Embed Size (px)
Citation preview

i
UNITED REPUBLIC OF TANZANA
PRESIDENT’S OFFICE
REGIONAL ADMINISTRATION AND LOCAL
GOVERNMENT
BUNDA DISTRICT COUNCIL
STRATEGIC PLAN
(2017/2018- 2021/2022)
District Executive Director P.O. Box 126, Bunda TANZANIA
Tel:+255(0)282621055, Fax: +255(0)28-2621264
Email: [email protected],
Website: www.bundadc.go.tz
ii
Preface
Bunda District Council is pleased to present its Strategic Plan for 2017/2018 – 2021/2022.
This plan sets our course for the next five years towards quality service delivery to the
citizens of Bunda District Council. The Strategic Plan for the Bunda District Council for
2017/2018-2021/2022 provides the strategic direction for the Council and the community.
It identifies key issues affecting the Council and provides strategies to reinforce the vision
and values of the Council and community. Council overarching vision is ‘to have a Community
with Strong Economic base, excellent services and living in peace and harmony’’. This vision is supported
by our core values of “leadership, community participation, equity, transparency, quality,
responsiveness, sustainable development, simplicity, accountability, change oriented,
creativity and value for money
The Strategic Plan was reviewed using the outcomes of council workshops involving 114
stakeholders and service delivery survey conducted by the consultants in the Council, hence
this provided framework of what to be attained by Bunda District Council by year
2021/2022 and beyond. The stakeholder’s workshop was convened under the assumption
that, every person is important and has a right to be heard and their opinion valued, however our community
expects that, the individual rights of a person are counter balanced by their responsibilities as citizens of our
area. The process for this Strategic Plan has considered such questions as “where are we
now?” and “where would we like to be in 5 years’ time?” for the various areas of operation.
We thought about our strengths and weaknesses and our current or potential opportunities
and threats.
Bunda District Council is widely recognised as a dynamic and progressive Council willing to
support innovative ideas and providing opportunities for our community to grow and
improve. This Plan builds on our past achievements and clearly articulates our direction for
the next five years. Our Council looks forward to working in partnership with the
community, government and other organisations to implement the strategies in this Plan to
achieve our vision for the future.
Isack Maela Kabugu
COUNCIL CHAIRMAN BUNDA DISTRICT COUNCIL.
iii
EXECUTIVE SUMMARY
The Bunda District Council strives to understand and better serve our citizens’ and
customers’ needs. Our successes hinge on our VISION, VALUES and our ACTIONS
described here in our STRATEGIC PLAN.
“Vision without Action is merely a dream …
Action without Vision is just passing time …
Vision with Action can change the world.”
The basic building blocks of our organization include our dedication to our vision and
values; as well as our commitment to our citizens/customers through our actions as
described in our Strategic Plan.The Strategic Plan for 2017/2018 – 2021/2022 of Bunda
District Council has been prepared by putting into consideration Tanzania Development
Vision (TDV) 2025 launched in 1999, Long Term Perspective Plan (LTPP), Five Years
Development Plan (FYDP II) inaugurated in June 2016 which incorporates aspects of
Agenda 2030 for Sustainable Dev Goals (SDGs), Implementation Strategy for FYDP
II, National Sector Policies and Strategies, D by D Policy, Plan and Budget
Guidelines and annual development plans, CCM election manifesto 2015, Local
demands and priorities. The main focus during preparation of this Strategic Plan has been
guided by the ongoing socio-economic reforms aimed at achieving macroeconomic stability,
to be realized through achieving the set objectives.
This is to be attained through sustainable utilization of the available resources with expected
end result of poverty reduction and acceleration of strong economic growth.
The Bunda District Council vision statement states that, ‘To have a Community with improved
living standards with Strong Economic base, excellent services and living in peace and harmony’’
While its mission statement states that, “To build the capacity of the residents by providing high
quality services in a participatory manner and ensuring optimal utilization of the available resources by
adhering to principles of good governance”.
The formulation of the vision, mission and core values through stakeholder’s workshop held
in the district were done together with identification of Council objectives, specific
departmental objectives, strategies, targets and projected costs so as to attain the end results;
and its implementation is expected to be an instrument to bring a positive sustainable socio –
economic development for our people.
Kusaja Amos, J.
DISTRICT EXECUTIVE DIRECTOR BUNDA DISTRICT COUNCIL
iv
ACRONOMY
AIDS - Acquired Immune Deficiency Syndrome
ARV - Anti Retro Viral
CBOs - Community Based Organizations
CHF - Community Health Fund
FYDP I & II – Five Year Development Plan I & II
CHMT - Council Health Management Team
CMT - Council Management Team
DADPS - District Agricultural Development Plans
DED - District Executive Director
DPLO - District Planning Officer
EIA - Environmental Impact Assessment
ETP - Education and Training Policy
HoDs - Heads of Departments
HIV - Human Immune Virus
HSR - Health Sector Reform
ICT - Information Communication Technology
BDC - Bunda District Council
LGAs - Local Governments Authorities
LGRP - Local Government Reform Programme
LLG - Lower Local Government Level
MCH - Maternal and Child Health
MKUKUTA II- Mkakati wa Kukuza Uchumi na Kupunguza Umaskini Tanzania II
M&E - Monitoring and Evaluation
MEMKWA - Mpango wa Elimu kwa waliokosa
NSGRP - National Strategy for Growth and Reduction of Poverty
NER - Net Enrolment Rate
NGOs - Non-Governmental Organizations
O&OD - Opportunities and Obstacles for Development
PADEP - Participatory Agricultural Development and Empowerment project
PRA - Participatory Rural Appraisal
PO-RALG- President Office, Regional Administration and Local Government
PMTCT - Prevention of Mother to Child Transmission
PEDP - Primary Education Development Plan
PMU - Procurement Management Unit
PHC - Public Health Committee
RWSSP - Rural Water Supply and Sanitation Programme
SACCOS - Savings and Credit Cooperative Society
SEDP - Secondary Education Development Plan
SWOTS - Strength, Weaknesses, Opportunities and Threats

v
TASAF - Tanzania Social Action Fund
VEO - Village Executive Officer
VC - Village Councils
WDC - Ward Development Committee
WEO - Ward Executive Officer
6
TABLE OF CONTENTS Contents Page
Preface ii
EXECUTIVE SUMMARY ................................................................................................. iii
CHAPTER ONE ....................................................................................................................... 9
BACKGROUND INFORMATION OF THE DISTRICT ................................................. 9
1.1 Location ................................................................................................................... 9
1.2 Land area ................................................................................................................. 9
1.3 Climate ..................................................................................................................... 9
1.4 Population size and Growth ................................................................................ 10
1.5 Administration ...................................................................................................... 10
1.6 SOCIAL-ECONOMIC STATUS ............................................................................... 10
1.6 ECONOMIC SERVICES ........................................................................................... 14
1.7 SOCIAL SERVICES .................................................................................................... 15
1.8 CROSS CUTTING ISSUES ....................................................................................... 16
CHAPTER TWO ..................................................................................................................... 19
SITUATION ANALYSIS ....................................................................................................... 19
2.0 Introduction .......................................................................................................... 19
2.1 SWOT Analysis ..................................................................................................... 19
2.2 PESTLE Analysis ................................................................................................. 21
2.2.1 Political Factors ..................................................................................................... 21
2.2.2 Socio-Cultural Factors .......................................................................................... 21
2.2.3 Economic Factors ................................................................................................. 21
2.2.4 Technological Factors .......................................................................................... 21
2.2.5 Legislative .............................................................................................................. 21
2.2.6 Environmental ...................................................................................................... 22
2.3 CURRENT SITUATION BY SECTOR(S) 24
2.3.1 Legal Unit .............................................................................................................. 18
2.3.2 Internal Audit Unit ............................................................................................... 19
2.3.3 Procurement Unit ................................................................................................. 19
2.3.4 ICT & Unit ............................................................................................................ 20
2.3.5 Bee keeping Unit
2.3.6 Environmnt and Solid Waste Managemnt
2.4.1 Planning, Statistic and Monitoring Department ......................................... 20
7
2.4.2 Administration and Human resources Department........................................... 21
2.3.6 Primary Education Deparment ............................................................................ 21
2.3.7 Secondary Education Department ...................................................................... 22
2.3.8 Agriculture department ........................................................................................ 22
2.3.9 Finance & Trade Department .............................................................................. 23
2.3.10 Water department ................................................................................................. 23
2.3.11 Health Department ............................................................................................... 25
2.3.12 Community Development ................................................................................... 25
2.3.13 Works & Fire rescue Department ....................................................................... 25
2.3.14 Lands and Natural Resources Department......................................................... 26
2.3.15 Livestock and Fisheries Deparment .................................................................... 27
35
CHAPTER THREE ................................................................................................................ 44
VISION, MISSION, PHILOSOPHY, VALUES, OBJECTIVES AND FUNCTIONS
OF BUNDA DISTRICT COUNCIL ................................................................................... 44
3.1 Vision of Bunda Distric Council ......................................................................... 44
3.2 Mission of Bunda District Council ...................................................................... 44
3.3 Bunda District Council Philosophy .................................................................... 44
3.4 Council Core Values ............................................................................................ 44
3.5 OBJECTIVES OF BUNDA DISTRICT COUNCIL ...................................... 45
3.5.1 Improve services and reduce HIV/AIDS infection .......................................... 45
3.5.2 Enhance, sustain and effective implementation of the National Ant-
corruption strategy ............................................................................................................... 45
3.5.3 Improve access, quality and equitable social services delivery .......................... 45
3.5.4 Increase Quantity and Quality of social services and infrastructure. ................ 46
3.5.5 Enhance Good Governance and Administrative services................................. 46
3.5.6 Improve social welfare, gender and community empowerment. ...................... 46
3.5.7 Improve Emergence and Disaster Management ................................................ 46
3.5.8 Improve environmental Conservation, Natural resources and Land
Management for sustainable development. ........................................................................ 34
3.5.9 Diversify sources of revenue through expanded investment opportunities. ... 35
3.6 FUNCTIONS OF COUNCIL ............................................................................ 46
3.7 COUNCIL MANAGEMENT STRUCTURE .................................................. 47
3.7.1 BDC Full Council ................................................................................................ 47
8
3.7.2 District Executive Director .................................................................................. 47
3.7.3 Head of Departments & Units .................................................................................. 36
CHAPTER FOUR ................................................................................................................... 49
OBJECTIVES, STRATEGIES, TARGETS & INDICATORS ......................................... 37
4.1 OBJECTIVE A: Improve services and reduce HIV/AIDS infection. ............ 37
4.2 OBJECTIVE B: Enhance, sustain and effective implementation of the
National Ant-corruption Strategy; ...................................................................................... 42
4.3 OBJECTIVE C: Improve access, quality and equitable social services
delivery 43
4.4 OBJECTIVE D: Increase Quantity and Quality of social services and
infrastructure. ....................................................................................................................... 57
4.5 OBJECTIVE E: Enhance Good Governance and Administrative services. .. 68
4.6 OBJECTIVE F: Improve social welfare, gender and community
empowerment. ...................................................................................................................... 74
4.7 OBJECTIVE G: Improve Emergence and Disaster Management .................. 76
4.8 OBJECTIVE H: Improve Environmental Conservation, Natural
Resources and Land Management for sustainable development. .................................... 78
4.9 OBJECTIVE I: Diversify sources of revenue through expanded
investment opportunities. .................................................................................................... 87
CHAPTER FIVE ..................................................................................................................... 81
MONITORING AND EVALUATION .............................................................................. 81
5.1 INTRODUCTION .............................................................................................. 81
5.2 MONITORING ................................................................................................... 81
5.3 EVALUATION.................................................................................................... 83
5.3.1 Types and Aspects of Evaluation ........................................................................ 83
6.3.2 Terms of Reference (ToR) for external evaluators ............................................ 83
9
CHAPTER ONE
BACKGROUND INFORMATION
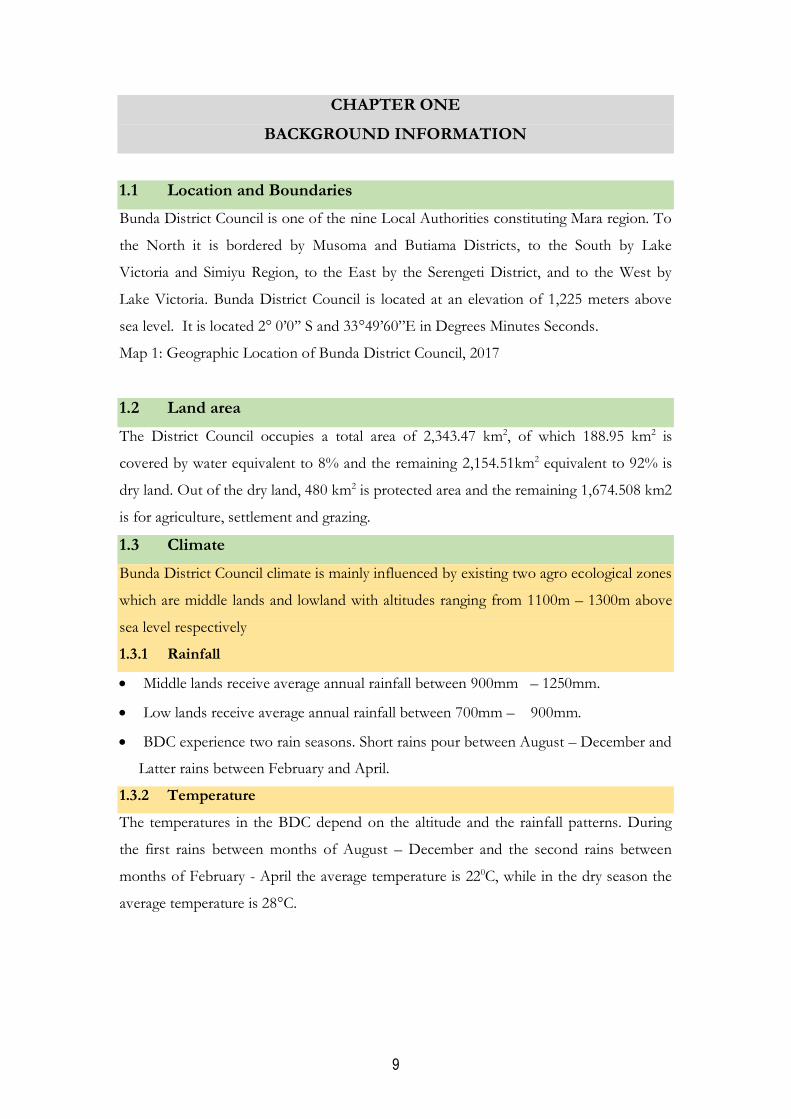
1.1 Location and Boundaries
Bunda District Council is one of the nine Local Authorities constituting Mara region. To
the North it is bordered by Musoma and Butiama Districts, to the South by Lake
Victoria and Simiyu Region, to the East by the Serengeti District, and to the West by
Lake Victoria. Bunda District Council is located at an elevation of 1,225 meters above
sea level. It is located 2° 0’0’’ S and 33°49’60’’E in Degrees Minutes Seconds.
Map 1: Geographic Location of Bunda District Council, 2017
1.2 Land area
The District Council occupies a total area of 2,343.47 km2, of which 188.95 km2 is
covered by water equivalent to 8% and the remaining 2,154.51km2 equivalent to 92% is
dry land. Out of the dry land, 480 km2 is protected area and the remaining 1,674.508 km2
is for agriculture, settlement and grazing.
1.3 Climate
Bunda District Council climate is mainly influenced by existing two agro ecological zones
which are middle lands and lowland with altitudes ranging from 1100m – 1300m above
sea level respectively
1.3.1 Rainfall
• Middle lands receive average annual rainfall between 900mm – 1250mm.
• Low lands receive average annual rainfall between 700mm – 900mm.
• BDC experience two rain seasons. Short rains pour between August – December and
Latter rains between February and April.
1.3.2 Temperature
The temperatures in the BDC depend on the altitude and the rainfall patterns. During
the first rains between months of August – December and the second rains between
months of February - April the average temperature is 220C, while in the dry season the
average temperature is 28°C.
10
1.4 Population size and Growth
According to the population census conducted in 2012 and its projection of 2017 with
population growth 2.6% the BDC human population is estimated at 250,050 people of
whom 121,773 are males and 128,277 are females
1.5 Administration
Administratively the Bunda District Council is divided into two Parliamentary
constituencies, 3 divisions, 19 wards, 78 villages, sub villages/ hamlet 388 and 42,381
households.
The Council consists of three Standing Committees, provided under Sec 74 of the Act
No. 7/1982 as follows:-:
i. Finance, Administration and Planning Committee,
ii. Education, Water and Health Committee, and
iii. Economic, Works and Environmental Committee.
The Full Council which comprises of all Councillors is the highest decision making
meeting in the Council. The Council Management Team (CMT) which is headed by the
District Executive Director (DED), consists of 13 head of departments and 6 Head of
Units. In the the lower level, decision making is vested in the Ward Development
Committee (WDC) and the Village Council.
1.6 SOCIAL-ECONOMIC STATUS
The major Economic activities in the BDC includes: -
Farming, Livestock keeping, Fishing, petty Business enterprises, Small scale industries,
and employment in various organizations
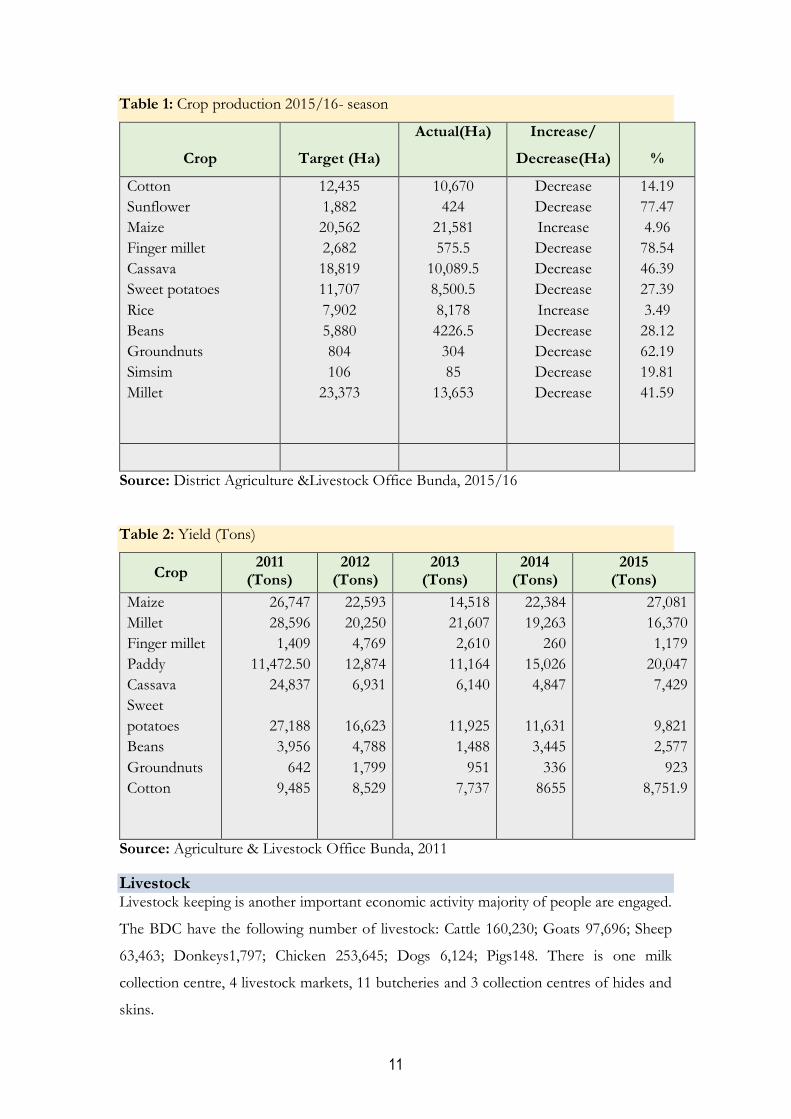
Agriculture Majority of the people in the BDC (90%) are engaged in agricultural undertakings
(farming). The District Gross Domestic Product is not yet estimated and hence the Per
Capita Income not yet determined while the National Per Capita Income of Tshs.
869,436/= per year has been recorded.
11
Table 1: Crop production 2015/16- season
Crop
Target (Ha)
Actual(Ha) Increase/
Decrease(Ha)
%
Cotton
Sunflower
Maize
Finger millet
Cassava
Sweet potatoes
Rice
Beans
Groundnuts
Simsim
Millet
12,435
1,882
20,562
2,682
18,819
11,707
7,902
5,880
804
106
23,373
10,670
424
21,581
575.5
10,089.5
8,500.5
8,178
4226.5
304
85
13,653
Decrease
Decrease
Increase
Decrease
Decrease
Decrease
Increase
Decrease
Decrease
Decrease
Decrease
14.19
77.47
4.96
78.54
46.39
27.39
3.49
28.12
62.19
19.81
41.59
Source: District Agriculture &Livestock Office Bunda, 2015/16
Table 2: Yield (Tons)
Crop 2011
(Tons) 2012
(Tons) 2013
(Tons) 2014
(Tons) 2015
(Tons)
Maize
Millet
Finger millet
Paddy
Cassava
Sweet
potatoes
Beans
Groundnuts
Cotton
26,747
28,596
1,409
11,472.50
24,837
27,188
3,956
642
9,485
22,593
20,250
4,769
12,874
6,931
16,623
4,788
1,799
8,529
14,518
21,607
2,610
11,164
6,140
11,925
1,488
951
7,737
22,384
19,263
260
15,026
4,847
11,631
3,445
336
8655
27,081
16,370
1,179
20,047
7,429
9,821
2,577
923
8,751.9
Source: Agriculture & Livestock Office Bunda, 2011
Livestock Livestock keeping is another important economic activity majority of people are engaged.
The BDC have the following number of livestock: Cattle 160,230; Goats 97,696; Sheep
63,463; Donkeys1,797; Chicken 253,645; Dogs 6,124; Pigs148. There is one milk
collection centre, 4 livestock markets, 11 butcheries and 3 collection centres of hides and
skins.
12
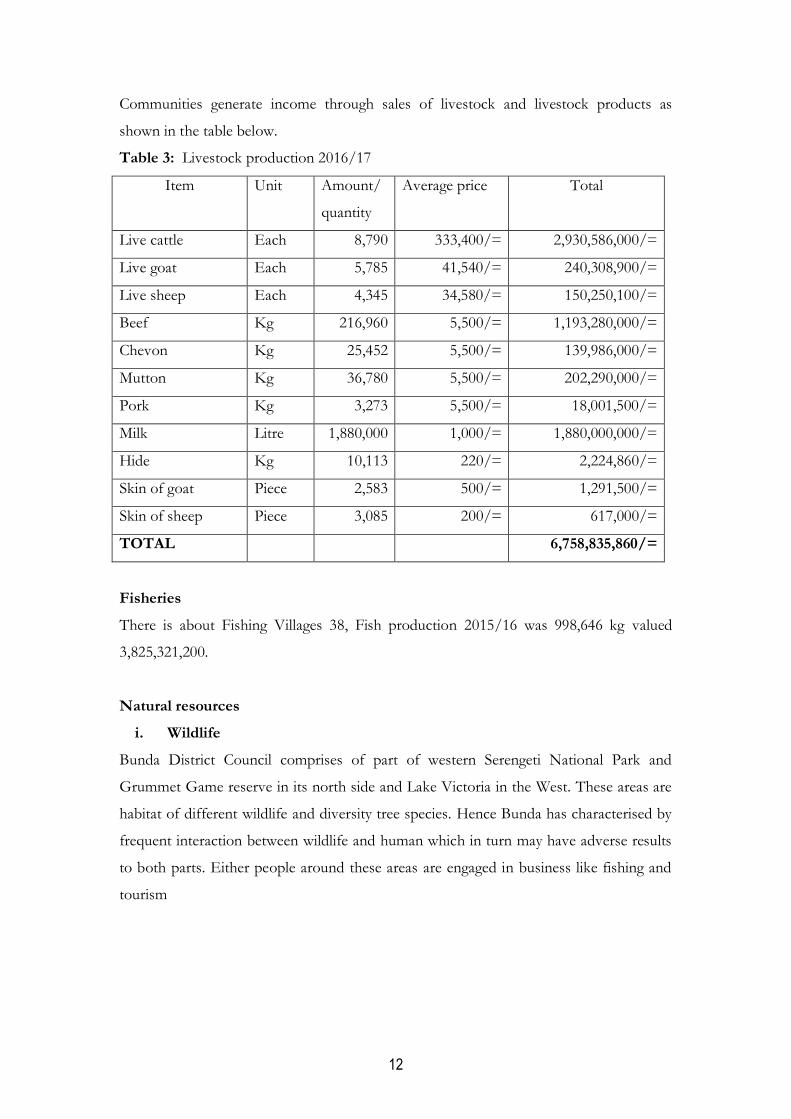
Communities generate income through sales of livestock and livestock products as
shown in the table below.
Table 3: Livestock production 2016/17
Item Unit Amount/
quantity
Average price Total
Live cattle Each 8,790 333,400/= 2,930,586,000/=
Live goat Each 5,785 41,540/= 240,308,900/=
Live sheep Each 4,345 34,580/= 150,250,100/=
Beef Kg 216,960 5,500/= 1,193,280,000/=
Chevon Kg 25,452 5,500/= 139,986,000/=
Mutton Kg 36,780 5,500/= 202,290,000/=
Pork Kg 3,273 5,500/= 18,001,500/=
Milk Litre 1,880,000 1,000/= 1,880,000,000/=
Hide Kg 10,113 220/= 2,224,860/=
Skin of goat Piece 2,583 500/= 1,291,500/=
Skin of sheep Piece 3,085 200/= 617,000/=
TOTAL 6,758,835,860/=
Fisheries
There is about Fishing Villages 38, Fish production 2015/16 was 998,646 kg valued
3,825,321,200.
Natural resources
i. Wildlife
Bunda District Council comprises of part of western Serengeti National Park and
Grummet Game reserve in its north side and Lake Victoria in the West. These areas are
habitat of different wildlife and diversity tree species. Hence Bunda has characterised by
frequent interaction between wildlife and human which in turn may have adverse results
to both parts. Either people around these areas are engaged in business like fishing and
tourism
13
ii. Forestry
BDC is not potentially forested as compared to other Districts in the country. It is
dominated by vegetation ranging from savannah woodlands, grasslands, scattered trees,
shrubs and herbs. Sound forestry base can be found in villages bordering protected areas
of Serengeti National Park and Grummet Game Reserve. BDC owns one forest called
Kurwirwi Forest Reserve with 1,580 ha located at Nansimo and Igundu Wards. The
forest reserve is a source of gravity piped water for Burendabufwe and Igundu Villages.
iii. Tourism Tourism is potential economic activity which contributes income to the people of
Bunda DC. The Council headquarter is located just 15 kilometres from the
Ndabaka Gate, Western Serengeti Corridor amid Serengeti National Park and
Lake Victoria. Serengeti National Parks and Lake Victoria have unique
characteristics nationally and internationally. These characteristics can attract
tourism activities within Bunda DC.
Tourism activities which can be conducted are:-
• Game viewing in Serengeti National park
• Bird watching at Lake Victoria
• Walking safaris in Serengeti National Park and Lake Victoria beaches
• Cultural Dances in tourist hotels located within Serengeti National parks
• Sport fishing within Lake Victoria
• Canoeing within lake Victoria
• Hotel and Catering services in the area near Serengeti National Park and along
Lake Victoria Beaches
The District Council and communities can have the following economic
opportunities due to the above activities
• Employment in hotel and lodges
❖ Market for agricultural products and retail business
• Service levy and business licences
14
Beekeeping
Beekeeping in BDC is done at a small scale. Currently, efforts are being done to
popularise beekeeping as an environmentally friendly income generating activity. To date
beekeeping is being practiced by groups and individuals located at Mwiruruma,
Busambara, Kibara, Neruma, Haruzale, Hunyari, Mugeta and Mariwanda villages. In
totality, there is about 300 modern hives.
Trade and Industries Some people are engaged in petty trade as their means of livelihood. These undertakings
include: - Shops/kiosks are 1669; Livestock traders are10; Milling machines are129;
Garages are 40; Carpentry workshops are 30; Hotels are100; Guest Houses are 57; Petrol
Stations are 4; Drug shops are 81; Butchery are 24; Spare part shops are 40; Stationery
Shops are30.; Bars are 15; Local brew shops are 18; Crop markets are19; Livestock
markets are4; financial institutions; (Bank (NMB) CRDB (mobile and Agents)Postal
Bank and FINCA are 4; (group these as Microfinance institutions) Telecommunication
companies are 5; and 2 small post offices.
Mining Sector The District Council is endowed with mineral deposits including,: Iron-ore and copper at
Igundu village and Kurwirwi Forest Reserve; Limestone at Bulamba village; Gold at
Kiloleli, Nyaburundu, Namhura, Muranda and Bulamba villages. Currently small scale
mining is done at these areas and mineral extraction through oxidation plants.
1.6 ECONOMIC SERVICES
Existing economic services include roads, Air transport, electricity and
Telecommunication services.
1.6.1 Road network The District Council road network has a total of 507.62kms as follows: Trunk road 0
kms; Regional roads 133.57 kms; District roads 244.39 kms; Rural roads129.66 kms;
The roads are passable on average of 76% during rainy season
1.6.2 Air Transport The District Council has one air strip called Grummet Air strip located at the western
corridor of Serengeti National Park which serves tourists and park staffs. For public air
transport the Council depends on the neighbouring airports located in Musoma and
Mwanza.
15
1.6.3 Electricity Major sources of energy for lighting in BDC are electricity, solar, and Kerosene.
The District is connected to the national electric grid. It is expected that by 2018/19 all
78 villages will be connected to the National Eclectic grid under Rural Electrification
Programme (REA)
1.6.4 Telecommunication The Council has access to different communication services, Available communication
services include TTCL, Airtel, Vodacom, Zantel, Tigo, Halotel, Fax, E-Mail and radio
calls.
1.6.4 Financial Institutions
Financial institutions available in BDC include Banks, Cooperative societies and Saving
and Credit Societies. Banks available are NMB, CRDB, Twiga Bancorp, Postal Bank,
FINCA, PRIDE. Others are Microfinance Credit institutions which are; Bayport,
Nufaika, Tujijenge, Bunda Saccos.
1.6.5 Council Revenue Council revenue sources include: Dues, business license fees, Service Levies, fishing
licence, fishing vessel licence, Fish cess produce cess fees; taxes; Rental; Miscellaneous
revenues; Grants from Central Government for PE & OC and Development projects
and donations.
1.7 SOCIAL SERVICES
The main social services provided by BDC are in the sectors of Education, Health, and
Water.
1.7.1 Education
Education sector comprises Primary education and Secondary education
1.7.1.1 Primary Education. Currently (2017) the BDC comprises of 104 Primary schools, out of that 100 schools are
owned by the government and 4 are privately owned.
16
1.7.3.1 Adult Education In respect to adult education, the enrolled adults attending classes are 244 (Male 130
Female 114); where in case of illiterate adults 361 (Male 176 Female 185); COBET
(MEMKWA): 8-13 years are 1525 in total (Male 760 Female 424); 14-18 years are 977 in
total (Male 681 Female 296)
1.7.2 Secondary education The BDC has 19 secondary schools with 9,397students (Boys 5,611 & Girls 3,786). Out
of 19 secondary schools, 17 secondary schools are owned by the Government and 2 are
privately owned.
1.7.4 Health Services The preventive and curative services are the major health services provided in the
Council through its 28 health facilities which comprises of one hospital owned by FBO,
5 Rural Health Centres and 22 Dispensaries. Out of the 22 dispensaries, 21 are owned
by the government and one is privately owned.
1.7.5 Water According to the population of the BDC, water requirement is 6033 m3 or 6,032,580
litres a day. The existing production capacity is 2,126 m3 or 2,126,250 litres a day
equivalent to 35.2% of total water requirement in the District Council
Water services available include: 18 charcoal dams; 95 dip wells with hand pump; 3
improved traditional water sources; 220 shallow wells; 3 dams; 8 pumped water schemes;
69 Institutional water harvesting tanks; 40 Household water harvesting tanks; 4 Gravity
schemes; 19 COWSO of which 12 are registered and operational and 1 Spring box.
1.8 CROSS CUTTING ISSUES
1.8.1 Gender issues The District has made considerable efforts to minimize gender imbalances and
inequalities that would prevent the society from realizing its full economic, social and
political development potential. Significant efforts have been made to promote women’s
participation in political and leadership positions.
The proportion of women in leadership representative (decision-making) position has
reached 23 percent. Women’s representation in public service (heads departments) is
17
15%. Gender equity in both private and public schools shows a positive trend and there
is a decrease in domestic violence.
1.8.2 HIV/AIDS
HIV/AIDS prevalence has been reduced from 5.6% in 2013 to 4% in 2016.
Through District Multi-Sectoral HIV/AIDS controlling Plan , Comprehensive Council
Health Plan and using council own source, the District Council has been taking various
measures to address this problem.
Among the efforts, which have been taken are community sensitizations on HIV/AIDS
prevention, formation and training of HIV/AIDS committees at the Council, Ward and
village levels, Formation of Peer Educators at the Council level, training of TBAs and
HIV/ AIDS Counselors, distribution of education materials to
1.8.3 Environment Sustainable development means achieving a quality of life that can be maintained for
many generations because it is socially desirable, economically viable and environmentally
sustainable. Development is sustainable if it takes place within nature's tolerance limits,
both in the short and in the longer-term perspective.
The challenge for Bunda district council is to recognise the various demands made upon
their environment, and reconcile these in ways which seek to maintain and enhance it for
the future.
Human activities that impact the environment in BDC are poor agricultural practices ,
tree cutting, overgrazing, illegal fishing, poaching, soil excavation to obtain gravels for
road rehabilitation and other construction activities.
These impacts include air pollution, water pollution, soil degradation, loss of biodiversity
and erosion. Environmental impact assessment is vital tool that enables undesirable
effects on the environment might arise from the implementation of the project to be
identified and avoided.
1.8.4 Good governance
The issue of good governance is a precondition for any planned development taking
place in the Council and villages levels. Such issues are transparency, accountability, rule
of law, integrity, responsiveness, participation, equitable and inclusiveness. In Bunda DC,

18
the issue of good governance is exercised in ensuring that all statutory meetings at higher
and lower levels are conducted, reading income and expenditure reports, availing
suggestion boxes and notice boards at all levels, displaying council plans and Budget on
notice boards and the Council website.

19
CHAPTER TWO
SITUATION ANALYSIS
2.0 Introduction
Based on the analysis of the Council’s present capabilities and performance and the
evaluation of the relevant strategic external environment, it has been possible to identify
the major SWOTs (Strengths, Weaknesses, Opportunities and Threats), which must be
considered by the plan for the period 2017/2018 to 2021/2022. The chapter has also
PESTLE Analysis that must be addressed through implementation of the plan.
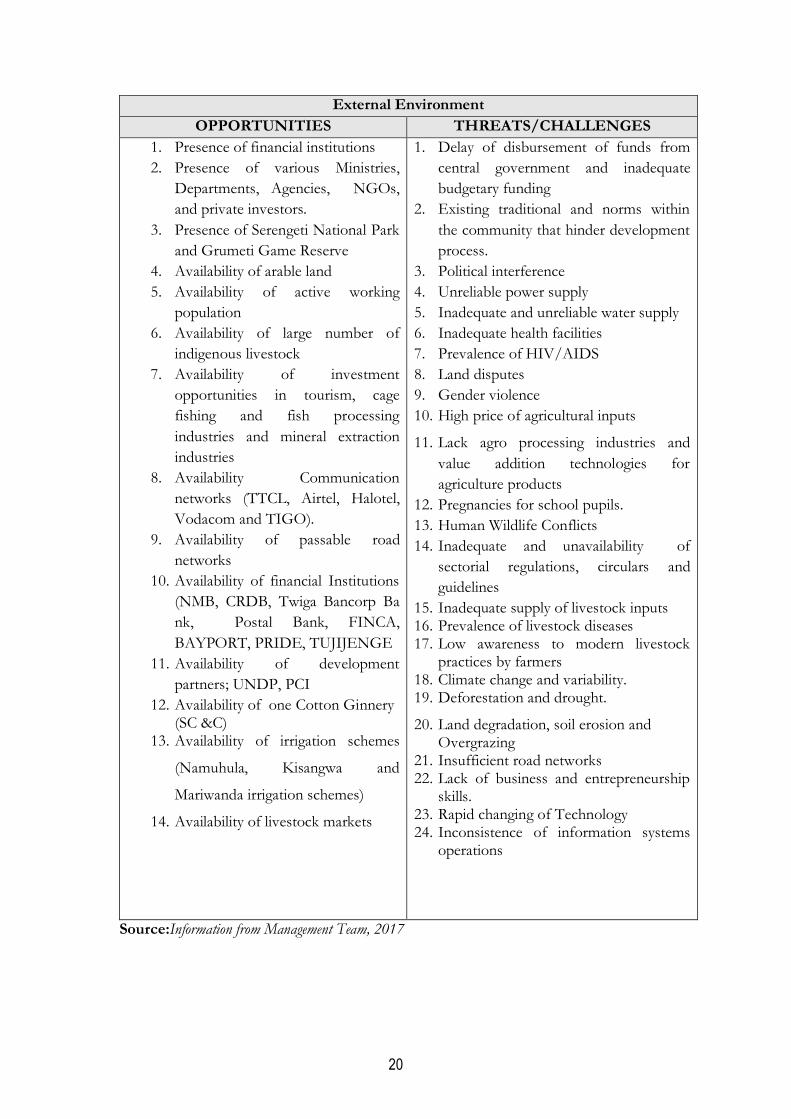
2.1 SWOT Analysis
The SWOT analysis was undertaken to critically assess the Strengths and Weaknesses,
Opportunities and Threats in respect of the internal and external environmental factors
affecting the organization.
Table 4: SWOT Analysis
Internal Environment
STRENGTHS WEAKNESSES
• Well established administrative structure
from lower to higher level
• Availability of well-educated, experienced
and very committed staff
• Availability of few infrastructure and
working gears (transport facilities and
buildings)
• Existence of Council Management
Systems; (Lawson, Epicor, Planrep,
HMIS, BEMIS, LRMS) FARS, ARDS,
TOMSHA, FFARS)
• Existence of road network
• Well-developed information and
communication systems such as Council
website and statutory meetings.
• Existence of good sectorial policies,
Acts, programs, guidelines and orders
and by laws
• Availability sources of revenues
• Inadequate number of staff(supportive
and professional staff)
• Inadequate office working gears/tools
• Few and unreliable sources of revenue
• Unreliable and limited own source
revenue
• Budget constraint
• Inadequate transport facilities
• Inadequate training and refresher
course to available staff
• Inadequate motivation/incentives to
employees
• Out-dated By-laws
• Inadequate funds for conducting audit
as per audit plan
• Lack of Knowledge of Audit
Committee Members
20
External Environment
OPPORTUNITIES THREATS/CHALLENGES
1. Presence of financial institutions
2. Presence of various Ministries,
Departments, Agencies, NGOs,
and private investors.
3. Presence of Serengeti National Park
and Grumeti Game Reserve
4. Availability of arable land
5. Availability of active working
population
6. Availability of large number of
indigenous livestock
7. Availability of investment
opportunities in tourism, cage
fishing and fish processing
industries and mineral extraction
industries
8. Availability Communication
networks (TTCL, Airtel, Halotel,
Vodacom and TIGO).
9. Availability of passable road
networks
10. Availability of financial Institutions
(NMB, CRDB, Twiga Bancorp Ba
nk, Postal Bank, FINCA,
BAYPORT, PRIDE, TUJIJENGE
11. Availability of development
partners; UNDP, PCI
12. Availability of one Cotton Ginnery (SC &C)
13. Availability of irrigation schemes
(Namuhula, Kisangwa and
Mariwanda irrigation schemes)
14. Availability of livestock markets
1. Delay of disbursement of funds from
central government and inadequate
budgetary funding
2. Existing traditional and norms within
the community that hinder development
process.
3. Political interference
4. Unreliable power supply
5. Inadequate and unreliable water supply
6. Inadequate health facilities
7. Prevalence of HIV/AIDS
8. Land disputes
9. Gender violence
10. High price of agricultural inputs
11. Lack agro processing industries and
value addition technologies for
agriculture products
12. Pregnancies for school pupils.
13. Human Wildlife Conflicts
14. Inadequate and unavailability of
sectorial regulations, circulars and
guidelines
15. Inadequate supply of livestock inputs 16. Prevalence of livestock diseases 17. Low awareness to modern livestock
practices by farmers 18. Climate change and variability. 19. Deforestation and drought.
20. Land degradation, soil erosion and Overgrazing
21. Insufficient road networks 22. Lack of business and entrepreneurship
skills. 23. Rapid changing of Technology 24. Inconsistence of information systems
operations
Source:Information from Management Team, 2017
21
2.2 PESTLE Analysis
External environmental factors which impact on the operations of the council and
related strategic objectives may be summarized as comprising the factors as below: -
2.2.1 Political Factors
It is recognized that political stability, democratization and empowerment of
stakeholders, peace and tranquility, legislative and institutional frameworks, are critical
success or failure factors for any organization. In addition, international and regional
relationships, global and national security, public demand for transparency and
accountability has great and underlying influence on policy and operational direction of
the organization.
2.2.2 Socio-Cultural Factors
The demographic changes and urbanization, changing consumption trends and patterns,
increasing and high poverty levels, changes in land use patterns, empowerment of
communities are all vital factors to be taken in preparation of this strategic plan. Equally
important are factors to do with wide income disparities, ethnic challenges, and
differences in social values, corruption and emerging and re-emerging disease incidents.
2.2.3 Economic Factors
Unpredictable exchange rates, escalating energy and food costs, high inflation rates;
uncertain monetary and fiscal policies, international tourist and economic trends
influence to a great deal operations of the organization. In addition, creation of an
enabling environment for investment, inequitable distribution of wealth, unemployment
and underemployment are all real factors to be considered and noted.
2.2.4 Technological Factors
Development in ICT, emerging technologies, e-commerce and the internet are factors,
which influence positively or otherwise the realization of the plan. The Council will
realize its objectives by using modern ICT and other modern technologies. For instance,
computerized database for payment, revenue collection and record keeping will help the
council to be fast in decision making.
2.2.5 Legislative
Legislative issues that will need to be addressed shall focus on factors such as sectorial
Acts, and other related laws, which affects in one way or another the implementation of
council activities. The council will always consider these factors before enacting any by-
laws within the council.
22
2.2.6 Environmental
The major external factors are those that deal with the environment and its impact on
poverty reduction and development of our communities. It should be understood that
some of these include - global climatic and ecological changes and weak enforcement of
national environmental policy.
2.2.7 Analysis of External Environment
2.2.7.1 Sustainable Development Goals (SDGs)
Following phasing out of Millennium Development Goals (MDGs) in 2015, the UN
member states had adopted global Sustainable Development Goals from 25th September,
2015. The Sustainable Development Goals are the new sustainable development agenda
where each goal has specific targets to be achieved over the next 15 years. Each member
state has committed to achieve 17 goals by 2030. Therefore Bunda District Council
strategic plan shall serve as one of the national vehicles to realizing the goals as it also
deserves the global and national support in that endeavor.
With respect to Sustainable Development Goals those milestones in all sectors of the
economy which the District Council is operating under the Bunda District Council has
the role to play in realization of these goals in unleashing Tanzania’s to middle income
country.
2.2.7.2 The Tanzania National Development Vision (2025)
Tanzania envisions that by 2025 will have attained a remarkable development from a
least developed to middle income country in the areas of quality livelihood, peace,
stability and unity, good governance, as well as educated and learning society; and
competitive economy capable of producing sustainable growth and shared benefits.
High Quality Livelihood
Ideally a nation’s development should be people-centered, based on sustainable and
shared growth and be free from abject poverty.
Peace, Stability and Unity
A nation should enjoy peace, political stability, national unity and social cohesion in an
environment of democracy and political and social tolerance. Although Tanzania has
enjoyed national unity, peace and stability for a long time, these attributes must continue
to be cultivated, nurtured and sustained as important pillars for realization of the vision.
Good Governance
23
Tanzania cherishes good governance and the rule of law in the process of creating wealth
and sharing benefits in society and seeks to ensure that its people are empowered with
the capacity to make their leaders and public servants accountable. By 2025, good
governance should have permeated the national socio-economic structure thereby
ensuring a culture of accountability, rewarding good performance and effectively curbing
corruption and other vices in society.
A Well educated and learning society
Tanzania envisages being a nation whose people are ingrained with a development
mindset and competitive spirit. These attributes are driven by education and knowledge
and are critical in enabling the nation to effectively utilize knowledge in mobilizing
domestic resources for assuring the provision of people’s basic needs and for attaining
competitiveness in the regional and global economy.
This necessitated the government to launch a Tanzania Five Years Development Plan
2016/17 – 2021/22
2.2.7.3 Tanzania Five Years Development Plan 2016/17 – 2020/21
This is an important milestone for Tanzania that the second five year development plan
is being unveiled. Spanning from 2016/17 to 2020/21, the plan is the formal
implementation tool of the country’s development agenda, articulated in the Tanzania
Development Vision 2025.
The Second Five Year Development Plan (FYDP II), 2016/2017 – 2020/2021, has
integrated frameworks of the First Five Year Development Plan (FYDP I, 2011/2012 –
2015/2016) and the National Strategy for Growth and Reduction of Poverty
(NSGRP/MKUKUTA II, 2010/2011-2014/2015) further extended to 2015/2016. This
integration implemented a Government decision taken in 2015 to merge the two
frameworks. The objectives of integrating the two frameworks were to improve
efficiency and effectiveness in implementation through organizing and rationalizing
national resources under one framework, by addressing critical challenges, which beset
implementation of the parallel frameworks. The challenges included existence of many
similar priorities of varying scope and emphasis, leading to available resources being
spread too thinly; weak coordination; evaluation and reporting.
The theme of FYDP II “Nurturing Industrialization for Economic Transformation and
Human Development” incorporates the main focus of the two frameworks, namely
growth and transformation (FYDP I) and poverty reduction (MKUKUTA II). FYDP II
24
outlines new interventions to enable Tanzania industrialized in a way that will transform
its economy and its society. It also incorporates unfinished interventions from the
predecessor Plan and Strategy, respectively, deemed critical for realization of the
aspirations of FYDP II. More importantly, and in tandem with the two predecessor
framework, FYDP II also implements aspects of Tanzania’s Development Vision (TDV)
2025 which aspires to have Tanzania transformed into middle income and semi
industrialized nation by 2025, characterized by the year 2025: i) high quality and
sustainable livelihoods; ii) peace, stability and unity; iii) good governance and the rule of
law; iv) an educated and learning society; and v) a strong and competitive economy. With
respect to FYDP II the Bunda District Council has the role to play in realization of these
goals in unleashing Tanzania’s latent potentials existing in the district.
2.3 CURRENT SITUATION BY SECTOR(S)
Bunda District Council comprises of 13 Departments and 6 units. The current situation
of each Department and Unit is as follows:-
2.3.1 Human Resources and Administration Department
The Department has two sections which are Administration and Human Resources. The
Total number of existing staff in this Department is 113 which include 05 Human
Resource Officers, 04 Record Management Assistants, 06 Personal Secretaries, 08
Drivers, 04 Security Guards, 14 Ward Executive Officers, 48 Village Executive Officers
and 06 Office Attendants.
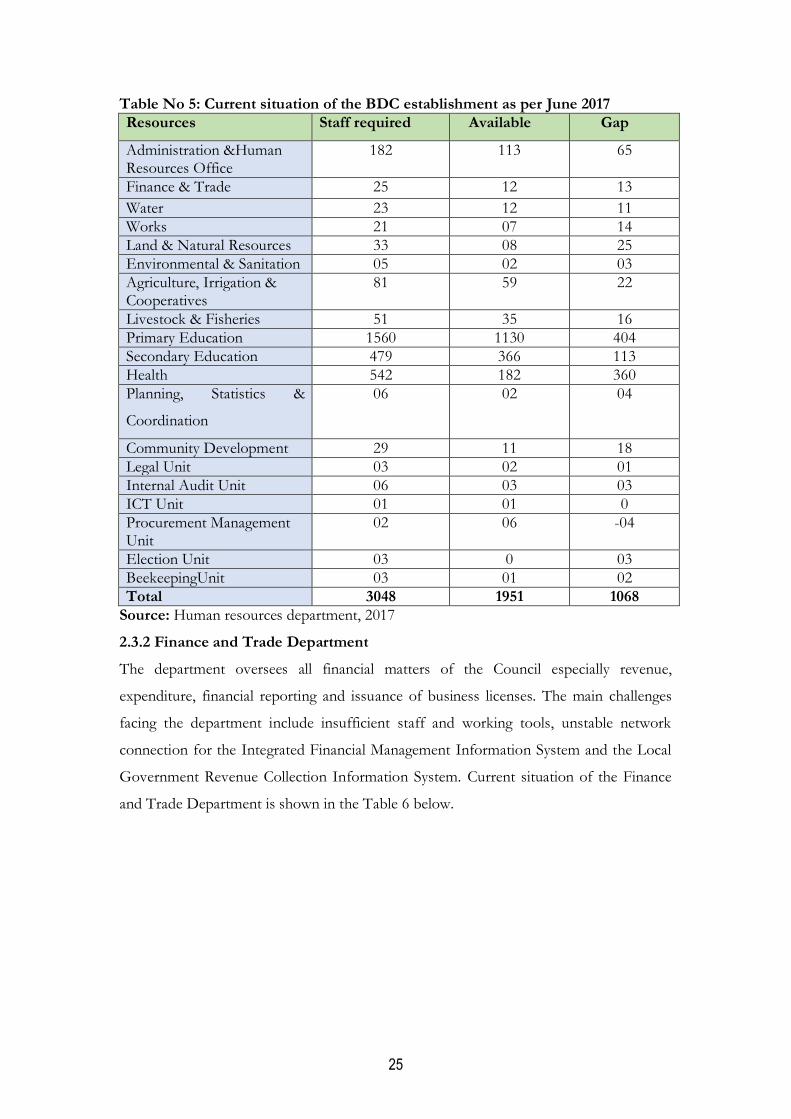
In general, the Council establishment by June 2017 is 3,048 employee. With the current
existing employees of 1951, we have the shortage of 1,068 employees from all 19
departments and Units. The departments which have high shortage of employees are
secondary education (113) (science teachers), Health (360), Primary school (404) and
Land and Natural resources (25) as shown in the table below.
25
Table No 5: Current situation of the BDC establishment as per June 2017
Resources Staff required Available Gap
Administration &Human Resources Office
182 113 65
Finance & Trade 25 12 13
Water 23 12 11
Works 21 07 14
Land & Natural Resources 33 08 25
Environmental & Sanitation 05 02 03
Agriculture, Irrigation & Cooperatives
81 59 22
Livestock & Fisheries 51 35 16
Primary Education 1560 1130 404
Secondary Education 479 366 113
Health 542 182 360
Planning, Statistics &
Coordination
06 02 04
Community Development 29 11 18
Legal Unit 03 02 01
Internal Audit Unit 06 03 03
ICT Unit 01 01 0
Procurement Management Unit
02 06 -04
Election Unit 03 0 03
BeekeepingUnit 03 01 02
Total 3048 1951 1068
Source: Human resources department, 2017
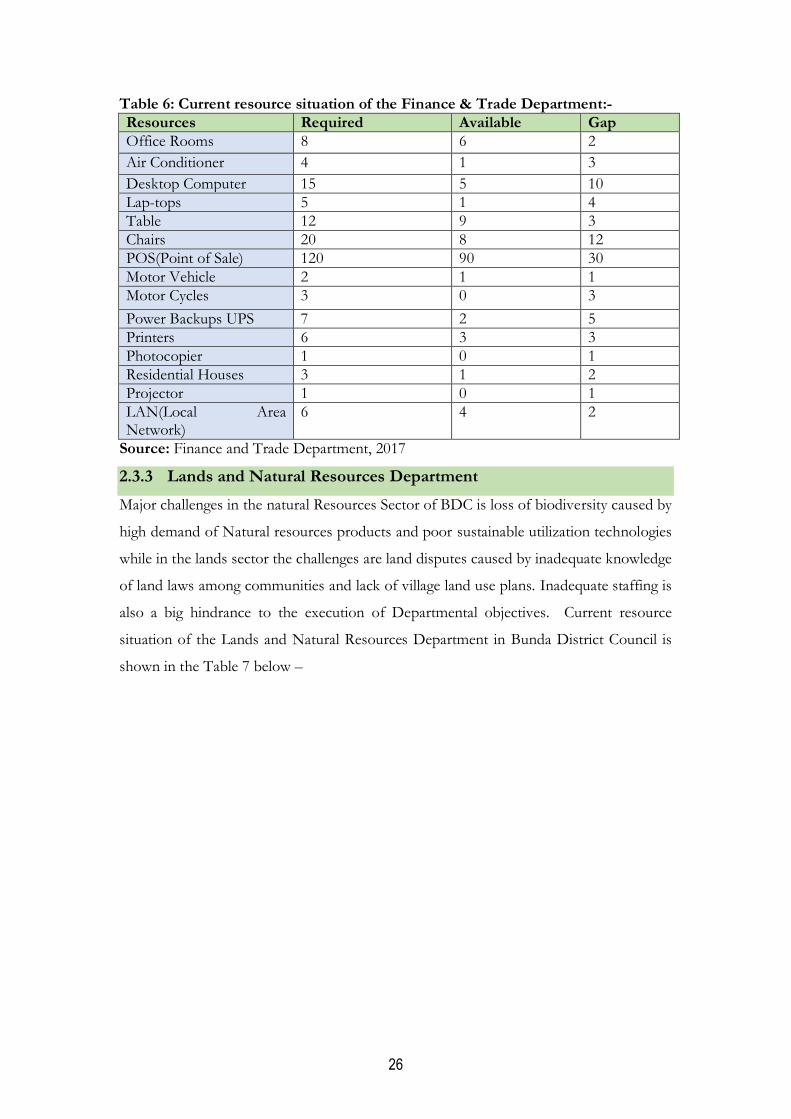
2.3.2 Finance and Trade Department
The department oversees all financial matters of the Council especially revenue,
expenditure, financial reporting and issuance of business licenses. The main challenges
facing the department include insufficient staff and working tools, unstable network
connection for the Integrated Financial Management Information System and the Local
Government Revenue Collection Information System. Current situation of the Finance
and Trade Department is shown in the Table 6 below.
26
Table 6: Current resource situation of the Finance & Trade Department:-
Resources Required Available Gap
Office Rooms 8 6 2
Air Conditioner 4 1 3
Desktop Computer 15 5 10
Lap-tops 5 1 4
Table 12 9 3
Chairs 20 8 12
POS(Point of Sale) 120 90 30
Motor Vehicle 2 1 1
Motor Cycles 3 0 3
Power Backups UPS 7 2 5
Printers 6 3 3
Photocopier 1 0 1
Residential Houses 3 1 2
Projector 1 0 1
LAN(Local Area Network)
6 4 2
Source: Finance and Trade Department, 2017
2.3.3 Lands and Natural Resources Department
Major challenges in the natural Resources Sector of BDC is loss of biodiversity caused by
high demand of Natural resources products and poor sustainable utilization technologies
while in the lands sector the challenges are land disputes caused by inadequate knowledge
of land laws among communities and lack of village land use plans. Inadequate staffing is
also a big hindrance to the execution of Departmental objectives. Current resource
situation of the Lands and Natural Resources Department in Bunda District Council is
shown in the Table 7 below –

27
Table No 7: Current resource situation of the Natural Resources Department
Resources Required Available Gap
Desk top Computers 8 3 5
Printers 5 1 4
Tables 10 6 4
Chairs 10 6 4
File Cabinet 6 1 5
Cupboard 4 2 2
GPS 10 0 10
Drones 6 1 5
Firearms 4 15 11
Map Cabinet 2 0 2
Binocular 2 0 2
Triplepod stand 3 0 3
Plumb bob 3 0 3
Sun Printer 2 0 2
Total station 2 0 2
Plotter 2 0 2
Deep plans box 2 0 2
Plotter 2 0 2
Saver for data base 1 0 1
Camera 2 0 2
Source: Departmental profile, 2017
2.3.4 Community development Department
The Department performs its activities through four sections; Children, Youth,
Planning, Research and Statistics section and the Gender desk. The department also
coordinates two projects including Tanzania Social Action Fund (TASAF) and
HIV/AIDS. Apart from projects coordination the community department is
coordinating Women Development Fund (WDF) and Youth Development Fund (YDF).
The main functions of Department is to enable community to change their mind set as
well as negative beliefs, traditions, culture, customs, norms and values which are not
supportive to development process
Achievements includes 337 income generating groups have been registered, the
formation of 46 VICOBA, Monitoring and evaluation of 20 Community Based
Organization (CBO), provision of loan to 78 women groups and 16 Youth groups .
Challenges include inadequate transport to reach most people within the council, lack of
awareness of people in creating economic groups, delay of loan repayment.
28
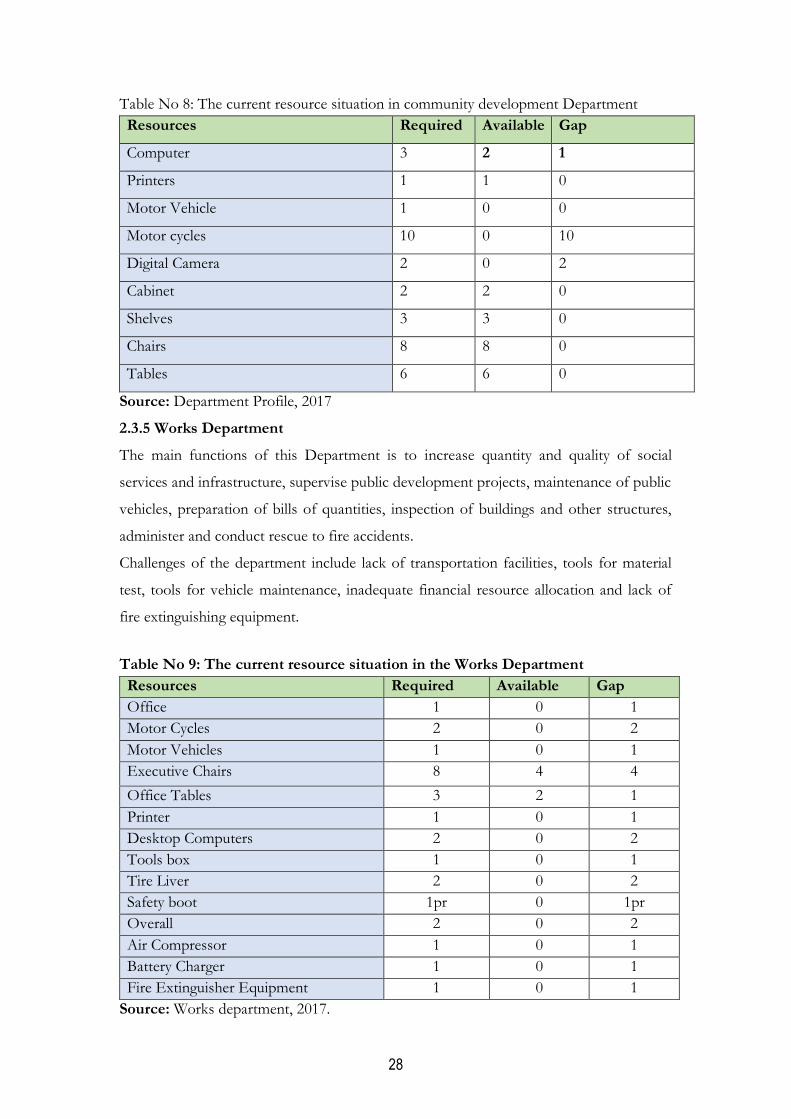
Table No 8: The current resource situation in community development Department
Resources Required Available Gap
Computer 3 2 1
Printers 1 1 0
Motor Vehicle 1 0 0
Motor cycles 10 0 10
Digital Camera 2 0 2
Cabinet 2 2 0
Shelves 3 3 0
Chairs 8 8 0
Tables 6 6 0
Source: Department Profile, 2017
2.3.5 Works Department
The main functions of this Department is to increase quantity and quality of social
services and infrastructure, supervise public development projects, maintenance of public
vehicles, preparation of bills of quantities, inspection of buildings and other structures,
administer and conduct rescue to fire accidents.
Challenges of the department include lack of transportation facilities, tools for material
test, tools for vehicle maintenance, inadequate financial resource allocation and lack of
fire extinguishing equipment.
Table No 9: The current resource situation in the Works Department
Resources Required Available Gap
Office 1 0 1
Motor Cycles 2 0 2
Motor Vehicles 1 0 1
Executive Chairs 8 4 4
Office Tables 3 2 1
Printer 1 0 1
Desktop Computers 2 0 2
Tools box 1 0 1
Tire Liver 2 0 2
Safety boot 1pr 0 1pr
Overall 2 0 2
Air Compressor 1 0 1
Battery Charger 1 0 1
Fire Extinguisher Equipment 1 0 1
Source: Works department, 2017.
29
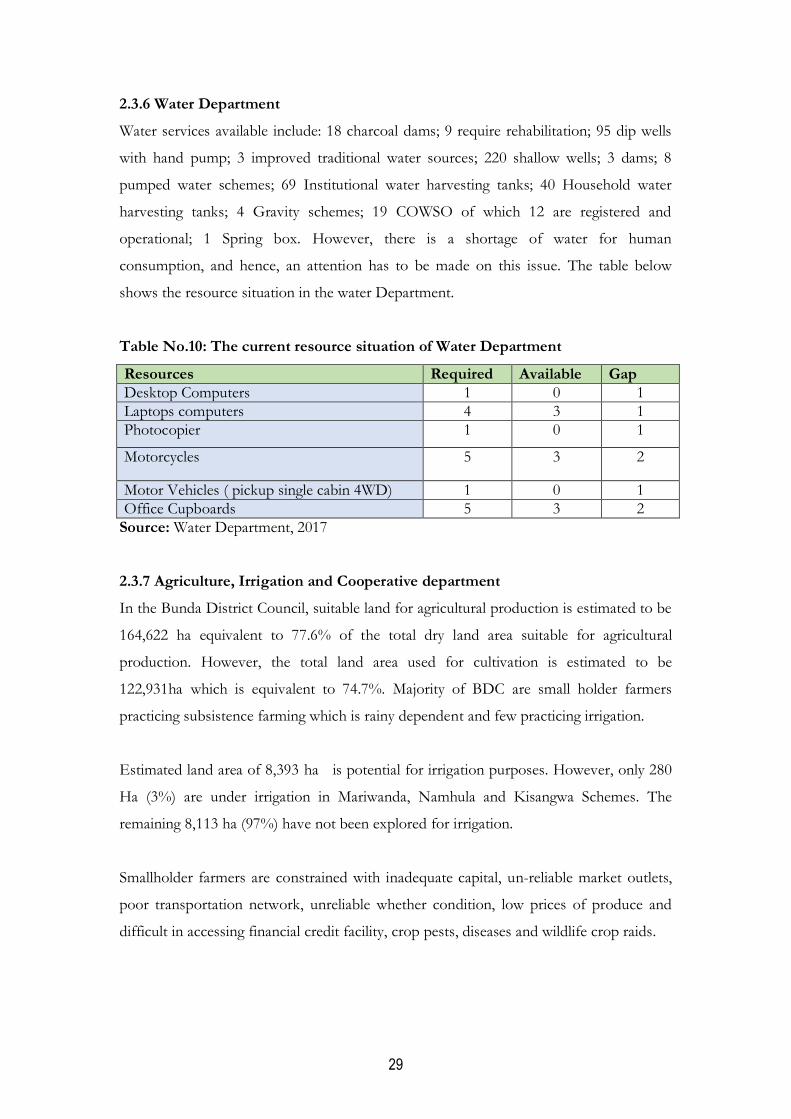
2.3.6 Water Department
Water services available include: 18 charcoal dams; 9 require rehabilitation; 95 dip wells
with hand pump; 3 improved traditional water sources; 220 shallow wells; 3 dams; 8
pumped water schemes; 69 Institutional water harvesting tanks; 40 Household water
harvesting tanks; 4 Gravity schemes; 19 COWSO of which 12 are registered and
operational; 1 Spring box. However, there is a shortage of water for human
consumption, and hence, an attention has to be made on this issue. The table below
shows the resource situation in the water Department.
Table No.10: The current resource situation of Water Department
Resources Required Available Gap
Desktop Computers 1 0 1
Laptops computers 4 3 1
Photocopier 1 0 1
Motorcycles 5 3 2
Motor Vehicles ( pickup single cabin 4WD) 1 0 1
Office Cupboards 5 3 2
Source: Water Department, 2017
2.3.7 Agriculture, Irrigation and Cooperative department
In the Bunda District Council, suitable land for agricultural production is estimated to be
164,622 ha equivalent to 77.6% of the total dry land area suitable for agricultural
production. However, the total land area used for cultivation is estimated to be
122,931ha which is equivalent to 74.7%. Majority of BDC are small holder farmers
practicing subsistence farming which is rainy dependent and few practicing irrigation.
Estimated land area of 8,393 ha is potential for irrigation purposes. However, only 280
Ha (3%) are under irrigation in Mariwanda, Namhula and Kisangwa Schemes. The
remaining 8,113 ha (97%) have not been explored for irrigation.
Smallholder farmers are constrained with inadequate capital, un-reliable market outlets,
poor transportation network, unreliable whether condition, low prices of produce and
difficult in accessing financial credit facility, crop pests, diseases and wildlife crop raids.
30
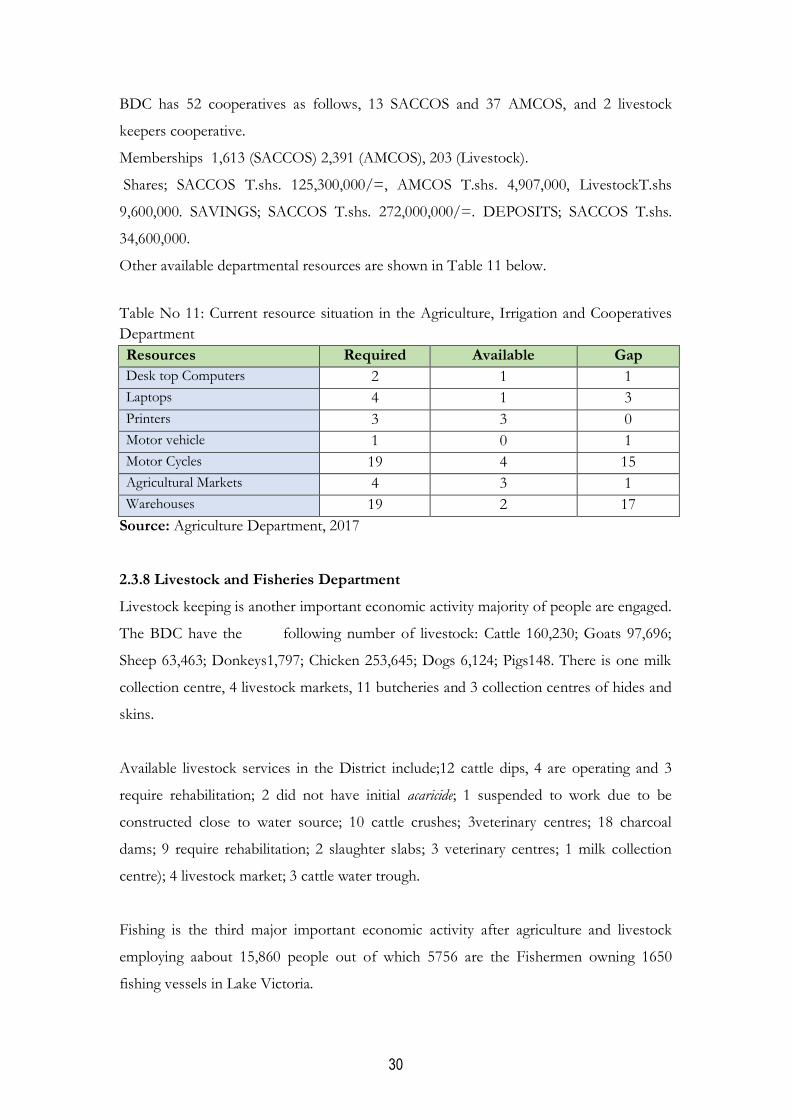
BDC has 52 cooperatives as follows, 13 SACCOS and 37 AMCOS, and 2 livestock
keepers cooperative.
Memberships 1,613 (SACCOS) 2,391 (AMCOS), 203 (Livestock).
Shares; SACCOS T.shs. 125,300,000/=, AMCOS T.shs. 4,907,000, LivestockT.shs
9,600,000. SAVINGS; SACCOS T.shs. 272,000,000/=. DEPOSITS; SACCOS T.shs.
34,600,000.
Other available departmental resources are shown in Table 11 below.
Table No 11: Current resource situation in the Agriculture, Irrigation and Cooperatives
Department
Resources Required Available Gap
Desk top Computers 2 1 1
Laptops 4 1 3
Printers 3 3 0
Motor vehicle 1 0 1
Motor Cycles 19 4 15
Agricultural Markets 4 3 1
Warehouses 19 2 17
Source: Agriculture Department, 2017
2.3.8 Livestock and Fisheries Department
Livestock keeping is another important economic activity majority of people are engaged.
The BDC have the following number of livestock: Cattle 160,230; Goats 97,696;
Sheep 63,463; Donkeys1,797; Chicken 253,645; Dogs 6,124; Pigs148. There is one milk
collection centre, 4 livestock markets, 11 butcheries and 3 collection centres of hides and
skins.
Available livestock services in the District include;12 cattle dips, 4 are operating and 3
require rehabilitation; 2 did not have initial acaricide; 1 suspended to work due to be
constructed close to water source; 10 cattle crushes; 3veterinary centres; 18 charcoal
dams; 9 require rehabilitation; 2 slaughter slabs; 3 veterinary centres; 1 milk collection
centre); 4 livestock market; 3 cattle water trough.
Fishing is the third major important economic activity after agriculture and livestock
employing aabout 15,860 people out of which 5756 are the Fishermen owning 1650
fishing vessels in Lake Victoria.
31
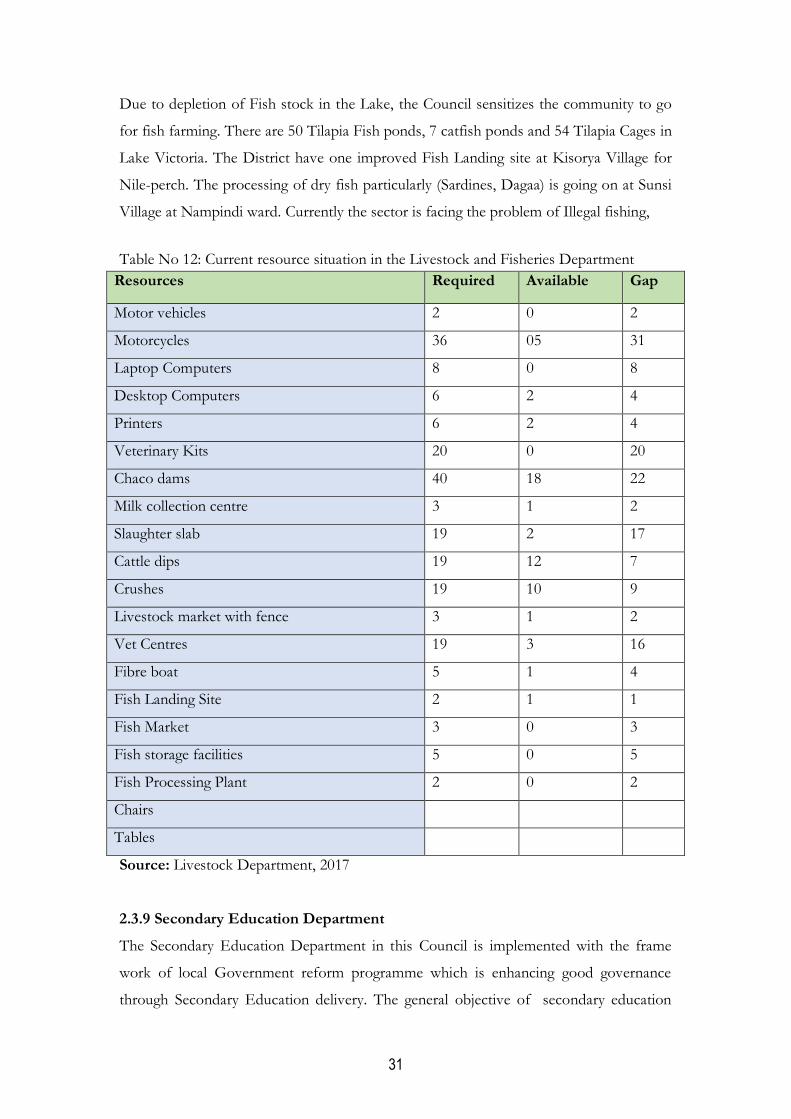
Due to depletion of Fish stock in the Lake, the Council sensitizes the community to go
for fish farming. There are 50 Tilapia Fish ponds, 7 catfish ponds and 54 Tilapia Cages in
Lake Victoria. The District have one improved Fish Landing site at Kisorya Village for
Nile-perch. The processing of dry fish particularly (Sardines, Dagaa) is going on at Sunsi
Village at Nampindi ward. Currently the sector is facing the problem of Illegal fishing,
Table No 12: Current resource situation in the Livestock and Fisheries Department
Resources Required Available Gap
Motor vehicles 2 0 2
Motorcycles 36 05 31
Laptop Computers 8 0 8
Desktop Computers 6 2 4
Printers 6 2 4
Veterinary Kits 20 0 20
Chaco dams 40 18 22
Milk collection centre 3 1 2
Slaughter slab 19 2 17
Cattle dips 19 12 7
Crushes 19 10 9
Livestock market with fence 3 1 2
Vet Centres 19 3 16
Fibre boat 5 1 4
Fish Landing Site 2 1 1
Fish Market 3 0 3
Fish storage facilities 5 0 5
Fish Processing Plant 2 0 2
Chairs
Tables
Source: Livestock Department, 2017
2.3.9 Secondary Education Department
The Secondary Education Department in this Council is implemented with the frame
work of local Government reform programme which is enhancing good governance
through Secondary Education delivery. The general objective of secondary education
32
department is to improve the quality of Secondary schools i.e. to provide conducive
teaching and learning environment to Teachers and students and to ensure that
Education is given equally to both girls and boys and to address the issues of Enrolment
Expansion ,Quality improvement, Capacity building, Institutional arrangement and Cross
cutting issues.
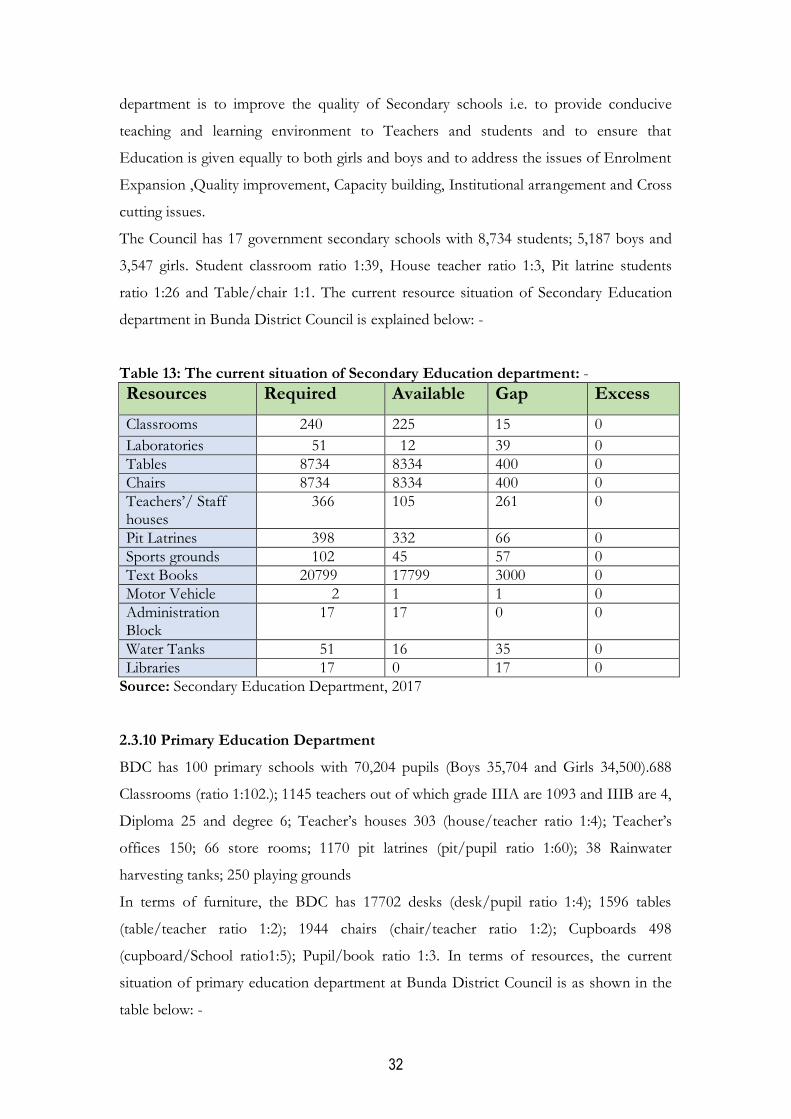
The Council has 17 government secondary schools with 8,734 students; 5,187 boys and
3,547 girls. Student classroom ratio 1:39, House teacher ratio 1:3, Pit latrine students
ratio 1:26 and Table/chair 1:1. The current resource situation of Secondary Education
department in Bunda District Council is explained below: -
Table 13: The current situation of Secondary Education department: -
Resources Required Available Gap Excess
Classrooms 240 225 15 0
Laboratories 51 12 39 0
Tables 8734 8334 400 0
Chairs 8734 8334 400 0
Teachers’/ Staff houses
366 105 261 0
Pit Latrines 398 332 66 0
Sports grounds 102 45 57 0
Text Books 20799 17799 3000 0
Motor Vehicle 2 1 1 0
Administration Block
17 17 0 0
Water Tanks 51 16 35 0
Libraries 17 0 17 0
Source: Secondary Education Department, 2017
2.3.10 Primary Education Department
BDC has 100 primary schools with 70,204 pupils (Boys 35,704 and Girls 34,500).688
Classrooms (ratio 1:102.); 1145 teachers out of which grade IIIA are 1093 and IIIB are 4,
Diploma 25 and degree 6; Teacher’s houses 303 (house/teacher ratio 1:4); Teacher’s
offices 150; 66 store rooms; 1170 pit latrines (pit/pupil ratio 1:60); 38 Rainwater
harvesting tanks; 250 playing grounds
In terms of furniture, the BDC has 17702 desks (desk/pupil ratio 1:4); 1596 tables
(table/teacher ratio 1:2); 1944 chairs (chair/teacher ratio 1:2); Cupboards 498
(cupboard/School ratio1:5); Pupil/book ratio 1:3. In terms of resources, the current
situation of primary education department at Bunda District Council is as shown in the
table below: -

33
Table 14: Status of infrastructure and furniture in primary schools
Resources Required Available Gap
Classrooms 1549 688 861
Teachers Houses 1549 303 1246
Pit Latrines 3130 1170 1960
Desks 23257 17702 5555
Offices 300 38 262
Teachers Resource Centre 19 2 17
Tables(HQ) 13 8 5
Executive Chairs 13 0 13
Visitors’ Bench 2 1 1
Laptops Computers 13 1 12
Desktop Computers 2 2 0
Photocopier Machine 1 1 0
Printers 5 2 3
Vehicles 3 1 2
Motor Cycles 5 2 3
Certificate Holders Teachers 1770 1430 340
Diploma Holders Teachers 100 0 100
Degree Holders Teachers 19 19 0
Staff (HQ) 13 8 5
Sports grounds 400 250 150
Libraries 100 2 98
Offices 300 150 150
Water Tanks 300 38 262
Text books 29430 9810 19620
Reference books 29430 9810 19620
Teaching Aids 300 100 200
Source: Primary Education profile, 2017
34
2.3.11 Health Department
The District Council have different categories of Health facilities including
Hospital, five Health Centres and twenty-two Dispensaries of which 1
Hospital and 1 Dispensary are privately owned.
However, the Health sector is facing various challenges including inadequate
number of staff, supply of drugs, hospital equipment, medicine and medical
supplies and shortage of qualified and skilled personnel which ultimately
affect the performance of service delivery.
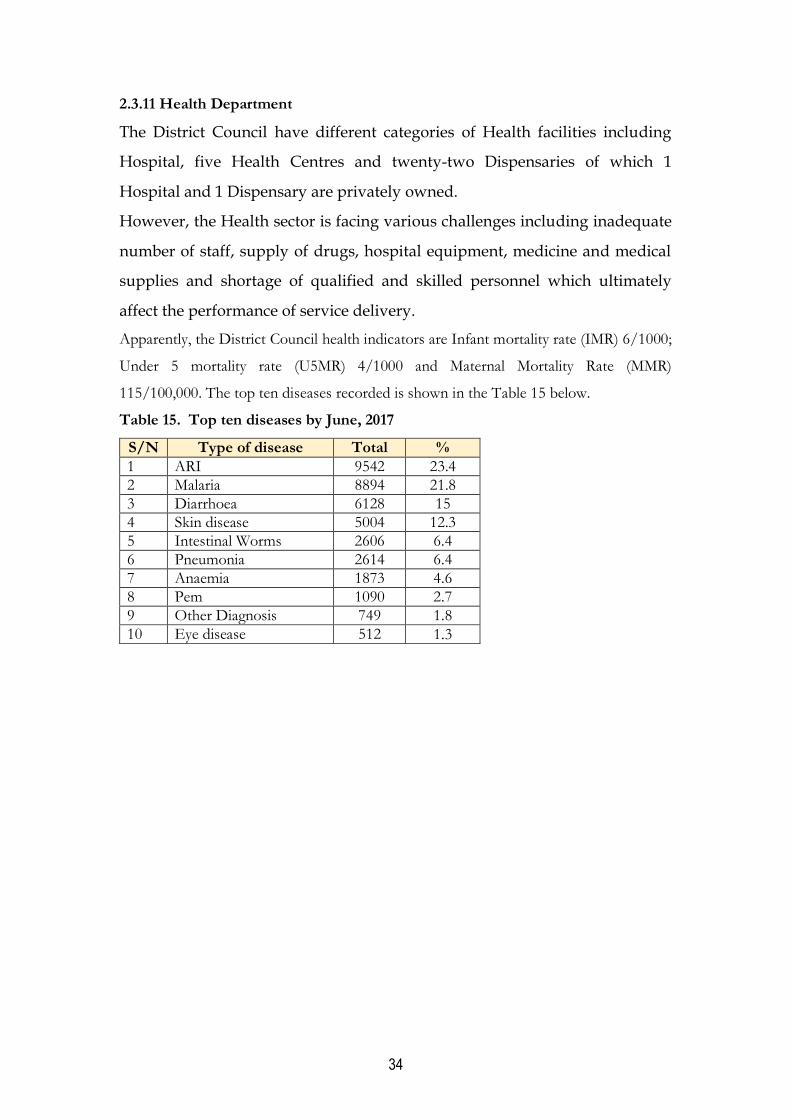
Apparently, the District Council health indicators are Infant mortality rate (IMR) 6/1000;
Under 5 mortality rate (U5MR) 4/1000 and Maternal Mortality Rate (MMR)
115/100,000. The top ten diseases recorded is shown in the Table 15 below.
Table 15. Top ten diseases by June, 2017
S/N Type of disease Total %
1 ARI 9542 23.4
2 Malaria 8894 21.8
3 Diarrhoea 6128 15
4 Skin disease 5004 12.3
5 Intestinal Worms 2606 6.4
6 Pneumonia 2614 6.4
7 Anaemia 1873 4.6
8 Pem 1090 2.7
9 Other Diagnosis 749 1.8
10 Eye disease 512 1.3
35
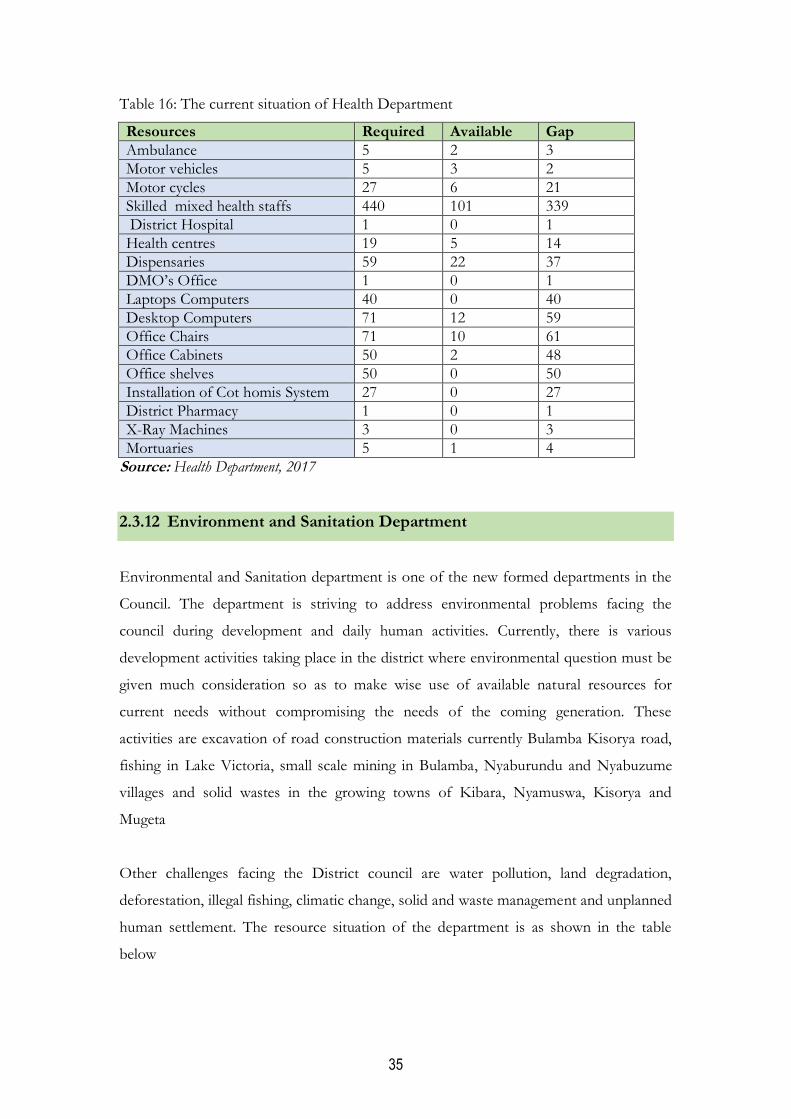
Table 16: The current situation of Health Department
Resources Required Available Gap
Ambulance 5 2 3
Motor vehicles 5 3 2
Motor cycles 27 6 21
Skilled mixed health staffs 440 101 339
District Hospital 1 0 1
Health centres 19 5 14
Dispensaries 59 22 37
DMO’s Office 1 0 1
Laptops Computers 40 0 40
Desktop Computers 71 12 59
Office Chairs 71 10 61
Office Cabinets 50 2 48
Office shelves 50 0 50
Installation of Cot homis System 27 0 27
District Pharmacy 1 0 1
X-Ray Machines 3 0 3
Mortuaries 5 1 4
Source: Health Department, 2017
2.3.12 Environment and Sanitation Department
Environmental and Sanitation department is one of the new formed departments in the
Council. The department is striving to address environmental problems facing the
council during development and daily human activities. Currently, there is various
development activities taking place in the district where environmental question must be
given much consideration so as to make wise use of available natural resources for
current needs without compromising the needs of the coming generation. These
activities are excavation of road construction materials currently Bulamba Kisorya road,
fishing in Lake Victoria, small scale mining in Bulamba, Nyaburundu and Nyabuzume
villages and solid wastes in the growing towns of Kibara, Nyamuswa, Kisorya and
Mugeta
Other challenges facing the District council are water pollution, land degradation,
deforestation, illegal fishing, climatic change, solid and waste management and unplanned
human settlement. The resource situation of the department is as shown in the table
below
36
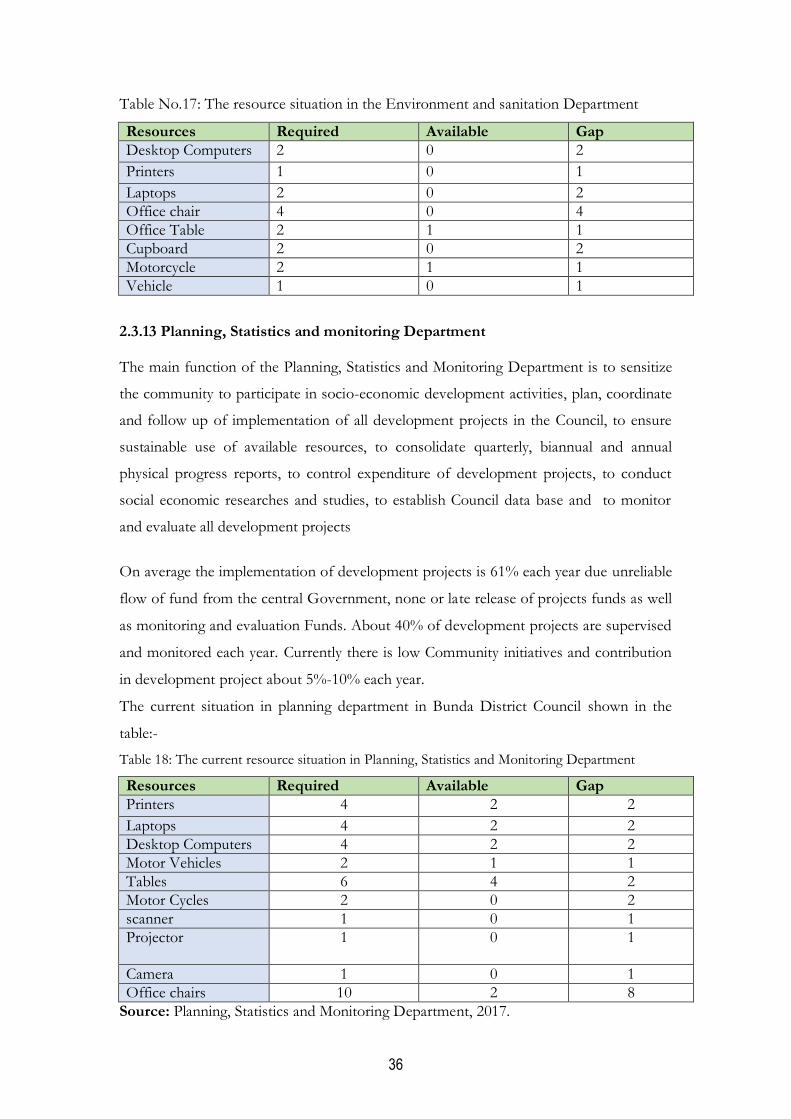
Table No.17: The resource situation in the Environment and sanitation Department
Resources Required Available Gap
Desktop Computers 2 0 2
Printers 1 0 1
Laptops 2 0 2
Office chair 4 0 4
Office Table 2 1 1
Cupboard 2 0 2
Motorcycle 2 1 1
Vehicle 1 0 1
2.3.13 Planning, Statistics and monitoring Department
The main function of the Planning, Statistics and Monitoring Department is to sensitize
the community to participate in socio-economic development activities, plan, coordinate
and follow up of implementation of all development projects in the Council, to ensure
sustainable use of available resources, to consolidate quarterly, biannual and annual
physical progress reports, to control expenditure of development projects, to conduct
social economic researches and studies, to establish Council data base and to monitor
and evaluate all development projects
On average the implementation of development projects is 61% each year due unreliable
flow of fund from the central Government, none or late release of projects funds as well
as monitoring and evaluation Funds. About 40% of development projects are supervised
and monitored each year. Currently there is low Community initiatives and contribution
in development project about 5%-10% each year.
The current situation in planning department in Bunda District Council shown in the
table:-
Table 18: The current resource situation in Planning, Statistics and Monitoring Department
Resources Required Available Gap
Printers 4 2 2
Laptops 4 2 2
Desktop Computers 4 2 2
Motor Vehicles 2 1 1
Tables 6 4 2
Motor Cycles 2 0 2
scanner 1 0 1
Projector 1 0 1
Camera 1 0 1
Office chairs 10 2 8
Source: Planning, Statistics and Monitoring Department, 2017.
37
2.3.14 Legal
The Legal Unit is among the Council units which has main function to advise the
council on legal matter , to represent the council in the court of law , Tribunal ,
Quasi-judicial board also to supervise the Ward Tribunal within the Council and to
enact bylaw for the council.
The legal unit is facing the following challenges
• Inadequate of facility such as transport office equipment
• Inadequate budget for unit
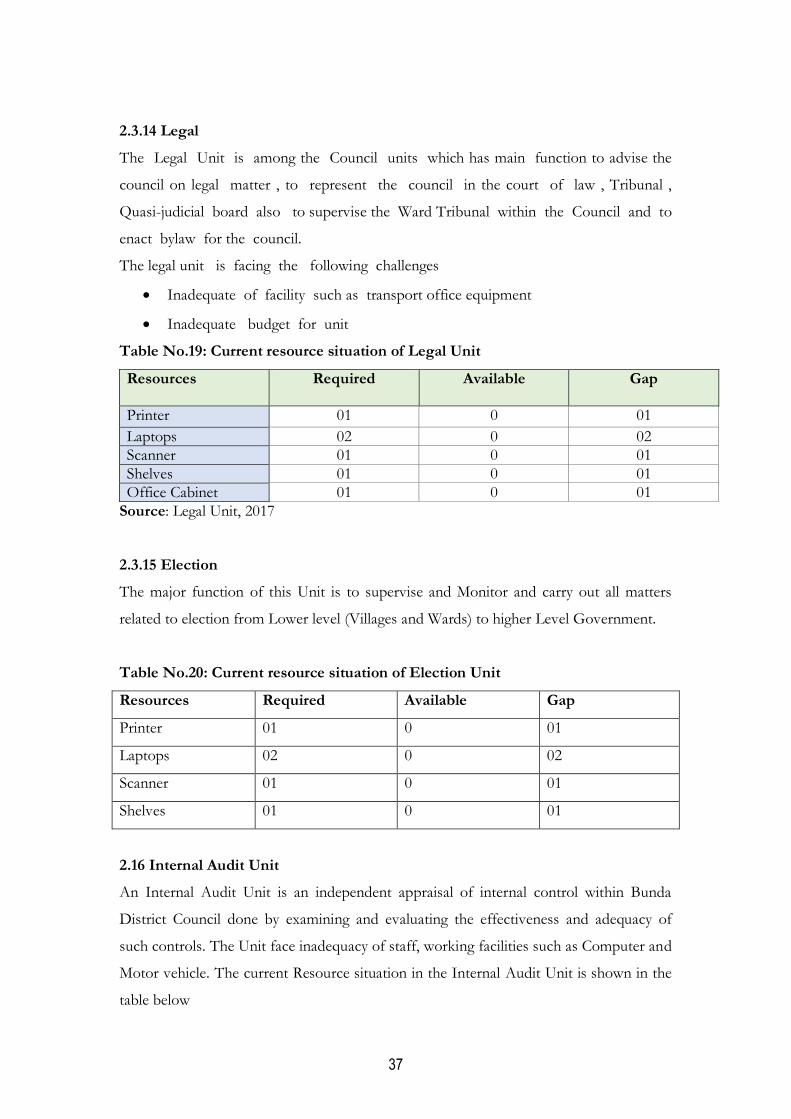
Table No.19: Current resource situation of Legal Unit
Resources Required Available Gap
Printer 01 0 01
Laptops 02 0 02
Scanner 01 0 01
Shelves 01 0 01
Office Cabinet 01 0 01
Source: Legal Unit, 2017
2.3.15 Election
The major function of this Unit is to supervise and Monitor and carry out all matters
related to election from Lower level (Villages and Wards) to higher Level Government.
Table No.20: Current resource situation of Election Unit
Resources Required Available Gap
Printer 01 0 01
Laptops 02 0 02
Scanner 01 0 01
Shelves 01 0 01
2.16 Internal Audit Unit
An Internal Audit Unit is an independent appraisal of internal control within Bunda
District Council done by examining and evaluating the effectiveness and adequacy of
such controls. The Unit face inadequacy of staff, working facilities such as Computer and
Motor vehicle. The current Resource situation in the Internal Audit Unit is shown in the
table below
38
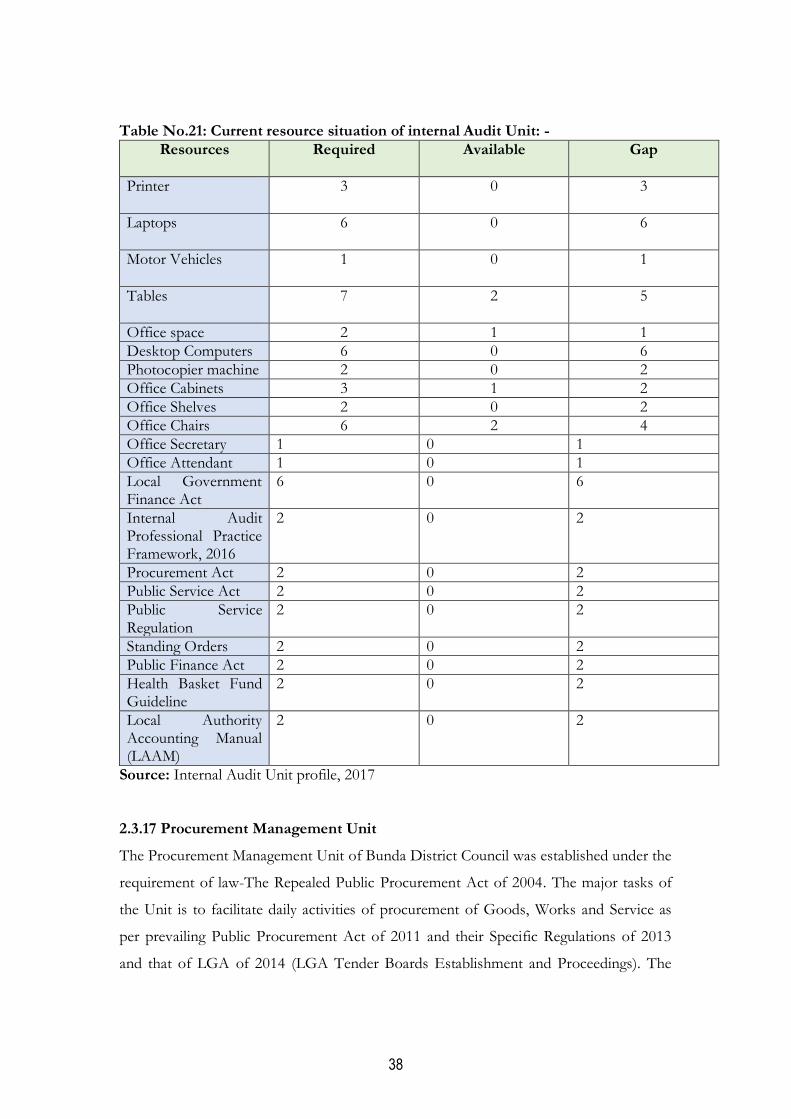
Table No.21: Current resource situation of internal Audit Unit: -
Resources Required Available Gap
Printer 3 0 3
Laptops 6 0 6
Motor Vehicles
1 0 1
Tables
7 2 5
Office space 2 1 1
Desktop Computers 6 0 6
Photocopier machine 2 0 2
Office Cabinets 3 1 2
Office Shelves 2 0 2
Office Chairs 6 2 4
Office Secretary 1 0 1
Office Attendant 1 0 1
Local Government Finance Act
6 0 6
Internal Audit Professional Practice Framework, 2016
2 0 2
Procurement Act 2 0 2
Public Service Act 2 0 2
Public Service Regulation
2 0 2
Standing Orders 2 0 2
Public Finance Act 2 0 2
Health Basket Fund Guideline
2 0 2
Local Authority Accounting Manual (LAAM)
2 0 2
Source: Internal Audit Unit profile, 2017
2.3.17 Procurement Management Unit
The Procurement Management Unit of Bunda District Council was established under the
requirement of law-The Repealed Public Procurement Act of 2004. The major tasks of
the Unit is to facilitate daily activities of procurement of Goods, Works and Service as
per prevailing Public Procurement Act of 2011 and their Specific Regulations of 2013
and that of LGA of 2014 (LGA Tender Boards Establishment and Proceedings). The
39
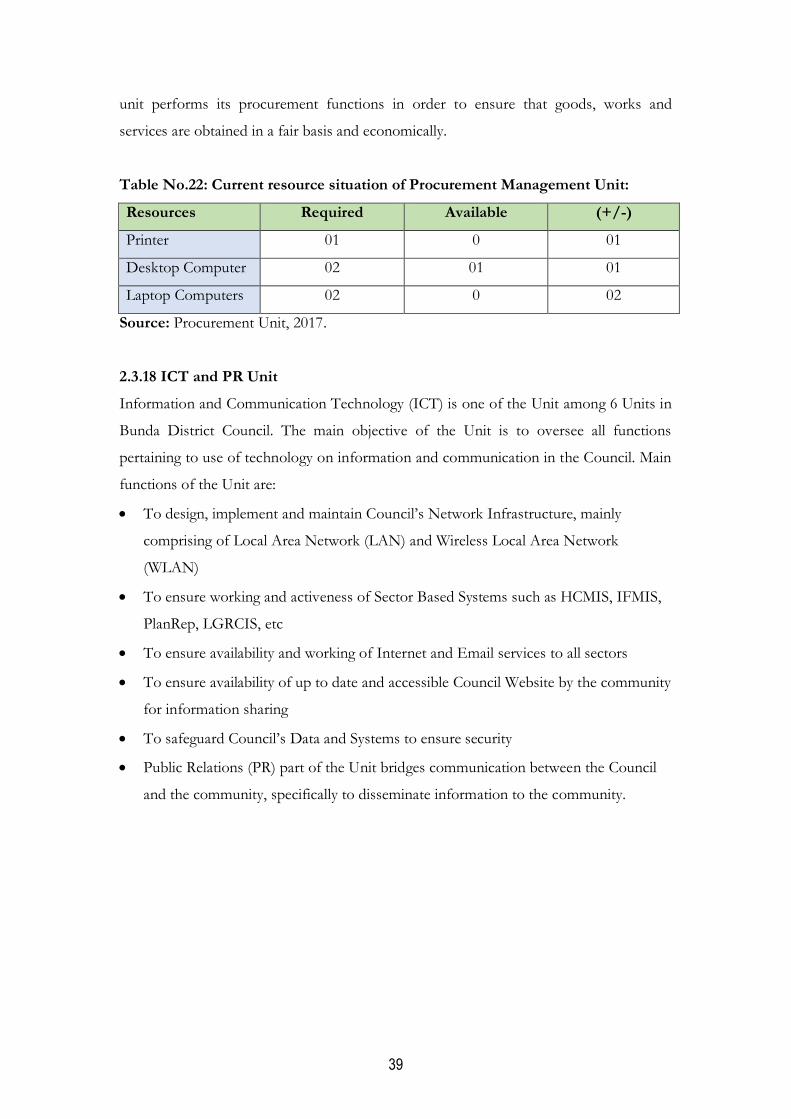
unit performs its procurement functions in order to ensure that goods, works and
services are obtained in a fair basis and economically.
Table No.22: Current resource situation of Procurement Management Unit:
Resources Required Available (+/-)
Printer 01 0 01
Desktop Computer 02 01 01
Laptop Computers 02 0 02
Source: Procurement Unit, 2017.
2.3.18 ICT and PR Unit
Information and Communication Technology (ICT) is one of the Unit among 6 Units in
Bunda District Council. The main objective of the Unit is to oversee all functions
pertaining to use of technology on information and communication in the Council. Main
functions of the Unit are:
• To design, implement and maintain Council’s Network Infrastructure, mainly
comprising of Local Area Network (LAN) and Wireless Local Area Network
(WLAN)
• To ensure working and activeness of Sector Based Systems such as HCMIS, IFMIS,
PlanRep, LGRCIS, etc
• To ensure availability and working of Internet and Email services to all sectors
• To ensure availability of up to date and accessible Council Website by the community
for information sharing
• To safeguard Council’s Data and Systems to ensure security
• Public Relations (PR) part of the Unit bridges communication between the Council
and the community, specifically to disseminate information to the community.
40
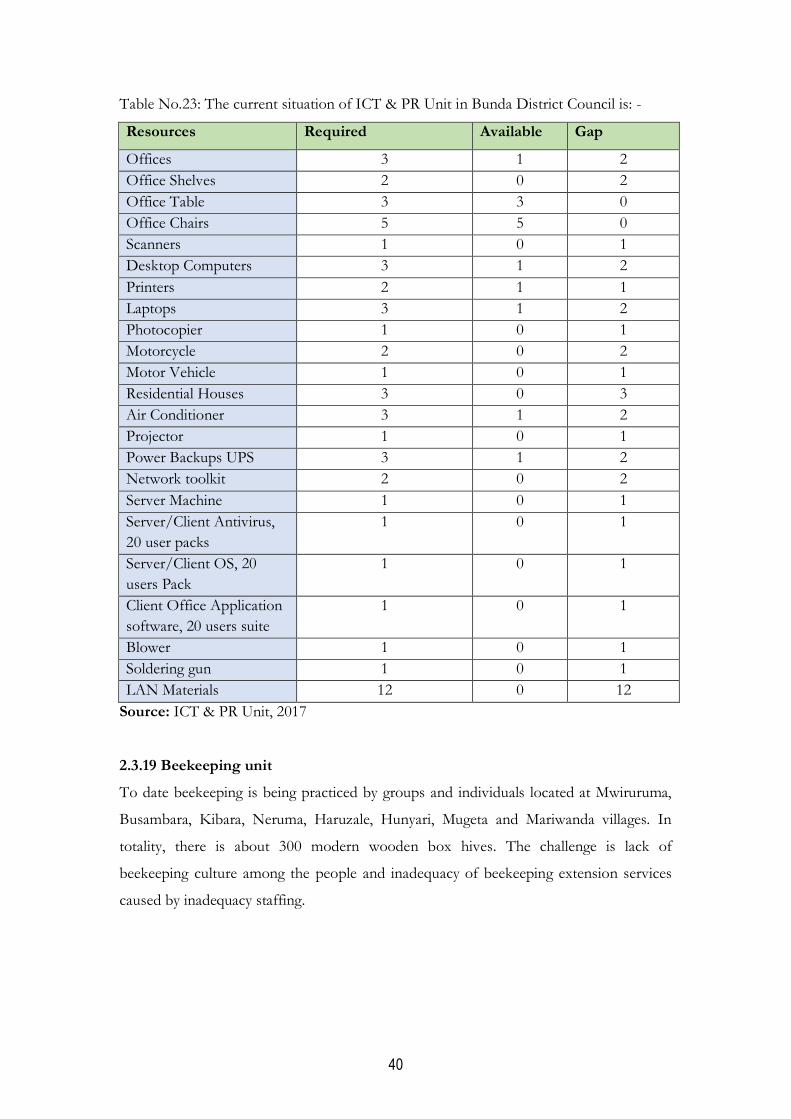
Table No.23: The current situation of ICT & PR Unit in Bunda District Council is: -
Resources Required Available Gap
Offices 3 1 2
Office Shelves 2 0 2
Office Table 3 3 0
Office Chairs 5 5 0
Scanners 1 0 1
Desktop Computers 3 1 2
Printers 2 1 1
Laptops 3 1 2
Photocopier 1 0 1
Motorcycle 2 0 2
Motor Vehicle 1 0 1
Residential Houses 3 0 3
Air Conditioner 3 1 2
Projector 1 0 1
Power Backups UPS 3 1 2
Network toolkit 2 0 2
Server Machine 1 0 1
Server/Client Antivirus,
20 user packs
1 0 1
Server/Client OS, 20
users Pack
1 0 1
Client Office Application
software, 20 users suite
1 0 1
Blower 1 0 1
Soldering gun 1 0 1
LAN Materials 12 0 12
Source: ICT & PR Unit, 2017
2.3.19 Beekeeping unit
To date beekeeping is being practiced by groups and individuals located at Mwiruruma,
Busambara, Kibara, Neruma, Haruzale, Hunyari, Mugeta and Mariwanda villages. In
totality, there is about 300 modern wooden box hives. The challenge is lack of
beekeeping culture among the people and inadequacy of beekeeping extension services
caused by inadequacy staffing.
41
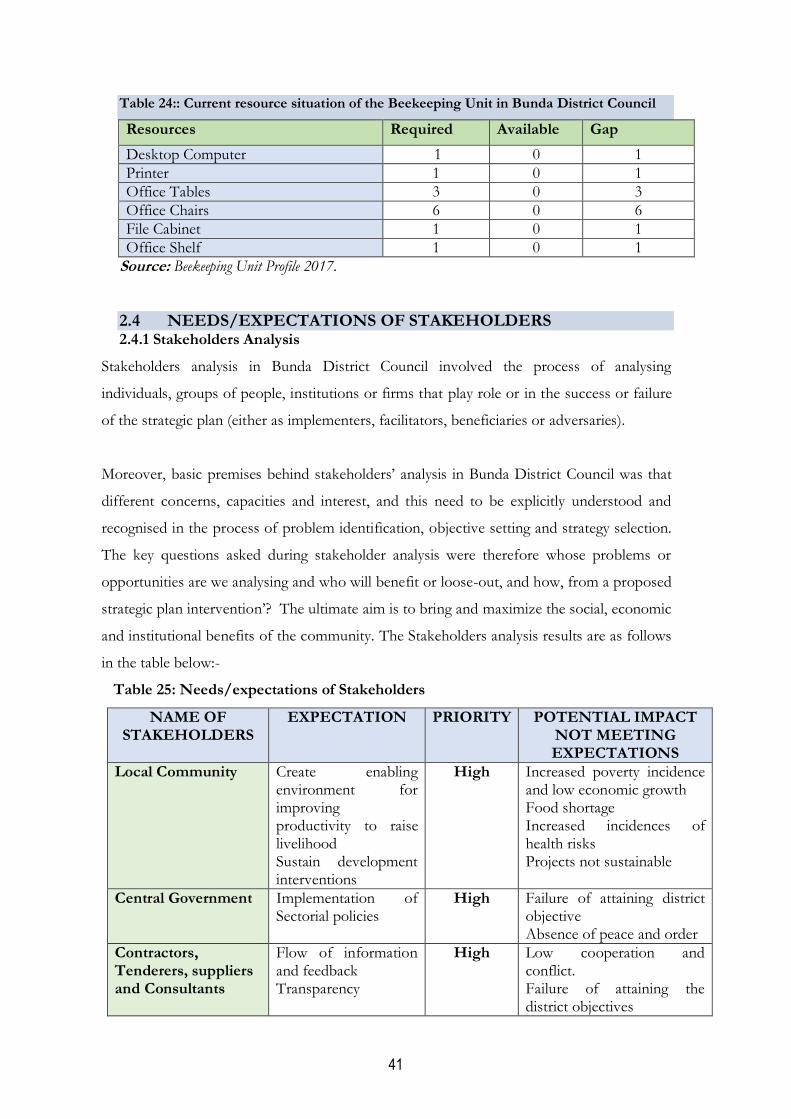
Table 24:: Current resource situation of the Beekeeping Unit in Bunda District Council
Resources Required Available Gap
Desktop Computer 1 0 1
Printer 1 0 1
Office Tables 3 0 3
Office Chairs 6 0 6
File Cabinet 1 0 1
Office Shelf 1 0 1
Source: Beekeeping Unit Profile 2017.
2.4 NEEDS/EXPECTATIONS OF STAKEHOLDERS 2.4.1 Stakeholders Analysis
Stakeholders analysis in Bunda District Council involved the process of analysing
individuals, groups of people, institutions or firms that play role or in the success or failure
of the strategic plan (either as implementers, facilitators, beneficiaries or adversaries).
Moreover, basic premises behind stakeholders’ analysis in Bunda District Council was that
different concerns, capacities and interest, and this need to be explicitly understood and
recognised in the process of problem identification, objective setting and strategy selection.
The key questions asked during stakeholder analysis were therefore whose problems or
opportunities are we analysing and who will benefit or loose-out, and how, from a proposed
strategic plan intervention’? The ultimate aim is to bring and maximize the social, economic
and institutional benefits of the community. The Stakeholders analysis results are as follows
in the table below:-
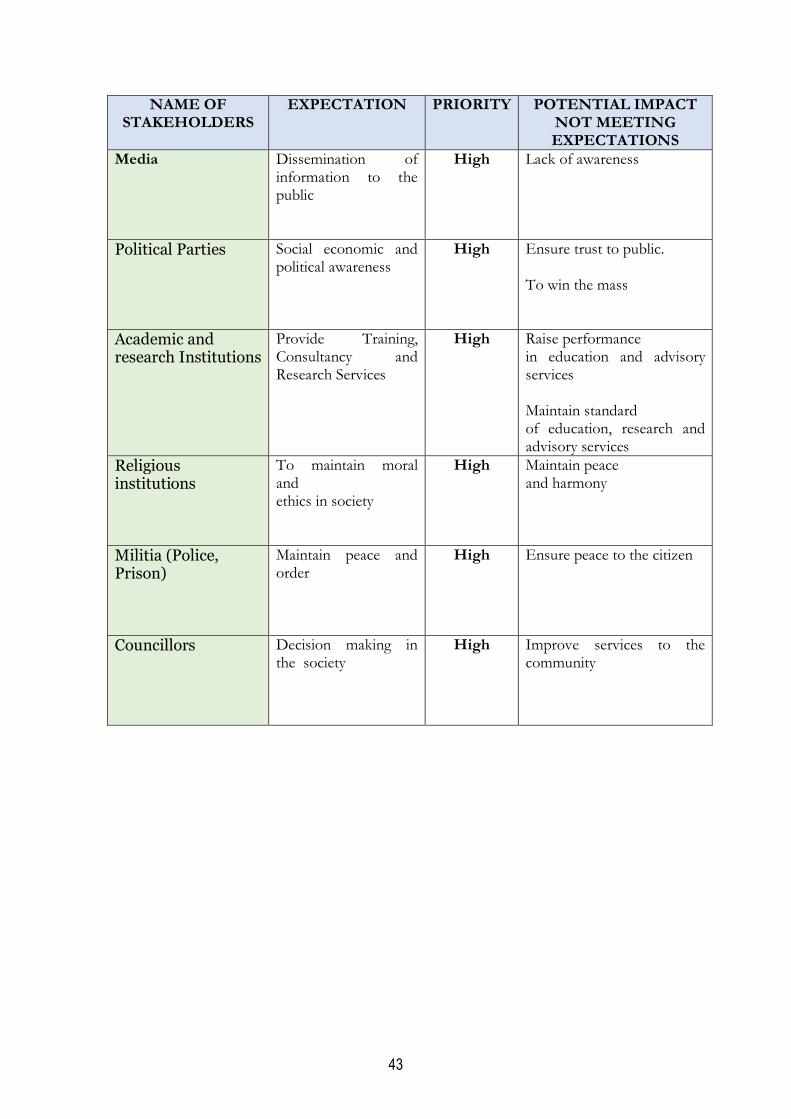
Table 25: Needs/expectations of Stakeholders
NAME OF STAKEHOLDERS
EXPECTATION PRIORITY POTENTIAL IMPACT NOT MEETING EXPECTATIONS
Local Community Create enabling environment for improving productivity to raise livelihood Sustain development interventions
High Increased poverty incidence and low economic growth Food shortage Increased incidences of health risks Projects not sustainable
Central Government Implementation of Sectorial policies
High Failure of attaining district objective Absence of peace and order
Contractors, Tenderers, suppliers and Consultants
Flow of information and feedback Transparency
High Low cooperation and conflict. Failure of attaining the district objectives
42
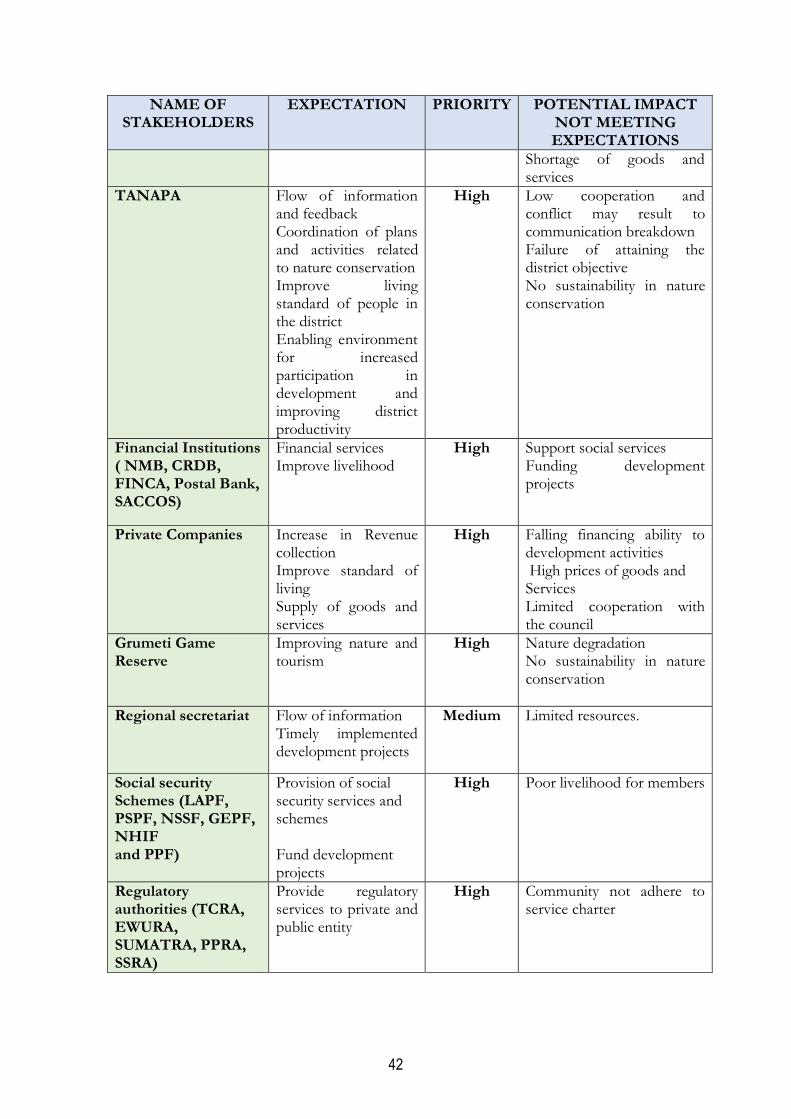
NAME OF STAKEHOLDERS
EXPECTATION PRIORITY POTENTIAL IMPACT NOT MEETING EXPECTATIONS
Shortage of goods and services
TANAPA Flow of information and feedback Coordination of plans and activities related to nature conservation Improve living standard of people in the district Enabling environment for increased participation in development and improving district productivity
High Low cooperation and conflict may result to communication breakdown Failure of attaining the district objective No sustainability in nature conservation
Financial Institutions ( NMB, CRDB, FINCA, Postal Bank, SACCOS)
Financial services Improve livelihood
High Support social services Funding development projects
Private Companies Increase in Revenue collection Improve standard of living Supply of goods and services
High Falling financing ability to development activities High prices of goods and Services Limited cooperation with the council
Grumeti Game Reserve
Improving nature and tourism
High Nature degradation No sustainability in nature conservation
Regional secretariat
Flow of information Timely implemented development projects
Medium Limited resources.
Social security Schemes (LAPF, PSPF, NSSF, GEPF, NHIF and PPF)
Provision of social security services and schemes Fund development projects
High Poor livelihood for members
Regulatory authorities (TCRA, EWURA, SUMATRA, PPRA, SSRA)
Provide regulatory services to private and public entity
High Community not adhere to service charter
43
NAME OF STAKEHOLDERS
EXPECTATION PRIORITY POTENTIAL IMPACT NOT MEETING EXPECTATIONS
Media Dissemination of information to the public
High Lack of awareness
Political Parties Social economic and political awareness
High Ensure trust to public. To win the mass
Academic and research Institutions
Provide Training, Consultancy and Research Services
High Raise performance in education and advisory services Maintain standard of education, research and advisory services
Religious institutions
To maintain moral and ethics in society
High Maintain peace and harmony
Militia (Police, Prison)
Maintain peace and order
High Ensure peace to the citizen
Councillors Decision making in the society
High Improve services to the community

44
CHAPTER THREE
VISION, MISSION, PHILOSOPHY, VALUES, OBJECTIVES AND
FUNCTIONS OF BUNDA DISTRICT COUNCIL
3.1 Vision
‘‘To have a Community with improved living standards with Strong Economic base, excellent services and living in peace and harmony’’
3.2 Mission
“To build the capacity of the residents by providing high quality services in a participatory
manner and ensuring optimal utilization of the available resources by adhering to principles
of good governance”.
3.3 BDC Philosophy
The BDC mission will be accomplished in a fair and equitable fashion using science-based
information, open communication, and collaboration. The policies and actions of Bunda
District Council will be developed and carried out to foster the public’s trust and respect;
and will be implemented in a way that encourages employee’s teamwork and partnerships
with private sector and non-governmental entities.
3.4 Council Core Values
BDC’s core values are:
• INTEGRITY: At all times, we act morally, ethically, and with honesty.
• LEADERSHIP: Council is committed to providing the highest standard of civic
leadership and performance for the betterment of our community.
• COMMUNITY PARTICIPATION: Council encourages community participation
and involvement in the life of our District and values the contribution made by each
stakeholder.
45
• EQUITY: The council will offer service equitably to ensure fairness to all sectors of
our community.
• QUALITY: Council seeks to continuously improve services, facilities and processes
and to create a reputation for excellence within our financial capabilities to enhance
the quality of life of our community in an economically sustainable manner.
• RESPONSIVENESS: Council seek to be responsive to the needs and aspirations
of our community.
• EXPLICITY: Council will ensure that, as far as possible, our rules & regulations,
by-laws, and operational procedures are simple, clear and precise.
• ACCOUNTABILITY and TRANSPARENCY: Council will operate prudently
within our means to ensure our on-going financial sustainability; as well as
transparency in all its decisions.
• RESPONSIBILITY: Councillors and staff shall discharge their responsibilities
efficiently, diligently with discipline and honesty.
• CONFLICT OF INTEREST: Councillor, staff and their relatives, shall avoid
personal conflict of interest in Council business, shall exercise self-commitment and
shall abide to the rule of law when executing his/her duties.
3.5 OBJECTIVES OF BUNDA DISTRICT COUNCIL
The objectives of the Council include the following:
3.5.1 Improve services and reduce HIV/AIDS infection The Council with all efforts will continue to fight with HIV/AIDS pandemic in the District
Council, which is a threat to socio-economic development of the district.
3.5.2 Enhance, sustain and effective implementation of the National Ant-corruption strategy
The Council will ensure that fighting against corruption is sustainable in all sectors in order
to make sure services are offered to citizens fairly without any element of corruption.
3.5.3 Improve access, quality and equitable social services delivery The Council will ensure citizens have access to quality and equitable social service in the
District Council, such as health, education and water.
46
3.5.4 Increase Quantity and Quality of social services and infrastructure. The Council will ensure in five years to come there is increase in quantity and quality of
social service and infrastructures such as roads in the district.
3.5.5 Enhance Good Governance and Administrative services. The Council will ensure the delivery of social services in the district follows the principles of
good governance.
3.5.6 Improve social welfare, gender and community empowerment. The Council will ensure in coming five years there is improvement in social welfare, gender,
participation and community empowerment in the district.
3.5.7 Improve Emergence and Disaster Management The Council will ensure the presence of emergence and disaster management in in order to
deal with unforeseen calamities in the District.
3.5.8: Improve Environmental Conservation, Natural Resources and Land
Management for sustainable development.
The Council will ensure the improvement of environmental Conservation, Natural
Resources and Land Management for sustainable development.
3.5.9: Diversify sources of revenue through expanded investment opportunities.
The Council strives to provide conducive environment to expand investment opportunities
in order to diversify sources of revenue
3.6 FUNCTIONS OF THE COUNCIL
The BDC functions as provided by the Local Government Act No. 7 of 1982 are: -
• To maintain and facilitate the maintenance of peace, order and good governance within its area of jurisdiction;
• To promote the social welfare and economic well-being for all persons within its area of jurisdiction;
• Subject to the national policy and plans for rural and urban development; to further the social and economic development of its area of jurisdiction
• To take necessary measures to protect and enhance the environment in order to promote sustainable development;

47
• To give effective and meaningful decentralization in political, financial and administrative matters relating to the functions, powers, responsibilities and services of all levels of local government authorities;
• To promote and ensure democratic participation and control of decision making by
people concerned; and
• To establish and maintain reliable sources of revenue and other resources enabling local government authorities to perform other functions effectively and to enhance financial accountability of local government authorities, their members and employees.
• And all other functions as provided for in the Local Government Authorities.
3.7 COUNCIL MANAGEMENT STRUCTURE
The Council management structure comprises of the Full Council, five standing Committees
and the Council Management Team (CMT) as stipulated in the Local Government (District
Authorities) Act of 1982.
3.7.1 Full Council
This in the top decision organ in the Council which comprises of the Councillors and the
Councils Management team under the chairmanship of the Council chairperson and the
District Executive Director is the secretary to this organ.
3.7.2 Standing Committees
These committees are set in respect to different development sectors. The standing
committees include: -
• Finance, Administration and Planning Committee
• Education, Health and Water Committee
• Economic, Works and Environment Committee
• Integrity Committee
• HIV/AIDs control Committee
48
3.7.3 Council Management Team (CMT)
This is a Council technical team comprising of Heads of Departments and Units. The DED
is the chairperson of this team. It is vested to discuss all technical matters in the Council and
plays an advisory role to the DED.
i. District Executive Director (DED)
The District Executive Director (DED) is the Chief Executive Officer (CEO) of Council
and the Secretary to the Full Council. The DED has the powers to exercise supervision
and control over all activities of the Council. Moreover, the DED is the Accounting
Officer of the Council.
ii. Heads of Departments and Units
The council comprises of 13 departments and 6 units with their respective heads. The
Departments and Units are Administration and Human Resources, Works and Fire
Rescue, Primary education, Secondary education, Finance and Trade, health, water,
Planning, Monitoring and statistic, Agriculture and Cooperatives, Livestock and
Fisheries, Community development, Cleaning and environment, lands and natural
Resources. The units are Beekeeping, ICT, Procurement, Internal Audit, Legal and
Election.
The heads of these departments and Units assists the DED in carrying out the core
functions of the council in making sure that socio-economic development is attained in
the Council.
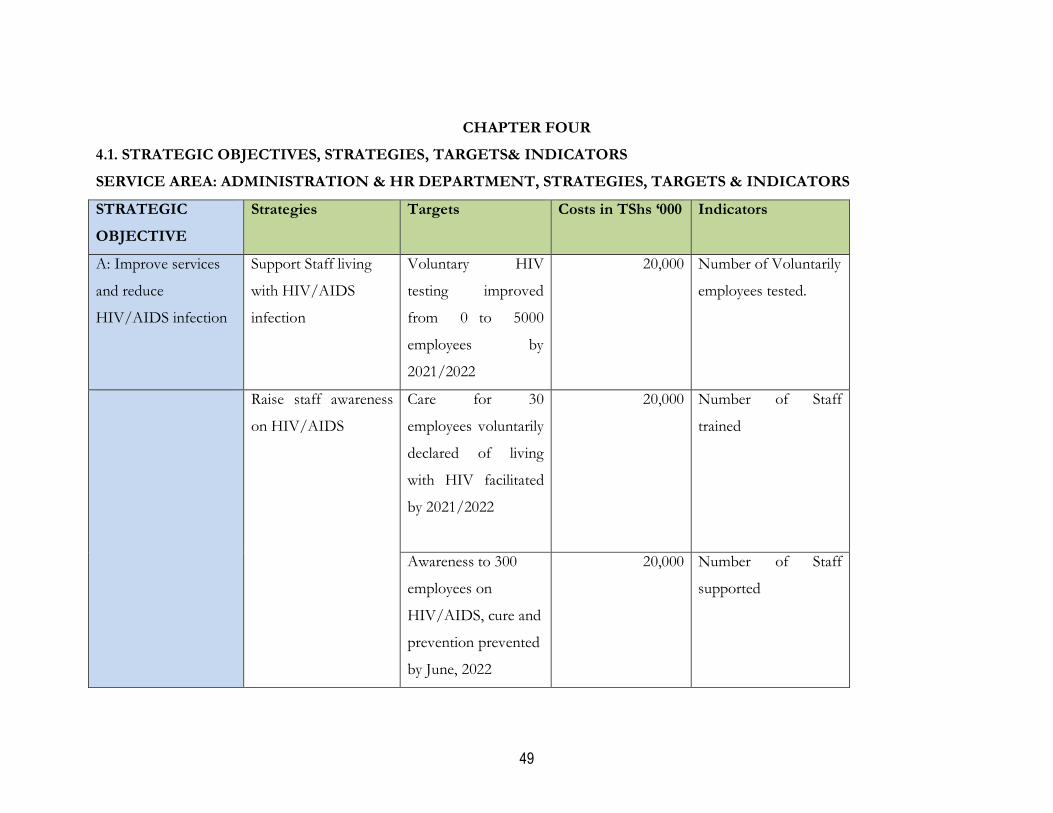
49
CHAPTER FOUR
4.1. STRATEGIC OBJECTIVES, STRATEGIES, TARGETS& INDICATORS
SERVICE AREA: ADMINISTRATION & HR DEPARTMENT, STRATEGIES, TARGETS & INDICATORS
STRATEGIC
OBJECTIVE
Strategies Targets Costs in TShs ‘000 Indicators
A: Improve services
and reduce
HIV/AIDS infection
Support Staff living
with HIV/AIDS
infection
Voluntary HIV
testing improved
from 0 to 5000
employees by
2021/2022
20,000 Number of Voluntarily
employees tested.
Raise staff awareness
on HIV/AIDS
Care for 30
employees voluntarily
declared of living
with HIV facilitated
by 2021/2022
20,000 Number of Staff
trained
Awareness to 300
employees on
HIV/AIDS, cure and
prevention prevented
by June, 2022
20,000 Number of Staff
supported
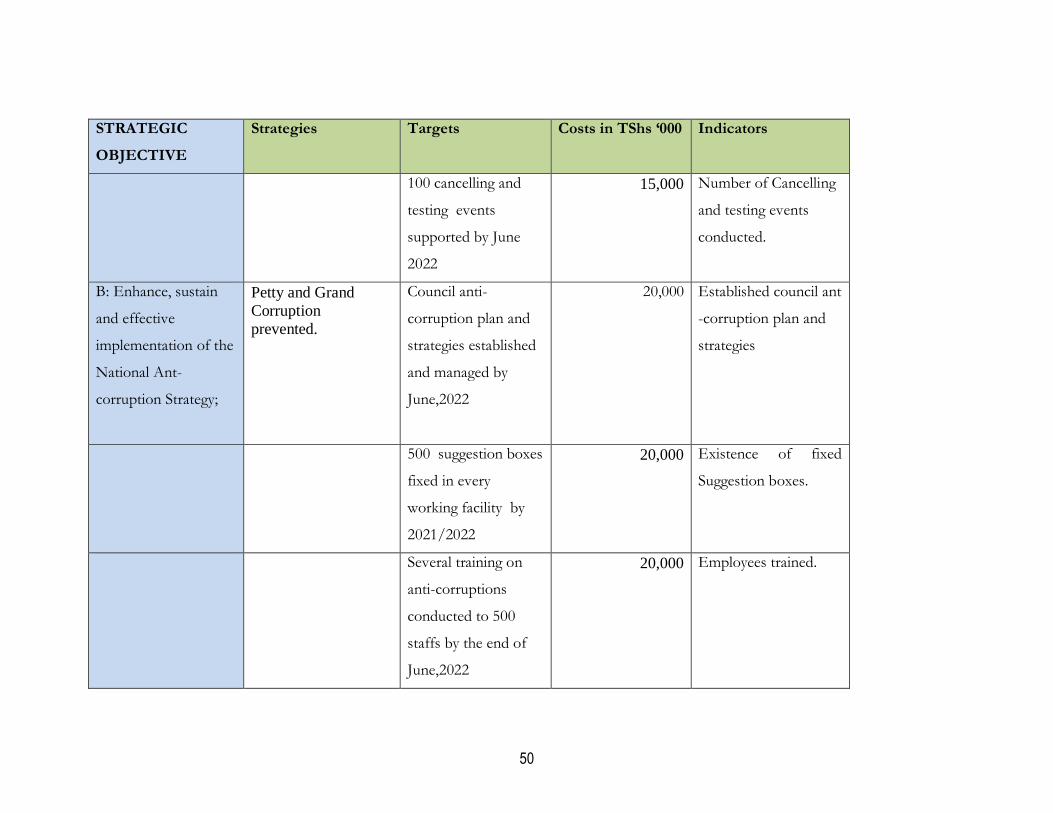
50
STRATEGIC
OBJECTIVE
Strategies Targets Costs in TShs ‘000 Indicators
100 cancelling and
testing events
supported by June
2022
15,000 Number of Cancelling
and testing events
conducted.
B: Enhance, sustain
and effective
implementation of the
National Ant-
corruption Strategy;
Petty and Grand
Corruption
prevented.
Council anti-
corruption plan and
strategies established
and managed by
June,2022
20,000 Established council ant
-corruption plan and
strategies
500 suggestion boxes
fixed in every
working facility by
2021/2022
20,000 Existence of fixed
Suggestion boxes.
Several training on
anti-corruptions
conducted to 500
staffs by the end of
June,2022
20,000 Employees trained.
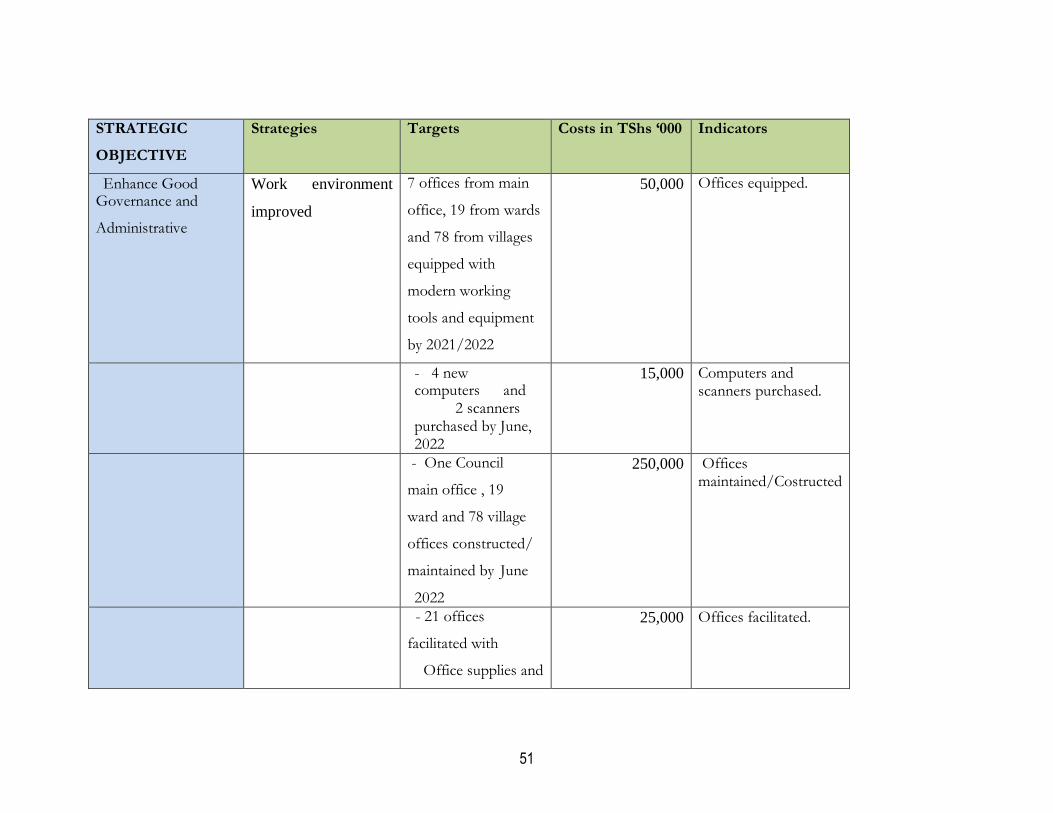
51
STRATEGIC
OBJECTIVE
Strategies Targets Costs in TShs ‘000 Indicators
Enhance Good Governance and
Administrative
Work environment
improved
7 offices from main
office, 19 from wards
and 78 from villages
equipped with
modern working
tools and equipment
by 2021/2022
50,000 Offices equipped.
- 4 new computers and 2 scanners purchased by June, 2022
15,000 Computers and scanners purchased.
- One Council
main office , 19
ward and 78 village
offices constructed/
maintained by June
2022
250,000
Offices maintained/Costructed
- 21 offices
facilitated with
Office supplies and
25,000 Offices facilitated.
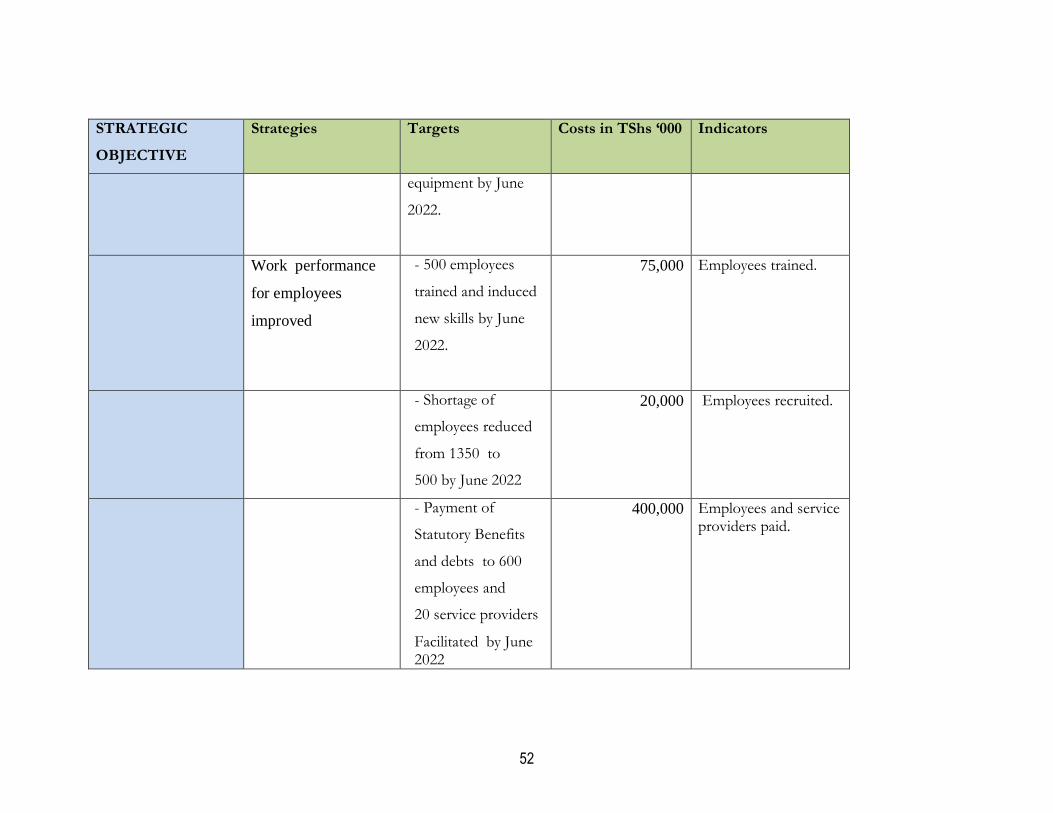
52
STRATEGIC
OBJECTIVE
Strategies Targets Costs in TShs ‘000 Indicators
equipment by June
2022.
Work performance
for employees
improved
- 500 employees
trained and induced
new skills by June
2022.
75,000 Employees trained.
- Shortage of
employees reduced
from 1350 to
500 by June 2022
20,000 Employees recruited.
- Payment of
Statutory Benefits
and debts to 600
employees and
20 service providers
Facilitated by June 2022
400,000 Employees and service providers paid.
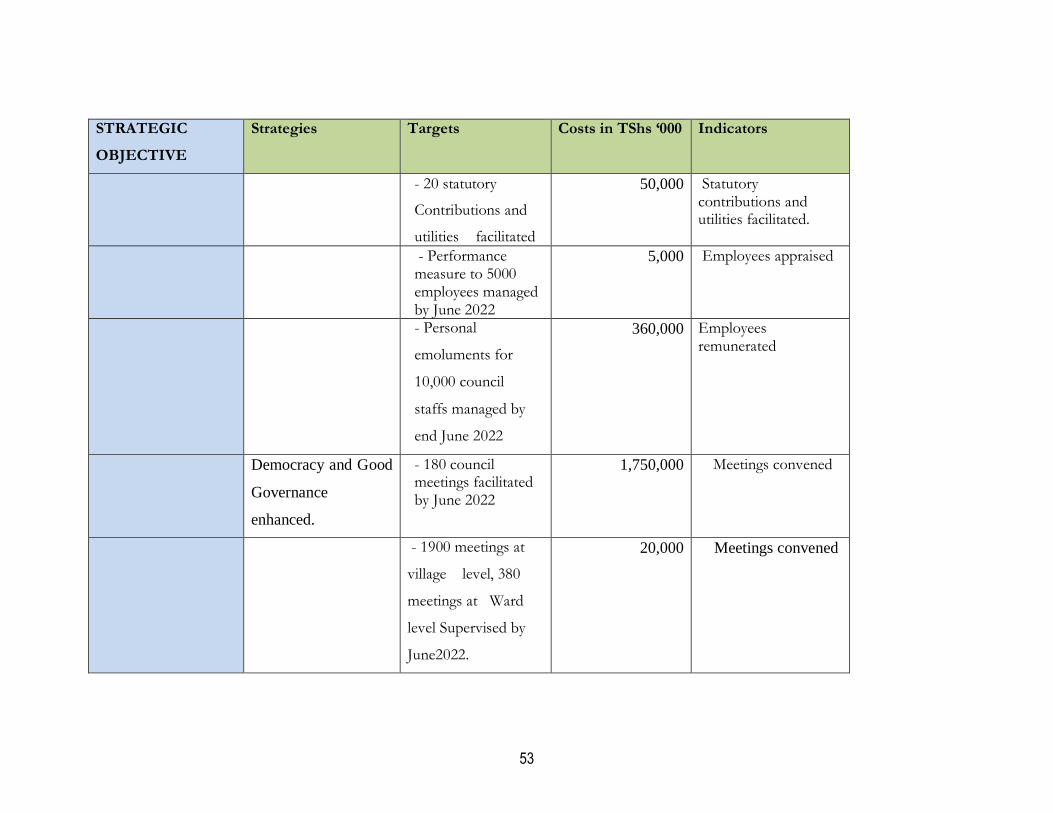
53
STRATEGIC
OBJECTIVE
Strategies Targets Costs in TShs ‘000 Indicators
- 20 statutory
Contributions and
utilities facilitated by June 2022
50,000 Statutory contributions and utilities facilitated.
- Performance measure to 5000 employees managed by June 2022
5,000 Employees appraised
- Personal
emoluments for
10,000 council
staffs managed by
end June 2022
360,000 Employees remunerated
Democracy and Good
Governance
enhanced.
- 180 council meetings facilitated by June 2022
1,750,000 Meetings convened
- 1900 meetings at
village level, 380
meetings at Ward
level Supervised by
June2022.
20,000 Meetings convened
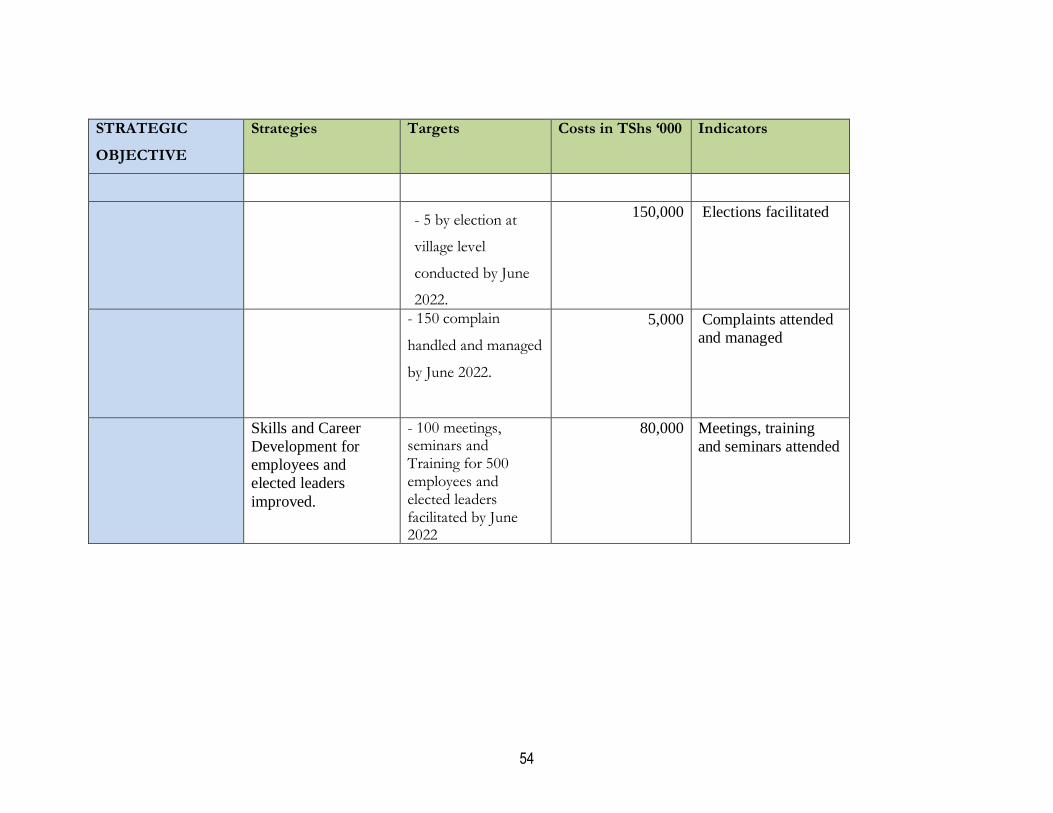
54
STRATEGIC
OBJECTIVE
Strategies Targets Costs in TShs ‘000 Indicators
- 5 by election at
village level
conducted by June
2022.
150,000 Elections facilitated
- 150 complain
handled and managed
by June 2022.
5,000 Complaints attended
and managed
Skills and Career
Development for
employees and
elected leaders
improved.
- 100 meetings, seminars and Training for 500 employees and elected leaders facilitated by June 2022
80,000 Meetings, training
and seminars attended
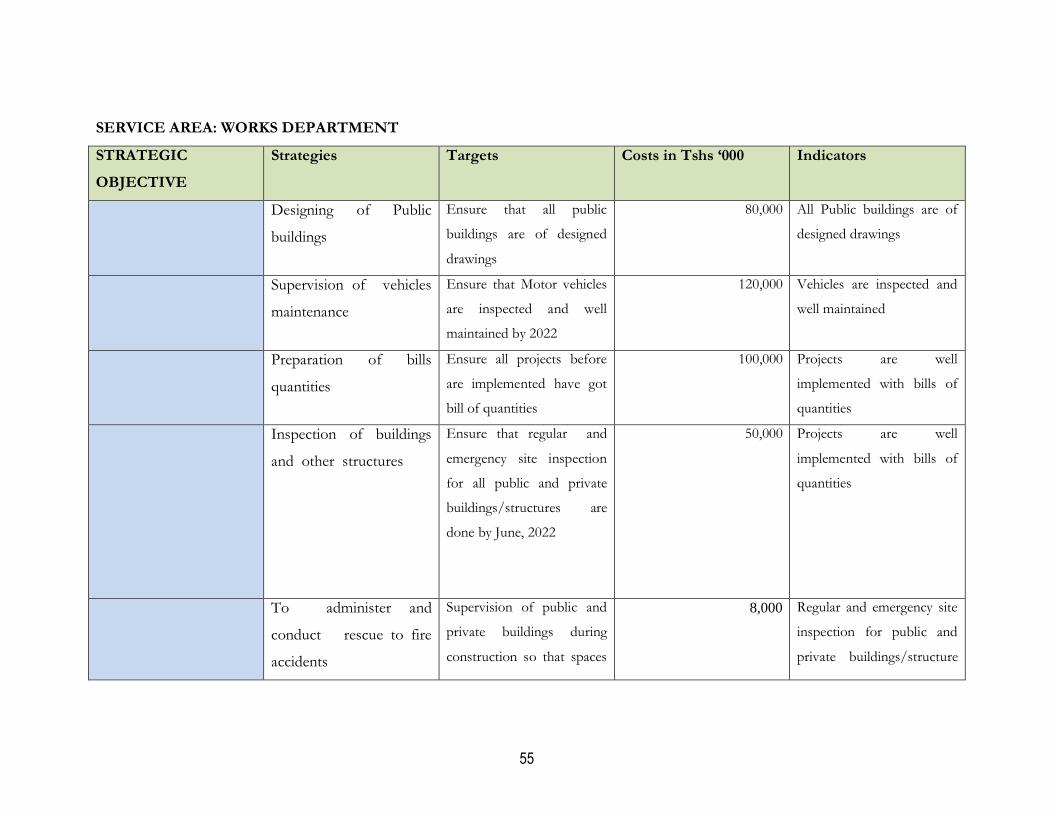
55
SERVICE AREA: WORKS DEPARTMENT
STRATEGIC
OBJECTIVE
Strategies Targets Costs in Tshs ‘000 Indicators
Designing of Public
buildings
Ensure that all public
buildings are of designed
drawings
80,000 All Public buildings are of
designed drawings
Supervision of vehicles
maintenance
Ensure that Motor vehicles
are inspected and well
maintained by 2022
120,000 Vehicles are inspected and
well maintained
Preparation of bills
quantities
Ensure all projects before
are implemented have got
bill of quantities
100,000 Projects are well
implemented with bills of
quantities
Inspection of buildings
and other structures
Ensure that regular and
emergency site inspection
for all public and private
buildings/structures are
done by June, 2022
50,000
Projects are well
implemented with bills of
quantities
To administer and
conduct rescue to fire
accidents
Supervision of public and
private buildings during
construction so that spaces
8,000 Regular and emergency site
inspection for public and
private buildings/structure
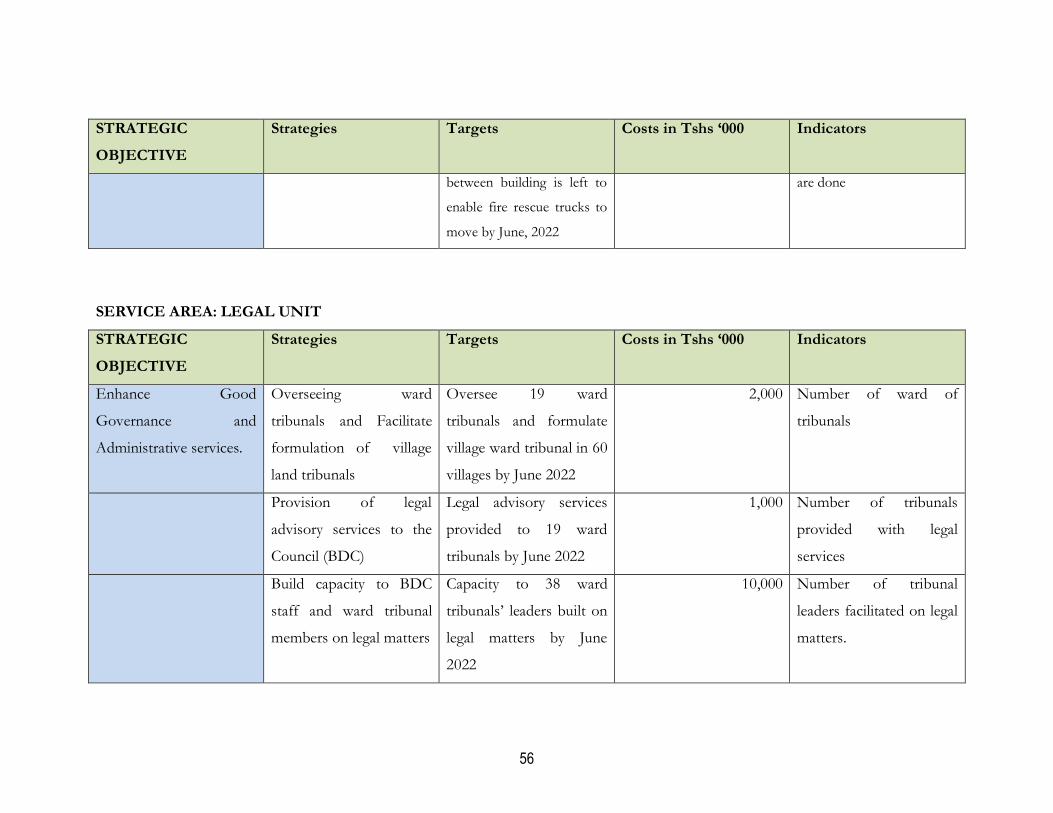
56
STRATEGIC
OBJECTIVE
Strategies Targets Costs in Tshs ‘000 Indicators
between building is left to
enable fire rescue trucks to
move by June, 2022
are done
SERVICE AREA: LEGAL UNIT
STRATEGIC
OBJECTIVE
Strategies Targets Costs in Tshs ‘000 Indicators
Enhance Good
Governance and
Administrative services.
Overseeing ward
tribunals and Facilitate
formulation of village
land tribunals
Oversee 19 ward
tribunals and formulate
village ward tribunal in 60
villages by June 2022
2,000 Number of ward of
tribunals
Provision of legal
advisory services to the
Council (BDC)
Legal advisory services
provided to 19 ward
tribunals by June 2022
1,000 Number of tribunals
provided with legal
services
Build capacity to BDC
staff and ward tribunal
members on legal matters
Capacity to 38 ward
tribunals’ leaders built on
legal matters by June
2022
10,000 Number of tribunal
leaders facilitated on legal
matters.
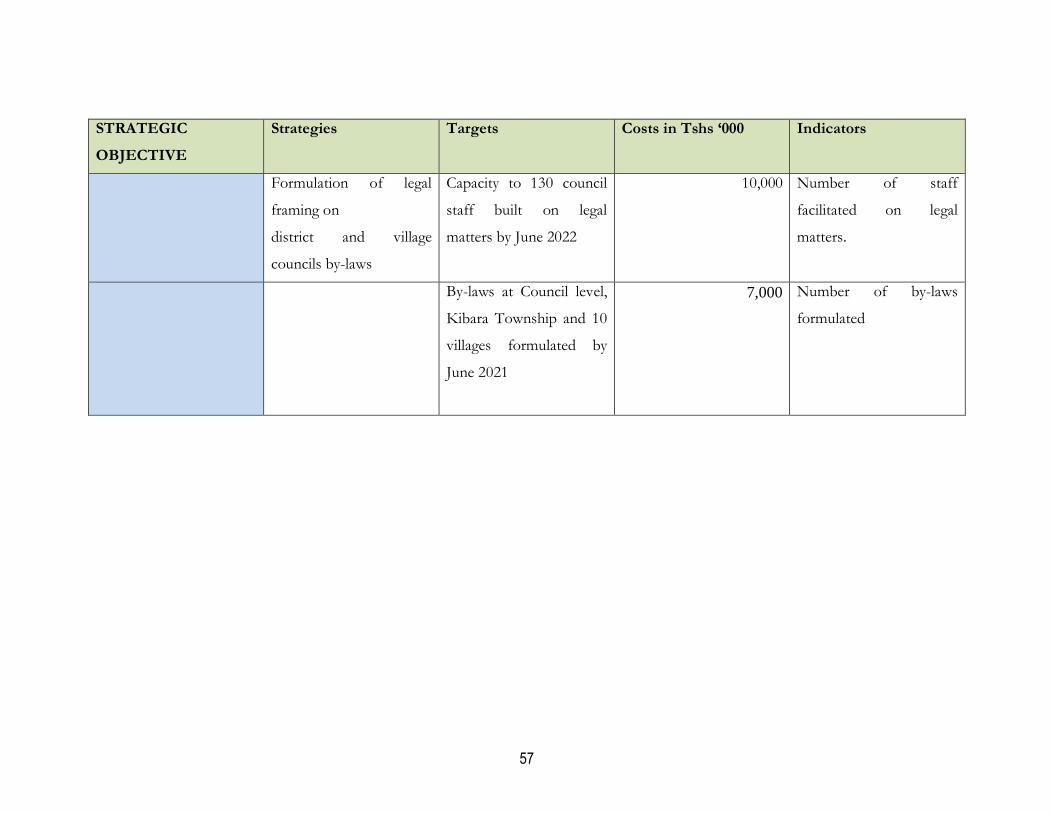
57
STRATEGIC
OBJECTIVE
Strategies Targets Costs in Tshs ‘000 Indicators
Formulation of legal
framing on
district and village
councils by-laws
Capacity to 130 council
staff built on legal
matters by June 2022
10,000 Number of staff
facilitated on legal
matters.
By-laws at Council level,
Kibara Township and 10
villages formulated by
June 2021
7,000 Number of by-laws
formulated
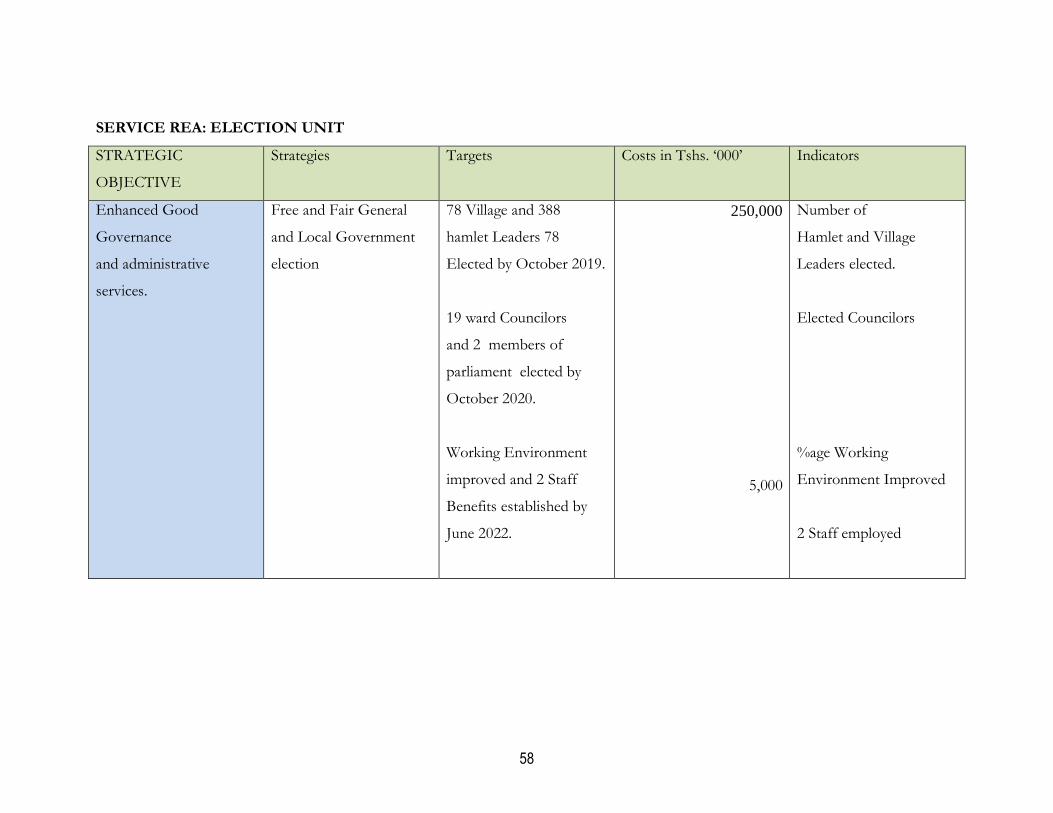
58
SERVICE REA: ELECTION UNIT
STRATEGIC
OBJECTIVE
Strategies Targets Costs in Tshs. ‘000’ Indicators
Enhanced Good
Governance
and administrative
services.
Free and Fair General
and Local Government
election
78 Village and 388
hamlet Leaders 78
Elected by October 2019.
19 ward Councilors
and 2 members of
parliament elected by
October 2020.
Working Environment
improved and 2 Staff
Benefits established by
June 2022.
250,000
5,000
Number of
Hamlet and Village
Leaders elected.
Elected Councilors
%age Working
Environment Improved
2 Staff employed
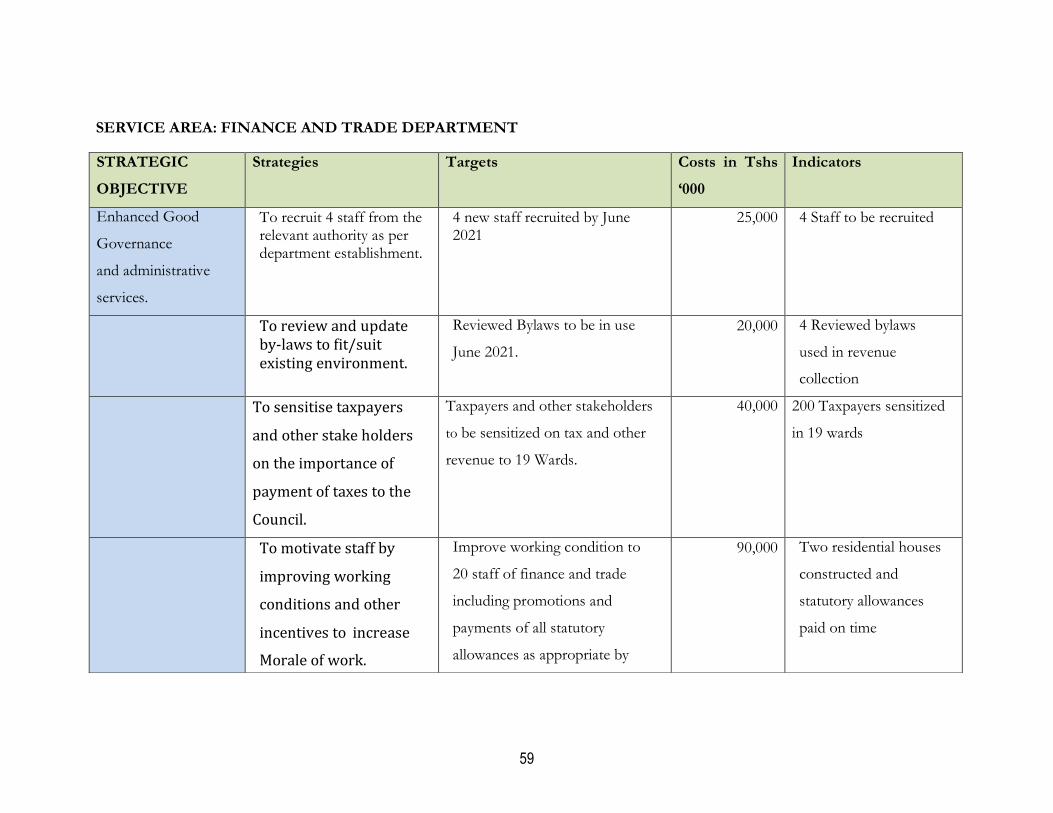
59
SERVICE AREA: FINANCE AND TRADE DEPARTMENT
STRATEGIC
OBJECTIVE
Strategies Targets Costs in Tshs
‘000
Indicators
Enhanced Good
Governance
and administrative
services.
To recruit 4 staff from the relevant authority as per department establishment.
4 new staff recruited by June 2021
25,000 4 Staff to be recruited
To review and update by-laws to fit/suit existing environment.
Reviewed Bylaws to be in use
June 2021.
20,000 4 Reviewed bylaws
used in revenue
collection
To sensitise taxpayers
and other stake holders
on the importance of
payment of taxes to the
Council.
Taxpayers and other stakeholders
to be sensitized on tax and other
revenue to 19 Wards.
40,000 200 Taxpayers sensitized
in 19 wards
To motivate staff by
improving working
conditions and other
incentives to increase
Morale of work.
Improve working condition to
20 staff of finance and trade
including promotions and
payments of all statutory
allowances as appropriate by
90,000 Two residential houses
constructed and
statutory allowances
paid on time
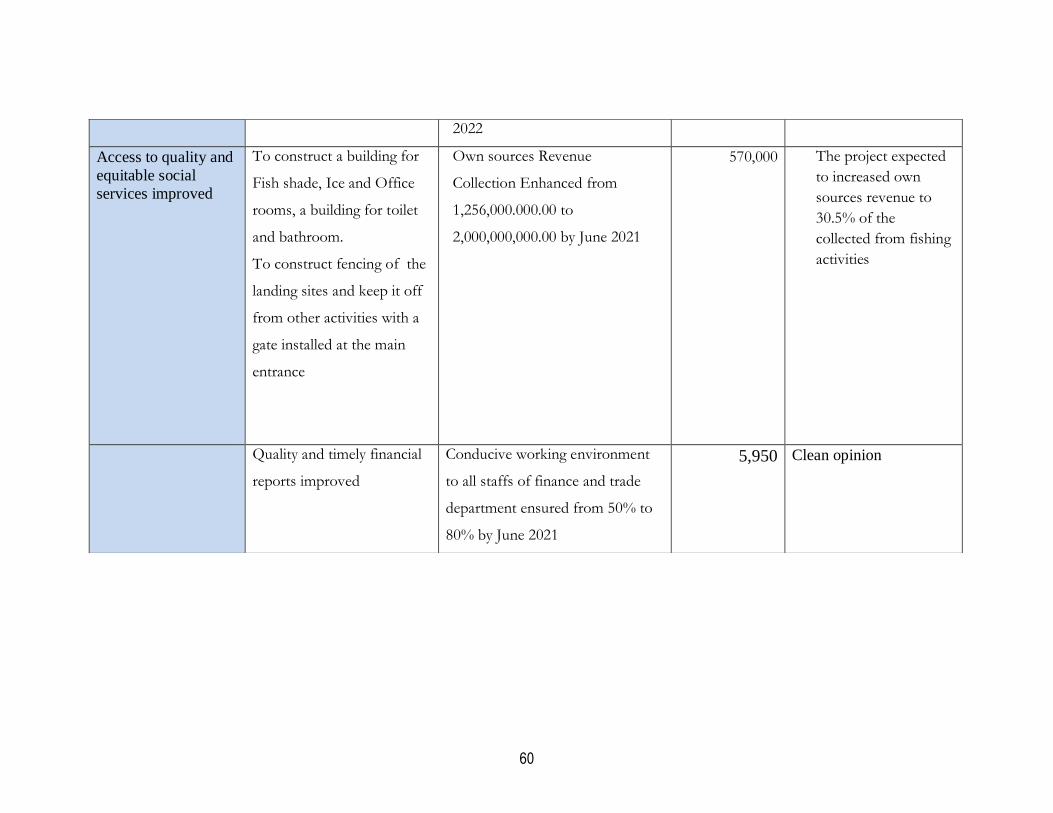
60
2022
Access to quality and
equitable social
services improved
To construct a building for
Fish shade, Ice and Office
rooms, a building for toilet
and bathroom.
To construct fencing of the
landing sites and keep it off
from other activities with a
gate installed at the main
entrance
Own sources Revenue
Collection Enhanced from
1,256,000.000.00 to
2,000,000,000.00 by June 2021
570,000 The project expected
to increased own
sources revenue to
30.5% of the
collected from fishing
activities
Quality and timely financial
reports improved
Conducive working environment
to all staffs of finance and trade
department ensured from 50% to
80% by June 2021
5,950
Clean opinion
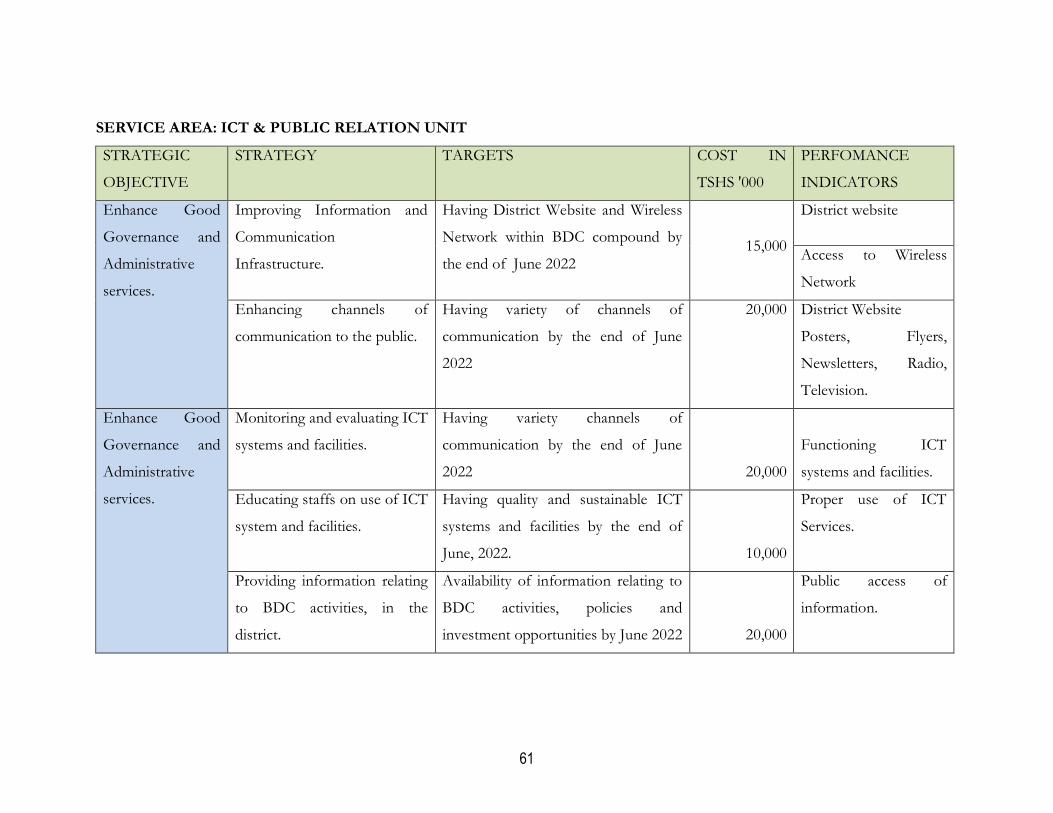
61
SERVICE AREA: ICT & PUBLIC RELATION UNIT
STRATEGIC
OBJECTIVE
STRATEGY TARGETS COST IN
TSHS '000
PERFOMANCE
INDICATORS
Enhance Good
Governance and
Administrative
services.
Improving Information and
Communication
Infrastructure.
Having District Website and Wireless
Network within BDC compound by
the end of June 2022 15,000
District website
Access to Wireless
Network
Enhancing channels of
communication to the public.
Having variety of channels of
communication by the end of June
2022
20,000 District Website
Posters, Flyers,
Newsletters, Radio,
Television.
Enhance Good
Governance and
Administrative
services.
Monitoring and evaluating ICT
systems and facilities.
Having variety channels of
communication by the end of June
2022 20,000
Functioning ICT
systems and facilities.
Educating staffs on use of ICT
system and facilities.
Having quality and sustainable ICT
systems and facilities by the end of
June, 2022. 10,000
Proper use of ICT
Services.
Providing information relating
to BDC activities, in the
district.
Availability of information relating to
BDC activities, policies and
investment opportunities by June 2022 20,000
Public access of
information.
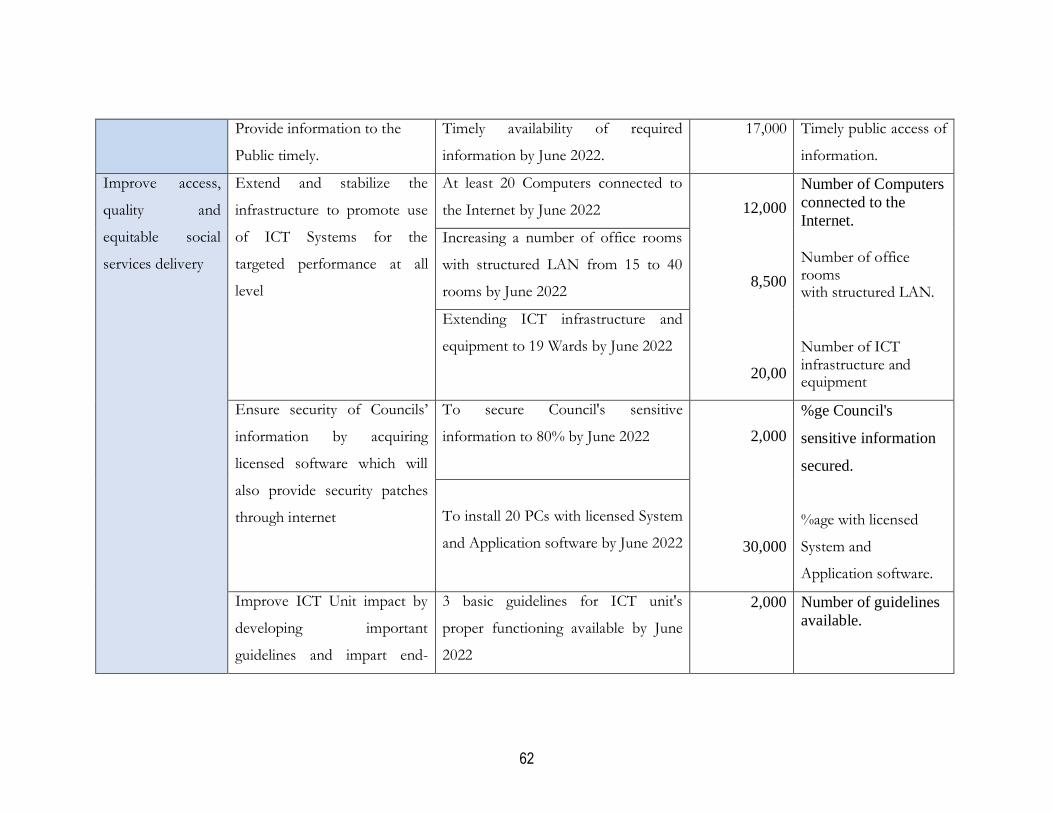
62
Provide information to the
Public timely.
Timely availability of required
information by June 2022.
17,000 Timely public access of
information.
Improve access,
quality and
equitable social
services delivery
Extend and stabilize the
infrastructure to promote use
of ICT Systems for the
targeted performance at all
level
At least 20 Computers connected to
the Internet by June 2022 12,000
8,500
20,00
Number of Computers
connected to the
Internet.
Number of office rooms with structured LAN.
Number of ICT infrastructure and equipment
Increasing a number of office rooms
with structured LAN from 15 to 40
rooms by June 2022
Extending ICT infrastructure and
equipment to 19 Wards by June 2022
Ensure security of Councils’
information by acquiring
licensed software which will
also provide security patches
through internet
To secure Council's sensitive
information to 80% by June 2022 2,000
30,000
%ge Council's
sensitive information
secured.
%age with licensed
System and
Application software.
To install 20 PCs with licensed System
and Application software by June 2022
Improve ICT Unit impact by
developing important
guidelines and impart end-
3 basic guidelines for ICT unit's
proper functioning available by June
2022
2,000 Number of guidelines
available.
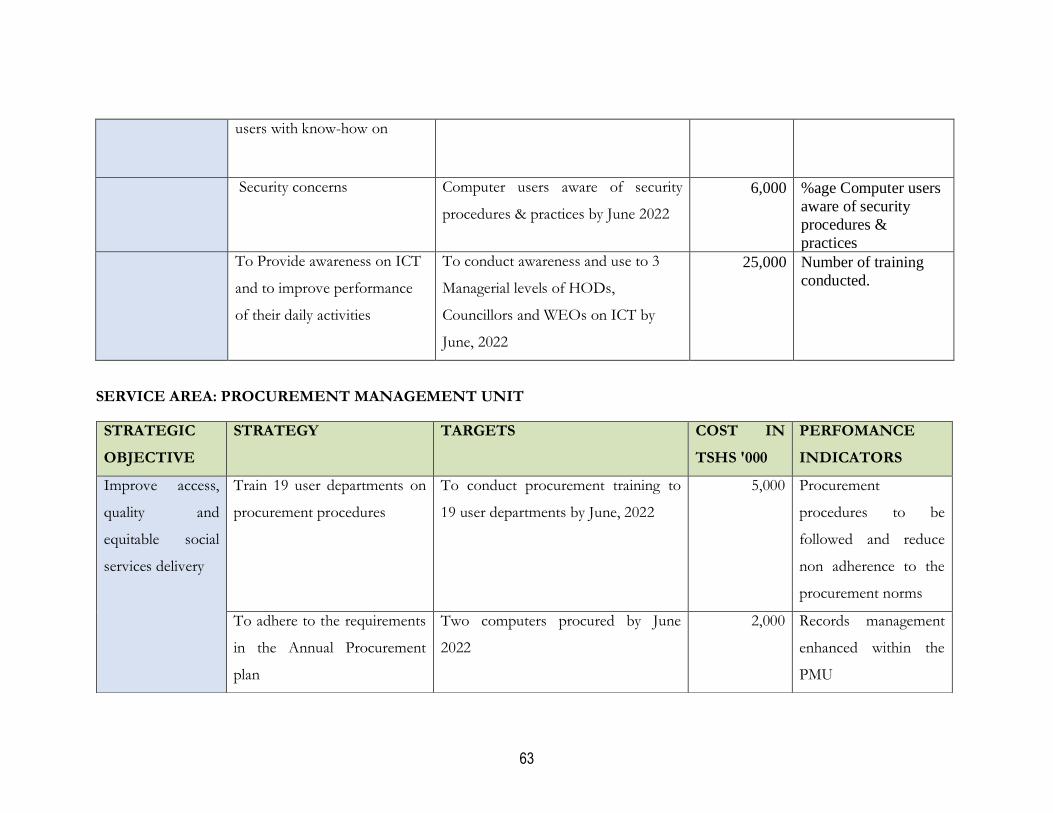
63
users with know-how on
Security concerns Computer users aware of security
procedures & practices by June 2022
6,000 %age Computer users
aware of security
procedures &
practices To Provide awareness on ICT
and to improve performance
of their daily activities
To conduct awareness and use to 3
Managerial levels of HODs,
Councillors and WEOs on ICT by
June, 2022
25,000 Number of training
conducted.
SERVICE AREA: PROCUREMENT MANAGEMENT UNIT
STRATEGIC
OBJECTIVE
STRATEGY TARGETS COST IN
TSHS '000
PERFOMANCE
INDICATORS
Improve access,
quality and
equitable social
services delivery
Train 19 user departments on
procurement procedures
To conduct procurement training to
19 user departments by June, 2022
5,000 Procurement
procedures to be
followed and reduce
non adherence to the
procurement norms
To adhere to the requirements
in the Annual Procurement
plan
Two computers procured by June
2022
2,000
Records management
enhanced within the
PMU
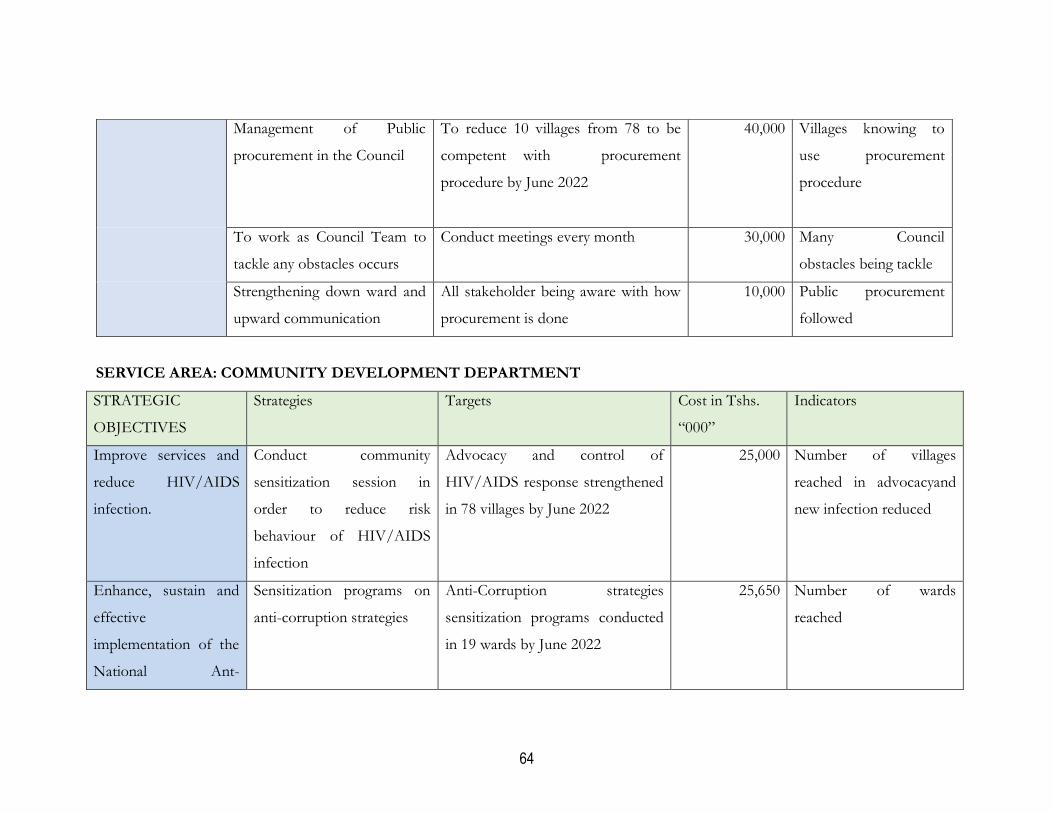
64
SERVICE AREA: COMMUNITY DEVELOPMENT DEPARTMENT
STRATEGIC
OBJECTIVES
Strategies Targets Cost in Tshs.
“000”
Indicators
Improve services and
reduce HIV/AIDS
infection.
Conduct community
sensitization session in
order to reduce risk
behaviour of HIV/AIDS
infection
Advocacy and control of
HIV/AIDS response strengthened
in 78 villages by June 2022
25,000 Number of villages
reached in advocacyand
new infection reduced
Enhance, sustain and
effective
implementation of the
National Ant-
Sensitization programs on
anti-corruption strategies
Anti-Corruption strategies
sensitization programs conducted
in 19 wards by June 2022
25,650 Number of wards
reached
Management of Public
procurement in the Council
To reduce 10 villages from 78 to be
competent with procurement
procedure by June 2022
40,000
Villages knowing to
use procurement
procedure
To work as Council Team to
tackle any obstacles occurs
Conduct meetings every month 30,000 Many Council
obstacles being tackle
Strengthening down ward and
upward communication
All stakeholder being aware with how
procurement is done
10,000 Public procurement
followed
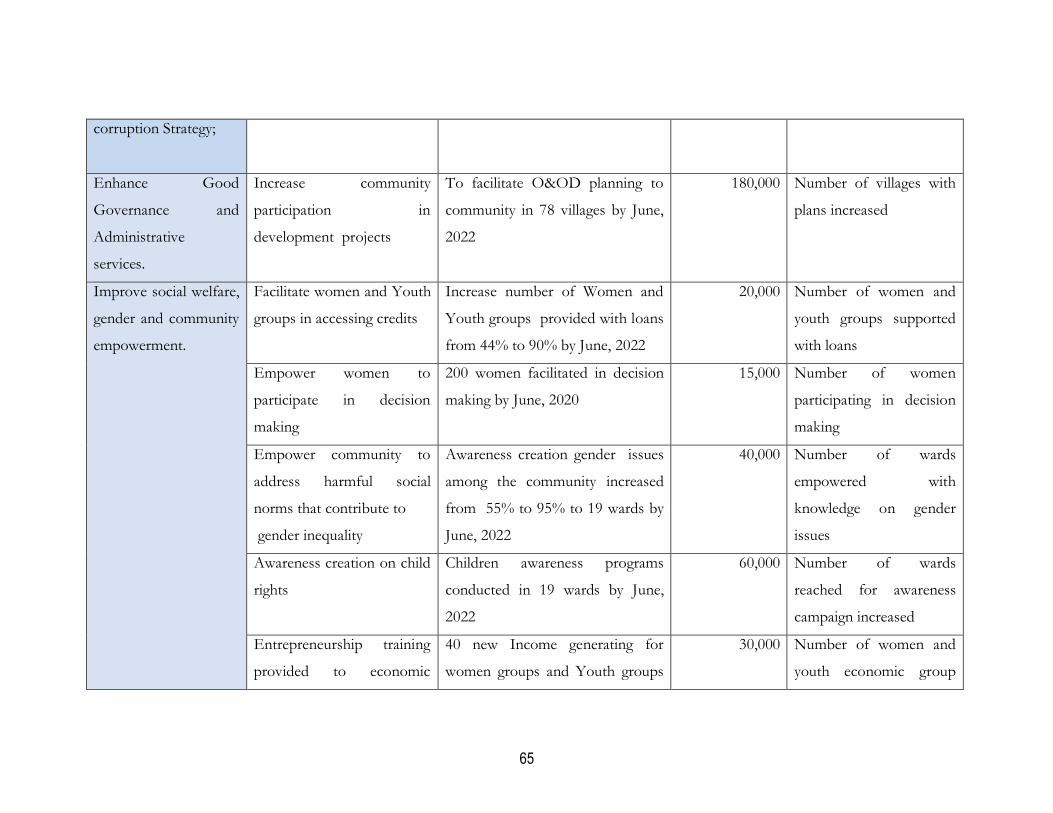
65
corruption Strategy;
Enhance Good
Governance and
Administrative
services.
Increase community
participation in
development projects
To facilitate O&OD planning to
community in 78 villages by June,
2022
180,000 Number of villages with
plans increased
Improve social welfare,
gender and community
empowerment.
Facilitate women and Youth
groups in accessing credits
Increase number of Women and
Youth groups provided with loans
from 44% to 90% by June, 2022
20,000 Number of women and
youth groups supported
with loans
Empower women to
participate in decision
making
200 women facilitated in decision
making by June, 2020
15,000 Number of women
participating in decision
making
Empower community to
address harmful social
norms that contribute to
gender inequality
Awareness creation gender issues
among the community increased
from 55% to 95% to 19 wards by
June, 2022
40,000 Number of wards
empowered with
knowledge on gender
issues
Awareness creation on child
rights
Children awareness programs
conducted in 19 wards by June,
2022
60,000 Number of wards
reached for awareness
campaign increased
Entrepreneurship training
provided to economic
40 new Income generating for
women groups and Youth groups
30,000 Number of women and
youth economic group
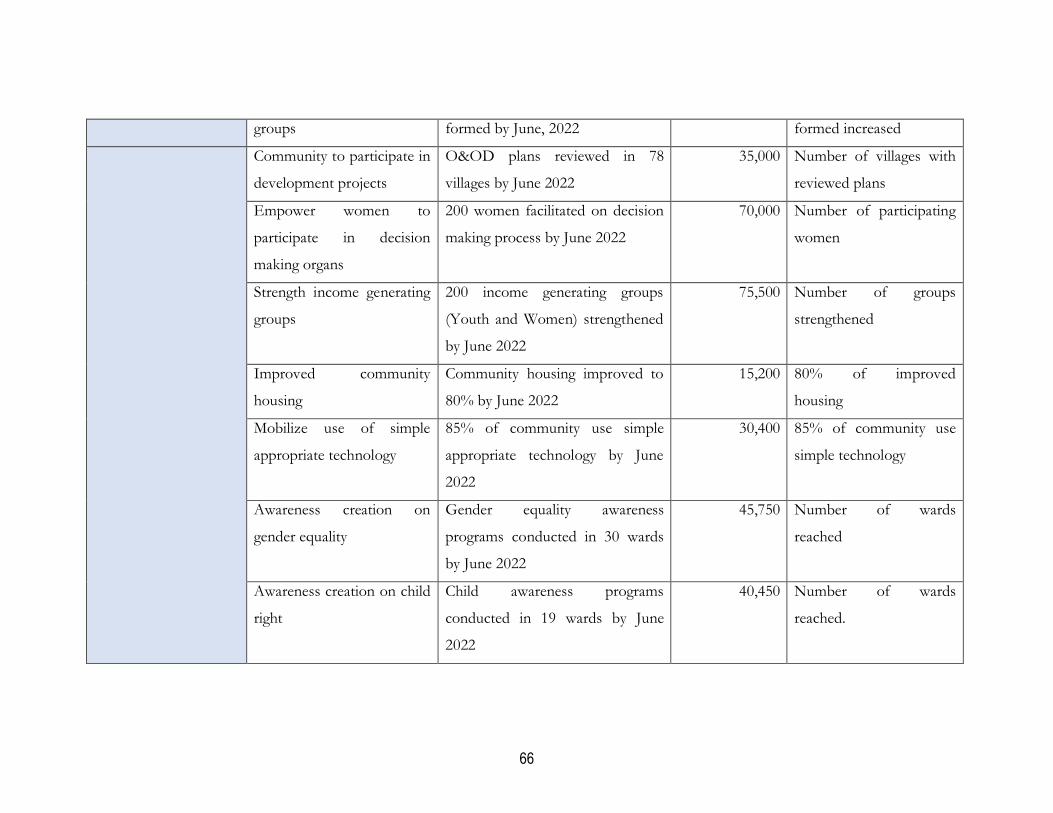
66
groups formed by June, 2022 formed increased
Community to participate in
development projects
O&OD plans reviewed in 78
villages by June 2022
35,000 Number of villages with
reviewed plans
Empower women to
participate in decision
making organs
200 women facilitated on decision
making process by June 2022
70,000 Number of participating
women
Strength income generating
groups
200 income generating groups
(Youth and Women) strengthened
by June 2022
75,500 Number of groups
strengthened
Improved community
housing
Community housing improved to
80% by June 2022
15,200 80% of improved
housing
Mobilize use of simple
appropriate technology
85% of community use simple
appropriate technology by June
2022
30,400 85% of community use
simple technology
Awareness creation on
gender equality
Gender equality awareness
programs conducted in 30 wards
by June 2022
45,750 Number of wards
reached
Awareness creation on child
right
Child awareness programs
conducted in 19 wards by June
2022
40,450 Number of wards
reached.
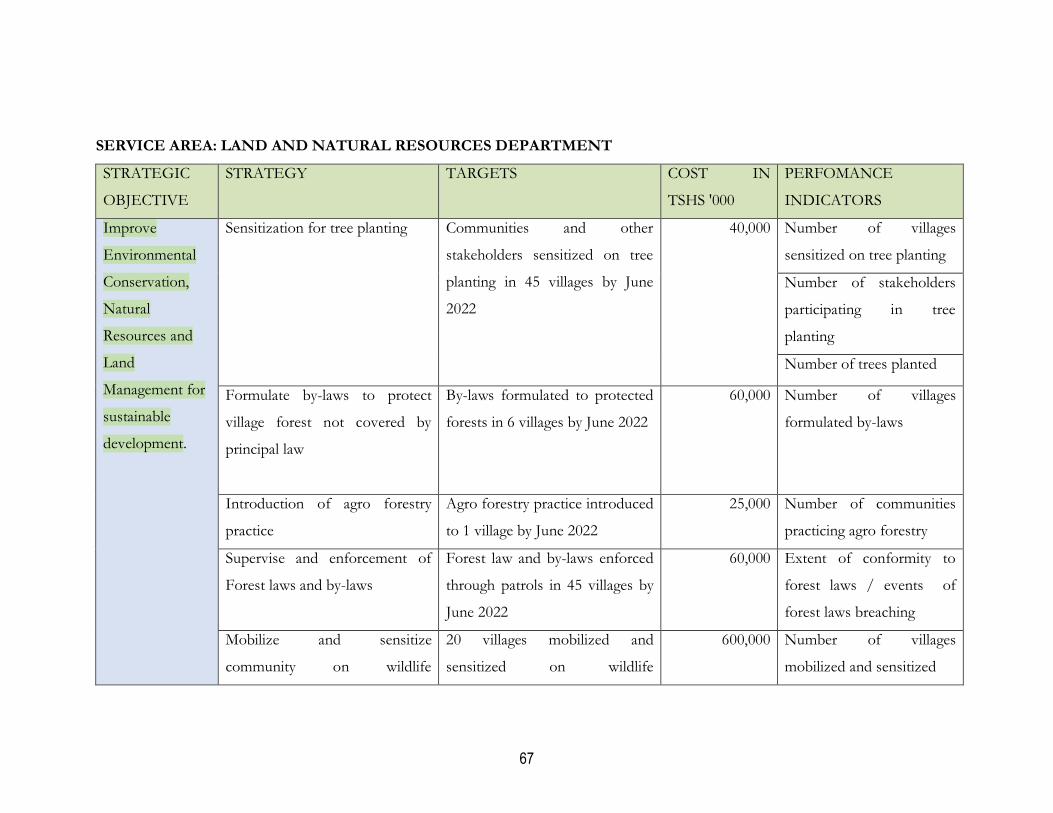
67
SERVICE AREA: LAND AND NATURAL RESOURCES DEPARTMENT
STRATEGIC
OBJECTIVE
STRATEGY TARGETS COST IN
TSHS '000
PERFOMANCE
INDICATORS
Improve
Environmental
Conservation,
Natural
Resources and
Land
Management for
sustainable
development.
Sensitization for tree planting
Communities and other
stakeholders sensitized on tree
planting in 45 villages by June
2022
40,000
Number of villages
sensitized on tree planting
Number of stakeholders
participating in tree
planting
Number of trees planted
Formulate by-laws to protect
village forest not covered by
principal law
By-laws formulated to protected
forests in 6 villages by June 2022
60,000
Number of villages
formulated by-laws
Introduction of agro forestry
practice
Agro forestry practice introduced
to 1 village by June 2022
25,000 Number of communities
practicing agro forestry
Supervise and enforcement of
Forest laws and by-laws
Forest law and by-laws enforced
through patrols in 45 villages by
June 2022
60,000 Extent of conformity to
forest laws / events of
forest laws breaching
Mobilize and sensitize
community on wildlife
20 villages mobilized and
sensitized on wildlife
600,000
Number of villages
mobilized and sensitized
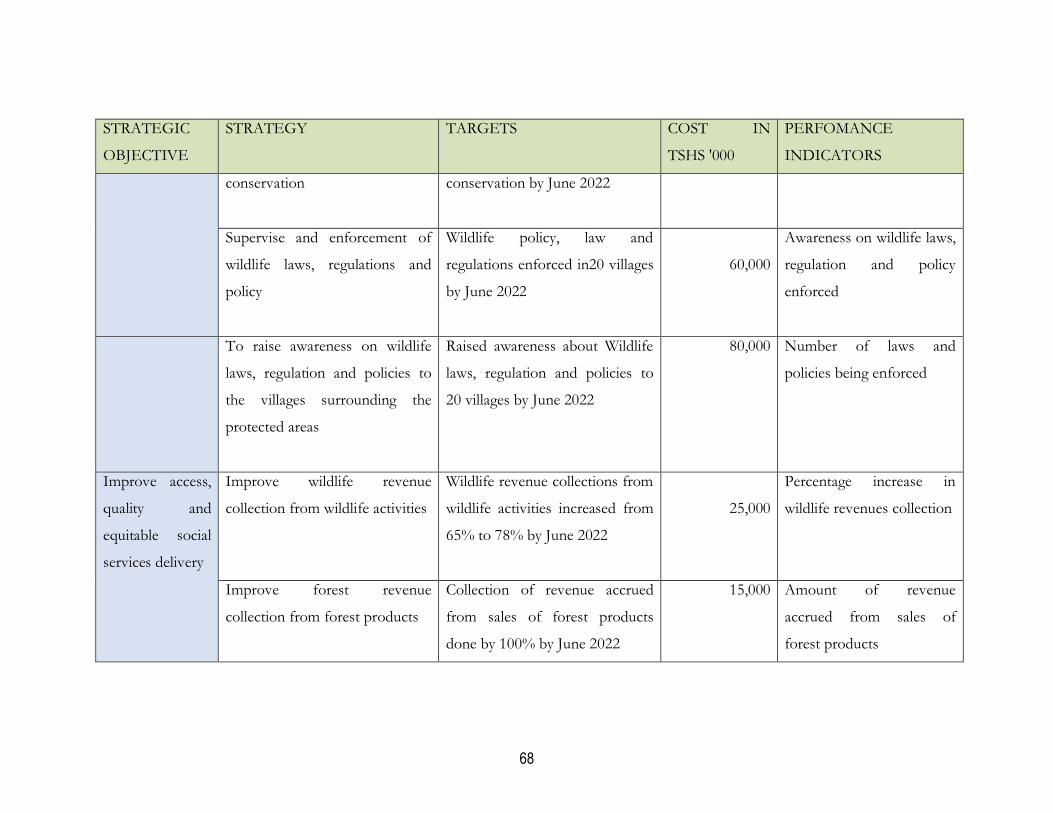
68
STRATEGIC
OBJECTIVE
STRATEGY TARGETS COST IN
TSHS '000
PERFOMANCE
INDICATORS
conservation
conservation by June 2022
Supervise and enforcement of
wildlife laws, regulations and
policy
Wildlife policy, law and
regulations enforced in20 villages
by June 2022
60,000
Awareness on wildlife laws,
regulation and policy
enforced
To raise awareness on wildlife
laws, regulation and policies to
the villages surrounding the
protected areas
Raised awareness about Wildlife
laws, regulation and policies to
20 villages by June 2022
80,000
Number of laws and
policies being enforced
Improve access,
quality and
equitable social
services delivery
Improve wildlife revenue
collection from wildlife activities
Wildlife revenue collections from
wildlife activities increased from
65% to 78% by June 2022
25,000
Percentage increase in
wildlife revenues collection
Improve forest revenue
collection from forest products
Collection of revenue accrued
from sales of forest products
done by 100% by June 2022
15,000 Amount of revenue
accrued from sales of
forest products
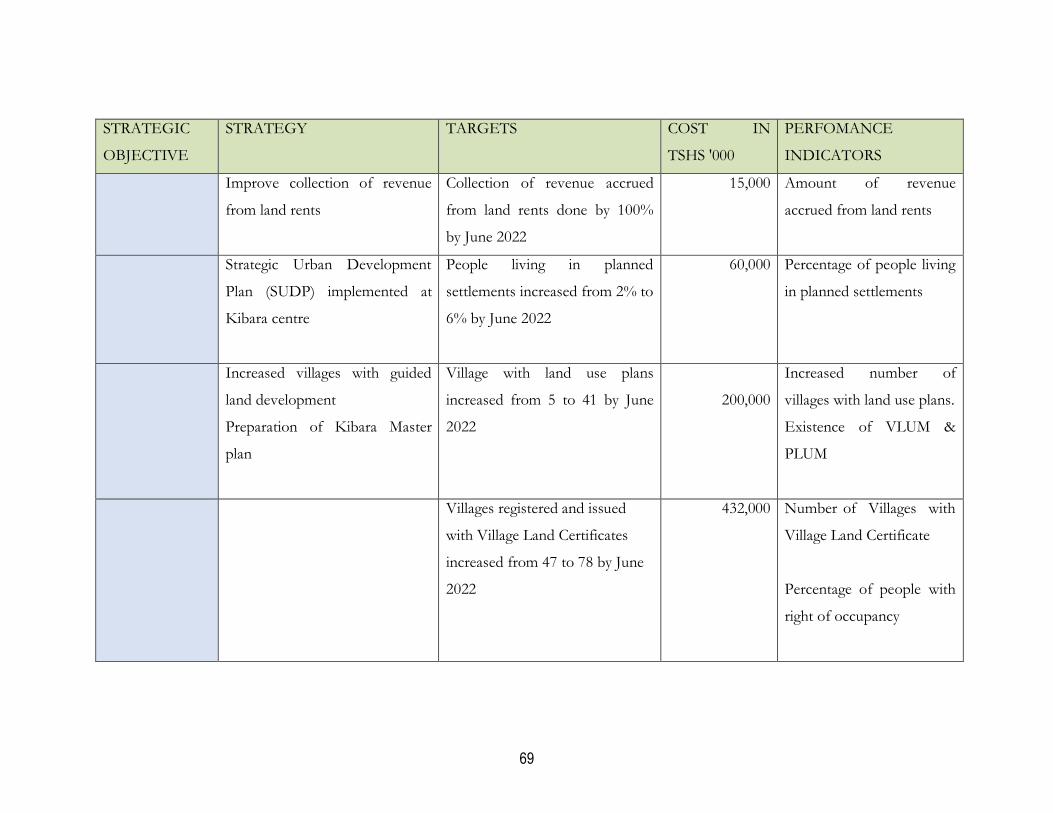
69
STRATEGIC
OBJECTIVE
STRATEGY TARGETS COST IN
TSHS '000
PERFOMANCE
INDICATORS
Improve collection of revenue
from land rents
Collection of revenue accrued
from land rents done by 100%
by June 2022
15,000 Amount of revenue
accrued from land rents
Strategic Urban Development
Plan (SUDP) implemented at
Kibara centre
People living in planned
settlements increased from 2% to
6% by June 2022
60,000
Percentage of people living
in planned settlements
Increased villages with guided
land development
Preparation of Kibara Master
plan
Village with land use plans
increased from 5 to 41 by June
2022
200,000
Increased number of
villages with land use plans.
Existence of VLUM &
PLUM
Villages registered and issued
with Village Land Certificates
increased from 47 to 78 by June
2022
432,000
Number of Villages with
Village Land Certificate
Percentage of people with
right of occupancy
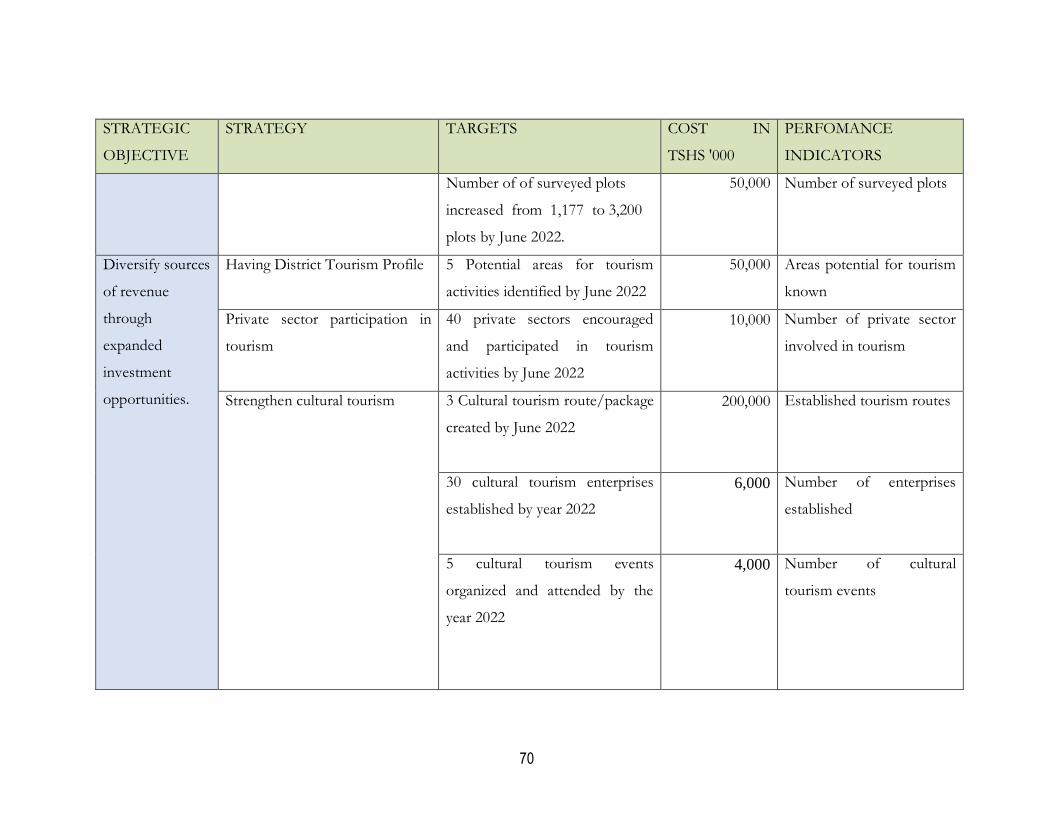
70
STRATEGIC
OBJECTIVE
STRATEGY TARGETS COST IN
TSHS '000
PERFOMANCE
INDICATORS
Number of of surveyed plots
increased from 1,177 to 3,200
plots by June 2022.
50,000
Number of surveyed plots
Diversify sources
of revenue
through
expanded
investment
opportunities.
Having District Tourism Profile
5 Potential areas for tourism
activities identified by June 2022
50,000 Areas potential for tourism
known
Private sector participation in
tourism
40 private sectors encouraged
and participated in tourism
activities by June 2022
10,000 Number of private sector
involved in tourism
Strengthen cultural tourism
3 Cultural tourism route/package
created by June 2022
200,000 Established tourism routes
30 cultural tourism enterprises
established by year 2022
6,000 Number of enterprises
established
5 cultural tourism events
organized and attended by the
year 2022
4,000 Number of cultural
tourism events
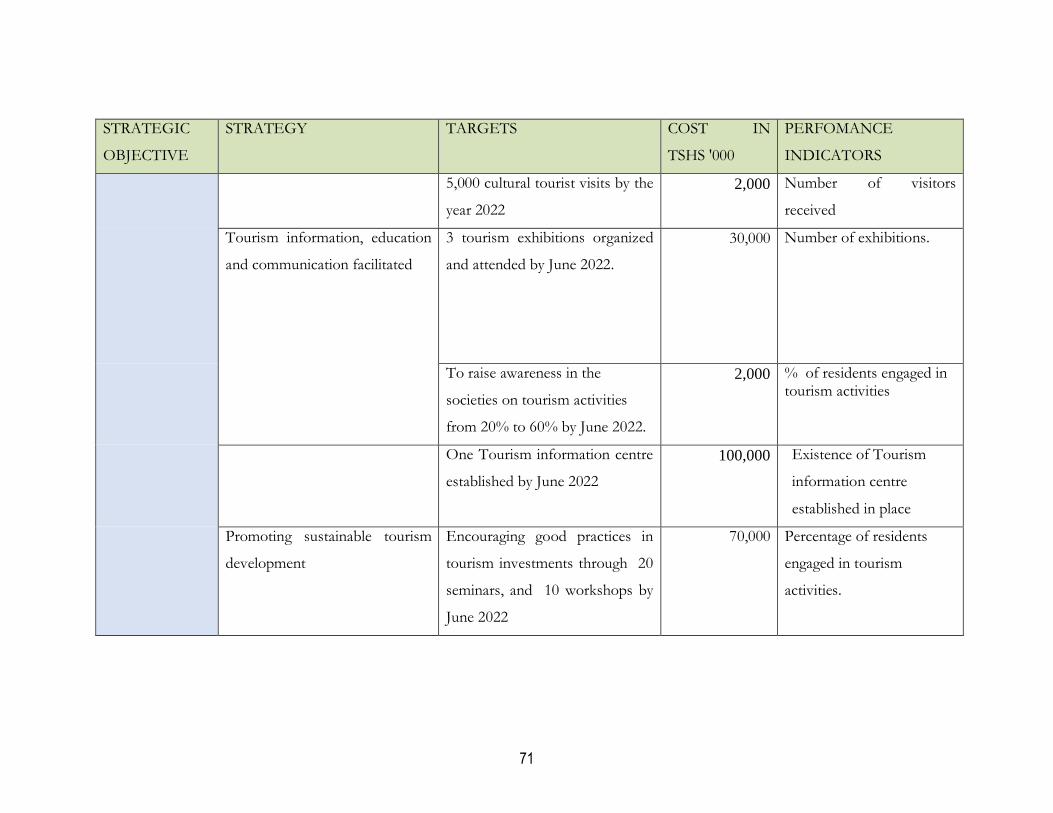
71
STRATEGIC
OBJECTIVE
STRATEGY TARGETS COST IN
TSHS '000
PERFOMANCE
INDICATORS
5,000 cultural tourist visits by the
year 2022
2,000 Number of visitors
received
Tourism information, education
and communication facilitated
3 tourism exhibitions organized
and attended by June 2022.
30,000
Number of exhibitions.
To raise awareness in the
societies on tourism activities
from 20% to 60% by June 2022.
2,000 % of residents engaged in tourism activities
One Tourism information centre
established by June 2022
100,000 Existence of Tourism
information centre
established in place
Promoting sustainable tourism
development
Encouraging good practices in
tourism investments through 20
seminars, and 10 workshops by
June 2022
70,000 Percentage of residents
engaged in tourism
activities.
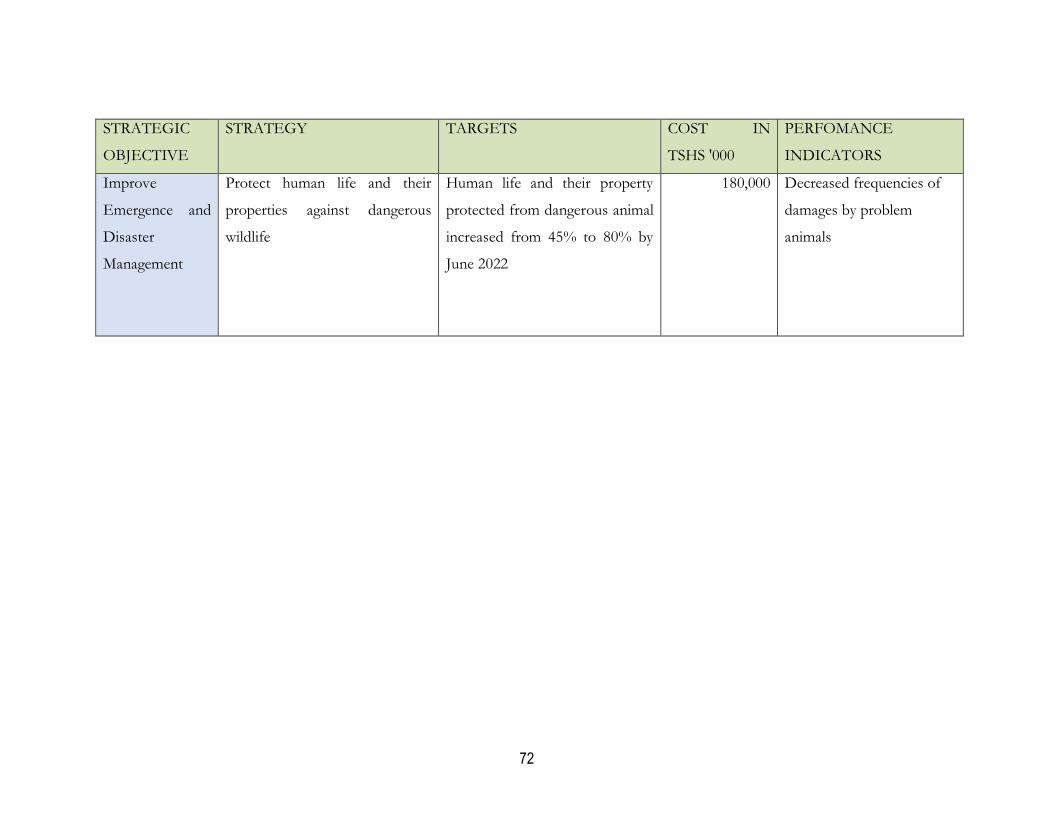
72
STRATEGIC
OBJECTIVE
STRATEGY TARGETS COST IN
TSHS '000
PERFOMANCE
INDICATORS
Improve
Emergence and
Disaster
Management
Protect human life and their
properties against dangerous
wildlife
Human life and their property
protected from dangerous animal
increased from 45% to 80% by
June 2022
180,000 Decreased frequencies of
damages by problem
animals
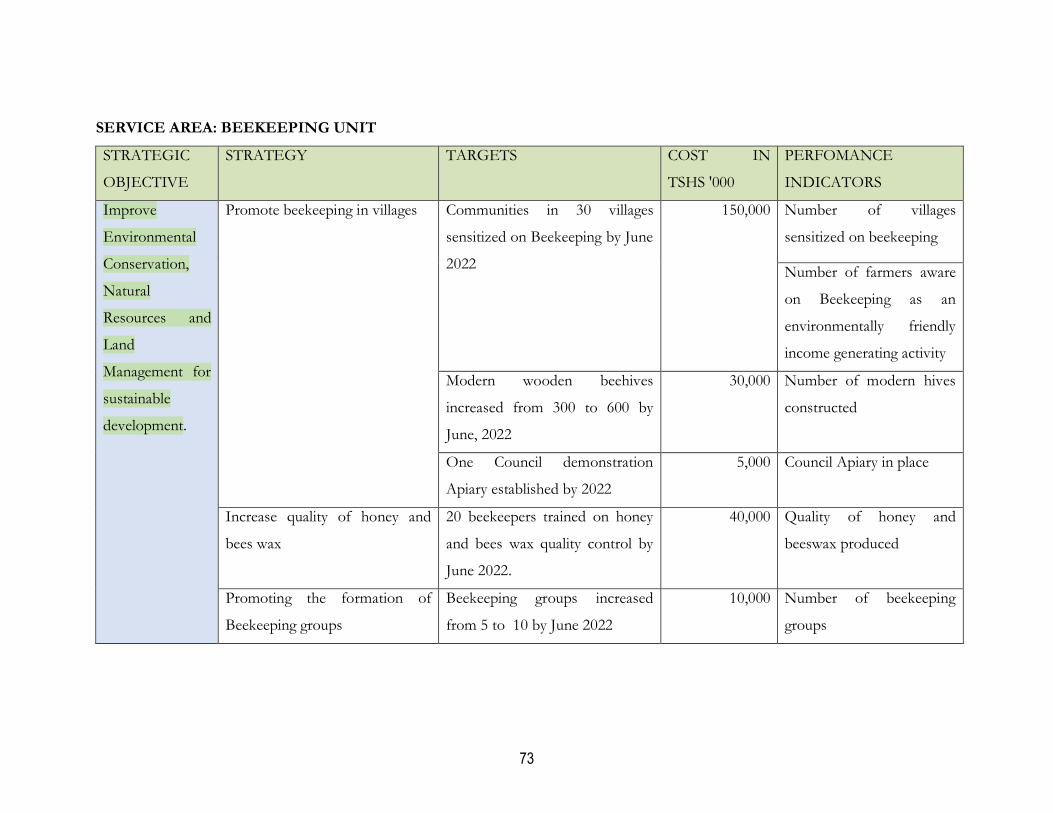
73
SERVICE AREA: BEEKEEPING UNIT
STRATEGIC
OBJECTIVE
STRATEGY TARGETS COST IN
TSHS '000
PERFOMANCE
INDICATORS
Improve
Environmental
Conservation,
Natural
Resources and
Land
Management for
sustainable
development.
Promote beekeeping in villages
Communities in 30 villages
sensitized on Beekeeping by June
2022
150,000
Number of villages
sensitized on beekeeping
Number of farmers aware
on Beekeeping as an
environmentally friendly
income generating activity
Modern wooden beehives
increased from 300 to 600 by
June, 2022
30,000 Number of modern hives
constructed
One Council demonstration
Apiary established by 2022
5,000 Council Apiary in place
Increase quality of honey and
bees wax
20 beekeepers trained on honey
and bees wax quality control by
June 2022.
40,000 Quality of honey and
beeswax produced
Promoting the formation of
Beekeeping groups
Beekeeping groups increased
from 5 to 10 by June 2022
10,000
Number of beekeeping
groups
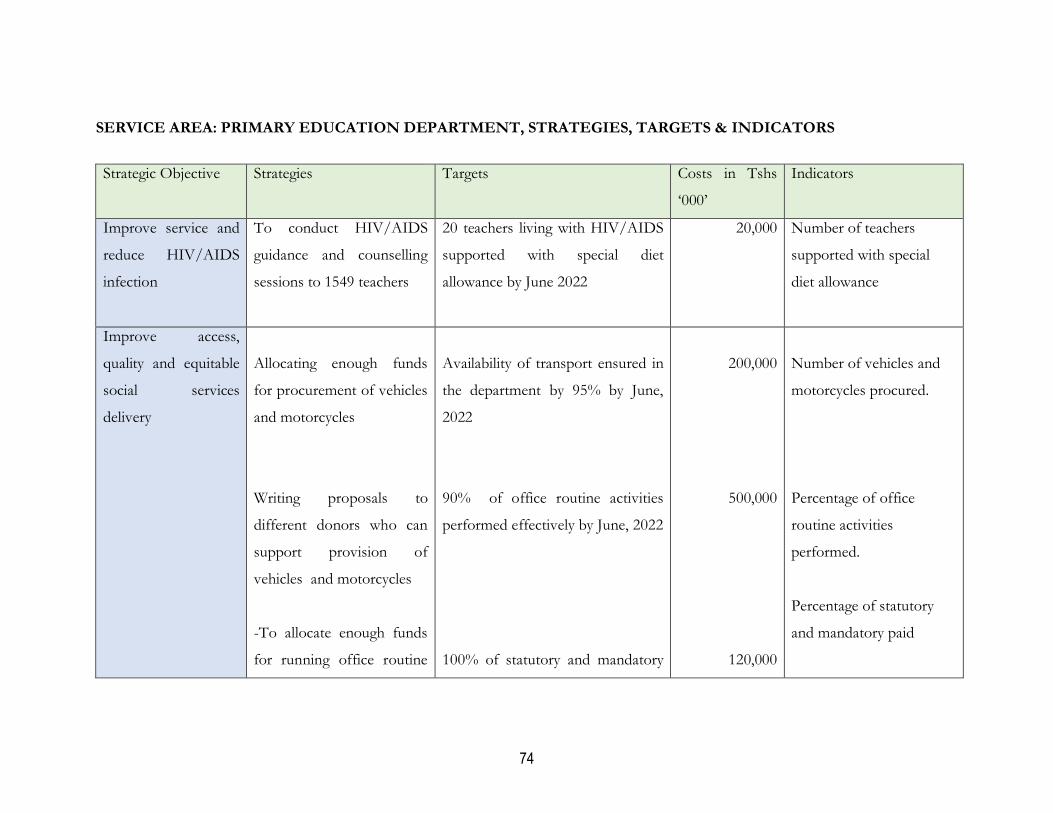
74
SERVICE AREA: PRIMARY EDUCATION DEPARTMENT, STRATEGIES, TARGETS & INDICATORS
Strategic Objective Strategies Targets Costs in Tshs
‘000’
Indicators
Improve service and
reduce HIV/AIDS
infection
To conduct HIV/AIDS
guidance and counselling
sessions to 1549 teachers
20 teachers living with HIV/AIDS
supported with special diet
allowance by June 2022
20,000
Number of teachers
supported with special
diet allowance
Improve access,
quality and equitable
social services
delivery
Allocating enough funds
for procurement of vehicles
and motorcycles
Writing proposals to
different donors who can
support provision of
vehicles and motorcycles
-To allocate enough funds
for running office routine
Availability of transport ensured in
the department by 95% by June,
2022
90% of office routine activities
performed effectively by June, 2022
100% of statutory and mandatory
200,000
500,000
120,000
Number of vehicles and
motorcycles procured.
Percentage of office
routine activities
performed.
Percentage of statutory
and mandatory paid
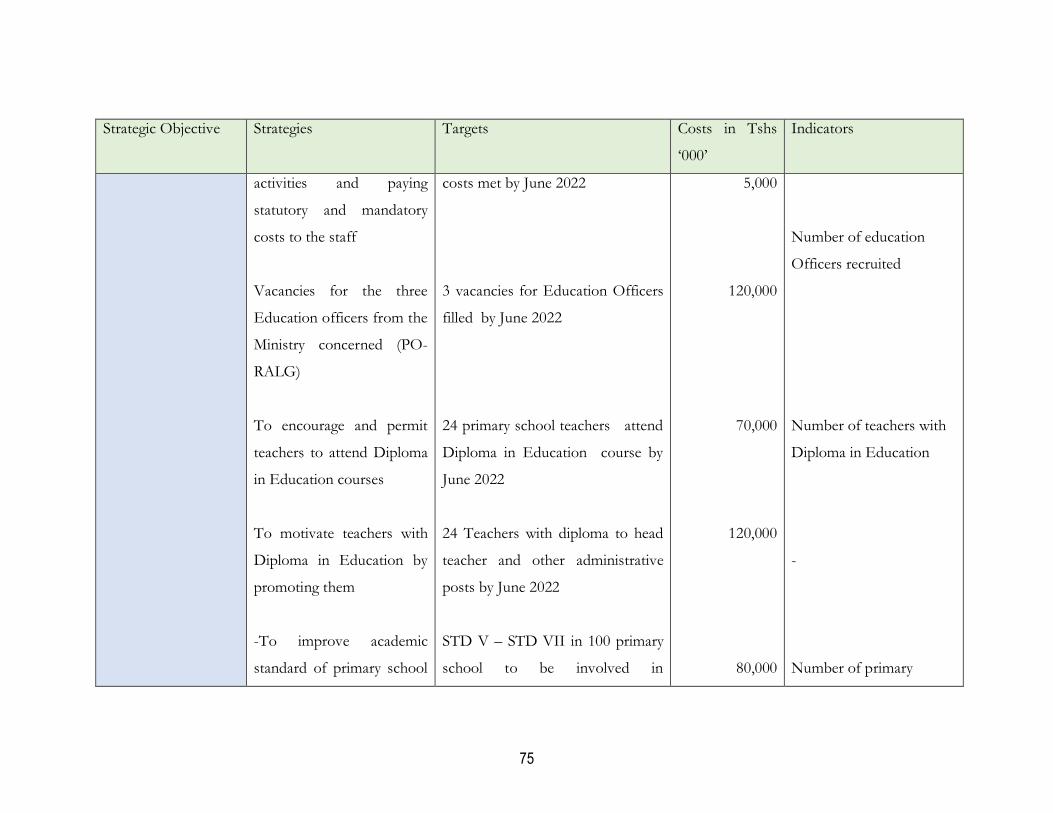
75
Strategic Objective Strategies Targets Costs in Tshs
‘000’
Indicators
activities and paying
statutory and mandatory
costs to the staff
Vacancies for the three
Education officers from the
Ministry concerned (PO-
RALG)
To encourage and permit
teachers to attend Diploma
in Education courses
To motivate teachers with
Diploma in Education by
promoting them
-To improve academic
standard of primary school
costs met by June 2022
3 vacancies for Education Officers
filled by June 2022
24 primary school teachers attend
Diploma in Education course by
June 2022
24 Teachers with diploma to head
teacher and other administrative
posts by June 2022
STD V – STD VII in 100 primary
school to be involved in
5,000
120,000
70,000
120,000
80,000
Number of education
Officers recruited
Number of teachers with
Diploma in Education
-
Number of primary
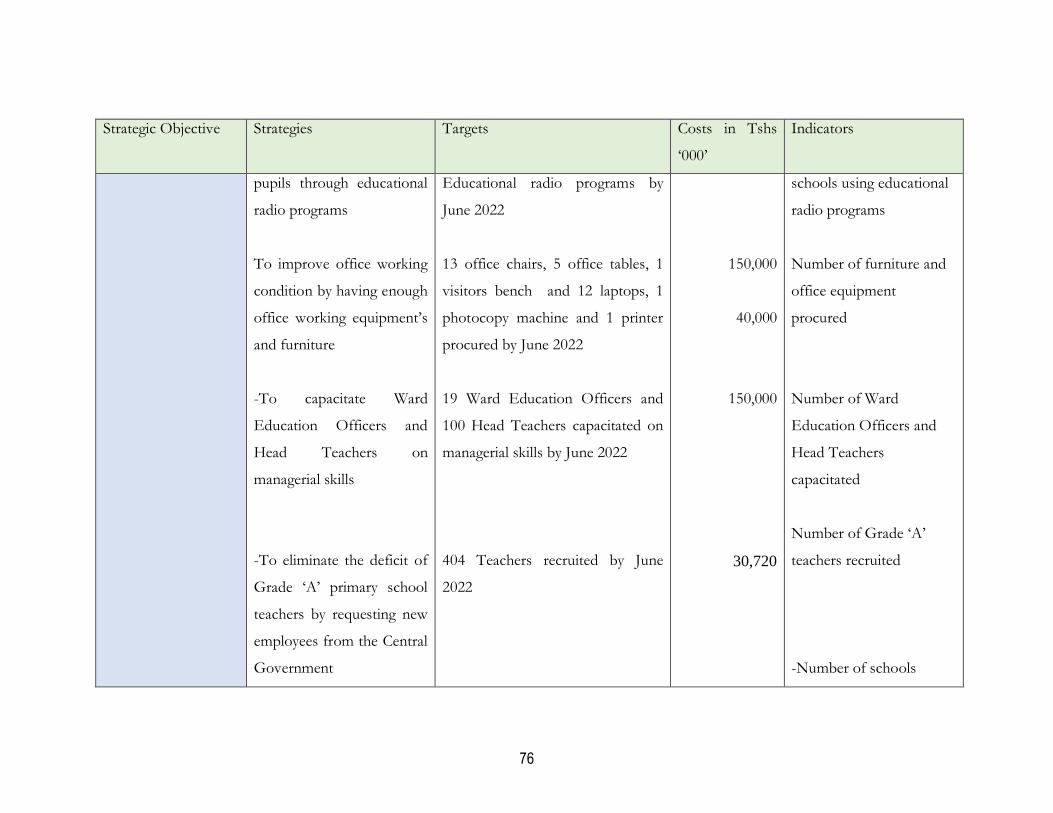
76
Strategic Objective Strategies Targets Costs in Tshs
‘000’
Indicators
pupils through educational
radio programs
To improve office working
condition by having enough
office working equipment’s
and furniture
-To capacitate Ward
Education Officers and
Head Teachers on
managerial skills
-To eliminate the deficit of
Grade ‘A’ primary school
teachers by requesting new
employees from the Central
Government
Educational radio programs by
June 2022
13 office chairs, 5 office tables, 1
visitors bench and 12 laptops, 1
photocopy machine and 1 printer
procured by June 2022
19 Ward Education Officers and
100 Head Teachers capacitated on
managerial skills by June 2022
404 Teachers recruited by June
2022
150,000
40,000
150,000
30,720
schools using educational
radio programs
Number of furniture and
office equipment
procured
Number of Ward
Education Officers and
Head Teachers
capacitated
Number of Grade ‘A’
teachers recruited
-Number of schools
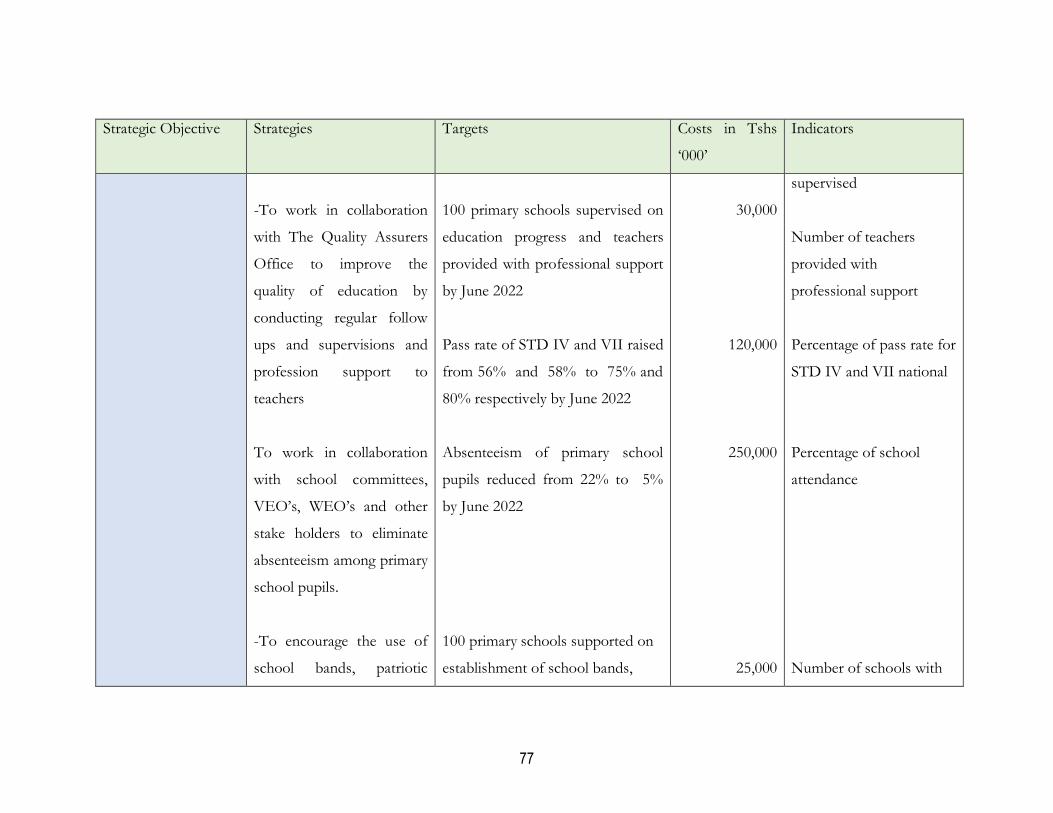
77
Strategic Objective Strategies Targets Costs in Tshs
‘000’
Indicators
-To work in collaboration
with The Quality Assurers
Office to improve the
quality of education by
conducting regular follow
ups and supervisions and
profession support to
teachers
To work in collaboration
with school committees,
VEO’s, WEO’s and other
stake holders to eliminate
absenteeism among primary
school pupils.
-To encourage the use of
school bands, patriotic
100 primary schools supervised on
education progress and teachers
provided with professional support
by June 2022
Pass rate of STD IV and VII raised
from 56% and 58% to 75% and
80% respectively by June 2022
Absenteeism of primary school
pupils reduced from 22% to 5%
by June 2022
100 primary schools supported on
establishment of school bands,
30,000
120,000
250,000
25,000
supervised
Number of teachers
provided with
professional support
Percentage of pass rate for
STD IV and VII national
Percentage of school
attendance
Number of schools with
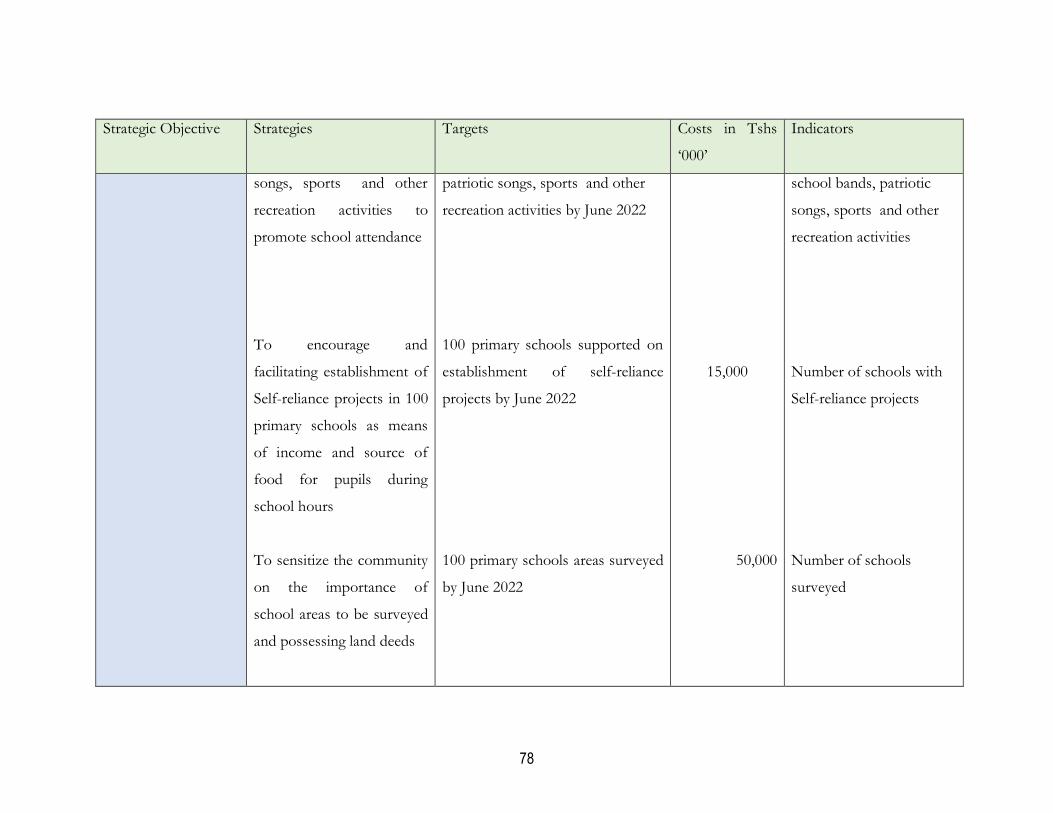
78
Strategic Objective Strategies Targets Costs in Tshs
‘000’
Indicators
songs, sports and other
recreation activities to
promote school attendance
To encourage and
facilitating establishment of
Self-reliance projects in 100
primary schools as means
of income and source of
food for pupils during
school hours
To sensitize the community
on the importance of
school areas to be surveyed
and possessing land deeds
patriotic songs, sports and other
recreation activities by June 2022
100 primary schools supported on
establishment of self-reliance
projects by June 2022
100 primary schools areas surveyed
by June 2022
15,000
50,000
school bands, patriotic
songs, sports and other
recreation activities
Number of schools with
Self-reliance projects
Number of schools
surveyed
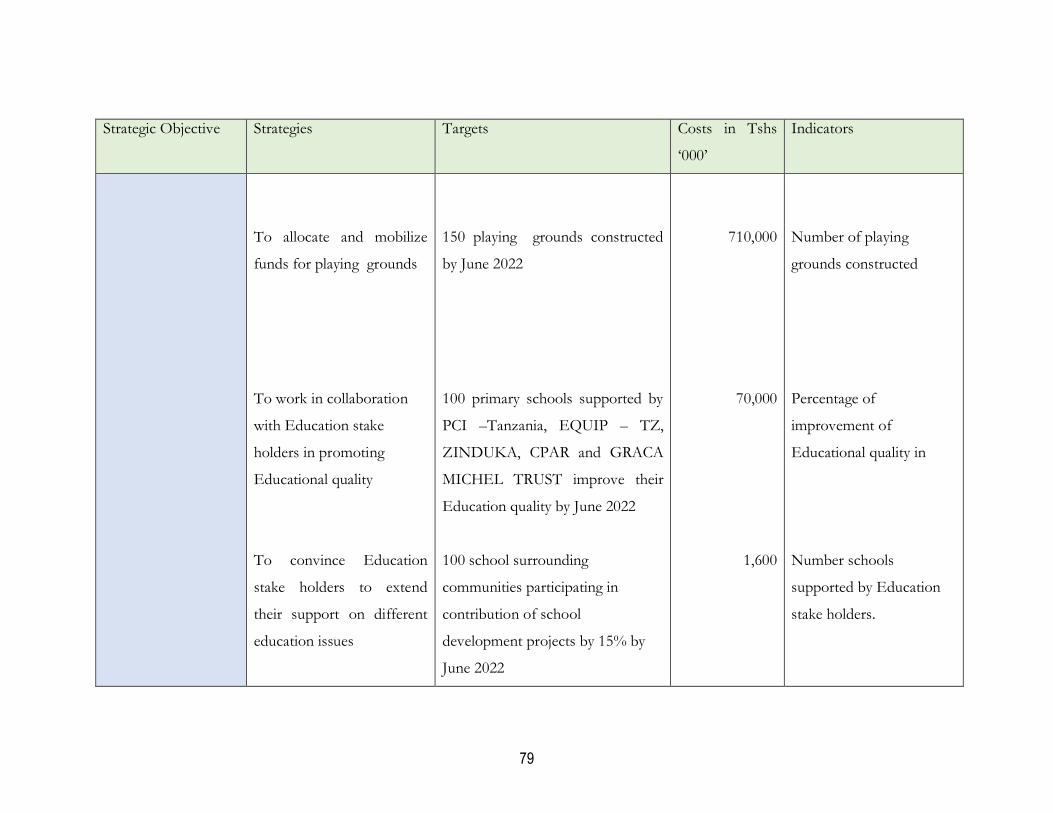
79
Strategic Objective Strategies Targets Costs in Tshs
‘000’
Indicators
To allocate and mobilize
funds for playing grounds
To work in collaboration
with Education stake
holders in promoting
Educational quality
To convince Education
stake holders to extend
their support on different
education issues
150 playing grounds constructed
by June 2022
100 primary schools supported by
PCI –Tanzania, EQUIP – TZ,
ZINDUKA, CPAR and GRACA
MICHEL TRUST improve their
Education quality by June 2022
100 school surrounding
communities participating in
contribution of school
development projects by 15% by
June 2022
710,000
70,000
1,600
Number of playing
grounds constructed
Percentage of
improvement of
Educational quality in
Number schools
supported by Education
stake holders.
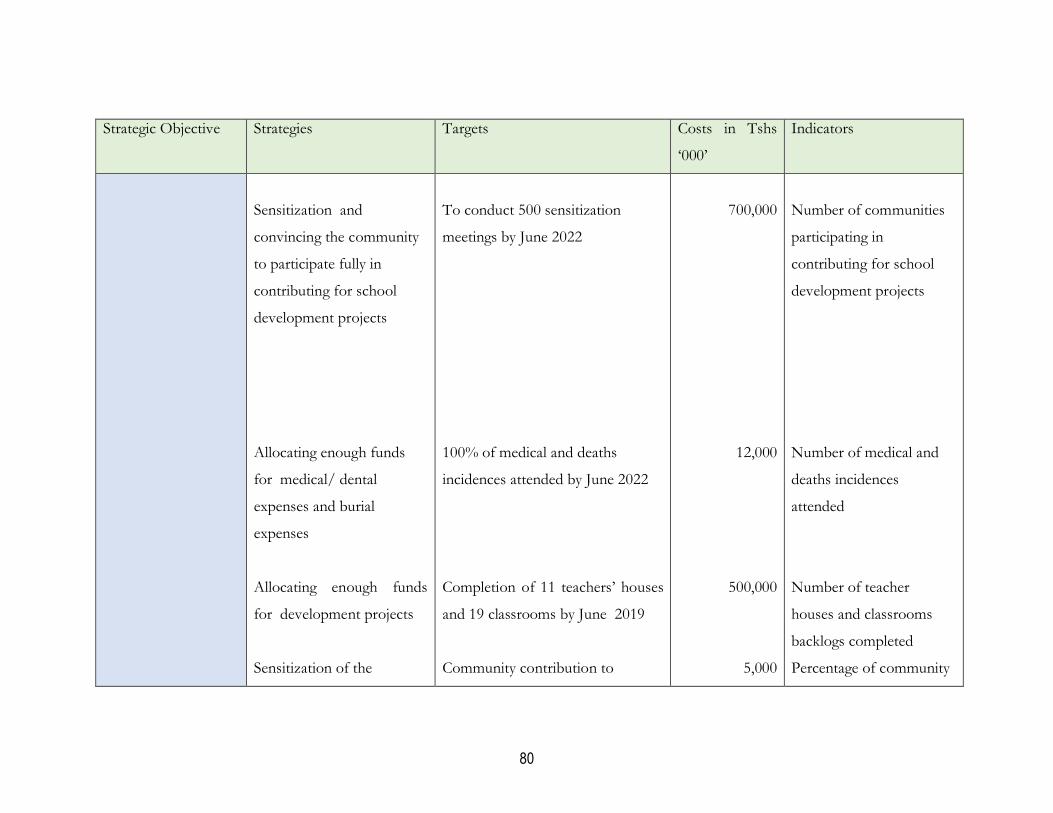
80
Strategic Objective Strategies Targets Costs in Tshs
‘000’
Indicators
Sensitization and
convincing the community
to participate fully in
contributing for school
development projects
Allocating enough funds
for medical/ dental
expenses and burial
expenses
Allocating enough funds
for development projects
Sensitization of the
To conduct 500 sensitization
meetings by June 2022
100% of medical and deaths
incidences attended by June 2022
Completion of 11 teachers’ houses
and 19 classrooms by June 2019
Community contribution to
700,000
12,000
500,000
5,000
Number of communities
participating in
contributing for school
development projects
Number of medical and
deaths incidences
attended
Number of teacher
houses and classrooms
backlogs completed
Percentage of community
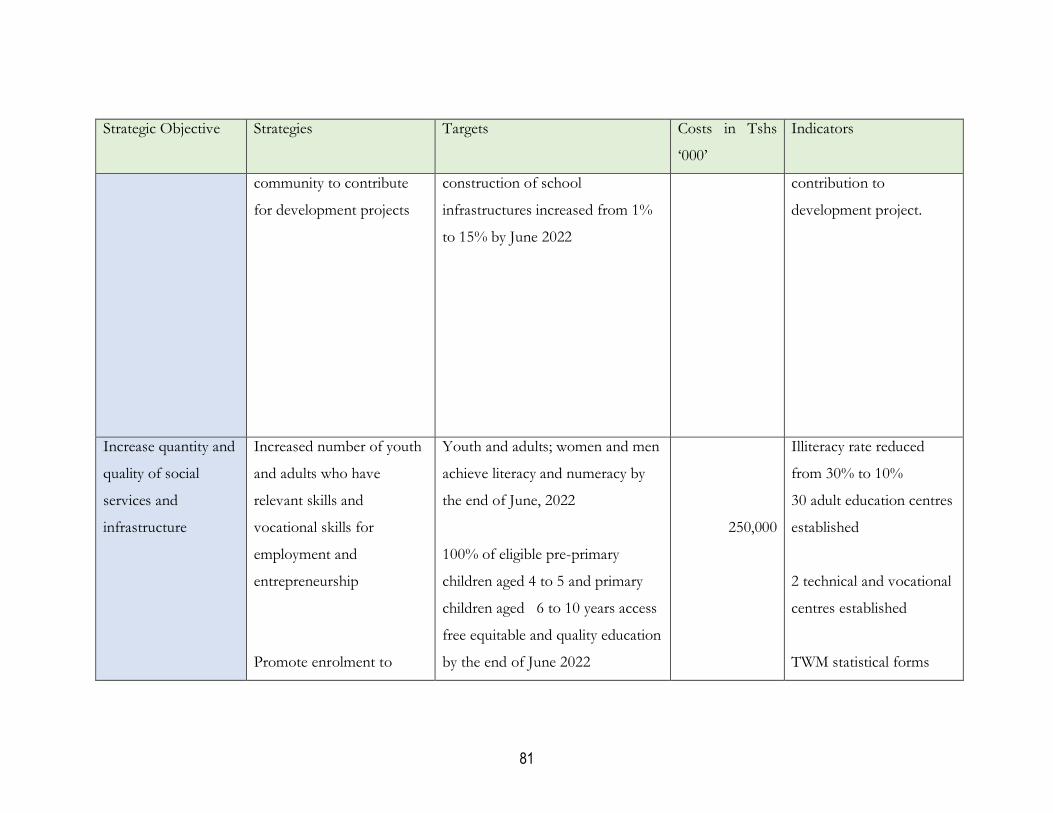
81
Strategic Objective Strategies Targets Costs in Tshs
‘000’
Indicators
community to contribute
for development projects
construction of school
infrastructures increased from 1%
to 15% by June 2022
contribution to
development project.
Increase quantity and
quality of social
services and
infrastructure
Increased number of youth
and adults who have
relevant skills and
vocational skills for
employment and
entrepreneurship
Promote enrolment to
Youth and adults; women and men
achieve literacy and numeracy by
the end of June, 2022
100% of eligible pre-primary
children aged 4 to 5 and primary
children aged 6 to 10 years access
free equitable and quality education
by the end of June 2022
250,000
Illiteracy rate reduced
from 30% to 10%
30 adult education centres
established
2 technical and vocational
centres established
TWM statistical forms
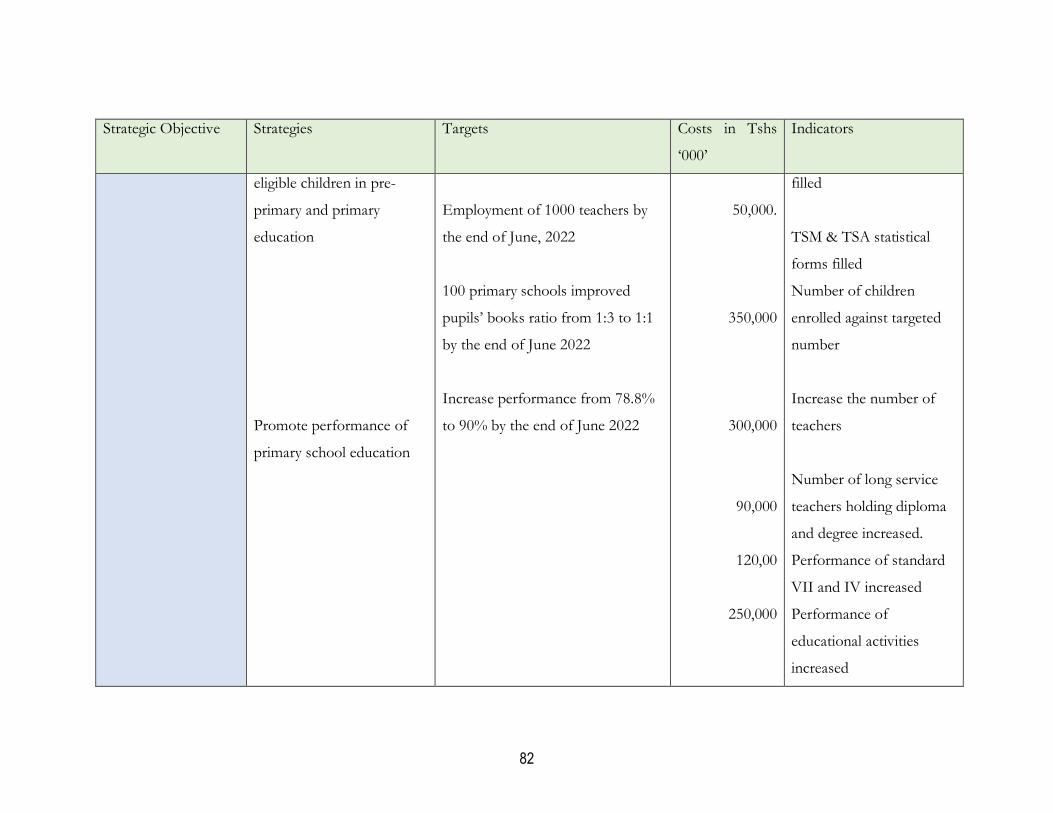
82
Strategic Objective Strategies Targets Costs in Tshs
‘000’
Indicators
eligible children in pre-
primary and primary
education
Promote performance of
primary school education
Employment of 1000 teachers by
the end of June, 2022
100 primary schools improved
pupils’ books ratio from 1:3 to 1:1
by the end of June 2022
Increase performance from 78.8%
to 90% by the end of June 2022
50,000.
350,000
300,000
90,000
120,00
250,000
filled
TSM & TSA statistical
forms filled
Number of children
enrolled against targeted
number
Increase the number of
teachers
Number of long service
teachers holding diploma
and degree increased.
Performance of standard
VII and IV increased
Performance of
educational activities
increased
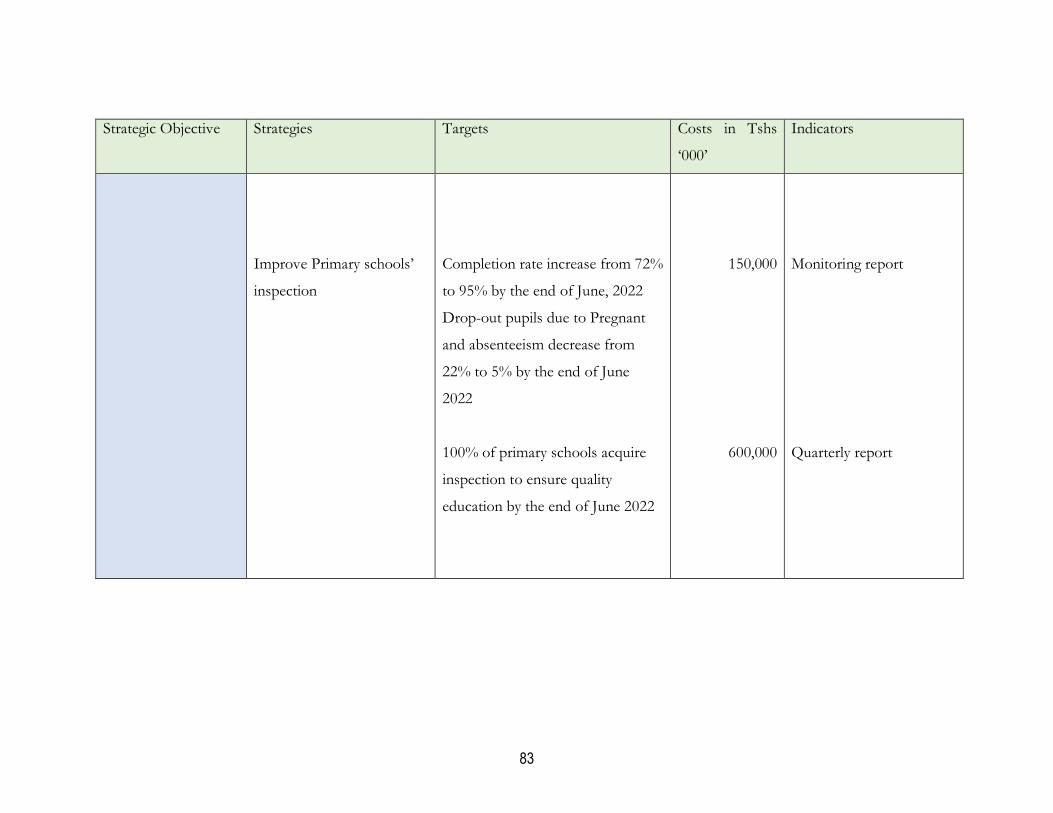
83
Strategic Objective Strategies Targets Costs in Tshs
‘000’
Indicators
Improve Primary schools’
inspection
Completion rate increase from 72%
to 95% by the end of June, 2022
Drop-out pupils due to Pregnant
and absenteeism decrease from
22% to 5% by the end of June
2022
100% of primary schools acquire
inspection to ensure quality
education by the end of June 2022
150,000
600,000
Monitoring report
Quarterly report
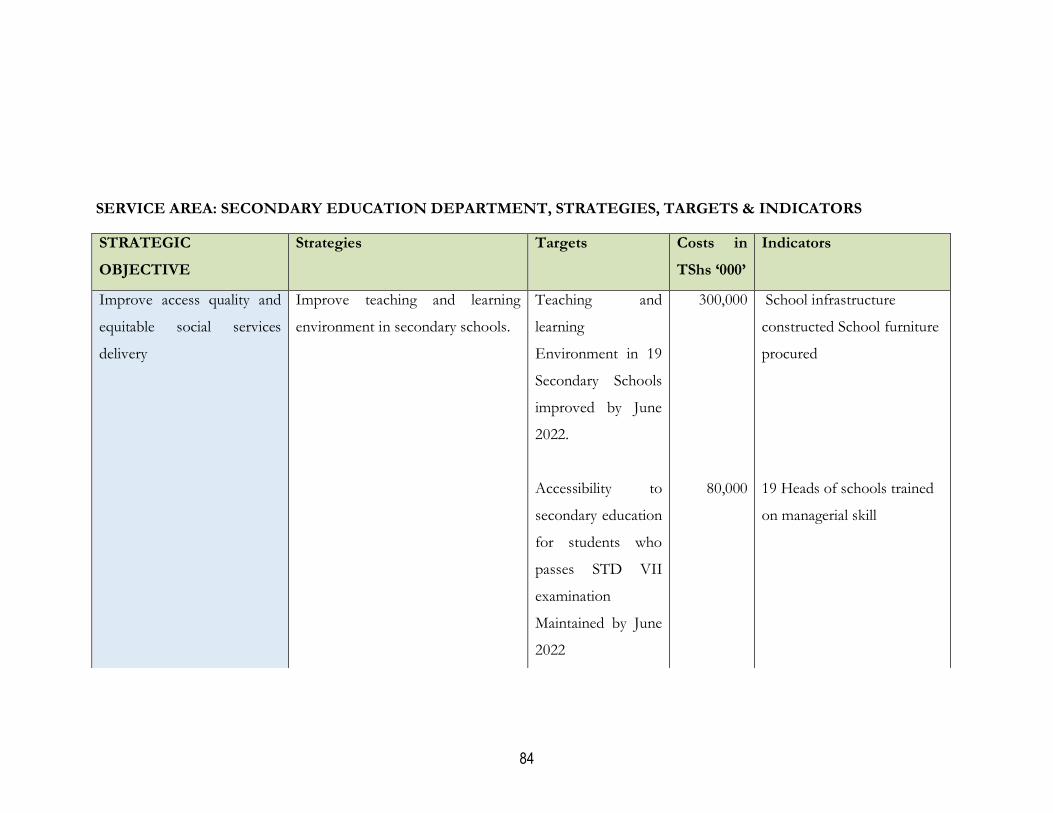
84
SERVICE AREA: SECONDARY EDUCATION DEPARTMENT, STRATEGIES, TARGETS & INDICATORS
STRATEGIC
OBJECTIVE
Strategies Targets Costs in
TShs ‘000’
Indicators
Improve access quality and
equitable social services
delivery
Improve teaching and learning
environment in secondary schools.
Teaching and
learning
Environment in 19
Secondary Schools
improved by June
2022.
Accessibility to
secondary education
for students who
passes STD VII
examination
Maintained by June
2022
300,000
80,000
School infrastructure
constructed School furniture
procured
19 Heads of schools trained
on managerial skill
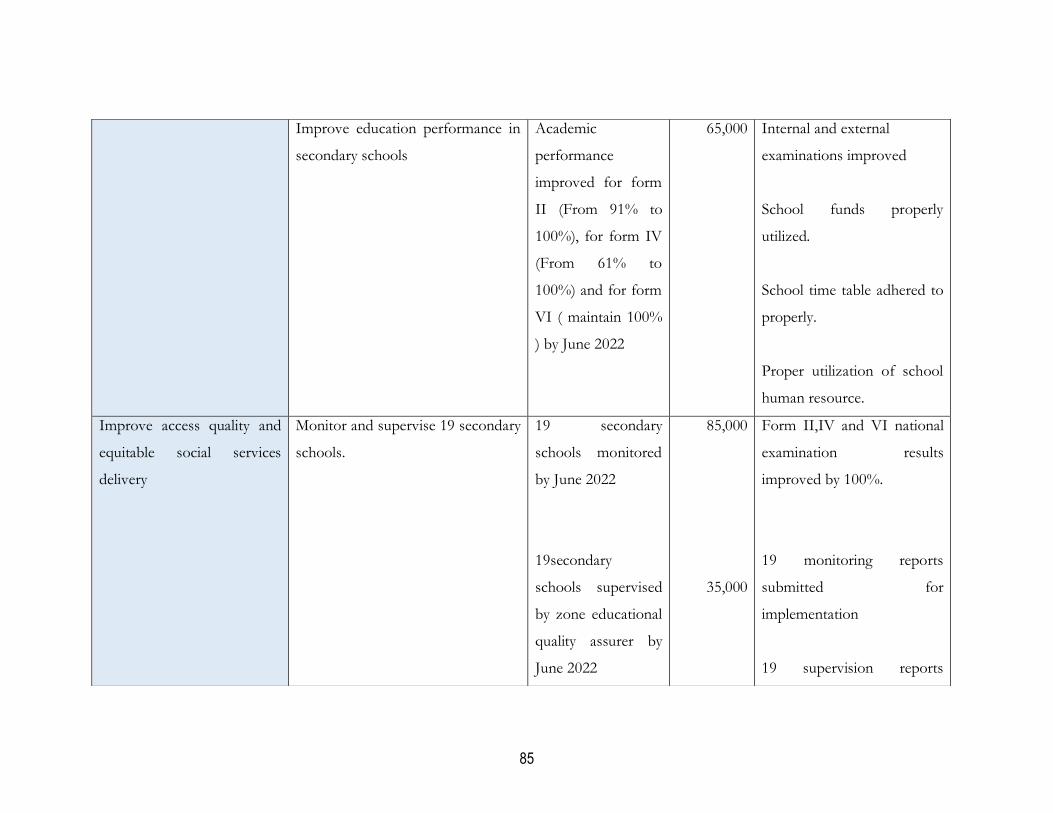
85
Improve education performance in
secondary schools
Academic
performance
improved for form
II (From 91% to
100%), for form IV
(From 61% to
100%) and for form
VI ( maintain 100%
) by June 2022
65,000
Internal and external
examinations improved
School funds properly
utilized.
School time table adhered to
properly.
Proper utilization of school
human resource.
Improve access quality and
equitable social services
delivery
Monitor and supervise 19 secondary
schools.
19 secondary
schools monitored
by June 2022
19secondary
schools supervised
by zone educational
quality assurer by
June 2022
85,000
35,000
Form II,IV and VI national
examination results
improved by 100%.
19 monitoring reports
submitted for
implementation
19 supervision reports
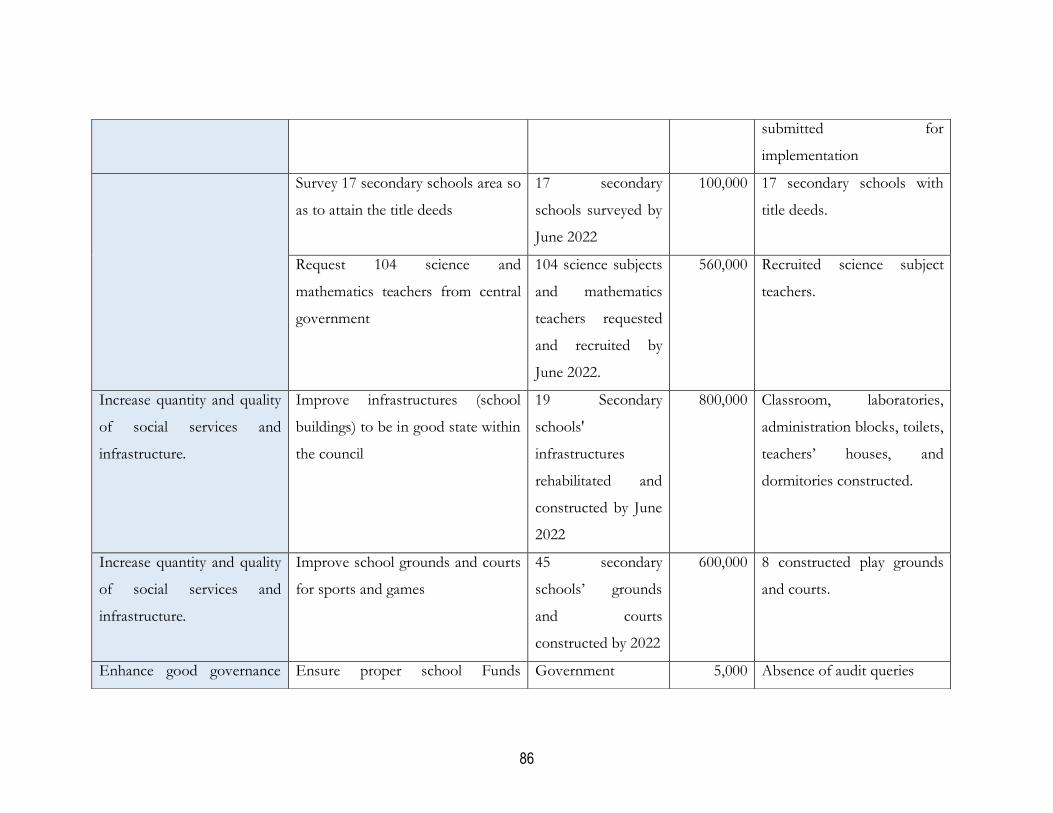
86
submitted for
implementation
Survey 17 secondary schools area so
as to attain the title deeds
17 secondary
schools surveyed by
June 2022
100,000
17 secondary schools with
title deeds.
Request 104 science and
mathematics teachers from central
government
104 science subjects
and mathematics
teachers requested
and recruited by
June 2022.
560,000
Recruited science subject
teachers.
Increase quantity and quality
of social services and
infrastructure.
Improve infrastructures (school
buildings) to be in good state within
the council
19 Secondary
schools'
infrastructures
rehabilitated and
constructed by June
2022
800,000
Classroom, laboratories,
administration blocks, toilets,
teachers’ houses, and
dormitories constructed.
Increase quantity and quality
of social services and
infrastructure.
Improve school grounds and courts
for sports and games
45 secondary
schools’ grounds
and courts
constructed by 2022
600,000 8 constructed play grounds
and courts.
Enhance good governance Ensure proper school Funds Government 5,000 Absence of audit queries
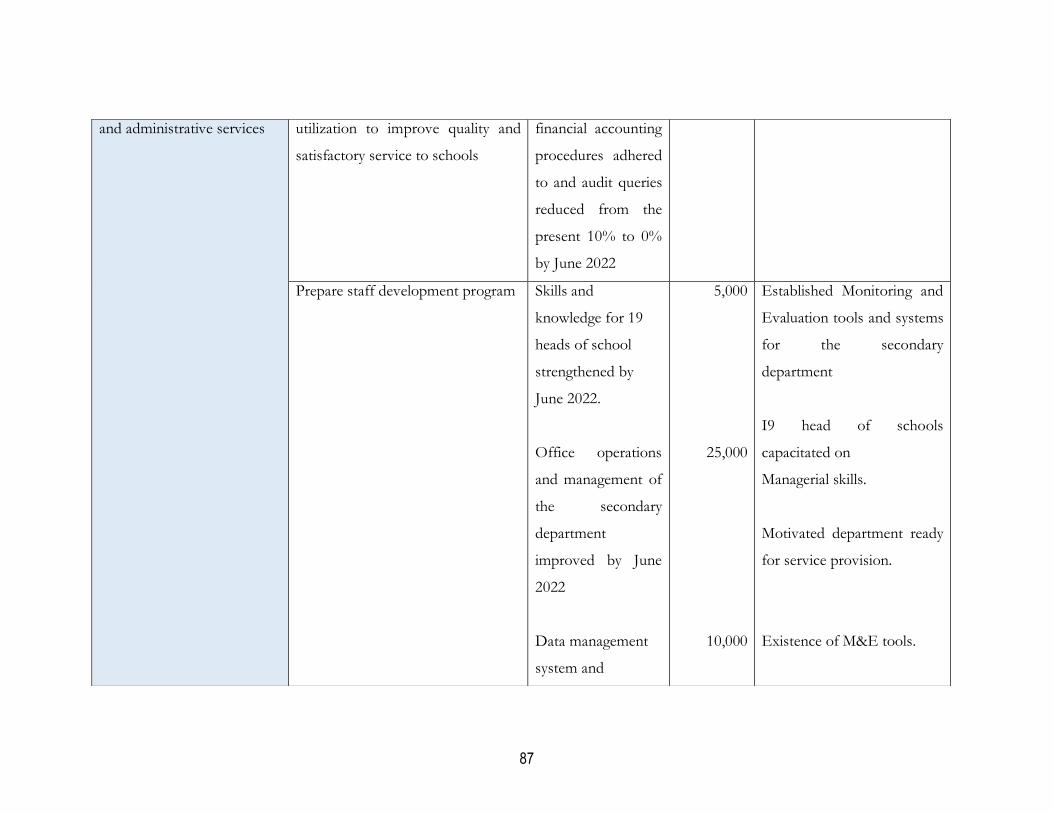
87
and administrative services utilization to improve quality and
satisfactory service to schools
financial accounting
procedures adhered
to and audit queries
reduced from the
present 10% to 0%
by June 2022
Prepare staff development program Skills and
knowledge for 19
heads of school
strengthened by
June 2022.
Office operations
and management of
the secondary
department
improved by June
2022
Data management
system and
5,000
25,000
10,000
Established Monitoring and
Evaluation tools and systems
for the secondary
department
I9 head of schools
capacitated on
Managerial skills.
Motivated department ready
for service provision.
Existence of M&E tools.

88
Enhance good governance
and administrative services
Identification of managerial gaps to
be filled by training, preparation of
17 Heads of schools
to be equipped with
170,000
Number of heads of schools
performing their duties
Monitoring and
Evaluation tools
strengthened by
June 2022
Facilitate mandatory secondary
education employees’ rights.
Employees’ rights
improved and
maintained by June,
2022
40,000
Records showing benefited
employees in various aspects.
Enhance good governance
and administrative services
Increase pass rate in secondary
schools National Examinations
26,629 students
assessed internally
and externally by
June 2022.
54,000
Percentage coverage of the
schools supervised
Level of students internal
and external exams
performance
Number of secretariat
established
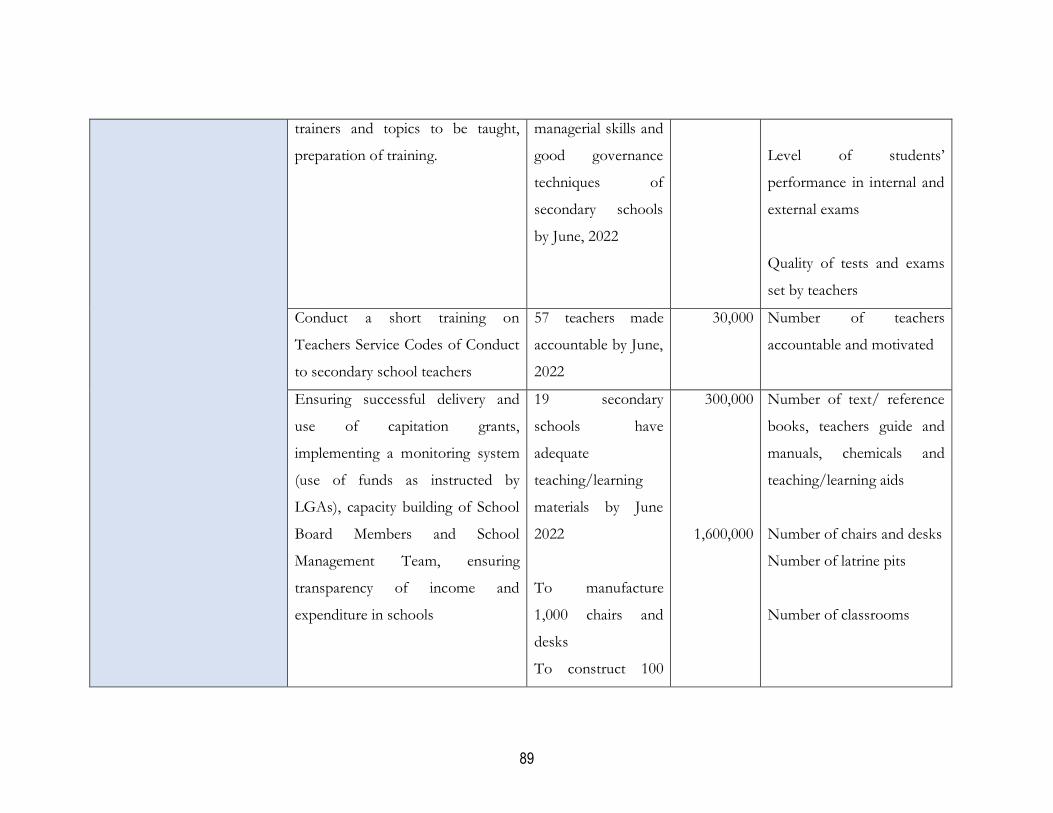
89
trainers and topics to be taught,
preparation of training.
managerial skills and
good governance
techniques of
secondary schools
by June, 2022
Level of students’
performance in internal and
external exams
Quality of tests and exams
set by teachers
Conduct a short training on
Teachers Service Codes of Conduct
to secondary school teachers
57 teachers made
accountable by June,
2022
30,000
Number of teachers
accountable and motivated
Ensuring successful delivery and
use of capitation grants,
implementing a monitoring system
(use of funds as instructed by
LGAs), capacity building of School
Board Members and School
Management Team, ensuring
transparency of income and
expenditure in schools
19 secondary
schools have
adequate
teaching/learning
materials by June
2022
To manufacture
1,000 chairs and
desks
To construct 100
300,000
1,600,000
Number of text/ reference
books, teachers guide and
manuals, chemicals and
teaching/learning aids
Number of chairs and desks
Number of latrine pits
Number of classrooms
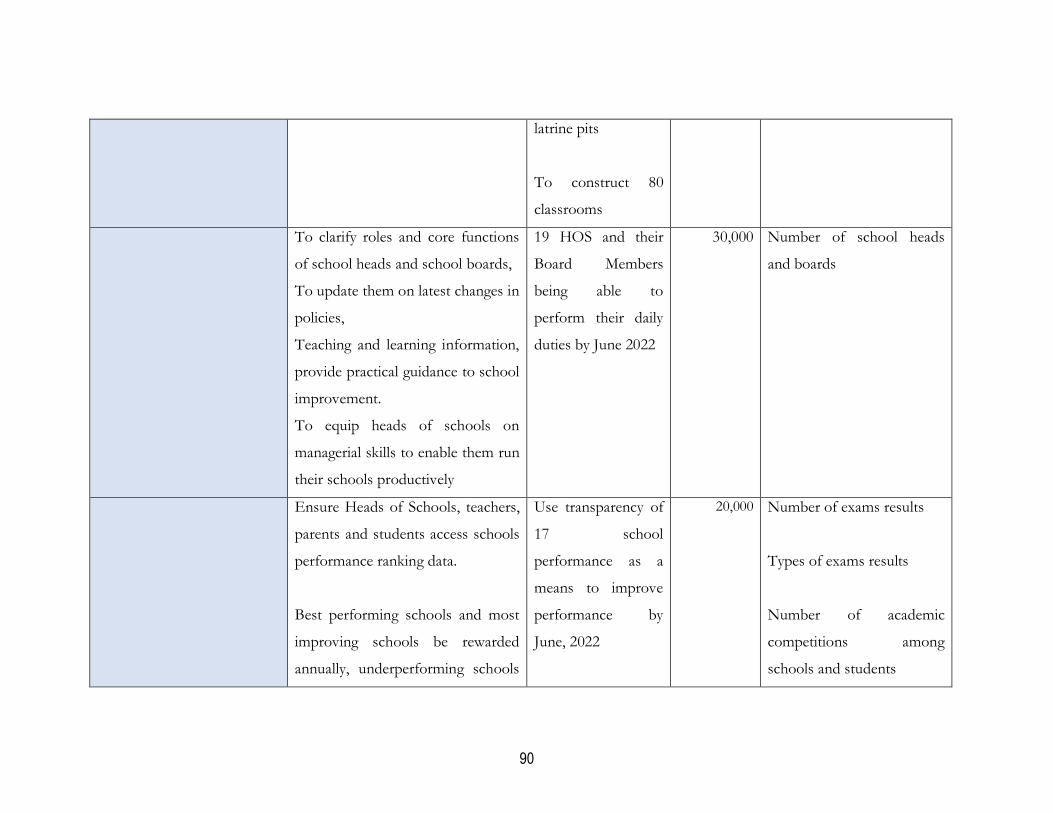
90
latrine pits
To construct 80
classrooms
To clarify roles and core functions
of school heads and school boards,
To update them on latest changes in
policies,
Teaching and learning information,
provide practical guidance to school
improvement.
To equip heads of schools on
managerial skills to enable them run
their schools productively
19 HOS and their
Board Members
being able to
perform their daily
duties by June 2022
30,000
Number of school heads
and boards
Ensure Heads of Schools, teachers,
parents and students access schools
performance ranking data.
Best performing schools and most
improving schools be rewarded
annually, underperforming schools
Use transparency of
17 school
performance as a
means to improve
performance by
June, 2022
20,000
Number of exams results
Types of exams results
Number of academic
competitions among
schools and students
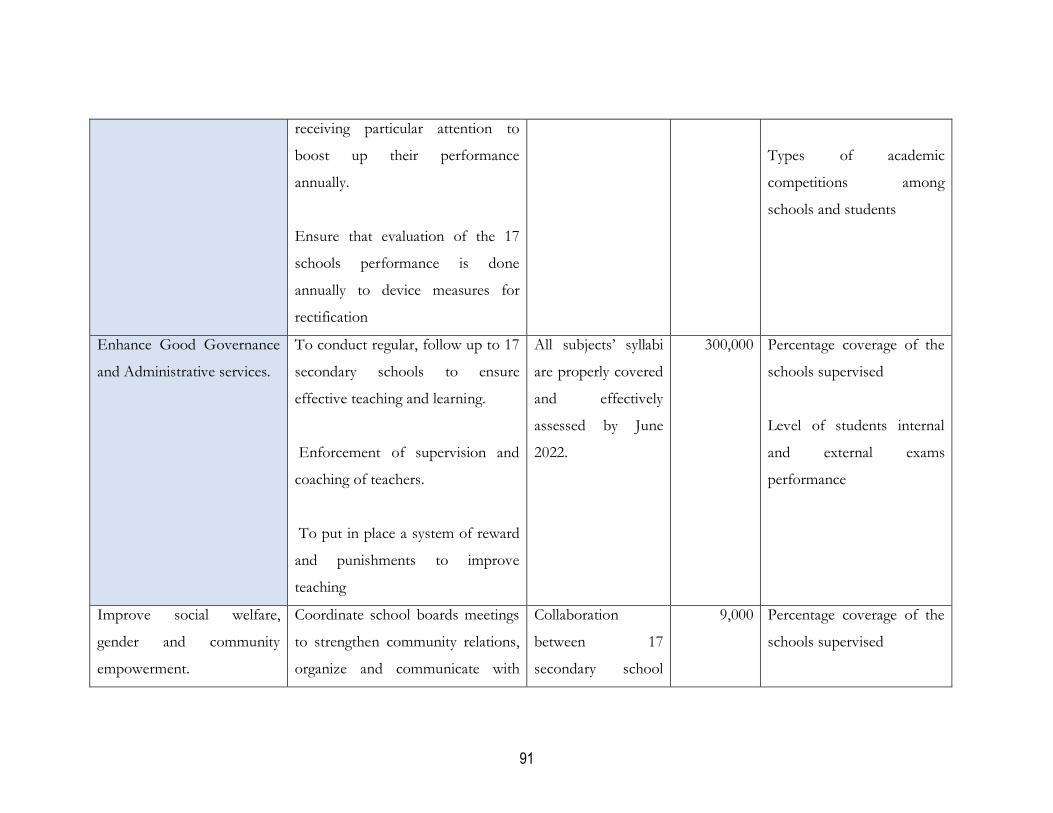
91
receiving particular attention to
boost up their performance
annually.
Ensure that evaluation of the 17
schools performance is done
annually to device measures for
rectification
Types of academic
competitions among
schools and students
Enhance Good Governance
and Administrative services.
To conduct regular, follow up to 17
secondary schools to ensure
effective teaching and learning.
Enforcement of supervision and
coaching of teachers.
To put in place a system of reward
and punishments to improve
teaching
All subjects’ syllabi
are properly covered
and effectively
assessed by June
2022.
300,000
Percentage coverage of the
schools supervised
Level of students internal
and external exams
performance
Improve social welfare,
gender and community
empowerment.
Coordinate school boards meetings
to strengthen community relations,
organize and communicate with
Collaboration
between 17
secondary school
9,000 Percentage coverage of the
schools supervised

92
parents to attend school meetings
and events to contribute towards
school developments
management and
community
enhanced to
improve school
performance by
June 2022
Level of students internal
and external exams
performance
Number of secretariat
established
SERVICE AREA: AGRICULTURE & COOPERATIVE DEPARTMENT, STRATEGIES, TARGETS & INDICATORS
Strategic Objective Strategies Targets Cost in
Tshs ‘000
Indicators
Improve access, quality
and equitable social
service delivery
Transformation of
agricultural production
To increase cotton production from
1.2 to 2.5 Tons/Ha by June, 2022
To increase paddy production from
an average of 5 tones/Ha to 7
Tons/Ha by June 2022
Cassava production increased from 3
450,000
75,000
60,000
Cotton production
increased from 1.2 to 2.5
Tons/Ha
Paddy production
increased from 5 to 7
Tons/Ha
Cassava production
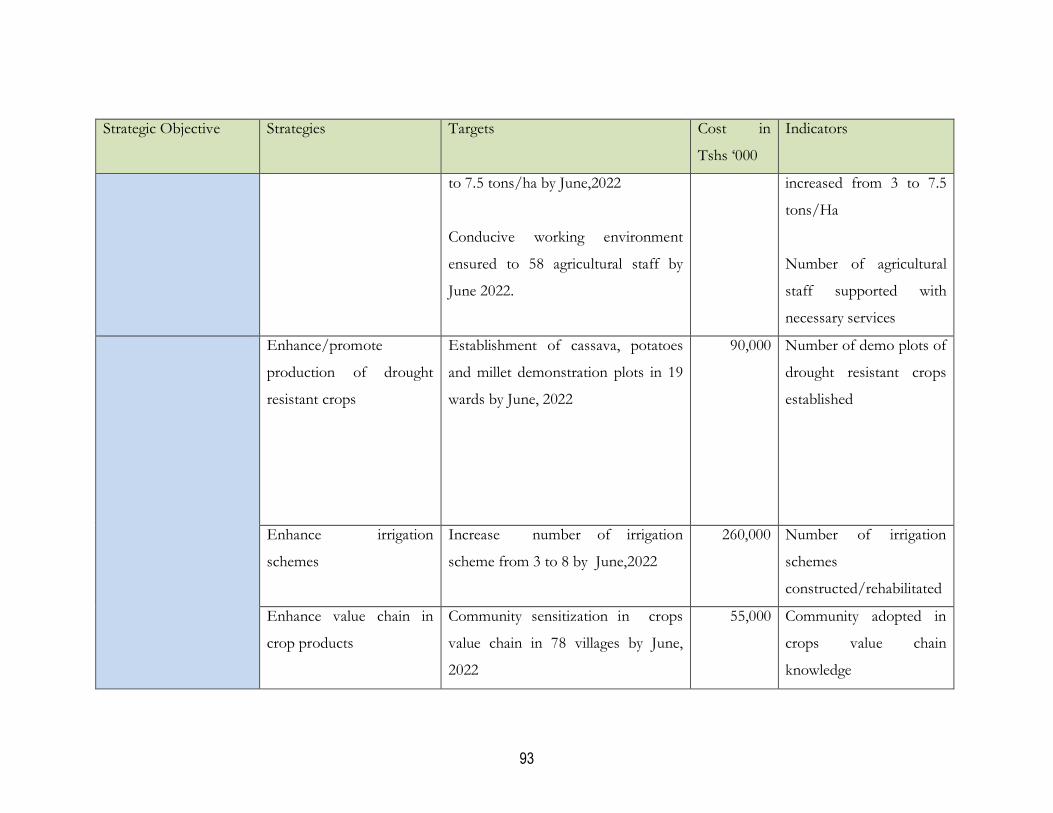
93
Strategic Objective Strategies Targets Cost in
Tshs ‘000
Indicators
to 7.5 tons/ha by June,2022
Conducive working environment
ensured to 58 agricultural staff by
June 2022.
increased from 3 to 7.5
tons/Ha
Number of agricultural
staff supported with
necessary services
Enhance/promote
production of drought
resistant crops
Establishment of cassava, potatoes
and millet demonstration plots in 19
wards by June, 2022
90,000
Number of demo plots of
drought resistant crops
established
Enhance irrigation
schemes
Increase number of irrigation
scheme from 3 to 8 by June,2022
260,000 Number of irrigation
schemes
constructed/rehabilitated
Enhance value chain in
crop products
Community sensitization in crops
value chain in 78 villages by June,
2022
55,000 Community adopted in
crops value chain
knowledge
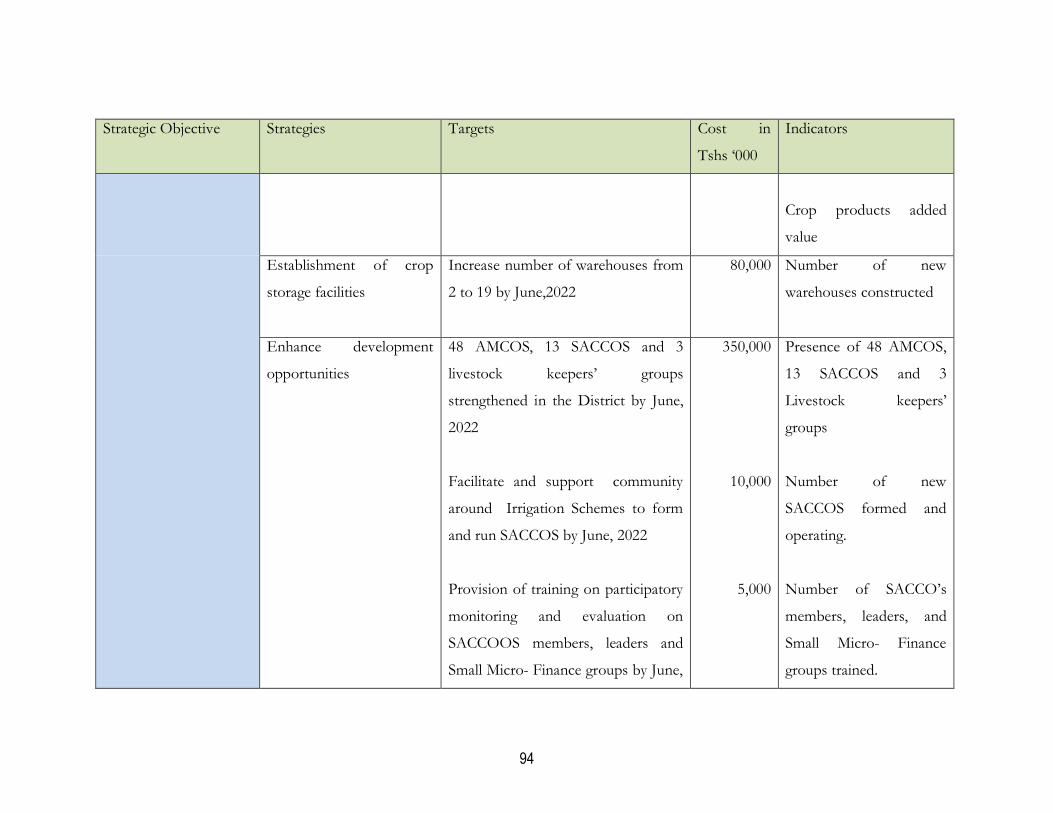
94
Strategic Objective Strategies Targets Cost in
Tshs ‘000
Indicators
Crop products added
value
Establishment of crop
storage facilities
Increase number of warehouses from
2 to 19 by June,2022
80,000 Number of new
warehouses constructed
Enhance development
opportunities
48 AMCOS, 13 SACCOS and 3
livestock keepers’ groups
strengthened in the District by June,
2022
Facilitate and support community
around Irrigation Schemes to form
and run SACCOS by June, 2022
Provision of training on participatory
monitoring and evaluation on
SACCOOS members, leaders and
Small Micro- Finance groups by June,
350,000
10,000
5,000
Presence of 48 AMCOS,
13 SACCOS and 3
Livestock keepers’
groups
Number of new
SACCOS formed and
operating.
Number of SACCO’s
members, leaders, and
Small Micro- Finance
groups trained.
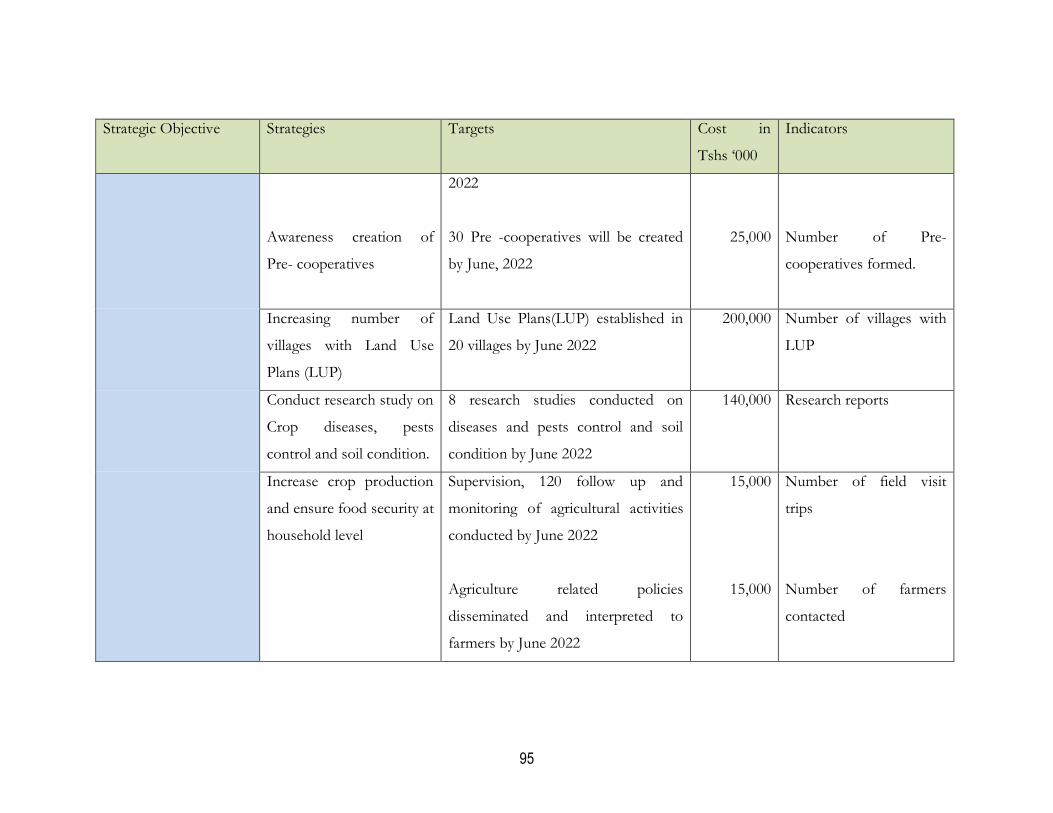
95
Strategic Objective Strategies Targets Cost in
Tshs ‘000
Indicators
Awareness creation of
Pre- cooperatives
2022
30 Pre -cooperatives will be created
by June, 2022
25,000
Number of Pre-
cooperatives formed.
Increasing number of
villages with Land Use
Plans (LUP)
Land Use Plans(LUP) established in
20 villages by June 2022
200,000 Number of villages with
LUP
Conduct research study on
Crop diseases, pests
control and soil condition.
8 research studies conducted on
diseases and pests control and soil
condition by June 2022
140,000 Research reports
Increase crop production
and ensure food security at
household level
Supervision, 120 follow up and
monitoring of agricultural activities
conducted by June 2022
Agriculture related policies
disseminated and interpreted to
farmers by June 2022
15,000
15,000
Number of field visit
trips
Number of farmers
contacted
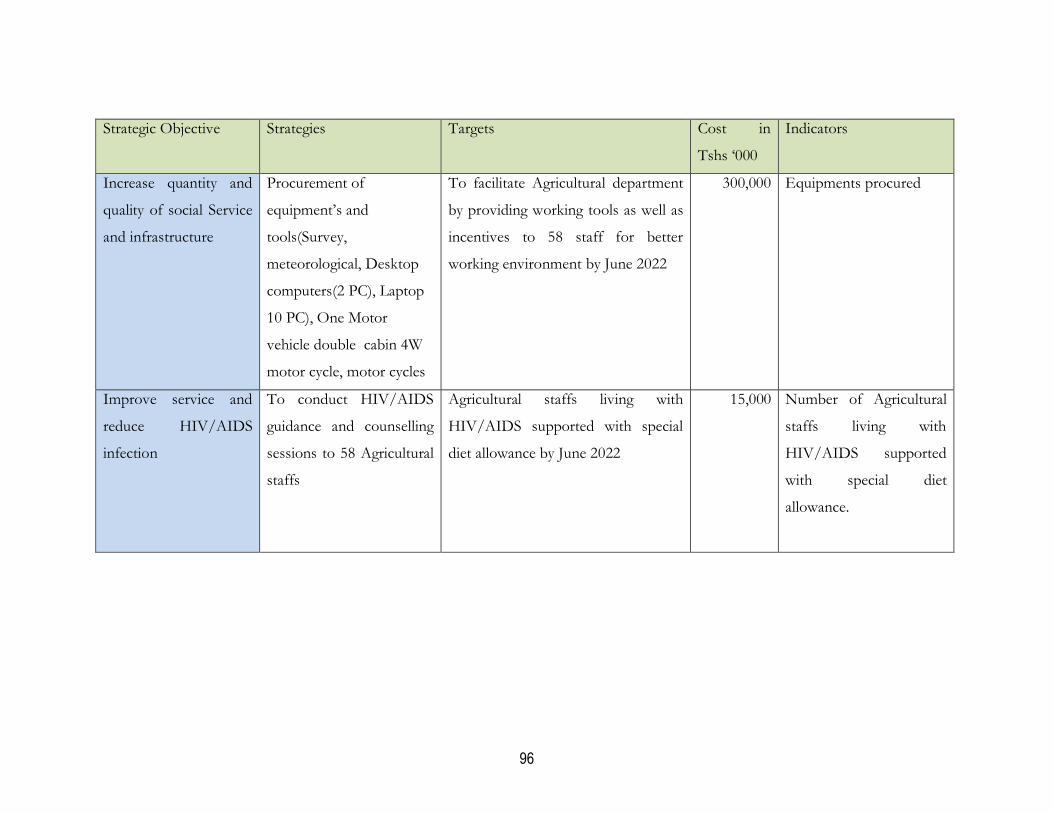
96
Strategic Objective Strategies Targets Cost in
Tshs ‘000
Indicators
Increase quantity and
quality of social Service
and infrastructure
Procurement of
equipment’s and
tools(Survey,
meteorological, Desktop
computers(2 PC), Laptop
10 PC), One Motor
vehicle double cabin 4W
motor cycle, motor cycles
To facilitate Agricultural department
by providing working tools as well as
incentives to 58 staff for better
working environment by June 2022
300,000 Equipments procured
Improve service and
reduce HIV/AIDS
infection
To conduct HIV/AIDS
guidance and counselling
sessions to 58 Agricultural
staffs
Agricultural staffs living with
HIV/AIDS supported with special
diet allowance by June 2022
15,000
Number of Agricultural
staffs living with
HIV/AIDS supported
with special diet
allowance.
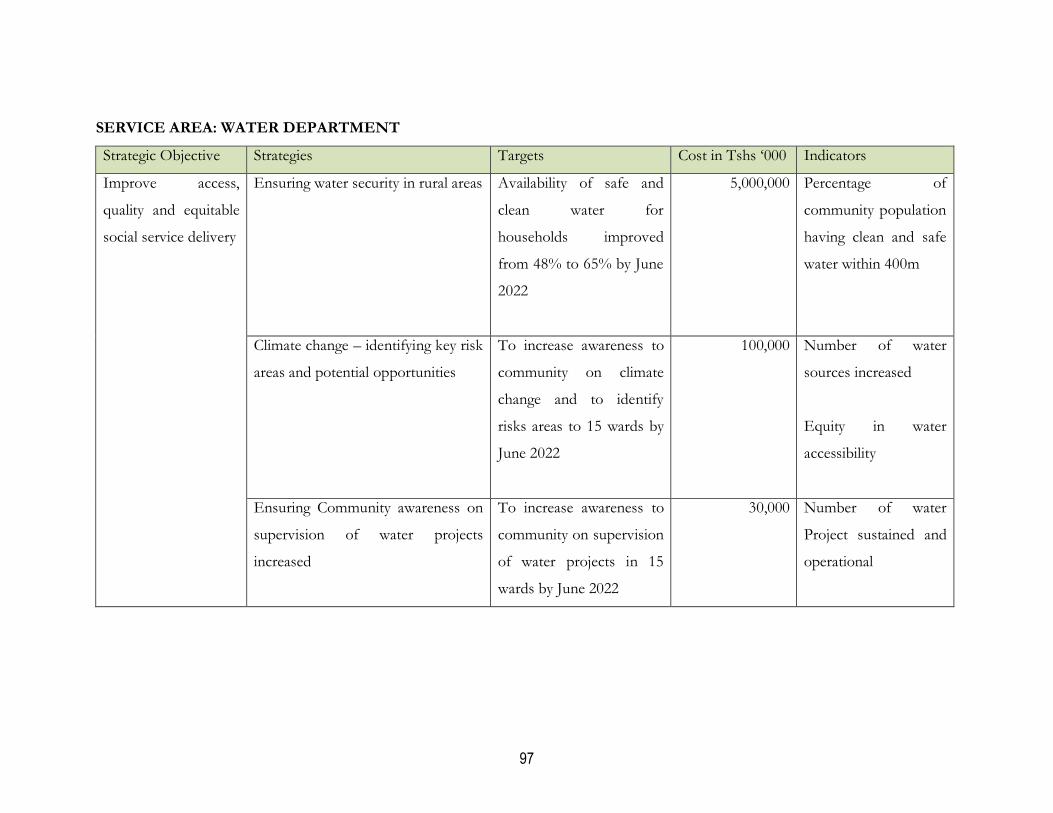
97
SERVICE AREA: WATER DEPARTMENT
Strategic Objective Strategies Targets Cost in Tshs ‘000 Indicators
Improve access,
quality and equitable
social service delivery
Ensuring water security in rural areas Availability of safe and
clean water for
households improved
from 48% to 65% by June
2022
5,000,000
Percentage of
community population
having clean and safe
water within 400m
Climate change – identifying key risk
areas and potential opportunities
To increase awareness to
community on climate
change and to identify
risks areas to 15 wards by
June 2022
100,000
Number of water
sources increased
Equity in water
accessibility
Ensuring Community awareness on
supervision of water projects
increased
To increase awareness to
community on supervision
of water projects in 15
wards by June 2022
30,000 Number of water
Project sustained and
operational
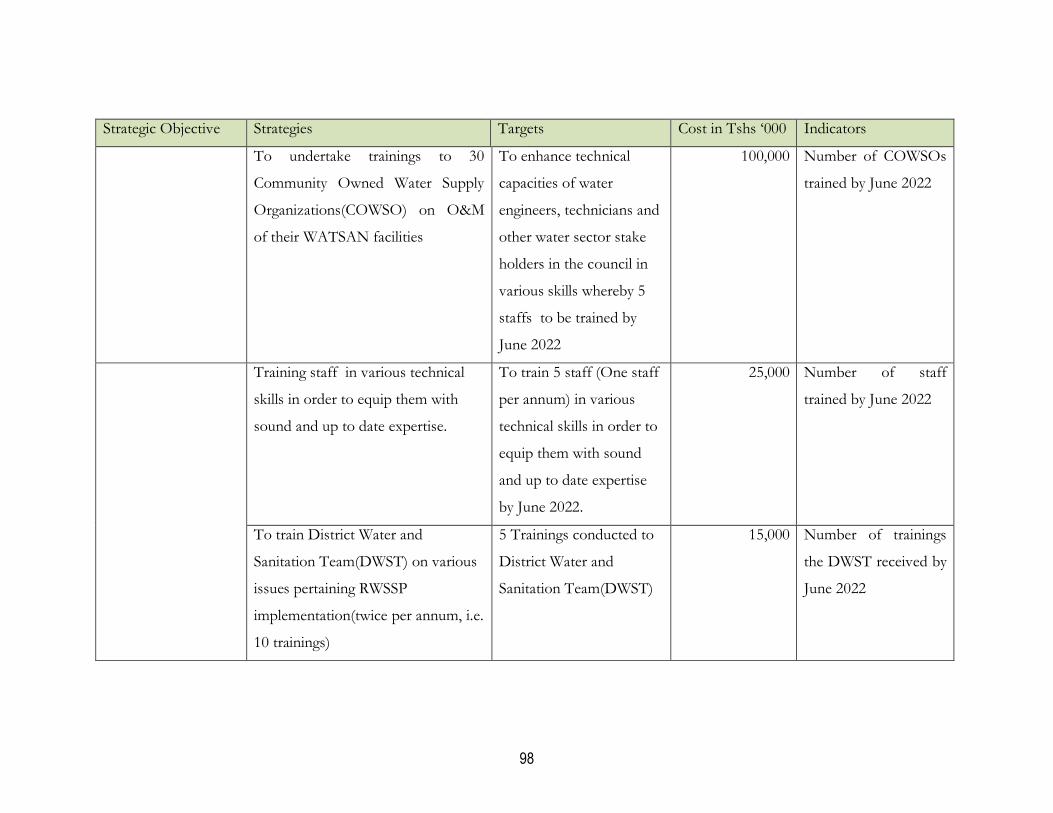
98
Strategic Objective Strategies Targets Cost in Tshs ‘000 Indicators
To undertake trainings to 30
Community Owned Water Supply
Organizations(COWSO) on O&M
of their WATSAN facilities
To enhance technical
capacities of water
engineers, technicians and
other water sector stake
holders in the council in
various skills whereby 5
staffs to be trained by
June 2022
100,000 Number of COWSOs
trained by June 2022
Training staff in various technical
skills in order to equip them with
sound and up to date expertise.
To train 5 staff (One staff
per annum) in various
technical skills in order to
equip them with sound
and up to date expertise
by June 2022.
25,000 Number of staff
trained by June 2022
To train District Water and
Sanitation Team(DWST) on various
issues pertaining RWSSP
implementation(twice per annum, i.e.
10 trainings)
5 Trainings conducted to
District Water and
Sanitation Team(DWST)
15,000 Number of trainings
the DWST received by
June 2022
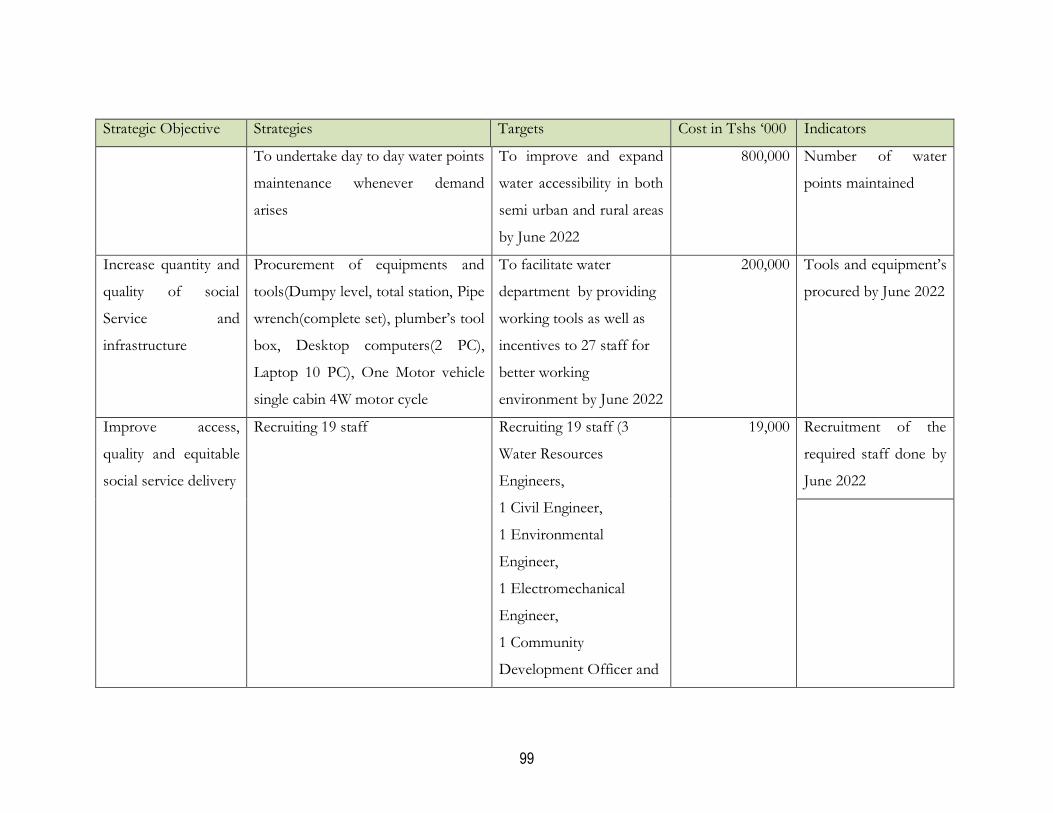
99
Strategic Objective Strategies Targets Cost in Tshs ‘000 Indicators
To undertake day to day water points
maintenance whenever demand
arises
To improve and expand
water accessibility in both
semi urban and rural areas
by June 2022
800,000 Number of water
points maintained
Increase quantity and
quality of social
Service and
infrastructure
Procurement of equipments and
tools(Dumpy level, total station, Pipe
wrench(complete set), plumber’s tool
box, Desktop computers(2 PC),
Laptop 10 PC), One Motor vehicle
single cabin 4W motor cycle
To facilitate water
department by providing
working tools as well as
incentives to 27 staff for
better working
environment by June 2022
200,000 Tools and equipment’s
procured by June 2022
Improve access,
quality and equitable
social service delivery
Recruiting 19 staff
Recruiting 19 staff (3
Water Resources
Engineers,
1 Civil Engineer,
1 Environmental
Engineer,
1 Electromechanical
Engineer,
1 Community
Development Officer and
19,000 Recruitment of the
required staff done by
June 2022
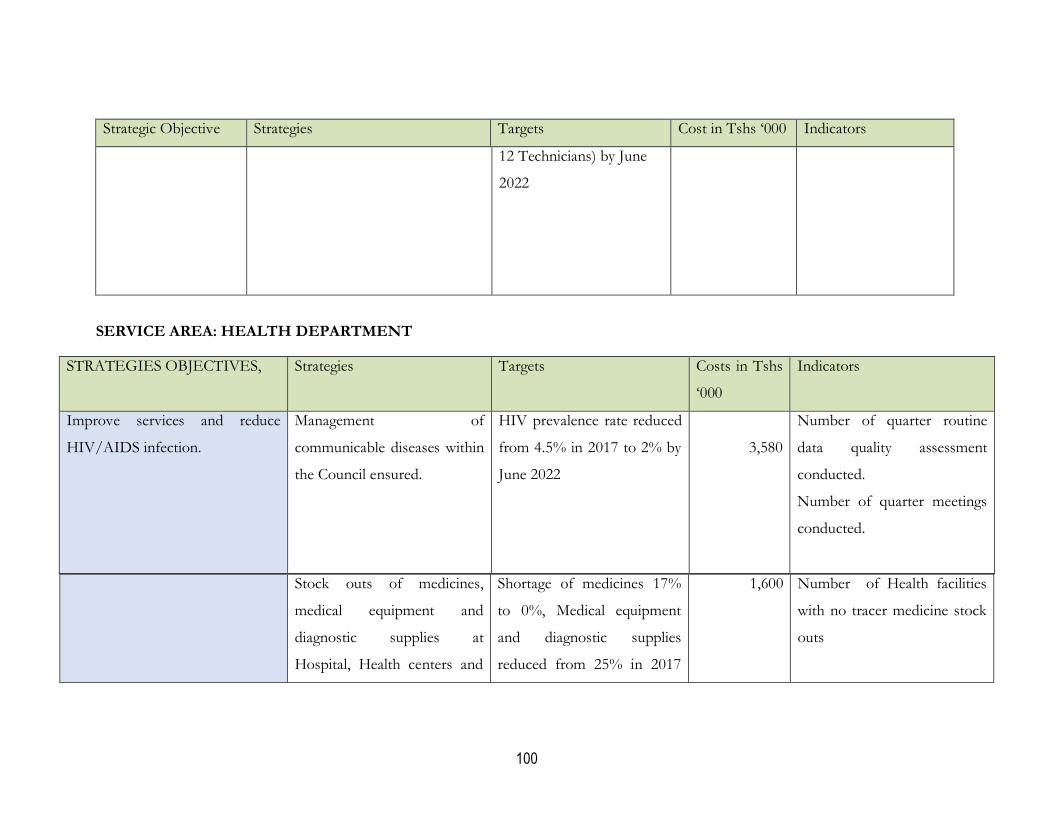
100
Strategic Objective Strategies Targets Cost in Tshs ‘000 Indicators
12 Technicians) by June
2022
SERVICE AREA: HEALTH DEPARTMENT
Stock outs of medicines,
medical equipment and
diagnostic supplies at
Hospital, Health centers and
Shortage of medicines 17%
to 0%, Medical equipment
and diagnostic supplies
reduced from 25% in 2017
1,600 Number of Health facilities
with no tracer medicine stock
outs
STRATEGIES OBJECTIVES, Strategies Targets Costs in Tshs
‘000
Indicators
Improve services and reduce
HIV/AIDS infection.
Management of
communicable diseases within
the Council ensured.
HIV prevalence rate reduced
from 4.5% in 2017 to 2% by
June 2022
3,580
Number of quarter routine
data quality assessment
conducted.
Number of quarter meetings
conducted.

101
Dispensaries reduced. to 15% by June 2022
Maternal, Newborn and Child
Health services strengthened
Maternal mortality rate
Reduced from 115 in 2016 to
40 per 100,000 live births by
June 2022.
Infant mortality rate reduced
from 6 in 2016 to 3 per 1,000
live births by June 2022.
Immunization defaulters
(dropout rate) of DTP-HB-
HIB3 reduced from 10 % in
2016 to 5% by June 2022
200,000
100,000
100,000
Number of Maternal reported.
Number of infant reported.
Number of children
unvaccinated DTP-HB-HIB3
Management of communicable
diseases within the Council
ensured.
TB cases detection rate
increased from 120/100000 in
2016 to 129/100000 by June
2022
40,000
Number of cases detected
increased
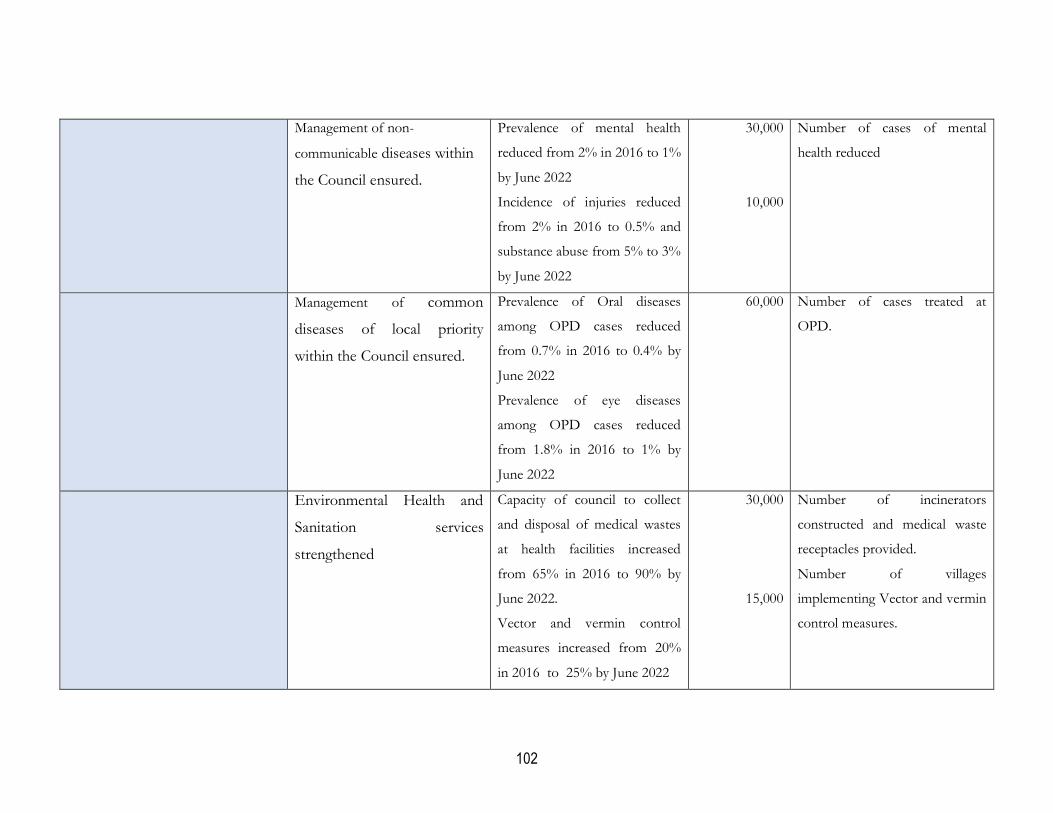
102
Management of non-
communicable diseases within
the Council ensured.
Prevalence of mental health
reduced from 2% in 2016 to 1%
by June 2022
Incidence of injuries reduced
from 2% in 2016 to 0.5% and
substance abuse from 5% to 3%
by June 2022
30,000
10,000
Number of cases of mental
health reduced
Management of common
diseases of local priority
within the Council ensured.
Prevalence of Oral diseases
among OPD cases reduced
from 0.7% in 2016 to 0.4% by
June 2022
Prevalence of eye diseases
among OPD cases reduced
from 1.8% in 2016 to 1% by
June 2022
60,000
Number of cases treated at
OPD.
Environmental Health and
Sanitation services
strengthened
Capacity of council to collect
and disposal of medical wastes
at health facilities increased
from 65% in 2016 to 90% by
June 2022.
Vector and vermin control
measures increased from 20%
in 2016 to 25% by June 2022
30,000
15,000
Number of incinerators
constructed and medical waste
receptacles provided.
Number of villages
implementing Vector and vermin
control measures.
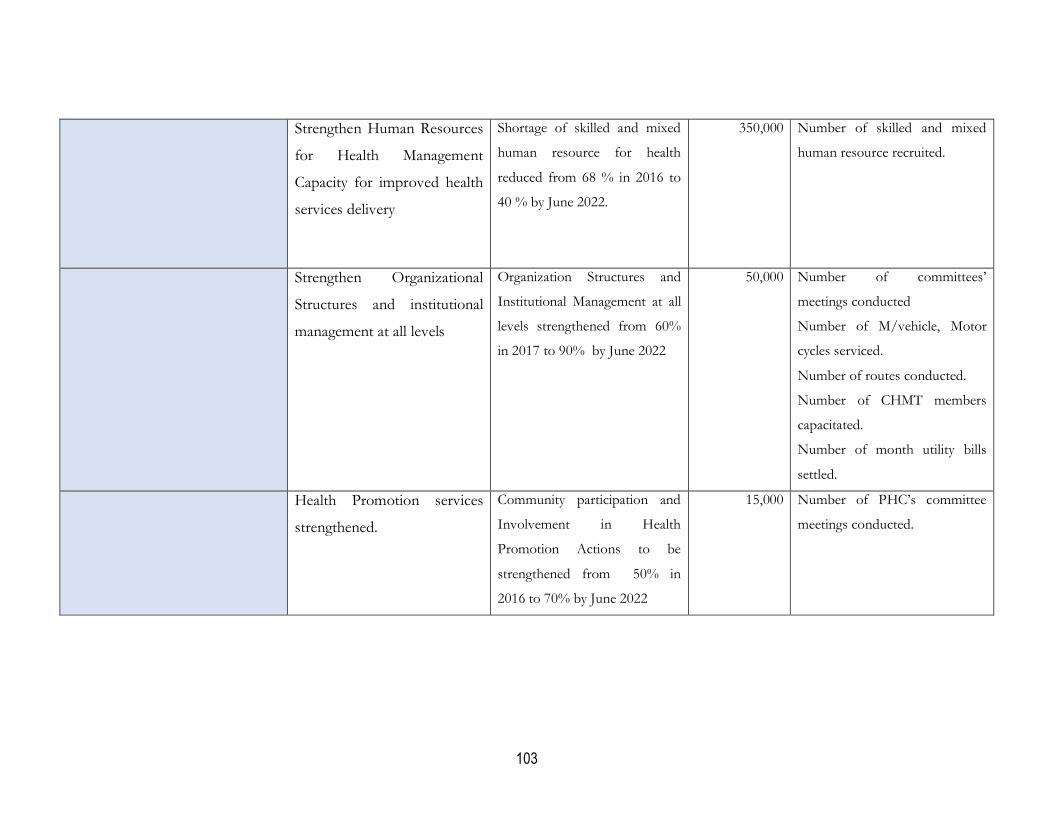
103
Strengthen Human Resources
for Health Management
Capacity for improved health
services delivery
Shortage of skilled and mixed
human resource for health
reduced from 68 % in 2016 to
40 % by June 2022.
350,000
Number of skilled and mixed
human resource recruited.
Strengthen Organizational
Structures and institutional
management at all levels
Organization Structures and
Institutional Management at all
levels strengthened from 60%
in 2017 to 90% by June 2022
50,000
Number of committees’
meetings conducted
Number of M/vehicle, Motor
cycles serviced.
Number of routes conducted.
Number of CHMT members
capacitated.
Number of month utility bills
settled.
Health Promotion services
strengthened.
Community participation and
Involvement in Health
Promotion Actions to be
strengthened from 50% in
2016 to 70% by June 2022
15,000 Number of PHC’s committee
meetings conducted.
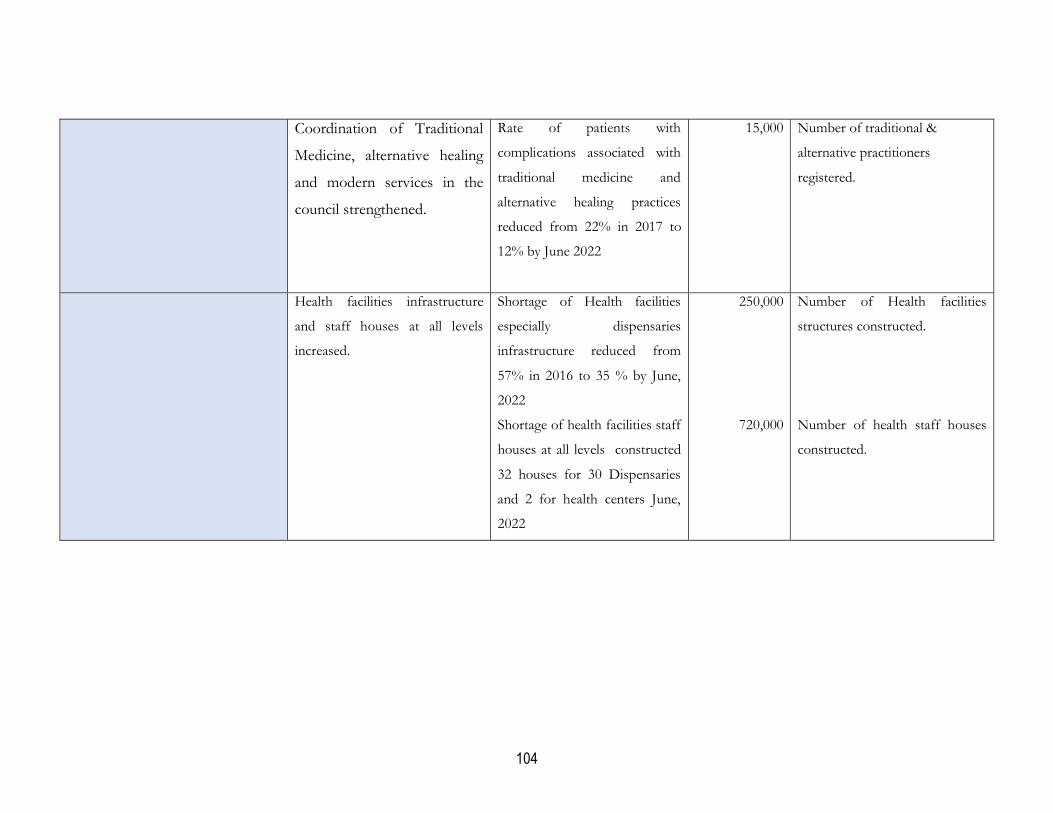
104
Coordination of Traditional
Medicine, alternative healing
and modern services in the
council strengthened.
Rate of patients with
complications associated with
traditional medicine and
alternative healing practices
reduced from 22% in 2017 to
12% by June 2022
15,000 Number of traditional &
alternative practitioners
registered.
Health facilities infrastructure
and staff houses at all levels
increased.
Shortage of Health facilities
especially dispensaries
infrastructure reduced from
57% in 2016 to 35 % by June,
2022
Shortage of health facilities staff
houses at all levels constructed
32 houses for 30 Dispensaries
and 2 for health centers June,
2022
250,000
720,000
Number of Health facilities
structures constructed.
Number of health staff houses
constructed.
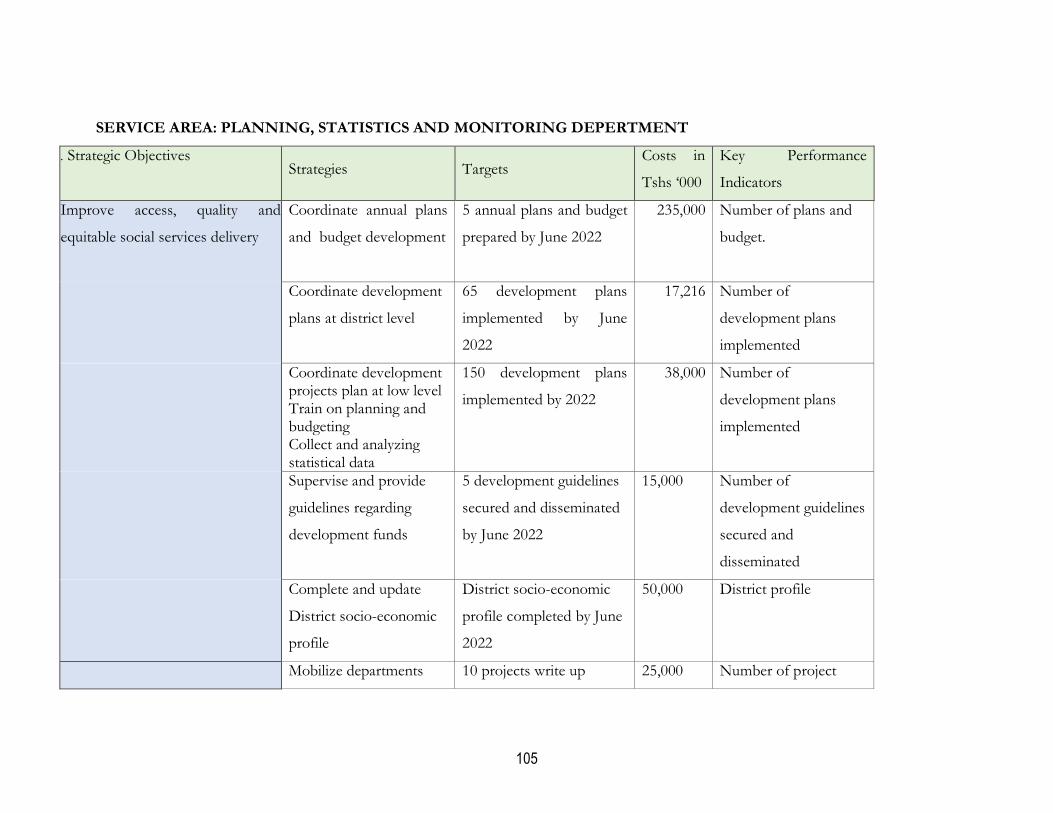
105
SERVICE AREA: PLANNING, STATISTICS AND MONITORING DEPERTMENT
. Strategic Objectives
Strategies Targets
Costs in
Tshs ‘000
Key Performance
Indicators
Improve access, quality and
equitable social services delivery
Coordinate annual plans
and budget development
5 annual plans and budget
prepared by June 2022
235,000 Number of plans and
budget.
Coordinate development
plans at district level
65 development plans
implemented by June
2022
17,216 Number of
development plans
implemented
Coordinate development projects plan at low level Train on planning and budgeting Collect and analyzing statistical data
150 development plans
implemented by 2022
38,000 Number of
development plans
implemented
Supervise and provide
guidelines regarding
development funds
5 development guidelines
secured and disseminated
by June 2022
15,000 Number of
development guidelines
secured and
disseminated
Complete and update
District socio-economic
profile
District socio-economic
profile completed by June
2022
50,000 District profile
Mobilize departments 10 projects write up 25,000 Number of project
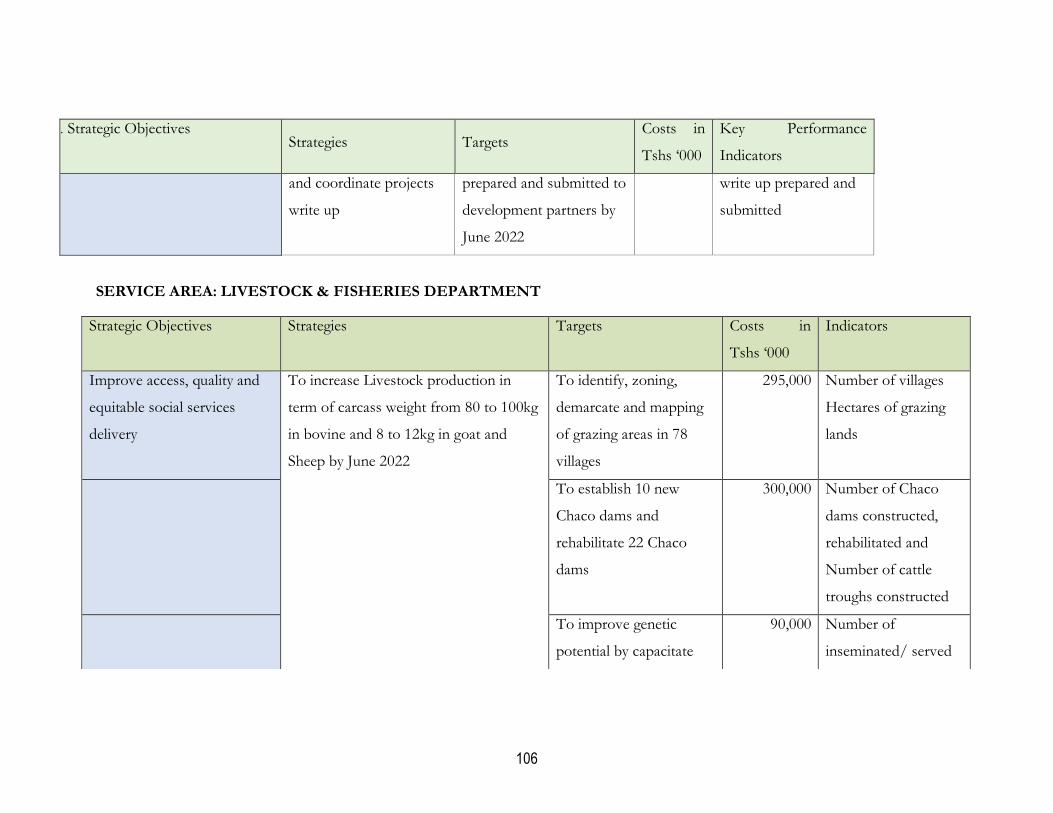
106
. Strategic Objectives
Strategies Targets
Costs in
Tshs ‘000
Key Performance
Indicators
and coordinate projects
write up
prepared and submitted to
development partners by
June 2022
write up prepared and
submitted
SERVICE AREA: LIVESTOCK & FISHERIES DEPARTMENT
Strategic Objectives Strategies Targets Costs in
Tshs ‘000
Indicators
Improve access, quality and
equitable social services
delivery
To increase Livestock production in
term of carcass weight from 80 to 100kg
in bovine and 8 to 12kg in goat and
Sheep by June 2022
To identify, zoning,
demarcate and mapping
of grazing areas in 78
villages
295,000
Number of villages
Hectares of grazing
lands
To establish 10 new
Chaco dams and
rehabilitate 22 Chaco
dams
300,000 Number of Chaco
dams constructed,
rehabilitated and
Number of cattle
troughs constructed
To improve genetic
potential by capacitate
90,000
Number of
inseminated/ served

107
the 3 A.I Centres
perform services by
purchasing the semen,
liquid Nitrogen, sheaths
and postulates
and procure 50 boran
bull
150,000
heifers and cows
Number of boran bull
To reduce mortality rate of livestock due
to infectious diseases from 10% to 6%
by June 2022
To rehabilitate 7 cattle
dips
To construct new 7 cattle
dips
To establish 3 veterinary
clinic and Construct 16
Veterinary clinic
240,000
350,000
300,0000
Number of cattle dips
rehabilitated and
constructed
Number of functional
vet clinic
To vaccinate 253,645
domestic chicken against
Newcastle Disease
100,000 Number of death of
chicken reduced
To vaccinate 6,124
domestic dogs and 1,235
cats against Rabies
125,000 Number of dog and
cats vaccinated
against Rabies
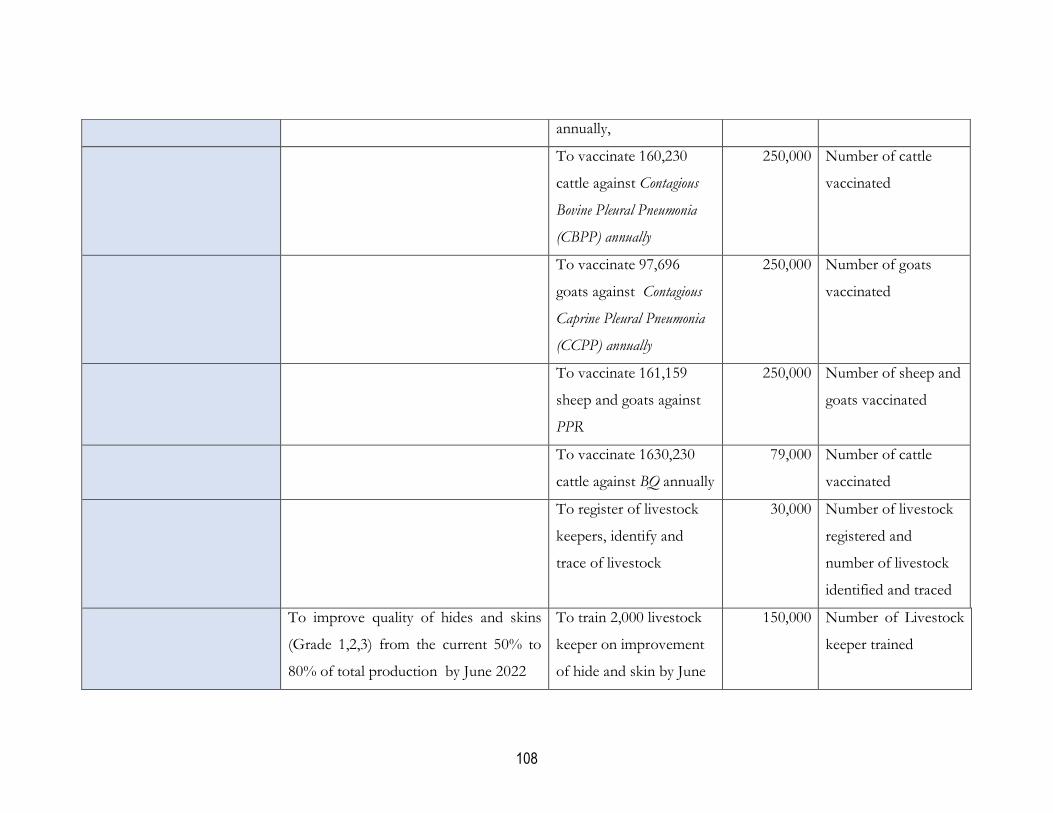
108
annually,
To vaccinate 160,230
cattle against Contagious
Bovine Pleural Pneumonia
(CBPP) annually
250,000 Number of cattle
vaccinated
To vaccinate 97,696
goats against Contagious
Caprine Pleural Pneumonia
(CCPP) annually
250,000 Number of goats
vaccinated
To vaccinate 161,159
sheep and goats against
PPR
250,000 Number of sheep and
goats vaccinated
To vaccinate 1630,230
cattle against BQ annually
79,000 Number of cattle
vaccinated
To register of livestock
keepers, identify and
trace of livestock
30,000 Number of livestock
registered and
number of livestock
identified and traced
To improve quality of hides and skins
(Grade 1,2,3) from the current 50% to
80% of total production by June 2022
To train 2,000 livestock
keeper on improvement
of hide and skin by June
150,000
Number of Livestock
keeper trained
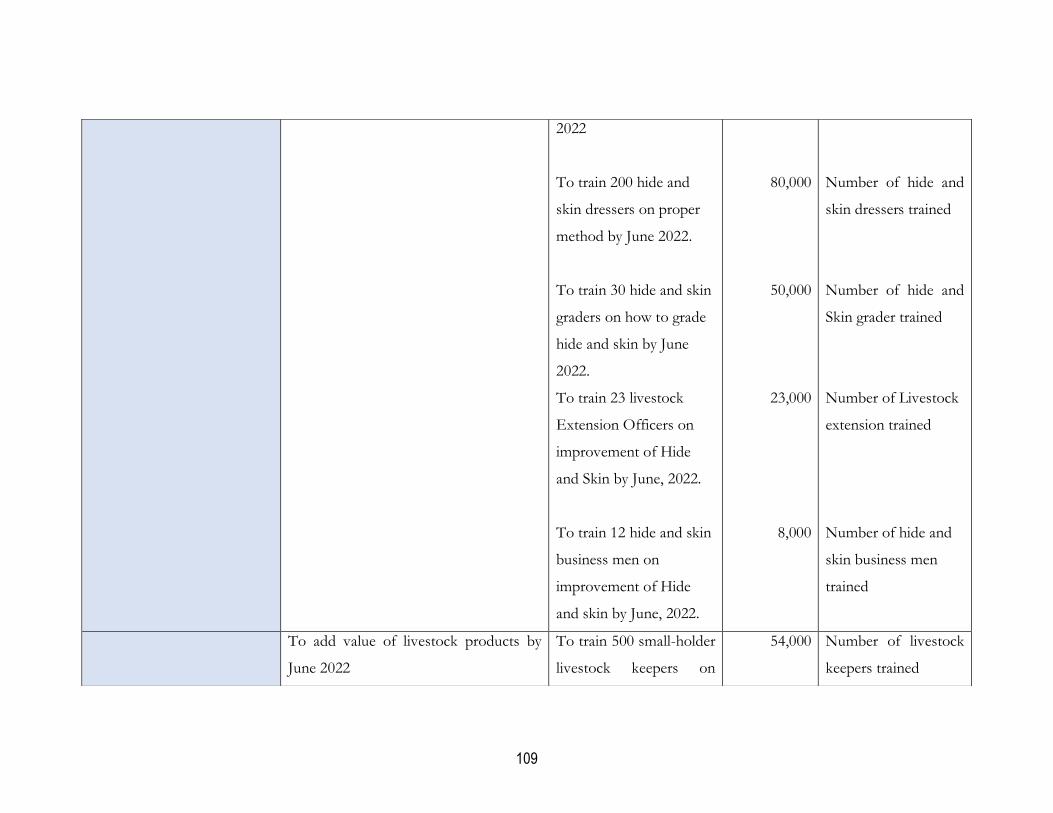
109
2022
To train 200 hide and
skin dressers on proper
method by June 2022.
To train 30 hide and skin
graders on how to grade
hide and skin by June
2022.
To train 23 livestock
Extension Officers on
improvement of Hide
and Skin by June, 2022.
To train 12 hide and skin
business men on
improvement of Hide
and skin by June, 2022.
80,000
50,000
23,000
8,000
Number of hide and
skin dressers trained
Number of hide and
Skin grader trained
Number of Livestock
extension trained
Number of hide and
skin business men
trained
To add value of livestock products by
June 2022
To train 500 small-holder
livestock keepers on
54,000
Number of livestock
keepers trained
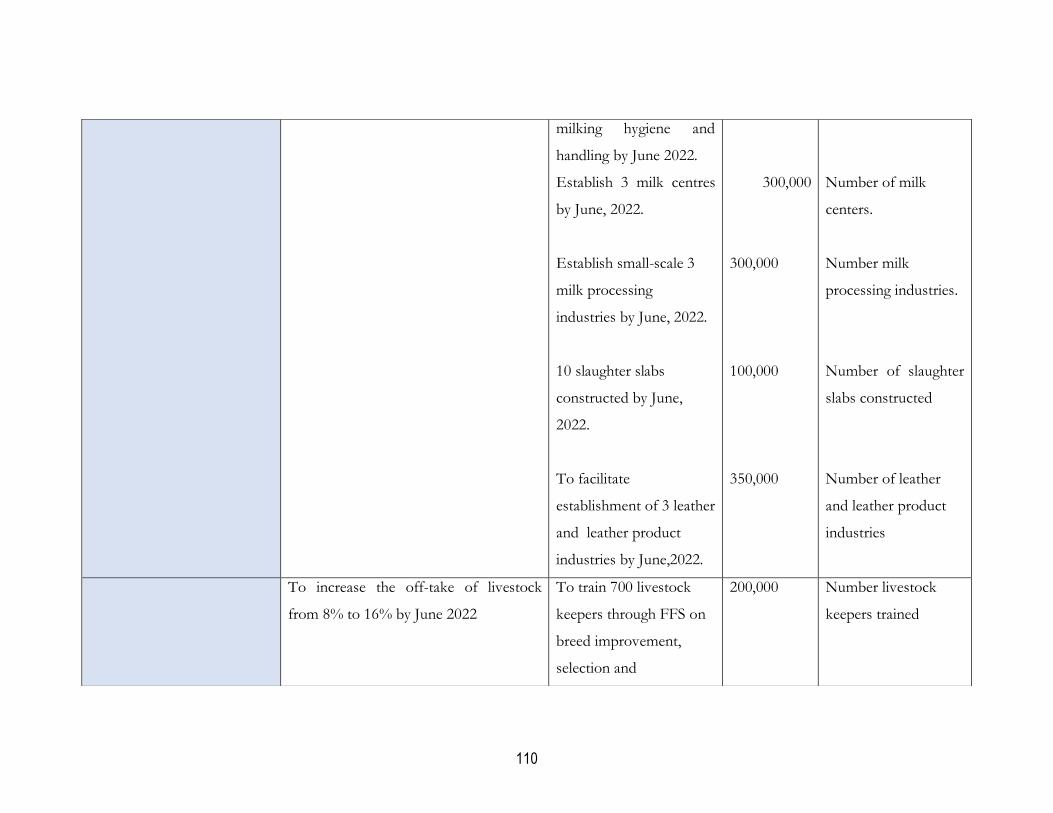
110
milking hygiene and
handling by June 2022.
Establish 3 milk centres
by June, 2022.
Establish small-scale 3
milk processing
industries by June, 2022.
10 slaughter slabs
constructed by June,
2022.
To facilitate
establishment of 3 leather
and leather product
industries by June,2022.
300,000
300,000
100,000
350,000
Number of milk
centers.
Number milk
processing industries.
Number of slaughter
slabs constructed
Number of leather
and leather product
industries
To increase the off-take of livestock
from 8% to 16% by June 2022
To train 700 livestock
keepers through FFS on
breed improvement,
selection and
200,000
Number livestock
keepers trained
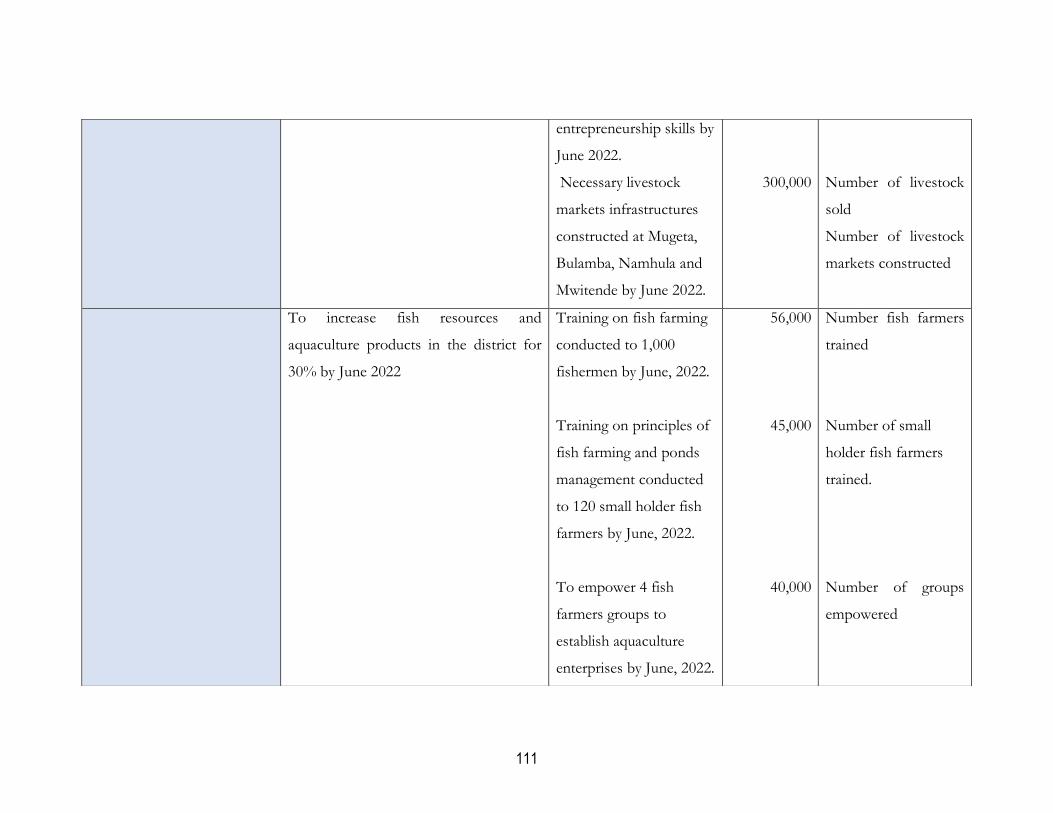
111
entrepreneurship skills by
June 2022.
Necessary livestock
markets infrastructures
constructed at Mugeta,
Bulamba, Namhula and
Mwitende by June 2022.
300,000
Number of livestock
sold
Number of livestock
markets constructed
To increase fish resources and
aquaculture products in the district for
30% by June 2022
Training on fish farming
conducted to 1,000
fishermen by June, 2022.
Training on principles of
fish farming and ponds
management conducted
to 120 small holder fish
farmers by June, 2022.
To empower 4 fish
farmers groups to
establish aquaculture
enterprises by June, 2022.
56,000
45,000
40,000
Number fish farmers
trained
Number of small
holder fish farmers
trained.
Number of groups
empowered
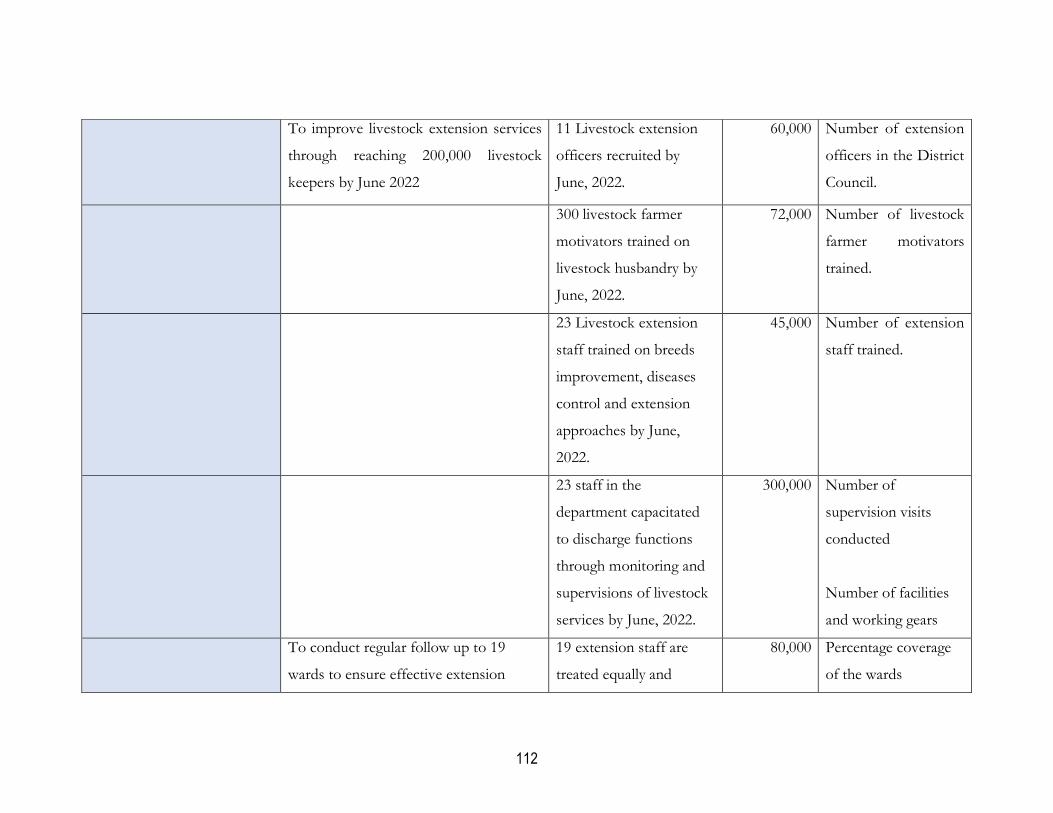
112
To improve livestock extension services
through reaching 200,000 livestock
keepers by June 2022
11 Livestock extension
officers recruited by
June, 2022.
60,000 Number of extension
officers in the District
Council.
300 livestock farmer
motivators trained on
livestock husbandry by
June, 2022.
72,000 Number of livestock
farmer motivators
trained.
23 Livestock extension
staff trained on breeds
improvement, diseases
control and extension
approaches by June,
2022.
45,000 Number of extension
staff trained.
23 staff in the
department capacitated
to discharge functions
through monitoring and
supervisions of livestock
services by June, 2022.
300,000 Number of
supervision visits
conducted
Number of facilities
and working gears
To conduct regular follow up to 19
wards to ensure effective extension
19 extension staff are
treated equally and
80,000
Percentage coverage
of the wards

113
SERVICE AREA: ENVIRONMENT AND SOLID WASTES MANAGEMENT DEPARTMENT
services and laws enforcement is done observe regulations and
positive working spirit by
June 2022.
Level of performance
Strategic Objectives Strategies Targets Costs in Tshs
‘000
Indicators
Improve Environmental
Conservation, Natural
Resources and Land
Management for sustainable
development.
Environmental Department
strengthened enough
The number of environment staff
increased from one 2017 to 6 by
June,2022
25,000
Number of
environment staffs
Improve environmental
awareness gap in the district
Seminar and forums on
environmental education
conducted to citizens in every ward
increased from 2% to 40% by June,
2022
Capacity building for ward and
5,000
10,000
Training reports
Number of training
conducted
Number of people
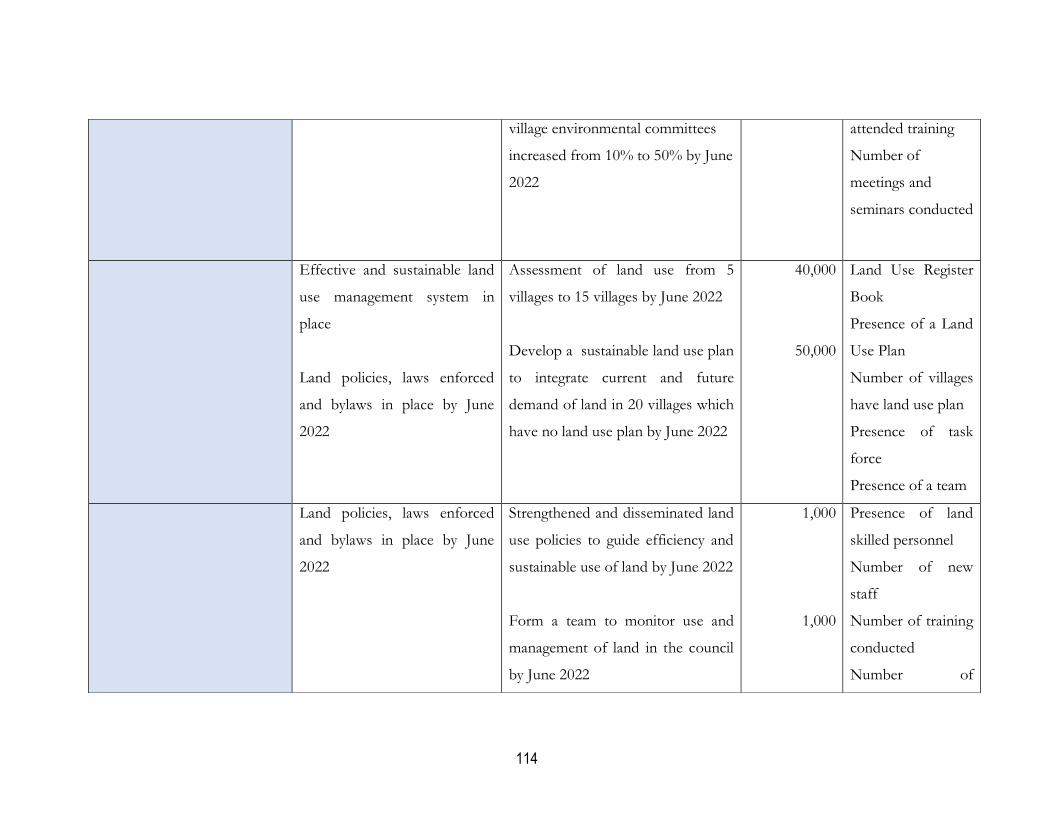
114
village environmental committees
increased from 10% to 50% by June
2022
attended training
Number of
meetings and
seminars conducted
Effective and sustainable land
use management system in
place
Land policies, laws enforced
and bylaws in place by June
2022
Assessment of land use from 5
villages to 15 villages by June 2022
Develop a sustainable land use plan
to integrate current and future
demand of land in 20 villages which
have no land use plan by June 2022
40,000
50,000
Land Use Register
Book
Presence of a Land
Use Plan
Number of villages
have land use plan
Presence of task
force
Presence of a team
Land policies, laws enforced
and bylaws in place by June
2022
Strengthened and disseminated land
use policies to guide efficiency and
sustainable use of land by June 2022
Form a team to monitor use and
management of land in the council
by June 2022
1,000
1,000
Presence of land
skilled personnel
Number of new
staff
Number of training
conducted
Number of
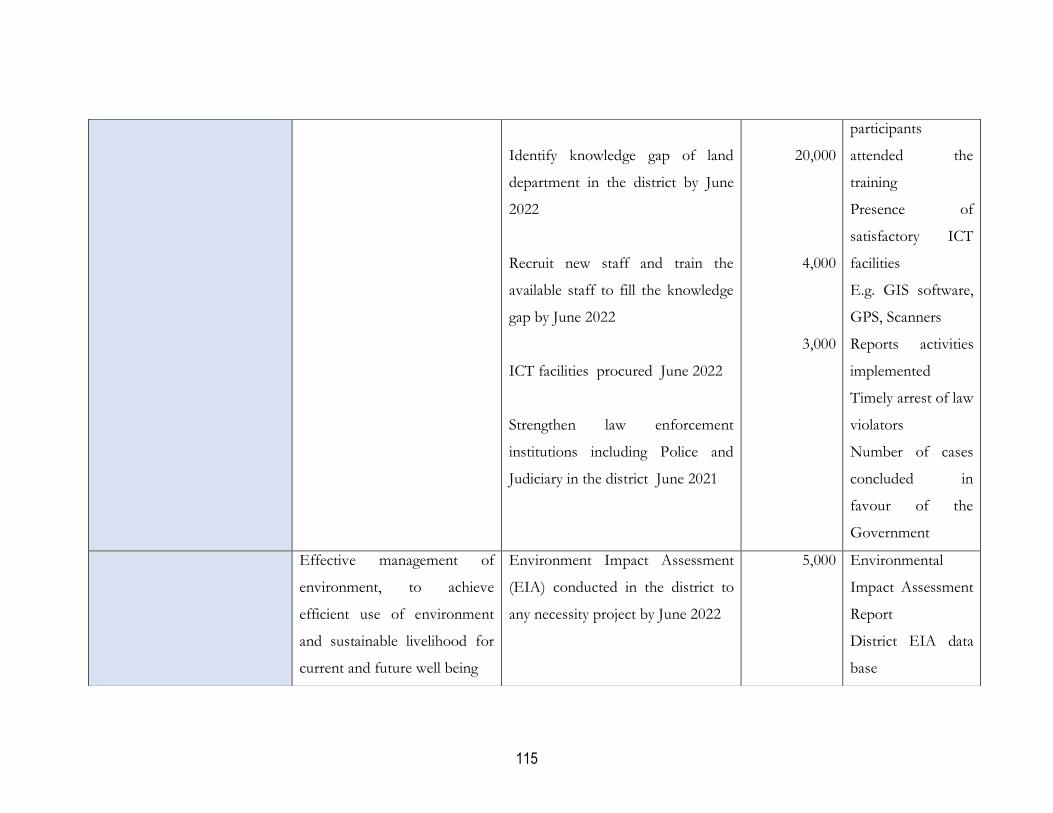
115
Identify knowledge gap of land
department in the district by June
2022
Recruit new staff and train the
available staff to fill the knowledge
gap by June 2022
ICT facilities procured June 2022
Strengthen law enforcement
institutions including Police and
Judiciary in the district June 2021
20,000
4,000
3,000
participants
attended the
training
Presence of
satisfactory ICT
facilities
E.g. GIS software,
GPS, Scanners
Reports activities
implemented
Timely arrest of law
violators
Number of cases
concluded in
favour of the
Government
Effective management of
environment, to achieve
efficient use of environment
and sustainable livelihood for
current and future well being
Environment Impact Assessment
(EIA) conducted in the district to
any necessity project by June 2022
5,000
Environmental
Impact Assessment
Report
District EIA data
base

116
Environmental policy to guide all
socio – economic activities in the
district by June 2022
Integration of environment
management practices in all socio
economic activities by June 2022
Capacity of Environmental
department staff in the council built
by June 2022
5,000
10,000
3,000
Presence of a
district
environment policy
Number of short
courses, seminars,
Workshops
conducted
Strategy for urgent attention on
land and water Catchments
Strength implementation of
integrated water resources
management
Water resources management plans
implemented by June
2022(demarcation of waters sources
in 10 villages within 60 metres from
water sources)
5,000
Number of water
catchments
identified and
conserved
Level of
compliance
Quantity and
quality of water
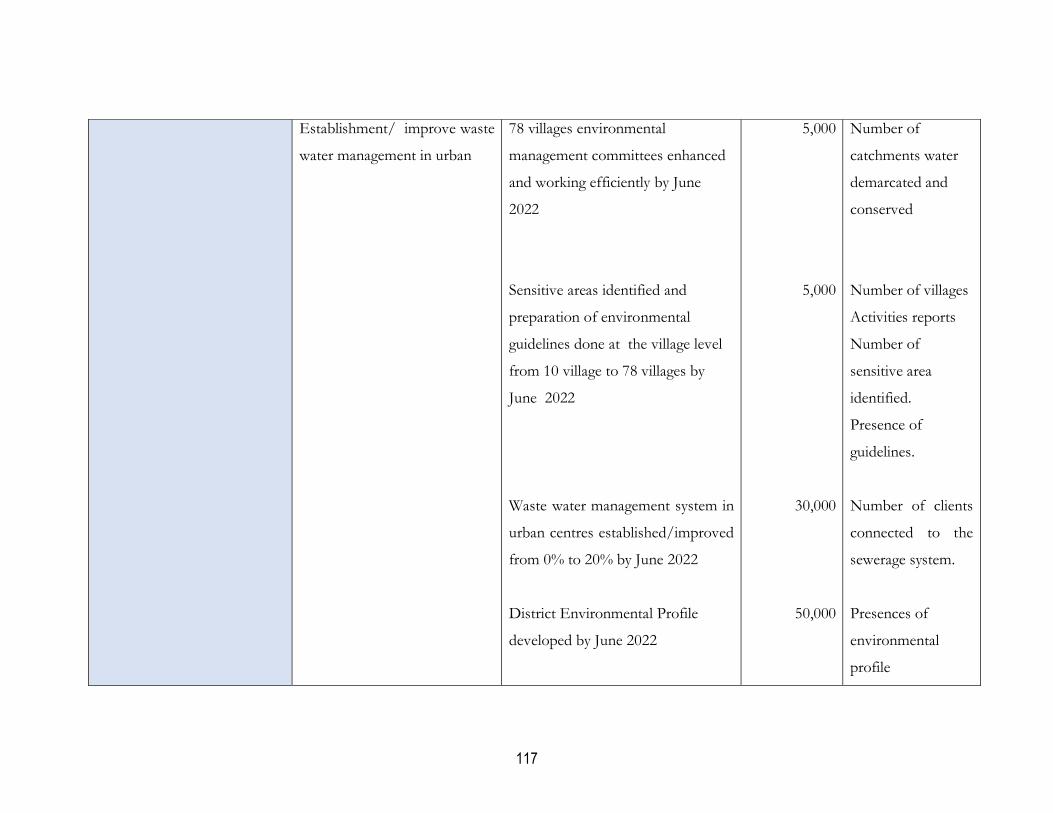
117
Establishment/ improve waste
water management in urban
78 villages environmental
management committees enhanced
and working efficiently by June
2022
Sensitive areas identified and
preparation of environmental
guidelines done at the village level
from 10 village to 78 villages by
June 2022
Waste water management system in
urban centres established/improved
from 0% to 20% by June 2022
District Environmental Profile
developed by June 2022
5,000
5,000
30,000
50,000
Number of
catchments water
demarcated and
conserved
Number of villages
Activities reports
Number of
sensitive area
identified.
Presence of
guidelines.
Number of clients
connected to the
sewerage system.
Presences of
environmental
profile
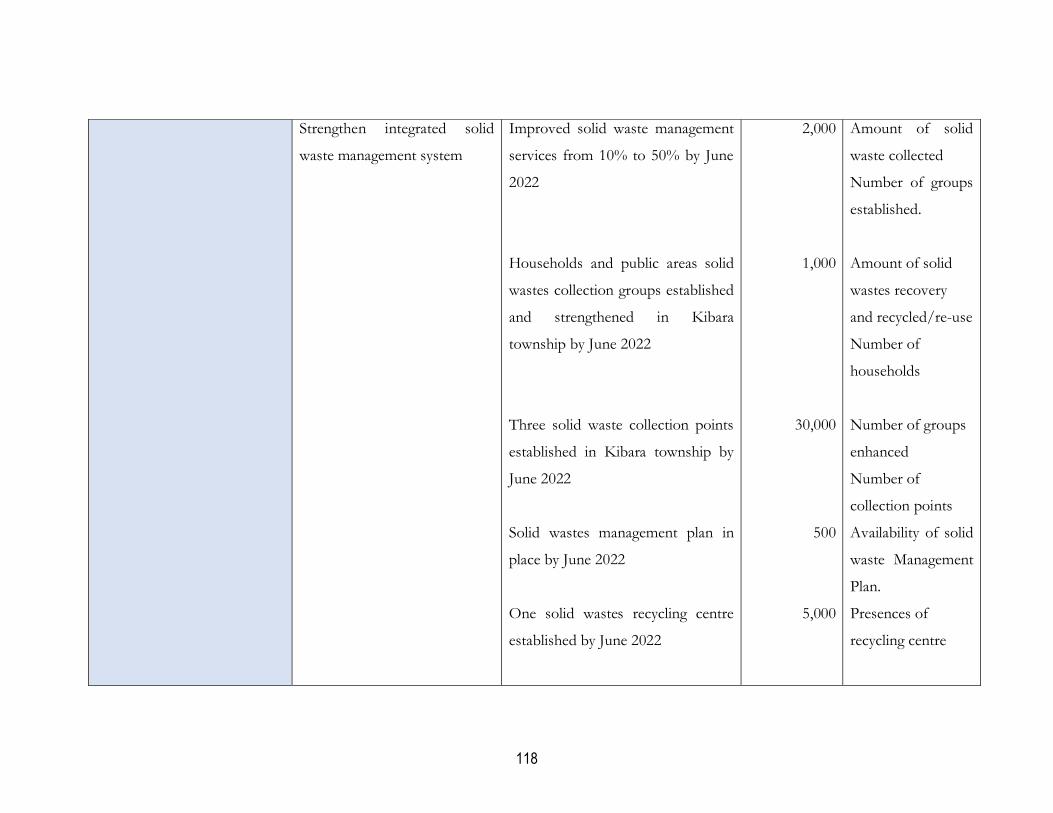
118
Strengthen integrated solid
waste management system
Improved solid waste management
services from 10% to 50% by June
2022
Households and public areas solid
wastes collection groups established
and strengthened in Kibara
township by June 2022
Three solid waste collection points
established in Kibara township by
June 2022
Solid wastes management plan in
place by June 2022
One solid wastes recycling centre
established by June 2022
2,000
1,000
30,000
500
5,000
Amount of solid
waste collected
Number of groups
established.
Amount of solid
wastes recovery
and recycled/re-use
Number of
households
Number of groups
enhanced
Number of
collection points
Availability of solid
waste Management
Plan.
Presences of
recycling centre
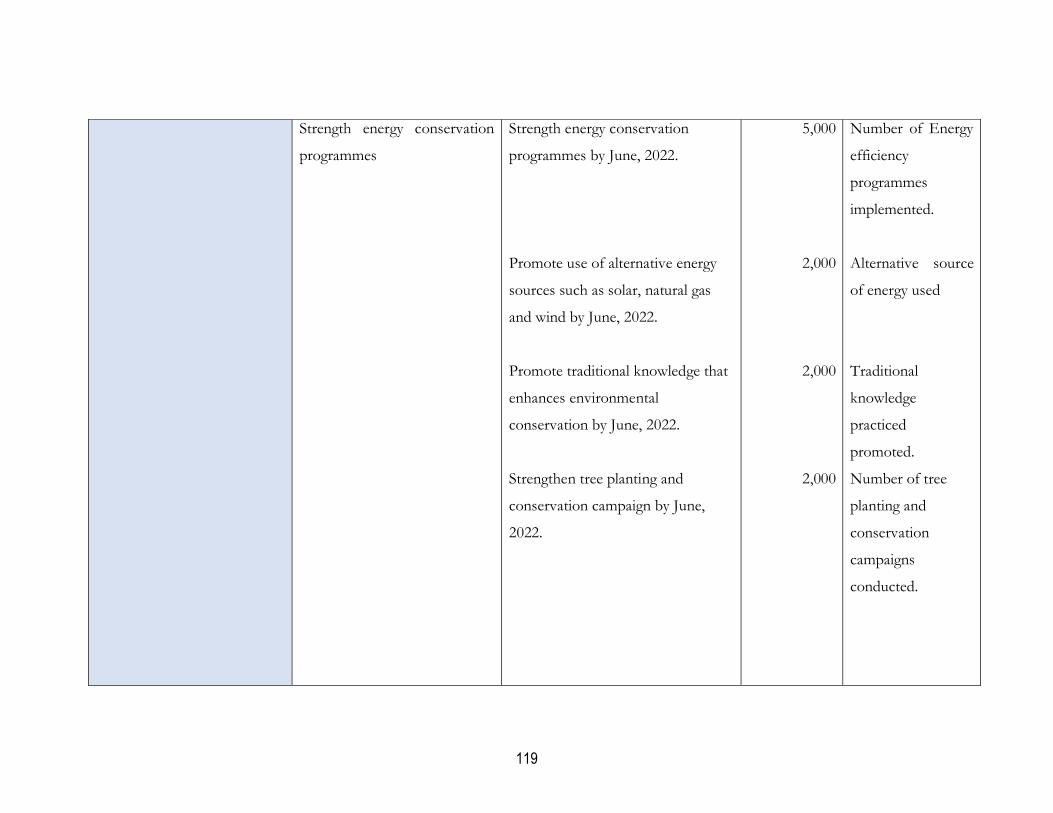
119
Strength energy conservation
programmes
Strength energy conservation
programmes by June, 2022.
Promote use of alternative energy
sources such as solar, natural gas
and wind by June, 2022.
Promote traditional knowledge that
enhances environmental
conservation by June, 2022.
Strengthen tree planting and
conservation campaign by June,
2022.
5,000
2,000
2,000
2,000
Number of Energy
efficiency
programmes
implemented.
Alternative source
of energy used
Traditional
knowledge
practiced
promoted.
Number of tree
planting and
conservation
campaigns
conducted.
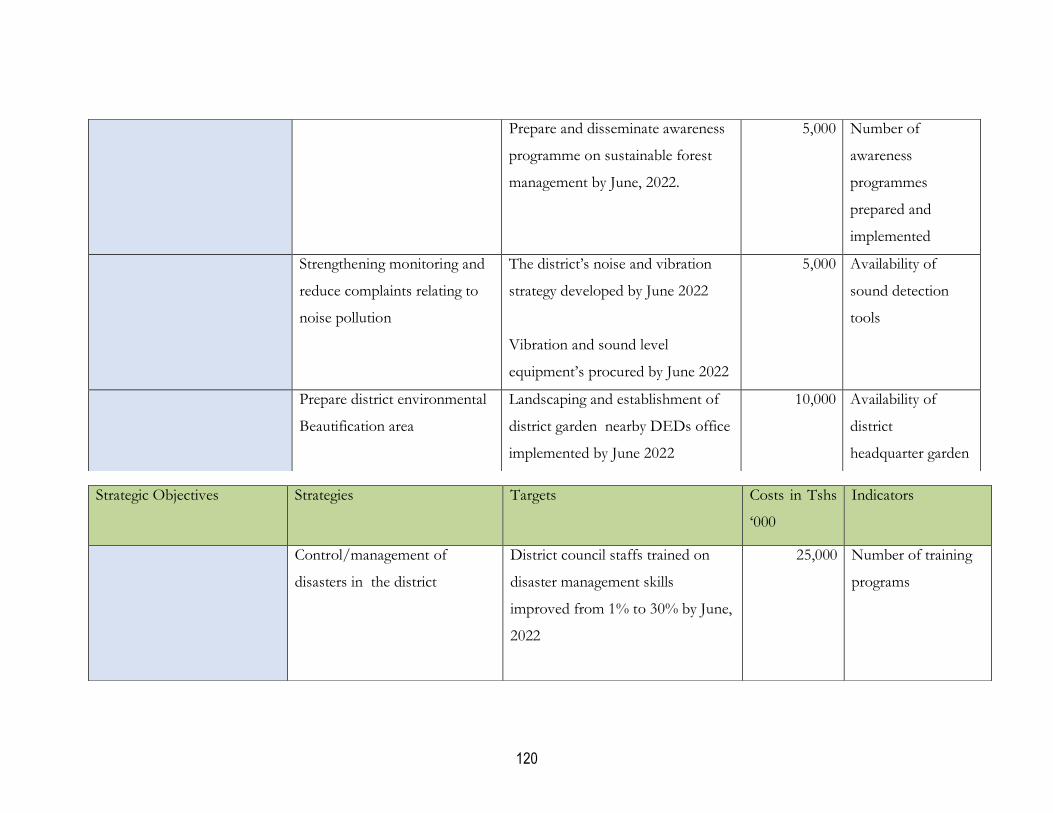
120
Prepare and disseminate awareness
programme on sustainable forest
management by June, 2022.
5,000 Number of
awareness
programmes
prepared and
implemented
Strengthening monitoring and
reduce complaints relating to
noise pollution
The district’s noise and vibration
strategy developed by June 2022
Vibration and sound level
equipment’s procured by June 2022
5,000 Availability of
sound detection
tools
Prepare district environmental
Beautification area
Landscaping and establishment of
district garden nearby DEDs office
implemented by June 2022
10,000 Availability of
district
headquarter garden
Strategic Objectives Strategies Targets Costs in Tshs
‘000
Indicators
Control/management of
disasters in the district
District council staffs trained on
disaster management skills
improved from 1% to 30% by June,
2022
25,000
Number of training
programs
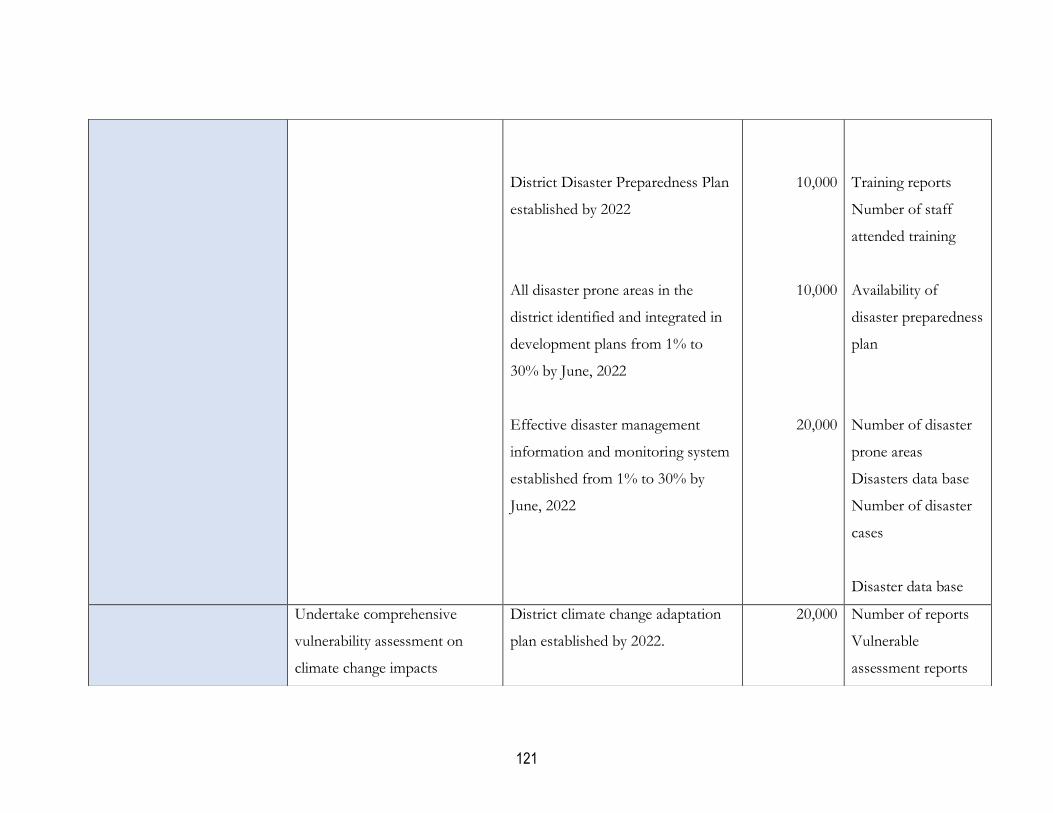
121
District Disaster Preparedness Plan
established by 2022
All disaster prone areas in the
district identified and integrated in
development plans from 1% to
30% by June, 2022
Effective disaster management
information and monitoring system
established from 1% to 30% by
June, 2022
10,000
10,000
20,000
Training reports
Number of staff
attended training
Availability of
disaster preparedness
plan
Number of disaster
prone areas
Disasters data base
Number of disaster
cases
Disaster data base
Undertake comprehensive
vulnerability assessment on
climate change impacts
District climate change adaptation
plan established by 2022.
20,000
Number of reports
Vulnerable
assessment reports
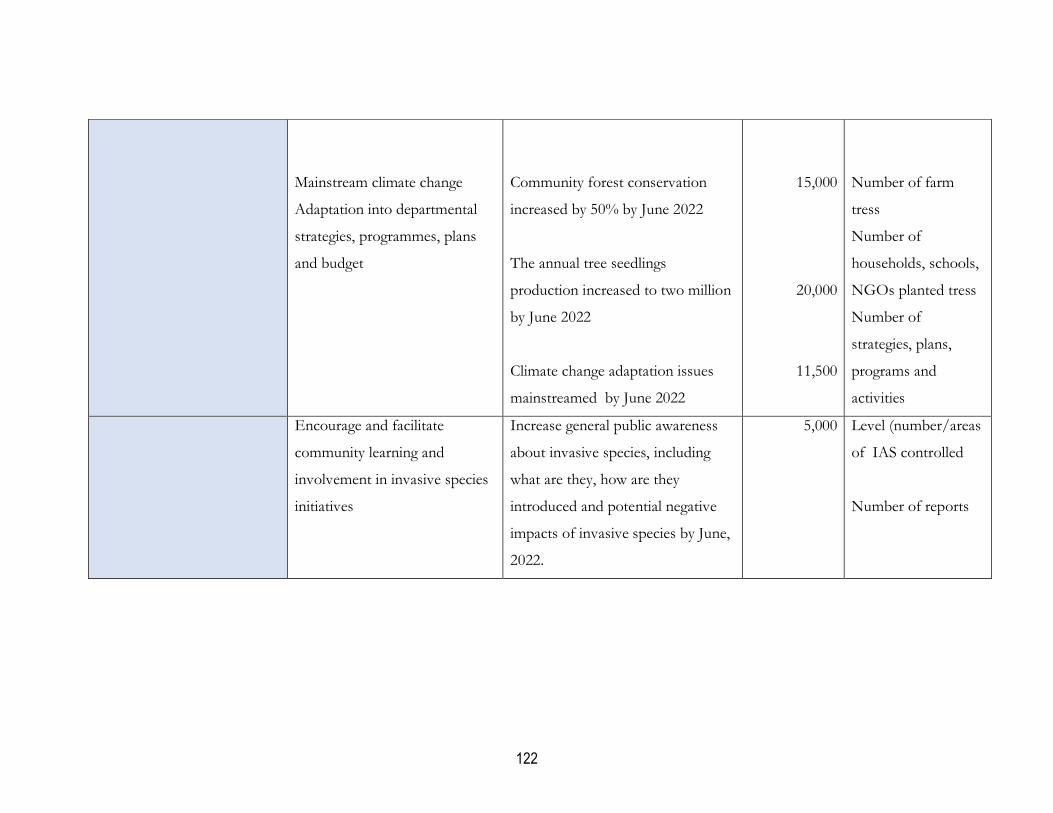
122
Mainstream climate change
Adaptation into departmental
strategies, programmes, plans
and budget
Community forest conservation
increased by 50% by June 2022
The annual tree seedlings
production increased to two million
by June 2022
Climate change adaptation issues
mainstreamed by June 2022
15,000
20,000
11,500
Number of farm
tress
Number of
households, schools,
NGOs planted tress
Number of
strategies, plans,
programs and
activities
Encourage and facilitate
community learning and
involvement in invasive species
initiatives
Increase general public awareness
about invasive species, including
what are they, how are they
introduced and potential negative
impacts of invasive species by June,
2022.
5,000 Level (number/areas
of IAS controlled
Number of reports

81
CHAPTER FIVE
MONITORING AND EVALUATION
5.1 INTRODUCTION
Monitoring and Evaluation (M&E) of the Councils Strategic Plan is designed to ensure
effective and efficient implementation of the plan as well as sustainability of the intended
impacts. The M&E system is instituted as a review mechanism to monitor the
implementation progress and assess outcomes compared to the vision and objectives.
While, monitoring refers to the tracking of the progress of implementation of the Strategic
Plan evaluation, on the other hand, is a critical and objective appraisal of the overall Strategic
Planning Process at the Council in the form of specific milestones of achievement. This
chapter describes the adopted Monitoring and Evaluation System for the Bunda District
Council strategic planning process and activities.
5.2 MONITORING
Monitoring of the Council Strategic Plan will be the overall responsibility of the Council’s
Management team. The District Executive Director shall appoint a responsible officer who
will be behind the implementation of the plans on the day-to-day basis.
The officer responsible for the plan implementation shall:
i. Prepare and issue monitoring and reporting guidelines to all staff who will be
involved in the implementation and the audit exercise. Specifically, a data
collection instrument will need to be prepared.
ii. Disseminate (to lower and higher levels) relevant information received and
collected from stakeholders. This information will mainly be on the external
impacts and context/external environment. Organize management meetings for
presentation of quarterly implementation reports.
82
a) Methodology
Monitoring will be instituted immediately after starting the implementation of the Strategic
Plan. Three major methods will be used by the Secretariat:
(i) Preparation of detailed budgets and annual work plans showing quarterly
targets and reporting the extent to which the accomplishment of the work
plan are being met using the format given; refer Appendix i & ii
(ii) Physical observations and interviews/discussions between the Secretariat and
the various stakeholders.
(iii) Regular inspection of the development projects by the Council Management
on implementation and management.
(b) Reporting
Monitoring reports will comprise of:
(i) A narrative Strategic Plan implementation report plus a summary table prepared
once every six months using the format given; refer appendix i & ii
(ii) Contents of the narrative report will include but not be limited to:
The approved Strategic Objectives and their target indicators,
o Approved strategies, activities and outputs related to the strategic objectives,
o Achievements in terms of outputs, the deviations in the planned activities and
outputs. Achievements should reflect both the qualitative and quantitative
achievements,
o Constraints in the implementation of the strategic plan and any internal and
external factors which affected implementation,
o Proposed remedial actions and the way forward for solving the problems faced
indicating clearly the planned activities to be carried out in the next period (six
months, and one year depending on the nature of the report).
There will be two six monthly reports per annum; one covering the period from July to
December and the other for January to June. However, when reporting on
implementation of the January to June report, the reporting unit will also reports the
whole year’s achievements as well as what activities have been planned for the next
financial year.
83
The reports from the Secretariat shall include but not be limited to the following: -
❑ Quarterly, Six monthly and annual reports on the implementation and achievements of
the Council Strategic Plan,
❑ Physical observations and interviews included as part of the annual reports, and
❑ Summary of the major recommendations for improving the rolling of the Strategic Plan,
preparing annual operating plan for the subsequent year and the implementation and
monitoring process in the subsequent year.
5.3 EVALUATION
5.3.1 Types and Aspects of Evaluation
There will be two types of evaluations of the Strategic Plan implementation at COUNCIL.
Every year using internal evaluators and another once in the mid-term use an external
evaluation team working with an internal evaluator. Prior to coming of the external evaluators
the internal evaluators will have to give their opinion on the progress of implementation of
the strategic plan, the basis for which the external evaluators would wish to validate. Towards
the end of the five years’ period, a final evaluation shall be undertaken using an external
evaluator.
6.3.2 Terms of Reference (ToR) for external evaluators
The Council shall prepare clear and comprehensive terms of reference to guide the
evaluation. The ToRs for the evaluations shall cover but not be limited to:
❑ Subject of the evaluation
❑ Methodology to be adopted: data collection procedures, sampling procedures,
indicators to be used, basis for comparisons, etc.
❑ Analysis of the field findings
❑ Evaluation of the achievements
❑ Feeding back of evaluation findings

84
Both the internal and external evaluators will have the mandate to decide on other additional
issues to be included or evaluated and agree with DED in advance. This will be agreed at the
first de-briefing meeting between the Council management and the evaluators.
Selecting the appropriate evaluators will consider relevant technical skills, evaluation skills
and experience in similar organizations/assignments. Both the internal evaluation team and
External Evaluation team shall be approved by the DED.
The evaluation reports will be discussed quarterly by Council Management team meetings.
The recommendations adopted will be implemented and included in the rolled over Strategic
Plan.

85
Appendix i
PROGRESS REPORT ON THE IMPLEMENTATION OF THE STRATEGIC
PLAN
Progress Report on the Implementation of the Strategic Plan
For the Period covering. ………………………….. to ……………….…….
Strategic Objectives
No…………………………………………………………………………
Planned Indicators/Targets
………………………………………………………………………………………
……………………………....................................................................................................
Strategic
Objective
Planned Achievements Planned
Remedial
Action
Planned
Strategies
Planned
Activities
Performed
Activities
Targets
Achieved
Reasons for
Deviation
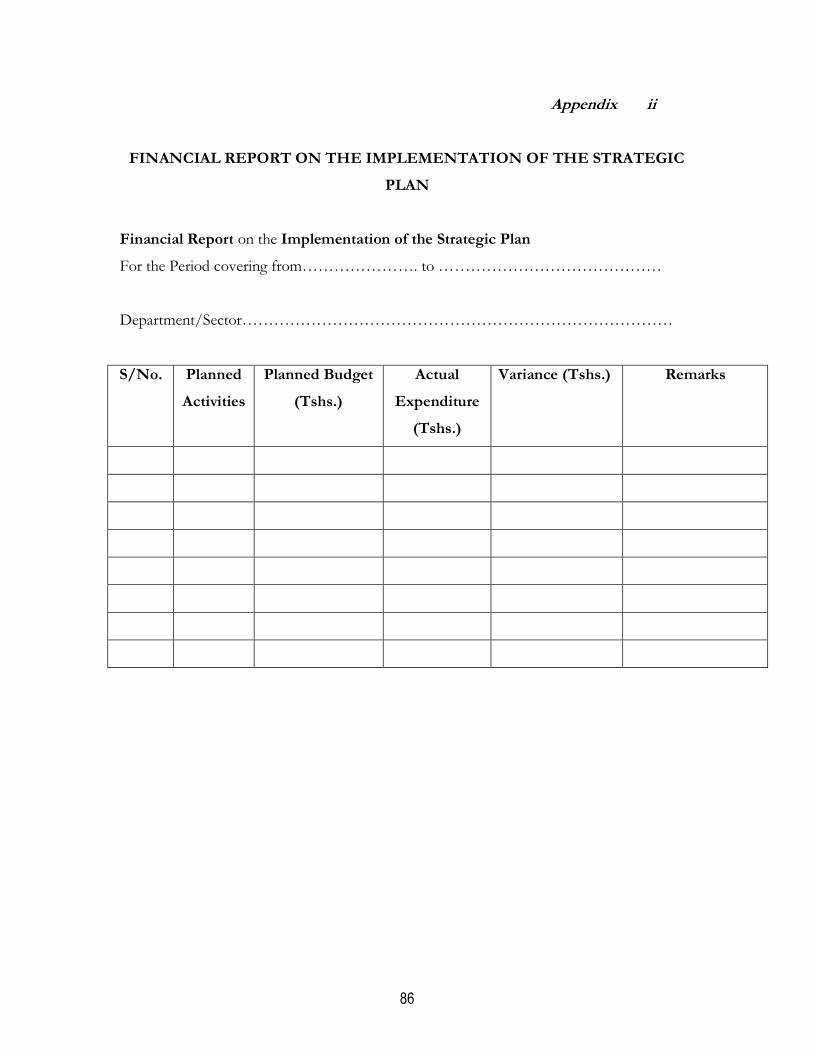
86
Appendix ii
FINANCIAL REPORT ON THE IMPLEMENTATION OF THE STRATEGIC
PLAN
Financial Report on the Implementation of the Strategic Plan
For the Period covering from…………………. to ……………………………………
Department/Sector………………………………………………………………………
S/No. Planned
Activities
Planned Budget
(Tshs.)
Actual
Expenditure
(Tshs.)
Variance (Tshs.) Remarks