Embed Size (px)
Citation preview
Bulletin of the Seismological Society of America. Vol. 53, No. 1, pp. 15-26. January, 1963
CONCURRENT STORMS OF LONG AND ULTRALONG
PERIOD MICROSEISMS
BY JAcK OLIw~ A~D ROBERT PAGE
ABSTRACT
Storms of u l t ra long period (14-18 seconds) microseisms are shown to be concurrent wi th s torms of the more famil iar long period (7-9 seconds) microseisms, and to be re la ted to the same meteorological dis turbances . D a t a from Palisades, New York, were analyzed for two cases, one for a meteorological s torm over the nor theas te rn Pacific and one for a meteorological s torm in the nor thwes te rn At lant ic . The conclusions are based on correlat ion of cont inuous spectral analyses of the concurrent microseism storms, and on ground part icle mot ion studies.
The periods of the u l t ra long period microseisms at any given t ime are, wi thin the precision of the measurements , twice the periods of the long period microseisms at t h a t t ime.
IIX-TRODUCTION
This paper describes a study of microseisms of ultralong periods, i.e., periods between about 14 and 18 seconds, generated by meteorological disturbances off the Alaskan and Labrador coasts and recorded at Palisades, New York. Of particular interest is that these storms are concurrent with storms of the more familiar micro- seisms of long periods, i.e., periods between about 7 and 9 seconds, and apparently are related to the same meteorological disturbances. The periods of the ultralong period microseisms appear to be just twice that of the long period micreseisms.
This is apparently the first time that microseism storms in these two period ranges have been related. Earlier studies of the ultralong period microseisms are few in number (Banerji, 1930; Oliver and Ewing, 1957; Pomeroy, 1959; Oliver, 1962), but they demonstrate that the seismic waves are generated, at least in seine cases, by ocean swell of the same periods incident upon a coastline, and that the microseisms may then propagate, primarily as Rayleigh waves, with amplitudes sufficiently large that they may be detected at long distances from the source. One such storm was detected throughout most of the world (Oliver, 1962). Ultralong period storms generated by meteorological disturbances off the east coast of North America have been detected as far inland as St. Louis. There have been no studies prior to this one of ultralong period microseisms generated by storms off the west coast of North America.
Earlier studies (Donn, 1954) of only the long period microseisms showed that, on occasion, Palisades records storms of waves with very regular character, with periods of 8 to 9 seconds, and with particle motion indicative of tlayleigh waves approaching from a northwesterly direction. Similar waves, usually of slightly shorter periods, sometimes are observed, and these approach Palisades from a northeasterly direc- tion. These types of long period microseisIns were shown to be associated with mete- orological disturbances in the northeastern Pacific and northwestern Atlantic oceans, respectively. Since these facts became known, many similar storms have been ob- served at Palisades, usually during the winter and usually lasting from one to several days. They are readily distinguishable on the basis of the above characteristics and are a feature well known to observers at Palisades, so that once adequate informa-
18
16 B U L L E T I N OF T H E S E I S M O L O G I C A L S O C I E T Y OF A M E R I C A
tion became available on the ultralong period microseisms, association with this particular type of storm of long period rnicroseisms was fairly obvious.
In order to demonstrate this association more thoroughly, and to examine the propagation of the ultralong period microseisms further, the seismic data for the two storms were analyzed in a number of ways. Photographic traces from Palisades were studied to determine arr~plitude variation with time, and, where possible, par- ticle motion. The latter was difficult, however, because the sharply tuned instru- ments that detect the ultralong period microseisms best have severe phase shifts in this period range, and these are not well known for the interval which was studied. Palisades also records three components of earth motion on magnetic tape. These records may be filtered on playback to provide records corresponding, within limits, to any instrumental response desired. Visible records obtained from magnetic tapes were used to determine ultralong period particle motion, as were photographic records collected by the Geotechnical Corporation at a site near Vernal, Utah. The particle motion in these ultralong period microseisms is somewhat erratic. Fro- quently large amplitudes on one component appear at a time of low amplitudes on one or both of the others, suggesting interference effects of some sort. When these effects are small, however, the particle motion is consistent with l~ayleigh wave propagation from the direction of the meteorological disturbance.
The output of the magnetic tape playback was also analyzed in a spectrograph, a device which gives a continuous spectral analysis of the ground motion as a func- tion of time (Ewing etal., 1959). This part of the study clearly demonstrates the near coincidence in time of the two kinds of microseisms within each storm, and gives, quantitatively, the periods of the spectral peaks and some estimate of the band width.
The ultralong period microseisms are of interest partly because little is known of the background noise in this portion of the spectrum, and partly because of their relation to long period microseisms. Relationships such as that found here should help to clarify our understanding of the mechanisms which generate storm micro- seisms.
INST~U~ENTATIO~,T
The long period microseisms associated with the storms studied in this paper were recorded by virtually all the many instruments at the Palisades station. The ultra- long period microseisms were detected by two types of seismographs. One of these, operated during the winter months, is the 30-1C0 P2F* configuration which has a high magnification in the period range of the ultralong period mieroseisms and a low magnification in the period range of the long period microseisms. This um~sual response results in good capability for detection of ultralong period microseisms, but it carries with it the aforementioned phase shifts which hinder precise studies of ground motion.
The second type of instrument which detected the ultralong period microseisms is the Columbia seismometer which records on magnetic tape and which has a free
* Instrument designations used here generally consist of two numbers; the first is the free period of the seismometer, the second is the free period of the galvanometer. For instruments with unusual response characteristics, additional numbers or letters are used. See Pomeroy and Sutton (1960) for details of this instrument.
LONG AND ULTRALONG PERIOD MICROSEISMS 17
period of 15 seconds. Since June 1961 the amplified output from a set of three of these seismometers at Palisades has been recorded almost continuously. Playback of the tapes provides a signal in the form of an electrical voltage which may be sub- jeered to various kinds of filtering and other analytical procedures.
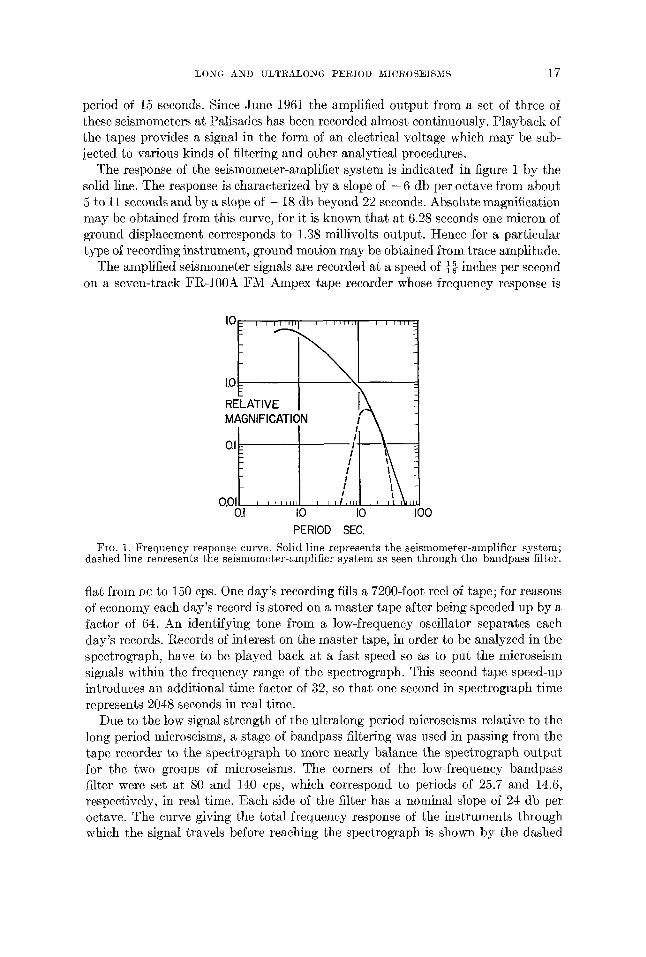
The response of the seismometer-amplifier system is indicated in figure 1 by the solid line. The response is characterized by a slope of - 6 db per octave from about 5 to 11 seconds and by a slope of - 18 db beyond 22 seconds. Absolute magnification may be obtained from this curve, for it is known that at 6.28 seconds one micron of ground displacement corresponds to 1.38 millivolts output. Hence for a particular type of recording instrument, ground motion may be obtained from trace amplitude.
The amplified seismometer signals are recorded at a speed of 1 s • • 6- inches per second on a seven-track FR-100A FM Ampex tape recorder whose frequency response is
I 0 1 : ' ' ' ' " " 1 , ' , . . . . . . . . . . . ~1
RELAT,VE I I.k 7 MAGNIFICATION / \ 4 I /Iq
I o.oll- , , , , , , ,J ,,,,,,,] , 0.I 1.0 I0 I00
PERIOD SEC. FIG. 1. Frequency response curve. Solid line represents the seismometer-amplifier system;
dashed line represents the seismometer-amplifier system as seen through the bandpass filter.
fiat from PC to 150 cps. One day's recording fills a 7200-foot reel of tape; for reasons of economy each day's record is stored on a master tape after being speeded up by a factor of 64. An identifying tone from a low-frequency oscillator separates each day's records. Records of interest on the master tape, in order to be analyzed in the spectrograph, have to be played back at a fast speed so as to put the microseism signals within the frequency range of the spectrograph. This second tape speed-up introduces an additional time factor of 32, so that one second in spectrograph time represents 2048 seconds in real time.
Due to the low signal strength of the ultralong period microseisms relative to the long period microseisms, a stage of bandpass filtering was used in passing from the tape recorder to the spectrograph to more nearly balance the spectrograph output for the two groups of microseisms. The corners of the low-frequency ban@ass filter were set at 80 and 140 cps, which correspond to periods of 25.7 and 14.6, respectively, in real time. Each side of the filter has a nominal slope of 24 db per octave. The curve giving the total frequency response of the instruments through which the signal travels before reaching the spectrograph is shown by the dashed
18 ]~ULLETIN OF THE SEISMOLOGICAL SOCIETY OF AMERICA
line in figure 1. Note that the filtering has the effect of decreasing the amplitude of an 8-second signal by a factor of about three relative to a 16-second signal.
The sPectrograph used in this study was a modified Kay Electric Company Missilyzer. At the time this work was done, the modifications to the Kay Mis- silyzer included a second stage of filtering to increase resolution, a more stabilized filament power supply, and an increase in the automatic gain control to keep more of the signal within the dynamic range of the facsimile paper. For more details about this type of modified commercial sound spectrograph, and for an early appli- cation of this technique to seismology, refer to M. Ewing et al. (1959).
In this study input signal samples of 20 seconds duration were analyzed in the range of 5 to 500 cps; that is, in terms of real time, 11-hour intervals of seismometer recording were analyzed in the period range from about 410 to 4 seconds.
DATA ANALYSIS
Storm of November 18-14
On the Palisades seismograms of November 12th through November 14th, a very conspicuous long period microseism storm was recorded by the standard Columbia 12-15, 15-75, and 30-100 seismographs. The ultralong period micro- seisms of this storm were visible on the filtered 30-100P2F seismograms. The ap- parent coincidence of the build-up of the long and ultralong period microseisms on the photographic sesimograms suggested that the two groups of microseisms were related to the same source, presumably a meteorological storm. To obtain a more graphic and detailed analysis of the build-up, duration and fall-off of the two micro- seism groups, tape-recorded data were analyzed with the modified Kay Missilyzer.
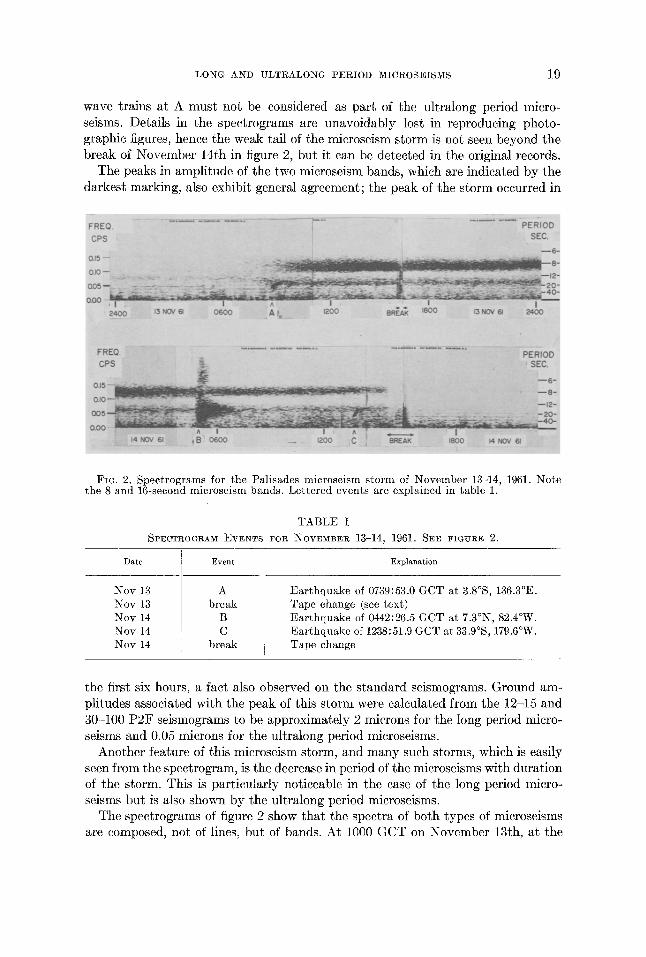
The spectrograms for the days of November 13th and 14th are reproduced in figure 2. In this figure there are three obvious horizontal bands. The uppermost band corresponds to microseisms with periods of about 8 seconds; the middle band to microseisms with periods of about 16 seconds; and the lowermost band to low- frequency noise from the tape recordings or the spectrograph itself. The lowermost marking on the spectrogram, the base line, represents the line of zero frequency. Frequency is plotted linearly on the vertical axis, as the scale to the left of the record indicates. This left-hand scale is a calibration record obtained by analyzing a recording composed of 100, 200, and 300 cps signals from a low-frequency os- cillator. The numbers assigned to the scale marks give frequency in real time. The right-hand scale indicates period in seconds in real time. Amplitude of a given fre- quency is a function of the darkness of the trace.
The horizontal axis gives time interrupted by "breaks" which correspond to the daily interruption in the tape recording when the tape is changed. Time is marked on the record in six-hour intervals. The letters along the time axis refer to various earthquakes, a key to which is found in table 1. Dispersion in certain of the earth- quake phases is obvious; and this feature usually aids in the identification of the event as an earthquake.
The conspicuous events on this spectrogram, if electronic noise and earthquakes are disregarded, are the two bands of mieroseisms. The near coincidence of the beginnings and endings of these two bands is striking. Note that the two Rayleigh
LONG AND ULTRALONG PERIOD MICROSEISMS 19
wave trains at A must not be considered as part of the ultralong period micro- seisms. Details in the spectrograms are unavoidably lost in reproducing photo- graphic figures, hence the weak tail of the microseism s torm is not seen beyond the break of November 14th in figure 2, but it can be detected in the original records.
The peaks in ampli tude of the two microseism bands, which are indicated by the darkest marking, also exhibit general agreement; the peak of the s torm occurred in
FIG. 2. Spectrograms for the Palisades microseism storm of November 13-14, 1961. Note the 8 and 16-second microseism bands. Lettered events are explained in table 1.
TABLE I SPECTROGRAM EVENTS FOR NOVEMBER 13-14, 1961. SEE FIGtrRE 2.
Date Event
Nov 13 A Nov 13 break Nov 14 B Nov 14 C Nov 14 break
Explanation
Earthquake of 0739:53.0 GCT at 3.8°S, 136.3°E. Tape change (see text) Earthquake of 0442:26.5 GCT at 7.3°N, 82.4°W. Earthquake of 1238:51.9 GCT at 33.9°S, 179.6°W. Tape change
the first six hours, a fact also observed on the standard seismograms. Ground am- plitudes associated with the peak of this s torm were calculated from the 12-15 and 30-100 P2F seismograms to be approximately 2 microns for the long period micro- seisms and 0.05 microns for the ultralong period microseisms.
Another feature of this microseism storm, and many such storms, which is easily seen from the spectrogram, is the decrease in period of the microseisms with duration of the storm. This is particularly noticeable in the case of the long period micro- seisms but is also shown by the ultralong period microseisms.
The spectrograms of figure 2 show that the spectra of both types of microseisms are composed, not of lines, but of bands. At 1000 G C T on November 13th, at the
20 BULLETIN OF THE SEISMOLOGICAL SOCIETY OF AMERICA
beginning of the storm, the period associated with the peak corresponding to the long period microseism band was 8.3 seconds; at 24(]0 G C T the same day, this peak had shifted to 8.1 seconds and, near the end of the s torm at 12(]0 G C T on
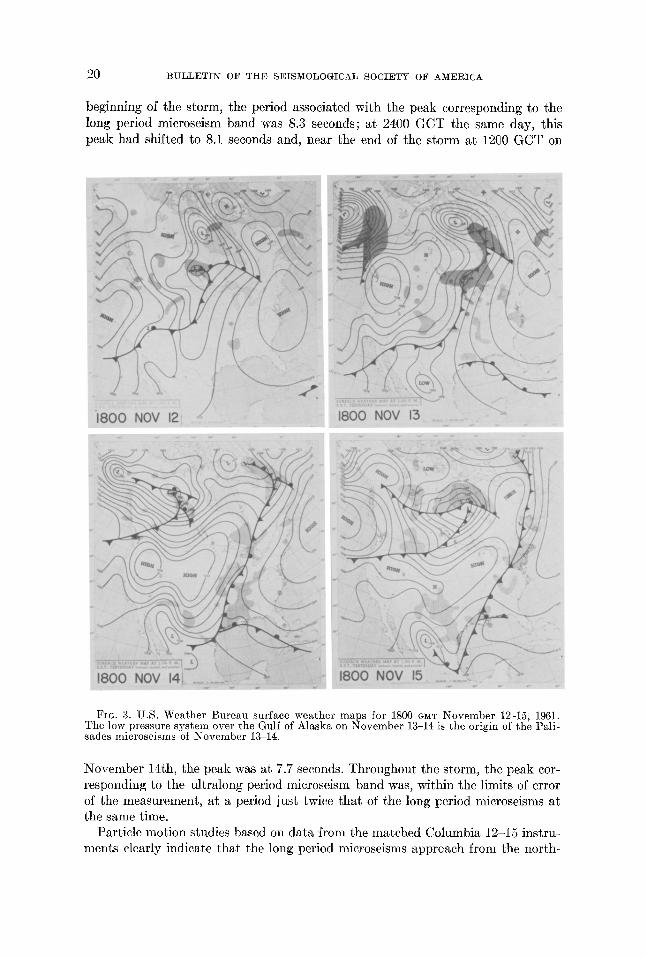
FIG. 3. U.S. Weather Bureau surface weather maps for 1800 GMT November 12-15, 1961. The low pressure system over the Gulf of Alaska on November 13-14 is the origin of the Pali- sades microseisms of November 13-14.
November 14th, the peak was at 7.7 seconds. Throughout the storm, the peak cor- responding to the ultralong period microseism band was, within the limits of error of the measurement, at a period just twice tha t of the long period microseisms at the same time.
Particle motion studies based on data from the matched Columbia 12-15 instru- ments clearly indicate tha t the long period microseisms approach from the north-
L O N G A N D U L T R A L O N G P E R I O D M I C R O S E I S M S 21
west, if Rayleigh wave propagation is assumed. To study particle motion of the ultra- long period microseisms at Palisades, graphic records for the three tape-recorded seismometers were produced on a Sanborn rectilinear strip recorder. Two stages of filtering between the tape recorder and the Sanborn recorder attenuated the long period microseisms so that the ultralong period microseisms could be studied more easily. In addition to the Sanborn records, microfilm records from the temporary Geotechnical Corporation seismograph station near Vernal, Utah, were used. The records from both locations exhibited erratic behavior among the three components for the ultralong period microseisms, i.e., when one component recorded the waves with large amplitudes, one or both of the other components frequently recorded small amplitudes. However, when simultaneous wave trains could be found on all three components, the indicated direction of wave approach was predominantly northwest. Thus the particle motion studies provide additional evidence that the two types of microseisms have a common source.
United States Weather Bureau surface weather maps for November 12th through November !5th are presented in figure 3. The low pressure system responsible for this microseism storm is clearly that situated in the Gulf of Alaska. By 1800 GCT on November 13th, when the microseisms at Palisades were near their peak, the low pressure system was well developed and the center was just off the coast. By 18(70 GCT on November 14th the low had passed onto the shore and weakened in in- tensity, and the Palisades microseisms had essentially disappeared. There were no strong low pressure systems in the North Atlantic area at this time.
Long period microseisms associated with cyclonic patterns over the Gulf of Alaska and recorded over much of North America have been reported by Donn (1954), by Carder (1955), and by others; but no mention of ultralong period micro- seisms: associated with these storms has been made previously, apparently because of unfavorable instrumental response.
Storm of December 6-12
A second nficroseism storm characterized by a double-peaked spectrum was observed at Palisades from December 6th through 12th, 1961. As was the case for the November storm, the first hint of a double-peaked spectrum appeared in exami- nation of the seismograms of the Palisades 12-15 and 30-100P2F seismometers. To investigate the spectrum of the storm as a function of time, the magnetic tape data were analyzed in the same manner as data from the November 13-14th microseism storm.
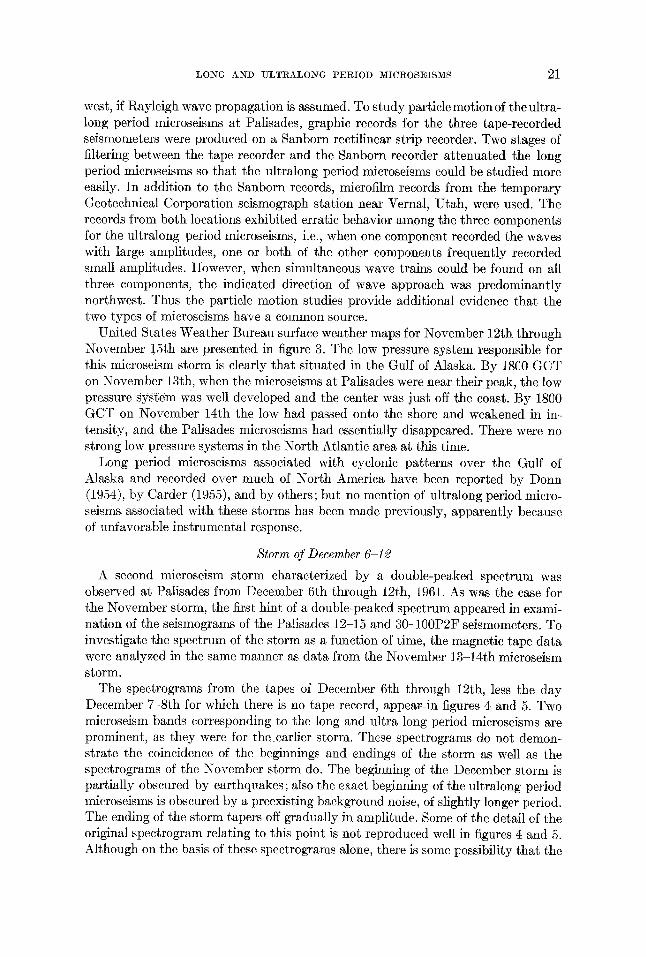
The spectrograms from the tapes of December 6th through 12th, less the day December 7-8th for which there is no tape record, appeardn figures 4 and 5. Two microseism bands corresponding to the long and ultra long period microseisms are prominent, as they were for the earlier storm. These spectrograms do not demon- strate the coincidence of the beginnings and endings of the storm as well as the spectrograms of the November storm do. The beginning of the December storm is partially obscured by earthquakes; also the exact beginning of the ultralong period microseisms is obscured by a preexisting background noise, of slightly longer period. The ending of the storm tapers off gradually in amplitude. Some of the detail of the original spectrogram relating to this point is not reproduced well in figures 4 and 5. Although on the basis of these spectrograms alone, there is some possibility that the
22 B U L L E T I N OF TIzIE SEISMOLOGICAL SOCIETY OF AMERICA
FIo. 4 and 5. Spectrograms for the Palisades microseism storm of December 6-12, 1961. Two bands of microseisms are apparent at about 8 and 16 seconds. Lettered events are explained in table II.
ultralong period microseisms begin somewhat earlier and continue somewhat after the long period microseisms have died out, a more reasonable explanation is tha t there is good coincidence between the two, with some background noise in the 15 second-plus region. This conclusion is strengthened by the similarity of the varia- tions of amplitudes of the two types of microseisms with time.
LONG AND ULTRALONG PERIOD MICROSEISMS 23
The peak in microse ism amp l i t udes occurs on D e c e m b e r 8 th and the g round mo- t ion amp l i t udes assoc ia ted wi th th is peak are a p p r o x i m a t e l y 5 microns for t he long per iod microseisms and a b o u t 0.1 microns for the u l t r a long per iod microseisms.
As wi th the N o v e m b e r 13-14th microse ism s torm, bo th t he long and u l t r a long per iod microseisms decrease s l igh t ly in per iod wi th t ime in the l a t t e r p a r t of t he s to rm. The per iods cor responding to the peaks of the long per iod microse ism b a n d
TABLE I I SPECTROGRAM EVENTS FOR DECEMBER 6--12, 1961. SEE FIGURES 4 AND 5.
Date Ev ent Explanation
Dec 6
Dec 6
Dec 6
Dec 7 Dec 9
Dee 9
Dec 9
Dec 9
A
B
C
D E
F
G
H
Earthquake of 0548:39.3 GCT December 6 at 13.7°N, 93.6°E.
Earthquake of 1335:43.8 GCT December 6 at 23.5°S, 176.0°W.
Earthquake of 1639:31.5 GCT December 6 at 49.4°N, 155.2°E.
Earthquake Earthquake of 0215:22.0 GCT December 9 at 56.3°N,
153.9°W. Earthquake of 0358:55.4 GCT December 9 at 14.9°S,
75.7°W. Earthquake of 1118:08.9 GCT December 9 at 43.7°S,
75.2°W. Earthquake
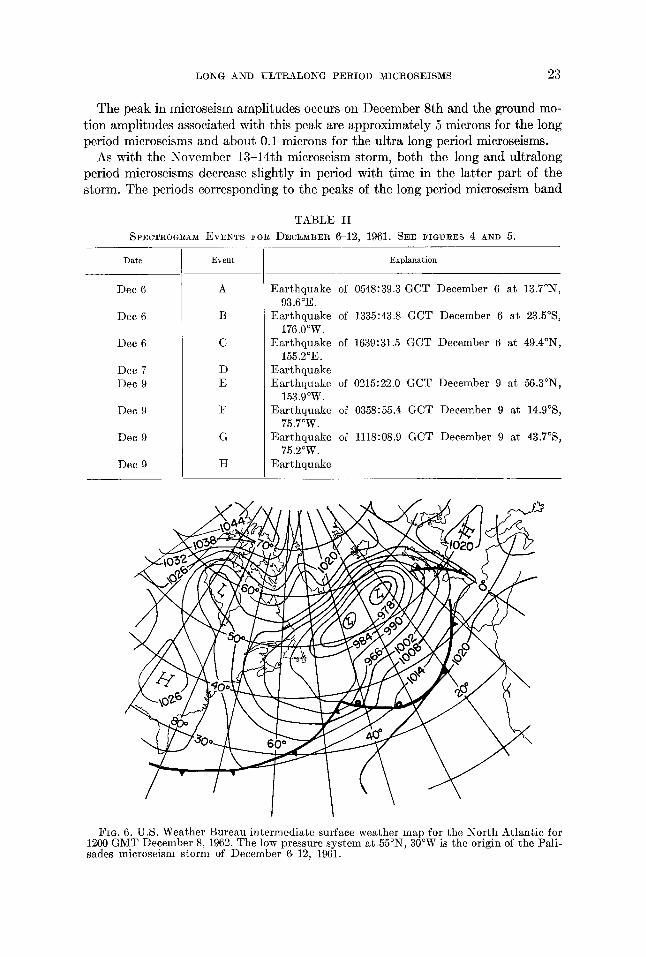
FIG. 6. U.S. Weather Bureau intermediate surface weather map for the North Atlantic for 1200 GMT December 8, 1962. The low pressure system at 55°N, 30°W is the origin of the Pali- sades microseism storm of December 6-12, 1961.
2 4 BULLETIN OF THE SEISMOLOGICAL SOCIETY OF AMERICA
were measured on the spectrograms every day at 12130 GCT; the measured periods are about 7.4 seconds on December 6th, 7.6 seconds on December 7th, 7.8 seconds on December 9th, 7.4 seconds on December 10th, and 7.0 seconds on December l l th . Here the microseism periods have a maximum in the middle of the storm and then decrease with time. Again the period of ultralong period microseisms is twice that of the long period microseisms, within the limits of error of the measurements.
Earthquake events which appear in the spectrograms of December 6th through 12th are designated by letters and are identified in table 2. The daily tape changes, which are made at about 18130 GCT occur, in these figures, at the end of each line.
Under the Rayleigh wave assumption, particle motion studies using the matched Columbia 12-15 and 15-75 seismometers indicate a northeasterly direction of ap- proach for the long period microseisms of this storm. Particle motion studies for the ultralong period microseisms were attempted using tape recorded data. In a six- hour period around 2400 GCT on December 8th, the apparent direction of approach of the ultralong period microseisms was northerly, but the data are only fair.
The surface weather map for the North Atlantic at 1200 GCT on December 8th is reproduced in figure 6. The low pressure system south of Greenland and Iceland is almost certainly responsible for this microseism storm. The development and movement of this low pressure system was traced on consecutiYe weather maps spaced 6 hours apart. At 1800 GCT on December 4th there was a weak low at about 50°W, 35°N. By 1200 GCT on December 5th the low had intensified and moved to 40°W, 40°N. Twenty-four hours later the pressure gradient reached its maximum value for this storm and was centered at 40°W, 45°N. The system gradually weak- ened and passed northeastward and at 1200 GCT on December 8th was as shown in figure 6. At 1200 GCT on December 10th the center was still well-developed and was at a position of 20°W, 55°N. In the following two days the low pressure system dissipated rapidly and the microseisms diminished.
DISCUSSION
In summary the data indicate that, at least for the two storms studied, long and ultralong period microseisms are genetically related to the same meteorological disturbances. This conclusion is based on the striking similarity of the amplitude versus time plots for the two types of microseisms of both storms, on the similarity of the direction of approach of the two types of microseisms of each storm, and on the agreement of this direction with the azimuth to the corresponding meteorologi- cal event.
The nature of the mechanism which generates the long period microseisms, i.e., the mechanism by which energy from the meteorological disturbance is transferred to seismic waves, remains unclear. The present study does not provide a unique answer to this question, which has persisted throughout most of the history of seismology, but it does provide a new kind of information which may aid in the solution.
Previous studies of the ultralong period microseisms showed that they may be generated as a result of the incidence of gravity waves in water upon a coastline, in general agreement with the classical "surf" theory, possibly with minor modi- fications. There is no evidence in the present study to contradict this explanation of the origin of the ultralong period microseisms, nor is a satisfactory alternative
LONG AND ULTRALONG PERIOD MICROSEISMS 25
explanation for their origin known to the authors. For the long period microseisms the situation is more complex. The 2 to 1 ratio of the periods of the two types of microseisms provides some support for the theory of Longuet-Higgins (1950) for his theory predicts this ratio. Some difficulties, however, which have to do with propagation of seismic waves in the 6 to 9-second range across parts of the ocean and particularly across continental margins, remain.
There are other possible mechanisms which could produce the 2 to 1 ratio in periods. Breaking surf is a classical example of a non-linear process and certainly, if generation of the ultralong period waves by surf is accepted, it must be expected that harmonics of these periods will be generated as well. It is difficult to under- stand, though, why the amplitudes of the first harmonic, which would correspond to the long period microseisms, would be so much larger than those of the funda- mental. Details of the mechanism by which the surf transmits energy to seismic waves are not well understood. Effects of propagation on water waves and on seis- mic waves are often ignored in studies of microseisms, yet they must sometimes be of great importance. The present study lacks the resolution in time, and the pre- cision of location of the generating areas, for both the water and seismic waves, that are required to make consideration of the propagation effects worthwhile.
In addition to the study of two selected storms, less detailed examination has been made of data for other similar storms and the results are consistent with those reported here. It should not be taken for granted, however, that the spectra of all storms have the double-peaked character with the 2 to 1 ratio in period emphasized here. An earlier study of 11 to 18-second microseisms generated on the east coast of the U.S. and recorded at Palisades failed to reveal microseisms of one half these periods at that station, although no detailed spectral analyses were made. The study of the worldwide storm of 27-second microseisms provided no conclusive data on the long period microseisms because all stations involved were far from the potential source of these microseisms, and long period microseisms do not propagate to long distances as well as ultralong period microseisms.
Instrumental limitations, particularly low sensitivity at long periods, prevent a thorough investigation of seismic noise with periods greater than about 20 seconds. It is interesting to note, however, that gravity waves in water with periods greater than about 30 seconds are almost never observed in the oceans, so that this source of seismic noise may be negligible for periods greater than about one half minute.
ACKNOWLEDGMENTS
The authors wish to thank Dr. George Sutton and Mr. Paul Pomeroy who designed, in- stalled and supervised the operation of the seismographs which record on magnetic tape, and Dr. Mark Landisman and Mr. Paul Kunsman who produced the much-improved version of the Kay Missilyzer.
The Geotechnical Corporation kindly supplied the records from Vernal, Utah. This research was supported by Air Force Cambridge Research Center under contract
# AF19(604)8375 of the VELA-UNIFORM Program and by the American Chemical Society Grant PRF756~2.
]~EFERENCES
Banerji, S. K. 1930. "NIicroseisms Associated with Disturbed Weather in the Indian Seas," Phil. Trans.
Roy. Soc. London, 229: 287-329.
26 BULLETIN OF THE SEISMOLOGICAL SOCIETY OF AMERICA
Carder, D. S. 1955. "Transmission of Microseisms Across North America and the Western North At-
lantic," Trans. Am. Geophys. Union, 36: 838-842. Donn, W. L.
1954. "Direction Studies Using Microseism Ground-Particle Motion," Trans. Am. Geophys. Union, 35: 821-832.
Ewing, M., S. Mueller, M. Landisman, and Y. Sato 1959. "Transient Analysis of Earthquake and Explosion Arrivals," Geofisica Pura E
Applicata, 44: 83-118. Longuet-tIiggins, M. S.
1950. "A Theory of the Origin of Microseisms," Phil. Trans. Roy. Soc. London, 243: 1-35. Oliver, J.
1962. "A Worldwide Storm of Microseisms with Periods of About 27 Seconds," Bull. Seism. Soc. Am., 52: 507-517.
Oliver, J., and M. Ewing 1957. "Mieroseisms in the 11 to 18 Second Period Range," Bull. Seism. Soc. Am., 47: 111-127.
Pomeroy, P. 1959. "Background and Storm Microseisms in the Period Range 11 to 22 Seconds,"
(abstract) : Am. Geophys. Union Program 40th Annual Meeting. Pomeroy, P. W., and G. H. Sutton
1960. "The Use of Galvanometers as Band-Rejection Filters in Electro-Magnetic Seismo- graphs," Bull. Seism. Soc. Am., 50: 135-151.
LAMONT GEOLOGICAL OBSERVATORY OF COLUMBIA UNIVERSITY PALISADES, NEW YORK LAMONT GEOLOGICAL OBSERVATORY CONTRIBUTION NO. 586
Manuscript received May 8, 1962.


![MICROSEISMS IN THE 11- TO 18-SECOND PERIOD RANGE By …epsc.wustl.edu/~ggeuler/reading/cam_noise_biblio/... · MICROSEISMS IN TEE J_~l- TO ]8-SECOND PERIOD RANGE AODEND~ ;e~t 30 -](https://img.pdfslide.us/doc/110x75/5fa7dc0e97189072eb2bfb5d/microseisms-in-the-11-to-18-second-period-range-by-epscwustleduggeulerreadingcamnoisebiblio.jpg)