Embed Size (px)
Citation preview

/F
Bulletin 45(Part 4 of 5 Parts)
0
THE- SHOCK AND VIBRATION
BULLETIN
Part 4Impact, Packaging and Shipping,
Blast and Impulsive Loading
JUNE 1975
A Publication ofTHE SHOCK AND VIBRATION
INFORMATION CENTERNaval Research Laboratory, Washington, D.C.
Office of---• The Director of DefenseL1. Research and Engineering
82 03 26 074Approved for public release: distribution unfimited.

SYM4POSIUM MANAGEMENT
THE SHOCK AND VENUTION WORMATION CIENTUI
Henry C. Pusey, DirectorEdward H. SchellRudolph H. Volin
J. Gordan Showalter
Iindi •m
Graphic Arts Branch, Technical Informtion DivisiosLNaval Research Laboratory

Bulletin 45(Part 4 of S Parts)
THESHOCK AND VIBRATION
BULLETIN
JUNE 1975
A Publication ofTHE SHOCK AND VIBRATION
INFORMATION CENTERNaval Research Laboratory, Washington, D.C.
The 45th Symposium on Shock and Vibration was heldat the Dayton Convention Center, Dayton. Ohio onOctober 22-25, 1974. The Air Force Flight DynamicsLaboratory. Air Force Materials Laboratory and jAeronautical Systems Division Air Force SystemsCommand, Wright-Patterson AFB, Ohio were the hosts.
ii,
Office of 'The Director of DefenseResearch and Engineering

copylNSa~pL~r
I.....
CONTENTS
PAPERS APPEARING IN PART 4
ImpactEXPLOSIVELY PROPELLED ROTATING PLATES FOR OBLIQUE IMPACT EXPERIMENS'...........I
F. H. Mathews, Sandia Laboratories, Albuquerque, New Mexico
- IMPACT TESTING USING A VARIABLE ANGLE ROCKET LAUNCHER ........................ 13H. W. Nunen, Sandia Laboratories, Albuquerque, New Mexico
-•EVALUATION OF THE SHOCK PULSE TECHNIQUE TO THE UH-I SERIES HELICOPEI"M ......... 19J. A. George, T. C. Mayer and E. F. Covill, Parks College of St. Louis Univmsity, Cabh fllwois
STRUCTURAL RESPONSE MODELING OF A FREE-FALL MINE AT WATER ENTRY'.............. 39R. H. Waser, G. L. Matteson and J. W. Honaker, Naval Surface Weapons Center, W Oak Laboratory,Silver Sprint, Maryland
* PLASTIC DESIGN ANALYSIS OF SHIPBOARD EQUIPMENT SUBJECTED TO SHOCK MOTIONS ...... 47L. T. Butt, Naval Ship Research and Development Center, Underwater Explosion Research Division,Portsmouth, Virginia
Packaging and ShippinF
HIGHWAY SHOCK INDEX (SI) PROCEDURE FOR DETERMINING SIt......................... 53J. H. Grier, Military Traffic Management Command, Transportation Engineerin Agency, NewportNews, Virginia
THE DYNAMIC ENVIRONMENT ON FOUR INDUSTRIAL FORKLIFT TRUCKS' .................. 59M. B. Gens, Sandia Laboratories, Albuquerque, New Mexico
A STATISTICALLY BASED PROCEDURE FOR TEMPERATURE SENSITIVE DYNAMIC CUSHIONINGCURVE DEVELOPMENT AND VALIDATION ........................................ 69
D. McDanie!, U.S. Army Missile Commafld, Redstone Arsenal, Alabama, R. M. W"*dida and M. R.Wilhelm, The University of Alabama, Huntsville, Alabama
A DAVIS GUN PENETRATOR LAUNCH SYSTEM1 ..................................... 81L. 0. Seamons, Sandia Laboratories, Albuquerque, New Mexico
Blast and Impulsive Loading
X-RAY SIMULATION WITH LIGHT-INITIATED EXPLOSIVE' .............................. 87R. A. Benham and F. H. Mathews, Sandia Laboratories, Albuquerque, New Mexico
.STRUCTURAL DYNAMIC RESPONSE TO HEIGHT OF BURST AIR BLAST LOADING . ............ 93H. F. Korman, N. Lipner and J. S. Chiu, TRW Systems Group, Redondo Beach, Camomime
RESPONSE OF FLAT PLATES SUBJECTED TO M'TID IMPULSIVE LOADINGS' ................... 105C. A. Ros, University of Florida Graduate Engineering Center, Eglin Air •rm Ban, Florida and W. S.Strickland, U.S. Air Force Armament Laboratory, Eglin Air Force Base, Florida
iII
JI

-A MATRIX STRUCTURAL DYNAMIC MODEL OF PARACHUTE THERMAL COVER EJECTION BYPYROTECHNIC DEVICES ....................................................... 117
A. E. Barniskis and R. R.omanzi, General Electric Company, Philadelphia, Pennsylvania
-STRUCTUREBORNE GUN BLAST SHOCK TEST USING AN ELECTROHYDRAULIC VIBRATIONEXCITER'; .................................................................. 127
N. D. Nelson, Hughes Aircraft Company, Fullerton, California and R. L. Woodfin, Naval WeaponsCenter, China Lake, California
., DYNAMIC PROPERTIES OF CONCRETE UNDER IMPACT LOADINGj) ........................ 131G. R. Griner, R. L. Sierakowski, and C. A. Ross, Department of Engineering Sciences, University oiFlorida, Gainesville, Florida
X b PCDTING PLATE RESPONSE TO BLAST LOADING% ................................... 143Lt. Col. Robert 0. Meitz and Lt. Philip B. -Alffein-Cade, Air Force Institute of Technology,Wright-Patterson Air Force Base, Ohio
PAPERS APPEARING IN PART 2
ADDRESS OF WELCOMEDr. D. Zonars, Chief Scientist, Air Force Flight Dynamics Laboratory, Wright-Patterson Air Force Base,Ohio
ADDRESS OF WELCOMEMr. George Peterson, Director, Air Force Materials Laboratory, Wright-Patterson Air Force Base, Ohio
KEYNOTE ADDRESSLI. General James L. Stewart, Commander, Aeronautical Systems Division, Wright-Patterson Air ForceBase, Ohio
Invited Papers
STANDARDIZING THE DYNAMICS OF MANDr. H. E. Von Gierke, Aerospace Medical Research Laboratory, Wright-Patterson Air Force Base, Ohio
THE RIVET GYRO STORYMr. John E. Short, Aeronautical Systems Division, Wright-Patterson Air Force Base, Ohio
AVIONICS RELIABILITYLt. Colonel Ben H. Swett, Headquarters, Air Force Systems Command, Andrews Air Force Base,Washington, D.C.
Panel Sessions
MIL-STD-810C
TEST OR ANALYZE?
Seismic
SEISMIC SIMULATOR FOR SILO CONSTRAINED MISSILE GUIDANCE PLATFORMR. L. Felker, Rockwell International Corporation, Anaheim, California
EARTHQUAKE RESPONSE OF COMMUNICATIONS EQUIPMENT IN SMALL BUILDINGSN. J. PeCapua and F. X. Prendergast, Bell Laboratories, Whippany, New Jersey
iv

- . - .- . -- - ' - r . . .. . . ... . .. . . . . .
SEISMIC ANALYSIS OF MOTORS FOR NUCLEAR POWER PLANTSL. J. Taylor, Westinghouse Electric Corporation, Buffalo. New York and N. M. Isha.aSe Uniwvrsity ofNew York at Buffalo, New York
Special Problems
EXTENSION OF CONTROL TECHNIQUES FOR DIGITAL CONTROL OF RANDOM VOIRATION TESTSJ. D. Tebba and D. 0. Smallwood, Sandia Laboratories, Albuquerque. New Mexico
VIBRATION-INDUCED DOPPLER EFFECTS ON AN AIRBORNE SHF COMMUNICATION SYSTEMJ. Pearson and R. E. Thaller, Air Force Flight Dynamics Laboratory, Wright-Patteesms Air Force Base.Ohio
FATIGUE DAMAGE EQUIVALENCE OF FIELD AND SIMULATED VIBRATIONAV ENVIRONMENTSD. D. Kana and D. C. Scheidt, Southwest Research Institute, San Antonio. Texas
AN EVALUATION OF SHOCK RESPONSE TECHNIQUES FOR A SHIPBOARD GAS TUBSNEJ. R. Manceau and F. Nelson, AiResearch Manufacturing Company of Arizona, Plami. Arizona
THE DEVELOPMENT OF A WATER PARTICLE VELOCITY METERJ. D. Gordon, Naval Ship Research and Development Center. Underwater Explouiam mercb Division,Portsmouth, Virginia
PAPERS APPEARING IN PART 3
Aerospace Vehicles
AN EXPERIMENTAL/ANALYTICAL DETERMINATION OF TRANSPORTER LOADS 04 THE VIKINGSPACECRAFT
G. Kachadourian, General Electric Company, Hampton, Virginia
DETERMINATION OF PROPELLANT EFFECTIVE MASS PROPERTIES USING MODAL TEST DATAJ. C. Chen and J. A. Garba, Jet Propulsion Laboratory, Pasadena, California
UNIQUE FLIGHT INSTRUMENTATION/DATA REDUCTION TECHNIQUES EMPLOYED ON THEVIKING DYNAMIC SIMULATOR
F. D. Day, Martin Marietta Aerospace. Denver, Colorado and B. K. Wada. The let PropulsionLaboratory, Pasadena, California
ANALYTICAL PREDICTION AND CORRELATION FOR THE ORBITER DURING THE VIKINGSPACECRAFT SINUSOIDAL VIBRATION TEST
G. R. Brownlee and J. A. Garba, Jet Propulsion Laboratory. Pasadena. California. mad F. D. Day, III,Martin Marietta Aerospace, Denver. Colorado
FAIL SAFE FORCED VIBRATION TESTING OF THE VIKING 1975 DEVELOPMENTAL SPACECRAFrJ. W. Fortenberry, Jet Propulsion Laboratory.. Pasadena, California. and P. Rader. Martin M,ýniettaCorporation, Denver, Colorado
A METHOD FOR DETERMINING TACTICAL MISSILE JOINT COMPLIANCES FROM DYNAMIC TESTDATA
J. G. Maloney and M. T. Shelton, General Dynamics Corporation, Pomona. California
Vibro-Acoustics
DYNAMIC STRAIN MEASUREMENT TECHNIQUES AT ELEVATED TEMPERATURESR. C. Taylor. Air Force Flight Dynamics Laboratory, Wright-Patterson Air Force lase, Ohio
v

AN ACTIVE LINEAR BRIDGE FOR STRAIN MEASURL...-NTP. T. JaQuay, Air Force Flight Dynamics Laboratory, Wright-Patterson Air Force Base, Ohio
VIKING DYNAMIC SIMULATOR VIBRATION TESTING AND ANALYSIS METHODA. F. Leondis, General Dynamics Corporation, San Diego, California
ANALYSIS AND FLIGHT TEST CORRELATiON OF VIBROACOUSTIC ENVIRONMENTS ON AREMOTELY PILOTED VEHICLE
S. Zurnaciyan and P. Bockemohle, Northrop Corporation Electronics Division, Hawthorne, California
AERO-ACOUSTIC ENVIRONMENT OF RECTANGULAR CAVITIES WITH LENGTH TO DEPTH RATIOSIN THE RANGE OF FOUR TO SEVEN
L. L. Shaw and D. L. Smith, Air Force Flight Dynamics Laboratory, Wright-Patterson Air Force Base,Ohio
PREDICTION OF ACOUSTICALLY INDUCED VIBRATION IN TRANSPORT AIRCRAFTH. W. Bartel, Lockheed-Georgia Company, Marietta, Georgia
SIMPLIFIED TECHNIQUES FOR PREDICTING VIBRO-ACOUSTIC ENVIRONMENTSK. Y. Chang and G. C. Kao, Wyle Laboratories, Huntsville, Alabama
USE OF A SEMI-PERIODIC STRUCTURAL CONFIGURATION FOR IMPROVING THE SONIC FATIGUELIFE OF STIFFENED STRUCTURES
G. Sengupta, Boeing Commercial Airplane Company, Seattle, Washington
PAPERS APPEARING IN PART S
Isolation and Damping
IMPACT ON COMPLEX MECHANICAL STRUCTURESS. F. Jan, Bechtel Power Corporation, Houston, Texas and E. A. Ripperger, The University of Texas atAustin, Austin, Texas
ENERGY ABSORPTION AND PHASE EFFECTS IN SHOCK EXCITED COUPLED SYSTEMSC. T. Morrow, Advanced Technology Center, Inc., Dallas, Texas
HIGH PERFORMANCE VIBRATION ISOLATION SYSTEM FOR THE DD963 GEARSP. C. Warner, Westinghouse Electric Corporation, Sunnyvale, California and D. V. Wright, WestinghouseElectric Corporation, Pittsburgh, Pennsylvania
THE DESIGN AND MEASUREMENT OF A HIGH IMPEDANCE FOUNDATION TO 20 kHz AND USE OFTHE DATA IN CORRECTING NOISE MEASUREMENTS
J. R. Hupton, Westinghouse Electric Corporation, Sunnyvale, California
RESPONSE OF THICK STRUCTURES DAMPED BY VISCOELASTIC MATERIAL WITH APPLICATIONTO LAYERED BEAMS AND PLATES
M. Lalanne, M. Paulard and P. Trompette, Institut National des Sciences Appliquees, Villeurbanne,France
CONTROLLING THE DYNAMIC RESPONSE OF JET ENGINE COMPONENTSD. i. G. Jones, Air Force Materials Laboratory. Wright-Patterson Air Force Base, Ohio and C. M.Cannon, M. L. Parin, University of Dayton, Dayton, Ohio
AN INVESTIGATION OF THE RESPONSE OF A DAMPED STRUCTURE USING DIGITALTECHNIQUESM. L. Drake, University of Dayton Research Institute, Dayton, Ohio and J. P. Henderson, Air ForceMaterials Laboratory, Wright-Patterson Air Force Base. Ohm
vi

AN ALTERNATIVE SYSTEM FOR MEASURING COMPLEX DYNAMIC MODUU OF DAMPINGMATERIALS
D. i. G. Jones, Air Force Materials Laboratory, Wright-Patterson Air Force Bea, Ohr
Dynamic Analysis
NONLINEAR VIBRATION OF CYLINDRICAL SHELLS UNDER RADIAL LINE LOADS. S. Tan&, RockweU International Corporation, Los Angeles, California
DETERMINATION OF THE ELASTIC MODES AND FREQUENCIES WHEN RIGlM BODY MODESEXIST
J. W. Staight, Christian Brothers College, Memphis, Tennessee
ON THE FORCED VIBRATION OF TRIANGULAR PLATESH. M. Negm, S. Chander, and B. K. Donaldson, Department of Aerospace E1iM University ofMaryland, College Park, Maryland
EXPERIMENTAL DETERMINATION OF MULTIDIRECTIONAL MOBILITY DATA FOR BEAMSD. J. Ewins, Imperial College of Science and Technology, London, Enskand sad P. T. Gleeson,Moddlesex Polytechnic and Imperial College, London, England
A NEW STUDY OF THE HARMONIC OSCILLATOR WITH NON-LINEAR FLUID DAMPNGI. A. Eyman, Martin Marietta Aerospace, Orlando, Florida
MECHANICAL DESIGN, ANALYSIS, AND TEST OF THE STANDARD ELECTRON"CS CABINET ANDCONTROL DISPLAY CONSOLE FOR THE ANIBQQ-S SONAR SET
R. E. Denver and J. M. Menichelio, IBM Corporation, Owego, New York
SHOCK SPECTRA, RESIDUAL, INITIAL AND MAXIMAX AS CRITERIA OF SHOCK SEVERITYC. T. Morrow, Advanced Technology Center, Inc.. Dallas, Texas
vii

77•
IMPACT
EXPLOSIVELY PROPELLED ROTATING PLATES FOR OBLIQUE IMPACT EXPERIMENTS
F. H. MathewsSandia Laboratories
Albuquerque, New Mexico 87115
ABSTRACT
A new technique for using explosive-driven flyer plates inimpact studies is described. The simulation of high-velocityimpacts at predictable shallow angles is now possible. Thedetonation of a solid explosive is used to accelerate massive,slowly rotating plates to high velocities. The device to be im-pacted is positioned at a distance along the flight path sufficientto allow rotation of the flyer plate before impact. Thus, anyangle between the plate's surfaces and the plate velocity vectorcan be obtained. Either plastic or metal plates can be used tostudy impact response against hard or soft materials. Thetechnique is employed to allow evaluation of the performance offull-scale fuzing hardware at velocities from 1500 to 3500 m/sec.Procedures for designing flyer plate experiments are described.Data establishing experimental repeatability are presented.
Summary Introduction
Plastic explosive has been incorporated Explosive warheads can be initiated byinto an assembly that propels a rotating plate fuzing systems that actuate upon target impact.of metal or plastic into a target for impact- Fuzing must occur quickly and reliably enoughfuze experiments. Data verifying the tech- that the warhead has time to function beforenique have been obtained at velocities from disabling damage occurs. The requirements1500 to 3500 m/sec. Methods of designing ex- for the fuze, therefore, are conflicting: itperiments are presented. The repeatability of must react practically instantaneously, yettwo explosive systems has been measured and must be thoroughly reliable and insensitive tothe data are presented. A typical experiment prefire.is described.
Modern ballistic -missile warheads con-It is concluded that accurately controlled tain impact fuzes that must function at impact
high-velocity impact experiments can be con- velocities from 1000 to 4500 m/sec. A com-ducted with the new technique, including shallow mon tac-cal demand that complicates fuzingimpact-angle conditions not previously possible, requirements is that of oblique impact. InFuture work will be directed toward applying the past, fuzing experiments have been con-explosive systems to fuze experiments over an ducted with track-guided, rocket-propelledextended range of velocities, sleds carrying target materials into stationary

fuse assemblies. Propulsion costs and sled- intact and reasonably planar over distancesshoe failures have limited this technique to approaching 20 m. This is accomplished byvelocities below 1800 m/sec. In experiments surrounding the flyer plate with a guard plateat higher velocities (2000 to 4000 m/sec), ex- backed up by an explosive layer. A weak jointplosives have been used to prope! metal and is provided by gluing the flyer plate into aplastic plates into test mnaterial&. A major tapered recess in the guard plate. Since ex-deficiency of this technique has been that the plosive pressures are relieved most rapidlyonly impact angles that could be simulated toward edges, the guard plate is thus free towere those at approximately 90" from the tra- lag during acceleration. A sufficient amountjectory. of guard plate assures that edge relief does not
cause the flyer itself to bend or break up.In this paper is described a way to im- Typical proportion@ for an explosive assembly
prove flyer-plate technology in this regard. are shown in Fig. 2. where h is the explosiveThe slow and predictable rotation of the flyer thickness over the flyer plate's center. Aplate during flight allows impacts to be made at triangular ramp of explosive leads to theany angle, while the velocity vector and the gradually tapered section over the plate. Withplate's surface normal remain in the proper the geometry of Fig. 2, a large part of the ez-orientation. Impact-fuze testing with this tech- plosive is used over the guard plate and doesnique can be conducted at velocities from 1500 not impart velocity to the flyer. Typically.to 4000 m/sec. only about 10 to 50% of explosive weight actu-
ally propels the flyer plate. Relatively thickplates moving at high velocities produce the
Explosive Requirements least efficient geometries and may require un-acceptably large quantities of explosive.
The principles behind the rotating flyer When the explosive is initiated by line-plate experiments are illustrated in Fig. 1. wave initiators, a detonation wave progresses
through the explosive, sweeping over the flyer-It is essential that the impulse from ex- plate/guard plate assembly. Resulting high-
plosive gases vary uniformly over the plate pressure gases accelerate both plates. Ac-surface, since the flyer plate must remain celeration is completed in a few 10's of
EXPLOSIVE
VFUZE
PLATE VELOCITY v, ROTATION RATE w
2
300
TýT
FIG. 2 PROPORTIONS OF A TYPICAL EXPLOSIVE ASSEMBLY
microseconds and requires a displacement of a Hence,few centimeters. The explosive is tapered sothat the velocity imparted varies uniformly V I- E"along the length of the plate, causing it torotate slowly during flight. The fuze assembly I + 5a + 4a2)is positioned along the flight trajectory, at a 3distance thrt will permit rotation of the flyerplate to the desired angle before impact. Ve-locity gradients associated with rotation are where V is the plate's final velocity, aonly a few percent of average velocity and have M/C the ratio of plate areal density to ex-negligible effect during impact. plosive areal density, and Vz is the Gurney
velocity (a constant for a particular explosive).Shock waves from explosive pressures This equation is plotted in Fig. 3 for Comp C-4
reflect at free surfaces and may produce suffi- explosive using 2.75 mm/usec for 42E . Ex-cient tensile stresses to cause fracture, result- perimental points for both the plastic anding in plate separation along spall planes.(l, 21 aluminum plates included in this figure showUse of side initiation and a "grazing" detonation good agreement over the full velocity range.reduces pressures and the tendency to spallwhen compared to the case where detonation The Gurney equation may be applied alongstrikes the plate at normal incidence. Spall- the tapered length of the explosive assembly,ation is more likely at low velocities and with making allowance for downstream motion of thelight materials. In these experiments, alum- explosive gases after detonation. Typicallynum was not spalled at velocities from 1. 7 to observed rotation rates are from 50 to 100% of3.7 mm/Asec, with Comp C-4 explosive di- the value estimated in this way. while veloci-rectly in contact with the metal. However, ties are within a few percent. Relatively thicknylon that was intact at 2. 3 mm/Msec developed explosive assemblies with high rotation ratesspall at 1. 5 mm/lAsec and to prevent this it was show the poorest agreement. Ordinariy,.necessary to place a thick sponge-rubber several half-scale experiments are conducted,cushion between the explosive and the plate, with explosive taper being modified until the
desired rotation rate is obtained. The scaledThe final velocity of explosively acceler- rotation rate is then reproduced in full-scale
ated plates may be calculated from the Gurney experiments.model [3, 4] which depends upon the experi- a
mentally determined specific energy (E, kJ g) The efficiency with which explosiveavailable from the explosive to produce the energy in transmitted to the plate is given bykinetic energy of gases and fragments. The"open-faced sandwich" form applies directly to 3athe center region of the plate explosive assem- 21+ 5a+ 4&bly where edge relief is prevented by the sur-rounding guard plate. where o . the mechanical efficiency, is the
ratio of plate kinetic energy to explosiveGurney energy. Mechanical efficiency is highover the region of interest, decreasing from
3
3
E 2
,10 I
0 2 4 6 8 10
MASS RATIOFIG. 3 COMPARISON OF CALCULATED AND OBSERVED PLATE
VELOCITIES OBTAINED WITH COMP C-4 EXPLOSIVE 4
33 to 25% as velocity increases. Overall ef- The flyer edge is deformed as the deto-fciency (the product of geometrical and me- nation sweeps over it and must be taperedchanical efficiencies) ranges from 4 to 15%. sufficiently that interference between the guardFortunately, energy in the form of C-4 ex- plate and flyer does not affect rotation. A 100plosive is relatively inexpensive. The princi- taper angle in aluminum was insufficient.pal problem associated with low overall ef- causing interference and a variation in plateficiency is that large explosive quantities are rotation rate. A relief angle of 200 reducednecessary, making the protection of experi- this scatter.mental apparatus difficult.
The flight portion of the trajectory is theinterval beginning after the first few centi-
Trajectory Considerations meters of motion and continuing to impact.After approximately the first meter of travelthe plate is surrounded by the explosive fire-
The plate trajectory may be considered ball. Then, depending upon the quantity ofin three segments; launch, flight, and impact, explosive, the presence of barriers erected toThe launch segment occupies a few tens of reduce fireball size, and distance to impact,microseconos and a motion of a few centi- the flyer emerges from the fireball and movesmeters. Explosive forces are completely through undisturbed air where appreciabledominant and the plate is rotated through an aerodynamic forces retard its motion. Theseangle and launched along a trajectory approxi- aerodynamic forces must be considered be-mately as described by Kennedy. [41 Because cause of their effect on accurate timing andof the taper of the explosive, it is necessary to trajectory predictions. Hoerner [51 givesempirically adjust both the rotation angle and aerodynamic drag coefficients CD that may bethe trajectory by a few degrees on the basis of applied to flat plates as a function of angle atexperience gain-ed during half-scale experi- hypersonic velocities. His drag functionments.
4

CD .L sln 2 9 0 : *60.8 deg thickness, which would allow a half meter ofplate travel before explosion gases outrun the
- 1.6 60.8 s 9s 90 deg plate. A sealing plate allows sufficient timebefore impact that shock waves within the flyer
may be used with the assumption of constant will have receded to an acceptably quiescentrotation rate to compute drag forces and re- state, permitting impact angles of nearly 90%.suiting velocity, position, angle, and timeinformation. Since the drag force acts normal Later in its flight the plate outruns theto the plate surface, a complementary lifting explosion gases, emerging from the gas cloudfor.:e may be calculated with which to estimate after a displacement ofvertical displacements. When these equations X 1/3are applied over the first quarter-turn of the x 1.9 M-HEplate, a velocity reduction of - 4% is indicated,with a vertical displacement of a few centi- where x is in meters and the explosive massmeters. Typically, actual impact times may (MHE) is in kilograms. If a barrier equippedbe predicted to within *19% of total flight time with an aperture slightly larger than the flyerand trajectory angles within ±0.20 over a 10- is placed close to the flyer's initial position,meter trajectory, by using these techniques the distance that it takes the flyer to emergein conjunction with empirical observations on from the cloud can be reduced to half the abovehalf-scale experiments, value.
Internal stresses caused by rotation act If experiments must be conducted atduring the flight portion of the trajectory, angles still denied by the impingement of ex-These forces are negligible in metals but are plosion gas, the target may be set up fartherappreciable for plastic materials in which yield along the flight, so that the plate has time tostrength is reduced by shock heating. Creep rotate through half a turn and strike the targetand stretching are observed with plastics. with the back of the plate. Such a test setupPolyethylene is unsuitable for this reason, but naturally results in correspondingly largernylon is an acceptable substitute. Vibration uncertainties in timing, position, and velocity.and bending are also much more noticeable inplastic plates, contributing to a modest un-certainty about plate planarity. Impact Requirement
It is essential that the first significantinput to the fuze component be produced by plate Plate thickness and material are dictatedimpact. However, other mechanical inputs may by the desire to duplicate as nearly as possibleprecede impact, risking fuze prefire. These the conditions of actual earth targets. Becausecan include an air shock wave radiating out- of the high pressures generated during impact,ward from the explosion, explosive gases that shock Hugoniots may be compared to establishmay move ahead of the plate and strike the a basis for selecting suitable materials forfuze, or the air shock wave associated with simulation. Nylon, for example, is a reason-plate motion in undisturbed air. able material with which to simulate water
impact. Aluminum has a somewhat higher
Air shock waves are of sufficiently low impedance than granite. Thus, extreme pa-amplitude to be neglected in our work. How- rameters of likely earth targets are simulatedever, if it were found necessary, the effects of by materials adaptable to explosive acceler-such waves could be reduced by placing the ation.fuze in a chamber that was frangible at one endand was evacuated or filled with helium. Plate thicknesses are determined in a
less exact way. Since geometrical efficiencyExplosive gases, which are relatively of the explosive system drops rapidly with
dense compared to air, do produce sufficient flyer thickness, little is gained by increasingpressures to cause concern. By sealing the explosive weights beyond an upper bound for aflyer and guard plate so that little or no ex- particular flyer area. The flyer thicknessplosive gas can escape, however, experiments that may be considered for any specific ve-
can be conducted as close as one-half meter locity is therefore limited. Measured fuzefrom the plate's initial position. Ultrahigh- performance, together with computer calcu-speed photographs show that venting of ex- lations employing a two-dimensional shock-plosive gases is retarded by using a continuous wave code, are used in judging whether asealing plate (see Fig. 1). 1/32 of the flyer particular plate thickness is adequate. The
S0
25-mm-thick aluminum plates propelled by 45 Protective essaetsm for x-rgy film,kg of explosive that we are using appear to be placed beside the night path, allow threemarginal or inadequate. Configurations em- shadowgraphs to be take just before and afterploying 180 kg of explosive to propel 50-mm- impact, providing accurate position and anglethick plates are under development, data for determlnaUm of velocity, rotation
rate, and impact time. A representative-shadowgraph fram the middle x-ray cassette
Experiment is shown in Fig. I. Argon candles provideillumination for high-speed camera coverage(1 million frames/sec) of the impact. Infor-
Elements of an aluminum flyer plate mation describing the fuse output signal insystem are shown in Figs. 4 and 5. The flyer, obtained electrically. Stress wave arrivalin this case 0. 3 m by 0. 25 m wide by 25-mm- times are determinmd by placing piezoelectricthick, is epoxied into the guard plate and crystals on the asamMb•y and observing themounted in a wooden platform. A continuous output signals. In this experiment, a rela-thin aluminmn sealing plate (not shown) is tively large distance between the explosiveplaced over the aluminum assembly. Wooden and the target allowed the plate to rotateside Nad end rails provide a mold into which through 151i before impact, thus providing46 kg8 o plastic Comp C-4 ssnloesve is pressed sufficient distance so that explosion gases didto the desirpd contour. Line-awae initiators not interfere with esiter the impact or theare then adoad. camera view.
The arrangement for an Impact-fuze Ezperimental repeatability has beenexperiment at a velocity of 2400 m/sec is good, as indicated by the data in Table I. Inshown in Figs. 6 and 7. The explosive as- general, impact times may be predicted fromsembly is liclined at a slight angle, as shown previous experiments within about 20 ssec,in Fig. 6, to establish a nearly horizontal even at relatively long range. The scatter inflight path. The sandbag walls reduce blast rotation rates observed in the aluminum ex-effects on cameras and x-ray equipment. The periments has caused some difficulty in theflyer proceeds through an aperture that re- accurate prediction of impact angles. Thisstricts the passage of explosion gases, allow- scatter was caused whem explosive detonationing optical observation of plate motion after deformed an edge of the flyer plate against the4 meters of travel, guard plate, disturbing rotation predictability.
FIG. 4 ASSEMBLY BEFORE LOADING WITH EXPLOSIVE
6

Thin problem was overcome by increasing the Acknowledgmentsangle of edge taper on the flyer plate. Carefulalignment and a repeatable trajectory angle arecritical for long-range experiments. Optical The thoughtful assistance of B. W. Dugginalignment coupled with excellent trajectory- and personnel of the Sandia Laboratories ex-angle repeatability in our test setups allow plosive firing site and the preparation of theshallow-angle experiments at 10 meters and manuscript by Mrs. B. D. Conley is gratefullyhead-on impacts at 20 meters, with uncer- acknowledged.tainties of -0.20 giving acceptably smallscatter in impact locations on the plate.Lateral trajectory scatter and yaw angles haveproven negligible.
FIG. 5 ASSEMBLY AFTER EXPLOSIVE LOADING
7
FIG. 6 EXPLOSIVE ASSEMUBLY IN POIIY1TION IF011 FIRING
'ExPL~~s~vE. FR• # AGMENT F•ILM:ASSEMBLY io "CA ": DLES ••-"".•" • "" "';'•"•": "" BARRIER CA SETTES ,BLAST
S. .... , .. ": iSHROUDED q '
FIG. 7 EXPERIMENT ARRANGEAMENT
FIG. 8 N- RAY~ SIIAIX)\% GRAI'II OF~AN AII N1 NII PLATE' 0. 3 it [A)\G.0. 25 Al\1 \DE, A\ND 0. 025 MI THICK OIITA I\: D Aim7:t1 A l(t-(W 7 \!ILTERS.II \ ri" V'I 10(IX)I'N 1S 2330 N\I/SIC; IiOt~AThI.'HAXII is~ 800 HIP\DfIXC
I.
TABLE I
Observed Performance(l) of Two Systems
Initial Velocity Rotation Rate TrajectoryPlate Scale mr/sec rad/see Angle
25 mm Aluminum Half 2400 790 (1580)(2) 9.2
Full 2350 1010 9.3
Full 2350 770 (1)
Full 2400 1000 9.4
"Full 2400 800 9.4
50 mm Nylon Half 2380 800 (1600) (2) 10.3
Half 2330 890 (1780)(2) 10.4
Full 2370 820 10. 5
Full 2370 (3) (3)
Full 2380 820 10.3
Full 2380 (3) 10.4
( 1 )Tolerances are approximately: velocity +30 m/sec, rotation ±25 rad/sec, trajectory angle ±0.1".(2)Higher value is observed rotation rate, table value has been adjusted by scale ^actor.
• 3 )Not determined due to short flight distance.
References [31 Gurney, R. W., "The Initial Velocities ofFragments from Bombs, Shells, andGrenades," U.S. Army Ballistic Research
(1] Jones, 0. E.E, "Metal Response Under Ex- Laboratory Report 405, 1943.plosive Loading," Behavior and Utilizationof Explosives in Engineering Design, 12th [4] Kennedy, J. E., "Explosive Output forAnnual Symposium ASME. Published by The Driving Metal," Behavior and Utilization ofNew Mexico Section ASME, March 2-3.1972. Explosives in Engineering Design, 12th
Annual Symposium ASME. Published by[2] Hosldn, N. E., Allan, J. W. S., Bailey, The New Mexico Section ASME, March
W. A., Lethaby, J. W., and Skidmore, 2-3, 1972.I. C.. "The Motion of Plates and CylindersDriven by Detonation Waves at Tangential [5] Hoerner, S. F., "Fluid Dynamic Drag."Incidence," Fourth Symp. (Intl.) on Deto- published by author, Cambridge. MA,nation, ONR ACR-126, 14-26, 1965. Library of Congress Catalog Card No.
57-13009.
II

//
IMPACT TESTING USING AVARIABLE ANGLE ROCKET LAUNCHER
H. W. NunezSandia LaboratoriesAlbuquerque. Now Mexico
This paper describes a test facility whichuses a rocket powered sled to launch a testItem at an Impact target. The rail alongwhich the sled Is launched Is capable ofbeing elevated so that the relative anglebetween the line of flight and the igpacttarget0face can be varied between 90 andnear 0 . A 2000 pound test unit can beaccelerated to an impact velocity ofapproximately 200 feet per second.
INTRODUCTION 3. The facility provides a convenientmeans of testing relatively largeSandia Laboratories has numerous items at fairly low impact veto-facilities for subjecting test items, cities. Units weighing up to 2000
both large and small, to various types pounds can be tested at impactof shock, vibration or impact envir- velocities of approximately 200onments. These include such facill- feet per second and velocities ofties as a 5000-foot rocket sled track, 450 feet per second can be attaineda 35-foot radius centrifuge, a 185- with lighter units.foot drop tower, various caliber guns,shock tubes, vibration tables and LAUNCHER STRUCTURE AID TARGETmany others. CONFIGURATIONS
One such facility which has been used The main feature of the Rocketvery successfully in the past is the Launcher Facility is the guide orRocket Launcher Facility. This is launcher rail. This rail consists ofprobably a misnomer because rockets a 73 foot long, 16 Inch deep wide-are not actually launched, but instead flange shape weighing 96 pounds perare used to propel a sled and test foot. One end of this beam is weldeditem along a guide rail until a pre- at right angles to a& a foot longdetermined velocity is reached at similar wide-flange shape. The endswhich time the test item is separated of this short cross beam are attachedfrom the sled and allowed to fly free to two upright frame supports by 3 inchto impact with a target. This facdl- diameter steel hinges. The free endity offers several advantages as of the long guide rail can be elevatedfollow: by means of a cable passing over pul-
leys between upright columns on either1. Point of Impact and angle of side of the rail. Figure I is an over-impact may be closely controlled, all view of the facility with the guide2. Testing is relatively Inexpensive rail in a raised position.because turnaround time is short,Instrumentation Is uncomplicated, Figure 2 is a closeup of thetemperature conditioning of a hinged end of the guide rail and thetest unit Is easily accomplished, frame supports. In Figure 2, note theand the rocket motors used cost bolt holes on the front side of theonly $10 each. Test fixture supports. Depending on the impactdesign is also quite simple, angle, these holes allow the hinges to
13

7 1
be positioned at a location which on top to provide an impact surface.will provide maximum unobstructed First impact and secondary impact orviews of the impact area. slapdown will occur on this surface.
Figure 2 also shows the impact The guide rail~can be elevatedarea for most test conditions. to approximately 60 from the hori-The area between the frame supports zontal. By placing the guide rail inis in the form of a shallow pit a horizontal position, test items can6 feet wide by 14 feet long by 15 be launched against vertical or nearinches deep. Normally, this pit is vertical targets. Typical targetsfillewith tamped dirt to a depth of for this type testing are massive3 to 4 inches and a reinforced con- concrete blocks or soft dirt bankscrete slab 12 inches thick is placed for soft recovery.
L G FTUERAS SUPPORTSUPPORTS
Figure 1- Rocket Launcher Facility
'4
B s EAN
Figure 2 - Lower Support Frames and Impact Area of Rocket Launcher Facility
SLED STRUCTURE At the end of a run, the sled isstopped by impacting against aluminum
The sled which carries the test honeycomb. When this sled decelera-item is a welded steel structure de- tion occurs, the test item slips for-signed to ride on the Inside surface ward off the hangers and continues inof the lower flange of the guide free flight to impact.rail. A typical sled is shown inFigure 3. The test item is suspended The sled has provisions for mount-below the sled on a set of special ing rocket motors on each side of thehangers or a specially designed sub- center web and in the area between thecarriage. This carriage is designed upper and lower flanges of the guideto support the test item and to push rail.it forward during the thrusting phaseof rocket burn. Figure 4 shows a ROCFET MOTOR CHARACTERISTICSunit suspended from the sled prior toInstalling rocket motors. For angle The rocket motor used on almostimpact tests, a test unit is tied all tests is a U.S. Navy High Velocityback to the beam with a "weak-link" Aircraft Rocket (HVAR). This solidwhich breaks when the rockets start propellant motor is 5 inches in dia-to thrust. meter and 51 inches long. It weighs
1S

suspension S~takets. ý
Figure 3 -A Typical Sled
Figure 4 -unit Suspended From Sled
Prior to Rocket Motor Installation
16

82 pounds and has a maximum impulse From Step 2.of 5150 lb-sec. The burn time of themotor is nominally 1.1 seconds and '2400'300'the average thrust over this period t J40 - 0.79 sec.is 4740 lb. 0) (3Z.2) 0
TRAJECTORY CALCULATIONS From Step 3.
The basic procedure for calcu- Distance a 1/2 (300) (.79) - 119 ft.lating position vs time or trajec-tory of the rocket launcher sled isas follows: But the guide rail Is not this
long, so this velocity is unattain-able with these motors.Step 1. Determine the number ofa
motors required to propel Exayple: Assume a total weight ofthe given Valght to the 400 lb. is to be accelera-
th gve wIgtoth ted to a velocity of 200desired velocity from: ft/sec.
from Step 1.(W) (V)
n 4(32.0) (To) a (400) 2
where: A - number of motors Use 2 motors
W a initial launch weight,pousds From Step 2.
V a desired velocity, feetper second (400) (200) - 0.26 sec.
Ta a average motor thrust, t-.) Y3.) t44u"pounds
t a motor burn time. seconds From Step 3.
0 - 1/2 (200) (.26) - 26 feetStep 2. After determining the number
of motors required - usually2, 4 or 6 - solve Step 1 for In actual practice, a computerthe time required to attain program is used to provide a print-the desired velocity, out of distance, velocity and accel-
eration for each 0.050 second periodStep 3. Verify that the travel based upon the weight of the test
distance required is within item and the number of motors used.This program is quite refined andthe limits of the Rocket considers the decreasing mass of theLauncher guide rail from: rocket motors as the propellant is
burned as well as the thrust vs timeDistance, feet - (Velociti) (Time) charateristics of the rocket motor.
Typically, using six HVAR motors,a 2000 lb. test unit can be propelledExample: Assume a total weight to a free flight velocity of 200 feet
(carriage, test item and per second or a 50 pound test unitrocket motors) of 200 lb. can be propelled to approximately IIs to be accelerated to a 450 feet per second.velocity of 300 ft/sec.
INSTRUMENTATIONFrom Step 1.
Almost all types of conventional(240) (300 transducers have been used at this
n 32 ) (470) 4.28 facility. These included acceler-ometers, strain gages, thermocouples,
Use 6 motors crush switches, etc. Due to therelatively short travel distance
17

(80-100 feet) of the test unit, it ispossible to hardwire between thetransducers and an instrumentationpatch panel located at the base ofthe tower.
High speed motion picture cameras arealso used on all tests to recordimpact motions.
by building lightweight, expendableenclosures around a test item sus-pended from the sled, it is possibleto temperature condition a unit Briorto testin 8 . Temperatures of -65and + 165 F have been attained.
DISCUSSION
Voice: I just have one question. I noticedyou had it hard wired for your data retrievaland I vwa wondering about what percentage ofsurvival you had of the leads? Your goingup about what, 400 feet/sac?
Mr. umes: (Sandia) So far we have been running
in the rungse f 200 ft/sec for herd wireddata and the retrieval has been surprisinglygood. We've tried to develop techniques tokeep the cable out from underneath the slap-down and so far we've been reasonably success-ful. One of the problems we are facing isthe everpraesent problem of noise in movingcables.
Voice: YeT we've had similar problems, I justwented to know how the other side was doing.
'I
Ii
I;
18

EVALUATION OF THE SHOCK PULSE DIAGNOSTIC
TECHNIQUE TO THE UH-I SERIES HELICOPTER
J. A. George*, T. C. Nayer*, E. F. CovilltParks College of Saint Louis University
Cahokia, Illinois
The use of shock pulse techniques as a diagnostic tool forthe UN-i *eries helicopter was investigated. A standardoff-the-shelf SKr Industries model MEPA-lOA was employed toconstruct shock emission envelopes of shock rate versusshock level. Operational helicopters of a Reserve ArryAviation unit were available and data was collected on thehanger bearings of the tail rotor assembly as well as the42* gearbox. Selected hanger bearings and gearboxes wereremoved for teardown analysis. Further data was obtained
from helicopters at Fort Rucker, Alabama, with known im-plants in the 420 gearbox. The correlation between shockemission envelopes and degree of degradation is described.The shock pulse meter does show promise for its ability toseparate those hanger bearings and 42* gearboxes with normalwear, or the onset of damage, from those with severe damage.
INTODUCTION oped by AB SKF, Sweden and are availa-ble in the United States through SKFIndustries, Inc.(4) When a bearing
The U.S. Army Aviation Systems race or rolling element contains a dis-Co•mand (AVSCOM) has an ongoing program crete fault, such as a pit or spell,to develop a mystem which will auto- the rolli.ng contact between this faultmatically accomplish inspection, diag- and the other rolling elements will re-nostic, and prognostic maintenance sult in repetitive impacts of shortfunctions on related subsystems of the duration. As a result of these impacts,UH-l helicopter. This program, called a shoc!. wave travels through the bear-AIDAPS, is intended to provide equip- ing housing causing a pulse displace-ment which will contribute to an in- ment input to a suitably mounted accel-crease in the tactical mobility of erometer. The output of the acceler-Army aviation operations and provide ometer is passed through a high gainan effectiie reduction in aircraft amplifier tuned at the resonantmaintenance costs and maintenance re- frequency of the accelerometer, inlated accidents, this c. se, 38 kHz. The amplifier acts
as a sharp band-pass filter. After thePast efforts (1-3), have irncluded signal is processed, a meter on the .
the collection of vibration data with face of the instrument gives outputa subsequent analysis of the resulting information. The meter registers thePower Spectral Densities to determine frequency of peaks abov3 a presetthe condition of the helicopter power- shock pulse amr.itude threshold.train. Another approach, particularlyin determining bearing condition, is to PRELIMINARY EVALUATIONuse shock pulse techniques. The tech-nique and instrumentation vere devel- A preliminary evaluation (5), of
the feasibility of using pulse tech-niques to the UH-1 series helicopter
*Professor, Aerospace Engineering (Figure 1) was conducted by Parks Col-Department lege under contract to AVSCOM. A stan-
tResearch Associate dard off-the-shelf SKF Industries
19
J
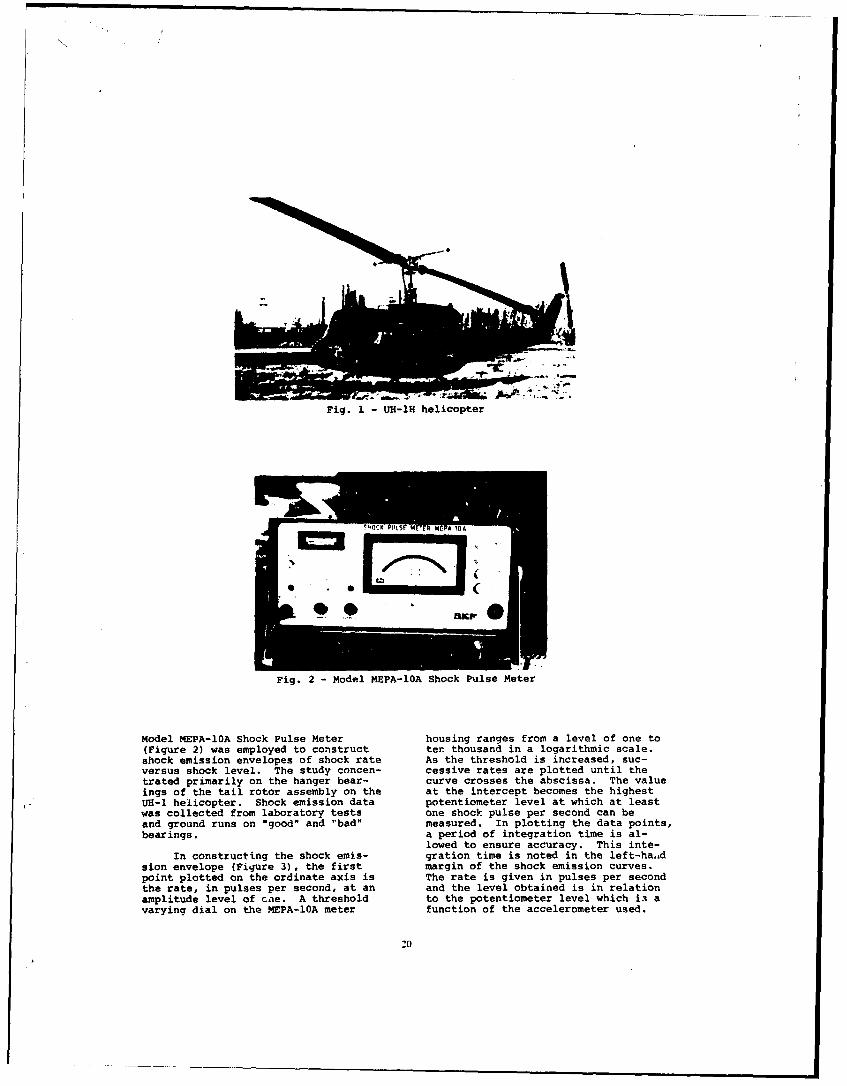
Fig. I - W-lH helicopter
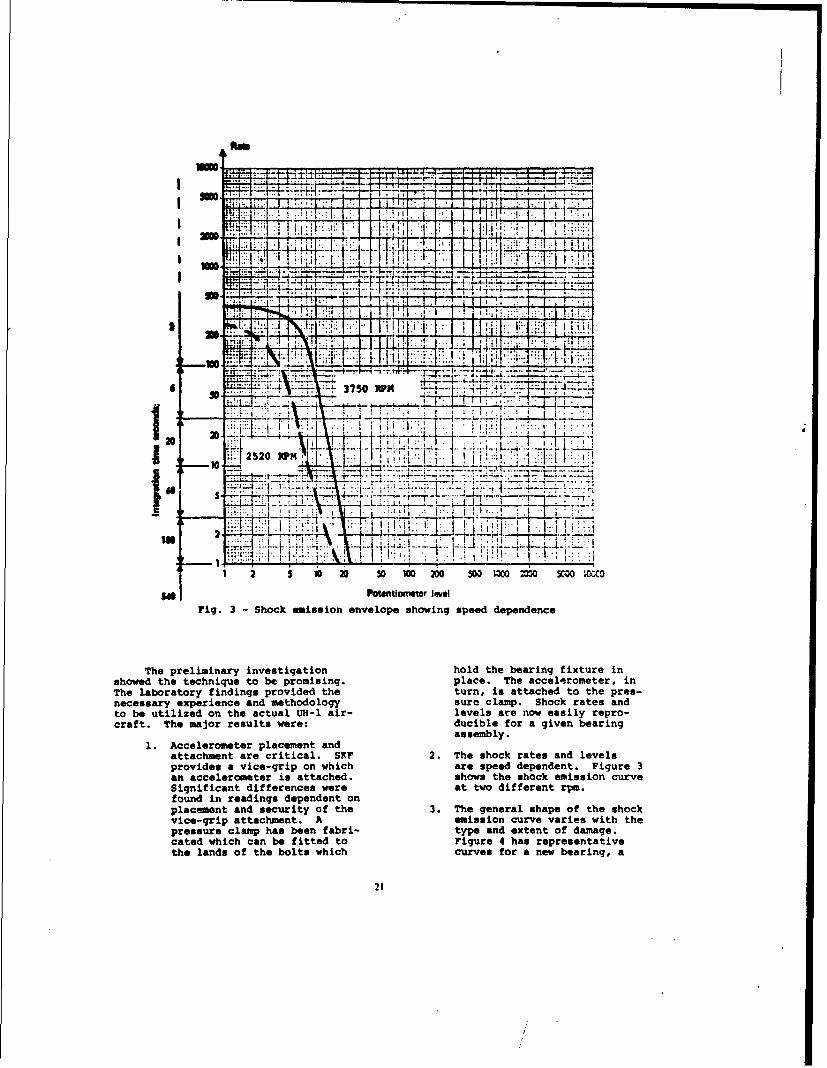
Fig. 2 - Model MEPA-10A Shock Pulse Meter
Model MEPA-10A Shock Pulse Meter housing ranges from a level of one to(Figure 2) was employed to construct ten thousand in a logarithmic scale.shock emission envelopes of shock rate As the threshold is increased, suc-versus shock level. The study concen- cessive rates are plotted until thetrated primarily on the hanger bear- curve crosses the abscissa. The valueings of the tail rotor assembly on the at the intercept becomes the highestU1-1 helicopter. Shock emission data potentiometer level at which at leastwas collected from laboratory tests one shock pulse per second can beand ground runs on "good" and "bad" measured. In plotting the data points,bearings. a period of integration time is al-
lowed to ensure accuracy. This inte-In constructing the shock emis- gration time is noted in the left-hatd
sion envelope (Figure 3), the first margin of the shock emission curves.point plotted on the ordinate axis is The rate is given in pulses per secondthe rate, in pulses per second, at an and the level obtained is in relationamplitude level of c.e. A threshold to the potentiometer level which i avarying dial on the MEPA-10A meter function of the accelerometer used.
20
R-17..". .. . . . .
. L....T 1.. .1 , i - II r f . " I • ,
P;I I A ii,-
' ~ ~ ~ -ti 71*
S - 4 J . ..... .... s•.. =. -_--_
1 252 5RPM51020 501000 5CoO
-. P-an-. wne . J. i .... ..
Fig. 3 -Shock mission envelope showing speed dependence
The preliminary investigation hold the bearing fixture inshowed the technique to be promising. place. The accel..rometer, inThe laboratory findings provided the turn, is attached to the pres-necessary experience and methodology aure clamp. Shock rates andto be utilized on the actual "-1,-1 air- levels are now easily repro-craft. The major results were: ducible for a given bearing
assembly.1. Accelerometer placement and
attachment are critical. SKF 2. The shock rates and levelsprovides a vice-grip on which are speed dependent. Figure 3an accelerometer is attached. shows the shock emission curveSignificant differences were at two different rpm.found in readings dependent onplacement and security of the 3. The general shape of the shockvice-grip attachment. A mission curve varies with thepressure clamp has been fabri- type and extent of damage.cated which can be fitted to Figure 4 has representativethe lands of the bolts which curves for a new bearing, a
21

I
N :1 i'1
- 4 .' ...
1 2 * 20 1002•0 500 1000 2000 500010000
Fig. 4 - Comparison of new and damaged hanger bearings
bearing with dirty lubricant, curves must be generated with
a dry bearing, and one with the bearing in the actualrolling element damage. In operating environment.each case, the damaged bear-ing shock emission curve ex- UH-1 SERIES HELICOPTER DATA COLLECTIONhibits increases in rate and
level over that of the new Upon completion of the prelimi-bearing, nary evaluation, the College undertook
to collect additional shock pulse data.4. Although a damaged bearing Initial efforts concentrated on build-
could be discerned, it was not ing up a data bank of shock emissionpossible to localize damage curves of hanger bearings of the tailas to the inner or outer race, rotor assembly and the 42" gearbox asrolling element, etc. installed on operational helicopters
(Figure 6).5. Laboratory readings Of rate
vwrsu• level differed from U1I-l type helicopters were made
those of the same bearing available by a Reserve Army Aviationassembly installed om a UM-l1f unit stationed near the College. Data
helicopter (Figure 5). Thus, was collected on three models: 014-ID,generalized damage assessment UII-lH and U14-lM. The federal stock
22

I I~ I 'T L7 .-
.1 M
3ig ...ai.r.t.r.dri.e-shaftandNJ
gearbo I. temblyHUN-iN~T heiope
V.. N;

number for all hanger bearings and for teardown analysis. These were selectedthose on the 420 gearboxes is the same on the basis of shock rates, potenti-for these series of helicopters. ometer levels, or unusual shock pulseDifferences are only in the number of curve characteristics. The time since 1hanger bearings with the UH-ID and -1H overhaul for these hanger bearingshaving four hanger bearings, while the ranged from zero to over five hundredUH-iM has three. The aircraft were hours.made available on a noninterferencebasis. No modifications could be made The shock rates were found to varywhich would result in the aircraft from 55-340 pulses per second.being in a nonflyable status nor any Approximately half of the hanger bear-interference with the normal main- ing rates were between 100-200 pulsestenance routine or flight operations. per second. Statistically, the sampleThe pressure clamp attachment described mean rate was 184 with a standardpreviously greatly facilitated the deviation of 86. The potentiometerrapid setup and recording of data. levels of the hanger bearings tested
a
Fig. 7 - Tailrotordriveshafthangerbearingassembly,WI-lHhelicopter a
" I
iai
All tests were ground runs at a varied considerablyl the range ofN2 = 6600 rpm. This gives a tail rotor levels were from 45 to 6000 units.drive shaft speed of 4300 rpm. Se- However, approximately two-thirds werelected hanger bearings and gearboxes between 45 and 200 units. The samplewere removed for teardown analysis. mean and standard deviation vere foundPulse signatures were then correlated to be 558 and 1192 respectively.with the teardown analysis. Eight hanger bearings, with
A second phase concerned data potentiometer levels from moderate tocollected from the helicopters in use high, were selected for teardownin the AIDAPS program being conducted analysis. This work was performed byat Fort Rucker, Alabama. This phase the Bell Helicopter Company. Teardownincluded 420 gearboxes with known analysis revealed that defects, ifimplants, they existed, consisted primarily of
pitting and corrosion varying fromHANGER BEARING ANALYSIS slight to severe. The data has been
summarized in a single shock emissionTwenty-nine hanger bearing assem- envelope which can be used to separate
blies were tested, including originally hanger bearings of normal wear (or theinstalled and replacement bearings onset of damage) from those of severe(Figure 7). Eight were removed for damage (Figure 8).
24

p. __
Ca
is-
r -V_7ometr J.s
i.-0 - -h e is envlop-t
2.11 T: . 7. . . ..
1. 2 _ 10 M 5D M 1 ,; ., m o ,p.40 .... SM! I M M•
F ig 8" --- .. . .... em i s io e nv e lo p e t -o , " : ' • !
determine hanger bearing condition
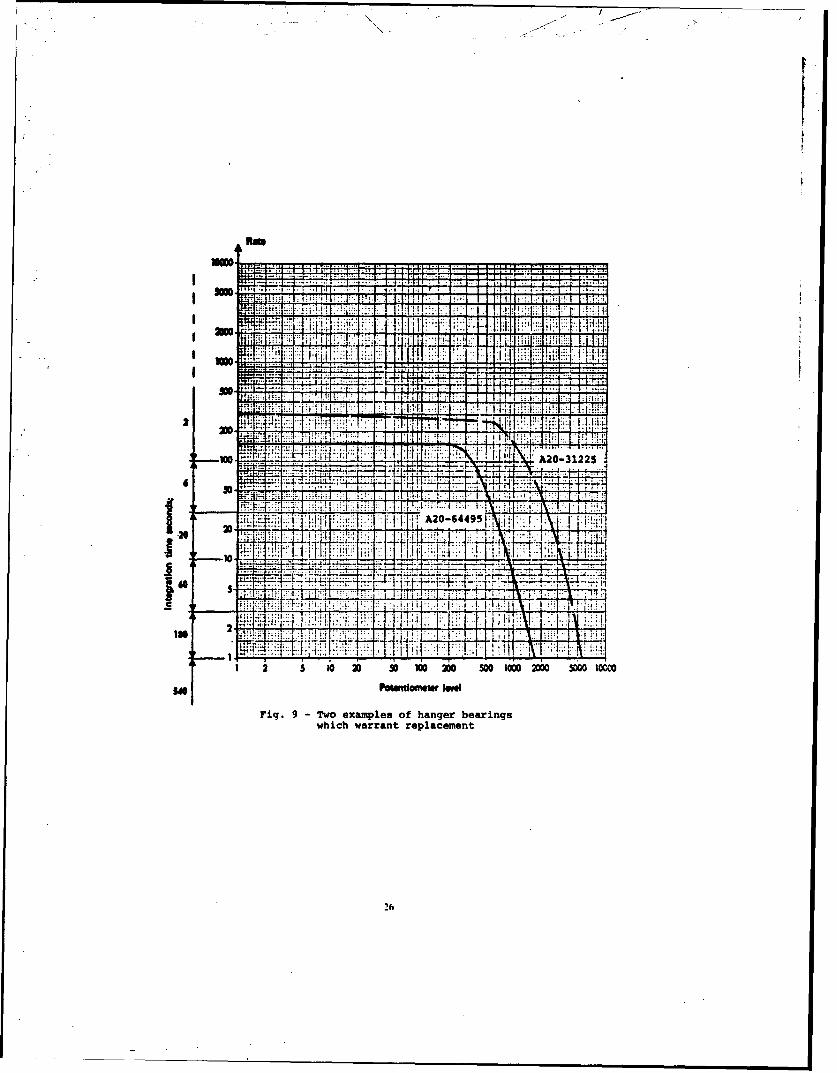
Figure 9 shows the shock pulse moved for teardown analysis, readingsLcurves for two hanger bearinge removed were taken on the new, or rebuilt,from UH-il aircraft which would nor- replacement bearing. In each case, amally warrant their rejection at over- marked reduction in potentiometer read-haul. Figures 10 and 11 are pictures ings was noted. Figure 15 compares aof corrosion and pitting damage found damaged hanger bearing (that shownon the ball bearing and outer race in Figures 9-11) with its zero timeof hanger bearing with the lesser replacement. The potentiometer levelspotentiometer level reading. Figures of the zero time hanger bearings were12-14 show the evidence of pitting and found to vary typically from 50 - 100corrosion on the bell bearings as well units.as both inner and outer races for thesecond of the two hanger bearings Additional data was collected ongiven in Figure 9. It was also noted hanger bearings installed on helicop-
that the bearing rotated roughly be- ters involved in the AIDAPS program atfore teardown. Fort Rucker. These hanger bearings
were inspected and found acceptableWhenever a hanger bearing was re- prior to their use in that program.
2S
:..• : :,
1 k2 1; ;K:!IMM ...1
C!
1 ~ ~ ~ ~ ~ I 2I;: 5 0 100 50P020 5000
A20

Fig. 10 -A20-64495 -Corrosion
Damage on ball bearing
Fig. 11 -A20-64415 -C'orrn;icnn
and pitt inan itcrrace,

-t
Fig. 12 - A20-31225 - Corrosionand pitting on outer race
Fig. 13 A20-31225 Corrosio•damaqv to inne r ravo
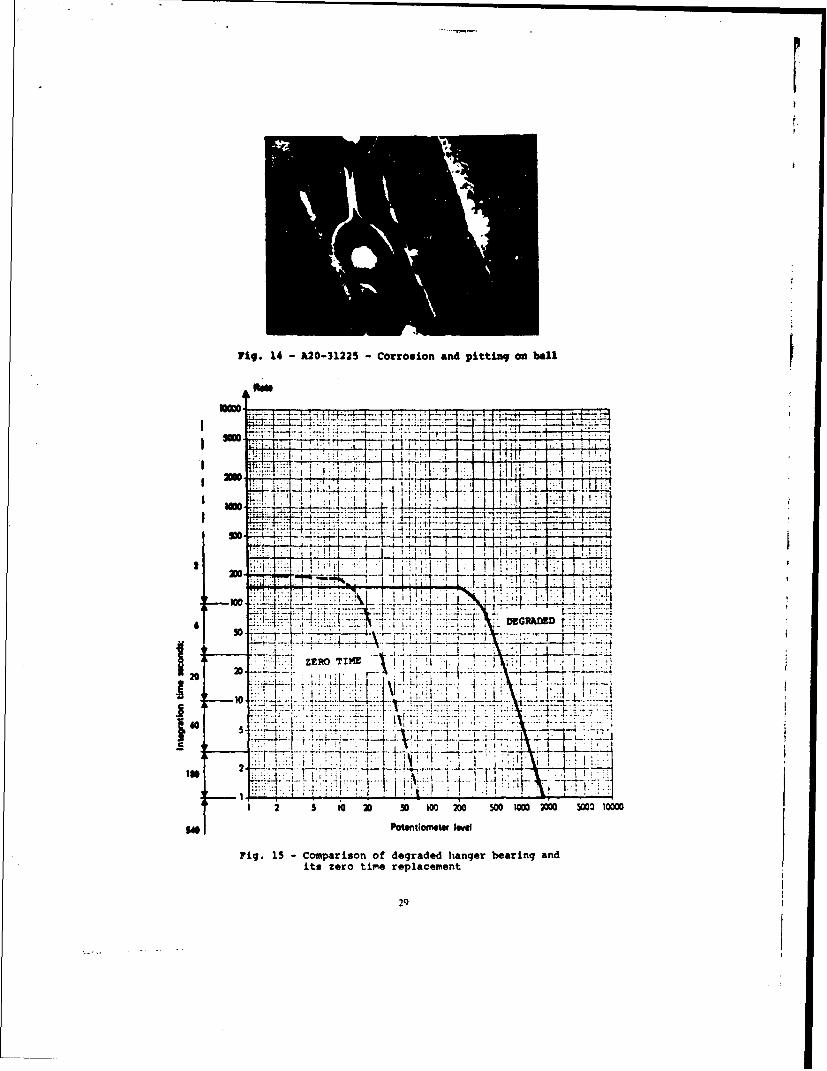
Fig. 14 -A20-3122S Corrosion and pitting on ball
PAN
-J- z41=t hn.' t
~ =1vi4 I
-
2 0- ZERO TIME\ II
I TjIr-f11 L
1 2 5 MC 20 so i0o 200 500 I= 2000 300210000
Potentlometa! Igvt
Fig. 15 -Compar ison of degraded hanger bearing andits zero time replacement
29
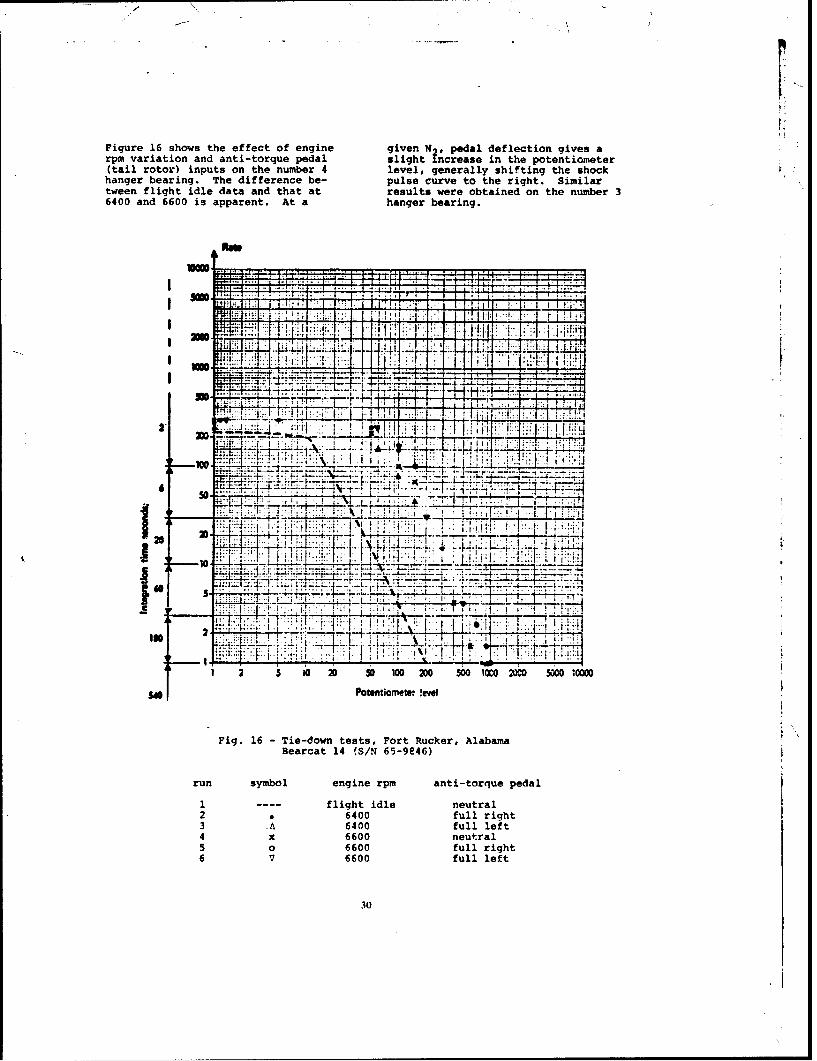
Figure 16 shows the effect of engine given ?4N pedal deflection gives arpm variation and anti-torque pedal slight increase in the potentiometer(tail rotor) inputs on the number 4 level, generally shifting the shockhanger bearing. The difference be- pulse curve to the right. Similartween flight idle data and that at results were obtained on the number 36400 and 6600 is apparent. At a hanger bearing.
I1! ..r .~--~ .
... ... . 1.. 1 ..... ~ ;id l -
lie4IIIW~77, ~ 11i 'JA .
100~~~~~~ 20 0 lC 0C 00 0
Poteniomet? i!eFig.~~~~~~~~~ 16jTedw etFr ukr lbm
Bera441SN6-86
run ymbo engne rm ani-toque eda
120. lgt deneta
230
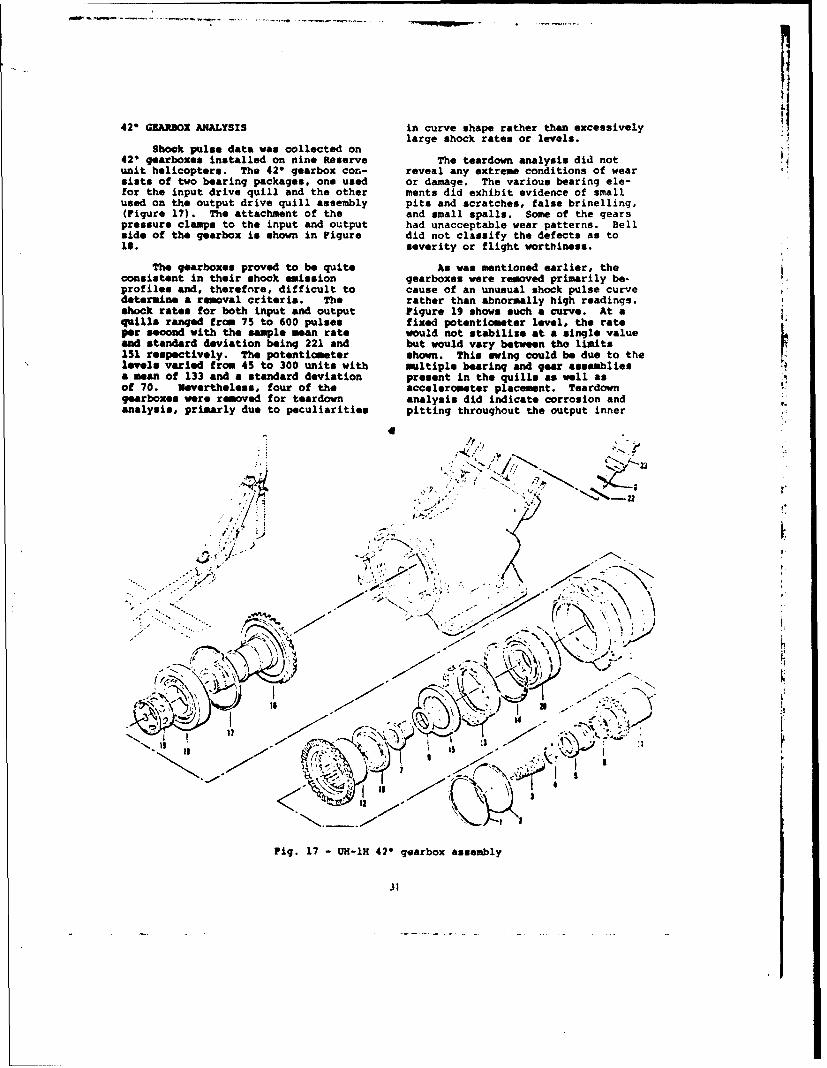
42" GZR.DOX ANALYSIS in curve shape rather than excessivelylarge shock rates or levels.
Shock pulse data was collected on42' gearboxes installed on nine Reserve The teardown analysis did notunit helicopters. The 420 gearbox con- reveal any extreme conditions of wearsists of two bearing packages, one used or damage. The various bearing ele-for the input drive quill and the other ments did exhibit evidence of smallused on the output drive quill assembly pits and scratches, false brinelling,(Figure 17). The attachment of the and small spalls. Some of the gearspressure clamps to the input and output had unacceptable wear patterns. Bellside of the gearbox in shown in Figure did not classify the defects as tois. severity or flight worthiness.
The gearboxes proved to be quite As was mentioned earlier, theconsistent in their shock emission gearboxes were removed primarily be-profiles and, therefore, difficult to cause of an unusual shock pulse curvedetermine a removal criteria. The rather than abnormally high readings.shock rates for both input and output Figure 19 shows such a curve. At aquills ranged from 75 to 600 pulses fixed potentiometer level, the rateper second with the sample mean rate would not stabilize at a single valueand standard deviation being 221 and but would vary between tho limits151 respectively. The potentiometer shown. This swing could be due to thelevels varied from 45 to 300 units with multiple bearing and gear assembliesa mean of 133 and a standard deviation present in the quills as well asof 70. Nevertheless, four of the accelerometer placement. Teardowngearboxes were removed for teardown analysis did indicate corrosion andanalysis, primarly due to peculiarities pitting throughout the output inner
4)
.-... ./-., \\\•' .7 ... , . -, ,
,,2,
', ,-•• , • - N • -
171:
./ •'.•'• J-_-.•, ,a'4,1 ,- -'&
Fig. 17 - UH-lH 420 gearbox assembly
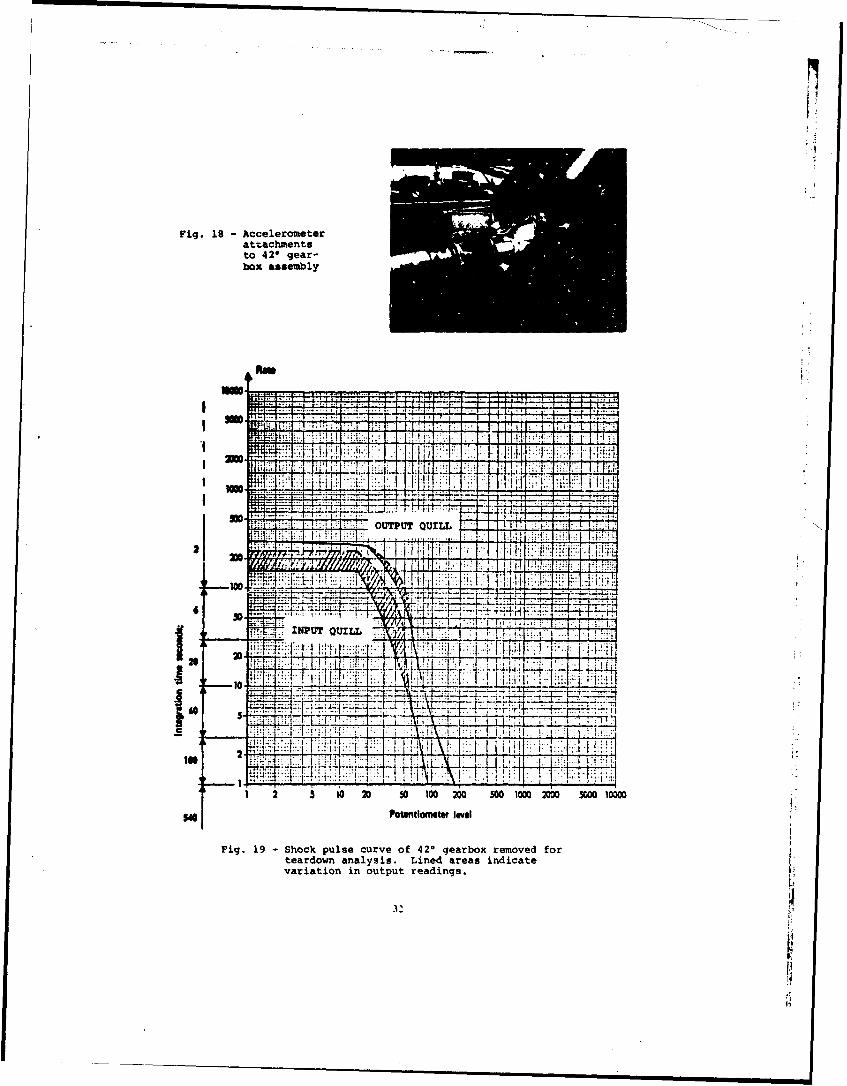
Fig. 18 -Accelerometer
attachmentsto 420 gear-box assembly
Al i I k1" j -
1 02 5 0 0 5010 00 0000
Potolmes Id
Fig.3.9 Shoc puse crveof 20 garbx reove foterdwnanlyis Lne aea idiat6 A
variaTio QInuptredns
11 :J


: .:IP i.. .................. 1I~ ! .Ki .. I1 F-.1 2. 74 _
-FT. ITi
... .. .. ..... ...... .. ..
.... ..... .... ..30I ;i1
2oslomt v
Fig 23- Cmprisn o baelne nd egade garo(implanted with sp~Alle ulxbaig
34

an outer ball (Figure 20-22), radialscratches in the output roller bearing,and output gear pattern too high andtoo far towards the toe, as well aspits on the input ball and rollerbearings.
I
Fig. 22 -Output, outer bearing,
amrrosion and pittingon outer race I
The data collected on the AIDAPShelicopters was from gearboxes of known
Fig. 20 - Output, inner bearing, condition. Each gearbox was completelycorrosion damage on disassembled, inspected, and any neces-outer race sary component replacement accomplished
prior to reassembly and use in the pro-gram. The data included that from animplanted input quill duplex bearing(item 20, Figure 17) with knowndefects.
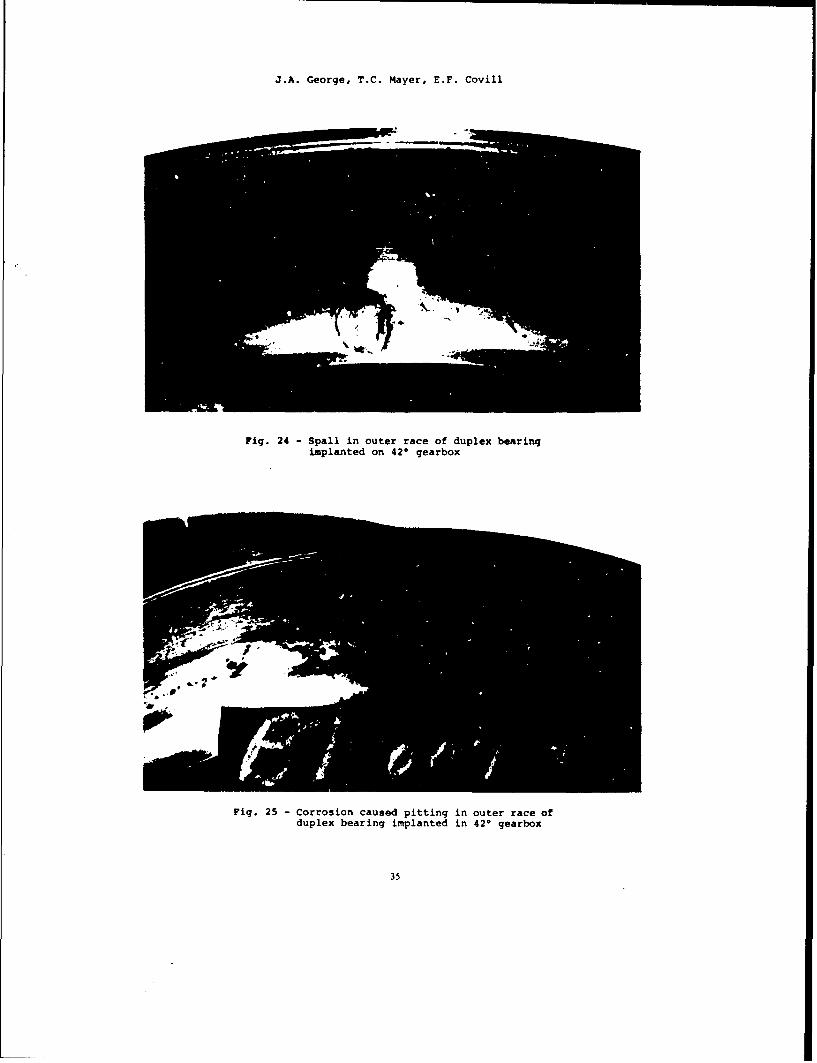
Figure 23 shows the shock pulsecurve for the *sanitized" gearbox aswell as one with an implanted duplexbearing. In this case, the outboardhalf of the duplex bearing had a singlespall in the outer race, 0.14' x 0.141,with a definite depth; the inboard halfhad some corrosion caused pitting withone pit in the ball's path (Figure 24,25). This damage was classified in
category C which corresponds to moder-ate spelling.
A second duplex ball bearing,this one with a single shallow spellapproximately 0.08" x 0.08" in the Iouter race, was implanted in another 420gearbox. Of particular interest was Ithe observation of progressive damagewhile the test was in progress. Theshape of the shock emission curvechanged continuously over a period ofminutes in both rate and shock level.Figure 26 shows two curves developedon a single run. A change in slopetakes place (A), a sharp increase inrate (B-C)ý a continual change in
Fig. 21 - Output, inner bearing, slope (C-D). Without shutting down thecorrosion on ball engine, the second curve (E-F-G) was
33

..i. I . . .
TOTh
.t~~- -2 1
- i--4-..-.-1 ~I i
2.4~L- j:I~jj.7
1 2 ~O 20 5 10 20 SC 000000 COQOC4
Po Ciiree ee
Pig 26- 2 Garox mpAntdwt ple ulxbl
bearng.Evidnceof dmag proresing
36 :,j; !4
'¾.It
J.A. George, T.C. Mayer, E.F. Covill
Fig. 24 - Spall in outer race of duplex bearingimplanted on 420 gearbox
Fig. 25 - Corrosion caused pitting in outer race ofduplex bearing implanted in 420 gearbox
35
Mr. MIMtSoM: MMUC You indicated that you have hal' t up enugh bakgtrourd sD that ini sonr difficulty in getting cosistent sathng hernas ahbwni we have actuallyreadings in your earlier tests. Were the bown able to classify it as either high rates
is due to the nc-riqld mq.ypit or high levels of settin where I get a bardof the acoeler•meter of of the accelerometer of rates, or a time varying cur iwhre damageitself? actually Pgresses with time. Tese are the
four categorie whic we look for. I mightMr. rborgy: The non repetitive readtngs vne add that we have also had one tranamissiondn to the fact that we used off the shelf that wesuspected and also a swis of 90squipset. ?Th AmV pumhased it and askdW degree gear ea of which bad baew •nthe college to evaluate it. Theu original dom, where damages had been found. So as wepiece of equipaent had a very large pair of go to ~ecoslicated mechanismwe i findpvime grips and you siumply claq them that the technique shows promise. it ison the bolt or seabmre on the struct•re; the fairly easy to get the data, it takes a feweacelerosete we maunte on the head of the minutes to fill out a curve and then itvise grips. IbP, problem me that t peolo requiresan interretaticm. InterpretationcoulA claep with different degree, of severity has baee built up simply to er WiMs .so w cOuld not get repetitive resdings under We dld not amalyze the lnards of the sockthat System. A•l of the data I have ps•eu-tg pulse mbeno or try to Impaoe an it we justhere is with the presure claf that wea simply looked at its feasibility as ashom in the figures thamselves, that is the field tool.pressure clamp wozld be rntred on the landof the bolt and then the acceler•mete wassaad in to the mont itself. So I re•ticnthat as a problem of the off the !hef pieceof equiPeaut rather than a problem with thedata. Vi do have acme difficulty withrepetition and if we make a run and findswoething azamally high %a try to find thecause. Usually it is very easy to find thatthe pressure clamp is not tight or theacelerometer is not screwed in properly, itis very evident, it is a quick check. Sb
38
developed. After engine shutdown, an REFERENCESoil sample analysis revealed traces ofmetal, although not beyond that deemed 'James Provenzano, oba Games, Alunacceptable. The dotted line is an Wyrostek, Art Ostheimer, Jack Young,extrapolation of the initial slope and "UH-lH AIDAPS Test Bad Program,"gives an indication of the shock level Vol. I and II; USAAVSCOM Technicalstabilizing at a factor of ten higher. Report 72-18, Aug. 1972.Two more runs were made which essen- 2Robert R. Butcher, Rassel Kirby, Jr.,tially repeated curve E-F-G. Teardown John Nakakihara, T. C. Watkins,analysis showed that the original de- "UH-lH Test Bed Program." Vol. I andgradation had not changed noticeably II; USAAVSCOM Technical Report 72-19,but that new spalls were found on the June 1972.outer race and on one ball bearing. 'J. A. Giorge and 1. N. Andres,
"Parks College UN-I AIDAPS Program,"SUMMARY Parks College of Saint Louis Uni-
versity, Final Report, Sept. 1974.The use of shock pulse techniques #P. L. Howard, 'Shock Pule Instrumen-
has proven successful as a diagnostic tation', Proceedings of the 14thtool in the limited applications on the Mechanical Failures Prevention GroupUU-l to date. The NMPA-10A shock pulse Meeting, Los Angeles, Calif., Jan.amter has shown its ability to diagnose 19711 MFPG Technical Import 2,deraded hanger bearings, particularly Feb. 1971.when significant degradation exists. 3t. F. Covill, T. C. Mayer, 3. A.A single shock emission envelope has George, 'Preliminary Evaluation ofbeen developed which can be used to the Shock Pulse Technique to the UH-lseparate hanger bearings of normal Series Helicopters." Parks College ofwear, or the onset of damage, from Saint Louis University, Jan. 1974.those with severe damage.
Although not able to isolate theparticular damaged element in a morecomplex unit such as the 420 gearbox,the NEPA-10A does show promise in indi-cating those with some level of degra-dation. Furthermore, in one case, ithas shown its ability to respondquickly to rather small changes indegradation.
Work continues in enlarging thepresent data base as well as investi-gating the extension of the techniqueto other power-train components suchas the 900 gearbox, transmission, andengine.
ACXNO1LEDGFXETS
The investigation was supported byU.S. Army Aviation Systems Conmand un-der Delivery Orders DAJ01-72-A-0027-0001 and -0002.
37
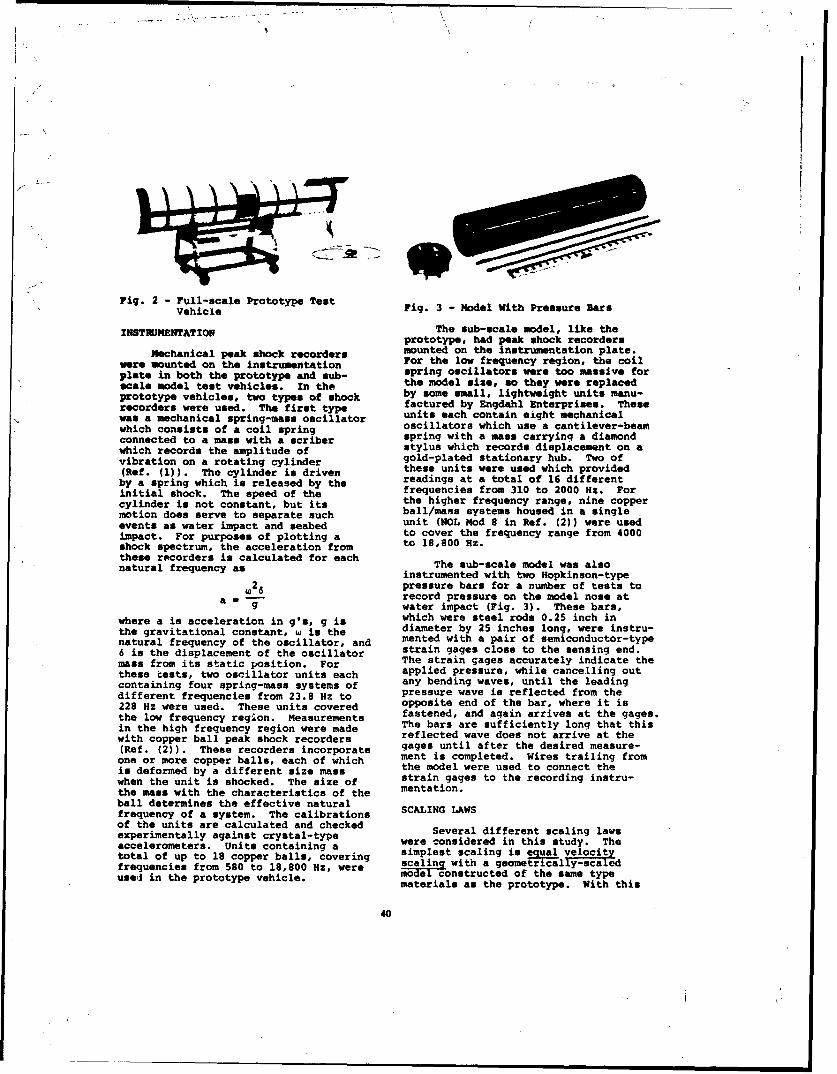
Fig. 2 - Full-scale Prototype TestVehicle rig. 3 model With Pressure Bars
INSTRUMENTATION The sub-scale model, like theprototype, had peak shock recorders
Mechanical peak shock recorders mounted on the instrumentation plate.were mounted on the instrumentation For the low frequency region, the coilplate in both the prototype and sub- spring oscillators were too massive forscale model test vehicles. In the the model size, so they were replacedprototype vehicles, two types of shock by some small, lightweight units manu-recorders were used. The first type factured by Engdahl Enterprises. Thesewas a mechanical spring-mass oscillator units each contain eight mechanicalwhich consists of a coil spring oscillators which use a cantilever-beamconnected to a mass with a scriber spring with a mass carrying a diamondwhich records the amplitude of stylus which records displacement on avibration on a rotating cylinder gold-plated stationary hub. Two of(Ref. (1)). The cylinder is driven these units were used which providedby a spring which is released by the readings at a total of 16 differentinitial shock. The speed of the frequencies from 310 to 2000 Hz. Forcylinder is not constant, but its the higher frequency range, nine coppermotion does serve to separate such ball/mass systems housed in a singleevents as water impact and seabed unit (NOL Mod 8 in Ref. (2)) were usedimpact. For purposes of plotting a to cover the frequency range from 4000shock spectrum, the acceleration from to 18,800 Hz.these recorders is calculated for eachnatural frequency as The sub-scale model was also
instrumented with two Hopkinson-type
28 pressure bars for a number of tests to-- record pressure on the model nose ata - g water impact (Fig. 3). These bars,
where a is acceleration in g's, g is which were steel rods 0.25 inch inthe gravitaticlation nstant, is the diameter by 25 inches long, were instru-natural frequency of the oscillator, and mented with a pair of semiconductor-type6 is the displacement of the oscillator strain gages close to the sensing end.
mass from its static position. For The strain gages accurately indicate thethese tests, two oscillator units each applied pressure, while cancelling outcontaining four spring-mass systems of any bending waves, until the leadingdifferent frequencies from 23.8 Hz to pressure wave is reflected from the228 Hz were used. These units covered opposite end of the bar, where it isthe low frequency region. Measurements fastened, and again arrives at the gages.in the high frequency region were made The bars are sufficiently long that thiswith copper ball peak shock recorders reflected wave does not arrive at the(Ref. (2)). These recorders incorporate gages until after the desired measure-one or more copper balls, each of which ment is completed. Wires trailing fromis deformed by a different size mass the model were used to connect thewhen the unit is shocked. The size of strain gages to the recording instru-the mass with the characteristics of the mentation.ball determines the effective naturalfrequency of a system. The calibrations SCALING LAWSof the units are calculated and checkedexperimentally against crystal-type Several different scaling lawsaccelerometers. Units containing a were considered in this study. Thetotal of up to 18 copper balls, covering simplest scaling is equal -sl itfrequencies from 580 to 18,800 Hz, were saing with a geometricall alusel in the prototype vehicle, modelconstructed of the same type
materials as the prototype. With this
40

STRUCTURAL RESPONSE MODELING OF A FREE-PALL
NINE AT WATER ENTRY
R. H. Waser, G. L. Natteson, J. W. HonakerNaval Surface ,"eapons Center, White Oak Laboratory
Silver Spring, Maryland
Shock levels were determined for a mine-test vehicleduring water entry at near-normal angles. Experimentaltests were made with a sub-scale model and full-sizeprototype. Scaling laws were developed which producedgood data correlation. A computer analysis was madeusing a structural response program which producedresults in agreement with the experimental data. Also,pressure measurements were made on the nose of the sub-scale model which indicated a non-uniform pressuredistribution with very high localized pressure transients.
INTRODUCTION its high drag to produce a minimumwater-impact velocity and minimum
An underwater mine is under study seabed impact velocity. This shape,which can be planted by aircraft, being however, does produce a maximum water-dropped from any altitude without a impact shock for a given velocity.retardation device. Among the advantagesof eliminating retardation devices, suchas parachutes, are that the shorterdescent time reduces drift and henceincreases placement accuracy, the reduced ..air time decreases the probability of .enemy observation of the planting, andthe mine is mechanically simpler, morereliable, and hopefully less expensive.The resulting high-speed water impact,however, about 900 fps, results insevere structursal loading and bottomburial problems. This study wasdirected only to the water-entry - -4problem, specifically to defining the L• .structural loading conditions, thestructural response of the mine, andthe failure modes. The analysis covers "
only the axial loading at water impact, Fig. 1 - Free-Fall Nine Test Vehicleand does not consider possibletransverse loading produced at a later Two vehicles were built to thetime ay slap against the water-cavity full-scale dimensions, and one sub-wall. The approach taken was to scale model was constructed. Figs. 2conduct experimental tests with both and 3 show one of the full-scalesub-scale and full-scale vehicles, and vehicles, and the model, respectively.to use the resulting data as input to, The sub-scale model, gmetricallyand verification of, a computer analysis, scaled and constructed of the sime type
materials as the prototype, was designedTEST VEHICLE DESIGN to be launched from a 5-inch-bore diam-
eter air gun into the NSW Hydroballis-A test vehicle, shown schemati- tics Tank. The exact model diameter
cally in Fig. 1, was designed to was 4.855 inches, givinq a scale factorrepresent the proposed mine. The proto-type characteristics are a weight of 4.8552060 pounds, a diameter of 21 inches, - - 0.231and a length of 120 inches. The caseand structural components are all steel.The flat disk nose shape was chosen for
39

so that PRESSURE MEASUREMENT TESTS
Knowledge of the pressures on thet nose of the vehicle at water entry was
i(Xaxm XTN desired for input to a computer for(____( - TN.....JA-L...... analysis. Accordingly, the sub-scale
______ model was instrumented with twoHopkinson-type pressure bars asP previously described. With this
or instrumentation, the model was firedinto the water with a trajectory5 degrees from vertical at velocities
(a..ax). - (amax)p of 150 to 200 fps.
For the shock region where the input The pressure data obtained frompulse duration "sgreater than the the pressure bars, which is believedvehicle natural period, i.e., for to be accurate, showed wide variations
in amplitude and rise time from test totoulse test. Maximum amplitudes varied by a
'>1 factor of five or six, with the higherreadings a factor of two above the valueof pcV (where 0 and c are the density and
the value of sound speed of water, respectively, andV is the model impact velocity) whichis the theoretically maximum obtainable
". ft 1 value. It is hypothesized that the;Umax following may be occurring (See Fig.
(4)): air pushed in front of the bodySince dishes the water surface before impact
so that effective impact angles less- u than the trajectory angle may occur.
These shallow angles accelerate theit then follows that water tangentially at very high
velocities. Measurements of differencein time at which the two nose gages(imaxdm 0 (;4max~p first saw pressure indicated water
or velocities up to about 4000 fps, or 20times the impact velocity. Water at
(amx) M f (%m&Xp)p these velocities, when stagnated withinthe dished surface, would generate high
if it can again be assumed that the erratic localized pressures such asvehicle responds as a simple spring those observed. Because these pressuresmass system, are localized, it is not possible to
use a limited number of readings forIn summary, the modified Froude purposes of calculating impact forces
relationship. which have been derived or accelerations. The pressure measure-are as follows: ment portion of the program was there-
fore terminated.velocity vm = VSHOCK MEASUREMENT TESTS
length 1m ) lip a. Sub-scale Model Tests. Thepressure Pm a APp 0.231-scale model as used for shock
measurements contained the mechanicalfrequency Wm = /A peak shock recorders described above
mounted on the instrumentation plate.The recorders gave readings at 25
(amax)m - (amax)p different frequencies. Tests were madetX at 150 fps with an entry angle of 85
tPulse degrees. Fig. 5 shows data frow sixTN 1 0.5 of these tests. The relationships from
acceleration which the shock spectrum grids are(amax)m W(amax)p for drawn are W26
!Bain a-> and va -WTN A few tests were made at greater
velocities, with permanent deformationof the nose in the form of dishing tak-ing place at 300 fps.
42

scaling, the stresses experienced by stiffness of sections results inthe model are exactly equal to those correct modeling of failure modes.of the prototype and the scaling holds Ref. (3) deals with this type modelingthrough gross plastic failure. The in some detail. Applying this modeling
only feature of this scaling which may is difficult because of the unavailabil-be undesirable is that the accelerations ity of structural materials with thefelt by the model are higher by the desired properties, which then dictatesscale factor than those experienced by making compromising gecmetric changes.the prototype. Following are thescaling relationships where A is the in this study a modified t ofscale factor, and the subscripts m and Froude scaling was use3 wEI a ows usep refer to the model and prototype, of-ienEIT-Fnterials in model andrespectively: prototype and seen to work well for
scaling peak shocks. This scalingvelOCity v 3 -p involves the use of different scalingrelationships in high and low frequencylength I Al regions. The velocity scalinq is the
Froude relationship v%- •vp and sincetime ta Atp the structural materials of imodel and
prototype are the same, the frequencyacceleration am - ap/A relationship is we - wa . For the low
freency r where the input pul-e-stress am 0p duraion iissiort with respect to the
vehicle natural period, i.e., forstructuralfrequencies -= aiA -Eulse ftmzlse
TN < 0.5The other scaling law studied was
Froude scaling. This scaling was the following analysis can be used.c on beciuse Froude number governs Consider the dynamic load factor curvethe dynamics of free-surface flow, and for a simple spring mass system asthe input accelerations to a rigid shown below (Ref. M4)) where u is themodel and prototype are equal. The displacement input to the system and xbasic scaling relationships are as is the response.follows:
velocity vm - /AVp
length l, -=W
time tm - /t
acceleration : m rinput am a a p i8
pressure Pm APp t 0 1 2 3 t1
If the same type materials are used formodel and prototype, the structural STYS WIT E
frequency relationship is wm a w,/X. maxThe time and frequency relationships For the region ul 0.5 -
are not reciprocals as they must be. TN . UaxThe result is that the pressure input k tpulsepulse duration is too long with respect where k is the slope of theto the model natural frequency. TNFurther, the pressure relationship is response curve. Then,rather than unity which means thatincipient and subsequent plasticfailure will not scale with the samematerials. Thus, true Froude scaling m a Tm ) mrequires the use of materials withdifferent physical properties. The (xmax) (tPulse)time relationships will be satisfied If Umax p TN pmaterials are selected to keep the.Cauchy numbet constant. The Cauchy where the subscripts refer to the modelnumber is NV'/tL3 , where the quantities and prototype respectively. For Froudeinvolved are mass, velocity, modulus of scaling
t elasticity, and length. Furtherattention to material strengths and
S .41
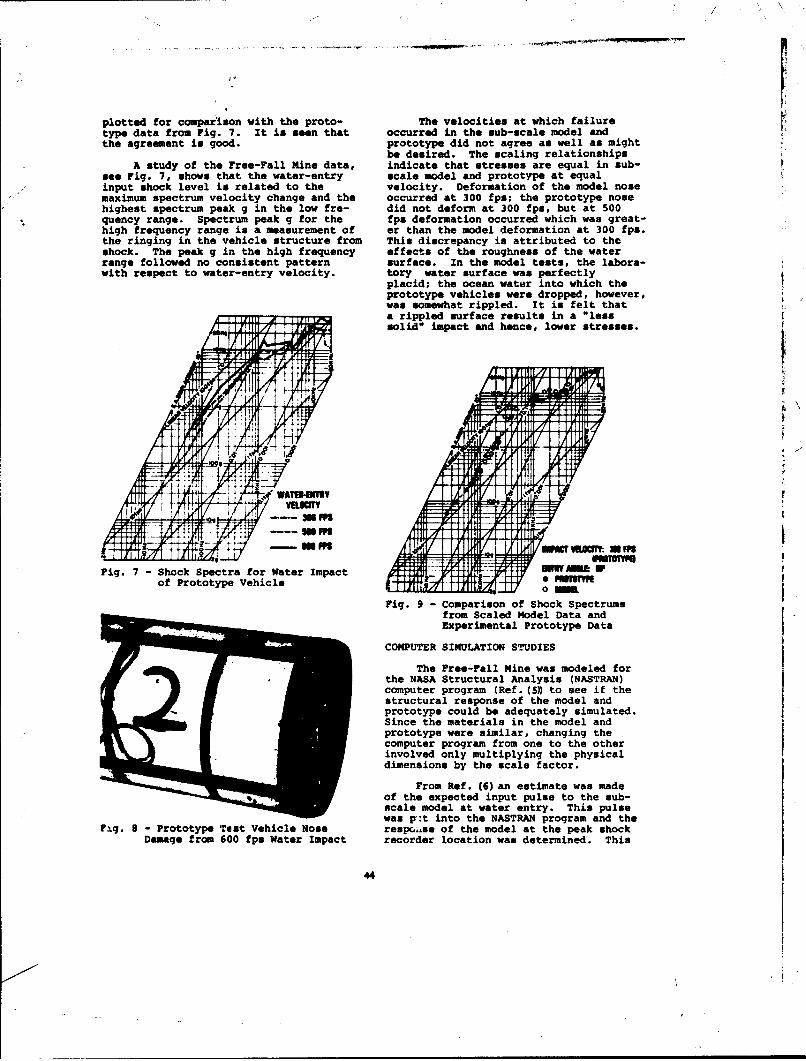
plotted for comparison with the proto- The velocities at which failuretype data from Fig. 7. It is seen that occurred in the sub-scale model andthe agreement is good. prototype did not agree as well as might
be desired. The scaling relationshipsA study of the Free-Fall Mine data, indicate that stresses are equal in sub-
see Fig. 7, shows that the water-entry scale model and prototype at equalinput shock level is related to the velocity. Deformation of the model nosemaximum spectrum velocity change and the occurred at 300 fps; the prototype nosehighest spectrum peak g in the low fre- did not deform at 300 fps, but at 500quency range. Spectrum peak g for the fps deformation occurred which was great-high frequency range is a measurement of er than the model deformation at 300 fps.the ringing in the vehicle structure from This discrepancy is attributed to theshock. The peak g in the high frequency effects of the roughness of the waterrange followed no consistent pattern surface. In the model tests, the labora-with respect to water-entry velocity, tory water surface was perfectly
placid; the ocean water into which theprototype vehicles were dropped, however,was somewhat rippled. It is felt that
Lo-W a rippled surface results in a *lesssolid" impact and hence, lower stresses.
-4.-
Fig. 7 - Shock Spectra for Water Impact N-. •of Prototype Vehicle
Fig. 9 - Comparison of Shock Spectrums
Experimental Prototype DataW mCOMPUTER SIMULATIN STUDIES
3NThe Free-Fall Mine was modeld for
compter program (Ref. 15 to see if thestructural respnse of the model and
ofprototype could be adeuately smulate.Since the materials in the model andcomputer program from one to the other
• involved only multiplying the physicaldmensions by the scale factor.
From Ref. (6) an estimate was madeof the expectd inpt plse to the sub-scale model at water entry. This pulsewas p:t into the NrTRAN program and the
Fag. s - Prototype Test Vehicle Nose response of the model at the peak shockDamage from 600 fps Water Impact rcorder location was determined. This
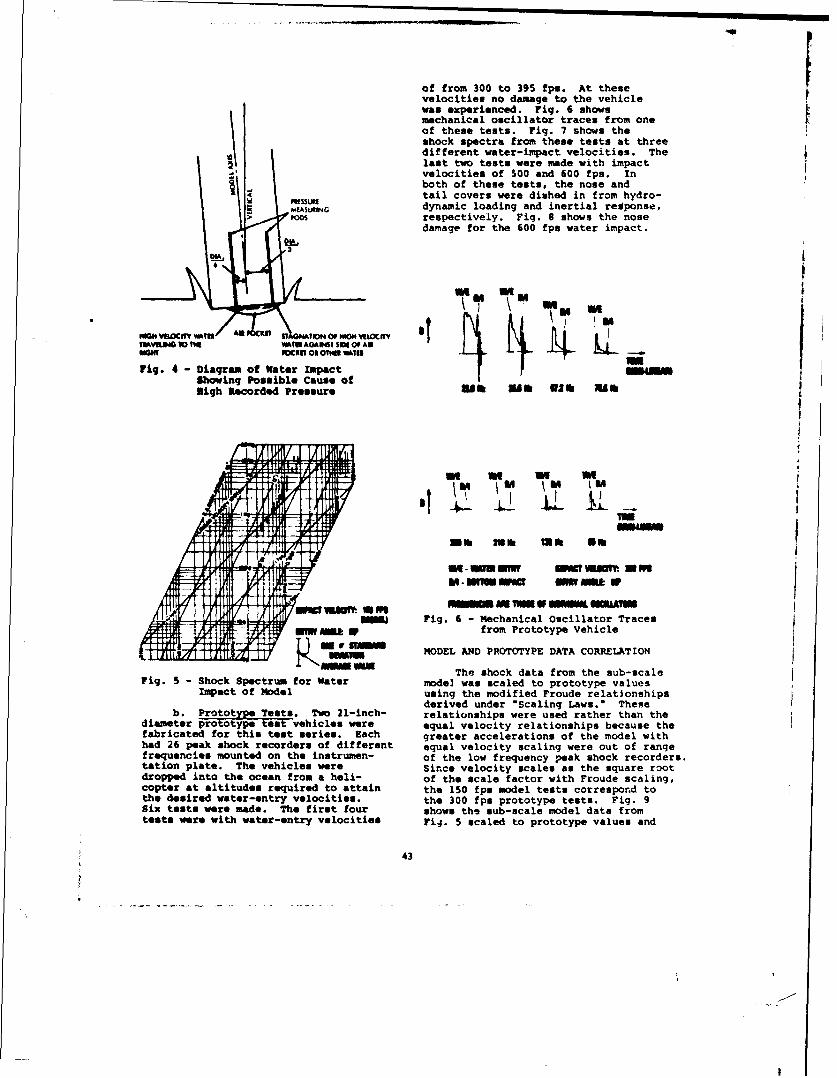
of from 300 to 395 fps. At thesevelocities no damage to the vehiclewas experienced. Fig. 6 showsmechanical oscillator traces from oneof these tests. Fig. 7 shows theshock spectra from these tests at threedifferent water-impact velocities. Thelast two tests were made with impact
-, velocities of 500 and 600 fps. Inboth of these tests, the nose andtail covers were dished in from hydro-
AON dynamic loading and inertial reaponse,> POO respectively. Fig. 8 shows the nose
damage for the 600 fps water impact.
"AIUGTo" WHOAA"IS SWE Of As Iki LBMW UOCKIP OSAM WUI
Fig. 4 - Diagram of Water Impact UNKshowing Possible Cause ofNigh Recorded Pressure ats1 111 Nbl N01 I
o t -111IN IN ING on
o NUNt 1ý -a Mom aMI TMW S1ýGNAIN
now mmuuinawFig. 6 - Mechanical Oscillator Traces
ow ý W from Prototype Vehicle
MODEL AND PROTOTYPE DATA CORRELATION
The shock data from the sub-scaleFig. 5 - Shock Spectrum for water model was scaled to prototype values
Impact of Model using the modified Froude relationshipsderived under "Scaling Laws." These
b. Protote ts. Two 21-inch- relationships were used rather than thediameter p-rototp Ites vehicles were equal velocity relationships because thefabricated for this test series. Each greater accelerations of the model withhad 26 peak shock recorders of different equal velocity scaling were out of rangefrequencies mounted on the instrumen- of the low frequency peak shock recorders.tation plate. The vehicles were Since velocity scales as the square rootdropped into the ocean from a hell- of the scale factor with Froude scaling,copter at altitudes required to attain the 150 fps model tests correspond tothe desired water-entry velocities, the 300 fps prototype tests. Fig. 9Six tests were made. The first four shows the sub-scale model data fromtests were with water-entry velocities Fir. 5 scaled to prototype values and
43

H
CONCLUSIONS v, V - velocityx - response displacement-
The following conclusions have 6 - displacement of oscillator mass Aresulted from this study: A - scale factor
P - density of water1. Sub-scale model testing is a a - stress or standard deviation
valid, economical technique for obtain- W - frequencying structural response data from avehicle experiencing water entry. Subscripts
2. The simplest applicable scaling I - modelfor the structural response of a water- N - naturalentry vehicle is equal velocity scalina p - prototype Vin which the sub-scale model is geomet-rically scaled using the same materials REFERENCES ,as in the prototype, with model andprototype test velocities equal. The 1. V. F. DeVost, "Shock Spectraonly disadvantage of this type of Measurements Using Multiple Mechanicalscaling is that the model accelerations Gages,* Naval Surface Weapons Center,are higher than those of the prototype NOLTR 67-151, 20 Sep 1967by the scale factor. (This disadvantagemade the use of equal velocity scaling 2. G. L. Matteson, "Calibrationimpractical for this study because low of NOL Copper Sall Accelerometers,"frequency peak shock recorders with a Naval Surface Weapons Center, NOLTRsufficiently high acceleration capa- 72-67, 7 Mar 1972bility were not available.)
3. Baker, Westine, and Dodge,3. A modified Froude scaling Similarity Methods in Engineeringtechnique for water entry Treationships Dnamics, Hayden Book Co., N. J., 1973given under "Scaling Laws") is validwhich does not require the scaling of 4 . Harris and Crede, Shock andmodel material properties as is required Vibration Handbook, Volume 3, McGraw-for exact Froude scaling. Hill, New York, 1961l
4. Using a structural response 5. C. W. McCormick, The NASTRANcomputer code, such as NASTRAN, with User's Manual, NASA SP-222-(01), Jun 1972experimental model data from a series of I'peak shock recorders, the input pulse at 6. J. L. Baldwin, "An Experimentalwater entry can be inferred. Once this Investigation of Water Entry," Ph.D.is done, the pulse can be scaled to the Thesis, University of Maryland, 1972full-size prototype case and thestructural response at any desired SPONSORlocation can be obtained from thecomputer. This program was sponsored by
NAVSEA-03512, Dr. T. Peirce.ACKNOWLEDGEMENTS
The authors would like to acknowl-edge Dr. J. E. Goeller for his assist-ance with scaling laws, J. M. Etheridgefor running the NASTRAN program, andH. K. Steves and D. F. Newell for helpwith the experimental program
NOMENCLATURE
a - accelerationc - sound speed of waterE - modulus of elasticityg - gravitational constantk constant1 - characteristic length dimensionM - massp - pressuret - timeT - periodu - input displacement
46

response was put into a smaller computer This pressure relationship is felt to beprogram to determine the responses of the valid f or impact angles up to 85 deqrees.peak shock recorders. The pressure pulse The resulting pulse was inputed to theimputed to the NASTRAN program was then NASTRAI4 code with the prototype vehiclemodified to bring the calculated peak dimensions and the output warn analyzedshock recorder responses into good agree- to obtain a peak shock spectrum. Fig.sent with the experimental responses. 12 shows this data compared to full-Pig. 10 shows the input pulse to the scale experime~ntal data.NASTRAN program and the computed responseat the location of the peak shock record-ers on the instrumentation plate in themodel. Fig. 11 shows the shock spectrumcalculated from Fig. 10 plotted forcomparison with the experimental data Itfrom Fig. 5. 7
DAR? wVIOWY IMm *WMEms . DOW ANGUS. IP
-- 4CAtCUL0AIED ACCEEIATION.ftft. EJIPEWINCED ON MMOL AAMU
I SSTKMJAANTATION PLATE cýW
.10. __J_ 0 _________WK
101 X0 300 40030 Fig. 11 -Comparison of Computed andTIME MICEOSCOt.QS Experimental Shock Spectrums*
for Model
PISSURE PULSE APPLIED fl
104 IEE EOLOOTO N4OVL NOSE ý
Fig. 10 -Computer Code input and
Having inferred the input pressurepulse to the sub-scale model by attain-ing agreement between the NASTRPJ4 pro-
gram and the experimental data, thisinput pulse pressure and duration wereIscaled to prototype values using therelationships M0
Fig. 12 -Comparison of Computed and
Vm t Experimental Shock Spectrums-p a Vp for Prototype
45

structure and to simplify the required analysis. [an teer b shown in Fl., 3.al this bs accomplished by designing a structure for a col--W load greater than the working load. The reultingst~cwe bean the working load with negligible pernna-aunt deformation. The formation of a plastic hinge in astructure does not necessarily a&How collapae beat merely W 0allows a redistribution of stresses. The reserve strength T)(3beyond yield allows rotation of the plastic hinge as theload is ' creaaed. Redistribution and the increa-se in load 0winl ultimately result in a collpse mechnism. The cot- ilapse sechanimn in terms of a static load constitutescatastrophic failure: howeve, the collapse mechanism alsoconsstitutes energy dissipation greater than the elasticswabl energy per unit of displacement. For example, theenerngy dissipated at a displocensent twice the elastic 1m1t DISPLACEMENTltsa simple structure my be foer tlsaes that absorbed Fg odDslcmndeistically. At two elastic &Wt displaiersuts. defleFl. LadDiplceen
aiso lkely to be visible.The are under this curve represents the energy
TItese basic prinlpa can be readilly shown by abmbior dlisspated. Theo energy at the formation ofexample. Consider a fixed ended besam (Fig. 1) loaded the mechanism is about 4.0 done grester than at theat its center-, the beam thus representing a founidation and *tic limsit. Beyond the mehsia formation the ener.thet load repreaenting an equipment. V dissipation for each increment of displacement equal
to the elastic blmt is about 3.0 times greater then theaMp at the elastic limit. In termy of a step velocityIsput of my 10 ft/sec to reachi the elastic limit it wouldrequire 20 ft/sec: to reach the mechanism formation. On
____________FRI ___ the other hand a fight structure could be substituted ifthe input is held at 10 ft/sec. Allowing three elasticbiait displacemsnets, a weight savring of 7S percen t can beresuged.
Fig. I - Simple System ESTRY AND STATUiS
A compiarison of the eneries at varlous points of The plastic design of statically loaded steel atruc-di'espaeent will demonstrate the advantages of plastic tome was initiated neartly 50 years ago. In 1961 there
design. The loads associated with the example me as; were moe than 2.000 structures built which had beenshown is FWg 2. - usiing the plastic design methods. These struc-
turn have deosrtdthe usefulness of plastic designw applied to static loads. It is expected that the gainsto be made is structures designed for dynamic loadswould be even more profitable. This can be realized since
__________________________static structures deform catastrophically when the loadreadhes the colapse 1-id while is a dynamic structure thecollapse mechanisn .&-rey allows energy dissipation.
Fig. 2.- Dean Lading Early investigations curled out by the DrownUniversity under contract to Naval Ship Research and
The beams may hawe four stages of deformation: Development Center (NSRDC) produced methods whichlooked promising toward application to certain classe of
I . Elastic limit atructusres subjected to Impulsive load. These methods2. Plastic hinges have formed at the ends and others developed at NSRDC were applied to some
and the load Increases; towars the ulti- simise structures by NSRDC. Experimental investigationsmete load. were carre out and correlations were made. The me-
3. Ultinate load is reached softe showed that these methods give acceptable estimates4. Deformation beyond the mnechanismi for- on the plastic deformationt expected. These investilmtoris
instion, ware carde out on shimple structures as an initiation ofthe waet to develop a plastic design methods. Three
The load displacement relationship for the beI system. were invesrtigated:
PLASMI DESIGN ANALYSIS OF SHIPBOARD
EQUIPMENT SUBJECTED TO SHOCK MOTIONS
Lwdil T. DuonNaeld %l Resarch and Deveiopsmeat Cmnter
Umierw we Eaxubdosu Rameuech [*AIsaPortsmouth. Virginis
111e app~llrnl of plawic design esClaniues INou -*m is hlemmedo. Einph
Is Plce an applemuoms Is the *a&c desig of equipmen a saw ct Appoxzi.
wbee sallsetdisplacemntgwuw t aflowable.
VIT4TODuCTON bemee in this massipy.
Mae coplxity of modes nava enis d sals. Little, asandma has, baee. gve to the efficiencyrmss equies coastant updating of design methods and of de.L Overdkes~ima foandetloew foe example can be
procedures. This is particularly truen of Ughi hlglrnped bwpeovd signiflcaaidy by takisq advantag @f te resweradaned d. New dsign mesthods said design, criteria strength in the mateuial Wh~ Iits yield point. This re-
whic wil remit Is weight ad space nviep ae ementiaL iserv strength obie with th redundmecy eneralMyIn current navael Vesels Ohee exist atructee which ae ecntened is fowdaieom design cam merve to optimizeobviously ovedegd ad would af*slow sigificant seehi foundation effldiemcy. To makevi of themutis weigt ad! spsce; fowtdations in psrenuier. stellt requires pimlic desdg pIcdua Currently,
plastc design peocedures. me practically nonexistent foeShipboaud equipieuat cm be divide into three. dyntemic loaeds.
ceompiela of dei: One category cm be clasiid mthose equipmentse which always reqube a dose aigpnment. Sbnpl one degsee-of-fmdom bearn structures ainFoe thes eqIuipments It Is nectams y that response to plastically designied Wing the bait toad procedure (seeoperating and shock"lad be confined to the elastic ranp. DDS 9110-7). Mont complex structures may be designedEquipments such as SINS. turbines. rsducto gsa. shit- using an elastic anaslysis peocedure (DDAM) but using re-bi. turbogenerstoes and simiarl item. fadin ma hi categoey. duced inputs. This procedure remults in a structure whichA second categoey which includes a large nuajoelty of will defornm plastically at the unreduced shock level. ThesthiPbourd structure and equi~m e t may be classified as resulting deformation or resp of the structure is ofthose items which do not Mequk %i aet mad ca sllow course unknown. This liaited unp of the plastic des~nsmall deformations. Piping. revihlentiy-mounted equip. concept done not allow optimization of design efficiency.meants and -ey foundations foe example cmn be consilder-ad for this category. The enormity of this category in "particular warvants a careful consuderaitlon of new maethods
wihmay laIen coats. weiol and Moac requkementa. The pspose of tais paper is to delineate theA tbkd category may be c~lasfied as those Itm which plastic design method foe hilpboard application and thecm tolsesate tarp deforemastiorn (deformations grester expected gains.t6= foew ehti limit dispacemnwt). Foundetoiom foedlectrovie cabiarse wOFoa cadles ad downa. decks. Phasti Design Methodoingystafchiaowseaid other support sbteutuu cm be comieefor this category. Methods which result in significant hestic devilin Is the art of utilizing dwthe reveshok protection are abvsitageoum and necesay foe many stuength of dwcil materials to optirize the efficiency of471
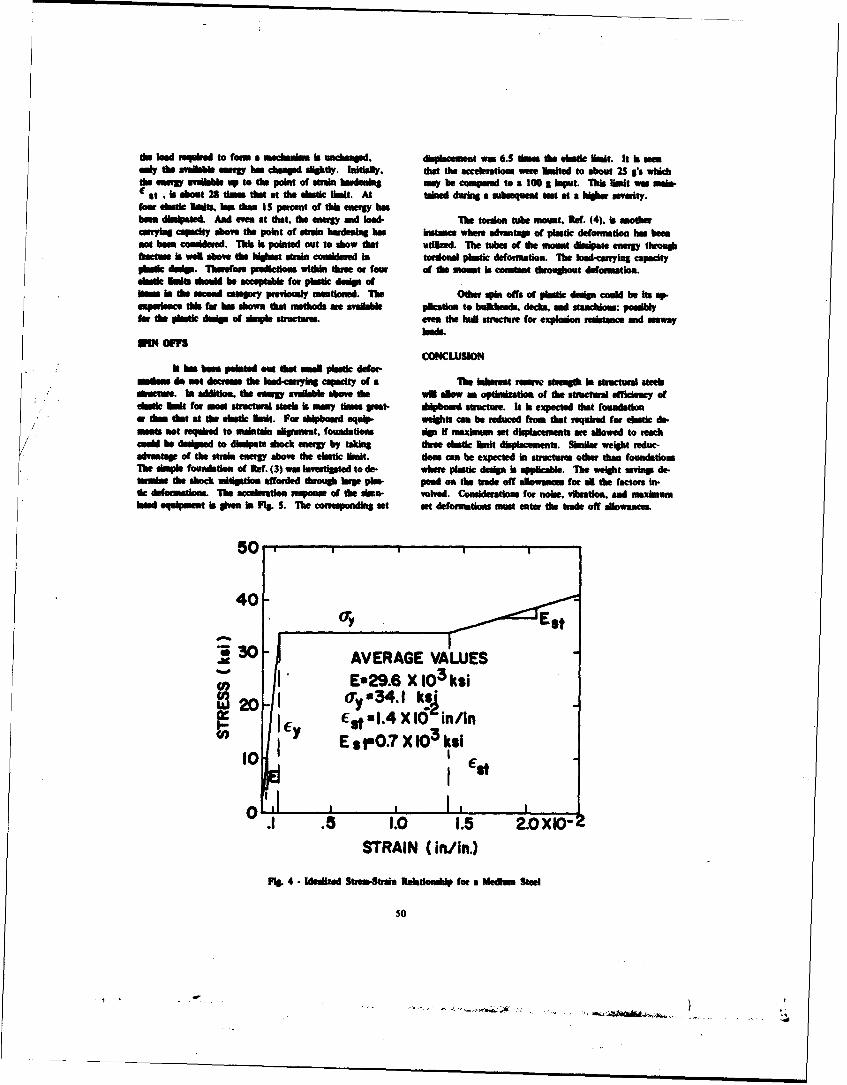
the laed requbud to form a mschmalow Is unchangod. diplacaen~t Was 6.5 thwes the e lbastc t. It Is ansomly tbe available miy hasW chsaWu slghtly. Intaltly. that the accelerations wene MItad to sbout 25 gs whichthu -ene availaleh Up to the point of strain hardniAMng may be comfared tor aO 10g input. This that was eda-fe fi i about 25 Urnss that at the elati "ht. At tubed during a oabequent "a at a hlogheriverity.four ehtInic at, lea than 15 percet of this enera hasbass dhindaesd. And am at that. lbs energy and toad- The torion tube moewt. Ref. (4). is mothercarrying capacity sho e the point of strain hurdening has hustance where advantage of plastic defoematlon has beennoe been coeddee. This Is pointed out to show thot atlized. The tuba of the molt "haiato energy tiwouiphMF-ata is well above the MOMes strom comidered in tortioru plastic deformtation. Thbe wed-amaring capacityphaicd desip. Thereore predictions within three or four of the mouwt ks costant teougoust deformation.ehati on"e tob" be am"ptb" for plastic delpa ofburn Is the seoond category peevioruly mentioned. The Other spin offs of plastic design could be Its Wp
euiluethis he haS 2hown tha method w aAiM b pleston to buldheadg. decia, end stanchiuons; pooiblyfa he daplast dusp of uinyle structures. eve the huE structure for exploesio reetance and aseawey
CONCLSONIt has been pointed adoutht small plastic defr-
sintern do ml et ra the load-cnrrying capacity of a The inherent ram stegt in structural atee"adtm h addition the emneg awdlable above the wil alow an op~thation of the structural efficiency of
dessl hat for ostw strctwlw sfteel is may theas West- ft~bo"r structure. It is expected that foundationar* at * at the ehtchalt. For eh46,o--d equip- wreght. can be reduced froms that requked for elastic don.
Nae ot req1We to Maintim allpmment. foundations sig If maxiniawn set displaements are allowed to neachcould be deigned to dinlpete shock energy by taking these elastic hadt displacements Sinuiar weight reduc-Aivetape of the strain enegy above the elastic Knit, does am he expected In structures othe than foundations
The sipe foundation of Ref. (3) was investipted to do- woere plastic desig Is applicable. The weight aseing de-a the shoc ritdtdo fafoded throug belg. plas. pend on the trade off aflowanors for aNl the factors in-
tic defoemations. The acceleration response at the sbau- volved. Considerations for noise, vibration, and ranximumebeed equipment is gie is Fit. S. The corrupondisag wt sat defoiniations meut enter the trade off allowances.
40-
.w AVERAGE VALUESft0
a: Cy faI.4XIQ in/inE 8 jsO.7 X10 3 ksi
.1 .5 1.0 1.5 2.0 XlO-STRAIN (in/in.)
Fig. 4. -Ielizaied Strain-Shin Relstioaiulp for a Riedhen Steel
so

1. Tip boded castieve kern. be an -m down. do Idci awld tex ews-2. ibseapi. been mental dmfemaalsdm are wft ht ehlatic limit displax-3. ftph fIammedata wea. It theuli be milds m mamas fouw cehtic limit
dpcmtsthe udefnrn - tweo muletohe am..EA&h of theme syaewas IrnsItalled on the Float- The peak divisimumat it *ae -e been for a%-
ii Sback fleifoema (FSP). Simulated underwaer weapon ample, vm n *m thde ofmi 1/4b&c in a Van letqth ofattacks -eet comisacud. Analytical jasedlietio. on the 78 1ni. The Dwap in my wA'eI structure amountsmet - Ila, ,ea wire compared to the expe 'no iena at- to this uch samidw andl m, ceptbl. Even thoushsite. Theme bnoeslptia.. are reported in Ref. (1), (2) them msructuams defolved I~ - 3it sbouldl be pointed;said (3) upeqctively. A wmumeay of compmelmorn in Red. out that their lsadvarrying capacity was unelterd. Re-(1)land (2hWp&Wm in TablesI said2. The abbeewlotlong ferlgto Fig. 4.skeinup w 3ar 4 therthat attheBlvmm in Table I ladicaee the various mehdw& which were dehtic as ispmmrnt WAY a a"patties of the availbleemehated be she stdy. Detab of the methaods me, gphem "wily mpIi by dwsn Une mim the wuderalmin th efierences. mew Upoi. giai haer a mar of fe ank eeimitsm
TABLE ICamibm Bimn COwiaps"of itTUsoveical awl Expellwasd noo Ddssimn
bow noleti, DaMoewRmpm
DA -2. -2atl.38fctl-2.t Mode 1 A 2.Mr-3.25tL44IA -24 29 RldNfc~ -2.45l -3.de A 2.5ro-303 l.0
a 49 De 97 -113 -169 .112 -162o21
D ~ ~ Mta 42 0-9eak -. 2 05 -1.6 411
D )47 -. 7 0-0e13 D-0frenc 01.264
RR R"Wid-Uhasdc Bound 04EPA EesAcPperfa Rly-Pbstic Mode 0.poxmaio
Expe-eWh aclymea ade Appoxmaio
A~~~~ c-plt Dto eiene i pemam po
e Elati Lii Dipacmn

IN Addition to the Savbog in weigh which relates mest Cauter Report 2191 (Mar 1967).so costs. there is also an expected cost reduction dume to
the simplicity of plastic desip analysis methods. (2) Butt, L T.. "Shock Dump Aim"yl of a Thr~eeSpan learn." Naval Ship Research and Development
The ligter stsuctres resulting from plastic de- Center Report 32S9 (Aug 1972).sip tend to reduace the hard spots usually associated withfoundation mid deep fraomes The lighter structures re- (3) Butt. L T., 'Inelastic Analysis of a Simple Mach.qirsie less attachment weld which minimizes weld stream. hinem Foundation SubWctd to Underwater Explo-
sio Attack," Naval Ship Research and DevelopmentAditional -n are possible employing plastic Center Repo"t E SD 177-120.
deforantion concepts in shock mitigation.(4) Butt. L T.. 'The Use of Torsion Tubes to Approach
REFERENCES the Ideal Constant Force Maintenance-Free Restor-able Shock Mount." Naval Ship Research and De-
(1) bItt. L T. at AL, "Siock Damage Mechanhan of a velopasut Center Report 2545 (De-c 1%9W9.Siple Structure." Naval Ship Research and D~evelop-
Mr W W Mar elrtings"MElectric orp Didl PtBtt: A nt evActly. The design
of strain rate on yield stress? I think there a small Plastic deformation does rat affect theare a numbrer of curves aroundi, one by manjoine, function of the equipment or the structure,andl it was around from the year ner. or did and to limit the displacement to som allowbleYOU Just guess at it and amhoew~ well it matched? value tlat yjou can tolerate.
Mr. Butt: Dlt prior to the test. Prior to the Mr. R~rkOis: (Naval Research Laboratory) Years;tarts it was cummu knowledlge that the strain ago I workedl on bolts and you have a Problem;rate would not affect motions at these rates; tewe is a shock fatigue cocaept and every timebut after finding this difficulty we did go you get into the plastic range it is an irreve-back and lock through the literature and the rsible process. You can't tring the materialstrain rates that we had for this steel agreed back to its original condnition so even in boltswith the data in the literature. 'Ita dobling there are a certain numnber of stocks toof the yield stress was in accrdance with failure. You might have an initial set ofthe data that had been found for steels sirilar .25, later on you will get another stock andlto this; but there is a very limited amount of you adid another .25, and you get an accumulatived&at for the strain rate effects on the new deforr'ation until the material breaks. So yousteela su~ch as HY 90 and hYi 100 andS so on. are going into another area and as the gentle-
men before me said it is not a reversibleMr. W'aser: (Naval Surf ace weaponis Center) You Process and that is %why we like to stay in thetalked abouxt plastic design, isn't that rpally elastic range. You should determine how manya misnomer, aren't you really in the elastic stocks a particular structure can tale beforeregrion? ? ave you taken fatigue Problems into failure and I think it is a serious problem.
Mr. Bu~tt- That is true bat there are plenty ofMr. Buttz Weo are actually in the plastic design applications of a plastic design in which yjouregion using this msethod; we assumne a rigid can take advantage of ttIds tremendcuE. a':curtPlastic deformation which moans that us are of available strain energy withouxt har=.going into the plastic rance Immiediately aundalso the problem is stock which is really notaffected by fatigue type deformations. T!*structure is asstwed to unfatigued and capableof taking same stock loadS.
Mr. Mlatheson: (Naval Surfac .baponq center)You deal with the plastic region in youranalysis which sant designers stay away frombecaus it is a one way street. You do notplan to reuse the structure in the same mannr~after You have gone through this region. Arethese yaw design considerations?

131
o
.0
03 0 0 0eooo
SI!
*o - - - .-lO

tractor. in combination with a 12-ton M127 tan- loaded weight of the vehicle is already in placedem trailer, was used for this phase of the and therefore is not involved in the determina-test program. Using military personnel and tion of the payload spring rate. The testsequipment considerably reduced research costs have shown that of the three major variables:and assured technical control of the field work. percent maximum payload, tire pressure, and
A s a result of these tests a procedure for speed, percent maximum payload has a majortesting commercial cargo trucks was developed. effect on shock index whereas tire pressure in
the practical range and speed causes relativelyDuring July 1973, limited field tests were ini- minor changes.tiated on the first of three leased commercialcargo trucks; all field work was completed by Since percent maximum payload has the mostApril 1974. Support for these tests was pro- effect on the "ride" on the truck cargo bed, avided by the US Army Transportation Center graph relating the payload axle spring rate,and Fort Eustis. Planning, supervision of axle payload, and shock index was developedtests, analyses, and development of concepts (Fig. I). In order to develop the graph, testsand application were performed by MTMCTEA were conducted on a range of cargo vehicles.engineers. The payload capability of these vehicles varied
from 13, 000 pounds on a two-axle truck; to
The detailed procedure on how to determine Z4, 000 pounds on a two-axle truck-tractor,the shock index for a typical highway cargo single-axle trailer combination; to 40, 000truck is contained in this report. pounds on a three-axle truck-tractor, two-axle
semitrailer combination.GENERAL
The vehicles were instrumented to measure
The purpose of the highway shock index (SI) is shock on the cargo bed and were driven overto proO' e a means for selecting highway cargo fixed, unyielding bumps at various speed* atvehicles on the basis of their "rough" riding different tire pressures, and with differentcharacteristics. The selection is based not on payloads.the vehicle configuration but on the combinedpayload spring rate (K) of the springs and tires The repeatability of data measurements re-on an axle. SI makes it possible to select a corded on the test course was satisfactory inrelatively "soft" riding vehicle for fragile cargo spite of the many variables that affect a dy-and thus minimize the possibility of damage to namic test of this type. Approximately 80 per-the cargo. The shock index rating system cent of all data recorded over the axles of theapplies to restrained cargo only. trucks were used in the preparation of the
graph and table.The shock index for a cargo vehicle should berepresentative of the roughest ride area on the SHOCK INDEX GRAPH
truck cargo bed. Previous tests have shown,and recent tests have confirmed, that for nor- When shock to the cargo is of concern therral operating conditions the roughest ride on a following conclusions can be drawn, based ontruck cargo bed is found over the rear axle for the graph (see Fig. 1).a two-axle cargo truck; or, for a truck-tractorsemitrailer combination, either near the rear As axle payload is increased from zero theaxle of the trailer or over the fifth wheel of shock index increased, providing a softer ride,the truck-tractor depending on which axle has to some optimum load for the vehicle. Thethe higher payload spring rate. dashed lines on the graph indicate a trend
reversal, where increasing the axle payloadUnder normal operating conditions maximum causes a decrease in shock index, providing ashocks on the cargo bed will occur in the verti- progressively rougher ride. There is an opti-cal direction; and, based on extensive tests by mum payload for all vehicles that will provideMTMCTEA and other organizations, a maxi- the softest ride for the cargo. This optimummum shock of 10g's is considered reasonable load can be readily selected from the graphfor a very rough road surface. Consequently, when the combined axle payload spring ratesthe highway shock index is based on a scale of for the vehicle are known.0 to 10g's. The numerical values of shock in-
dex vary from 5 to 0, with 5 corresponding to High, erratic shock values are most likely to0g, representing the softest "ride." occur with very light or maximum payloads
since at light loads the vehicle springs areThe deadweight of the vehicle is not involved relatively stiff and at very heavy loadsin the determination of shock index; the un- "bottoming out" of the springs may occur. The
54

PACKAGING AND SHIPPING
HIGHWAY SHOCK INDEX (SI)
PROCEDURE FOR DETERMINING SI
John H. Grier
Military Traffic Management CommandTransportation Engineering Agency
Newport News, Virginia 23606
IThe Army, Navy, Air Force, and Marine Corps have Jointly sponredand participated in the development of a Shock Index Sir) for k/gliaytransportation. A numerical St. associated with a particular vshicle-load combination, can now be determined at a low cost by applestio.of simple static field measurements. The SI provides classifi nfor vehicle-load combination as regards probability of shocks twnse-
I mtted to the cargo during highway shipments.
INTRODUCTION in the report "a net of semiempilrical rela-tionships have been developed to equate the
In 1967 representatives of the United States performance of the vehdce/cargo with theArmy. Navy. Air Force. and Marine Corps significant variables affcting the ride." Con-agreed that It should be possible to establish clusions, as preseuted by Geae.at Testing,shock indices that would be representative of Inc.. are that "the SI eqatia developed underthe cargo environment for the various trans- this contract is the result ao an approach to aport modes. The Services formed a Steering complex problem. la teuh this work is notCommittee to initiate and guide the develop- the ultimatp anbwer to so problem of cargoment of a highway shock index. The highway ride; instead, it rpresstts a foundation onmode was selected because of the relative ease which to build a firm sat of requirements forin controlling the environment and related the safe transportability of all cargo."variables.
The bulk of General Tmesaig Inc.. work con-A a an initial step the Steering and Advisory cerned a controlled laboratory test arrange-Committee let a $53,000 contract to General ment. J.A. Johnson. Inc.. was tasked to vali-Testing. Inc., Springfield, Virginia, to deter- date the feasibility of the General Testingnrine and develop a shock index equation that classification procedure and test on publiccould be used to classify highway cargo vehi- roads to establish the accuracy of method in acles in terms of vehicle shock to the cargo. In practical over-the-road environment.addition, and in conjunction with the General Johnson's work concluded that a shock indexTesting, Inc., contract, a second $13. 000 con- classification is both fsasible and needed by thetract was let by the joint services committee military community. but that more engineeringto J. A. Johnson. Inc., Short Hills. New expertise is required to improve accuracyJersey, an independent testing organization, prior to adoption of the classificationto check and verify the General Testing. Inc. procedure.project objective. General Testing, Inc.. rana comprehensive group of static and dynamic Accordingly, Military Traffic Managementshock evaluation tests using five classes of Command Transportati Engineering Agencycargo trucks. (MTMCTEA) initiated a comprehensive shock
index field test program using Fort EustisGeneral Testing, Inc., laboratories released facilities, military equipment, and personnel totheir final report, Development of a Shock assist in obtaining program objectives by de-Index Classification for Highway Cargo veloping a practical tat to obtain usable im-Vehicles, dated 16 April 1971. As described pact data. A military 5-ton MSZ tandem
53

most erratic results will occur over the fifth same type springs and tires.wheel area due to the concentration of load atthe kingpin. 1. Required Information:
The graph indicates that for a relatively soft a. Vertical deflection at one-half and fullride the vehicle payload axle spring rate should payload of truck bed at rear axle(s) and/or atbe about 7, 000 pounds per inch. For this con - rear axle(s) of truck-tractor if the vehicle is adition for an axle payload of 3, 000 pounds, the truck-tractor semitrailer combination.cargo would most likely not be subjected to ashock of over 2g's, and the shock index rating b. Payload axle load causing the verticalfor the vehicle would be about 4.1. deflections.
For a vehicle payload axle spring rate of 10, 000 2. Determination of combined (springs andpounds per inch the maximum expected shock tires) vertical deflection. at an axle(s).to the cargo should not exceed about 4g'*, foraxle payloads of 3, 000 to 9, 000 pounds. This a. Check tire air pressure, adjust tovehicle would have a shock index of about 3. operating pressure.
Fora vehicle payload axle spring rate of 13,000 b. Position axle(s) on scales; or, if scalespounds per inch the maximum expected shock not available, on a uniformly smooth, level.to the cargo should not exceed about 6 g's for unyielding surface. Vehicle unloaded.axle payloads of 3, 000 to 9, 000 pounds. Thisvehicle would have a shock index of about 2.4. c. Accurately measure the height of the
cargo bed on each side of the truck at theFor all ranges of payload, due to the many axle(s). If vehicle is on scales, note unloadedvariables, dynamic behavior, and variable en- axle(s) load.vironment associated with the vehicle-roadrelationship, some radical, inexplicable shock d. Use dummy concentrated weights, ifvalues will occur. In the test leading to the available, to simulate axle(s) payload. Loaddevelopment of the graph approximately 20 per- with center of gravity directly over axle forcent of the recorded values faUl within this single-axle vehicles or midway between tandemcategory and were accordingly discarded, axles. If concentrated weights are not avail-
able, use available homogeneous weights andPROCEDURE FOR DETERMINING SHOCK uniformly load truck bed. Accurately measureINDEX the height of the cargo bed on each side of the
truck at the axle(s) (Fig. 2). The truck shouldThe procedure for estimating SI (or a specificcargo truck involves two steps. First, it in- HTOUIW[ AVERAGE umA PAVUADvoives loading and unloading the truck and tak- KFLEC•IN AT OUE-NALF
ing measurements on how much the cargo bed A N FiL PAYLJAIUM
Secondly, it is necessary to know the payloadaxle load. This can be determined on a set ofportable scales or by calculation. It is neces-sary that this information be obtained by physi-cal measurements because of the high variableinternal friction in leaf springs, variable stiff-ness in tire sidewalls. and general construc- Fig. 2 - Rear View of Trucktion of the overall suspension system of thevehicle. Also, correlation between the manu- be loaded and unloaded several times and anfacturer's spring rate for a leaf spring of a average deflection determined, both at one-vehicle cannot be made with the installed half and full payload.spring, because in the manufacturer's test pro.cedure, the test is performed without centerendsare . In order to obtain accurate averageclamps and shackles, and the spring ends are deflections proceed as follows:nounted on rollers so that they are free tomove. (Reference SAE Standard Leaf Springs (1) Fully load the truck; measure truck bedfor Motor Vehicle Suspension, SAE 35102.)'When the SI for a specific make and model oftruck has been determined, it should a ply toothers of the same make and model, with the (2) Unload to one-half full load; measure
56
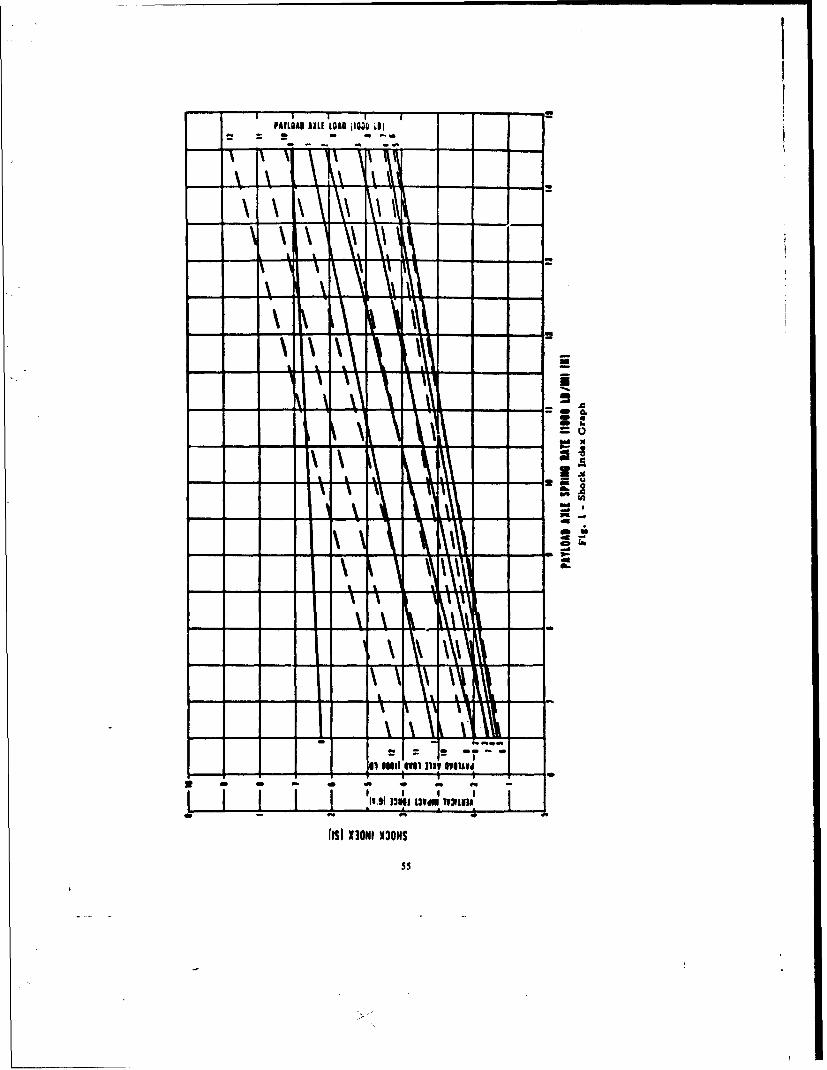
PAYLOAD AIELOAD j106 uil
IIIL\ 'z
N'---Cs
A--11I a1N 3N
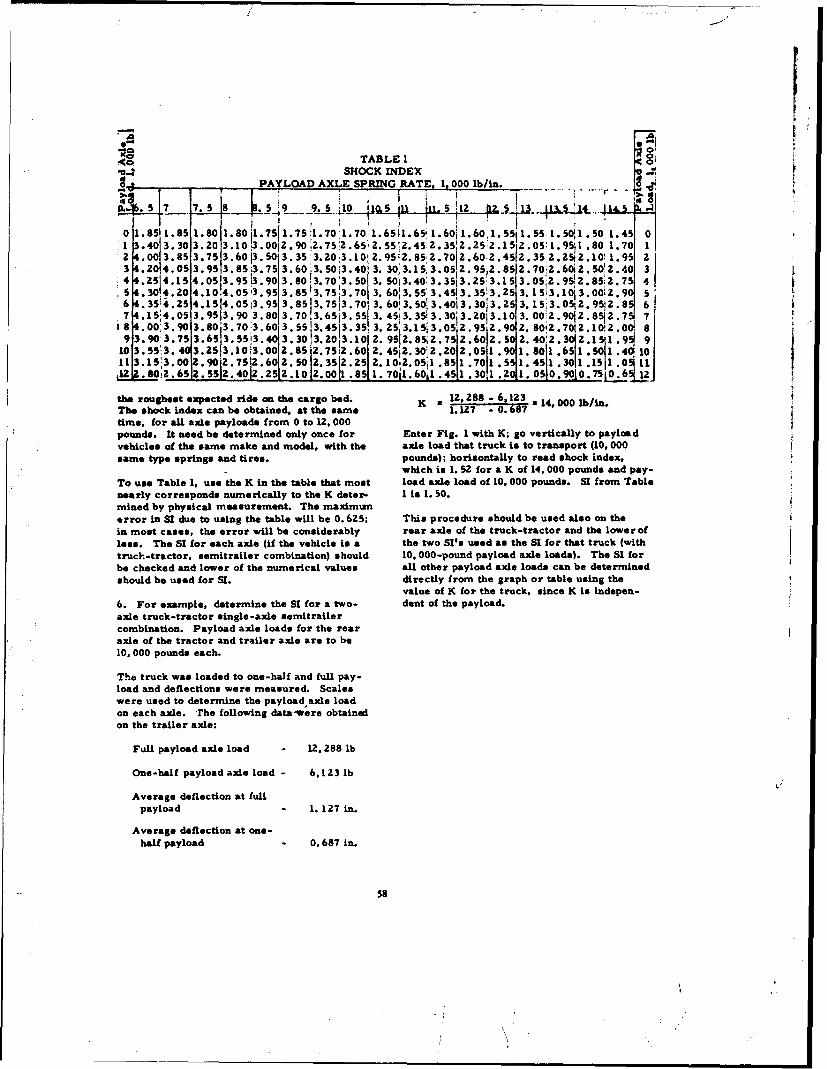
A TABLE I o~
',- SHOCK INDEX 00b .. -
PAYLOAD AXLE SPRING RATE, 1. 000____n
M .5 . .. 5 ... 5 1-112 1 1 S0.5i 9. 5 00 1.S 1.8sS 1. 8011. 80il.75 1.75!l. 70 ý1. 70! 1. 6s1. 0 1. 6011.60, 1. 5511. 55 1. 50.o .S 01
1 3.40 3.30 3.20 3.10 j3.001 .902.75;2.65;,2.55:2.45:2.352 .252. 1512.05:1.9511 .80.1.70 1iZ 4.00 3.85 3.75 3.60 13. 50 3.35'3.20 3. 10 2. 95Z. 85 2. 70 2.o602:.45 2.35 2.25, : 2.10! 1. 9S 2
3.20o4.05 3. 9513. 853. 75 3.603. 503.40 3. 30;3.15,3. 05 2.95,2. 852.70 2.60 2.$50'2.040 3S4.251 15 4.0513. 9513.90 3.80!3.70;3.50 3. 5013.40:3.35 3.25;3.15 3.05;2.9502. 85:2. 75 45 .30.4o20 4.o104.05;3.95 3.85,3.75j3.70 3. 60'3. 553. 453.35!3.25 3. 1s5i3.10 3.00,..90 S
6,.35i .25•.1514.0o•3.9, 3.85 3.7513. 70 3. 60! 3. 50d 3. 403.30 3.25 3. 15:3.052.9 ._74.15:4.053.9513.90 3.80 3.70 3.65i3. 5 3. 45;3.35 3.30 3.20 3.10 3. 0012.90oZ.8512.75 784.00;3.90 3.80'3.70:3 603 5513.45 3.351 3.5 :15ý30.95 2.9 2. 8o2.7olz.i2.oo 89:3.903.753.36513" 553013. 3.3013.ZO 3.101 2. 95 2. 8•2.75 2.60 Z.5 2. 40'.3Oj2.1 3 2 .9 9
103.553. 2 3.853.1o 3.o2 2.75 .6O24512. 3o0!2.o20 2.051.O 1. •41.61.5o1.,1o
11 3.153.00:1 .90I.75 .602. 5012. 3512.Z51. 75 6.05ii .8511.70 .5 1.451 .301 1 .Sil1 .01 1il.16, "-58 -2 2,2 12 S4 000 Ib12 soI 7011.60,1 .451 .30112 .0590 .7j6~
the roughest expected ride an the cargo bed. K a 12.288 - 6,123The shock index can be obtained, at the same 1.127 - 0.687time, for all axle payloads from 0 to 12, 000pounds. It need be determined only once for Enter Fig. 1 with K; go vertically to payloadvehicles of the same make and model, with the axle load that truck is to transport (10, 000same type springs and tires. pounds); horizontally to read shock index.
which is 1. 52 for a K of 14, 000 pounds and pay-To use Table 1, use the K in the table that most load axle load of 10.000 pounds. SI from Tablenearly corresponds numerically to the K deter- I is 1. 50.mined by physical measurement. The maximumnerror in SI due to using the table will be 0.625; This procedure should be used also on thein most cases, the error will be considerably rear axle of the truck-tractor and the lower ofless. The St for each axle (if the vehicle is a the two Sits used as the SI for that truck (withtruck-tractor, semitrailer combination) should 10,000-pound payload axle loads). The SI forbe checked and lower of the numerical values all other payload axle loads can be determinedshould be used for SI. directly from the graph or table using the
value of K for the truck, since K is indepen-6. For example, determine the Si for a two- dent of the payload.axle truck-tractor single-axle semitrailercombination. Payload axle loads for the rearaxle of the tractor and trailer axle are to be10. 000 pounds each.
The truck was loaded to one-half and full pay-load and deflections were measured. Scaleswere used to determine the payload axle loadon each axle. *rhe following data-rere obtainedon the trailer axle:
Full payload axle load - 12, 288 lb
One-half payload axle load - 6,123 lb
Average deflection at fullpayload 1. 127 in.
Average deflection at one-half payload 0.687 in.
58
N,
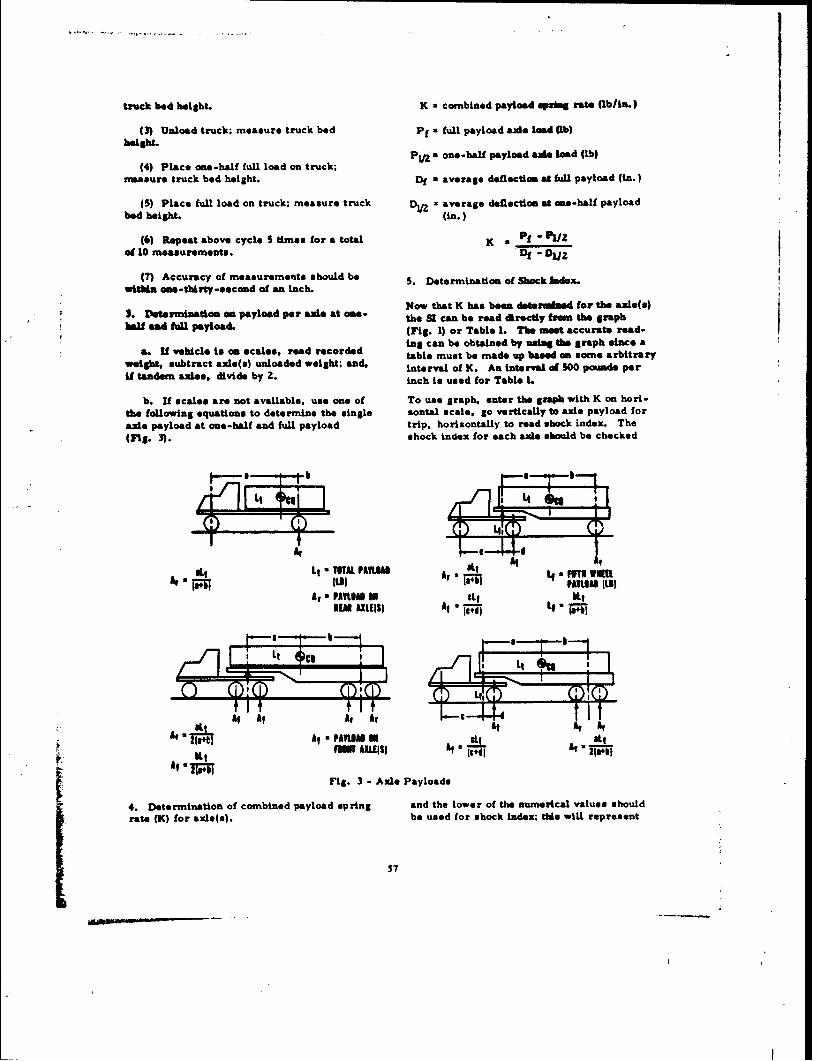
track bed height. K a combined payload spdog rate (lb/ln.)
(3) Unload truck; measure truck bed Pf a full payload axle load Ob)
height. Pk/2 a one-half payload &Asd lead (lb)
(4) Place one-half full load on truck;easeure truck bed height. Df a average deflection at full payload (in.)
(5) Place full load on truck; measure truck DV = average deflection at .me-hall payloadbed height. (in.)
(6) Repeat above cycle S times fora total K - Pf "P1j 2d 10 measurements. Df -DZ
(7) Accuracy of measurements should be S. Determination of Shock lndex.within oee-thirty-second of an inch.
. Determination on payload per axle at on- Now that K has been determined for the axle(s)the SI can be road directly from the graph
balf ad fall payload. (Fig. 1) or Table 1. The meat accurate read-
a. It vehicle i on scales read recorded lng can be obtained by using the graph since aweight. subtract ve les) unlsoades, weigrded table must be made up based on some arbitrary
eight, subtract axle(s) unloaded weight; and, interval of K. An interval of 500 pounds perif tandem axles, divide by Z. inch is used for Table L
b. If scales are not available, use one of To use graph, enter the graph with K on hori-
the following equations to determine the single sontal scale, go vertically to sale payload for
axle payload at one-half and full payload trip. horizontally to read shock index. The
(Ing. 3). shock index for each axle should be checked
Att TTAMAL FA1U Ar, 1. 4f -MYWI
At A• Atl A run l
At a A PAILIAS ON ef AtiltAA,~A a ALIUS
hit M LE "ISI At
'a ~
At a AAta"
Fig. 3 - Axle Payloads
4. Determination of combined payload spring and the lower of the numerical values shouldrate (K) for axle(s). be used for shock index; this will represent
57
I -
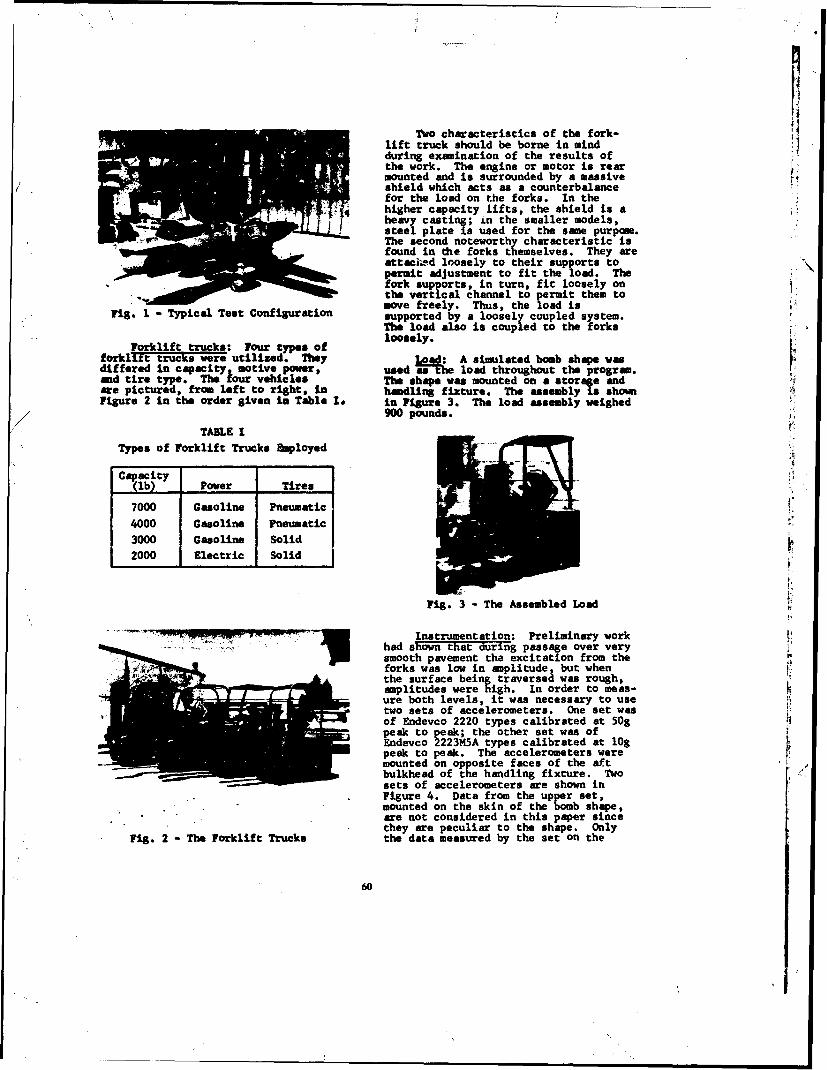
Two characteristics of the fork-lift truck should be borne in mindduring examination of the results ofthe work. The engine or motor is rearmounted and is surrounded by a massiveshield which acts as a counterbalancefor the load on the forks. In thehigher capacity lifts, the shield is ahe rheavy casting; in the smaller models,
WNW, steel plate is used for the same purpose.The second noteworthy characteristic isfound in the forks themselves. They areattache~d loosely to their supports topermit adjustment to fit the load. Thefork supports, in turn, fit loosely onthe vertical channel to permit them tomove freely. Thus, the load isSFig. I- Typical Test Configuration supported by a loosely coupled system.The load also is coupled to the forks
" Forklift trucks: Four types of loosely.
differet tn cap were mtilized. They ro,: A simulated bomb shape wasdiffered in capacity, motive power, used W"F•e load throughout the program.and tire type. The 1our vehicles The shape was mounted on a storage andare pictured, fro, left to right, in handling fixture. The assembly is shownFigure 2 in the order given in Table Is in Figure 3. The load assembly weighed
900 pounds.
TABLE ITypes of Forklift Trucks Employed
Capacity(lb) Power Tires
7000 Gasoline Pneumatic
4000 Gasoline Pneumatic3000 Gasoline Solid2000 Electric Solid
Fig. 3 - The Assembled Load
- Instrumentation: Preliminary work I'had shown that during passage over verysmooth pavement the excitation from theforks was low in amplitude, but whenthe surface being traversed was rough,amplitudes were high. In order to meas-ure both levels, it was necessary to usetwo sets of accelerometers. One set wasof Endeveo 2220 types calibrated at 50g t
peak to peak; the other set was ofEndevco 2223M5A types calibrated at lOg-peak to peak. The accelerometers weremounted on opposite faces of the aftS• bulkhead of the handling fixture. TNo
sets of accelerometers are shown inSFigure 4. Data from the upper set,mounted on the skin of the bomb shape,are not considered in this paper sincethey are peculiar to the shape. Only
Fig. 2 - The Forklift Trucks the data measured by the set on the
60

THE DYNAMIC ENVIRONMENT ON FOUR INDUSTRIAL FCRKLIFT TRUCXS*
Mark B. Gesn
Sandia LaboratoriesAlbuquerque, Now Mexico 87115
The purpose of this study was to determine the dynamicinput to cargo during carriage on various types of forklifttrucks. Among the variations examined were trucks withcapacities of 2000, 3000, 4000, and 7000 pounds; trucks withpesueatic and with solid tires; and trucks powered by gaso-line engines and by electric motors.
The cargo used as a simulated bomb shape mounted on acradle-like rack which is used to transport and handle wea-pons. It was found that there was little steady-statecontinuous excitation transmitted- through the forks to theload. Many discrete excitations were present. Data reduc-tion in the form of shock response spectra showed responsesup to lOg in ampltude below 20 Hz and up to 40g at 100 Hz.
IwrTRODmCTION Albuquerque, New Mexico. It is onephase of a larger program which will
The transportation of components, provide definition of the environmentassemblies, and packages by forklift experienced by cargo during handlingtruck is inherent in almost all phases by a variety of mechanical equipment.of manufacture, transport, handling, Program management is by the Environ-and storage. The forklift truck is mental Criteria Group, Sandiaemployed in: (1) moving material and Laboratories. Air Force participationequipment during manufacture, (2) in this phase was limited to funding.removing completed assemblies andpackages to transportation points, (3) The phase of the program to beloading cargo into rail cars, trucks, reported here considers only the typesor aircraft, (4) unlodding cargo at of forklift trucks in general usedestination, (5) warehousing cargo, throughout industry. It is limited toand (6) moving cargo to point of use. four specific trucks during outdoor use.The environment produced by such trans-port has not been defined. It was the TEST CONFIGURATIONpurpose of this study to sample thedynamic environment experienced by The test configuration consistedcargo during transport by forklift of a forklift truck, a load, and thetruck and, analyses of the data, necessary instrumentation. A typicaldevelop a definition of the environ- assembly is shown in Figure 1.ment. Since this was pioneering work,the resulting definition is preliminaryin nature and is subject to futuremodification.
The program was funded and con- *This work was supported in part by theducted Jointly by the Air Force Weapons Air Force Weapons Laboratory throughLaboratory, Kirtland Air Force Base, Contract PD73-246 with the AEC, and inIts Mexico, and by Sandia Laboratories, part by the AEC.
59

(.4 4 4%(4 P44 04~
F0 00 .4 (.
.40 P4 I
i'4 4
44 @0(.0
as " 100
* .
P4 N .44
q4S4
CC)44 WO C4 G%0 CO . f . d. .
"a Ca' Q
.e44
.4 4 C4 ~ .~.
M,~ ~ ~ ~ 0 .0O -r
0AI4 0000 .0 C)
u. . . 4 0 c
inE00 :0 Z. 4.4 4.
00iO 004'.
62 .4d 0~
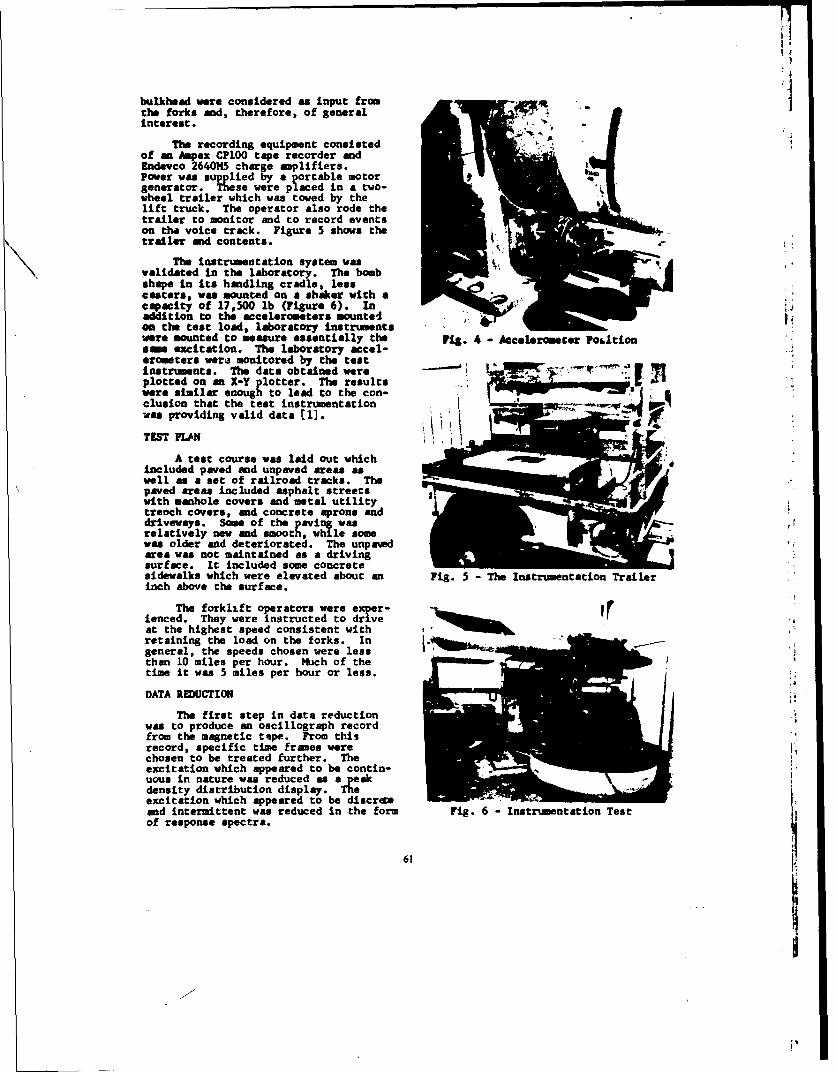
ii
bulkhead were considered as input fromthe forks and, therefore, of generalinterest.
The recording equipment consistedof an Ampex CP1O0 tape recorder andEndavco 264015 charge amplifiers.Power was supplied by a portable motorgenerator. These were placed in a two-wheel trailer which was towed by thelift truck. The operator also rode thetrailer to monitor and to record eventson the voice track. Figure 5 shows thetrailer and contents.
The instrumentation system wasvalidated in the laboratory. The bombshape in its handling cradle, lesscasters, was mounted on a shaker with acapacity of 17,500 lb (Figure 6). Inaddition to the accelerometers monted*on the test load, laboratory instrumentswere mounted to measure essentially the fig. 4 Aeler' ter Poh~tions excitation. The laboratory accel- eerOters were monitored by the teatinstruments. The data obtained were A - ., .''plotted on an X-Y plotter. The results .were similar enough to lead to the con-elusion that the test instrumentationwas providing valid data [1].
TEST MANJ
A test course was laid out whichincluded paved and unpaved areas aswell as a set of railroad tracks. Thepaved areas included asphalt streetswith manhole covers and metal utilitytreoch covers, and concrete aprons anddriveways. Some of the paving wasrelatively new and smooth, while somewas older and deteriorated. The unpawedarea was not maintained as a drivingsurface. It included some concretesidewalks which were elevated about an Fig. 5 - The Instrumentation Trailerinch above the surface.
The forklift operators were experienced. They were instructed to dr •veat the highest speed consistent withretaining the load on the forks. Ingeneral, the speeds chosen were lessthan 10 miles per hour. Much of thetime it was 5 miles per hour or less.
<a
DATA REDUCTION
The first step in data reductionwas to produce an oscillograph recordfrom the magnetic tape. From thisrecord, specific time frames werechosen to be treated further. Theexcitation which appeared to be contin-uous in nature was reduced as a peakdensity distribution display. Theexcitation which appeared to be discreteand intermittent was reduced in the form Fig. 6 - Instrumentation Testof response spectra.
61
I

bm
Fig. 9& Fig. 9b2000 lb Capacity Forklift Truck 7000 lb Capacity Forklift Truck
1o.0. 10.
I
I/
•lll414 !I vB~S.Ir.IcI
- 17 VflttC*
Fig. 9c Fig. 9d3000 lb Capacity Forklift Truck 4000 lb Capacity Forklift Truck
Fig. 9 - Envelopes of Forklift Response of High Amplitude Discrete FxcitationMeasur-d at the Bias of the Handling Cradle (Damping - .03)
64

iNS1LTS of the sane event shown in Figure 7 wassubmitted to bandpass analysis. A
rgaWro: The =do designations typical display of the results of thisused In thI-data displays are relative effort iL given in Figure 8. Thisto the axes of the forlift truck, display hows that the excitation is
largely low amplitude pulses which areEtxou Ecitation: Peak den- discrete in nature. Examination of
s1ty M1sORLM ton reductions were made other frequency bands shows that someof records which appeared to show pulses have peaks as high as 0.7g incontinuous excitation [2). Figure 7 frequencies below 15 Hz. In the highershms a typical example of such a frequencies, peaks rarely exceed 0. grecord. it represents the data taken and usually ame below 0.05g.when the load was carried on the 3000lb capacity forklift truck along a r -- -"
$ood asphalt surface at approximatelymiles per hour. .......
At first glance, the peak densitydAstribution record appear to be anormal one of low mplitude excitation.
Omiever, a closer exaInation revealsso anomalies. In continuous excita-tion, the nmber of peaks countedicremaes in proportion to frequency. I TSn time remanI constant, there will
beSppximately 10 times as many peaksat100 fs at 10 Hz. The smallestpeak count will appear in the left handcolm (0-20 Hz) end the largeoscount in the right hand colm (100- . -IM 1i), with a progression between 300 lb Capacity Fokliftthe two. Here, that is not true. 30 bCpct
Several frequency bands have a loawr The absence of an incremental pro-peak count than found in the brad of gression in the amber of peaks across
aowst frequency. The peak count the spectrum the few namber of peaksincreases until 80 Hz is reached then in Sam of ghigher frequency bands,diminishes, rises again in the 24f-350 the pulse-like character of the excite-Hz band, and continues to rise and fall tion, and tha very low mplitudesthroughout the spectrum. indicate the absence of any significant
continuous broad bend random excitationnin the forklift environment, regardless
band, amwon d exect, were the excite- of the type of motive power.tion continuous, that the relationshipof peak count to frequency might be Discrete Excitation: The presenceexpressed as: of discrete excitation in the forklift
environment is very apparent. Examina-Mp w (2f) (t) tion of the oscillograph records show
frequency high anplitude bursts super-where imposed onrte low amplitude background.
These data were reduced in the form ofNp - umber of peaks response spectra. These spectra were
mm arized in two ways to show the maxi-2f - number of peaks per cycle mum accelerations for each type oft a time of i-cord in seconds forklift truck end to show a summary of
all spectra as an indication of theenvironment which may be encountered byWaen this relationship is applied cro
to the 500-700 Hz frequency band, using cargo.600 Hiz m the man frequency, Figure 9 shows envelopes of
2(600)(5) - 6000. In our example, response spec t ra in each axis for eachf xnd 68 peaks in the frequency band. of the forklifts used. These spectraThese two examples indicate the absence reveal one co-mon characteristic: Inof continuous excitation, the frequencies below 10 Hz, the verti-
cal axis is dominant and has highAh further analyste to determine amplitudes raising from 8 to 109. In
the true nature of the excitotion which three cases, %ere is a prominentappeared to re continuous an the I"hump" in the 3 to 5 Hz region. In theosctllogrph record, a 5 secotnd record fourth record (Figure 9b), the "ump"
63
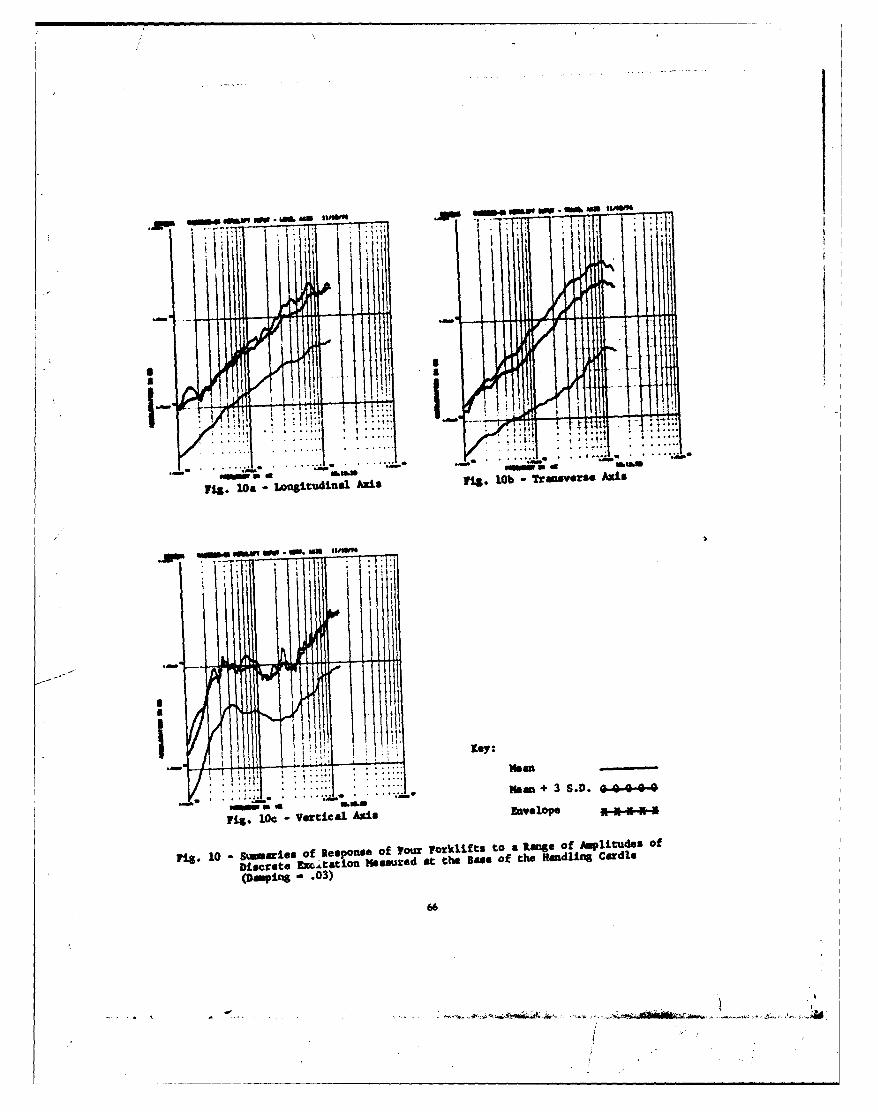
via. 10a Longitudinal Alis vig, lob T ransverse Axis
I I it oy :
tVsmi + 3 S.D.* Q-4-04.44
Fig. L0c -Vertical Axis fzwelope
,pig. 10 -S~ummerias of Responise of your Forklifts to a Range of Amplitudes OfD iset xcttif esd at the Base of the Handlinig Cardle
(Dapinlg -. 03)
66
is present but is overshadowed by a maxisawm values lies above that of thehigher amplitude prominence at 7 to 8 3 S.D. level. At 100 Ez, the differenceHa. Above 10 Hz, axis domination varnes. is 15S. This may be interpreted to meanMeasurements made on the 3000 lb and that while most of the responses in the4000 lb forklift trucks (Figures 9c and transverse direction lie at or below the9d) show the transverse axis to be 3 S.D. level the lurching of the fork-dominant while in the other two cases, lift truck ;16; traversing uneventhe vertical axis dominates throughout surfaces can camse responses above thatthe spectrum. The highest response level often enough to be significant.amplitude found was 37g in the trans-verse axis on the 3000 lb capacity truck These summaries show once againat 100 Hz. that the highest amplitudes in the fre-
quencies lower than 10 Hz are in theComparison between these envelopes vertical axis. In the transverse and
Indicates that of the physical variables, vertical axes, the 3 S.D. level reachesbetween the four vehicles, the one which or exceeds 20g in the 80 to 100 Hzappears to have the greatest influence range, while the highest level of theon the moothness of ride is the ratio 3 S.D. is 18 fz in the longitudinalbetween the capacity of the vehicle and axis at similar frquencies. Responsesthe weight of the load. The truck which above 20S were recorded in all threewas loaded most heavily (2000 lb cpet- mes at tse he" her frequencies.ity, figure 9a) had the smoothest r do.No response amplitudes were higher than C0IIM.USIOU
The truck which was loaded mosthly (7000 lb capacity Figure 9b) 1. This work encompassed measurementresponse amplitudes that were higher of the dynamic environment of four
than log in only a few frequencies. industrial forklift trucks. It isConversely the vehicles which were not yet clear whether these dataloaded at 25 to 30 percent of capacity are typical, since little other(3000 and 4000 lb capacity, Figures 9c such work has been done.and 9d) had response amplitudes abovelOg in all frequencies above 15 Hz. 2. No continuous excitation with
Gaussian-like distribution wasThere was no evidence that the type found. There is a background
of tire involved had any Influence on of pulsating continuous excita-the dynamic environment. The 2000 and tion of very low amplitude,3000 lb capacity trucks both had solid usually less than 0.1g.tires, yet the response spectra werevery different in shape and amplitude 3. Discrete excitation is frequent.(Figures 9a and 9c). On the other hand,the 3000 and 4000 lb capacity trucks 4. The lift truck which was loaded toexhibited response spectra which were approximately 50 percent of capac-very similar, and the latter had ity showed the least variation inpneumatic tires (Figures 9c and 9d). response level. The high capacity
lift truck loaded to approximatelyForty-eight response spectra were 13 percent of its capacity showed
produced for the purpose of analysis relatively low levels of responseof the forklift environment. In order below 20 Hz.to provide a single representation ofthe environment, these were combined by S. Responses in the longitudinal andcomputer. The program operates with transverse axes were higher whenthe coordinates from which the individ- the lift truck was loaded to 20 toual spectra are plotted. It calculates 30 percent of capacity.the mean, standard deviation, and high-est value for each frequency of the 200 6. Responses in the vertical axis were
ints used to produce response spectra. consistently the highest in frequen-It then plots in mean, mean plus 3 cies below 10 Hz, but the other axesstandard deviation, and the higest showed higher amplitude responses atvalue for each point. Figure 10 shows frequencies above 10 Hz.the results of this manipulation. 7. Examination of the distribution of
The mmarized response spectra in the responses showed that most max-Figure 10 are shown by axis. The longi- imum amplitudes were at or abovetudinal and vertical records show a the mean plus 3 standard deviationclose correspondence between the maximum levels. In the longitudinal andvalues and the iMan plus 3 standard vertical as, the highest responsesdeviation (3 S.D.) values. In the were at approximately the sametransverse axs, however, the curve of amplitude as the 3 S.D.; however, in
65
Z
.,
A STATISTICALLY BASE PROCEURE FOR TUMPEATURE SENSITIVE
DYNANIC CUSHIONING CURVE DEVELOPMENT AiD VALIDATION
Des McDanielGround Equipmaet and Materials Directorate
Rsearch, Developmnt. Engineering and Missile Systems LaboratoryU. S. Army Missile Command
Redstone Arsenal, Alabam 35809
Richard N. WyakidaIndustrial and System Engineering Department
The University of Alsami in HuntsvilleNustsville. Alab a 35807
sod
Mickey 1. WilhelmIndustrial and Systemm Engineering Department
The University of Alabama in HuntsvilleHuntsville, Alabse 33807
The experimental results presented herein clearly indicate thata statistically significant temperature effect on the cushion-ing performance of a foamed thermoplastic material does, in fact,exist and should thus be explicitly considered by designers ofcontainer cushioning system.
Drop test data were collected for Hercules Minicel material andanalyzed by: 1) the development of an outlier test based onthe variance associated with the three replications of each ex-perimental condition; 2) the development of design curves forthe various temperatures, drop heights, and material thicknessesbased upon a second order polynomial regression of the logarithmof stress versus deceleration at impact; 3) conducting an anal-ysis of variance for each drop height to determine the effect ofteperature differences.
INTRODUCTTON effect of temperature other than the stipu-lation of "safe' temperature values, due to
Foamed thermoplastic materials are partic- the absence of temperature sensitive dynamicularly attractive for use as lightweight, low- cushioning design curves.cost, easily fabricated cushioning systems inshipping containers. However, fosamd materials A study which was published as MICOMhave been used in military containers with res- Report No. RL-TR-71-2 entitled "A Study ofervations, due primarily to the difficulty the Impact Test Effects Upon Foamed Plastic Con-container designer encounters in attempting to tainers," [1). indicates that temperature haspredict the dynamic response of the packaged a significant effect upon the C level responseitem when a container is exposed to the rigors of an item that is packaged utilizing a foamof worldwide distribution. Military containers plastic cushioning system. The above refer-
t encounter widely varying temperature extremes *aced study was based upon a comprehensivein worldwide distribution. However, current literature search performed by the Defensedesign practice utilizing available dynatic Documentation Center on container drop testscushioning curves does not account for the conducted within the last 15 years. Many of
SI .... ".M -1 3
69/-W -.
the transverse axis, respns as Mr. Cartel: (Kinetic Syseem) I waen't clearmuch as 15g higher than 30S.D * were as to the purpese of the *ak spectrum werefound. these analysed me @bodhe aram this a steady
vibration or a transiaent enatiou and if it
S. f lurtherwk mutae ntcn be doe maigdef and if shoc sphatraum the ja sevlect out thi
S.Frhrwr itb osui df e hc pcr i eetotferent loada, different forklift particular bum out of tb time history recordtruck, and different terrain before that to@ analysed in a Anh sk pectrum methodabout the environment experienced particular analys is?by cago during forklift transport. .Ca:Teemrep dfomteeil-
ACKNOLGDCfhTS graph record as looking 11km shocks and wereanalysed as jbacob with a bh istory &ad shock
The author wishes to express appre- reopen"e spectrum type of anlysis. in generalciation to the Air Force Weapons they were particular bee. There is oneLaboratory, Kirtland Air Force Base, bump on the southeide ofad D . 894 that wsa InNesw Nlexico, for participation in the all of thin. l&Lch w man seing to you. butfunding of this work. Special thanks I started loeking foir it to the records becausewe extended to Mk. A. J. Tucker It wa e "chaaettistic. So day were reducedSandia Laboatories, who supplial most as whak spectra and mas Ic there will be aof the technical expetises and ign ty report act thickhase all of that to Lt. Therewhich nabd it r sibl to obtain the wa smother Part to ye qusetism.
data pon hic his ocumnt i basd. M. Cartel: It wse abmt do Q Is the abackwUncuWZ spectrum analysis. If thee Is sany further
work being done along thie art" by other[11 A. 3. Tucker, "Certification of people or any projected salyaia that would be
Portable Instrumentation S stmew an important standardiseties key to the dataunulished Sandia Report [4233h6, you are presenting.
J. 1ene. Mr.tGoes:rWhat w d here sea 3 damping.[2) J. T. Foley, at al., "Current
]Predictive Moelsl of th Mr l. Cartel: Did you try to anlyze by shockfwironment of Transpor*tation,.I spectrum the bump that miaht &rise from lower-
SLA 73-0456, Sandia Laboratories, ing the equipment offS the I ITh. It seam likeAlbum a .ru June 1973 (also usually this in the sitmaciam of wet concern,
ublfs uedin the Journal of REvi- that the actual handling ad lifting end sittinga amtal Sciences, .anuaryl it donam e place becus depening on theFebruary 1973). care and skill of the sperators these could be
hanardoua tines for deliecae equipmnt.
Mr. Gene: They were enclosed in the envelopesbut they didn't contribute very such to thenand I mentioned that me bad skilled operators andI don't think that we got whet me might havegotten from some others. Shat's a Somae.
Voice: You mentioned aedere that you broughtin the engine from the veicle itself, how didthe engine dynamic comoents compare with theactual dynaics of riding war the surfaces you.mere traveling on? 'Aes the engine any significantfactor in the vibration environment that youmere seeing?
Mr. Goen: No, the engine didn't mom to haveany particular contribution. Weaelways startedout with what me called a qsiet run whereeverything mee running but the vehicle wse notmoving. I didn't redwee my of that. Thatwhich I did reduce which whine the pulses higherin amplitude at least on the oacillograpla recordbut me couldn't find amy evidence of steadystate vibrat~on at all ad the type which youwould expect from an engine.
67
Of-.-.~-
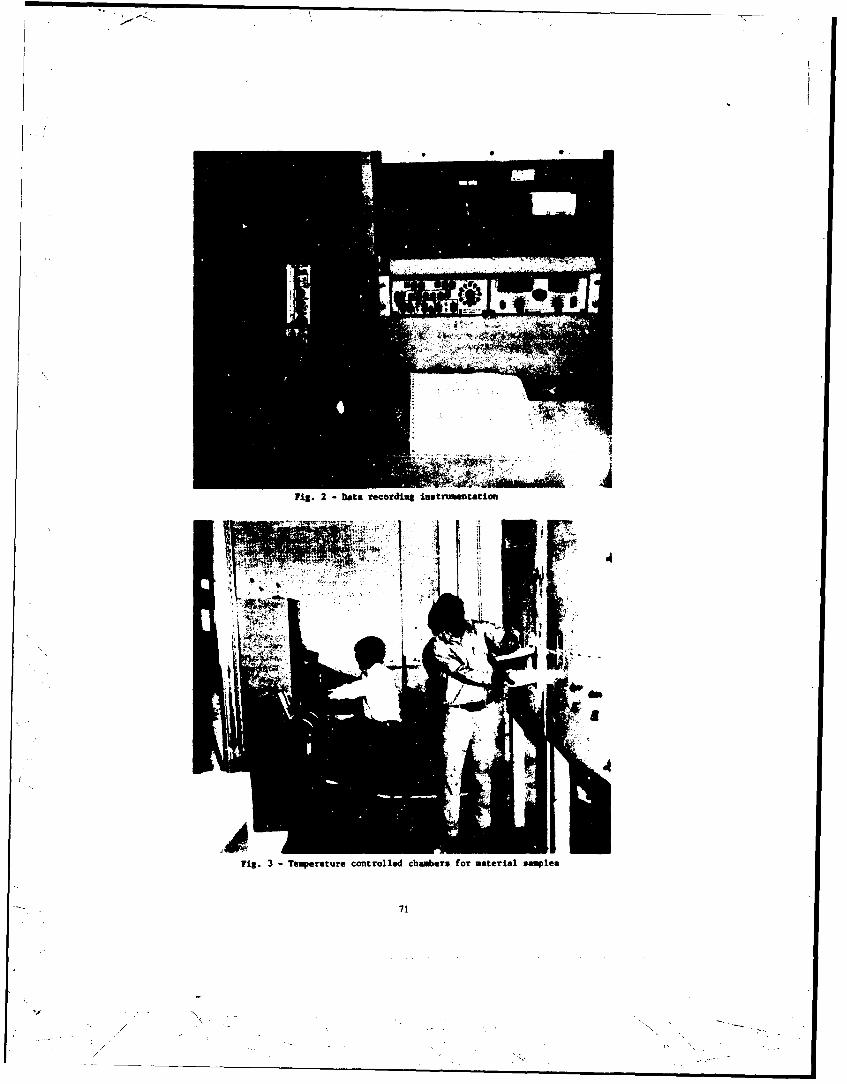
Fig. 2 Dabta recording i~n-tru-nentaton
Fig. 3 - Temperature controlled chambers for material samples
71
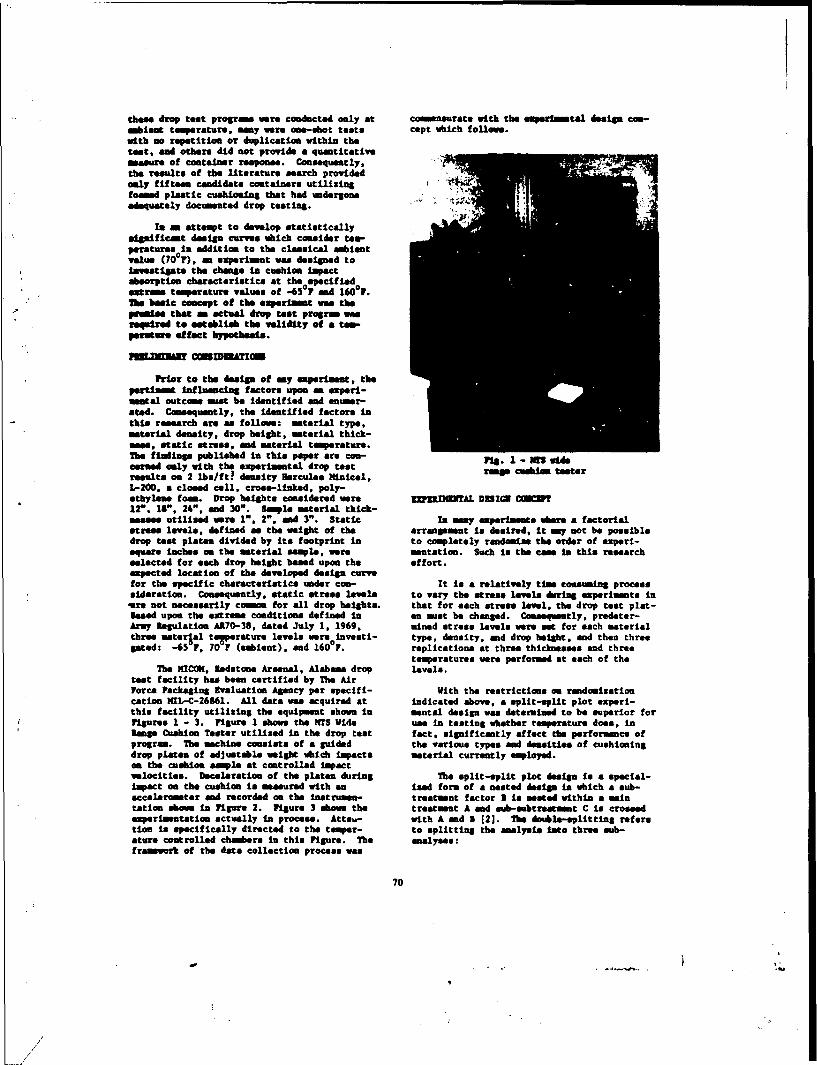
these drop test progrms were conducted only at comsneurats with the experimental design con-=hiem temperature, tmany were ooe-shot tests cept which follows.with so repetition or duplication within thetest, and othere did not provide a quantitativemeasure of container response. Consequently,the results of the literature "arch providedonly fifteen candidate containers utilizing "foamed plastic cushioning that had undergoneadequately documented drop testing.
in - attempt to develop statisticallysignificast design curves which consider teo-peraturesoin addition to the clasLcsi amlbentvalue (70 r), ,- experiment was designed toInvestigate the chenge in cushion impactabeorption characteristice at theospecifiedextrem tmerature values of -65 F nd 160 F.as basic concept of the experimnt was thepmise that - setual drop test program wasrequired to establish the validity of a tom-perature effect bypothess.
PIin.IIUAE CCUMMMON
Prior to the design of my eaperinent, thepertinent Influencing factors upon an experl-mental outcome most be identified and enumer-ated. Consequently. the identified factors inthis research are as follows: material type,material density, drop height, material thick-mass, static stress, and material teperature.Uhe findings published in this paper are con- Fig. I - W wideIerned only with the ezperimntal drop testresults om 2 lbs/ft
3 density Bercules nicel, r cashius teeter
L-200, a closed cell, croes-linkad, poly-ethylene foan. Drop heights considered were gPDO1 AL DESIGNC12W. IS", 24%", and 30". Saple material thick-nesses utilized were 1". 2", sad 3". Static In yma eopern" ens Irbe a factorialstress levels, defined as the weight of the arrangement is desired, it my not be possibledrop test platen divided by its footprint in to completely randomize the order of expert-square inches on the material sample, were mntstion. Such is the case in this researchselected for each drop height based upon the effort.expected lnction of the developed design curvefor the specific characteristics under con- It in a relatively tine consing processsideration. Consequently. static stress levels to vary the stress levels daring ezperimmtns in-are not necessarily commo for all drop heights. that for each stress level, the drop test plat-Based upon the estrem conditions defined in en must be changed. Coansequently, predetor-Army Regulation A170-38, dated July 1. 1969, mined stress levels were set for each materialthree aaterPl O to -erature levels were investi- type, density, and drop height, and then threegated: -65 F, 70 F (amient), and 1600 F. replications at three thicknesses and three
temperatures were performed at each of theThe MIC(OI, Redstone Arsenal, Alabama drop levels.
test facility has been certified by The AirForce Packaging Evaluation Agency per specifi- With the restrictions on randomizationcetinn MIL-C-26861. All data we acquired at indicated above, a split-split plot erperl-this facility utilizing the equipmant shown in mental design was determined to be superior forFigures 1 - 3. Figure 1 shows the NTS Wide use in testing whether temperature does, inlmanm Cushion Tester utilized in the drop test fact, significantly affect the performance ofprogram. The machine consists of a guided the various types and dsasIties of cushioningdrop platen of adjustable weight which impacts material currently employed.on the cushion sample at controlled impactvelocities. Deceleration of the platen during The split-split plot design is a special-Impact on the cushion is measured with an ised form of a nested design in which a sub-acceleroester nad recorded on the inetruman- treatment factor I is mated within a maintation show in Figure 2. Figure 3 showe the treatmet A and sub-subtretmmt C is crossedexperlmentation actually in process. Atte.- with A and 1 [2]. The doble-splitting referstion is specifically directed to the temper- to splitting the analysis lito three sub-ature controlled chamers in this Figure. The analyses:framework of the data collection process was
70
/

TANLA 1
Aalysis of Varimace on Data for a 12" Drop Height a
URCE OF VARIATION SM Of SQUARES Di NEAM SQUARES F-STATISTIC PROS.> 7
Strom Level 303165.00 14 21654.60 753.53 0.00
implicates 69.79 2 34.90 - -
Error (Stress) 804.65 28 28.74 - -
Material Thickness 136578.00 2 68289.10 2223.06 0.00
Stress x Thickness 31334.50 28 1119.09 364.30 0.00
Error (Thickness) 1843.11 60 30.72 - -
Temperature 2038.77 2 1019.39 27.73 0.00
Stress x Temperature 127240.00 28 4344.29 123.63 0.00
Thickness o Temperature 6321.84 4 1580.46 42.99 0.00Stress • thickness I Tesperature 3772.83 5 67.37 1.63 0.00
arrot (Temperature) 6616.44 160 36.76 -
TOTAL 619784.00 104 -
TAKL 2
An•lysis cf Variance on Data for a 18" Drop Heisht *
SOURCE OF VARIATION SUMS OF SQUARES Dl MEAN SQUARES P-STATISTIC PROS.> F
Stress Level 365539.00 11 33230.80 302.87 0.00
Replicates 109.26 2 54.63 - -
Error (Stress) 2413.85 22 109.72 - -
Material Thickness 270231.00 2 135115.00 1624.72 0.00
Stress z Thickness 85727.10 22 3896.69 46.86 0.00
Error (Thickness) 3991.78 48 83.16 - --
Temperature 1278.82 2 639.41 7.57 0.00
Stress x Temperature 203606.00 22 9254.82 109.52 0.00
Thickness x Temperature 12512.60 4 3128.15 37.02 0.00
Stress x Thickness x Temperature 7576.06 44 172.18 2.04 0.00
Error (Temperature) 12166.40 144 84.50 - --
TOTAL 965153.00 323 --
C The values In this table may not sun due to rounding
73
S. .. \ __",/
f~r~ -

1. An esalyale consisting of the temperature effaect em cudm porformeace.main, treatment A, the replica- Consequently, a deta feemem doolined andtime, sd -n interaction which computerized which famcluded a randouiaatiamio called error of A z replica- scheme for Identifying do eader of experi-
2. Ananalysis of subtrestenat B. formed. wh~~tmtathcthe interaction of A x 1, and theerror composed of the Interac- Analusis of Variancetimes (a z replications) plus(A: a I replications); and ts order to tes e significance of the
temerature effect n cushioning material prop-3. The analysis of uub-eubtreatmsnt ertlee, the data met cmss 'aIng to each drop
C, the Interactions A x C, B z C, height Was subjected to -n Analysis of Var-eind A x I z C. and the error COW lance to detect the etIVicrnes of a t-er-posed of the interactions (C a ature effect before sof my further. Thereplications) plus (I z C a repli- results were thee aUl Am" heights exibited acatiman) plus (A a C z replicatiorns) temperancre effect m oh Is Tables I throughplu (A x & x C a replicatiems). 4.
bider this dead&* coafiguratiom, the maac- OWCor Dotammetical model for suhexpriena oweswa-
sawa met be tabe dit a seo of observations,
+ Th i+ 8Th ii Th it + Thus the decsion confronting the xeiSl.TPLT-? master in whether to heep the suspect observe-
ST tim(s) In comptation. or whether it should belit Idiscarded -n a faulty wmeereest. It shouald
be pointed aut. sn~r thet the word reject* Ti* Si 1 1* miian used here nmesa reject In comutation.* since+ Tk S~ik+ TbTke+ ary obeservation met be recorded.
MThT ~ + SPLT3nI * hh 1 *1th these conepts ts sind, the. data was
m re reoved before the design carves werei generated. Further, the outlier test wee
where m or ofutlpersmenta cnditi rs for eac
T noailthickness wore found Is the literature which were appli-j th cable to this case. Consequently, an extension
Tk -k tmeauelevel of the extreme staietizad deviate from the
a th relctinemple mnan (Nair Criterim) was developed.
C The first stop In the outlier detectionSR~ -t"whole plot error procedure is to copue the eomple variances
far each sat of three replications of G levelsThi *t+ T ijt a split-plot error for each static stroes considered, to find
jt ijwhich met has the mmamom aomle variance. ?or+ ThTIL jk + -k ShRI the met of observations hering the largest
jit 'variance, each observation of the set is thensplit-split plot error. tested individually an a candidate for rejec-
timn es - outlier by stilizing the statisticDATA ACQUISITION AND ANALYSIS
BeUfore the drop test study could prceed, t z -;
provisiona hW to be made for collecting the avresulting drop test data which would he comn-pletely compatible with the split-split plotexperimental design for the determination of a
72
.A
where x. - an Individual observation in a sot static stress Wz versus deceleration at impactof three replications (y) was attempted that significant results were
obtained. The general form of the p-order poly--• the sample man of the three obser- nom.a1 regression equation was determined to be:
vationo
% V an independent external estimate of Y, " b0+1 xi + b2 (tn XI)2
the standard deviation from concur-"rent data. b .... p(n ) I
To acquire a , the set of replications ofC's having the mu/ium sample variance, as which represents the deceleration y valuesindicated above, corresponding to a particular from the logarithm of static stress level a,stress level, is eliminated from the calcu- values.lation. From the remaining sets of replicationsof G's, %~ is calculated with the expression A fairly rigorous method for determining
the degree of the polynomial to be fitted to agiven set of data consists of first fitting a
n-l straight line to a set of data, i.e., y - b +$2e b1s and testing the hypothesis 51 - 0. The,
i-l fit a second degree polynomial and test the- -*0 g1ae hypothesis t2 e q. namely, that nothinf to
gained by ptcludins the quadratic tath. Ifwhere s2 - sample variance of the th set of this hypothesis can be rejected, a third-degrae
replications of G's polynomial is fitted and the hypotheses 03 " 0is tested, etc. This procedure is continued
n - numbeL of stress levels, until the null hypothesis 0 - 0 cannot berejected in two successive Steps and, con-
The values of the t statistic for each sequently, there is no apparent advantage toobservation in the set of replicates being carrying the extra terms [(4. Nowever, intested are compared with the appropriate value order to perform these tests it is necessary tofrom a table of pewcentap points of the ex- impose the assumptions of normality, indepen-trem studsatised deviate from the ample mean dence, and homoscedasticity of errors of the[3), and a point is rejected as an outlier if regression estimates.t(calculated) > t(table value).
After fitting the straight line, a second-If an observation "s rejected in the first degree polynomial is fitted and tested to sa"
iteration of the outlier test, the sat of repi- whether it is worthwhile to carry the quadraticcates to which It belonged is no longer con- term by comparing ii, the residual vari ncesidered in further calculations, but the pro- after fitting the straight line, with 02, thecadure then moves to the set of replicates with residual variance after fitting the second-the next highest sample variance to check for degree polynomial. Each of these variances isoutlier*. Iteration is continued until a set &Ive byof replication. is checked and no points arerejected. a
Safeguarus are built into the outlier tt-it i- Iprocedure which restrict the number of data degrees of freedompoints that can be rejected in a set of repli-cates. For instance, only one point can be with y' computed, respectively, from the equ-rejected in a set of three replications. Also, ation &f the line:if two of the three values of t are the sa,and are greater than the test criterion value y; - b0 + blxiof t, then neither of the observations isrejected. This is essentially a tie rule for and the equation of the second degree poly-a relatively rare but possible eventuality. nomial:
Regression Curve Development 2 b + bsxi + bzx•
With the outlying observations removedfrom the data, many different polynomial regres- where in this research effort xi - tn (100 xsion models were utilized in an effort to de-scribe the theoretical dynamic cushioning curve The term "degrees of freedom" in thefrom this data. However, none of these models denominator of the equation for the residualwere sufficient on the basis of analysis of variances is n - 2 for oj, because two degreesregression variance and sample correlation of freedom are lost in the computation of xcoefficients of static stress (x) versus decel- and bl, and it is n - 3 for ;J, because threeeration at impact in G'a (y). It was not until degrees of freedom are lost in the computationa polynomial regression of the logarithm of of x, bl, and b2 .
75

TAME 3
Analysis of Variance on Data for a 24" Drop Usight a
SOURCE OF VAAIATION SUMN OF SQUARSS DY IMra SQUAlUS 1-STATISTIC PWB., I
Stram level 475736.00 10 47573.60 150.18 0.00Implicates 41. 8 2 20.94 -
Error (Stress) 6335.53 20 316.76 -
Mhterial Thickness 221067.00 2 110534.00 94.83 0.00Stress x Thickness 61112.60 20 3055.63 19.21 0.00Irror (Thickness) 6999.48 44 159.06 - -
Temperature 46759.00 2 23379.30 130.27 0.00Stress x Tempersture 310374.00 20 13518.70 305.05 0.00Tkicheso z Teipersturs 16448.20 4 4162.04 38.17 0.00kSraw a Thickness z Temperature 12536.00 40 313.40 3.12 0.00Error (Teerature) 19499.10 132 147.72 - -
TOTAL 1177110.00 12% --
TABLE 4
Asalysis of Variance on Data for a 30" Drop eMight *
SOUCz OF VARIATION SMS OF SQUARIS Df MEol SQuARS F-STATISTIC 3n).o I
Stress level 644785.00 15 42985.70 599.97 0.00
IRplicates 563.37 2 282.79 - -
Error (Stress) 2149.39 30 71.65 - -
Material Thickness 787921.00 2 393960.00 6479.41 0.00Stress x Thickness 283931.00 30 9464.37 155.64 0.00Error (Thickness) 3891.92 64 60.81 - -
Temperature 10016.50 2 5008.24 77.69 0.00Stress x Tesprature 674500.00 30 22483.30 348.79 0.00Thickness x Temperature 97072.90 4 24268.20 376.48 0.00
Stress x Thickness x Temperature 28641.70 60 477.36 7.41 0.00Error (Temperature) 12376.40 192 64.46 - -
TOTAL 2545650.00 431
• The values in this table say not sam due to rounding
74
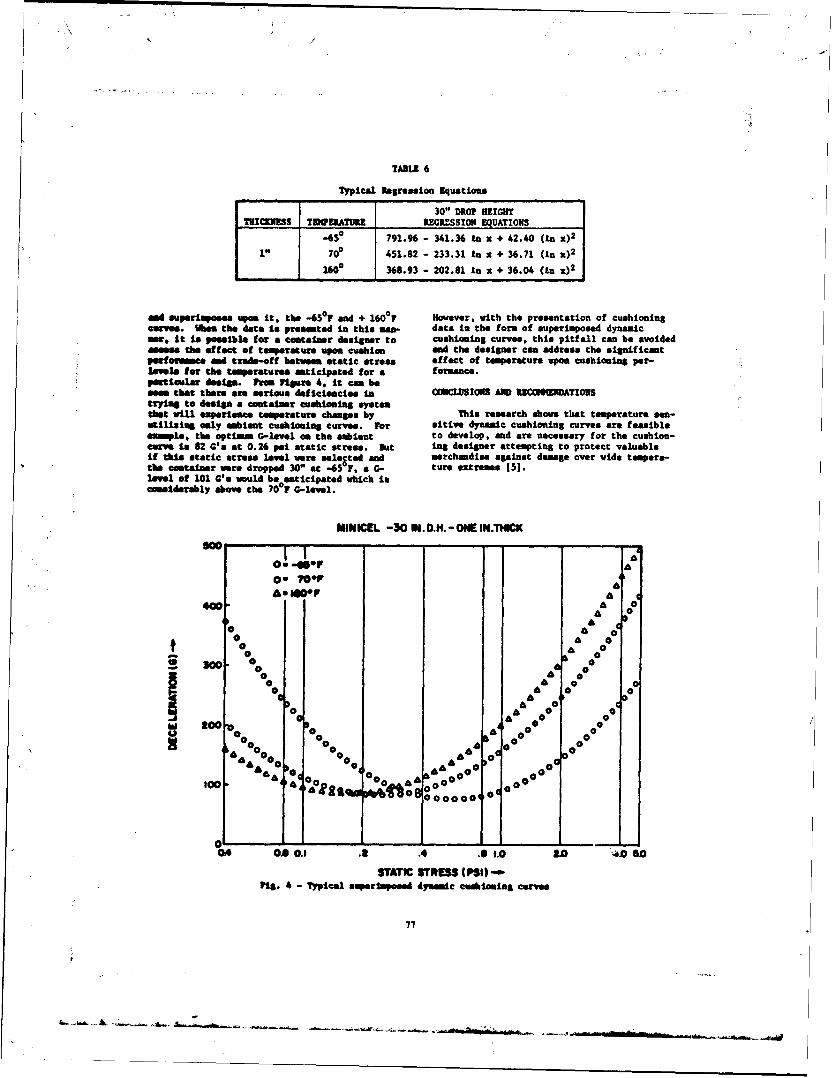
TABLE 6
Typical Regression Equations
30" DROP HEIGHT-TICNSS TUZATURR REGRESSION EQUATIONS
-63 791.96 - 341.36 In z + 42.40 (to X)20P 451.82 - 233.31 In x + 36.71 (In X)2
IW368.93 - 202.81 in x + 36.04 (In X)2
sad superimposees upon it, the -6501 and + 160O H fowever, with the presentation of cushioningcurves. hi~sn the date is preessted In this man- data In the form of superimposed dynamicmsup It is possible for a containser designer to cushioning curves, this pitfall can be avoidedasses. the effect of temperature upon cushion and the designer can address the significantperfeemsce and trade-off between static stress effect of temperature upon cushioning per-loeve, for the temeraturves anticipated for a formance.particular design. Fro Figure 4, it can he
semthet there are serious deficiencies in CORCLSIONS AND RZCMUTIDTOIStrylas to design a container cushinming systemthat will esperieace temperature changes by This research showe that temperature sen-utilizing only amieat cushioning curves. For sitive dynamic cushioning curves are feasibleexamle, the optiuma c-level on the ambient to develop, and are necessary f or the cushion-curve is 82 C's at 0.26 psi static stress. But Ing designer attempting to protect valuableIf this static stress level were seleated an merchandise against damage over wide tempera-the coatainer were dropped 30" at -65 F. a G- ture extremes [5).lavel of 101 Gae would be0atciae which isconsiderably ahove the 70y F -level.
MINIME -30 IN.O.DA - ONE INTHICK
As a 0*r
4WA 010 ~0
0* 00a
0o A 1 000 0 00 C
10 2000100 000 @% 00
&A 00A OC00 0 0
too- 00 000 &A 0 000 0000 % A09 0 0..
tO0 00004 @0 0
04 0*0.1 .8 .4 .6 1.0 A.0 -400s
STATIC STRESS (PSI) .-
Fig. 4 - Typical superimposed dynamic cushioning cre
77

The decision bether to carry the quadrat- ?IAM S
ic term is based oan the statistic 1-4katatica
SJ - a2 IaICAL a 4.1070a 20.05
TRW. THICKINSS DDF MGM - 12"
which is the value of a random variable having CUIC QUARTIC'm approximate F distribution with 1 and n - 3 1" 8.68 0.99 0.99degrees of freedom. The hypothesis 02 - 0 1i -650 2" 19.46 0.99 0.99rejected for values of F (calculated above) 3" 7.19 0.99 0.99
le (1, n-3) where a - 0.05 for this test. 1" 24.53 0.99 0.99
Continuing with this lire of reasoning, 700 2" 12.02 0.99 0.993" 5.25 0.99 0.99the decision whether to carry the cubic term
Is besed an the statistical test 1" 23.09 0.99 0.99160° 2" 13.15 0.99 0.99
3" 2.21 0."99 0.99
THICKUS D 010? •- 1"QUADBtC 0231C QUAITIC'
1" 12.76 0.99 0.99
(y .b +z 3 2 -6b° 2" 55.24 0.99 0."
wher ;2a 11~ 21 " 3.1 .6 09@3 10 39.78 0.99 0.99
(a-4) 700 2" 10.06 0.99 0.993" 9.70 0."9 0."9md the decision whether to carry the quarticterm is bhaed oan the test 1" 12.71 0.99 0.99
1600 2" 13.77 0.99 0.99.2 .2 3" 18.17 0.99 0.99
7 , _*ý - *4 - r (1,-5) =-.2 TOP. THIC1 0SS 0MP HEIGHT - 24"QWLATIC CUBIC* QUARTIC*
wre1" 8.19 0.99 0.99-65 2" 3.63* 0.99 0.99
3" 8.31 0.99 0.99
(y- (b + b1zh + b2 t2 + b3x3 + b~x"1)2 1" 15.70 0.9 0.9
;2 b z 70° 2" 16.43 0.97 0.99O -(n) 3" 8.65 0.99 0.99
1" 7.18 0.99 0.991600 2" 7.67 0.99 0.86
As can be sen in Table 5, qadratic fits are 3" 11.15 0.99 0.99statistically significant in all experimental -
conditions except three. Further, w see that TlV. THICKNESS DOP HEIGHT - 30"absolutely nothing is gilned by carrying the QUADRATIC CUBIC* QUARTIC*third and fourth degree terrm, i.e., we cannever reject the null hypothes-s 63 - 0 and 0 1" 8.17 0.99 0.9960 - 0 at the 52 level of signaficance. -63 2" 50.14 0." 0.99
3" 6.17 0.99 0.99Table 6 presents the regression equations 1" 19.04 0.95 0.99
for 30" drop height and 1" thick Minicel. By 7 2" 2.substituting any selected static stress level 70 2 26.15 0.99 0.99into the regression equation for a particular 3" 11.57 0.99 0.99temperature, the predicted G-level vill be 1" 8.75 0.99 0.99computed with excellent statistical accuracy 160° 2" 10.59 0.99 0.99for that particular static stress and tem- 3" 18.14 0.99 0.99perature condition.
In addition to the regression equations * Not significant at n .05that model G-level response mathematically, theanalysis proceaure also provides a graphicalpresentation of the design curves. Figure 4is an example of a superimposed dynimc cushion-ing curve that can he generated by these equa-tions. As cam he readily tsen, Figure 4displays the ambient dynamic cushioning curve
76
I
Ifr. loDanIel: That's true! That is one of theproblem aress with using dynamic cushioningcurves generated in the eamnar that we generatedthem today. A report asked Woody Rayes do youhavne ay probleme with these football teas,he said no we haven't. We have gone as nue! as7 years without fouling up the snap from cvinterand this year we've mossed it up twice andthere's 14 years shot to hell! So yes that isa problem. There it no doubt about it end yesdyamic cushioning curves are a first puasa that adasigner uses to elbow his way in to a containerdesign and there are all kinds of things likeside constraints and the shape of the cushionsad thinga like that. A flat cushion is notnecessarily representative of mectly what youfind in contaisers but it's the best thingWo'e got that I know about and I think motpeople will agree that dynemic cushioningcurves ars the beat we've got today and they
"N e"a be a reliable msa of designing on a
preliminary basis and then putting into theprototype the shape, sine, statistics and wallcushioning that can he expected such that thefinal design should perform the way you wentit to. There still are those problem ofpreloadinS that you mentioned that are notaccounted for.
79
Isperinental resultsaon Hercules Minicel 91S032100clearly indicate that a tosprature effect M.cre:(iei yt" 6tigtadoes. Is fact, exst so should be tae intato:(ieicUem tigta
acon ythe container cusioning systow wee Interesting to us ia yew plot me thedesgnr It Is recommended that tesperaturs little triangle where the three eptirna curvessensitive dynestic cushioning curves be incor- or where the three cushioning carve@ sort ofporated in MIL-OUD-304, package Cushioning coas together near their optisme. The questionDesign, which will facilitate maxinm. distri- is how big does this triangle very from moatrial
butin o th infrusionto ontanerdes~oý to usteriel. If the triangle is very small itutOnr fteefrm.o ocntie ein would seem that is en Ideal spot to design
are. cuahioning independent of temperature effects.
The regression equations provided through Mr. McD§niel: (USAIC) That is the mey as far asthe analysis procedure ame a significant coo- bow big the triangle you get aed not only doesstribution to the study of cushioning moatrial it vary from moatrial to material but they alsotheory. It may be poesible with the mache- cnvr rmtikeso Mbibho nmatical modle of enables repons developed cnvr rmtikeso rphihho nbereft to formalate the mathematical relation- one particular moatrial end so tn this tase thes*Upe that represent the vieccelsatic prprties triangle is rether mall sad Is other cases if
of chialegmteial. No s . I tomotyou am up on the a level epsettu the triangleexpectedta lcuhioning m ateriala.Nwwei willa gate bigger you mee. So yea that to right sad1 ectla that saU cutering mantherala wil ofcourse that is Imoprtant ad smtimee If youbeaverial thnequenty p ette h asthera shicld are high enough c the S level en" for instance
matria. Cmequmtly eah ateialabold YOU have as allowble 125-150SO s them itbe teeted Individually, in a manner similar to wouldn't bother you that there is a substantialthe Plmicel teats. It io recognized that difference here in thus* things because you areextrapolatiom to other coshioning materials is alright at all three temerature$ anyway.mot possible freem oe Isolated material, That's right there is that point to be concerned
Base upn th enouraingresuts ro-with. umaly how big that triangle is and ema-mtdheredn rpmtesearch contaning re olsn* times you just fall outside of that triangletadd hereinl rsterar iyps codnstinies on mal And aren't reelly mare of it with the current
as the development of confidence intervals on ifraiua teivle uhinn seirgeerated design curves. Mr. Waser: (Supebipe, Grotem) I noticed thin
-EC2 material has the phnmm of creep when youuse it in containers. Dome the g factor change
1. Nhinel, Don, "A Study of lopact Test with reference to tio WOODS there is toueratureIffects Upon loomed plastic Containers," variauce or dues the curve very with tine?HICOM Report No. RL-TK-71-2, 1971 Mk. NeDaniel: Me didn't address the problom
2. VITA TAIS cal SytemSTA-FAK, ro- of creep we just recognised that there is that2. WIVA Lare Sale yatma SAT-ACK,~n- problow with any of those things sad even Lord
grmnors Reference, tJP7SO2 * Sperry Rend eight admit that their sheer mount might creepCorp.. Rev. 1, 1970 a little and yea that does happen eud its one of
3. Nscrella, Mary, !Lecrimental. Statistics, these things that you have in a viscoelasticNational Bureau of Standards Handbook 9i, noatrial. Me looked at the dymamic cushioningAug 1943 curves just like MI. Handbok 30 suggested that
ug.it should be looked at using that noemost of4. Miller, Irwin, and John K. lrend, Prob- test parerters and imputs with the exception
abilty ad Sttisics or faime -9.that we did have one slight disagreosent with:abliy d taitics- l fnlwor Cliffes.NJ, 195 the handbook. I really think that kind of thing
PreniceHall lelawod Ciffs N.., 145 mould he a very useful thing to put in Mr.5. Wok~a, ichrd . an Hikeya. ilbls, Handbook 304. If we cam ever convince the Air
"Temperature Sensitive Dynastic Cushioning Focoftt sbweongthai.Pwact ion Development and validation For Mr. iorkis: (ML) I wa wandering what theReeral"s MLnicel Thermopasetic loom," UM effect of prelmed weuld beacm that? it semaResearch Report me. 159. Sept. 1974 to ma that could make significant changese in
yeur acceloertiow level@ particularly thee youhave plus and smies loading we am itme and itwasn't clear tomes axactly how your test wasperformed. Too didn't hae" the I a loading themYea Ispoeted the specimam, if I am year droptesting arrenemeat properly?
78

IN.~
//
I IWl
'? ' ' f
Figure 1 - Launch System in Figure 3 - Launch System inShallow Angle Launch Vertical LaunchConfiguration Configuration
approximately S5,000 pounds grossweight. The system is equipped withaft end stabilizing outriggers, a crane,and two winches. All this equipment,plus the main gun elevation cylinder, ispowered by a 2000 psi by lSGPM hydraulicunit located at the front end. Thehydraulic unit, plus an adjacent4000-pound steel ballast, help counter-weigh the gun when the launch system is
The gun design was chosen fromthree final candidates, all powered bysolid propellant. The candidates werea normal, breech loading, closed-breechgun and associated recoil system, aconventional recoilless gun, and a DavisGun recoilless. Since no riflings orother torque-inducing features are
,--.> , ; required, all candidates were smoothbores.
The closed-breech gun wasrejected primarily because the recoil
Figure 2 - Launch System in system could not maintain low enoughProjectile Loading recoil forces over an acceptably smallConfiguration recoil distance. Low recoil forces
were needed to prevent lifting thelaunch system during gun firing and tokeep the structural loads within reason.
compatible with commercial tractors. The Davis Gun and conventionalIn the traveling configuration, the The guns wun and andethelaunch system is 40 feet long, is a recoilless guns were compared, and themaximum of 10 feet wide, and is Davis Gun was chosen. These two types
82
r __ __ 7

A DAVIS GUN PENETRATOR LAUNCH SYSTEM
L. 0. SeamonsSandia Laboratories
Albuquerque, New Mexico
(U) Interest in experimenting with large high velocity vehiclepenetration of in situ undisturbed earth targets has clmiatedwith a new test facility, the Davis Gun Penetrator LomrwSystem. The launch system is a trailer mounted gun. IMtrailer provides nobility and doubles as a gun mount d gumelevation mechanism. The Davis Gun is a special type od recoilless gun and fires test vehicles downwards into earth targetsonly a few feet away. The Davis Gun advantages over ethercandidate guns resulted in its selection for the facility butalso gave experimenters an extra projectile to worry about.
INTRODUCTION capability.
Earth penetration isearch, or 2. A gun, with the maximumterradynamics, is a 12-year old study practical bore dimter, must be usedarea at Sandia Laboratories. The to accelerate the payload.rimary object of these studies haseen to understand the dynamics of the 3. An experimental payload of
interaction between free-flying missiles, no less than 300 pouds must be deliveredor penetrometers, and undisturbed earth at velocities to 30W ft/sec.targets. Maximizing penetration hasbeen a major secondary goal. 4. The payload must be delivered
in a downward directim at angles rangingSince the targets must be from 30 degrees off horizontal to
au naturel, the experiment must go to vertical.the target. Targets generally areeither small, or require precision 5. The payload impact CEP can beimpact location, and the experimenter no more than a couple feet.must deliver the penetrator with a lowcircular error probable (CEP). These The contradiction between aconstraints, plus available facilities, roadable facility and a maximum size gunhave limited study to small penetrators determines the nominal size and weightand low velocity phenomena, of the launch system. The payload-
velocity-directioa needs dictate theNew potential applications of minimum gun size and general structural
penetrator technology have stimulated geometry. The resultant launch systeminterest in experimenting with large was a trailer-mounted gun. The trailerdiameter, high velocity penetrometers. provides mobility od doubles as gunIn response, a unique facility has been mount and elevation machanism at thedesigned and built to meet these goals. target site. The gom fires the payloadThe new facility is named, "The Davis downwards automatically satisfying theGun Penetrator Launch System". low CEP requirement by limiting free
flight to a few feet. The facility isDESIG4 PHILOSOPHY shown in different coanfigurations in
Figures 1, 2 and 3.The new facility was originally
defined by rather general criteria: As the photographs show, the gunrotates in a vertical plane about a pivot
1. The facility must be at the aft end of the trailer. Theroadable, with a moderate crosscountry trailer is a fifth-wheel type and is
a'
I,.: 0 / ."1
V2 after the projectiles have traveled elastic interface was taken one half
distances SI and S2. A few reasonable way through the wall thickness). Thetube will have a minimum life of S00
assumptions and the conservation of firings of 50000 psi peak pressure.momentum principle lead to theconclusion that the same propellant LAUNCH SYSTEM PARTICULARScharge reacting in the same initialpropellant chamber volume would result The two projectiles fired fromin the following closed breech Sun the Davis Gun are the penetrator"launch: A projectile weighing experiment and what is dubbed theW1 W2 reaction mass. Typical maximum
W 4 after traveling (S1 " $2) capabilities for a tube of this sizea re a 380 pound penetrator to 3000 ft/sec
would exit with a velocity of (V + V) or a 750 pound penetrator to 2000 ft/sec.1 2) In both of these cases, a reaction mass
Furthermore, V1 Sz V2 and the weight around 1500 pounds would be used." The mass ratio of the two projectiles is
optional as is the launch point location.time from first motion to gun barrelexit is the same for both projectiles.These simplified but reasonably accurate ware setup inside the tube is shown inrelationships enable the less familiar Figure S. In general, a penetrator-Davis Gun behavior to be transformed to experiment consists of a subcaliber"a closed breech gum framework. (i.e. less than 12 inches) penetrator
Toadapted to the bore diameter by a rigidThe Davis Gun has one dis- foam ring in front and an aluminum/
advantage: a piece of hardware exits steel piston in back. Penetrators arethe aft end of the gun instead of a planned to carry on-board telemetrystream of gas. This makes certain systems capable of real time in-targetrange safety and gun operations more data transmission. Techniques forawkward, but the many advantages of the recovering stored data without recover-Davis Gun were felt to more than ing the penetrator are also planned.compensate. These advantages were: Data recovery is vital since experiment
recovery from depths in the order of1. A simpler design and 200 feet is an expensive lengthy
significantly lower cost resulted, procedure, and in some types of targetswith shallow water tables, recovery is
2. No initial nozzle sizing virtual~y impossible.Swas required. The propellant charges are/ •3. There would be no object- modular. Each contains 50 pounds ofionable erosion problem to be monitored propellant and 8 ounces of black powderand evaluated, igniter material. Explosive packaging
is done with heavy cloth and a card-4. Inherent flexibility--the board tube provides an axial passageway
propellant chamber volume may be through the module for the launchvaried by merely changing the projectile positioning cable. The cloth propellantspacing, and the launch point may be container has a laced seam for easyanywhere, propellant removal when less than 50
pounds is needed. As many as four5. The internal ballistics are modules will be used for a given test.
more predictable. This is especiallyimportant when an experiment requires The reaction masses are alsolarge extrapolations from known modular with an axial passageway forbehavior ranges. the launch positioning cable. The
modules are sheet aluminum skins6. Less propellant is required attached to wood end caps and are filled
for a given propulsive task. with metallic shot. Other reaction massdesigns were considered and many were
The specific Davis Gun designed evaluated in scale model tests utilizingand built for the launch system is a an 8-1/2 inch smooth bore gun. Liquid12 inch inside diameter, 19.2 inch reaction masses were rejected because ofoutside diameter, 35 foot long, 21000 low density. Other designs which werepound tube. The gun was built from an tried and worked were stacks of thin,alloy steel forging heat treated to 60 mil, steel plates with transverse or175000 psi tensile yield strength, and longitudinal lamination orientations.the tube was 50 autofrettaged before Solid reaction mass modules would alsofinal machining (i.e. the plastic- work, but they would require almost
84
- ----

I I
-- & BARE - - C KBIR •- -NOZZLE
BURSTP RPELLA DIAPHRAGM
ADVAD ACES
/O T1 I. GAS macnION MASS.C~ONVENTIONAL RECOILLESS GUN
CONS T1.. BARREL 1 SIMR, I COST DESIGN
S2.NO INITIAL NIZZIE SIZINGI. NO EROSION /RfECOIL PM MLD
4. FREXIBILITY: VARIABLE CHAMBERVOLU AW LAUNCH POIN
.............5. MORE PREDICTABLE INTERNALMPACTILEJ L.omu N L ct~o B.ITICS
CHARGE MASS 6. LESS PSOI)LUNT REWUIRED
DAVIS GUN RECOILLESSFigure 4 - A Conceptual Comparison of the Conventional
and Davis Gun Recoilless Guns
of recoilless guns are conceptually machined to adjust the net recoilcompared in Figure 4. force. Nozzle throat erosion and
changing recoil forces are experiencedAs can be seen, the conventional after the gun leos into service.
recoilless basically consists of abarrel, a propellant chamber and a In contrast, the Davis Gunnozzle. In large caliber guns, these recoilless consists only of a constantdifferent parts are, of necessity, inside diameter tube open at both ends.separate pieces of hardware and require A propellant charge resides between twojoint designs for assembly. Normally, projectiles and, at ignition,there is a burst diaphragm in the simultaneously drives them in oppositethroat of the nozzle section to enhance directions. The recoil forces auto-initial pressure buildup in the matically net out to zero with thepropellant chamber. exception of negligibly small differ-
ential friction forces. Note that theIn the conventional recoilless zero axial force condition remains true
gun, the propellant charge is ignited even if projectile exit times differ.and the pressure simultaneously The second projectile only constrainsaccelerates the projectile and causes the propellant gas enough for propergas to flow through the nozzle. Proper pressure to develop.nozzle design results in a pressuredistribution which integrates out to An interesting equivalencezero net force on the gun. Typically, exists between the internal ballisticshowever, a recoilless gun must undergo of a Davis Gun and a closed breech gun.a series of gun firings in a pendulum Assume a Davis GuI launches projectilesmount to size the nozzle. Either the weighing W1 and V2 at velocities V1 andnozzle throat or exit diameter are
83

BLAST AND IMPlSIVl LOADING
1. X-RAY SIMULATICK WITH LIGHT-INITUTED EXPLOSIVE
K
R. A. Benham"F. H. Mathews
Simulation Division 9321Saudia Laboratories
Albuquerque. New Mexico 87115
"ABSTRACT
X-ray blowoff effects are simulated by the detonation ofa sprayed coating of explosive initiated by intense light.
-,_ 'I--f
.9
1 9

/
the end of the gun barrel at the otherend. An intermediate swage-on cablestop holds the weight of the reactionmass and keeps it off the propellantcharge. The propellant char;e ignitioncable is attached to the positioning
SPcable from the aft end of the propellantLAUNCH POSITIONING charge to the ead of the gun barrel.
CABLE When the propellant charge is
ignited, the launch positioning cablepulls out from the penotrator piston ata 60 psi pressure level. The penetratoris accelerated out the gun barrel andinto the target where the foam ring and
TION MASS piston are stripped off. The reactionT mass exits the other end of the gunM•ODULES barrel, and the containment skin, havingbeen cut by knives mounted on the end of
the barrel, imediately bursts and freesGAS SEAL the metallic shot. The positioning
cable is cut as the reaction mass exitsSWAGED CABLE by a knife blade feature built into the
tie-down hardware at the end of the gunSTOP barrel. The projectile mass ratio is
"set for a reaction mass exit velocityless than 1000 ft/sec. This velocitySPROPELLANT and the high air drag configurationafter burst limit -he reaction mass
MODULES range to less than 1000 feet in theinitial velocity direction.
GAS SEAL CONCLUSION
A versatile tool for conductingPENETRATOR on site earth penetration experimentsPISTON is now available at Sandia Laboratories.
'4-1 Present plans include testing of earthpenetration devices ranging in diameter
SUB-CALIBER from four to six inches, in weight from400 to 1000 pounds and in impact
PENETRATOR velocity from lOO to 3000 ft/sec.Shake down tests will be conducted inthe Albuquerque, New Nexico area andFOAM RING initial testing will be done at TonopahTest Range in Nevada.
This work was supported by theUnited States Atomic Energy Commission.
Figure 5 - Typical Davis GunPenetrator ExperimentSetup, Launch Position
unrestricted overhead air space and/or"large downrange restricted areas.
The launch positioning cable isa length of 1/4 inch aircraft cablethat is initially used to tow the entirelaunch assemblage into position and attube elevation suspends everything inposition until the propellant charge isignited. The launch positioning cable
- ties into the penetrator piston at oneend, passes through the axis of thepropellant charge, passes through theaxis of the reaction mass and ties to
-- - -i

subsequent spray operation, since explosivewet with acetone will not detonate. Erythrosin-B dye is added to increase the light absorptive-ness of the SASN. thus improving its initiationproperties.
The SABN-acetome supply is stirred continu-ously to maintain a homogeneous suspension.A peristaltic pump. employing a squeezingaction on flexible rubber tubing, provides con-tinuous circulation of SASN to the valve of thespray nozzle. The spray gun is mounted on areciprocating carriage that can be traversed atuniform speed across 'the surface to be painted.By the careful control of spray parametersU(.e. position, speed. pressure, and mixture)a misform layer of explosive is deposited duringeach spray pass. Since all these operationsmust be conducted remotely. trials with inert Figure 2. Spray arrangement for an axiallymaterials and simulated test shapes arefrequently necessary to establish control of symmetric structuredeposition. ___
Control and Verification
S,/ • One of the techniques used to control explosivedeposition is illustrated in Fig. 2. This setupwas used to obtain an impulse varying a acosine over half the surface of a stainless-steel ring. A mask restricts explosive deposi- /tion to a narrow arc of the ring surface. By/ "rotating the ring and making repeated spraypasses, the desired contour is built up in in-crements of explosive, each corresponding toan impulse load of 25 tape. * Initially, phenolic Mur"weighing coupons are mounted on both the ringand adjacent surfaces to assure that identical R -quantities of explosive are deposited in bothlocations. During the actual spray application. *1 TAP
the coupons are only placed at intervals PS*1 TAP
adjacent to the ring. Periodically. in thespraying sequence, the coupons are removedand weighed to determine the local areal_density of the applied explosive, and adjust- 1 20 30 40 50 0
ments in the spraying sequence are made if SPRAYE AREAL DNSITY (Mvtmll
necessary. The impulse imparted to the testobject is directly related to the areal density Figure 3. Impulse vs areal density forof deposited explosive as shown in Fig. 3.This relationship has been determined experi- Ag 2 C2 AgNO3mentally, with individual impulse measure-ments generally falling within 5 to 10 percent An example of the way the explosive distri-of the empirical relationship. The impulse bution over half of the ring surface is checkedmeasurements are obtained by observing, with for accuracy is shown in Fig. 4. Impulsea pulsed x-ray shadowgraph, the velocity values anticipated from coupon weights andimparted to the coupon from the detonation of measured from coupon firings were comparedthe explosive on the phenolic coupon. to the values desired. As an additional check,
the rigid-body velocity imparted to the ringstructure was measured and found to be con-
*1 tsistent with the desired cosine distributionI tap= dyne-sec/cm2 of impulse.
89
X-RAY SIMULATION WITH LIGHT-INITIATED EXPLOSIVE
Introduction tungsten wires powered by the discharge of acapacitor bank. initiates the explosive. In-
When a weapon structure is exposed to x-rays. strumentation is available for measuringthe energy deposited in the surface material strain, acceleration, pressure, and displace-may result in its vaporization and subsequent ment. and for obtaining both high-speed
"* blowoff. This blowoff imparts an impulse to photographic and pulse x-ray pictures of testthe structure within a few microseconds. To events.furnish information about structural behaviorcaused by this loading, previous laboratoryexperiments have employed electron-beammachines. magnetically accelerated flyerplates, and strip explosives to simulate blow-off impulse. In the method described here.the weapon structure is spray-painted with a pnwsmcoating of silver acetylide-silver nitrate o0(SASN). a light-sensitive explosive. Thisexplosive combines initiation sensitivity andloading simultaneity with the ability to detonatein thin layers. When detonated by an intense W Areflash of light, the explosive delvers a pre*- Lowsure load that simulates x-ray impulse effectson a test structure. This technique is partic-ularly useful for structures with irregularsurfaces and is employed with other simulationtechniques and with underground experimentsto study weapon vulnerability.
This technique was first developed at South- av.awest Research Institute in 1965 [1. 2]. Earlywork involved spraying the explosive, by hand.onto relatively small and simple struccures. Figure 1. Plan view of facility
"Spray Application of ExplosiveFacility
The SASN explosive is manufactured in theA facility suitable for the handling of primary* spray chamber by remote control as the firstexplosives is required for spray-painting step in each spray operation. A precipitationSASN. The facility (Fig. 1) is designed so process is employed in which acetylene gas isthat all operations involving significant dispersed through a solution of silver nitratequantities of explosive are performed re- and methyl cyanide. The silver nitratemotely. The operator is protected by an reacts with the acetylene gas as follows:explosion-proof window and has access to thetemperature-controlled spray chamber by a 3AgNO3 + C2 H2 Ag2C2 AgNO3 + 2HNO 3pair of master-slave manipulators. An ex-
haust system draws over-spray of the explo- The SASN (Ag2 C2 • AgNO3 ) settles oit as asive into a disposable filter that can be white precipitate and the supernatant fluidtransported to an incinerator by a remotely (nitric acid) is .. canted into a waste beaker.controlled monorail. A similar monorail is The explosive is then washed with acetone toused to transport the test object into firing remove excess nitric acid and other impuri-position. Here the light source, an array of ties. Acetone is used as a carrier in the
'Primary explosives can be detonated easily by heat or shock.
q
subsequent spray operatin. since explosivewet with acetone will not detonate. Erythrosin-B dye is added to increase the light absorptive-ness of the SASN. thus improving its initiationproperties.
The SASN -acetone supply is stirred continu-ously to maintain a homogeneous suspension.A peristaltic pump, employing a squeezingaction on flexible rubber tubing, provides con-tinuous circulation of SASN to the valve of thespray nozzle. The spray gun is mounted on areciprocating carriage that can be traversed atuniform speed across the surface to be painted.By the careful control of spray parameters(i.e.. position, speed, pressure, and mixture)a uniform layer of explosive is deposited duringeach spray pass. Since all these operationsmust be conducted remotely, trials with inert Figure 2. Spray arrangement for an axiallymaterials and simulated test shapes are
frequently necessary to establish control of symmetric structure
deposition.
Control and Verification
One of the techniques used to control explosivedeposition is illustrated in Fig. 2. This setupwas used to obtain an impulse varying as acosine over half the surface of a stainless-steel ring. A mask restricts explosive deposi- 20
tion to a narrow arc of the ring surface. Byrotating the ring and making repeated spray -passes, the desired contour is built up in in-crements of explosive, each corresponding toan impulse load of 25 taps. * Initially, phenolicweighing coupons are mounted on both the ringand adjacent surfaces to assure that identicalquantities of explosive are deposited in both US" - * TAP-
locations. During the actual spray application. barthe coupons are only placed at intervals MD -.. I.$ • 10 TAPS
adjacent to the ring. Periodically, in thespraying sequence, the coupons are removedand weighed to determine the local areal 0density of the applied explosive, and adjust- 1t 20 30 40 50 60
ments in the spraying sequence are made if SPRAYED AREAL DENSIY (mg'cm')
necessary. The impulse imparted to the testobject is directly related to the areal density Figure 3. Impulse vs areal density forof deposited explosive as shown in Fig. 3. Ag2C2 " AgNO3This relationship has been determined experi- Amentally, with individual impulse measure- jtments generally falling within 5 to 10 percent An example of the way the explosive distri-of the empirical relationship. The impulse bution over half of the ring surface is checkedmeasurements are obtained by observing, with for accuracy is shown in Fig. 4. Impulsea pulsed x-ray •. adowgraph. the velocity values anticipated from coupon weights and
imparted to the coupon from the detonation o. measured from coupon firings were comparedthe explosive on the phenolic coupon. to the values desired. As an additional check,
the rigid-body velocity imparted to the ringstructure was measured and found to be con-
*1 tap = dyne-seccm2 sistent with the desired cosine distributionof impulse.
89
Z;-
. .. .. .. . .

7 '
Figure 4. Comparison of impulse from couponmeasurements to desired impulse
Explosive Behavior
Figure 5. Magnified view of markingsThe explosive is initiated through heating left by explosive detonationcaused by an intense flash of light. Lightradiating from an arc formed around each The detonation wave striking the surface iswire provides a power input to the explosive not planar and retains a shape imposed by thesurface of several hundred kilowatts per discrete detonation points. However, thesquare centimeter. causing explosive initia- detonation wave strikes the entire surfacetion 5 to 6 tssec after arc formation. A 100-kJ within 1 usec, which is much shorter than thecapacitor system provides sufficient energy rise time of the structural response. Quartzto initiate one square meter of explosive and tourmaline gauges that average pressuresurface, over several initiation points indicate that
average pressures up to 4 kilobars may be 4
Initiation occurs independently at many dia- obtained at the structure surface.crete points on the explosive, with initiationdensities ranging from 20 to 300 per square
centimeter. A detonation wave propagates Experimental Verificationfrom each point until a similar wave radiatingfrom an adjacent initiation point is encountered. The test on the stainless-steel ring (Fig. 2)The resulting intersections generate high- was performed to establish the validity of thepressure regions that leave a visible pattern photo-explosive method for simulating impulseon the surface of the test item, as shown in loading. This was done by demonstrating a
Fig. 5. The dimensions of these patterns and measured response from the explosive testthe detonation rate of the explosive (U. 2 ram/ that duplicated or closely followed the re-
gsec) may be used to determine the time sponse predicted by elastic ring theory. Aneeded to detonate the explosive surface in a comparison of predicted and measured re-particular region. About 0.4 Usec would be sponses is shown in Fig. 6. The theory curve
required for the area in Fig. 5. where there comes from the modified Humprey-Winterare about 150 initiation points for each square Modal solution to the problem of elasticcentimeter of surface. Simultaneity moasure- response of a thin ring to a pure impulsements indicate that even widely separated load. The ring material had minimal strain ipoints of a large surface initiate within I usec rate and strain hardening effects (3). Strainof each other. is shown during a relatively early time when
90
* /
$ -o ,
it is dominated by a high-frequency membrane List of Referenceswave. Similar comparisons at other locationsand at later times, when bending strains 1. G. E. Nevill, Jr., and F. 0. Hoese,dominate, are equally close. This demonstra- "Impulse Loading Using Sprayeu . ilvertion justifies the use of the photo-explosive Acetylide-Silver Nitrate," Exper'mentalprocess for simulating impulse loading so that Mechanics, September 1965, pp. 2-14-198.applications may now include structures whereunknown material properties [4] or geometri- 2. F. 0. Hoese, C. G. Langner, an W. r.cal complexity prevent complete analysis. Baker, "Simultaneous Initiation Over
Large Areas of a Spray-DepositedExplosive," Experimental Mechanics,September 1968.
3. M. J. Forrestal. M. J. Sagartz, and H.C. Walling, "Response of a CylindricalShell to a Cosine Distributed Impulseover Half its Circumference," AIAA
o "Journal, Vol. 11, No. 9, September 1973,pp. 1355-56.
4. R. A. Benham, "Impulse Tests of• ,,l, Graphitized CVD Carbon Felt Rings,.
Sandia Laboratories Report SLA 73-0941,January 1974.
Figure 6. Comparison of predicted and 5. R. A. Benham, "Nose Tip Impulse Testsmeasured strain for a steel Using Light Sensitive Explosive, " Sandiaring; explosive detonation Laboratories Report, SAND74-0211,occurred at T = 0 Novenber 1974.
6. R. A. Benham, "Impulse Tests of theExperiments on more complex structures SAMAST-02 Aft Cover, " Sandiah'tve included lateral loading of nose segments Laboratories Report. SIA 74-0293,[5] and aft loadings of full vehicles. A August 1974.toroidal aft cover is the most difficultgeometry yet attempted [6].
DISCUSS ION
Hr. O'Hearne: (Martin Marietta) I was a little Mr. Benham: The positioning of the light sourceunclear as to how you located the light sources with respect to the explosive is not veryrelative to the target? critical. We have to be within 4 to 6 inches
from the surface of the explosive so we haveMr. Benham: We have a positioning indicator some flexibility. The test object is takenon the trolly of the monorail system which around on the monorail and positioned in frontremotely stops the carriage when it gets in of the light array where these circles indicatethe proper position in front of the light the light array itself. We have a positionsource so this is set up prior to starting indicator on the monorail system which stopsthe spray operation. the carriage thert supporting the test object
in front of the monorail system at the properMr. 0'Hearne: What I am thinking of is wher, position.you initiate the explosion with your lightsimpulse, how are the sources arrayed? WhatI was thinking of was the problem you have
when you have a complex shape and you placethe layers on there according to the chargeyou want, how do you get them initiateduniformly? How are the sources arrayedrelative to the target?
91

STRUCTURAL DYNAMIC RESPONSE
TO HEIGHT-OF-BURS! AIR BLAST LOADIIG
H. F. Korman, N. Lipner, J. S. ChijTRW Systems Group
Redondo Beach, California
The traditional technique for designing or assessing the hardnessof protective structures to air blast loads uses equivalent triangularpressure histories to represent the blast. This introduces a degreeof approximation which can result in hardness uverestima~es or under-estimates, depending on the method for determining the load durationtime. This paper describes the development of structural dynamicresponse factors for air blast loading which considers the completepressure history. The loading is based on the most recent advancesin air blast phenomenology which provides a calculational procedurefor the determination of the waveform shape as a function of weaponyield, peak pressure and detonation height-of-burst.
The analysis modeled the structure as a single degree of freedomsystem with an elastic-perfectly plastic spring and no viscous damp-ing. For structure frequencies of interest, code calculation resultsessentially collapsed into one set of parametric curves which relatethe following key variables: structure frequency, weapon yield,pressure decay time parameter, allowable ductility ratio, and dynamicload factor. These curves provide a technique for design or evaluationof structure components which is no more complex than using the dynami:load chart for triangular pulses.
INTRODUJCTION DYNAMIC RESPONSE ANALYSIS
With advances in the design of nuclear In this study the structure was consid-hardened weapon systems, it has become increas- ered to he a surface flush target (Figure 1)ingly more important to accurately dssess the wnich could be modeled as a single ucgree-of-hardness of protective structures to air blast freedom system with an elastic-perfectly plas-loads. The traditional technique fcr design or tic spring and no viscous damsping. The springassessment [1] uses equivalent triangular pres- resistance q(x) is linear with deflection xsure histories to represent the air blast. This until the yield deflection x is reached [whereintroduces a degree of appruximatior which can yresult in hardness overestimates or underesti- q(x ) qy j and then is constant unti themates, depending on the method for determining peak deflection vx is attained. Thus, the duc-the effective load duration time. This paper ydescribes the development of structural dynamic tility 1 is defined as the ratio of peak deflec-response factors for air blast loading wh<'n tion to yield deflection. The elastic frequencyconsiders the complete pressure history. The f is related to qy, xy and m as shown in theloading is based on the ,ost recent advances in Figure. Structure dynamic response was deter-air blast phenomenology [2] which provides a nined for two analytial fits (termed simple andcalkulation procedure for determining the wave- lirect) to the dirblast loadir,> is defined inform shape as a function of weapon yield W, peak Reference 2.*vressure p.' and detonation height-of-burst HOB.
l These analytic fits produce essenlally the
same pressure nistories for a surface burst asthe ea-lier Brode triple exponential pulses [3).
91
~ ~ ~ ~ ~ ~~6 M 0 . . . . . . . . rI . . . . . . . ! . . . . . . . . . . .
4ac
06
--do '.
944
Figure I summarizes the calculational is that in Figure 4 the parmeters (H0W-1000 ft.procedure for determining dynamic response fac- pm 3000 psi) correspond approximateoy to thetors (pm/qy) for a specified Pm and HUB. A Hpatimal HO condition (largest ground range for
series of computer calculations generate (dq ) achieving the p* value), while in Figure 3 thecurves for several values of the frowueny '
for the pressure waveform associated with conditions are below optimal MOB (HOB - 1000 ft,Pao HOB and W. Details of structural dynamic p1" 1000 psi). It should be noted that
MOB a 1500 ft Is the apprcmite optimal condi-response analysis are given in many textbooks tion for 1000 psi. Thus, from a structural res-such as M4]. Crossplotting the curves produces ponse viewpoint, it makes little differencethe dynamic response factors as a function of f whether the simple or direct fit is used. Breftwith u as a perameter. pulse results in Figures 5-7 discussed below were
If similar dynamic response charts were generated using the direct fit.raquired for each 16 and HM which might be of Structural response Onslyses were conduct-Isterest, this approach would be too cu" ad for INT and peak pressure ranging from 300 toto be of value. Fortunately there Is a techmique 3000 psi. Both surface amd air bursts with WOB'sfar generalizing the chart shown Is figure I to as high as 3000 ft wae cossfiered. When the re-apply t & Significant rang of P andiOB. " n sponse ratio •I y as dslsla dai S function of
this manner at most only a few charts wOuld be ftoo witt i as a paremeter, it curves essen-required for the total range of po and NOB whch tially collapsed upon each ether fcr ftonA0.6.might be of interest. Figure 5 shows, for three values nf ,. the bend
Consider the initial slope intercept ton within which the resalts collapsed. The devia-
of the Erode pulse shown in Figure 1. This r4- tion as fto0 becomes sall are to be expectedramoter is an approximate measure of the time because the response becoms more sensitive toscale of pressure decay for various Pal In the ft1 as f is reduced. It should be noted thatsae manner that U113 Is an exact measure of this for most hardened targets ef interest, fto willtime scale for a given p and NOB. Thus a notu- 0te sbe large eonough to pemit the use of a singlerel approach for attempting to generalize the set of curves. For this region a hardnessdynamic response was through the parameter ft evaluation tochnique based on these Brode pulsesor alternatively the paramter is no more complex than the dynamic load chart
for triangular pulses.
f~,W 1/3 A coparison of the Irodei pul se resul ts(for a surface burst at Pa a 1000 psi) with the
too types of triangular pulses is presented InWhere t• is the value of too for a iNT burst and Figure 6. It is see that at high frequency the
M N wtoo triangle approximsties is adequate. However,
in the lower frequency regio the initial sloPethis appr ach was quite successful, response ratios increase faster as ftoo is do-
The variation of t; with Pm for several creased than do the Erode pulse curves. FotNOB Is shown in Fiure 2. The figure is based on example, given a 1MT surface burst at 1000 psi,ES] which contains data for additional HOB. Also a structure frequency of 40 cps (foo 1). andshowv in Figure 2 is total Impulse intercept t, ductility of S. the too triangle approximatior.Wch is the intercept of a linearly decaying will yield a response 171 lower than that of thepulse with the same impulse per unit area as the brode pulse. Whether or met a hardness evalu-pressure weveform. ation using too triangles will be significantly
Brode pulse results will be compared to unconservative can be determined from Figure S.zero rise time triangular pulse results which On the other hand, the imlse triangle pulseappear in the literature In the form of dynamic curves fall off much more slowly than Brode pulseload charts (e.g.. Ell). Two Intercepts will be curves as ft is decreased. Preserving totalconsidered, too (initial slope related) and t impulse with triangular pulses thus produces re-(impulse related). sults which are too conservative for the ftoo
RESULTS AND DISCUSSION rane shown In the Figure. For very wall ft00iSince Erode presewts two approximations the curves must begin to conve again because
for air blast pulses, It Is of interest to cam- the response is impulse sensitive. The edvan-pare structural response results for each approxi. ta" In using brode pulse results instead ofmotion. Figures 3 and 4 present such results fortwo sets of parameters. Each comparison showslittle difference between the two approximations. *etights of Burst discussed in this section areThe essential difference between the two figures referenced to 1MT condititns.
95

Cal
~ ~ 8~2 cm(Z~d)3WISSUdW3A

Y
I II;: ' • . . . $
----I - I-
' -
• P.
97

I
I
U, -'.
U I',
a•
Nw-- J
/ *8
4.
_________ U
- -S
iI� I.4�Z
*C
*o
o
1///
/ p p p -
* * *N -a a
'9

LU LAA
cc_____________
cm
40/ In Iy C. *
co I0 4 -W C-
*1c ' C; f
~~Ci i p%*
I 00
e those for the equivalent triangles is cledrlydemonstrated, especially for low yield conditions.
CONCLUSIONS
The above discussion has shown that theBodse pulse results can be simply and accuratelyused for structural dynamic response to air blastloading. Hence, it is recomended that Figure 7(generated using the direct fit Brode pulse withP6 a 1000 psi and surface burst conditions) be
used for design and hardness assessment of pro-tective structures for a pressure range from 200
to 6000 psi and MOB range up to 3000 (W/W*)l 1/3ft(W e INT). Results ore only showr for ft 00 .3to preclude any significant errors with the coi-lapse technique. The accuracy of the curves out-side this region has not been investigated; otherpressure levels are of limited interest.
ACKNOIEDGEHENT
This work was performed through thesupport of the United States Air Forc, SAMSOContract No. F04701-74-C-0068. The aothors wishto express their appreciation to M. A. Brady forhor computer programing efforts.
REFERENCES
1. Nmmark, N. M., et. al., "Air Force DesignManual." AFSWC-TDR-62-138, December 1962.
2. Brode, H. L., "Height-of-Burst Effects atHigh Overpressures," DASA 2506, July 1970.
3. brode, H. L., "A Review of Nuclear ExplosionPhenomena Pertinent to Protective Construction,"Rand Report R-425-PR, Nay 1964.
4. Biggs, J. H., Introduction to StructuralDnmcs, McGraw Hll, 1964.
S. Newmark, N. M., "Effect of Height-of-Burst onH'orizontal Yielding Targets," DNA-3252F,Narch 1974.
IO0
14 2
I I
_ _ _ _ _ _ _ _ _ _ _ _ _ _ _ _ _ _ _ _ _ _ _ _/IyIto
CL 4Ax ISr
co-
U ~ a.
LtA41t in140 W C so C.
cs C;
102.
DISCUSSION
Mr. O'Hearne: (Martin Marietta) You justremarked that the curves are quite applicable&ad my personal feeling of insecurity is inthe modeling of this head structure and similarstructures as single degree of freedom elastic/plastic esytems perhaps you could comment onthat?
Mr. Reruns: (TRW Systems) Teo, I said that ourwerk takes out just one element of the art Inthis activity. You are quite correct in point-Log out the other element that io exceedinglyi£prtaut which is the choice of your systemparoamters. That is really something whichto based em a lot of civil engineering eaperi-Smes, but io so" of our applicatione we havetest data which demonstrates whet the foods-mestal Uos& io and then we can pick out thefrequency. One can use standard civilwaineering practice, where static calculationsare useed to determine these resistance forces.We've also done structural response analysiswith finite element codes to pin down whetthe primary modes ore and again it is a modalanalysi* that counts and guessing the rightresistance force is a key factor which io stillan art or something based on one's engineeringJudgmnt and experience*.
103

RESPONSE OF FLAT PLATES SUBJECTED TO MILD IMPULSIVE LOADINGS
C. A. RossUniversity of Florida Graduate Engineering Center
Eglin Air Force Base, Florida 32542
W. S. StricklandU. S. Air Force Armament LaboratoryEglin Air Force Base, Florida 32542
This paper presents the results of an effort to deter-mine failure of flat plates subjected to mild impulsiveloadings generated by a fuel air explosive. A membranemodel based on a total plastic strain energy function, arigid strain hardening constitutive relation and an assum-ed final deformed shape was used to derive an equation ofmotion for the plate centerpoint deflection. Controlledfuel air explosions, contained in a gas bag, were used toproduce blast loadings on square aluminum plates with fix-ed edges. A dynam.ic shadow Moire technique was used toobserve plate deformation modes. Plate failure occurredas a result of gross deformation.
INTRODUCTION Abrahamson, et al, [2] assumed onlybending in circular plates and describe
Response of plates to impulsive the dividing region between the staticlads is usually described in terms of and traveling plastic hinges mechanismstwo rather distinct mechanisms, i.e., a in terms of the static collapse loadstazic mode ini which the plate deforms based on the plastic moment required tounder a rather continuous pattern produce a plastic hinge. In this casethroughout the deflection process and if the maximum overpressure of thea Plastic hirge mode in which the in- loading is less than twice the staticit.al deformation is by a traveling collapse pressure the static mechanismplastic hinge associated with stress is operative and if the maximum over-wave propagation. The demarcation be- pressure is greater than twice thetween the t'-o mechanisms has been de- static collapse load then the travelingfined in one case [i] in terms of the hinge mechanism is assumed to operate.characteristic period of elastic vibra- Result3 of reference [2] indicate thattion and the positive pressure phase of bending alone is not sufficient to Dre-the impulsive load. In this case if dict large plate deformation and mem-the positive pressure phase of the load- brane forces must be taken into accounting exceeds one quarter of the charac- in the analysis. Cox and Morland [3]teristic period of the plate then the using the same Reneral assumption ofpla~e will respond in a vibratory man- reference [2] determined the total cen-ner. If the positive pressure phase tral deflection of simply supportedof the loading is less than a quarter square plates subjected to mild impul-of the elastic chara:teristic period of sive loads. Hudson [4] was probablythe plate then a plastic hinge will the first to observe the hinge mechanismform at the boundaries and will move to- in thin circular diaphragms subjectedward the central portion of the plate. to blast loadings and developed a
105
pUmn am UA=.O num
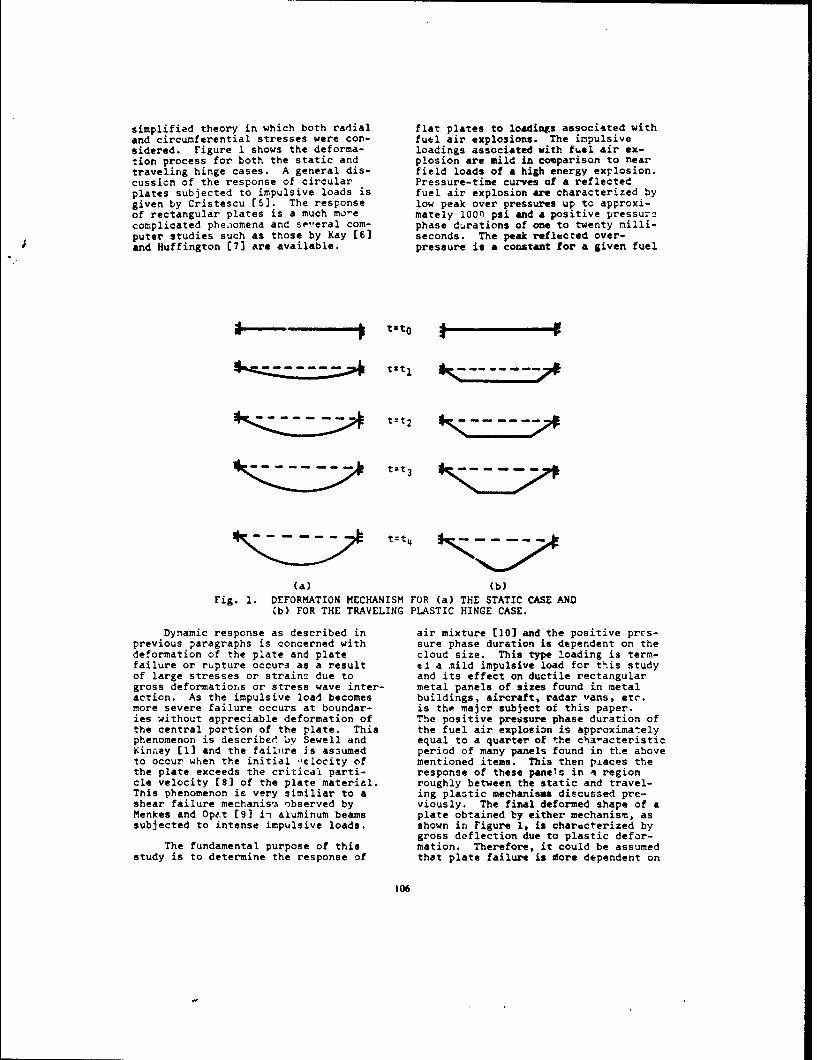
simplified theory in which both radial flat plates to loadings associated withand circumferential stresses were con- fuel air explosions. The impulsivesidered. Figure 1 shows the deforma- loadings associated with fuel air ex-tion process for both the static and plosion are mild in comparison to neartraveling hinge cases. A general dis- field loads of a high energy explosion.cussion of the response of circular Pressure-time curves of a reflectedplates subjected to impulsive loads is fuel air explosion are characterized bygiven by Cristescu (5). The response low peak over pressures up to approxi-of rectangular plates is a much mo-e mately 100O psi and a positive pressuracomplicated phenomena and sev.'eral com- phase durations of one to twenty milli-puter studies such as those by Kay [6] seconds. The peak reflected over-and Huffington C73 are available, pressure is a constant for a given fuel
t't2
tzt 3
(a) (b)Fig. 1. DEFORMATION MECHANISM FOR (a) THE STATIC CASE AND
(b) FOR THE TRAVELING PLASTIC HINGE CASE.
Dynamic response as described in air mixture [10] and the positive pres-previous paragraphs is concerned with sure phase duration is dependent on thedeformation of the plate and plate cloud size. This type loading is term-failure or rupture occurs as a result ei a mild impulsive load for this studyof large stresses or strains due to and its effect on ductile rectangulargross deformations or stress wave inter- metal panels of sizes found in metalaction. As the impulsive load becomes buildings, aircraft, radar vans, etc.more severe failure occurs at boundar- is the major subject of this paper.ies without appreciable deformation of The positive pressure phase duration ofthe central portion of the plate. This the fuel air explosion is approximatelyphenomenon is described by Sewell and equal to a quarter of the cha-acteristicKinn~ey [1] and the failure is assumed period of many panels found in tl.e aboveto occur when the initial ',locity of mentioned items. This then places thethe plate exceeds the critical parti- response of these panels in i regioncle velocity [8] of the plate material, roughly between the static and travel-This phenomenon is very similiar to a ing plastic mechanisms discussed pre-shear failure mechanism observed by viously. The final deformed shape of aMenkes and Opet (9] in aluminum beams plate obtained by either mechanism, assubjected to intense impulsive loads, shown in Figure 1, is characterized by
gross deflection due to plastic defor-The fundamental purpose of this mation. Therefore, it could be assumed
study is to determine the response of that plate failure is iore dependent on
106
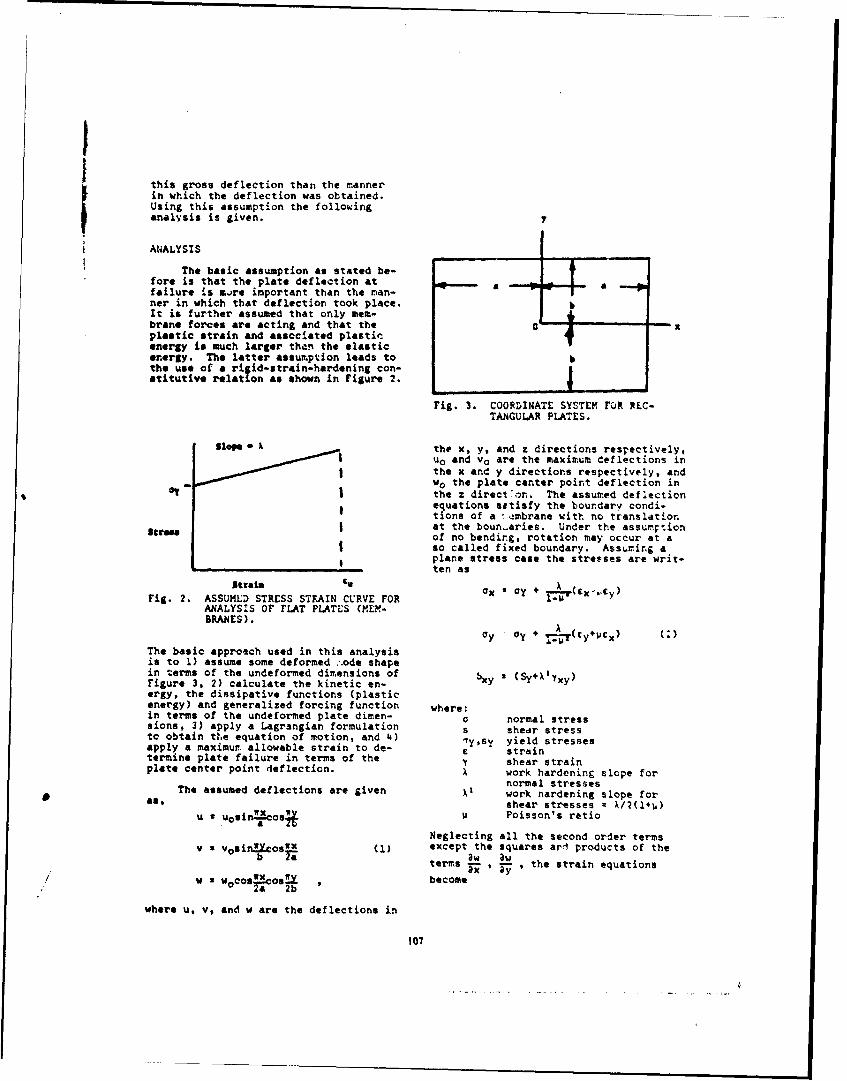
Ithis gross deflection than the manner
in which the deflection was obtained.Using this assumption the followinganalysis is given.
A14ALYSIS
The basic assumption as stated be-fore is that the plate deflection at afailure is mjre important than the man-ner in which that deflection took place. bIt is further assumed that only mem-brane forces are acting and that the c -
plastic strain and associated plasticenergy is such larger than the elasticenergy. The latter assumption leads to bthe use of a rigid-strain-hardening con-atitutive relation as shown in Figure 2.
Fig. 3. COORDINATE SYSTEM FOR REC-TANGULAR PLATES.
$lope- * the x, y, and z directions respectively,uo and vo are the maximum deflections inthe x and y directions respectively, andwo the plate canter point deflection in
OT the z direct on. The assumed deflectionequations satisfy the boundary condi-tions of a -•mbrane with no translation
setrs at the boun-aries. Under the assumptionof no bending, rotation may occur at a
I so called fixed boundary. Assuming a* plane stress case the stresses are writ-
ten as
Strata CuFig. 2. ASSUMLD STRESS STRAIN CURVE FOR Tx oy + (x.-V y)
ANALYSIS OF FLAT PLATES (HEM-BRANES).
vy Oy + •s•(cy+pcx)
The basic approach used in this analysisis to 1) assume some deformed -.ode shapein terms of the undeformed dimensions of yFigure 3, 2) calculate the kinetic en-ergy, the dissipative functions (plasticenergy) and generalized forcing function where:in terms of the undeformed plate dimen- o normal stresssions, 3) apply a Lagrangian formulation s shear stressto obtain the equation of motion, and 4) lysy yield stressesapply a maximum, allowable strain to de- E strainternine plate failure in terms of the shear strainplate center point deflection. work hardening slope for
normal stressesThe assumed deflections are given Al work hardening slope for
as, shear stresses x A/2(1+u)u 2 uosi X o8"cs u Poisson's rotio
Neglecting all the second order termsv a vosin!Xcoswx (1) except the squares arl products of the
terms !w- , the strain equations
w a wcoswxos!O , become
2a 2b
where u, v, and w are the deflections in
107

-II,2 I I
*x a u d (aL) rL sqj (7)3 2 O ~ q
C a v (3) (32 where qi represents the generalizeday 2 3y coordinates uo, Vo, and we, the equa-
tions of motion for the plate may bedetermined. Performing t.w proper
f• . ,•1 + 3W(Iw. steps as called for in Equation (7)3Yy y •x ' eX s ye " leads to three coupled nonlinear differ-
ential equaticns prescribing the de-Defining the dissipatlva furction or fleetions of the membrone. These equa-plastic energy per unit volume as the tions are omitted here and the assump-area under the stress strain curve the tion that u and v are small in compari-total plaotic energy PE is expressed as son to w is imposed. Applying this
,assumption to all the proceeding Equa-'a e, tiono (1) to (6) and siubstituting the
PF a h f f (1vC €¥) results into Equation (2) the equationL" l-~b L KCX#Cof motion for a rectamnula plato (mem
brane) of size lex2buh sbjected to aS2pressure-time load of p(t) beoemes,
and the kinetic energy KE can be deter-+ t walbp)mined from IWTA0 -11 t) ,
KE a (wýu'ev')dxdy .-b (5) where o is the specific density in
where a is the mass density per unit weight per unit volume and g is thevolume and h is the plt* thik ravitational constant. The integralSubstitung Equahetionse ( c3ness. Efivolving the shear yield stress sy isSubstituting Equations (3) into Equation zero when integrated over the entire(4), Equation (1) into Equation (5) and plate area.integrating both results gives express-ions for PE and KE in terms of the dis- Previous tests indicate that theplacements U0 , Vo, and wo and their time reflected pressure for a controlledderivatives. fuel air explosion closely approxi-
mates an exponential decay function ofThe blast pressure p(t) is assumed the following form.
to act as a uniformly distributed loadover the area of the plate and the &en-eralized force is determined from the PM a imx(1-t/a)~t/tvirtual work 6W of the pressure forcemoving through a virtual displacement when6w. In that the pressure force isassumed to act only in the z directionthe generalized force is associated with Piax " peak reflected over pressureonly the generalized coordinate wo and t a timeis found from the expression, T a duration of the positive
pressure phasefaaf*&Ib r w]( a a decay term.
Fwo�6wo . - o y (6) A schematic of a typical pressure-time
function used in this analynis is shown
The other generalized forces associated in Figure 4.with uo and vo are zero due to zeroforces in the direction of the virtual A failure criteria based on andisplacements 6uo and 6 vo. ultimate material elongation (strain)
tu for 4 uniaxial stress-strain diagr'mDefining the Lagrangian I as L • may be determined from Equations (1) and
KE - PE and the Lagrangian equation of (3). Using the assumed deflection equa-motion as tions (1) the strains are largest at the
101
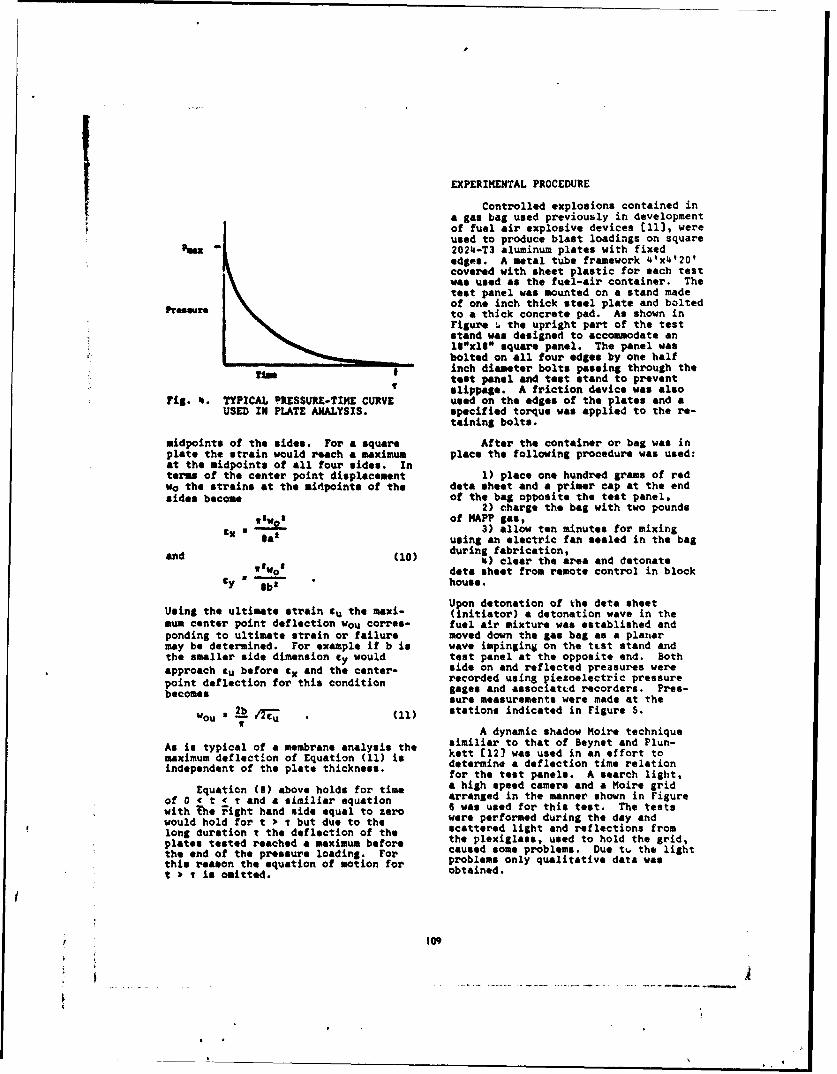
EXPERIMENTAL PROCEDURE
Controlled explosions contained ina gas bag used previously in developmentof fuel air explosive devices (11], wereused to produce blast loadings on square
~m~z 20214-T3 aluminum plates with fixededges. A metal tube framework 4'x4'20'covered with sheet plastic for each testwas used as the fuel-air container. Thetest panel was mounted on a stand made
of one inch thick steel plate and boltedme to a thick concrete pad. As shown in
Figure 4 the upright part of the teststand was designed to accommodate anl1x"S" square panel. The panel wasbolted on all four edges by one half
Tim I inch diameter bolts passing through thetest panel and test stand to preventslippage. A friction device was also
Fig. 4. TYPICAL PRESSURE-TIME CURVE used on the edges of the plates and aUSED IN PLATE ANALYSIS, specified torque was applied to the re-
taining bolts.
midpoints of the sides. For a square After the container or bag was inplate the strain would reach a maximum place the following procedure was used:at the midpoints of all four sides. Interms of the center point displacement 1) place one hundred grams of redwe the strains at the midpoints of the dota sheet and a primer cap at the endsides become of the bag opposite the test panel,
2) charge the bag with two poundswtw 0
1 of KAPP gas,ex a-- 3) allow ten minutes for mixing
S-as using an electric fan sealed in the bag
and (10) during fabrication,W 8) clear the area and detonate
1 w0o data sheet from remote control in blockCy a b' house.
Upon detonation of the data sheetUsing the ultimate strain cu the maxi- (initiator) a detonation wave in themum center point deflection wou corres- fuel air mixture was established andponding to ultimate strain or failure moved down the gas bag as a planarmay be determined. For example if b is wave impinging on the ttst stand andthe smaller side dimension ty would test panel at the opposite end. Bothapproach tu before ex and the center- side on and reflected preasures were
point deflection for this condition recorded using piezoelectric pressurebecomes gages and associattd recorders. Pres-
sure measurements were made at theWou , 2b (11) stations indicated in Figure S.
SA dynamic shadow Moire technique
As is typical of a membrane analysis the similiar to that of Beynet and Plun-maximum deflection of Equation (11) is kett [12] was used in an effort toindependent of the plate thickness. determine a deflection time relation
for the test panels. A search light,
Equation (8) above holds for time a high speed camera and a Moire gridof 0 < t 4 t and a similiar equation arranged in the manner shown in Figurewith The Fight hand side equal to zero 6 was used for this test. The testswould hold for t ) T but due to the were performed during the day andlong duration T the deflection of the scattered light and reflections fromplates tested reached a maximum before the plexiglass, used to hold the grid,the end of the pressure loading. For caused some problems. Due t% the lightthis reason the equation of motion for problems only qualitative data wast T is omitted. obtained.
109

DISCUSSION OF RESULTS
Metal frame .A typical experimental pressuretime curve for the reflected pressure
- of a controlled fuel air explosion isI shown in Figure 7. The average re-
Plas b~ flected peak overpressure for the de-tonation wave of all the gas bag ex-periments flush with the test stand was
20' 600 psi. This agrees very well withredicted values obtained by Nicholls13] and also reported in Reference 10.
The pressure-time curve of Figure 7 is"representative of the reflected pressurewhen the bag is positioned immediately
- adjacent to che test panel. The mc-ni-tudes of the peak overp•essure Pblx were
Pressure transducer 3 varied by moving the bag to specifiedI$ -distances away fron the panel. The
• I4
,'- - effect of this change on the decay term3 4a was quite nmall ad the decrease in
"30 the peak ovetpressurs resulted in a re-ductron of the maximum impulse an shownin Table I.
Test plate Solutions of Equation I were ob-o 0 tamned for lI"xlO" 202%-T3 squarealuminum panels of variable thickness
Test stand . , using the material properties obtainedfrom Reference 14. These propertiesare listed with tabulated results inTable 1. Experimentally determinedovalues Of PSaX' 1, 2 were used In thepressure time function of Equation 9.Due to the large amount of plastic de-formation a Poisson's ratio of 0.S wasused in the calculations. An analogsimulation program using a fourth order1Runge-Kutta technique (151 was used inO S/ the solution of Equation 9. Reasonable
of reemtnt between the analytical pro-d ctions and experimental results was
obtained cnd is shown in Figure S.
6 0 Plot. 07 4, The ultimate center point deflec-s"xle"fl tion wou corresponding to a strain of
u•/cu at the edge of the plate was calcu-Tes t s~ta;n: d -lated using Equation 10 and an ultimateAs, m strain of 0.12 to 0.17. The range ofSstrain produces a band of (Wo)msx,
Concrete pad showti also in Figure 6, above whichfailure is assumed to occur. The solidsymbols ef Figure I indicate plate fail-
Fig. 5. TEST EQUIPMLNT FOR CONTROLLED ure, however they are plotted at theFUEL AIR EXPLOSION. PRESSURE deflection point calculated using Equa-TRANSDUCERS 1. 2, 3, a MEASURE tgon 9.STATIC PRESSURE ON GROUND.PRESSURE TRANSDUCERS S, 6, 7 Plat& failure started as a crackMEASURE REFLECTED PRESSURE. at the edg, of one uf the sides of the
plate and p:,gressed around the edgesand curving around the corners of thepanel as shown in photograph of Figure9. Any crack formation was considereda failure in Table 1. The failed sur-faces at the initial crack .-'ening weretypical of a uniaxial tensiA% failureof flat sheet.
11O
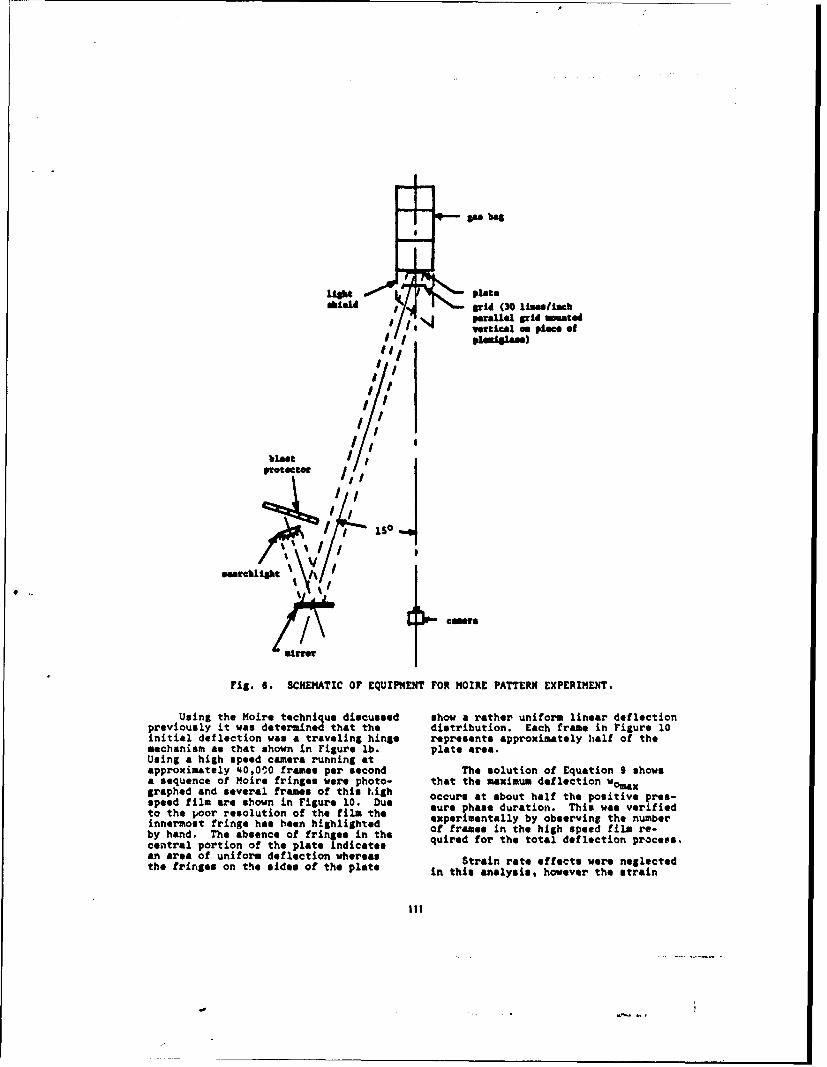
geea beg
light • plateinhigld grid (30 liasslich
#• , parallel grid amated%4 VI mil ase) piece of
eI,
blast hvl/ II,protector
Fitl. 6. SCHEMATIC OF EQUIPMENT FOR NOIRE PATTERqN EXPERIMENTI.
Using the Moir* technique discussed show a rather uniform linear deflectionpreviously it was determsined that the distribution. Each frame in Figure 10initial deflection was a traveling hinge represents approximately half of themechanism as that shown in Figure lb). platte area.Using a high speed camera running at
approximately 4,0.0O frame* per second The solution of Equation 9 shows
a sequence of Moir@ fringes were photo- that the maximum deflection wOmaxgraphed and several frames of this itih occurs at about half the positive pres-speed film Fre shown SH FiAuOe 10. Due our* phase duration. This was verifiedto the Uoor resolution of the film the experimentally by observina the numberinnereost frinte has deen hiahlighued of frames in the high speed film re-by hand. The absence of fringes in the quired for the total deflection process.cencral portion of tha s late indicates
asng are hfuighr sedo camerarnningas
a seq of Moire fring wherepo Strain rate effects were neglectedbhe fringes on the aid*@ of the pfrte an this analysis, however the strain
IlI
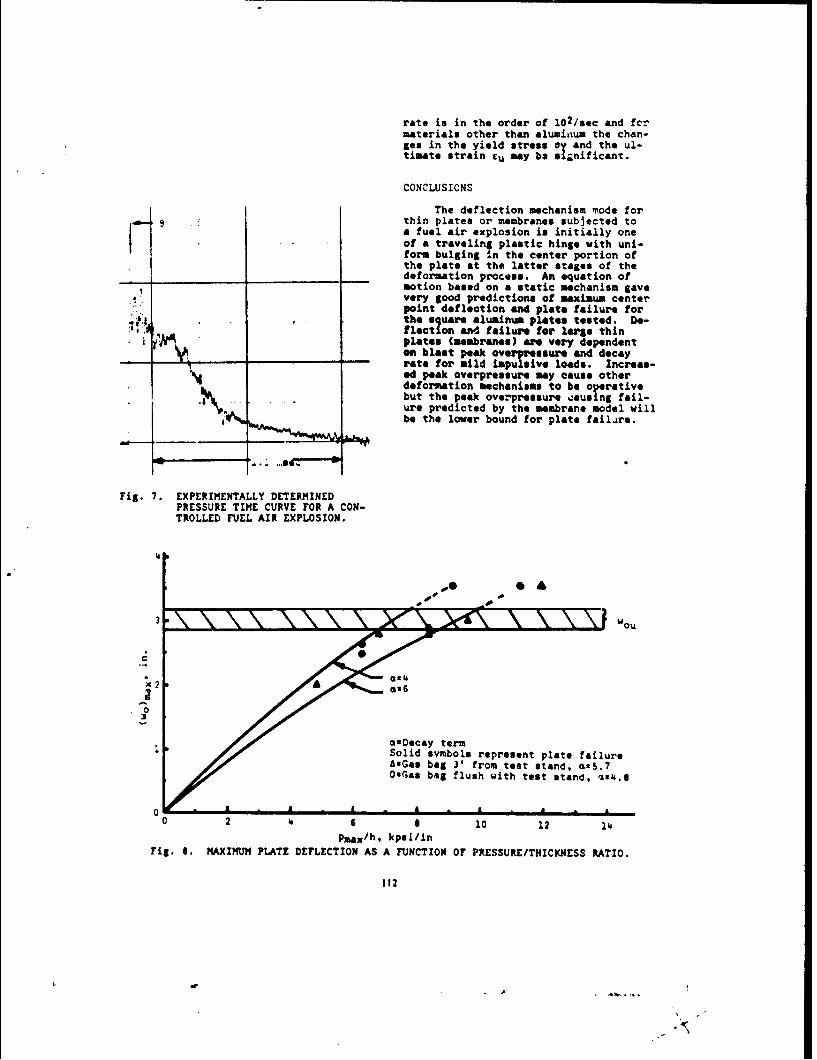
rate is in the order of 10 2 /sec and fcrmaterials other than aluminum the chan-ges in the yield stress ay and the ul-timate strain £u may ba significant.
CONCLUSIONS
The deflection mechanism v~ode for9 :thin plates or membranes subjected to
a fuel air explosion is initially oneof a traveling plastic hinge with uni-form bulging in the center portion ofthe plate at the latter stages of thedeformation process. An equation of
_motion based on a static mechanism gavevery good predictions of maximum centerpoint deflection and plate failure forthe square aluminum plates tested. Do-flection and failure for large thinplates (membranes) are very dependent-on blast peak overpressure and decay
_ - rate for mild impulsive loads. Increas-ed peak overpressure my cause otherdeformation mechanisms to be oirativtbut the peak overpressure aus ng fail-ure predicted by the membrane model willbe the lower bound for plate failare.
Fig. 7. EXPERIMENTALLY DETERMINEDPRESSURE TIME CURVE FOR A CON-TROLLED FUEL AIR EXPLOSION.
14
3D
3 Wou
0
A2a6aaz
*aDecay termSolid symbols represent plate failureasGas bag 3' from test stand, QtS.70 OuGa8 bag flush with test stand, 094.0
0 2 4 1 , 10 12 14
Pmax/h. kpsi/inFig. 6. MAXIMUM PLATE DEFLECTION AS A FUNCTION OF PRESSURE/THICKNESS RATIO.
112
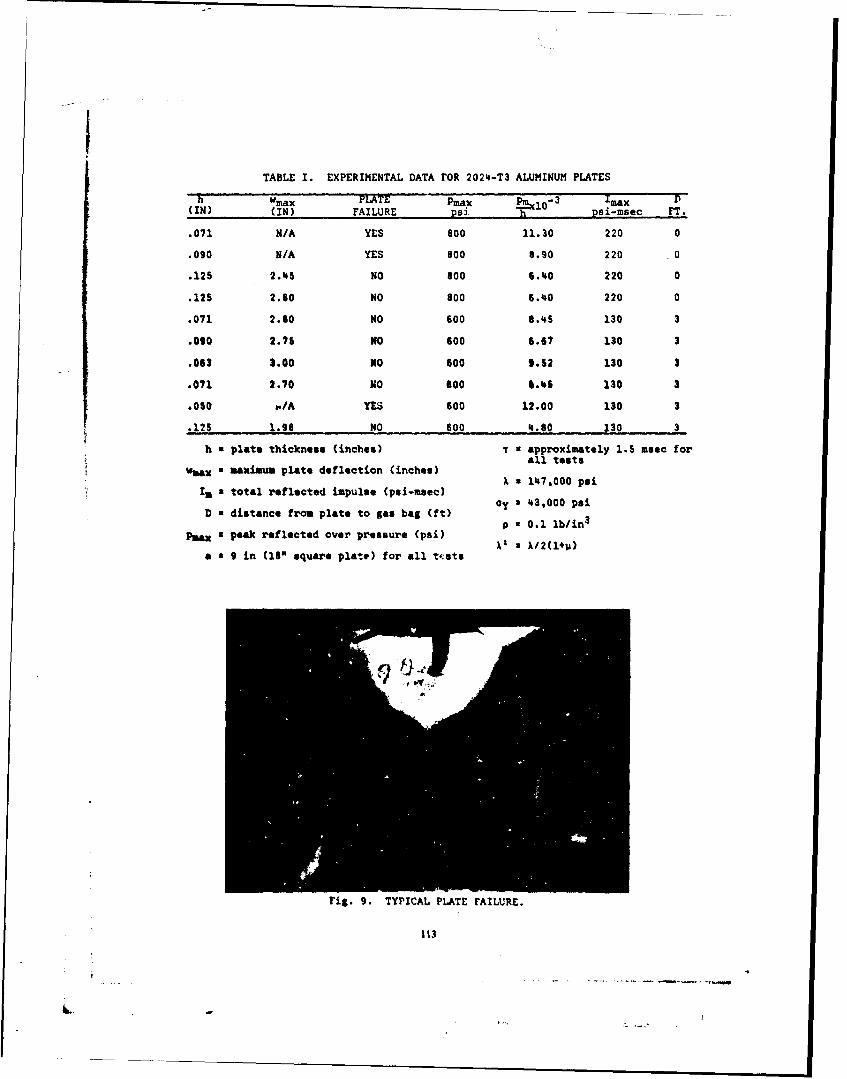
iTABLE I. EXPERIMENTAL DATA FOR 2024-T3 ALUMINUM PLATES
h Wmax PLAETE Pmax Pm.. 1 0 - 3 Imax D(IN) (IN) FAILURE psi. .. psi-msec FT.
.071 N/A YES 800 11.30 220 0
.090 N/A YES 800 8.90 220 0
.125 2.o5 NO 600 6.40 220 0
.12S 2.60 NO 800 6.40 220 0
.071 2.80 NO 600 8.45 130 3
.010 2.75 NO 600 6.67 130 3
.063 3.00 NO 600 9.52 130 3
.071 2.70 NO 600 g.46 130 3
.050 so/A YES 600 12.00 130 a
.125 1.96 NO 600 ,.80 130 3
h a plate thickness (inches) i a approximately 1.5 msec forall tests
wmax a maximum plate deflection (inches)A a 147,000 psi
Ia total reflected impulse (psi-meec)
D a distance from plate to gas bag (ft) y a 43,000 psi
p a 0.1 lb/in3
plax a peak reflected over pressure (psi)
a s 9 in (16" square plate) for all tcsts
Fig. 9. TYPICAL PLATE FAILURE.
"113
16- .,--

3
11
6
Fig. 10. DYNAMIC MOIRE FRINGE PATTERNS FOR DEFLECTING PLATE. EACH NUMBEREDFRAME REPRESENTS APPROXIMATELY HALF OF THE DEFORMED PLATE. NUMBER-ING SEQUENCE REPRESENTS INCREASING TIME. THE FIGURE IS INTENDEDZOR QUALITATIVE OBSERVATIONS ONLY, HOWEVER APPROXIMATE TIME BETWEENFRAMES IS 0.025 MILLISECONDS AND THE FRINGE CONSTANT IS APPROXIMATELY0.125 IN.
114

REFERENCES C14] MIL-HDBK-S, "Metallic Materialsand Elements for Flight Vehicle
El] Sewell, R. G. S., and Kinney, G. Structures."F., "Response of Structures toBlast: A-New Criterion," Naval (153 Hildebrand, F. B., Advanced Calcu-Weapons Center Report No. 4422, lu for Engineers, Prentice Hall,Juno 1966. Irnc, ew York , N. Y., 1953.
(2] Abrahamson, G. R , Florence, A. L., DISCUSSIONand Lindberg, H. E., "RadiationDamage Studies (RADS), Vol. XIII pr.essur (Tha System) Whet w ei the incidentDynamic Response of Beams Plates pressure tht oseloe8 with your Figure 7?and Shells to Pulse Loads," BSD- M loe:(University of Florida Grad. Zng. Ctr.TR-66-372 Vol. XIII. September gSlin Afn) Roughly about 300 psi.1966. In a shock wase in air the reflected pressure
E33 Cox, A. D., and Morland, L. W., should be around 2000 psi. right?Dynamic Plastic Deformation ofSimply Support Square Plates," J. I. Koun: Rish'Mach. Phys. Solids, 7, No. 4 22T-Z11 l i s,59.. yr. ase: so it's quite different.
"([i Hudson, G. E., "A Theory of the Hr. genus- am my pounds of yu'ploiv "oDynamic Plastic Deformation of a you -LostThin Diaphragm," J. Appl. Phys. . o: it's a fuel/air mixture and we only221 (1951). used about 20 grams of data sheet as initiator
() Criatascu, N., Dvn~mijc Plasticitu, and 1 think there is only 3 lbs. of map gas inNorth-Hollanr. Publishing Co.,Amsterdam, 1967, pp. 292-334. Mr. Roman: I was wondering whether in aect
your instrumentetion wasn't picking up the" T6 eay, F. P ., and Whitehouse, G.lD., peak pressure es opposed to not getting the"TePnulastic Deformatines SufeCted o appropriate reflection factor because I wouldRectangular Membranes Subjected o pses that you had a sufficiently well gas toImpulsive Type Loading," Proceed- air ratio such that you should get a reasonablyings of the IASS Symposium, Hawaii, close shock wave in air and should in faet get1971. that factor of 6.
(7] Huffington, N. J., Jr., "Blast Mr. Rooes: No, we've gone through this withResponse of Panels," BRL TN 1702, Nickels at University of Michigan. He seemAugust 1972. to be our expert end as finally ,-onyinced him
that we would not got thet high order pressure(83 Rinehart. J. S., and Pearson, J. refleced•.Behavior of Metals Under Impulsive
o Ove ubi. Co.% New York, Mr. Korman: Did you do any calculations with agams of 1.2 which is representative of explosive"(9] Menken, S. B., and Opat, n. J., gases to see what kind of reflected pressure
"Broken Beams," E tenal Mech- you would predict?anics, Vol . 13, N9T,1, N~ove7X ei roue1973 pp. 480S946. Mr. lose: Well. it you would go to Stan Uk•vich
in his translation you will find that he has an110] Strickland, W. S., and Ross, C. A., equation for the reflected pressure, end itUS Air Force Armament Lab. AFATL doesn't metter what the sem ratio is it isTR-74-181. about 2 4 even for condensed explosures.
(11] Collins, D. M., "Critical Energy Mr, Korwean: The reason why I as bringing it upThreshold for Detonation Initiation is because ia %rodes. height of burst reportin MAPP-Air Mixtures," AFATL-TR- he has done some calculetions for reflected72-192 (1972). pressure ratios, a function of specific heot
[12] Baynet, P., and Plunkett, R., ratios."Plate Impact and Plastic Deforma- Mr. Rose: For shock wave and air?tion by Projectiles," ExperimentalMechanics, Vol. II, No. 2, February1971, p. 64-70.
(13] Nicholls, J. A., University ofMichigan, private communication.
"115
LW
Mr. o301ms: Tee. for air or any ome. Forexample, he has a &m for 1.2 that would beappropriate to combusted gas. Ok, I me talkingabout a Chapmen-Jouget system in which we havea detonation mowing throuph an explosive. Wasthet wbole air btf filled with explosive games?
Mr. Rome: It's a mixture of San and sir. Thereis a fan in there circulating it around, andit's at the right volumstric-stotchiomotricvelnsa to give us an explosion. If you wereoff to the right o-. left either way of thatratio you oa't get one, you would Just get adeflatgrtiom.
Nz. Keoran: So you feel them that your instru-mentation was adequate enough to pick up thepeak pressure?
Nr. IRee: Teo sir. W've gaes through, onthis is the rea" we really bee this thin$to doeth, bet mobody w•ld bellve me. That'sthe preblem, " wem bh., really searehed it outand gsme to veriwo. imntrumentations an wmfimelly vied up some big gs mm believing us.So Niabs is in Michigan has given this emuer.
Mr. Gary ?oa: (larry Division) Can you tellfrom the experiment at what point in time theplate failed, wes it during the final paot ofthe esplosion or did it fall just whoe thestress weve started at the edge?
Mr. Ites: About half of the pressure timcurve had elapsed. It occurred at 3/4 of amillisecond sod we found that our pressuretim carve lasted about 1 1/2 millisecondsso about half emy through it failed and ourfilm shows this end our calculations indicatethis, nmaly, that the maximum deflection willoccur about half wey through the pressure timecureo. AMd also our file showed this.
Mr. For: So that's before it lots to thehemispherical shape?
Mr. Use: I am not abeslutely sure about thatnow. Let me say that if we calculate themuximum deflection of the center point, whichwe can do and look at it exporimentally itoccurs at about halt way through the pressuretinm curve and if it it going to fail itoccurs at about that time.
116
- - .. r4 - ~ 16

A IIATRIX STRUCTURAL DYNAMIC MODEL OF PARACHUTE
THERMAL COVER EJECTION BY PYROTECHNIC DEVICES
A. 2. Barniskia and l. A. RomanziGeneral Electric Co.
3t-entry and Environmental Systems Division3198 Chestnut Street
Philadelphia, Pa. 19101
This paper presents a method developed at General Electric (RESDDivision - Philadelphia, Pa.) for predicting separation velocitiesof a flexible thermal cover ejected by four cartridge type pyro-technic devices. The method developed consisted of a structuraldynamic model of the cover driven by four ejector pistons usinga three-dimensional table of piston pressure, displacement andtime as the forcing fr.ction.
The structure was modeled as an assembly of beam elements withstiffnesses and masss adjusted so that the mathematical modelcharacterized the dynamic response of the cover observed in vibra-tion tests. All first and second order physical parameters affectingperformance of the separation system were included in the model.
The dynamic model has demonstrated excellent accuracy simulatingsystem performance and predicting ejection velocities of several de-signs as corroborated by ground tests, and has been used effectivelyas a tool for guiding design optimizations.
1. INTRODUCTION
The energy transfer of a pyrotechnic ejec-tor device is strongly dependent on the displace-ment time history of the ejected mass. Atypical series of pressure time histories for,1,Mseveral rigid r asses ejected by a pyrotechnicejector is shown !n Figure 1. , , ,
The piston pressure for the heavier masses, ,which have corresponding lower accelerations,are higher throughout most of the ejection cycle. /It would therefore be extremely difficult to ob- 10,tain accurate predictions of the ejected veloc-ities fo: a wide range of inertia loads by usingan "average" pressure time history and inte-grating it to obtain a corresponding velocity•time history. The problem is further compUl- 3 4 W 1 .1 ..
cated when the ejected body is an elastic sys-tem, as idealized in the two-degree-of-freedom Figure 1. Pyrotechnic Ejector Forcesystem shown in Figure 2. Time History
117
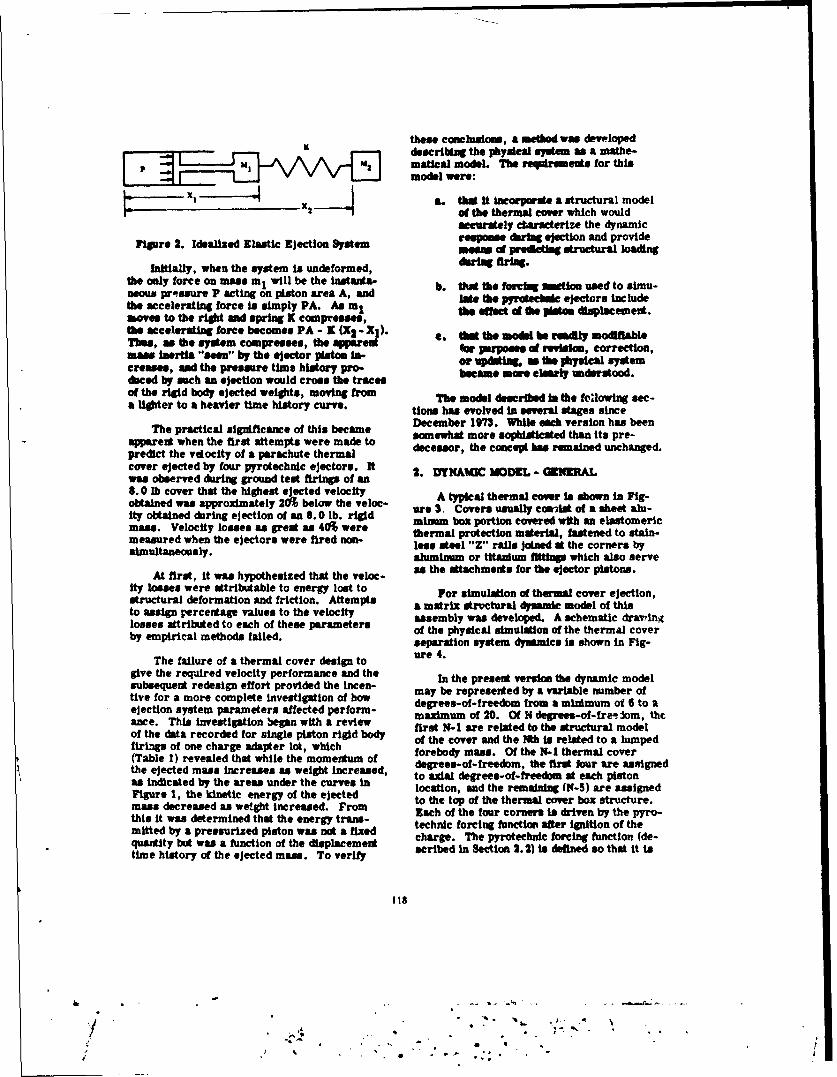
these conclusoin, a method wa developedSdescribing the physical system as a mathe-
P M 2lmomatical model The requirements for thisLIK=L AAVI model wawse:
X. x a. tt it Incorporsate a structural model- 2 x of the thermal cover which would
accurately ctaracterize the dynamic
Figure 2. Idealized Elastic Ejection Stem r"spM"e darig ejection and providemesas of precting structural loaing
Initially, when the system is undeformed, daring firin.
the only force on mass ml will be the nat - b. that the forcing tio used to smu-nmurn proasure P acting on piston area A, and We the pyratecgudo ejectors Inclmudthe accelerating force is simply PA. As m, the Of d, of te isto discement.moves to the right and spring K compresses,the accelerating force becomes PA - K (X2 - XI). e. " the moda be rwdky modifiableThue, as the system compresses, the apparent for purposes of revisiom, correction,mass Inertia "seen" by the ejector piston In- or u as do physical system
reases, and the pressure time history pro- becme moe ely ude ood.dsced by such an ejection would cross the tracesof the rigid body ejected weights, moving from The model described In the following see-a lighter to a heavier time history curve. tione has evolved in several stages since
The practical significance of this became December 1973. While each version has been
apperent when the first attempts were made to somewhat more sophisticated than its pre-
predict the velocity of a parachute thermal decessor, the concept has remained unchanged.
cover ejected by four pyrotechnic ejectors. It 2. DYNAMIC MODEL - G(ZNRALwas observed during ground test firings of an8.0 lb cover that the highest ejected velocity A typical thermal c Is shown in Ftg-obtained was approximately 20% below the veloc- are 3t Covers uually coerm of a wbeen anF-ity obtained daring ejection of an 8.0 lb. rigid ainum box portion covered wih an elastomericmass. Velocity losses as great as 40% were thermal protection material, fastened to stain-measured when the ejectors were fired non- less steel "Z" rails joined at the corners bysimultaneously, aluminum or titanium flttinp which also serve
At first, It was hypothesized that the veloc- as the attachments for the ejector pistons.
Ity losses were attributable to energy lost to For simulation of thermal cover ejection,structural deformation and friction. Attempts a matrix strvctural dynamic model of thisto assign percentage values to the velocity assembly was developed. A schematic drawvinglosses attributed to each of these parameters of the physical simulation of the thermal coverby empirical methods failed. separation system dynamics is shown in Fig-
The failure of a thermal cover design to ure 4.
give the required velocity performance and the In the present version the dynamic modelsubsequent redesign effort provided the Incen- may be represented by a variable number oftive for a more complete investigation of how degrees-of-freedom from a minimum of 6 to aejection system parameters affected perform- maximum of 20. Of N deprees-of-fre-eom, theawte. This investigation began with a review first N-I are related to the structural modelof the data recorded for single piston rigid body of the cover and the Ith Is related to a lumpedfiri-gs of one charge adapter lot, which forebody man. Of the N-1 thermal cover(Table 1) revealed that while the momentum of forebsdyfmassedOf the Ni thermar coverthe ejected mass increases as weight increased, degrees-of-freedom t t ea ssignato axial degrees-of-freedom at each pistonFigure 1, the kinaetic energy of the ejected location, and the remaining (N-5) are assignedFigu ereasthed knweticenergofteaejeted. Frto the top of the thermal cover box structure.mass decreased as weight increased. From Each of the four corners is driven by the pyro-this it was determined that the energy trans- technic forcing function after Initon of the Imitted by a pressurized piston was not a fixed c technic forcing function (te-quantity but was a function of the displacement charge. The pyrotechnic forcing function (de-time history of the ejected mass. To verify scribed In Section 2.2) is d so that it t
b.I
S• - .• - *. A

TABLE 1Piston Performance Test Data
Peak Calculated EjectedTetVelocity Irple Energy WNo.Press (./sec) (ftlbs) Weight TES" (psi) 01b-sec) (lbe)
1. 10,000 55.6 5.61 157.5 3.0 1. Plstoa performance tests conducted2. 10,200 55.6 5.61 157.5 3.0 9/18/70 to 9/25/703. 10,400 53.4 5.39 145.5 3.04. 10,400 54.8 5.53 153.0 3.0 2. Energy and impulse calculations
based on piston weight of 0.25 lb5. 10,400 53.4 5.39 145.5 3.06. 10,200 40.1 6.54 129.0 5.0 3. Weight listed in "Ejected Weight"7. 9,400 39.3 6.40 126.5 5.0 column does not include weight of8. 9,400 37.2 6.06 113.4 5.0 piston
9. 10,800 42.9 7.00 150.5 5.0 4. PistonsallmodifledtoinstallIn-10. 10,600 41.2 6.70 139.1 5.0 strumentation except where noted11. 11,200 40.8 6.67 136.8 5.0 ()wg. No. 470173285)12. 11,200 50.2 5.06 130.5 3.0
5. InstrumedtatIon for all pressure13. 10,000 78.6 4.24 166.6 1.5 reading& was a KISTLER 607L14. 10,000 78.6 4.24 166.6 1.5 Pressure Transducer15. 9,800 92.6 3.61 167.2 1.016. 9,600 90.6 3.53 160.0 1.0 6. SVA testing accomplished In accord-
ance with Charge Acdpter Specifica-17. 9,500 85.1 3.32 141.2 1.0 tion No. 1375-02-000118. 10,800 80.1 4.33 173.2 1.519. 11,500 27.0 8.58 115.9 10.0 7. Flring altitude in all tests 100,00020. 11,400 27.9 8.97 123.9 10.0 feet
21. 11,200 27.0 8.58 115.9 10.022. 10,000 90.6 3.53 160.0 1.023. 9,200 92.6 3.61 167.2 1.024. 9,800 86.8 3.38 147.0 1.0
SOX ORMYMVTRCONTOCRMASS POINTrS ATsm 1,ore'row Cl't? CTnNz co4-PISTON CORNERS XTOp
MANS -7 3FRA MEIPISTON
PISTNS 4) J J FOREDODY,/ • t
Figure 3. Alumlnum/ESM Parachute Figure 4. Schematic of Thermal CoverThermal Cover Dynamic kadel
119
/ .

a function of displacement at each corner and Equation A liHts the Inertial force on thethe time since firing of that corner. With this thermal cover and forebedy due to forcessimulation non-slmultaneous firing events are generated by the ejector platoon, structuralaccommodated by specifying individually the stiffness, and system dming effects. Thefiring times of each pist¢,n. thermal cover corners are modeled as being
rigidly cocpled to the forebody before ignition.Program input parameters are stiffness, At ignition, a corner is uncoupled from the
mass, and damping matrices, ejector firing forebody; after all four ejectors have fired, thetimes, and the ejector forcing function ex- forebody is completely urcaopled from thepressed as a table of piston force versus time thermal cover and Is acted on only by the sumand displacement. Logic related to each force of the pressure of all four ejectors. Equationcontrihutor is contained in a separate sub - 2 defines the piston stroke which Is the dis-routine to facilitate logic changes w..thout placement of the piston relative to the chargemajor reprogramming. The equations of adapter cylindrial housing. The piston strokenotiao, described in the following section, are dring firing is the dfhrewnee between theIntegrated mnmeric.Uy using a fourth-order corner displacement and forebody displacement,Ibuge-Kutta technique [1] through which the plus the deflection of the mount. Equation 3aeceleratsons of the N mass points art ante- defines the momentum equivalent velocity of thegrated to obain the velocities, which are ante- thermal cover mass poitas it time of the lastgrated to obtain the displacements. piaton clearing the eject'r.
2. 1 Equations of Motion 2. 2 Pyrotechnic Ejector Forcing Function
The equations of motion of the physical sys- The pyrotechnic forcing function Is rep-tern are: resented by a three-dimt3aional function of
piston force, displacement, and time. Table[MfIt] l -F (Xsttf) [XI - (c] 1*1i) 2 shows the three-dimensional forcing function
for a typical charge adpler.Xs = Xp - Xf + F (X tf)/Kf (2) The method used to derive a table of this
Vine a (i/mtow) [I1 [M] x (3) type was to obtrdn a soriof oascllograpbtraces of pressure time histories for firings of
1-, 2-, 3-, 5-and O-Ib rligd weghts and thenwhere, numerically integrate each curve twice to ob-
tain a displacement time history for that test.lXI = Vector of displacements The velocities and displacements from this
lil = Vector of velocities numerical integration were then checkedagainst teat results for each case, and the dis-
S= Vctor of accelerations placements for the vari weights paired withX = Piston displacement their corresponding pressures through the time
X p Forbod dislaceenthistories. For chosen increments of time,, a= P Forebody displacement "best fit" interpolating polynominal [1] Is used
X = Piston stroke to express pressure as a function of disilace-B ~merg£.tf - time since piston firing
IF (xs, t = piston force as function of stroke After the table was assembled some dataand time since firing smocthing was required, using et'gineering
judgement. In the roine, a table look-up and[M] = System mass matrix bilinear interpolation scheme is used to com-[K] = System stiffness matrix pate the pressures at times and displacements
rCi z System damping matrix falling in regions between rows and columns.
Kf - Charge adapter to forebody local 2.3 Thermal Cover Structural Modelstiffness.
The dynamic analysis for the thermal coverVme = momentbm equivalent velocity was performed using a finite element model ob-Mitoal -f total mass of thermal cover tained by the direct stiffness methol [21 to
120

TABLE 2Piston~ Force Versus Time and Deflection
0 ft .06 .0 .6 1 .16 W3 .20 .60 .60 .80 1.0 1.11 2.0 2.1 3.6 3.7 11.11 4.0
* 0 S 0 0 0 0 0 0 0 0 0 S 0 0 0 8 0 0.4 0 1.36 1.0 1. 1.54 1.02 1.74 1.70 1.60 1.10 1.35 1.20 1.00 6 1 .0 .SO .47 0 0.3 1 22 2.0 L? .$ 0 1: 2.61:11 1.73 1.60 1.511 1.40 1.30 1.15 .10 .6 . .111 .40 .06 0 0
2. 0 26:.7 . 1 1.1111 1.75 1.114 1.41 2.34 1.201) .0 .0 .0 6 4 4~~~2.0 S . 1.3 .6 23 1. 2.7 .55 .37 1 .22 96 .3 75 .0 .5 43 .A .6 0 02.0 0 2.30 1.57 1.6 1.02 1.77 2.67 1.511 1.39 1.10 . " .77 .6 50ý$ .60 .46 .37 .30 0 0LS 0 1.6 1.06 1.612.57 2.514 2.44 L.2 1.21 2.05 .84 .72 .62 .52 .41 .39 .36 .36 0s#o L 1220.2721.0 2.321 1111 t . 12242.2 .06..86.0. 56..46.0 7.3".30,N0L2.6 12.0 2.N1.0 S.06.0. .3".3N.6.74 .41.6 .412.54.A .0 .570 a4.0 02If .31125..0 . 6.68.8 ." 4.7 .06.0..62.30.n2.3In. .60 It0
*6.4 t102.6.0 .3.7.776 .1 .6 0 .14 .53 .51 .0." .0 .8 n3.10 ItL0.062.30.1.03.76.6 .1111.0. .46 .6. .41 .6 .84 .3N.3 .11 .2110 S1.0 & 2.3..a3.6.6 .47 .40.0.7 .3X.54.6.331*."3.60.11 .550 aL 0 01.16 .37"5. .3 W 4 .46.3.62.8.3 3 . .0 .3 .2 . .12 .10 0 022.69102.011.6.766.0 .60.9.7 .30.311 .27 .3.3.6a.26 .2* .2 .660 6
1111.11 .3 .n .6 .0 . 6" . 3 2 .36 .1 11 .38 .1111 . N .10 .26 .22 .6 .57 6 0111.1110.3.76.6 .6.6.32 .30.57.3.36 l. .14 .31.14.22 . .60 6
KEAM 11L1111011II OFesent the structure. The model consisted 3 OT
of a flnite number of rigid masses connected 2* - = Z=R s foviby masslen elastic nlns. The mass degrees- Lof-freedom wre shown as solid dots in Figure 5. -L-
2t 8 I '-I I 1 2V 5 I I.~ 2 5 ; zI
'I I I G L, I I I I La Ir3s I- I. I- I I _
MoelMasoit I I, I I NI Gil I
A~~~~ toa of 19 1ot wer Ise to decrb th 1t '.2 1 2 L ~ 6tbr~2a cover reutn in 11 stti 1 2 1 1MG 1
m~~~~~~ial ~ ~ ~ ~ ~ 12 bea stffes mar1soni iue6 3~, 1~Fi ur 6. Io SI fns LatriI
32122LA
f i I I IG

i The parameters used In defining the elements where the transformion Is
for this stiffness matrix were given by: 1/2 112
A Cross-section area55 W _ 0)a Mohdulus of elasticity i/L - i/L
0 bear Modualus ofeatct h asmtixi h udw ytmIJ Moment of inertia about Axis II2 Moment~ of inertia about Axis 2j(6
1 Moment of Inertia about Axis 3L iL eLmm athobeam
U Momedt Therefore since Kinstle Rm Is itnvriantKA Nfleetive Aer aml under coordinate trdwmadms, the mass
matrix In the 6 coordltoe em Is]hor boasdary oonditios, the model vmisthe X 6 Y direetkee it joist 1, 3,
4L ? be stifneg s matrix 1W as origioaa3tL I(~"M I dsF wM CorreSted wth static test
the eonms Imd, the stifhes of the basi cMA dtncma is da to both twting of the L
bottom joint, side bending of the rails. It wasfond that the side bending of the rails Is sig-afcaMnt and that the predicted "ahaea of thestiffness were within the range of values deter- Now for the 4 beams togu toe generalizedmined from static load testsat esch &o the mass matrix Is obtained.fnme corners. For the thin aluminum cover,the box structure Woes not siglflcantly stiffenthe rafls. The 114 DOT stiffness matrix wasthen reduced to 15 dynamnc DOrts correspond-Ing to the 15 lumped masses moving in the Z.( N 'ý) 0 Ldirection using the static stiffness reductiontechaiqurs, i.e*., reduced stiffness is
-1I -4
"" KI22 K21 i
In the "released' condition, each corner of j.the cover Is free to move in the Z direction.Due to the rigid characteristics of the rails, ageneralized mass matrix can be written whichtransforms the lumped mosses and inertias fromthe center of the rails to the four corners.
sThis coupled 4 x 4 geamallzed mas matrixFor a sinle rail with mas concentrated at was used for the model to represent the rail
its ceoter (as in sketch below) the transforma- mases at joint& 5, 6, 7 ad.tion equations from the center to the ends ofthe ral are The generalized eqflti of metio is tgiven
by
q M] +XI .[KI IXI-I F(t), (9)whe'e,
L[M] . m,,] mri
[K) u siffness mitriIxi - dispimmesst vector
i4I W" ] II (4) fI I .sceera-t-"mwtrIo(t) re Vector
122

This equation was then reodced to a 15 DOF where,problem by applying the matrix reduction trans-formation. The 15 DOF's remaining correspond [1to the masses located at firing points of the 4pistons and the masses t the center of theKpanel.
By subatttuting the coordinate transforms-The matrix reduction is a static •ruefof tion into the equatLon of motion and pre-
miso that reducem the size of the eigenvalue multiplying by [T11, the reduced equation ofproblem while retaining the inertial effects in motion will be given bythe mass mtrlx. For the static case, theforce-de.flection relationship can be expressed INl*j l * [K] JX jI J- " (t)J (16)in prtltioned form as
-"l ; ''lY." IN*) -' IT T I)" I- T]woe [a*] - MrT fig) IT)
I'1 force -vt)l , , - I vT IF[J1fK] a atifees matrix Not that the triple product [T]T [K] [T] will
result in a KO matrix that is identical to the K*IX - static deflecion derived from the static case. Motions for theSare X2 I coordinates can be obtained by applying
Nf F1 are the only external forces actg on the foordionte transform used to obtain the re-the structure, (i. o., F2 - Up, then the equa- daced equation of motion.tions In partitioned form may be written as
Because the equations of motion dEring11P -' [K1i 1 1 X I J+ [1 21 IX21 cover ejection were to be solved with numerical
,~ ri ,i r~ * (11) Integration, it was considered desirable to re-10J 1 [211 IXI Ij [1 K22 1 X-2 doce the number of DOF's to l1 in order to re-
duce the complexity of the integration program.and X2 may be expressed as 2.4 Charge Adapter Stiffness
1X2 I [=-2 [ ] -2 [ IX'] (xi i ~ r 'stiffness is included tosimulate the structural response of the mount-
By substituting the solution for X into the first lag in determining the effects on energy trans-equation, the famliar reduced stiffness matrix, fer produced by the pistons. This effect isK*, is obtained: accounted for in the equations of motion by
Equation (3) which defines the piston stroke andI- is included as a displacement term approxi-
K* a K1 1 - YK12 K2 K21 (13) mating the charge adapter deflection due tofiring forces. The stiffness value used for this
and the reduced equation for the static cue may simulation is 40,000 lb/in, for each adapter.be written as Measurements of local stiffness were obtained
from Impedance vibration tests. Results were1711 X , J (14) on the order of 1.0 to 1.5x l10 lb/in, for a
10-lb maximum inPut from the shaker. Due toUsing the expression for X2 in terms of XI, one this low input force, compared to the highcan detihe e coordinate traneformstion given by levels obtained during thermal cover ejection
(atbot 2000 lbe) the 40, 000 lb/in. value was
used pending static tests at higher load levels.
[ - . T) x, (15)
123
2* 5Movng týýand mode sapes" oblaineid from an elgoealue-eigenvector solution closely agreed with meas-
The mowing forebody was included to ured dynamic behavior of the thermal cover.simulate the loss of energy and piston stroke It was this refined atruchural -mndel which wasdue to forebody motion and to determine its used In the velocity preft~m model.effects on the total TC velocity produced by the
pso.The forebody wsmdlda 6l .TEMLCVRZZTD
2.6 Daping Mfects performance preidictons obtained with the useDempng nclues ll frce whih ae a of the dynamic model. Contained herein Is aDampng nclues ll frce whih ae a comparison of predicted election velocities
function of mass point velocities. Included are with ejection test daa for several thermalthermal cower structural damping, and a drag covers, an empirical dmstdWia of the dragcoefficient Simulating all frictiowa losses. coefficient cited Is snowe 2.2, and as Waeit-The drag coeffcient sImlates" fricticesi losses fleatil" of velocity losses thotid tbhringlby applying a retading force to the eorner thermal come electWsaossne poins Aboovtoal to velocity. a wasderive empirically from previous tesg re- A tomp~barl of *WNWe Modal predic-sulls. The elements of the strucetural damping tions and ejection test velocitie, for thrematrix are proportional to the stiffness matrix different thermal cmer models, Is shon tnand are compulted as the structural damping Table 3. The drag coeniftie used in thecoefficient multiplied by the ratio of the corree- dynamic model for allibresewoers was 0. 27pooding cower stiffness matrix element to the bf-sec/ln. The, good agrement with test re-stiffness of the center relative to the corners. suits indicates that this method of r~presentinigStructural damping was assumed In phase, with the unidentified frictional Wasse was suffi-"vlocity. cloeily accurate. Discussion of the derivation
of this value follows inaswutm 4.2.3. VIUKATION TIFF
The objective od the vibration tests was to 41Zprcl~taboIn~ecetobtain dynamic characteristics of the thermal As stated in Sectios 2.1, the drag coeffl-c werued in refinement of the stiffness and cieui was attributd to sn-accomustle effectsmass matrices Incorporated in the ejection such as parachute, baftle, sad piston friction,model. From test result& it was observed that and, for ground test firings, the pressurethe box portion was highly flexible and non- differential &*rody, le drag. Parametriclinear. Tests performed at three vibration studies were Performed to determine the effectlevels showed that the cower became stiffer at of this drag coefficient on predicted velocity.high force levels as Indicated by an increase in From the results, values of 0. 27 and 0. 165resonant frequency. When the TIC was driven lbf-moc /in. were choosen ase the values to pre-at the first modal frequency, largo lateral die- dict ground test and flight ejection velaeitles,placements were measured with 60 to 80% of respectively.the mass effective. In addition, the deflectionof the top caused large lateral motions of the 4. 2 Thermal Cover Velocity Loss Identificationunsupported sides.
To guide the redesign of heavier thermalIn the second mode, the motion of the top cowers it was envisioned that knowing the
of the cover indicated that the center mowed various lose coefficients, modifications to theout of phase with the sides, i.e., there was a redesign could be made. The produzctionmodal circle between the center and the other thermal cower ejected was chosen as the base-accelerometer location on thie cower top. In line design for analysis of the contribution ofthe frequency range between 5 and 200 Hz, the various physical parameters to the energyframe showed no significant dynamic motion in balance.the vertial direction.
The velocity losse associated with each ofUsing the vibration test data described the physical parameters simulated in the dy-
above, the stiffness and mass matrices of the namic model are shon In Table 4. Rt was oh-ll4.degre,-of-fr#edom structural model were served that a total velocity lwos is ground testadjusted until the predicted frequencies and of 15. 2 Wt/e" is obtained when all physical
124

TABLE 3Comparison of Predieted Cover Nominal Velocity With Test Values
Cover Corrected PredictedJettison Weight Test Value Velocity
(lb) Velocity (it/sec)(__ _ _ _(ft/sec)
12.3 Weighted 38.5 40.7Production 39.3 39.3 AverageModel 40.2
11.8 Production 42.3 42.3Model
11.3 Siffened 46.53 44.1ProdoctionModel
TABLE 4TIC Velocity Loss Identiicatiorn
sVelocity Lose Predicted Eject Vel
Physical ParamWters t(p Individual Effects_ _ _ _ _ _ _(fpe)
Single Piston - Rigid Body 0 57.5
T/C Sriff and Structural Damping 5.3 49.7
Forebody Mass 2.0 40.4
Charge Adaptor to Forebody Local .3 44.7Owtiness
Piston Loss DampIng Attributed to 7.0 49.8Parachute and Piston Friction
Dynamic Model Which Includes All 15.2 42.3Above Effects
effects are included. The velocity losses Iden- 5. CONCLUSIONSin Table 4 were calculated by deleting thephysical parameters one at a time from the Presented in this section are conclusionsdynamic model and noting the velocity gained, arrived at regarding the particular ejectionFor example, the effect of the moving forebody system that has been cited as an example,was determined by running a trial cast with in- modeling techniques applied to pyrotechnicfinite forebody weight; cover flexibility lons ejection simulations, and some general con-was determined by running a case including all clusions regarding pyrotechnic ejection ofeffectn, but ejecting a rigid lumped mass equal elastic systems.to the mass of the cover. The remaining ve-locity lose required to bring the predicted ve- 5. 1 Basic Aluminum/E8M Thermal Coverlocity down to test velocity after all other effects Designwere accounted for, was assigned to frictionalor drag effects, as discussed previously. The production thermal cover that vu the
object of this Investigation was desnidw to
125
- -

withstand a high load re-entry environment. be designed that was "tuned" to optimize theUsinb; the ejection dynamic model as a design pressure time history prodaced by a giventool, ejections of many proposed designs were pyrotechnic device, it is believed that for de-simulated. From these simulations It was con- sign purposes the rigidilsag approach Is mostcluded that the design separation velocity could practical.not be achieved using the original pyrotechniccharges. As a result, a new higher energy 6. FURTHER INVESTIGATIONpyrotechnic device was developed. For thischarge, the dynamic model made accurate pre- While the method of describing the pyro-test predictions of separation ye' )cities without technic forcing function developed fcr this in-applying additions! empirical ad. istments, I.*e., vestigation has proin estirely Adequate forusing the previously defined sys em parameters analyzing the present system, #t would bewith a new three-dimensional p, otechnic worthwhile to investigate other methods notforcing function, Immediately yielded prede- subject to the restrictions cited In Section 4. 2.tions that agreed with ground test results. For example, it would be worthwhile to attempt
modeling the physical pro ess of pyrotechnic1.2 CIasiOeS Remditm the MIethod of peopellat burning ad prew a generation.
Modena Pyrotechnic Ejector This investigaion cmld aM tslnlficadly to theknowledge of pyrotechllc/structuru systems
owes tho methods Ueed to express and In particular, and response of structures totiepate the equatoas of motion of the struc- highly noe- linear forcing ractions Ia general.tue re relatively conventional and have beenapplied previously to problems of structuraldynrmics, it Is the opinion of the authors that REFERENCESthe most unique and vahlable aspect of this in-vestigation, beyond the immediate benefit of 1. Carnahan, B., Lather, H., and Wilkes, J.,providing a useful design tool for the particular Applied Numerical Methods P. 363,problem, was the derivation and validation of P. 573, John iW1iey d WoM, Inc., 1969.
:' a method for representing the highly non- linearpyrotechnic forcing function. The method de- 2. Rublnstein, U., Matrix Compuer Analysisscrtbed in Section 2.2 appears to be valid when of Structures, P. 178, Prentice-Mallthe displacement of the ejector piston is a Inc., Imonotonically increasing function of time, andthe displacement time histories to be modeledfail within the range of the test eisplacementtime histories from which the forcing functiontable is derived. It is anticipated that thistechnique can be of great benefit in modelingpyrotechnic actuation devices as well a* eJec-tion devices.
it Is also concluded that the excellentaccuracy achieved in velocity predictions wasdoe to a large extent to the accurate charac-terization of the dynamics of the structureachieved by refining the mathematical modelusing vibration test results.
5.3 Effect of Structural Elasticity
In general, it was concluded that for agiven welght, the more closely a structure&pproaches a rigid body, the higher the ejectedvelocity. The reason for this Is that this con-dition will mvimize the average pressure overthe time of piston stroke, thus maximizing sys-tem momentum. This approach of rigidizingthe structure also minimizes structu al defor-mation and thus non- recoverable energy losses.While it Is conceivable that a structure could
126
b.J . - .-
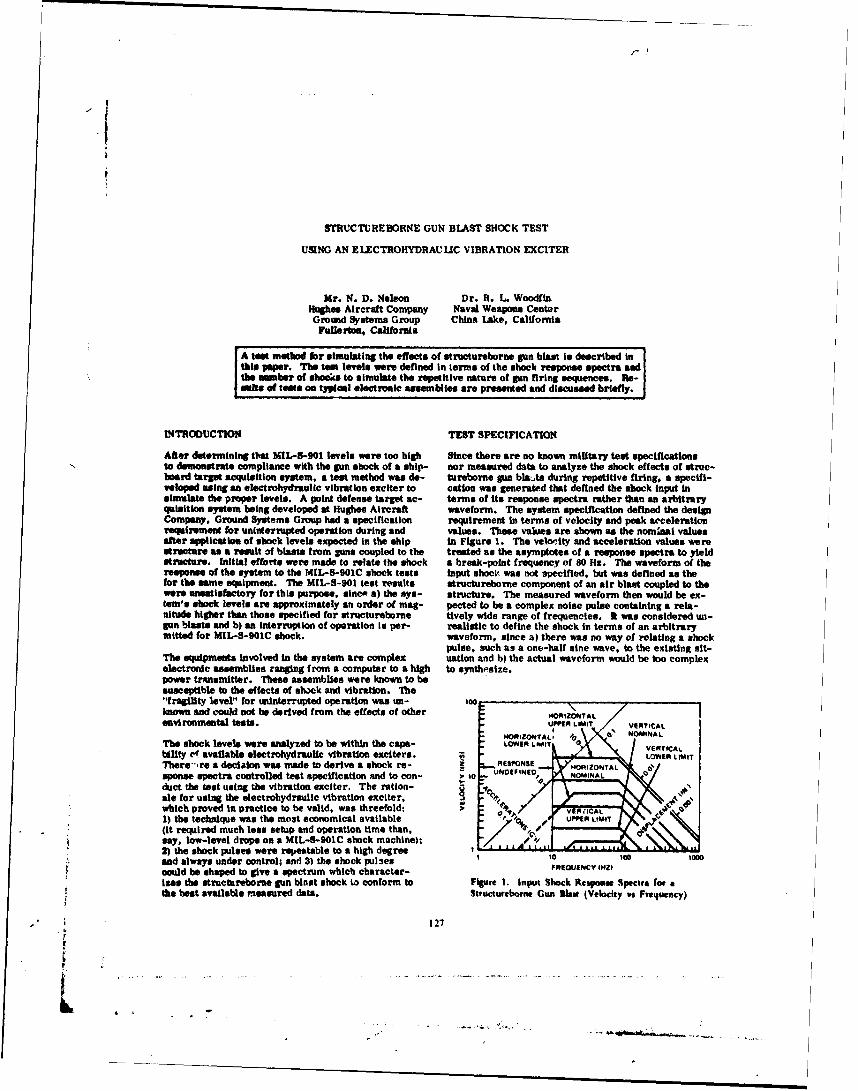
STRUCTUREBORNE GUN BILAST SHOCK TEST
USING AN ELECTBOHYDRAUUC VIBRATION EXCITER
Mr. N. D. Nelson Dr. R. L. WoodfiliHughes Aircraft Company Naval Weapons CenterGround Systems Group China Lake, California
WWII=.ee Califrnia
A AtogS method for simulating the effects of structureborne gun blast is described Intipae.The test levels were defined In terms of the shock response spectra and
the suanbar of shock#s to simulate the repetitive nature of gun firing sequences. Ite-suas of toest on typical electronic assemblies are presented and discussed briefly.
INTRODUCTION TEST SPECIFICATION
After determining that MIL-S-901 levels were too high Since there are no known military test specificationsto demonstrate compliance with the gun shock of a ship- nor measured data to analyze the shock effects of strue-board target acquisition system, a test method was de- tureborne pan bla.,ts during repetitive firing, a specifi-"vloped using an electrolaydraulle vibration exciter to cation was generated that defined the shock Input Insimulate the proper levels. A point defense target ac- terms of its reaponse spectra rather than an arbitraryqulsition system being developed at Hughes Aircraft waveform. The system specification defined the designCompany, Ground Systems Group had a specification requirement In terms of velocity and peak accelerationrequiremenit for uninterrupted operation during and values. These values are shown as the nominal valuesafter application of shock levels expected in the ship In Figure 1. The velo-ity and acceleration values werestructure as a result of bleasts from guns coupled to the treated as the asymptotes of a response spectra to yieldstructure. Initial efforts were mae& to relate the shock a break-point frequency of 80 Hz. The waveform of theresponse of the system to the MIL-9-901C shock tests Input shoc'; was not specified, but was defined as thefor the mnme eqiapment. The MIL4S-901 test results structureborne component of an air blast coupled to thewere unsatisfactory for this purpose, sin"~ a) the sys- structure. The measured waveform then would be ex-tem's shock levels are approximately an order of mag- pected to be a complex noise pulse containing a rela-nitude higher than those specified for structureborne tively wide range of frequencies. I was considered un-gun blasts and b) an interruption of operation is per- realistic to define the shock in terms of an arbitrarymitted for MIL-3-901C shock, waveform, since a) there was no way of relating a shock
pulse, such as a one-half sine wave, to the existing sit-The equipments Involved In the system are complex uation and b) the actual waveform would be too complexelectronic assemblies ranging f rom a computer to a high to synthesize.power traunsmitter. These assemblies were known to besusceptible to the effects of sho~ck and vibration. The"Ifragility level" for untinterrupted operation was un- 100known anid could not be derived from the effects of other HSZMAenvironmental tests. UPPER LIMIT V114TICAL
The shock levels were analyzed to be within the capa- LOWEIMINT qQVERTICAL.bility &' available electrohydraulic vibration exciters. ,,LOWE14 LIMITThere- t r a deciaion was madle to derive a shock re- R ESPONSE HORZON AL osponse spectra controlled test specification and to con- to U N WFN NOMINAL 0duct the test using the vibration exciter. The ration-ale for using the electrohydraulic vibration exciter, ~ %which proved In practice to be valid, was threefold: > et1) the technique was the m0st economical available A IM(it reqiuired much loes setup and operation time than, % J. MLIIsay, low-level drops on a MIL4-90O1C shock machine);2) the shock pulses were repeatable to a high degree 1Z
I to 101 0oand always under control; and 3) the shock pulses F REQENY INVIcould be shaped to give a spectrum which character-ises the structureborne gun blest shock to conform to Figure 1. Input Shock Response Spectra for atihe best available measured data. Structuteborne Gun Alast (Velocity vs Frequency)
127
I.
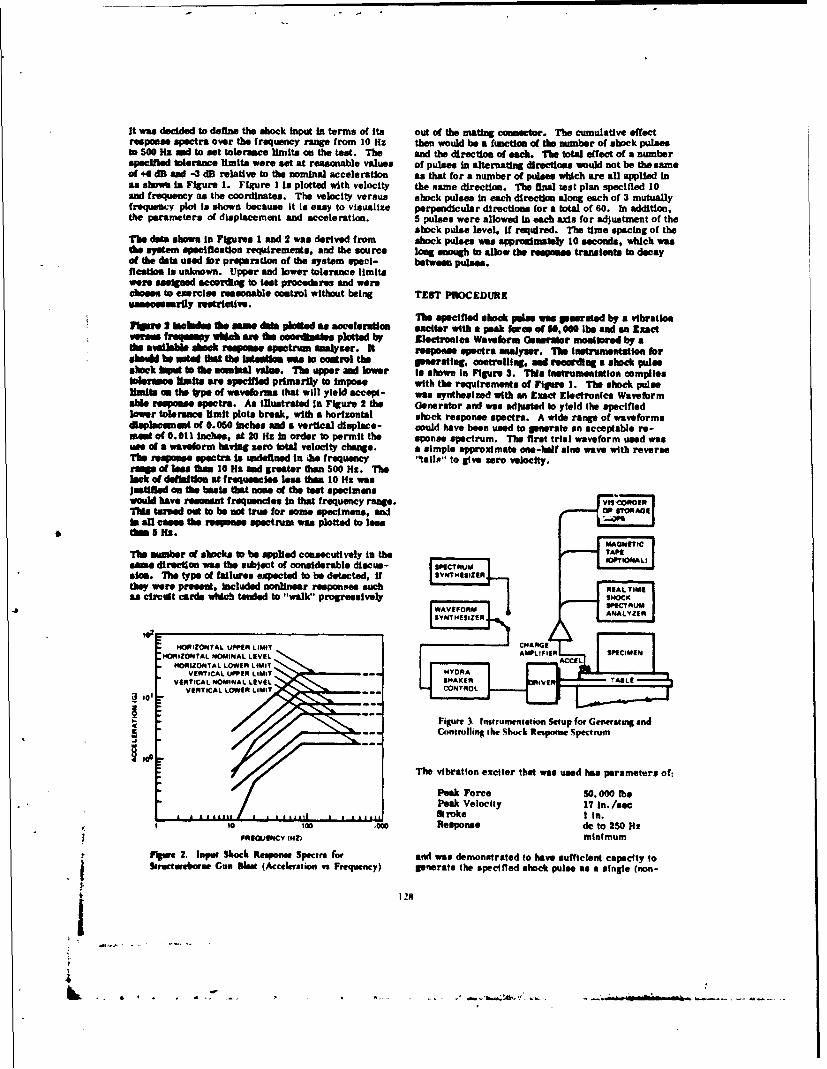
It was decided to define the shock Input In terms of its out of the mating connector. The cumulative effectresponse spectra over the frequency range from 10 Hz then would be a function of the number of shock pulsesto 500 Hz and to met tolerance limits on the test. The and the direction of each. The Itel effect of a numberspecified tolerance limits were aet at reasonable values of pulses in alternatingf directions would not be the sameof +46dB san -3 dB relative to the nominal acceleration as that for a number of pulses which are all appied Inas shown in Figure 1. Figure 11Is plotted with velocity the same direction. The final test plan specified 10and frequency as the coordinates. The velocity versus shock pulses In each direction along each of 3 muttualyfrequency plot is shown because it Is easy to visualize perpendicular directions for a total of 60. In addition,the parameters of displacement and acceleration. 5 pulses were allowed In each axis for adjustment of the
stock pulse level. if required. The time spacing of theThe data shown in Figures 1 and 2 was derived from shock pualses was sprorimately 10 seconds, which wasthe system specification requirements, and the source long enough to allow the response transiefts to decayof the data used lor preparation of the system sped- between pulses.ficatloo is unknown. Upper and lower tolerance limitswere assigned according to test pmcwhares anid wereshone to exercise reasonable control without being TENT PROCEDURE
unesearily restrictive.Tint specified shock pulse wase pserstted by a wihratiom
Vigm 2 Ilebdee the smie daft p~e as acceleration exciter with s peak forms of 50, W0 [be and -n Exactversumh@sm reempywebc an doe coordinates plotted by Sliectrouies Waveloram Gemrsior monitored by a*Ae avaialft simick response spectrum analyzer. it response spectra saalyser. The fat ettoa rsboul be nowedwte the latemillow "a to control the generating. controllIng. aid recordllng a shock pulseshock but to the movalal value. The upper and lower Is shown In Figure 3. This instrumentation compliestolersme limits are specified primarily to Impose with the requirements of rigure 1. The shock pulseUnmits on the "yp of waveforms that will yield acet was synthesized with an Exac Electronics Wavefbrmable respomse spectra. As illustrated in Figure 2 the Generator and was adjusted to yield the specifiedlower tolerance limit plots break, with a horizontal shock. response spectra. A wide range of waveformsdisplmcemsnt of 0. 050 Inches sand a vertical displace- could have been used to geneorate an acceptable re-mama of 0. 011 inche". at 20 Hz In order to permit the sponse spectrum. The first trial waveform used waswse of a waveflorm having zero total velocity change. a simple approximate one-half sine wave with reverselbe response spectra is uadefined In ihs frequency '1tail.p to give zero velocity.r~em of les" than 10 Hiaend greater than 500 Ha. Thelack of defhitio at frequencies less than 10 Hzs wasJ@MMWe on the basis that none of the test specimenswould have resonant frequencies In that frequency range. icosThis turne out to be not true for some specimens, and 0 T~Ois all cases the responw spectrum was plotted to less
The saer of stocks to be applied consecutively in theOPI#Lama direction was the subjiect of considerable, disc us- SPICrs',msic. The type of faihwues expected to be detected, If 5VWTHESIZERthey were present, Included nonlinear responses such RATMas circuit cards which tended to "walk" progressivelySHC
HORIZONTAL UPPit LIMIT HHORIZONETAL NOMINAtILVL LEVEL ACL PI1100
HORIZONTAL LOWE LIITVERTICAL UPPER LIMIT --- HYDRA
VERTICAL NOMINAL LEVEL SAE V ALVERTICAL LOW*" LIMIT--COTL
L I M TF ig u re 3 . wm r inw e cto n S e tu p fo r G e n e ra tin g a n d
-- ~controlling the Shock Reiporme Spectrum
The vibration exciter that was used has parameters of.
Peak Force 50. 000 [bsPeak Velocity 17 In. /sewtroke I In.
so 1Wto c Response dc to 250 Hz01011JENCY IHrI minimum
Figae 2. 1"pM Shock Retiponse Spectra foe and was demonstrated to have sufficient capacity tohtructureborne, Gun Dims (Acceleration vs Frequency) generate the specified shock pulse as a single (non-
128
hI

repetitive) pulse. Figure 4 is a photograph of the test 1o2setup for an electronic cabinet In the horizontal axis.
A typical shock response spe!c -- t- ;1t is shown InFigure 5. The waveform and response spectrum varies 9somewhat with the dynamic characteristics of the sam- ozpi, and fixture. There was no attempt to optimize the , totresponse spectrum for each test speciwen. Figure 6 rshows the response spectrum and waveform for a honlzontal y-axis shock pulse on a top-supported electrodecabinet. The peak accelerstio was controlled to the -'
nominal value, and it w aus not necessary to adjust the dP;:
waveorm for the samples tested. aus e
""OFROM SEICY 1pZ)
i: Wavef for a Typical Tet in the Horizontal (Y) Axis__ (c% 0.1)
"TEST RESULTS
The results of the shock tests revealed much moreresponse than was expected; the primary i-dication ofanomaly was system interrupts in a number of differentunits. These shock tests were conducted to detect con-ditions which could cause problems in the system duringsea trials. Some of the results are described brieflyIn the following paragraphs.
Figure 7 shows the shock response spectra at the inputFigrpe 4. Setup for a S•uctweboee Gun Shock Tea and output of the shock isolators of a cabinet. The
transmissibility of the isolator was plotted and the plotshowed that the isolators were tuned to 18 Hz instead of10 Hz as expected. The isolators then transmitted anappreciably higher shock level than the design condition.The isolator design was subsequently modified to pro-vide the designed isolation frequency of 10 Hz.
101 An electronic cabinet was found to have a panel circuitbreaker which tripped under the shock input. Examina-tion and accelerometer data indicated that the panel wasresonant at a relatively low frequency which approxi-mately matched the peak of the input shock spectrum.
,Z The panel was stiffened and the circuit breaker no long-10 . er tripped at the specified shock level. The same unit
C had an 'ntermittent connection in a circuit carJ. Sub-stitution of another card removed the Intermittent con-
8dition and the unit was capable of operating through theshock pulse.
1o-1 .A digital card rack having a high density machine-wiredX "back plane was shown to have conductive debris trapped
in Cie wire bundles. The shock pulses caused migrationof the particles and several short circuits within the
"TIME (SNsEc/CMI wiring. The unit had previously been vibrated until the6LLLAU_ release of particles had dropped to essentially zero.
10 1oo a0 1000 The vibration level was approximately I gravity to aPnEOUE9CV INiz maximum frequency of 33 Hz. The shock input was 10
Figure S. Input Shock Response Spectrum and Input to 25 times higher than the vibration acceleration andWaveform for a Typical Test in the Vertical (Z) Axis excited the entire frequency spectrum. The test unit
operated through 10 consecutive shocks In each direc-(CSCo 0.1) tion in each of 3 axes after approximately 120 shocks.
129

No phaysical damage was expeced, and none was ob- CONCLUSIONserved during the tests, since all of the units testedweoe designed for MIL-S-901C shock which has shock The teat method described herein is usefu for detecttngInpts 10 to 50 times higher than those specified for nuisance malfunctions in herd-mounted complex elec-atructurebomn goon ahock. tronic assemblies which are required to operate without
Interruption and are subjected to structureborne shock.at levels characteristic of gun firing. The shock levelsare at levels of approximately 1/20 of the level ofMIL-S-901C and consequently give a measure of circuitfragility at levels roughly equivalent to the response to
9~XwECcIED POT vibration. Vibration per MIL-STD-167 extends throughACCEECATON ~ the fequnucy range of 4to 33 Hz and does not yield
4 dost relat Ive to the realof: , i the 33- to 500-Hz regiona of the spectrum, which Is strongly excited by structure-
8PONU AC=LISATIO fall 15 born. gun shock of the type specified.
This teat meathod was included with the vibration bwa
nam wa spectrum controlled. it th equipment is
dsmp~ -ais (Cc.) 1010available, the lest is relatvely ftexesmive and cam be
peawjCNCV P41 am (1) Iloo sod Vibration Heaadbck, McGraw-HtiBook Co..* edited by C. hi. Harris and
PFawe 7. Shock Truaamissilky. Tisposso C.E. Credo, Vol 1 (1IN1)owe - f iolaor*andth do v mnsissbily a () Instruction Bock, Model 320, Sock Response Spec-ampin -sdo(C/C) of .10.trwu Analyzer; S1pecitral Dynamics Corp.
DSICUISSIONMr~. Forkois: (1101) You can do the am thing Mr. Forkois: I have used the wedjirn weightas the sodium weight shock machine by reducing shock machine with inclined bulk head whichthe height of the banner drop! allowed we to got shock comonents in three
directiona simultaneously down to levels asMr. reley: (Hugheios Aircraft Co.) I think the low as 3 1/2 gl's and 5Soli frequency by thereason we chose this was because we could hit aimp~e expedient of using isolating mountst60 to 120 shock isquloes and hae" tham fall right between the structures and the table itaself.on the line, I don't think I could do that with It's a very versatile machine and you can dothe mediumn weight shock machine, we have tried that. The only difficulty that I think canto do it with the sodium weight shock machine happen here is that you my not be able tobut we were not successful. Right now we are drop the hawsr repeatedly in 20 seconda itusing a soft deck, I don't know if you are might take you 30 seconds to drop it and insteadfamiliar vith that or not, and we are trying of dropping it 2 1/2 feat you my drop itto get some repeatability but at that time we 6 inches and get the em effect with all thecouldn't get it on sodium weight shock machine. frequency comonents that exist in the stand-
ard mounting for the standard test if this isMr. Donohue: (Navel Weapon Center) And also as what you are looking for.a matter of cost this teat has worked right inwith the Nil Std 167.
Mr. Foley: Yes, that's right. it wes on the"maw sochine we could complete our vibrationset up and do the shock. There was noadditional fixture required.
Mr. Forkois: My only concern is this is a lowlevel shock input end by no stretch of theinaginatiom should this be considered asubstitute for the KU-SL~TD "OIC test.
Mr. Donohue: so, It Isn't.
130

*MANIC PROPEXTIES OF CONCRETE UNDER IMPACT LOADING
G. I. Griner, R. L. Sierakoaski, and C. A. RossDepartment of Engineering Sciences, University of Florida
Gaineeville, Florida
Euperimental studies were conducted to determine thedynamic impact behavior of concrete bar specimens at stresslevels near or below the tensile failure strength of thematerial. Strain pulse propagation characteristics were mon-itored with pulse shape change, pulse propagation speed, andamplitude attenuation catalogued for bars of varying diameterand particle aggregate. Dynamic impacts were introduced intolong bar specimens by the use of an air gun with impactvelocities in the range of 100 to 800 in/see. Three steelimpactors (ball, I" cylinder with hemispherical nose, 2"cylinder with hemispherical nose) were used to obtain varyingpulse lengths. The effects on pulse shape and length wererecorded for bars with a protective steel cap 0.25" thick andthe results compared with the data for uncapped bars. Inaddition, dynamic threshold impact velocity measurements weremade to determine initial fractures for each type at impactor.
INT30DUC-1ON
As a structural material, concrete is often concrete is inherently weak in tension, wave pro-used as a protective and/or containment mediua pagation through this latter region can pro-for impact and blast loadings. For such app- duce microcracks, scabbing, or corner fractureslications, an assessment of material degra- when the dynamic tensile strength of the con-dation and damage are important failure cri- crete is exceeded.teria to establish. In general, three fractureregions are readily apparent and may be identi- Currently, only a limited amount of data isfied as 1.) a pulverized or crater region, 2.) available in the open literature on the dynamica region of crushed aggregate, and 3.) a region behavior of concrete. This lack of informationof numerous microcracke in which elastic waves makes it difficult to establish criteria for usecan be considered important (Figure 1). Since in designing protective and containment struc-
tures. A currently used design criteria is toSselect the dynamic t.nsile strength as twicethe static ultimate tensile strength, [Q).
"* Studies on the dynamic comp-essive strength ofDynamic Loading concrete have also been reported in [23.
Results from these studies show that (a) thecompressive strength increased with the rate ofloading and was twice the static value for in-termediate loading rates (10 in/in/sec), (b)the dynamic elastic modulus was found to be 1.5times the static value, and (c) that the impactresistance of the material was found to increase
Ill with the rate of loading. Additional investi-gations of the dynamic properties of impactedconcrete bar specimens (3,4] have shown that:he wave propagation velocity is similar to
Figure 1. Effects of Dynamic Loading on a that in igneous rocks, that the dynamic elasticlock Medium (1, Crater Region: II, modulus is greater than the static value andCrushed Aggregate: Ill, Elastic that pulses of short duration and high riseRegion) time propagate with little dispersion and some
131
166

J
Table 1. Summary of grain size properties and mix proportionsfor aggregates A-3 and A-4.
her Diameter Aggregate D50 Cu /c W/cinches _ _,) I
.___,__3A4 A-3 0.425 1.64 2.0 0.56
1-_/2 A-3 0.425 1.64 2.0 O.6
_ 1-112 A-4 1.30 1.49 2.0 0.50
attenuation, the latter dependent upom the geometrical diamtetrs, 0.75 inches and 1.50specific strain level. Most recent studies [13 inches. 104de for the specimens G ere cosCtruc-indicate that a strain energy fracture criterion ted from PVC tubes split an two sides 1800 apartmy provide a meaningful guide for design for easy removal after setting of the concreteagainst spell and corner fractures. Also, sam had occurred. Them erode of the molds werecurrent results obtained for brittle material sealed by rubber stoppers; a ember 3 stopperother than concrete f5l indicate that a statis- was used for the 0.75" mold and a number 9 fortical correlation between static tensile frac- the 1.30" mold. An elaborate taping procedureture and corresponding wave propagation failure was developed to prevent leaking of the water/in long bar specimens may be possible. cement mixture from the mold. Duct tape was
used to seal the longitudinal seams and makingIn the present investigation, infotmation tape was wrapped around the mold to keep it
relative to the microcrack region has been ex- from expending laterally. Ilectrical tape wasperimentally obtained on instrumented long bar used to seal the rubber stoppers to the mold.specimens. These specimens have been impel- An oil base mold release agent was coated on theslively loaded using impactors of different inside surface of the mold before casting tolength and shape, with the specimens being of prevent adhesion of the cement to the mold.variable diameter and concrete aggregates. Thebars have been impacted at stress levels well The mix proportions were adjusted for thebelow the compressive strength of the material combination that resalted in a bar with thein order to investigate the extent and nature best (smooth) surface for strain gage applica-of the tensile fracture phenomenon occurring tion. The parameters involved in the mix pro-within the specimens. Surface strain gages portions were the soil/cement (s/c) ratio andhave been used to measure the strain pulse pro- the water/cement (v/c) ratio. The a/c ratiopagation characteristics including pulse shape was selected to be 2 to I for high strengthchange, pulse speed and amplitude attenuation, properties and the v/c wes adjusted in a rangeIn addition, changes in particle aggregate of .50 to .65. Values of .56 for the A-3 agg-sizes along with bar geometry changes have been regate and .50 for the A-4 aggrebate resulted instudied for potential scaling purposes, bars with minimal surface air pockets, good con-
solidation, and little or no water leakagethrough the seams and ends of the mold.
SPICUIIN PRIPARATIONConcrete was mined in quantities sufficient
The concrete specimens were fabricated to prepare three specimens. The mix wes addedfrom high early strength cement, Portland Type to a prepared mold in a vertical position inIII and an aggregate with a low uniformit two inch layers, consolidated by tamping with acoefficient, (i.e. the grain diameters are flat ended 5/8 inch fiber glass rod, and sealedhomogeneous in size). Selection of aggregate ,ith the upper stopper and electrical tape.vas made such chat scaling between bars of ,he seal.4 concrete filled mold was then laidvarying diameter and aggregate size could be horizontally for tht e days to allow for settinginvestigated. Table I summarizes the gradation of the concrete after .,hich the mold was thenand grain size data which include the mean removed and the bar im.Arsed in water at roomdiameter (D50), the uniformity coefficient (CU), temperature (760f) for a period of 4 days.the soil/cement ratio (a/c) and the water/cement After the 7 day cure time the bar was allowedratio (w/c). The aggregates used were 99.5% to air dry for a minimi of 3 days beforeSio 2 ., testing. For the case of the 28 day cure
specimens the procedure was the same except theThe test specimens were fabricated for two cure in water ias increased from 4 days to 25
days.' Private conversation, Al Fiorl, ML Industries Zzamples of typical concrete bar specimenstdgar, Fla., 6 July, 1974 are shown in Figure 2. The bars take the shape
132
/
4 /
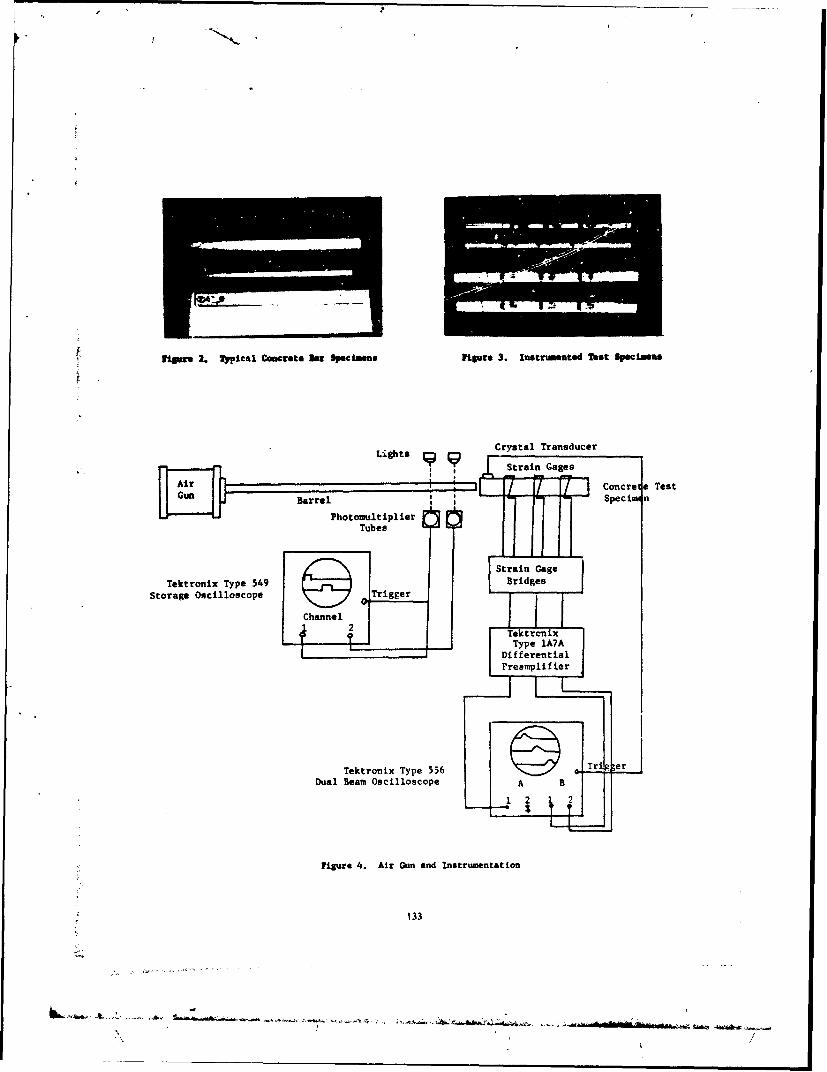
Svare 2. Tppicgl Concrete In Specimens Vigpre 3. Instrumented Test Ipecuau.
Lights Crystal TransducerStrain Gages
Air Concrete TestBarlPhotomult ipli•er SubesGrrum - Specim n
Strain Gage
Tektronix Type 549 Bridges
Storage Oscilloscope 0 Trigger
TektrcnixType 1A7A
DifferentialPreamplifier
Tektronix Type 556 Tri •er
Dual Bean Oscilloscope A B
Figure 4. Air Gun and Instrumentation
133
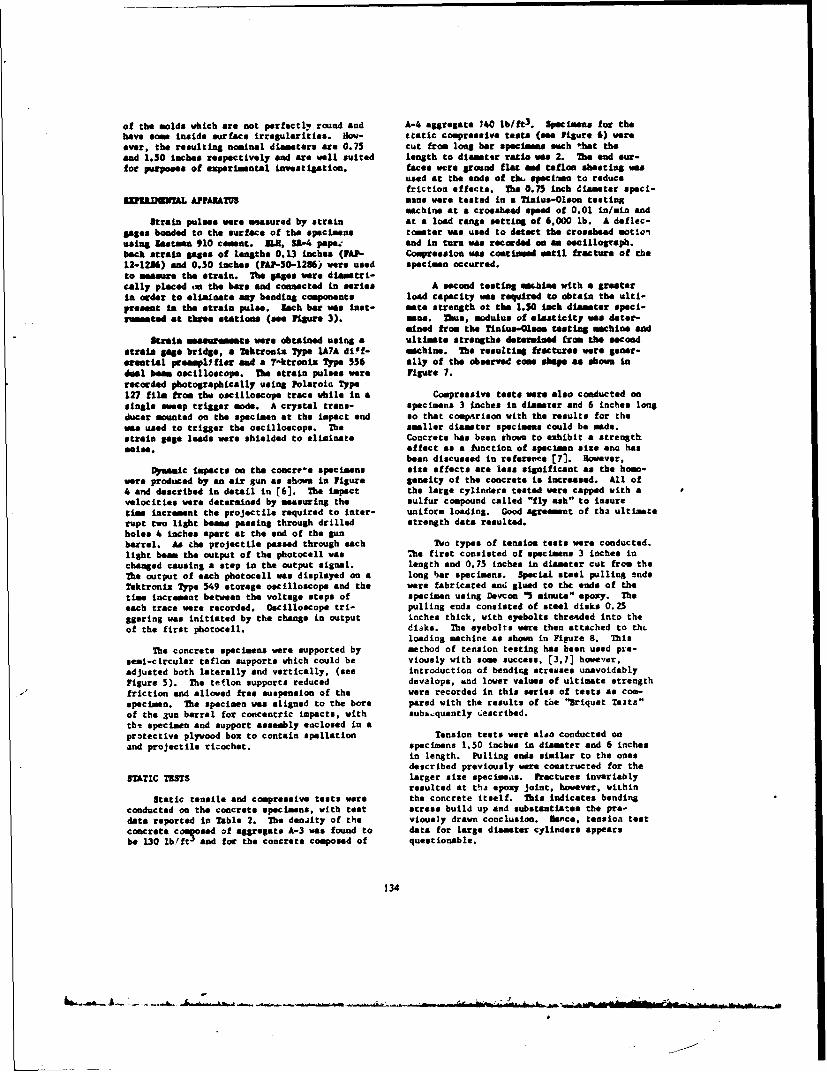
of the molds which are not perfectly round and A-4 aggregate J40 lb/ft3 . Specimens for the
have stor inside surface irregularities. How- etatic compressive tests (see Figure 6) wereever, the resulting nominal diameters are 0.75 cut from long bar specimens such *hea theand 1.50 inches respectively and are well suited length to diamettr ratio was 2. The end our-for purposes of experimental investigation, faces were ground flat sed teflon sheeting was
used at the ends of thi. specit-n to reducefriction effects. The 0.75 inch diameter speci-
SIPtflDGW APPARATUS mess were tested in a iaius-Olsou testingmachine at a croashead speed of 0.01 in/mm and
Strain pulses were measured by strain at a load range setting of 6,000 lb. A deflec-gagoe banded to the surface of the specimens toaster was used to detect the croshead motion
uaing Sastmon 910 csmnt. UN, S1-4 pape., and in turn was recorded oe as oscillograph.back strain gages of lengths 0.13 inches (PAP- Compression Was coetimrd entil fracture of the12-1236) and 0.50 inches (YAP-50-12S6) were used specimen occurred.to measure the strain. The gages were diametri-cally placed on the bor and connected in series A second testing aLoone with a greaterin order to eliminate any bending components load capacity was required to obtain the ulti-present in the strain pulse. Iach bar was inst- mate strength ot the 1.50 lack diameter speci-riented at three stations (see Fiure 3). was. Thus, modulus of elasticity was deter-
mined from the Tinius-Olsom testing machine end
Straia msssurommts were obtained using a ultimate strengths determined Eram the secondstrain gase bridge, a Tektronix Type lA7A di~f- machine. The resulting fractures were gener-
rtial p•eamplifier and a T-ktroniz Type 556 ally of the observed come shape e shown indual beam oscilloscope. The strain pulses were Figure 7.recorded photographically using Polaroid Type127 film from the oscilloscope trace while in a Compressive tests ware also conducted onsingle weep trigger mode. A crystal trane- specimens 3 inches in diameter and 6 inches longducer mounted on the specimen at the impact end so that comparison with the results for thewas used to trigger the oscilloscope. The smaller diameter specimens could be made.strain gags leads were shielded to eliminate Concrete has been shown to exhibit a strengthmvase. effect as a function of specimen size an has
been discussed in reference [7. However,Dynamic Impacts on the concree specimens size effects are less significant as the homo-
were produced by an air sun as shown in Figure genaity of the concrete is increased. All of4 and described in detail in [6]. The impact the large cylinders tested were capped with avelocities were determined by measuring the sulfur compound called "fly ash" to insuretime increment the projectile required to inter- uniform loading. Good agreement of tha ultimaterupt two light beaom passing through drilled strength data resulted.holes 4 inches apart at the end of the gunbarrel. As the projectile passed through each Two types of tension tests were conducted.light beam the output of the photocell was The first consisted of specimens 3 inches inchanged causing a step in the output signal, length and 0.75 inches in diameter cut from theThe output of each photocell was displayed on a long bar specimens. Special steel pulling endsTektronix Type 549 storage oscilloscope and the were fabricated and glued to the ends of thetime increment between the voltage steps of specimen using Devcon "S minute" epoxy. Theeach trace were recorded. Oscilloscope tri- pulling ends consisted of steel disks 0.25ggering was initiated by the change in output inches thick, with eyebolts threaded into theof the first photocell, disks. The eyebolts were then attached to the
loading machine as shown in Figure 8. ThisThe concrete specimens were supported by method of tension testing has been used pre-
semL-circular teflon supports which could be vLously with sow success, (3,7] however,adjusted both laterally and vertically, (see introduction of bending stresses unavoidablyFigure 5). The teflon supports reduced devalops, and lower values of ultimate strengthfriction and allowed free suspension of the were recorded in this series of tests as com-specimen. The specimen was aligned to the bore pared with the results of the "Briquet Teita"of the •un barrel for concentric impacts, with sub&,quently ,eacribed.the specimen and support assembly enclosed in aprotective plywood box to contain spallation Tension tests were sido conducted onand projectile ricochet, specimens 1.50 inches in diameter and 6 inches
in length. Pulling ends sixiler to the onesdescribed previously we" constructed for the
STATIC ThSTS larger size speciimeas. Fractures invariablyresulted at tha epoxy joint, however, within
Static tensile and compressive tests were the concrete itself. This indicates bandingconducted on the concrete specimens, with test stress build up and substantiates the pre-data reported in Table 2. The density of the viously drawn conclusion. Mance, tension testconcrete coursed of aggregate A-3 was found to data for large diameter cylinders appearsbe 130 lb/ft and for the concrete composed of questionable.
134
* J.... 6~~~__

e-4
fl$O S. ipecimea upport IWehobu FigurS 6. Specimens for StaticCompressive Tests
Table 2. Static Properties
u Copression Tension
Diameter Sectioaml time Yount's YOURS, aShape (in) Arta AIegate (days) 0lt. lbdtlus Utt. Modulus
(1n Strength (xt10- Strength (x10-6(p-si) psi) (psi) psi)
3/4 0.418 A-3 7 5540 3.33 394 3.63
Cylinlder
28 8819 4.47 5.53
1 1/2 1.7671 A-3 7 5538 3.02 3.87
1 1/2 1.7671 A-4 7 6340 3.01 3.95
A-3 7 585
kltcqus t 1" _____
A-4. 7 541
135

Prsrro
The "etoad method of tension testing In-volved the casting of the Concrete iate espe-cially designed molds. Soe shape to Shown inFigure 9 and was designed such that concentra-tion of the load occurs at the narrow portionof the. briquet. The load to determined from aproving ring calibration chart. Ultimatestrengths in tension were substantially higherfrom this test "tries and greater confildoeat Isplaced upon these values because of uaiformityof specimn failure. Fpgure a. Static eausim vat Flaure,
"Peprate investigation a" served as a Comn-FRACTURS 21M 0L0O DIIACT VUcCIT maSSJunto parlson toe the data obtained from the dynmmic
testrumeted Impact teste.Dynamic impact tests were conducted om mo-
instrumented concrete bars in order to dater- A Wavetek Model 144 ame generator pro-mine the minimum velocity required to cause a vided the input signal freqoency of 800000single tensile fracture. The effects of the hertt. The output signal wse read directly byaddition of a protective steel cap to the ino- a Tektronix Type 5S55 oscilloecope and thepact end were also Investigated. lor diameters input sand output signals were then simultanso-of 0.75 and 1.50 inches were used with the A-3 ugly displayed on the oscilloscope traee. Theaggregate and a diameter of 1.50 inches was time required for the first we"s to treverseused for the A-4 aggregate. Some typical frac- the thickness of the specimen was observed andtures are shown in Figure 10. A range of im- wave speed calculated. Soe dynamic moduluspact velocities were used in order to establish was then determia~d by aeing the elastic wavethe lover threshold velocity limit for a sin- speed equation (a -PC 2 ).$I@ fracture. for cases where the bar was notfractured, repeated tests were conducted at the Some typical wave paterns for the 0.25sam or higher impact velocities to determine Inch and 0.50 inch specimens have been shown inif the dynamic characteristics changed due to figures 11 and 12 end the resulting ultrasonicthe previous passges of a tensile wave through test data have baee give is Table 4..the specimen. Also, for same bars the frac-tured specimens were rebonded using Devcon "5minute-' spory and repeated dynamic testing con- ODiWEIC DEFACT TZSTSducted. A summary of the tareshold limits aregiven in Table 3. A total of twelve hare were instruamented
with strain gages foe dymmic imact testing.Repeated impacts were conduted am the haer
ULTRAMCIC TamS using the following impactors: *phere. V'cylinder with hemispberical nose, 2" cylinder
Ultrasonic test specimens 0.25 inches and with hemispherical nose. Vaet wep speeds0.50 inches were cut from both unshocked (20W sec/cm) on the oectilocope were used to(virgin) berr and previously shocked (one or obtsai data for calculating pulse speed andmore prior impacts) bars. Both ends of the determining pulse shape fr each type ofspecimens were ground flat and 0.13 inch impactor. Slow sweep speeds (20OW setc/c) werediameter transducers were Nounted to produce used to observe pulse atteasat ion. Some typi-axial motion. These tests were conducted as a cal pulse shape* bae" bass Included in Figures
136

j .•
YVig" 9. riquet $Pect"&$ used lgwo 10. lyptca amale heeule Praccureais Static 200l0se, bats fee 0.75 isch Dameter Nra
Table 3. Average Tesile fracture Impact Velocity Threahold Limits
b•r 4ndDiameter Aggregate Cure Impactor Cnditi on Aver&$e Velocity(inches) (days) (inches) (C-capped Threehold Limit
, ,,_ _ouncaped) (in/]ec) I
7 1 C 150.. •
0.73 A-3 - 0 20MalC 400
1 ,_ _250
A-3 7 1 C , 0 .1.50 - - _______1200
A-4 7 1
t ..A sc/€CA t . eac/cmFigure 11. Typical Wave Pattern in Figure 12. Typical lave Pattern in
0.25 inch Thick Specimen 0.50 inch Thick Specimen
137
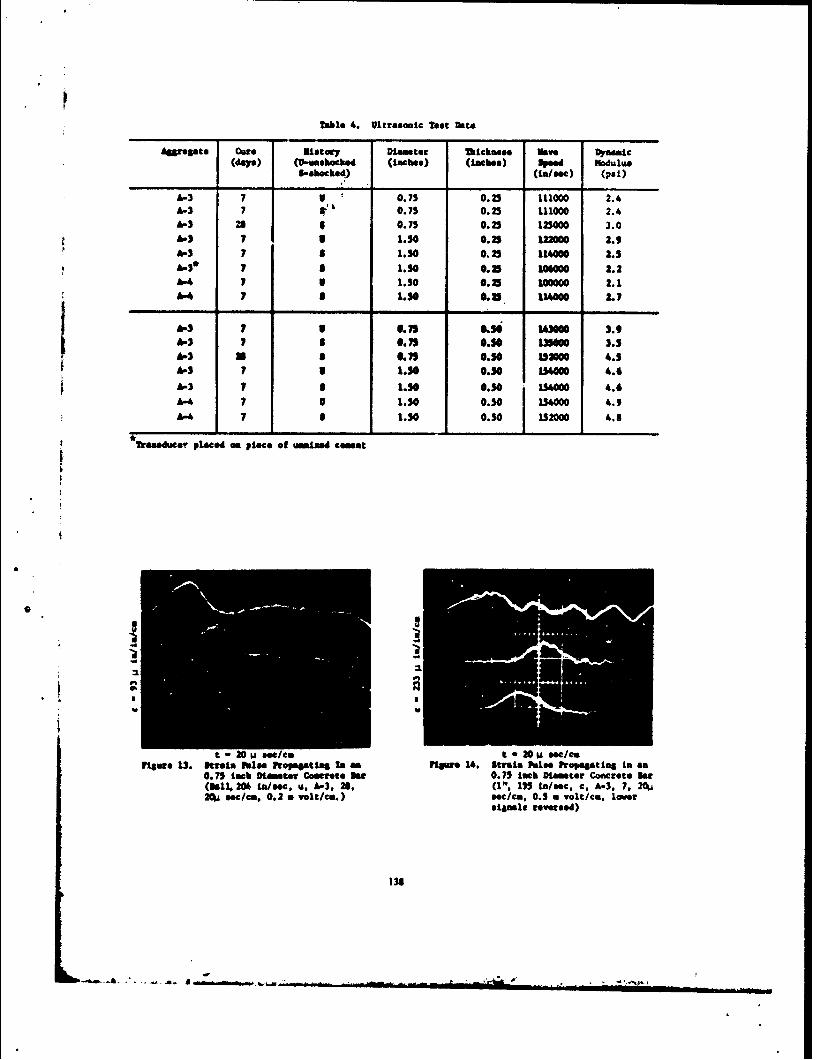
Table 4. Ultrasonlc Test kata
Aggregate Care 315ta r7 Diameter Thickness I-ve Dynamic(dy,) (u-iumbocked (inches) (Laches) Speed ioftulus
.--bocked) (ia/eec) (psi)
L-3 7 g 0.75 0.23 111000 2.4A-3 7 8" 0.75 0.23 111000 2.4&-3 2S 6 0.75 0.25 125000 3.04-3 j 7 1.50 0.23 122000 2.9A-3 7 S 1.50 0.25 11400 2.5&-I 7 8 1.50 0.35 106000 2.24-4 7 1 1.50 0.33 100000 2.14-4 7 8 1.30 0. 114000 2.
4-3 7 3 6.75 0.i 143000 3.93.3 1 8 0.75 0.50 130000 3.5
S 43 SO d 0. 7e 0.50 1_3000 4.iA-3 l1."4 0.50 154400 4.6
L-3 7 I1.50 0:50 Mm40 4.6
A-4 7 9 1.30 0.50 154000 4.9
A1.4 7 $ 1.50 0.54 152000 4.8
a Tr~almoduce Plaited OR place of unmi ed cement
II
.II
t - 20 a see/c. t -20 s eec/cmFigure 13. Strata psl"e ftopaatta Ia aF igure 14. Strain False Propagating in &a
0.75 Loek Diameter Concrete 3t 0.75 Loeh Disinter Concrete Am(Ball, 20k n/soec, u. 1-3, 26, (1", 1"5 La/ee, c, A-3. 7. 2,2o. eec/c, 0.2 a volt/ca.) sec/ca, 0.5 a volt/ca. lower
signals reversed)
138

t 20 ii se /c 0 Msi
//
/*/U/CiC
ft " 20 '.L eec/cm t - :O0 g seec/cnag"te L5. Strain plse Propagating in Figure 16. Strain Pulse Attenuatioa tn a
a 1.50 Inch Diameter Concrete 1.50 Inch Diameter Concrete UatNat (1", 195 in/sec, C, A-3, 7. (Ball. 351 in/Woe, U, A4, 7,20 61 eec/cm, .5 a volt/ca) 200 M sec/ca, .2 a volt/ce)
t -50U sec/cs t -50 w set/cmfigure 17. Effects of .n epoxy figure 18. effetsc: of an E~poxy•
Joint on Pulse Propagation Joint on Pulse Propagation(1", 444 in/set, V, A-3, 7, (1., 229 in/sec, C, A-3, 7,5O b, sec/cm, .5 a volt/ca) , , 20 s• ec/cm, .5 a volt/cm)
a!
.- O
t -20 jA eec/cm t - o0 p eec/ca
figure 19i Strain Amplitude a. Function of Fi1ure 20. Strain Amplitude as a 'nction ofimpact Velocity (o.n 0 inch diaaeter, ompact Velocity (1l.5 diameter,A-3, 7 day cure, 1 inch 7mpactor, .2 (-3, 7 day cure. spherical im7ac-
5 volt0/Cm, 20U sec/cm, 0.25 inch tor, v2 m volts/cm, 20. avle/cm,cap, VI 163 in/sec, V2 -250 in/ O.3O inch cap, V, 200 in/si:c, V208c, V3 - 333 in/ec) 333 insee, V3- 476 in/
139
mmm, I

13-16. Details of each test are given in paren- along the bar. The absence of attenuation andtheses in the following order: projectile, dispereion did not appear to depend on bar Sgo-velocity, end condition (u-uncapped, c-capped), metry as used in this study and can be notedaggregate, cure time, oscilloscope sweep speed, by comparing Figures 1 aend 13.oscilloscope voltage). steel caps 0.25 inchesin thickness wer used on several of the bars Previous studies r3] oa concrete rod ape-tested. The diameter of the caps matched the cimens indicate that a solid friction model isdiameter of the bar to which it were attached. representative of the resulting data. However,All caps were bonded to the bars using Dyvcon there is am order of magnitude difference in"5 minute" epoxy, the impact velocities in that particular study
and the study presented here. The author (3)After repeated Impacts, the tensile further goes on to say, based upon past dynasmic
stress waves created week areas in the ber studies oan rock specimen that "any materialbeing tested with fracture or hairline cracks will behave en an elastic solid below a .riticalgenerally noted. Wen fracture did occur, the stress level, will exhbit etteuation abovespecimen ase rebonded using Devcon "5 minute" this level, and will regaim its elastic beha-epex end the baer ws rotested, Por bars vior upon saturation of microecopic structural
e fracture occurred beyond the third gage demage." If this situation dees indeed occur"s•taei , palse hearacteristics were recorded fgo concrete then it is peesible for ImpactAw fat soeep speed" im order to observe the velocities at or seat the toemil* failurefirst plse passage. The iaformation obtained strength of concrete that a ecmletely elasticIn this wemme a n found t2 be equivalent to a behavior imy be expected.ber without a fracture as long as interferencedid not occur for the incident compessive and lurface strain gage data showe that pulsesreflected tensile palss. propagated through a bonded front steel cap are
shorter in weve length thea palses generatmdPulse propegation characteristics 6hrough from impacts on uncapped bars. This result is
an epoxy joint between ogae stations were also in agreement with fractures observed in the dy-obtained. Soe typical data has been included namic impect velocity threshold test seriesto figures 17 and 18. with a shorter pulse producing a tensile froc-
tL.' nearer the distal end of the bar.
RK ,JI AM DIICUSSION Tests have been conducted in order todetermine the effects of increasing is-act velo-
DOte obtained from the Dnamic Impact Test city upon sibsequent strain amplitude. Figure"sesie indicate that the velocity required to 19 presentL the effects on a capped 1.50 inchproduce a single tensile fracture is reduced as diameter bar for a I inch cylindrical pro-the impactor length increased. tn addition, jectile with hemisph•rical nose while figure 20the influence of a cap at the impacted end of presents the effects on an untapped 1.50 incha bar appears to causA tensile failure nearer diameter bar for a spherical projectile. Boththe distal end of the bar. Also, repeated sets of data indicate good reproducibility withimpacts on previously tested and rebonde" approximately a linear relationship betweenspecimens tend to produce random fractures, strain amplitude and projectile impact velocity.
Results from the ultrasonic tests conduc- (omparison of pulse data on similar harsted indicate that thickness of specimens tested having different gage lengths (0.13 vs 0.50is important in establishing wave speed data inches) showed little observable differences.with higher wave speeds in thicker specimens. Cross comparisons between bars instrumentedAlso, wave speeds determinud in concrete com- with gages of varying length can thus be usedposed of A-3 and A-4 type aggregates were found with confidence.to be similar. It was observed that concreteof longer cure time had a slightly higher Results from the amplitude attenuationwave speed; this result occurring due to the studies Zor which multiple reflections mereincrease in modulus with increasing cure time. observed indicate that a decay in amplitude
occurs with progression down the bar whileIn general, pulse propagation speeds amplitude growth is obcerved with progression
determined from bar impact studies wero found of the reflected tensile pulse toward the in-to be in the range of 118,000 inches per pact end. The differences are seall and eresecond to 150,000 inches per secon, and in possibly within the error of the experimentalagreement with results from thQ ultrasonic apparatus, however, this observation is noticedtests. Wave shapes mere approximately a half on repeated tests of the same bar and also fromsine wave with long rise times, end almost tests on different bare. Deta presented insymetrical about the peak magnitude point, references r8.9] has also shown this some pheno-
m non for dwnanic impact tests of igneous rockObservations of the pulses from photo- specimens and hypothesized that this effect in
graphs of fast sweep speeds (20W sec/cm) indi- due to the release of stored energy in thecate the pulses propagate with little or no oh- grains as the tensile wave passes.servable attenuation and dispersion and remainelastic in character durf.n8 initial traverse
1430 10
LLNOUN"

CONCLUSIONS Rocks," Journal of Geophysical Research,Vol. 71, No. 6, 1966, p. 2055.
1. Concrete behaves as an elastic solid for
stress levels near the tensile failure [9) Goldsmith, V., and Austin, C. F., 'Somestrength of the material for initial wave Dynamic Characteristics of Rocks," Stresspassage. Waves in Anelastic Solids, Springer,
2. Tensile wave speed in concrete is approxi- Berlin, Germany. 1964, p. 237.mately 1.2-1.5 times faster than the com-pressive wave speed. DIS(IUSSION
3. Tke compressive wave speed decreases withpropagatLon down the bar while the tensile Voice: ... on dynamic tests of concrete.wave spaot increases with propagation I recommend to you the summary technical reporttowards the loaded end after refle.tion. of Division 2 of the WKRC 1946-41 which has
4. dynamic Young's modulus is similar to a lot of data. It will be at 1600 feet/secstatic modulus for stress levels near not 1600 in/second end up. Also, if you look
the tensile failure strength of the con- in the engineering Index from about 1940 tocrete, and the dynamic ultimate strength is 19%4 you vil l find a lot of data on the stress1.3 to 1.5 tmese the static ultimate waves produced by impact on concrete bars, instrength for stress levels near the tensile this ease about 6 in. square end 20 feetfailure of the concrete. la with reel life-se aggregate.
. ggreate #ise does not significantlyaffect dynamic properties when the aggrega- Mr. Griner: Were those instrumentod tests?to varies in grain diameter from Sm to1. Sm. Voice: Yes they were!
6. Dynamic tensile fracture stresses are afunction of the projectile momentum and not Voice: I was in the Laboratory in Raleigha function of impact velocity only. School of Mines in 1940 and right next to my
testing machines was the test apparatus fordoing this very thing. I'm sure it was
92IRUECIS written up end reported.
[i] D. L. Sirkimer and 1. Lindemann, "Dynamic Uk. Crier: One thing I might point out to youTensile Strength of Concrete Materials," Is that for these low stzrss levels i.e. 100 toJournal of the American Concrete Institute. 700 psi, the dynamic modulii did not change thatVol. 68, 1971, p. 47 much but if we went to 5000 psi then it may g,,
up to as much as 1.5 and I think that is what[21 D. Watetein, "Effect of Straining Rate on has been reported. The ultimate strengths
the Compressive Strength and Elastic Pro- were slightly higher, even at the low stressparties of Concrete," Journal of the levels. Now one thing that I think needs moreAmerican Concrete Institute, Vol. 24, work in this particular areas and that in1953, p. 729. finding the critical stress level at which
fracture occurred. Now my strain gages were[3] V. Goldsmith, K. Polivka, and T. 'ang. at a certain position that I could measure the"Dynomic Jehavior of Concrete," SlgW- pulse but of course the fracture didn't occur
mental Mechanics, Vol. 6, 1966, p. 65. right at the strain gage so I really couldn'ttell exactly what the stress was when it
r4] W. Goldsmith, V. H. Kener, and T. 2. fractured. I think that would be one of theRicketts, "Dynamic Loading of Several Con- most important parameters.crete-Like Mixturns,"Journal of theStructural Division CASCKU, Vol. 94, 1968, Mr. O'Hserne: (Martin Marietta) I noticed inp. 1803. statically loading the cylindrical bars it
looked as though the loading area was smaller[5' K. F. L. OH and I. Finnie, "The Location than the cross-sectional area of the bar and
of Fracture Ln Brittle Solids-U1," Inlte- I was wondering why the failure didn't occurnational Journal oC Fracture Mechanics, in the neighborhood of the loading head?Vol. 6, 1970, p. 333.
(61 Sierakowski, I. L., Nevill, G. Z., Ross, Mr. Griner: ear the pulling end?
C. A., and Jones, 9. r., Studies on thetallistic Impact of Composite Materialf Mr. O'lee-ne: Right:AFATL-TIL-69-99, Air Force Armament Labora- Mr. Criner: What we did is we fabricated thesetory, aglin Air Force Base, Florida, July particular ar-cimsne in molds that were 3/41969. inches in diemater and they were split down the
middle on both sides and taped together such• 7) Nevill, A. N., "Properties of Concrete," the. we had no water leakage. There wers someJohn Wiley and Sons, No York, 1971.thtwhanoaerlkg.Tee i sm
surface irregularities inside that an ans arluclt it wasn't a completely unifc:m .75 inches[$I Goldsmith, W., Austin, C. F., Wang, C. C.,ý but those pulling *ads were exa ct€ly .73 inch*@.
and Finnegan, S., "Stress Waves in Igneous
14111
-~ -.. -

is fact the cylindric.tL specimn weas slightlylarger then the pulling end. And like I saythe epoxy and so forth was so strong that itdid fail n•ar the center near the ends but inmeet ae.s. if we went to a larger diameterspeciumn or a higher strength specimen itfractures right on that epoxy joint but it wasvithin the concrete.
142

PREDICTING PLATE RESPONSE TO BLAST LOADING*
Lt. Col. Robert 0. Maitzand
Lt. Philip B. Aitken-CadeAir Force Institute of Tectnology
Wright-Patterson Air Force Base, Ohio 4S433
T"h Uam of the iso-damage curve as a predictive tool for designersis explored in the context of plastic deformation. Malytical and ex-perimantal results available in the literature are used to demostratethe feasibility of suppressing variations dus to geometry end bowmdaryconditions by selecting suitable non-dimmasioual variables.
LUTRODCrIN exceeds or is less then the level under consid-oration. Just as a iso-bar is a line on a map
The response of structures to various types connecting points having equal barometric pres-of dynamic loAfing, including that due to blast sure, so en iso-dsage curve is a line connect-effects, is frequently characterized by plotting ing points on a graph representing equal levelscurves of constant response using the peak value of denage. Such a plot may be used by a weaponof load end delivered impulse as coordinates, designer to establish parameters required toIf the coordinates are suitably scaled by dimen- achieve a desired level of dmage to his tar-sional analysis or other techniques, a single get. Obviously, this data is equally valuable
Ssuch curve, called en iso-response or iso-%aaage in assessing the vulnerability of one's owncurve, can be ued to predict the behavior of equipment and structures to a postulated threat.all similar structures, providing the geometry Iso-damage theory end the use md constructionof the structure, any boundary conditions end of iso-dsup plots for structures under blastthe pulse shape of the load remain the same loading vere described rather completely byThe objective of this study was to examine the Greenspon I1].feasibility of constructing an iso-damage curvewhich is valid for differing structural config- The definition of dauage levels will varyurations, that is, to lift the restrictions to with the problem at hind and may be either qual-similar geometry med boundary conditions. itative or qumtitative. For example, collapse
A brief introduction to the concept of iso- of structures, rupture of pressure vessels, ordwasp curves will be followed by a review of loss of nobility of vehicles are possible quali-"selected literature dealing with the plastic tative measures; while the occurrence of criti-deformation of plates which are subjected to dy- cal stresses or specified perament deformationneuic loading. Next. a set of sWIple iso-damage are quantitative in nature.curves are developed, based on mnalytical solu-tions available in the literature. Finally, ex. When considering blast loading as the damageperimental results for impulsively loaded plates machanisa, a convenient choice of coordinatesare used to test the validity of the proposed 'or the iso-dauege plot would be the peak pres-technique. sure end total impulse per unit area delivered
ISO-D4AM ( E to the target. Other damage mchanisms would* lead to different choices of coordinates.
The concept of iso-da ge was originated a Kornhauser (2] has p-sented a collection ofiso-responsetcurves forvarious ioaitiphenomenBallistic Research Laboratories, Aberdeen Prov- hichseillustratesto so extent impacthe vr etynaofing Ground. The iundamental idea is that some
specified level of damage to a target may be re-lated to certain qumtitative characteristics ofthe loading imposed on it. Then, if the locus *A portion of the material reported here wasof points repisenting the specified level of taken from a thesis submitted by the seconddamage is plotted using the load characteristics author to the Air Force Institute of Technologyas coordinates, the resulting curve represents in iartial fulfillment of the requiremants forthe boeada-y between regionr where damage either the MS degree.
143
• •ojo.•. , ' .
r •./ , . '

coordinates which may be wsed. asymptote Indicates a mbio Lawus* far whicha given damp level will owm. For my Jo-
To make the iso-domge concept were can- pulse leon than this miio the dinage will becrete,. Figure I represents a typical iso-dmsge less than the specified dowe level regardlesscurvme. The curve may be divided arbitrarily of the pressure mplitaf. gagion it is ainto three regions following the discussion of region of dynamc loading Alre the damage levelLindberg [3]. The three regions may be classi- to the system is sensitive to chmnges in bothfled as the impulsive loading realm, region 1, pressure and impulse. Im addition. the timthe dynamic loading realm, region 11. and the history or "puse shapse of the loading is in-quasi-static loading realm, region 111. In portent in this region. lagion III is the
*region I where the curve approaches the verti.. quasi-static loading ramwhere the curve ep-cal asymptote, peak pressure become unimpor- proaches the horizontal asymtote. The impulsetest and the dmap level depends mainly on is- ba s a unmotn an do dmag depends min -pulse. The impulsive Icading is of short dur- iy on the peak pressure. IhW horizontal asymp-atio with respect to the response time of the tote indicates a milins pomeur. for which asystem under consideration and as the duration given dmge level will einor. For my pressureapproaches Sere, the impulse approaches a limit, below this minim the dopwill be less thenThis limit leads to the value of the Impulsive the specified dowe load egardless of theas eymptote depicted In Figure i1. This vertical level of impulse.
I REGION I LOADING
IMPULSEI
IM IN£PEAK US-
PRESSURE
-PRESSUR
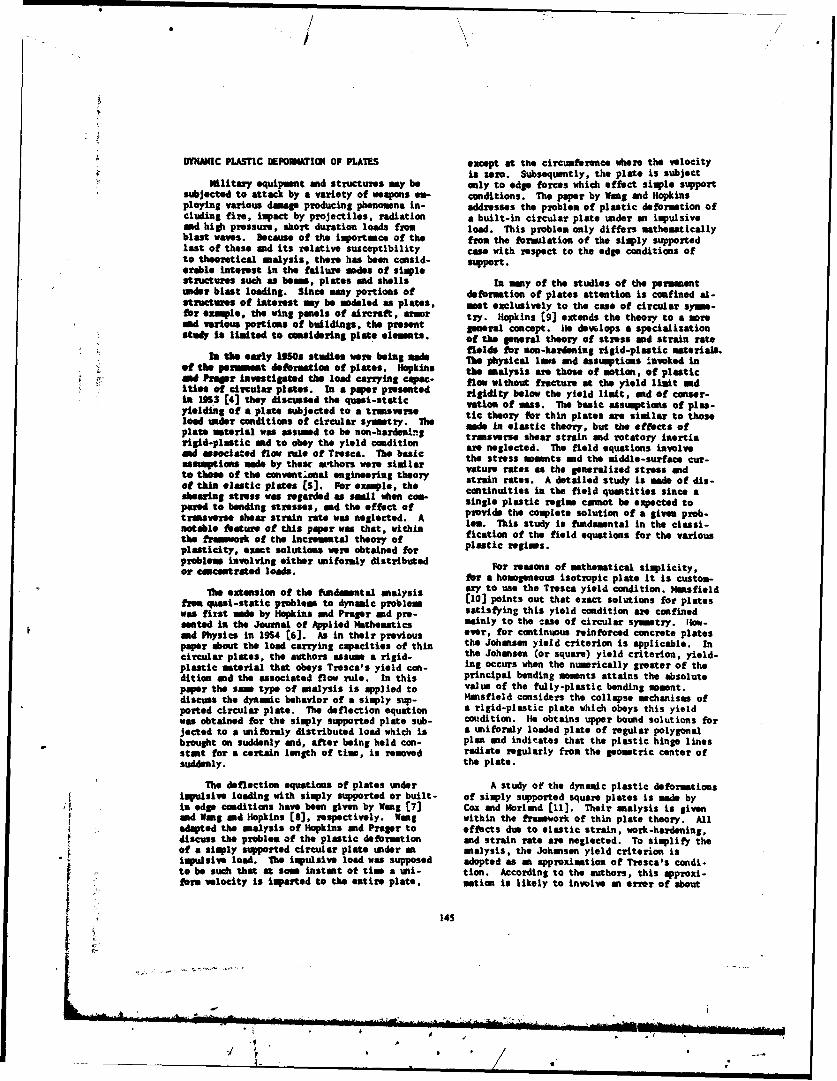
/ N
DYNAMIC PLASTIC DEPOMATION OF PLATES except at the circumference where the velocityis zero. Subsequently, the plate is subject
Military equipment and structures my be only to edge forces which effect simple supportsubjected to attack by a variety of weapons em- conditions. The paper by Wang and Hopkinsploying various damage producing phenomena in- addresses the problem of plastic deformation ofcluding fire, impact by projectiles, radiation a built-in circular plate under an impulsiveand high pressure, short duration loads from load. This problem only differs mathematicallyblast waves. Because of the importance of the from the formulation of the simply supportedlast of these and its relative susceptibility case with respect to the edge conditions ofto theoretical analysis, there has been consid- support.erable interest in the failure modes of simplestructures such as beon, plates ad shells In many of the studies of the permanenttunder blast loading. Since may portions of deformation of plates attention is confined &I-structures of interest may be modeled as plates, moet exclusively to the case of circular syma-for example, the wing panels of aircraft, am.30 try. Hopkins [9] extends the theory to a moreand various portions of buildings, the present general concept. fie dewlops a specializationstudy is limited to considering plate elements. of the general theory of stress and strain rate
Is the early 1950s studies wate being made fields for non-hardening rigid-plastic materials.The physical lows and assumptions invoked inof the pommeat defomation of plates. Hopkins the analysis are those of motion, of plasticad Prsegr Investigated the load carrying capoc- flow without fracture at the yield limit sad
ities of circular plates. In a paper presented rigidity below the yield limit, and of conser-in 19S3 C4] they discussed the quasi-static vation of mass. The basic assumptions of plas-yielding of a plate subjected to a trmsverse tic theory for thin plates are similar to thoseload vnder conditions of circular symmtry. 1he made in elastic theory, but the effects ofplate material was assumed to be non-hardeni-g transverse shear strain and rotatory inertiarigid-plastic and to obey the yield condition are neglected. The field equations involveamd associated flow rule of Tresca. The basic the stress moments and the middle-surface cur-assumptions made by these au-thors were similar vature rates as the generalized stress and
to those of the conventional engineering theory strain rates. A detailed study is made of dis-of thin elastic plates (s]. For example, the continuities in the field quantities since ashoeaing stress was regarded as small when com-pared to bonding stresses, and the effect of single plastic regime cannot be expected totransverse shear strain rate was neglected. A provide the complete solution of a given prob-notable feature of this paper was that, within Im. This study is fundamental in the classi-the abomefuok of the incrpen ta theory of fication of the field equations for the various
plasticity, exact solutions were obtained for plastic regimes.problem Involving either uniformly distributed For reasons of mathematical siaplicity,o•r conceutrated loads, for a homogeneous isotropic plate it is custom-
The extension of the fundaenntal analysis ary to use the Tresca yield condition. Mansfieldfrom quasi-static problems to dynamic problem (10] Points out that exact solutions for plateswas first made by Hopkins and Prager and pre- satisfying this yield condition are confinedsemted in the Journal of Applied Mathematics mainly to the case of circular symtry. lioe-sad Physics in 19S4 [6]. As in their previous ever, for continuous reinforced concrete platespaper about the load carrying capacities of thin the Johansen yield criterion is applicable. Incircular plates, the authors assume a rigid- the Johansen (or square) yield criterion, yield-plastic material that obeys Tresca0s yield con- ing occurs when the numerically greater of thedition and the associated flow rule. In this principal bending moments attains the absolutepaper the sam type of analysis is applied to value of the fully-plastic bending moment.discuss the dynamic behavior of a simply sup- Mansfield considers the collapse mechanisms ofported circular plate. The deflection equation a rigid-plastic plate which obeys this yieldwas obtained for the simply supported plate sub- coitdition. lie obtains upper bound solutions forjected to a uniformly distributed load which is a uniformly loaded plate of regular polygonalbrought on suddenly and, after being held con- plan and inditates that the plastic hinge linesstint for a certain length of time, is removed radiate regularly from the geometric center ofsuddenly. the plate.
The deflection equations of plates under A study of the dynamic plastic deformtionsimpulsive loading with simply supported or built- of simply supported square plates is made byin edge conditions have been given by Wang [7] Cox and Morland (11]. Their analysis is givenand Wang and Hopkins [8], respectively. Wang within the framework of thin plate theory. Alladapted the analysis of Hopkins and Prager to effects due to elastic strain, work-hardening,discuss the problem of the plastic deformation and strain rate are neglected. To simplify theof a simply supported circular plate under an analysis, the Johansen yield criterion isimpulsive load. The impulsive load was supposed adopted as an approximation of Tresca's condi-to be such that at soma instant of time a uni- tion. According to the authors, this approxi-fore velocity is imparted to the entire plate, motion is likely to involve an error of about
145
-I , i

too percent in the maximum displacement end which the heading stresse end in-plae shear-tims of motion. They show that results obtahiad Ing stresses far exceed the transverse shearingfor the maximum central displacement and total stresses. Although the shear force resultingtims of notion for a sqjars plate may be gener- from the shearing stresses normal to the Platoalized to solve the problem for a regular, surface wus taken late account in the equationa-sided polygonal plate, with n greater than 4_. of dynamic equilibrium, these stresses wereCox end Morland assum that the velocity field .- neglected in the yield codition. The effectshas the features of that described by Mansfield of rotatory inertia were also neglected. The(10]. In other words, they assume that plastic plate material was sa~sud to be non-hardening,deformation only occurs along the square plate rigid-plastic end to obey either the Tresca or,diagonals where hinge lines form, the rest of for the square plate, Johansen yield conditionthe plate remains rigid. Ibis is significant end associated flow role. The use of differentdeviation from the analysis presented by anu- yield conditions does ont come my difficultythere Such as Ming, Hopkins, and Prager. These hare; when principal bading amounts have theauthers assumed that the plastic deformation is sam sip, the two criteria a"e iadistinguish-
4 such that the plate middle surljce is divided able. Per seas plane conflguration, the loadingInto a rigid central circular region together was a uniformly distributed transverse pressurewith surrounding alternate annular regions of with a rectongula tim history.rigid or plasticly deforming material. The num.bar end position of these reginas varies with The cellapse behavior of plates generallySim. differs significuantly free that of ft'.. nrue-
turns end hoesn. Whmen determining the collapseFlor.c asi[12 treats the problem of clasped loads of fromss, the eleomets of the fras maycircular rigid-plastic plates under blast load- be assumed to be rigid-plastic, end have a cal-lot in a similar menner to that used in (4]. [6], culable fully plastic momnt. When consideringM?,eand 19]. There are two additional contri- the corresponding behavior of rigid-plastic
biions mode by Florence. First, he elaborates plates additional complications arise because ofonthe fact that there are two mechanisms of the presence of two principal bending moments.dformation. If a blast load is Idealized as en Defors the total calla"~ of a plate occurs.instantaneous rise to so=. peak pressure fol- the load is resisted by the middle surfacelowed by a continuous monotonic decay, then forces. For a rigid-plastic plate the totalmecabnism I corresponds to peak prsjsures in ex- collapse will only occu when the plate Is act-cesns of the static collapse pressure, but less ing as a plastic membrane. It is assumed. how-then twice the static collapse pressure. Mach- ever, that the plate is nwe so thin that themiss 2 corresponds to peak pressures greater load would be resisted purely by middle surfacethen twice the static collapse pressure. If the forces. Therefore, a partial tellapse mcha-deformaticn occurs by mens of mechanism 1, the nism must be considered.circular plate will be transformed slowly into acone with the vertex at the plate center. In Partial collapse mechaisma are character-mechenism 2, a central region of the plate ac- ized by the formation ef plastic hinge lines.quires a uniform velocity. This central region In the case of circular rigid-pl stic platesis circular, with a radius which is a funiction under uniform trensverse loading several authorsof the magnitude of the peak pressure, the dura- have characterized the partial collapse sucha-tion of the loading, end the time elapsed subse- nism by the formation of circular hinge lines.qWant to the loading. The radius of this region Several such hinge lines may form as concentricfinally decreases to zero, after which time the circles centered at the geometric center of thedeformation continues as in mechanism 1. Second- plate.
* ~~~ly, end of ma)or Importance, he shows the aspen-Astdofheclae censsf*done& of the permaent central deflection onAstdofheclaemcanmsf
pressure mid impulse when the blast loading is rigid-plastic plates is O~vae by Mon~field (101.take asa rctanula puse.A variety of shapes, boundary conditions, endtake asa rctanula puseloadings are investiqatiod including the case ofIS0O-AMIM CMtVWS FOR PL.ATES A square Plate under a vatform transverse load.
In this section iso-dusge curves will be The dynamic loading situation Is not considered,developed for a circular plate with simply but the static Collaps pressure is determined.supiported edaes, a circular plate with clamped The collapse mechanism for a square plate isedges end a simply supiported square plate. The theorized to involve the tormaion of plasticdevelopment is based on enalytical results given hinge lines along the plate diagonals. Thisby Hopkins &ad Prager (6], Florence (12], end collapse pattern is used in the developmenlt of* Cox med Nerlend (11]. These solutions were the deflection equations for the simply supi-Choosen for comparison becMe all three employed ported square plate.similar plats behavior theory md the sam typeof loading. Consequently, the only significant Mien the applied pressure is great enoughdifferences between the cases considered were in to Produce the partial cellaps mechanism, theplenform end boundary conditions. plate will begin to defeor.. Upson release of
the load, the plate will continue to deform un-*In eac of the three cases, the usual thin til all of its kinetic energy is absorbed bypiste assumptions were adopted according to Plastic work. Because elastic effects have been
146

neglected, the deformation at this tin is taken an the load regime, and each iso-damap carwto be the permient plastic deformation. For will consist of two portions which met atsimplicity, the maximm transverse displacement P a 2Ps.of the plate (which occurs at the plate center)was chosen as the quantitative measure of damage Expressions for the deflection of the sim-received, ply supported circular plate and the square
plate are given in (6] and (11] respectively.After the expression for the final central Although the form of the deflection function ob-
deflection of a plate is obtained, non-dimension- viously must differ for the two cases, the ex-al pressure and impulse characteristic equations pressions for the central deflection are identi-may be determined. It is from these equations cal when written in term of the static collapsethat the iso-damao curves are constructed. pressure rather than using yield stress or yield
moment as the strength parameter. Thus, forConsidering the preceding discussion, if is both plates, the final central deflections are:
necessary to consider the static collapse loadfor each configuration. For the simply supported For P s <Pc2p,, 12circular plate, Hopkins and Prager [4] give .W (1 . ) (4)
,. (1) Par bF,,
R2 Uf a1 (3 Ps (S)
where2 where,
I - PTO is the impulse per unit area, and
is the fully plastic bending aoment per unit a is the mass per unit area of the plate.length, and Florence [12] provides the solution for a
Ps is the static collapse pressure clamped circular plate. The resulting expres-sions are quite complex and require the use of
A is the radius of the plate a high speed computer to obtain solutions.Florence has done this and presented the results
ay is the yield per unit area in the form of a Pressure-Impulse diagram. Thisdiagram has been rescaled to conform with the
2h is the plate thickness non-dimensional coordinates used in this studyas will be described below.For the clamped circular plate [12],
ar ( [An observation is made in [10] that if thePS 6% (2) boundaries are simply supported then the col-
Slapse pressure of a regular polygonal platedepends only on the radius of the inscribed cir-cle and the value of the principal bending
where moment at yielding. Comparing Eq(l) and Eq(3)shows that this relationship also holds in the
re 0.73R limiting case of the circular plate. In thatFor the square plate r11], case it would be advantageous to define non-
o tpdimensional pr.ssure and impulse expressions so
S () that they are independent of shape. This isachieved if the non-dimensional pressure is
L2
defined as
where L is the half side length of the square. P(6)
Now, consider that the applied pressure is and the non-dimensional impulse is defined asof the mgnitkde, P. and persists from time,t a O, to t a vo, when the pressure is suddenly T. S (7)reduced again to zero. After release of theload, the plate comes to rest at t a tf.
For P - P the plate yields indefinitely N.ow since Ps is defined uniquely for each of theslowly and inaftia forces do not arise. For P2Ps lates wnder consideration the expressions forthe dynamic behavior of the plate is found to Pnd T provide a co basis for comparison.have a different character according to whetherthe load is "mdium" (PSP'2Ps) or "hiSh"(PK2Ps). Consequently, the expressions for final Substituting Eq(4) and Eq(S) into thedisplacement of the plate will differ depending non-dimensional impulse expression, the follobing
147

equations are obtained, the following is obtained:
Por medium load (lJ2}) T* i r
Therefore,
Fow high load (162) i * 1.03 1 (10)
/ T - 41 (9) The cur e pseted in (121M n-w he sesealed
to conform with the coordiaes defined by37-2 Ee(6) and Eq(7). rhe rescaled is*-d'mp carm
It is emphasied that these equations are writ- is plotted in Pigwul 3. together with that for
tern is teram of the individual plate static col- the simply supported plates.lqse pressure as defined by gq(l) or Bq(3),*1ew r is applicsble. 94(s) mad Eq(9) dspead Pr a given valu ofI. 0, 1 is the
Iey W V una dld sre mot explicitly dependet quasi-static wealm, a corspqonding vaue of
m the plate shae, thickness, size, density, or for a simply sWl•pwte plao is wvry nearly thematerial. It to therefore possible to construct same as the T for the clamped plate. In the
misa-doage cu aFar both the square and quasi-static t1eal the curves antacid.
circular siaply supported plates. This is*-demap cu~m is presented in Figure 2. Since the coordisates tw points chopin toplot the iso-dcrp cure of the clmped
The expression used in (12] for the nom- circular plate ywon road frees aopy of a simi-dimnsional impulse is lar diagram in mother report [12], it cannot
be expected that the curve is wry accurate.However, it is siniflcmatly close to the curve
R for the simply supported plate. It is suggestedthat Figure 2 is ma acceptable iso-damale curve
Sfor a square .r circular, simply supported orclamped, thin plate subjected to blast loadingwhen that ;ndividual plate's collapse pressure
If th l Clmped circular'plate collapse pesWSISa is used in to expressiaos for ordinate madsq(2), is substituted into the above expression, abscissa.
S~-lo 3
64
p SUPPORTED
I am S SPLY SUPPORTED
II 24 6 a 10
I
52 4 6 a 10"Figure 3 iso-dinge Curws for a
Clamped Circular Pate
Figure 2 Iso-damage Curve for a and a Simply Supported
Simply Supported Plete Plate
148
/1
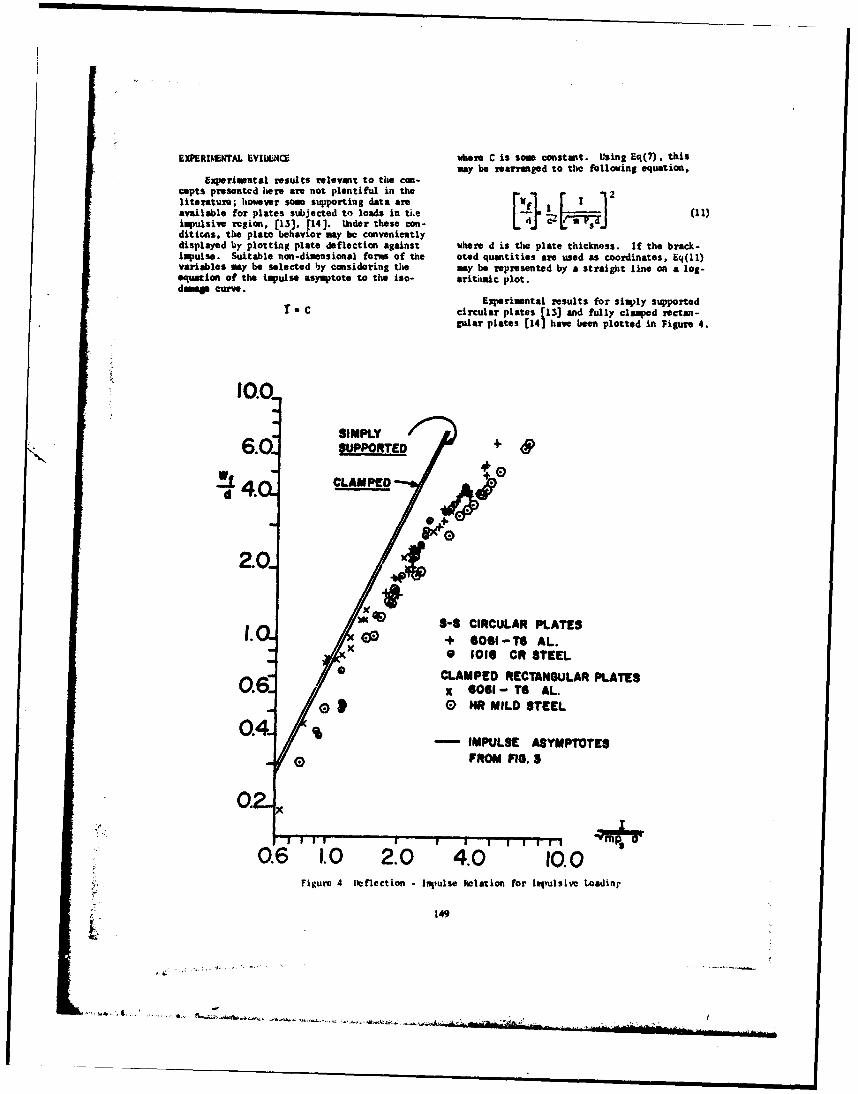
EXPERIMENTAL EVILWCL where C is som constant. Using Eq(7), this
may be rearranged to the following equation,Ezperionntal results relevant to the con-
cepts presented here are not plentiful in the2literature; however so0e supporting data are W favailable for plates subjected to loads in ti.e L()impulsive region, [13), [14]. Under these con-diticos. the plate behavior may be convenientlydisplayed by plotting plate deflection against where d is the plate thickness. If the brack-impulse. Suitable non-dimensional forms of the eted quantities are used as coordinates, Eq(ll)variables may be selected by considering the MAy be represented by a straight line on a log-equation of the impulse asymptote to the iso- arithaic plot.dms curve.
Experimental results for simply supported1 * C circular plates [13] and fully clamped rectan-
gular plates [14] have been plotted in Figure 4.
10.0
SIMPLY6.0 suppORTED+
CLAMPED
d 4'4.2.0.
'S-S CIRCULAR PLATES1. x + 061 -TO AL.
S1 I01 CR STEEL
* CLAMPED RECTANGULAR PLATES0.6 x 606,l- r6 AL.
,. HR MILD STEEL
0.4. -- IMPULSE ASYMPTOTES.•FROM FIG. S
0.
"0.6 1.0 2.0 4.0 10.0Figure 4 Ileflection - Irqiulse Relation for Impulsive Loadinp
149
aN ow&""

The static collapse pressure for the circular 'Lr2 3, Ogahaaao, Ste'ucturvi Iffoot* ol#aplates was defined by Eq(l) while that of the pact. Spartan looks, Marylood, 1964.rectangular plates was determinod using theprinciple of virtual work and the collapse (3] 11. E. u~ndbrg, et aI, "NOsponse Of Boem-mcbmism suggested in [14]. All the rectan- try Vehicle-type Shells to Blast Loads,"Plst plates had an aspect ratio of 1.69, for AP04(694)-6S5. N4ortom Air Fores Base.which the collapse pressure is given by Eq(l2). California, Ballistic System Division,
1965.
Ps a 22.3 Pe (12) (4] HI. G. Hopkins and 3. Prager, "The LoadLy Carrying Capacities of Circular Plates."
Journal of the Mechanics end Physics ofimore 21. Is the length of the plate. Solds. Vol. 2. pp. 1-13, 1953.
Figren 4 shows very good agreement mog E(5] S. Timshoko end S. Vainowsky -Krieger.the data points for the various combinations of Theory of Plates and Shells, MeGrue-iill.material and plate configuration. The asymp- New York, 1959.totes te the curves of Figure 3 are also plottedis P1gm 4. on this plot the two aseymtotes (6) H. G. hopkins end W. Prager. -ft theue newly imdistimguishablo fren me mother. Dymamica of Plastic circular plates,"The atapesimsta~lly masmured deflections are Zoritschrift for mpowindto kehesm&smaller them the predicted values. Since the ad Physik. Vol. 5, pp. 317-330, 15S4.theooetical models involved neglect the stiff-ening offsect of mabran forces, this outcoem is (7] A. J. 1mg, -The Porwment bflectien ofmet surprsing, a Plastic Plate under Blast Loading."
Journal of Applied t'bchosics. Vol. 22,CONCLI14Gjc EMARKS pp. 375-376, 1955.
These results suggest that iso-domage (8] A. J. %atg avd 11. G.. Hopkins, "(1m thecurves, appropriately scaled on the basis of Plastic Deformation of Built-in Circularstatic collapse pressure, provide a useful memo Plates under Impulsive Load," Journal offor characterizing the response of plate strut- the Mechanics end Pr.ysics of Solids,tures in a relatively compact and convenient Vol. 3, pp. 22-37, 1954.farm. With proper care end knowledge of staticcollapse pressures, a designer may be able to [9] H. G. H1opkins. -Vn the Plastic Theory ofwe experimental or theoretical results for one Plates." Proceedings of the Royal Societyconfiguration to construct reasonable predic- of London, Vol. 241, pp. 153-179. 1957.tions of the behavior of many other proposedstructures. :10] B. It. Hantfield, "Studios in Coll"ps
Analysis of Rigid-Plastic Plates with aThe coostruction of iso-damage curves in Square Yield Diagram." Proceedings of the
the muneor proposed is based on en intuitive Noyal Society of London. Vol. 241.feeling that the effects on plate response of pp. 311-338, 19S7.geometry end boundary conditions, which cowinto play in both static end dynamic problems, (11] A. D. Cox end L. W. Merlmd, "Denmicare relatively invariant with changes in the Plastic Deformations of Simply Supportedduration of the loading. Ona the other hand, Square Plates." Journal of the fMechanicsefficts duon to the inertia characteristics and Physics of Solids, Vol. 7, pp. 229-ac':otrnt for the major portion of -he variation 241, 1959.In response as the duration is .ltored. Justori conventional scaling as employed in[12]saqa- (12] A. L. Florence, "Clamped Circular Rigid-presses variations duo to size, density end Plastic Plates under Nlast Loadidig,"choice of material, it is hoped that the schem Journal of Applied Mechanics. Vol. 33,adopted here would suppress thoe" duen to team. Series E, pp. 2S6-260, June 1966.try end boundary conditions. it is hoped that*xperlsontal investigators in this field will E13] A. L. Florence. "Circular Plate under abe encouraged to try the suggested construction Unaiformly Distributed Impulse," Inter-using data available to then and thus demon- national Journal of Solids end Structures.strate whether or not this approach is also W.t Vol. 2, pp. 37-47, 1966.id for dynamic end quasi-static loadingconditions. (14] Norman . Jaons, T. 0. Uran and S. A. Tekin.SM1210=1 "The Dynamic riastic Behavior of Fully
Clasped Rectangul ar Plates.," International
(1] J. U. Greenspon. "Theoretical Calculation Journal of Solids end Structures, Vol. 6.of Iso-damage Oaarecteristtcs," B11. TR 10. pp. 1499-1512. 1970.Aerd6e Proving Ground. Maryland, 1970.
ISO