Embed Size (px)
Citation preview
Bulletin 53 (Part 4 of 4 Parts)
Reprinted From
THE SHOCK AND VIBRATION
BULLETIN
Part 4 Damping and Machinery Dynamics
MAY 1983
A Publication of THE SHOCK AND VIBRATION
INFORMATION CENTER Naval Research Laboratory, Washington, D.C.
Office of The Under Secretary of Defense for Research and Engineering
Approved for public release; distribution ,unlimited.

-.
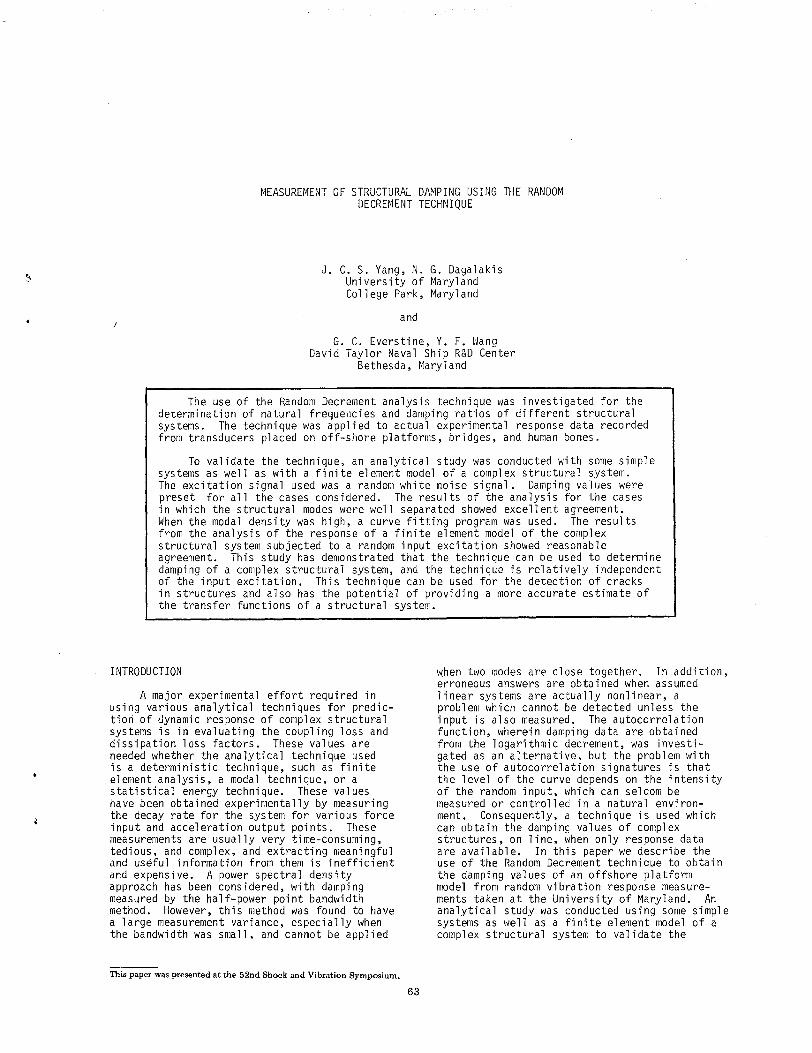
MEASUREMENT OF STRUCTURAL DAMPING USING THE RANDOM DECREMENT TECHNIQUE
J. C. S. Yang, N. G. Dagalakis University of Maryland College Park, Maryland
and
G. C. Everstine, Y. F. Wang David Taylor Naval Ship R&D Center
Bethesda, Maryl and
The use of the Random Decrement analysis technique was investigated for the determination of natural frequencies and damping ratios of different structural systems. The technique was applied to actual experimental response data recorded from transducers placed on off-shore platforms, bridges, and human bones.
To validate the technique, an analytical study was conducted with some simple systems as well as with a finite element model of a complex structural system. The excitation signal used was a random white noise signal. Damping values were preset for all the cases considered. The results of the analysis for the cases in which the structural modes were well separated showed excellent agreement. When the modal density was high, a curve fitting program was used. The results from the analysis of the response of a finite element model of the complex structural system subjected to a random input excitation showed reasonable agreement. This study has demonstrated that the technique can be used to determine damping of a complex structural system, and the technique is relatively independent of the input excitation. This technique can be used for the detection of cracks in structures and also has the potential of providing a more accurate estimate of the transfer functions of a structural system.
INTRODUCTION
A major experimental effort required in using various analytical techniques for prediction of dynamic response of complex structural systems is in evaluating the coupling loss and dissipation loss factors. These values are needed whether the analytical technique used is a deterministic technique, such as finite element analysis, a modal technique, or a statistical energy technique. These values have been obtained experimentally by measuring the decay rate for the system for various force input and acceleration output points. These measurements are usually very time-consuming, tedious, and complex, and extracting meaningfuland useful information from them is inefficient and expensive. A power spectral density approach has been considered, with damping measured by the half-power point bandwidth method. However, this method was found to have a large measurement variance, especially 1~hen the bandwidth was small, and cannot be applied
This paper was presented at the 52nd Shock and Vibration Symposium.
when two modes are close together. In addition, erroneous answers are obtained when assumed linear systems are actually nonlinear, a problem which cannot be detected unless the input is also measured. The autocorrelation function, wherein damping data are obtained from the logarithmic decrement, was investi gated as an alternative, but the problem with the use of autocorrelation signatures is that the level of the curve depends on the intensity of the random input, which can seldom be measured or controlled in a natural environment. Consequently, a technique is used which can obtain the damping values of complex structures, on line, when only response data are available. In this paper we describe the use of the Random Decrement technique to obtain the damping values of an offshore platform model from random vibration response measurements taken at the University of Maryland. An analytical study was conducted using some simple systems as well as a finite element model of a coniplex structural system to validate the
63

technique.
RANDOM DECREMENT ANALYSIS
The Random Decrement (Randomdec) technique was originally developed by Mr. H. A. Cole for the measurement of damping and for the detection of structural deterioration of airplane wings subjected to wind flutter excitation[1 ,2]. Other applications have been studied by various other authors[3-5].
The Random Decrement technique is a fast converging method for extracting meaningful information from random data. In this process segments of the random vibration response of a transducer placed on an object subjected to random excitation are ensemble averaged to form a signature which is representative of the free vibration decay curve of the structure. This signature can be used to measure damping or to detect incipient failures. The method is particularly useful in field measurements of structures and mechanical systems because excitation is provided naturally by such random inputs as acoustic noise, fluid flow, wind, etc.
In this section we present a brief, rather intuitive explanation of the principles of the Random Decrement technique. A more extensive mathematical derivation was developed by Reed[6].
The response x(t) of a linear system is governed by the following basic equation:
m ~(t) + c x(t) + k x(t) = f(t) (1)
The solution of this differential equation depends on its initial conditions and the excitation f(t). Since for linear systems the superposition law applies, the response can be decomposed into three parts: response due to initial displacement Xd(t), response due to initial velocity xv(t), and finally response due to the forcing function Xf(t).
The Random Decrement analysis consists of averaging Nsegments of the length Tl of the system response in the following manner: The starting time ti of each segment is selected ~uch that Xi(tiJ = Xs = constant and the slope xi(ti) alternates between positive and negative. This process can be represented in mathematical fonn:
6(T) = _l I: Xi(ti + T) (2) N i=l
where Xi (ti) = Xs 2, 31 '
x)til > 0 1, 3, 5
xi (ti l < 0 = 2, 4, 6
The function 6(T) is called the Random Decrement signature and is defined only in the
time interval 0 :::_ T :::_Tl. The meaning of the Random Decrement signature can now be determined. If the parts due to initial velocity are averaged, they cancel out because partswith positive and negative initial slopes are taken alternately and their distribution is random. Furthermore, if the parts due to the excitation are averaged, they also vanish because, by definition, the excitation is random. Finally, only the parts due to initial displacement are left and their average is the
,•Random Decrement signature representing the free vibration decay curve of the system due to an initial displacement, which corresponds to the bias level xs· (Fig. 1)
TOTAL RESPONSE DUE + RESPONSE DUE + FORCING RESPONSE = TO INITIAL TO INITIAL FUNCTION
DISPLACEMENT VELOCITY
+ +
Fig. 1 - Principles of Randomdec technique
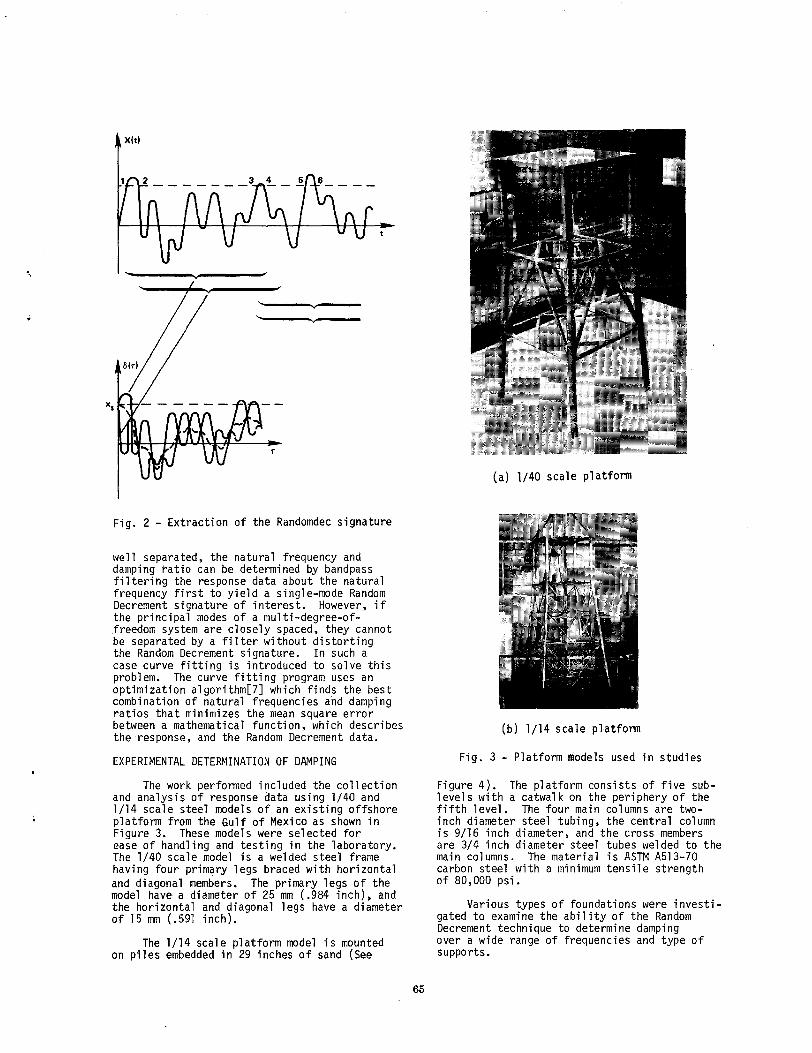
In practice, the technique is implemented with a Random Decrement computer which converts each segment into digital form and adds it to the previous segments (Fig. 2); the average is then stored in the memory and can be displayed on a screen. The number of segments to be averaged for the Random Decrement signature depends on the signal shape; usually 400 to 500 averages are sufficient to produce a repeatable signature.
One particularly interesting characteristic of the Random Decrement technique should be mentioned: it requires no knowledge of the excitation f(t) as long as it is random. Neither the type nor the intensity of the input affect the signature.
For a single-degree-of-freedom system the natural frequency and damping ratio can be calculated directly from the Random Decrement signature by the logarithmic decrement measurement since the signature is a free vibration decay curve of the system. For multi-degreeof-freedom systems in which the modes are
64
X(t)
Fig. 2 - Extraction of the Randomdec signature
well separated, the natural frequency and damping ratio can be determined by bandpassfiltering the response data about the natural frequency first to yield a single-mode Random Decrement signature of interest. However, if the principal modes of a multi-degree-of.freedom system are closely spaced, they cannot be separated by a filter without distortingthe Random Decrement signature. In such a case curve fitting is introduced to solve this problem. The curve fitting program uses an optimization algorithm[?] which finds the best combination of natural frequencies and dampingratios that minimizes the mean square error between a mathematical function, which describes the response, and the Random Decrement data.
EXPERIMENTAL DETERMINATION OF DAMPING
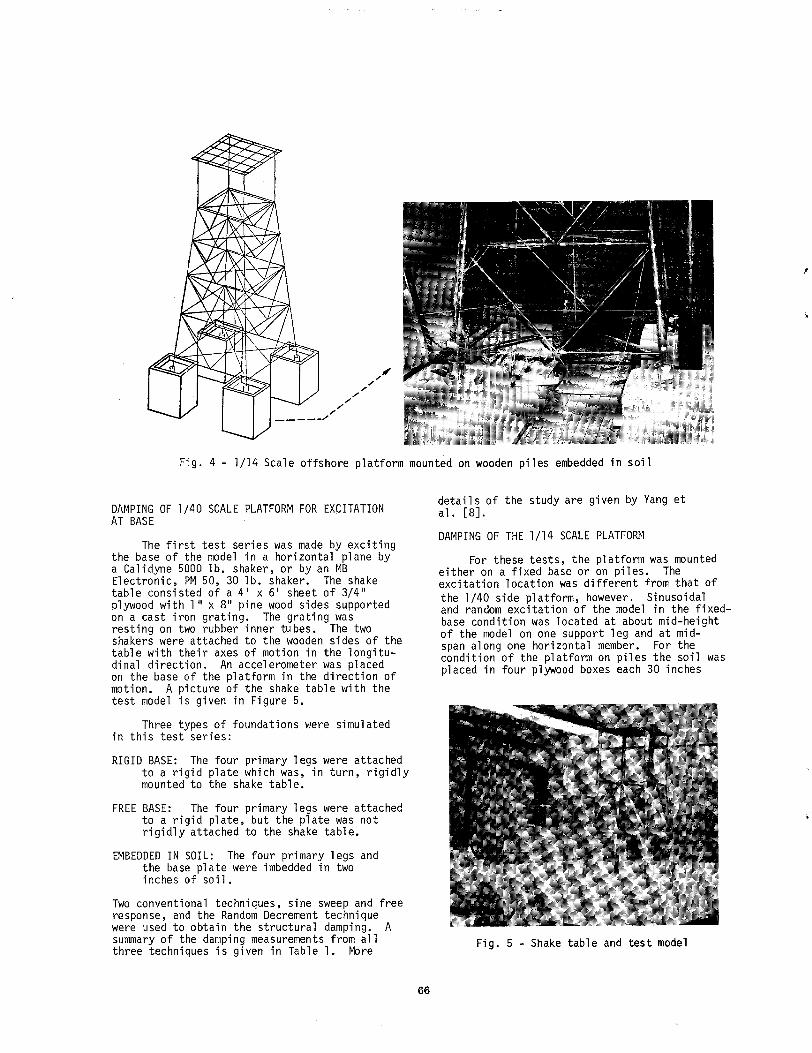
The work performed included the collection and analysis of response data using 1/40 and 1/14 scale steel models of an existing offshore platform from the Gulf of Mexico as shown in Figure 3. These models were selected for ease of handling and testing in the laboratory. The 1/40 scale model is a welded steel frame having four primary legs braced with horizontal and diagonal members. The primary legs of the model have a diameter of 25 mm (.984 inch), and the horizontal and diagonal legs have a diameter of 15 mm (.591 inch).
The 1/14 scale platform model is mounted on piles embedded in 29 inches of sand (See
(a) 1/40 scale platform
(b) 1/14 scale platform
Fig. 3 - Platform models used in studies
Figure 4). The platform consists of five sublevel s with a catwalk on the periphery of the fifth level. The four main columns are twoinch diameter steel tubing, the central column is 9/16 inch diameter, and the cross members are 3/4 inch diameter steel tubes welded to the main columns. The material is ASTM A513-70 carbon steel with a minimum tensile strengthof 80,000 psi.
Various types of foundations were investigated to examine the ability of the Random Decrement technique to determine damping over a wide range of frequencies and type of supports.
65
,,,.~,,,, /,, ____ _./,, /
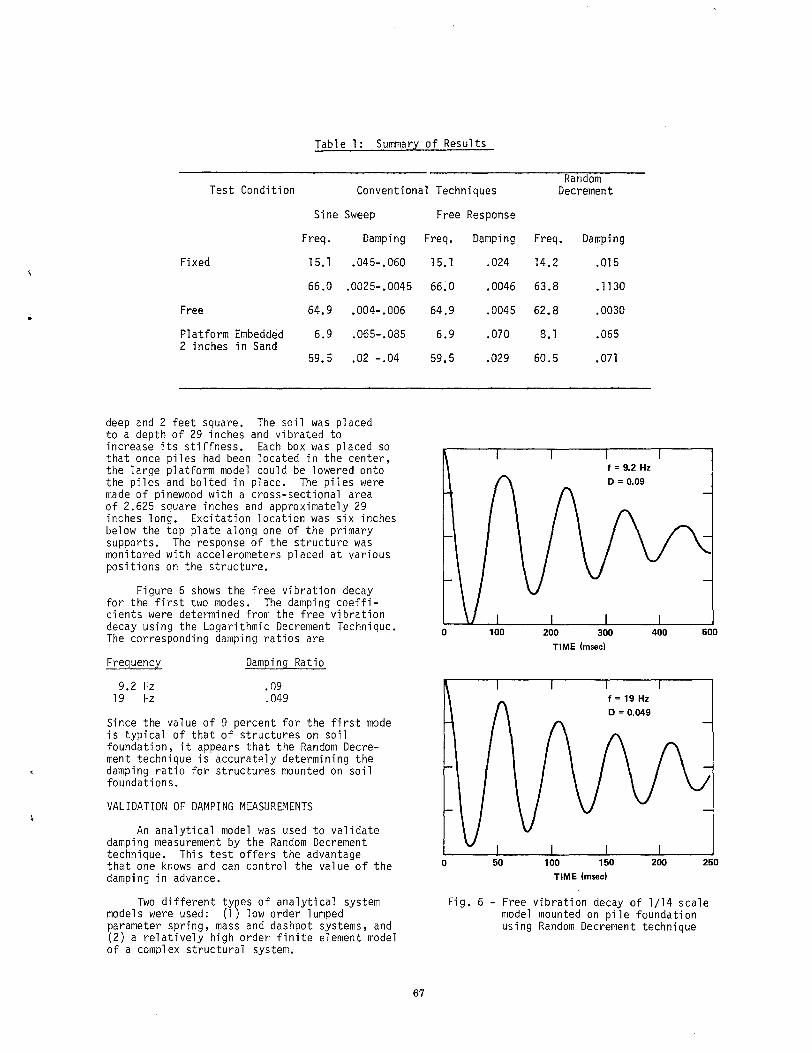
Fig. 4 - 1/14 Scale offshore platform mounted on wooden piles embedded in soil
DAMPING OF 1/40 SCALE PLATFORM FOR EXCITATION AT BASE
The first test series was made by excitingthe base of the model in a horizontal plane bya Calidyne 5000 lb. shaker, or by an MB Electronic, PM 50, 30 lb. shaker. The shake table consisted of a 4' x 6' sheet of 3/4"plywood with l" x 8" pine wood sides supported on a cast iron grating. The grating was resting on two rubber inner tubes. The two shakers were attached to the wooden sides of the table with their axes of motion in the longitudinal direction. An accelerometer was placed on the base of the platform in the direction of motion. A picture of the shake table with the test model is given in Figure 5.
Three types of foundations were simulated in this test series:
RIGID BASE: The four primary legs were attached to a rigid plate which was, in turn, rigidlymounted to the shake table.
FREE BASE: The four primary legs were attached to a rigid plate, but the plate was not rigidly attached to the shake table.
EMBEDDED IN SOIL: The four primary legs and the base plate were imbedded in two inches of soil.
Two conventional techniques, sine sweep and free response, and the Random Decrement technique were used to obtain the structural damping. A summary of the damping measurements from all three techniques is given in Table l. More
details of the study are given by Yang et al. [8].
DAMPING OF THE 1/14 SCALE PLATFORM
For these tests, the platform was mounted either on a fixed base or on piles. The excitation location was different from that of the 1/40 side platform, however. Sinusoida~ and random excitation of the model in the fixedbase condition was located at about mid-height of the model on one support leg and at midspan along one horizontal memb~r. For th~ condition of the platform on piles the soil was placed in four plywood boxes each 30 inches
Fig. 5 - Shake table and test model
66
f = 9.2 Hz
D = 0.09
0 100 200 300 400 500
TIME (msec)
0 50
f = 19 Hz
D = 0.049
100 150 200 250
TIME (msec)
Table 1: Summar.}:'. of Results
Random Test Condition Conventional Techniques Decrement
Sine Sweep Free Response
Freq. Damping Fr-eq. Damping Freq. Damping
Fixed 15. l .045-.060 15. l .024 14.2 .015
66.0 .0025-.0045 66.0 .0046 63.8 .1130
Free 64.9 .004-.006 64.9 .0045 62.8 .0030
Platform Embedded 6.9 .065-.085 6.9 .070 8.1 .065 2 inches in Sand
59. 5 .02 -.04 59.5 .029 60.5 •071
deep and 2 feet square. The soil was placed to a depth of 29 inches and vibrated to increase its stiffness. Each box was placed so that once piles had been located in the center, the large platform model could be lowered onto the piles and bolted in place. The piles were made of pinewood with a cross-sectional area of 2.625 square inches and approximately 29 inches long. Excitation location was six inches below the top plate along one of the primary supports. The response of the structure was monitored with accelerometers placed at various positions on the structure.
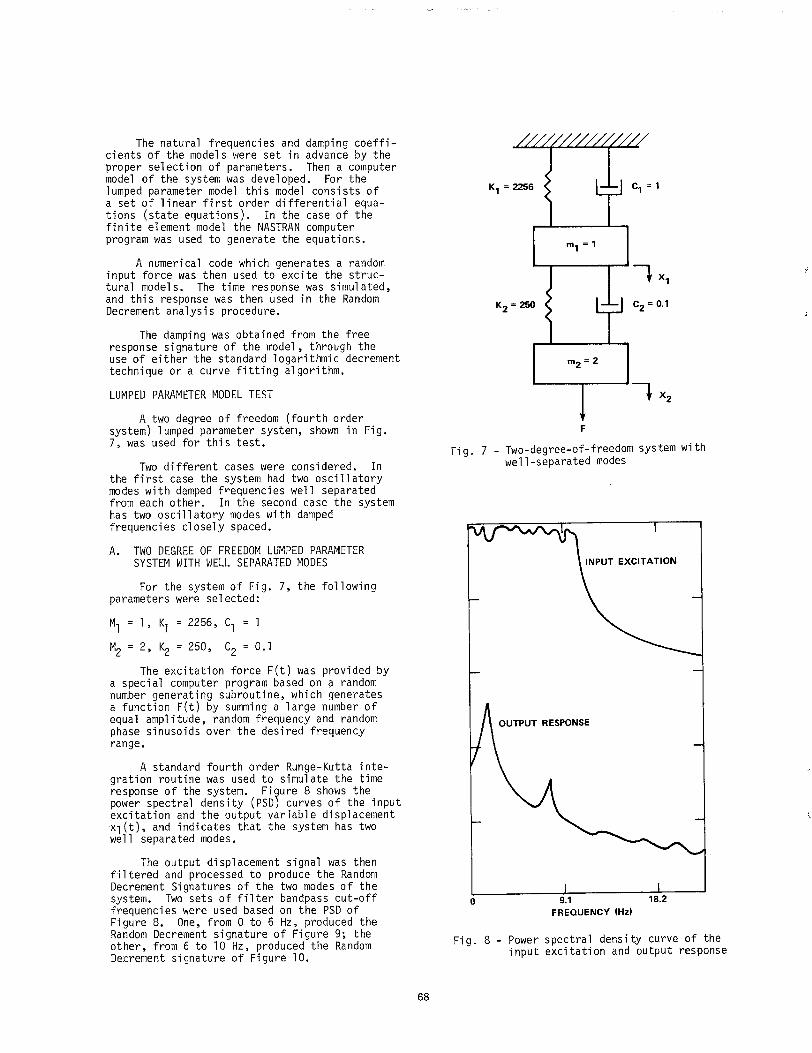
Figure 6 shows the free vibration decay for the first two modes. The damping coeffi cients were determined from the free vibration decay using the Logarithmic Decrement Technique. The corresponding damping ratios are
Freguenq Damping Ratio
9.2 Hz . 09 19 Hz .049
Since the value of 9 percent for the first mode is typical of that of structures on soil foundation, it appears that the Random Decrement technique is accurately determining the damping ratio for structures mounted on soil foundations.
VALIDATION OF DAMPING MEASUREMENTS
An analytical model was used to validate damping measurement by the Random Decrement technique. This test offers the advantage that one knows and can control the value of the damping in advance.
Two different types of analytical system models were used: (l) low order lumped parameter spring, mass and dashpot systems, and (2) a relatively high order finite element model of a complex structural system.
Fig. 6 - Free vibration decay of 1/14 scale model mounted on pile foundation using Random Decrement technique
67
K2 = 250
F
c2 = 0.1
0 9.1 18.2 FREQUENCY (Hzl
OUTPUT RESPONSE
The natural frequencies and damping coefficients of the models were set in advance by the proper selection of parameters. Then a computer model of the system was developed. For the lumped parameter model this model consists of a set of linear first order differential equations (state equations). In the case of the finite element model the NASTRAN computer program was used to generate the equations.
A numerical code which generates a random input force was then used to excite the structural models. The time response was simulated, and this response was then used in the Random Decrement analysis procedure.
The damping was obtained from the free response signature of the model, through the use of either the standard logarithmic decrement technique or a curve fitting algorithm.
LUMPED PARAMETER MODEL TEST
A two degree of freedom (fourth order system) lumped parameter system, shown in Fig. 7, was used for this test.
Two different cases were considered. In the first case the system had two oscillatory modes with damped frequencies well separated from each other. In the second case the system has two oscillatory modes with damped frequencies closely spaced.
A. TWO DEGREE OF FREEDOM LUMPED PARAMETER SYSTEM WITH WELL SEPARATED MODES
For the system of Fig. 7, the following parameters were selected:
M1 1 , Kl = 22 56, c1
M2 2, Kz = 250, c2 0.1
The excitation force F(t) was provided by a special computer program based on a random number generating subroutine, which generates a function F(t) by summing a large number of equal amplitude, random frequency and random phase sinusoids over the desired frequency range.
A standard fourth order Runge-Kutta integration routine was used to simulate the time response of the system. Figure 8 shows the power spectral density (PSD) curves of the input excitation and the output variable displacement x1 (t), and indicates that the system has two well separated modes.
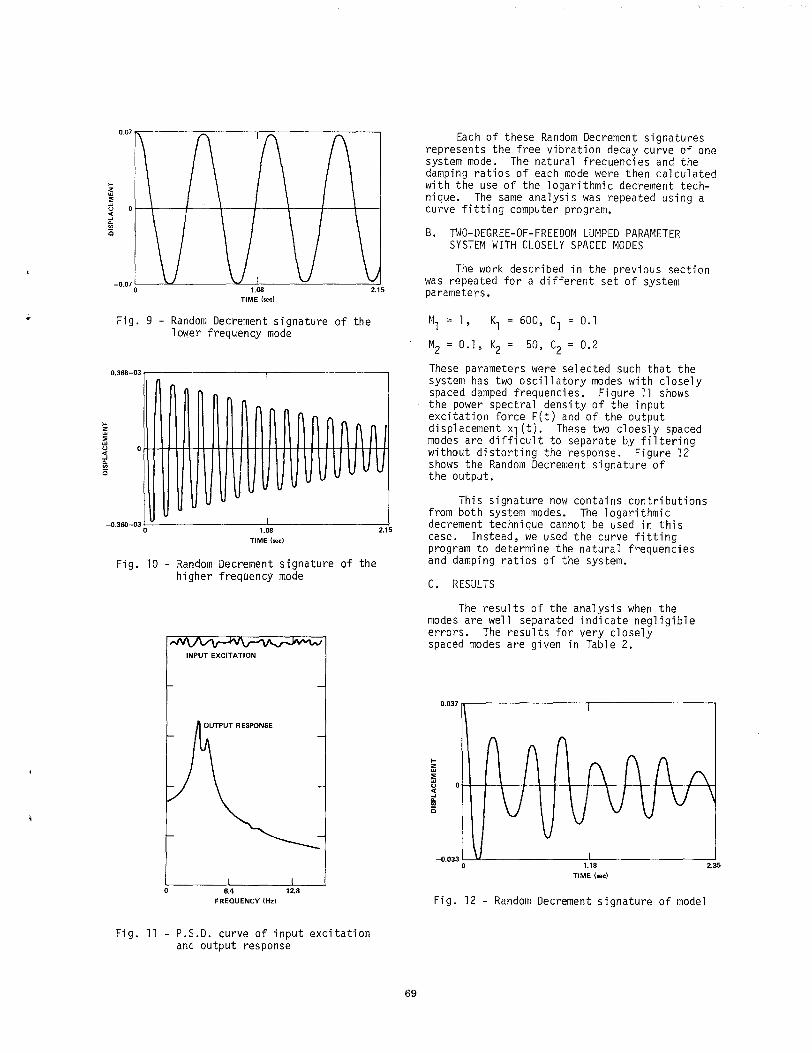
The output displacement signal was then filtered and processed to produce the Random Decrement Signatures of the two modes of the system. Two sets of filter bandpass cut-off frequencies were used based on the PSD of Figure 8. One, from 0 to 6 Hz, produced the Random Decrement signature of Figure 9; the other, from 6 to 10 Hz, produced the Random Decrement signature of Figure 10.
Fig. 7 - Two-degree-of-freedom system with well-separated modes
Fig. 8 - Power spectral density curve of the input excitation and output response
68
0.037 ~--------...,------------,
-0.033 L--"---------'--:----------,--' 0 1.18 2.35
TIME (sec)
INPUT EXCITATION
0 6.4 12.8 FREQUENCY (Hz)
0.368-03 I
'
t '
~
' "
I-0.360-03 0 1.08 2.15
TIME (sec)
1.08 2.15 TIME (sec)
Fig. 9 - Random Decrement signature of the lower frequency mode
Fig. 10 - Random Decrement signature of the higher frequency mode
Fig. 11 - P.S.D. curve of input excitation and output response
Each of these Random Decrement signatures represents the free vibration decay curve of one system mode. The natural frequencies and the damping ratios of each mode were then calculated with the use of the logarithmic decrement technique. The same analysis was repeated using a curve fitting computer program.
B. TWO-DEGREE-OF-FREEDOM LUMPED PARAMETER SYSTEM WITH CLOSELY SPACED MODES
The work described in the previous section was repeated for a different set of system parameters.
M l, Kl 600, 0.11 c1 M 0.1, K 50, 0.22 2 c2 These parameters were selected such that the system has two oscillatory modes with closely spaced damped frequencies. Figure 11 shows the power spectral density of the input excitation force F(t) and of the output displacement x1 (t). These two cloesly spaced modes are difficult to separate by filtering without distorting the response. Figure 12 shows the Random Decrement signature of the output.
This signature now contains contributions from both system modes. The logarithmic decrement technique cannot be used in this case. Instead, we used the curve fitting program to determine the natural frequencies and damping ratios of the system.
C. RESULTS
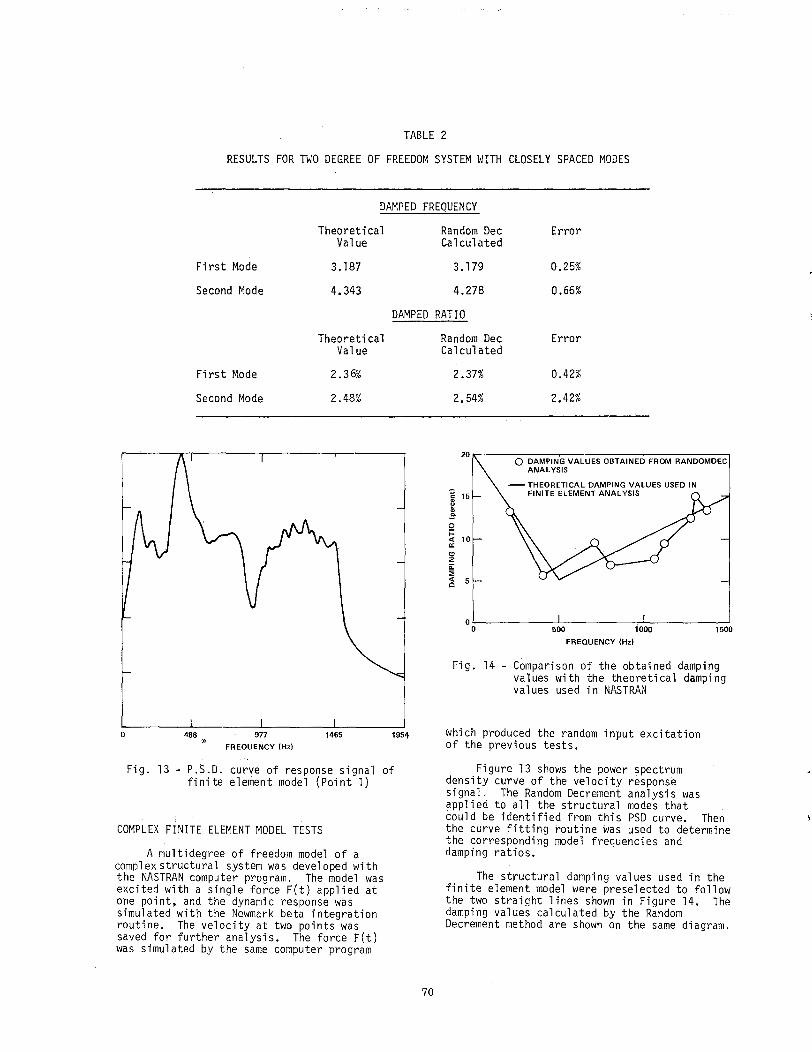
The results of the analysis when the modes are well separated indicate negligible errors. The results for very closely spaced modes are given in Table 2.
Fig. 12 - Random Decrement signature of model
69
20r-~~~~~~~~~~~~~~~~~
Q DAMPING VALUES OBTAINED FROM RANDOMDEC ANALYSIS
-THEORETICAL DAMPING VALUES USED IN FINITE ELEMENT ANAL VSIS~ 15
~ .so i= <t 10 a: <!l 2 0:: :;; ;:§ 5
FREQUENCY (Hz)
TABLE 2
RESULTS FOR TWO DEGREE OF FREEDOM SYSTEM WITH CLOSELY SPACED MODES
DAMPED FREQUENCY
Theoretical Random Dec Error Value Calculated
First Mode 3.187 3.179 0.25%
Second Mode 4.343 4.278 0.66%
DAMPED RATIO
Theoretical Random Dec Error Value Calculated
First Mode 2.36% 2.37% 0.42%
Second Mode 2.48% 2.54% 2.42%
0 488 977 1465 1954 "?!
FREQUENCY (Hz)
Fig. 13 - P.S.D. curve of response signal of finite element model (Point 1)
COMPLEX FINITE ELEMENT MODEL TESTS
A multidegree of freedom model of a complex structural system was developed with the NASTRAN computer program. The model was excited with a single force F(t) applied at one point, and the dynamic response was simulated with the Newmark beta integration routine. The velocity at two points was saved for further analysis. The force F(t) was simulated by the same computer program
Fig. 14 - Comparison of the obtained damping values with the theoretical damping values used in NASTRAN
Which produced the random input excitation of the previous tests.
Figure 13 shows the power spectrum density curve of the velocity response signal. The Random Decrement analysis was applied to all the structural modes that could be identified from this PSD curve. Then the curve fitting routine was used to determine the corresponding model frequencies and damping ratios.
The structural damping values used in the finite element model were preselected to follow the two straight lines shown in Figure 14. The damping values calculated by the Random Decrement method are shown on the same diagram.
70
4
DISCUSSION AND CONCLUSIONS 8. J.C.S. Yang, M.S. Aggour, N. Dagalakis, F.
This study has demonstrated that the Random Decrement technique is a useful method in determining modal frequency and damping of complex structural systems.
The main advantage of this technique is that it does not require the knowledge of the input excitation. This technique may prove particularly useful in determining the modal characteristics of large structures that are difficult to vibrate with man-made excitation, or when it is impossible to measure the exciting force. This technique requires only enough natural excitation to produce measurable response. As long as this excitation is random, the Random Decrement analysis technique may be applied.
ACKNOWLEDGEMENT
The research was supported in part by the Office of Naval Research and the United States Geological Survey. Grant No. N-00014-78-C-0675 and by the David Taylor Naval Ship Research and Development Center, Annapolis, Grant No. N61533-80-M-1520.
REFERENCES
l. H.A. Cole, "Method and Apparatus for Measuring the Damping Characteristics of a Structure", United States Patent No. 3,620,069, 1971.
2. H.A. ColP., "On-Line Failure Detection and Damping Measurement of Aerospace Structures by the Random Decrement Signatures", NASA CR-2205, 1973.
3. D.H. Caldwell. "The Measurement of Damping and the Detection of Damage in Linear and Nonlinear Systems by the Random Decrement Technique", Ph.D. Thesis, University of Maryland, 1978.
4. D.W. Cal dwel 1, "The Measurement of Damping and the Detection of Damage in Structures by the Random Decrement Technique", M.S. Thesis, University of Maryland, 1975.
5. J.C.S. Yanq, D.l•i. Caldwell, "Measurement of Damping-and the Detection of Damages in Structures by the Random Decrement Tee hni que", 46th Shock and Vi brat ion Bulleti n, 1976, pp. 129-136.
6. R. E. Reed, "Analytical Aspects of Randomdec Analysis", AIAA/ASME/ASCE/AHS 20th Structures, Structural Dynamics and Materials Conf., St. Louis, M:>., April 4-6, 1979.
7. R. M. Bennett, and R. N. Desmarais, "Curve Fitting of Aeroelastic Transient Response Data with Exponential Functions", NASA SP-415, Oct. 1975.
Miller, "Damping of an Offshore Platform Model by the Random Decrement Method", Proceedings of the Second ASCE/EMD Specialty Conference, Atlanta, Ga., pp. 819-832' (1981 ) •
71

l I ' t