Embed Size (px)
Citation preview
Vir inia Water Resources Research Center Virginia Polytechnic Institute amp State University
if3Cf Altered Hydrology of
Bulletin 139
the Missouri River and
Its Effects on Floodplain Forest Ecosystems
TD
W Carter Johnson Peggy W Reily L Scott Andrews James F McLellan John A Brophy
201 V57
no139 1982
US EPA - A WBERC LIBRAR Y
11111111111111111111111111111111111111111111111111307011004 8407 7
Altered Hydrology of the Missouri River and
Its Effects on Floodplain Forest Ecosystems
W Carter Johnson Peggy W Reily
L Scott Andrews James F McLellan
Department of Biology Virginia Polytechnic Institute and State University
John A Brophy
Department of Geology North Dakota State University
Fargo North Dakota 58102
The work upon which this report is based was supported in part by funds provided by the United States Department of the Interior
Project B-1 08-VA VP I-VWR RC-BU LL 139
35C
A publication of Virginia Water Resources Research Center
Virginia Polytechnic Institute and State University Blacksburg Virginia 24060-3397
ii
middot v l-7 n I Contents of th is pub l ication do not necessarily reflect
the views and policies of the United States Department of the Interior nor does mention of t rade names
of commercia l products const it ute their endorsement or recommendat ion for use by the United States government
Additional copies of this publication while the supply last s may be obtained f rom
the Virginia Water Resources Research Center Single copies are provided free to persons
and organizations within Virginia For those out-of-state the charge is $6 a copy
if payment accompanies the order or $8 a copy if billing is t o follow
TABLE OF CONTENTS
List of Figures iv
List of Tables v
List of Microfiches vi
Acknowledgments vi
Abst ract 1
Introduction 3
Study Area 5 I Physiography 5
II Geologic History 5 III Geologic Materials of the Trench 6 IV Soils 7 V Stream Hydrology 8
VI Natural Vegetation Dynamics 9
Tree Growth 12 I Methods 12
II Results and Discussion 14 A Environmental Variables 14 B I nter-Period Comparisons of Cumulative Growth 16 C Patterns of Annual Radial Tree Growth 18 D Multiple Regression Analysis 19
Land Use and River Hydrology 23 I Methods 23
A River Meandering Rate bull 23 B Land Use Change 24
II Resu Its and Discussion 25
Tree Population Structure 30 I Methods 30
II Results and Discussion 31
Conclusions 36
iii
Literature Cited 39
Figures 45
Tables 71
Microfiches insert
LIST OF FIGURES
1 Location and Number of Study Sites in North Dakota 47
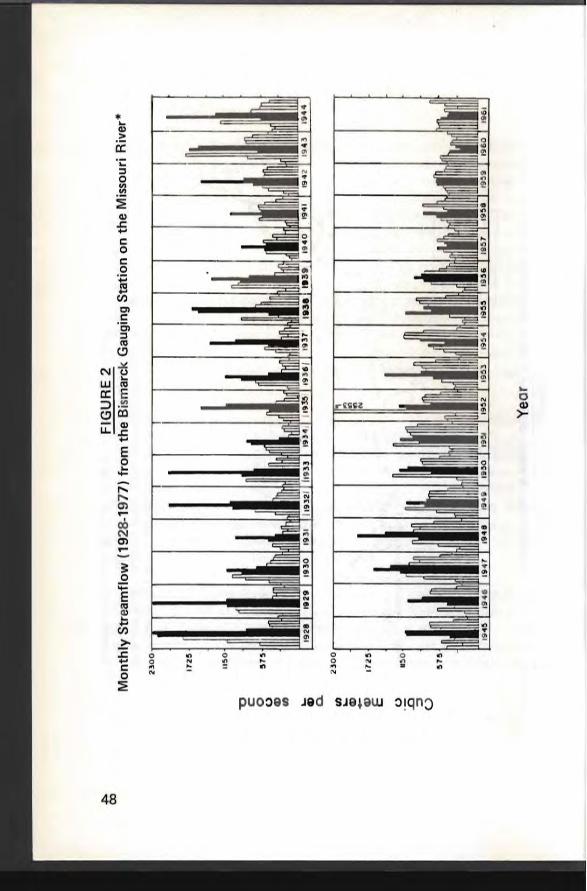
2 Monthly Streamflow (1928-1977) from the Bismarck Gauging Station on the Missouri River 48
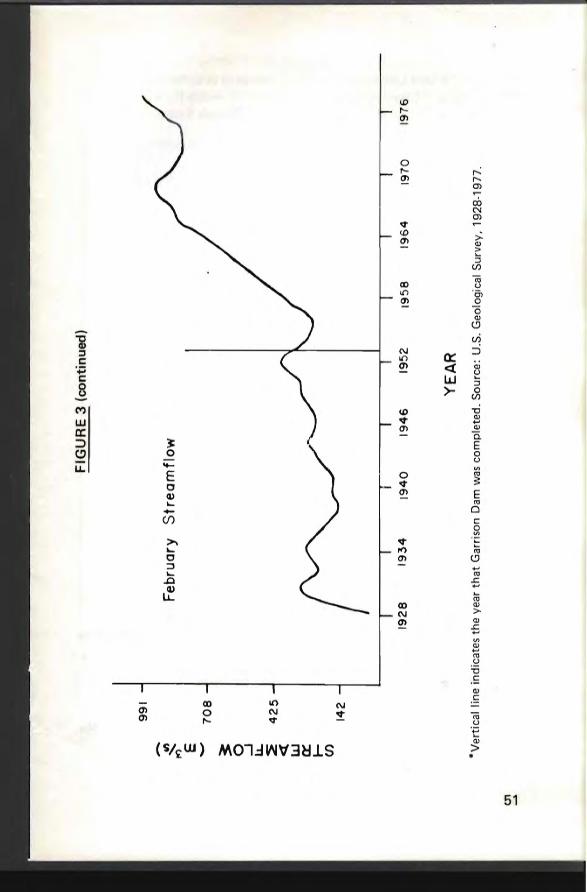
3 Streamflow for June and February 1928-1977 at the Bismarck Gauging Station on the Missouri River 50
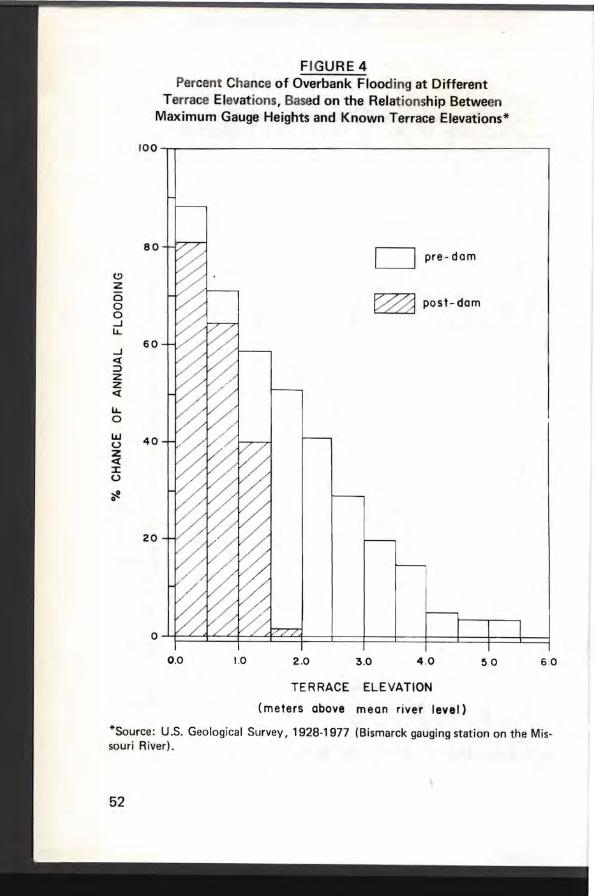
4 Percent Change of Overbank Flooding at Different Terrace Elevations Based on the Relationship Between Maximum Gauge Heights and Known Terrace Elevations 52
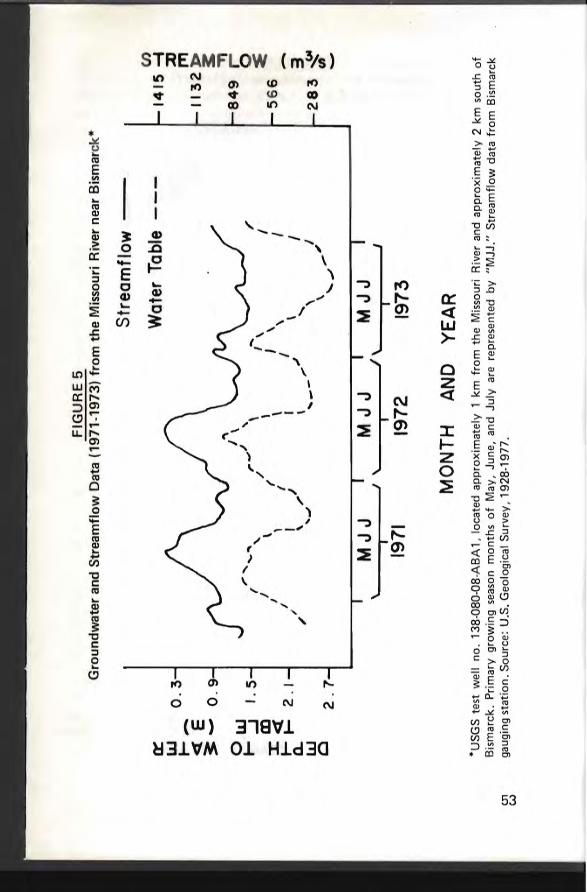
5 Groundwater and Streamflow Data (1971-1973) from the Missouri River near Bismarck 53
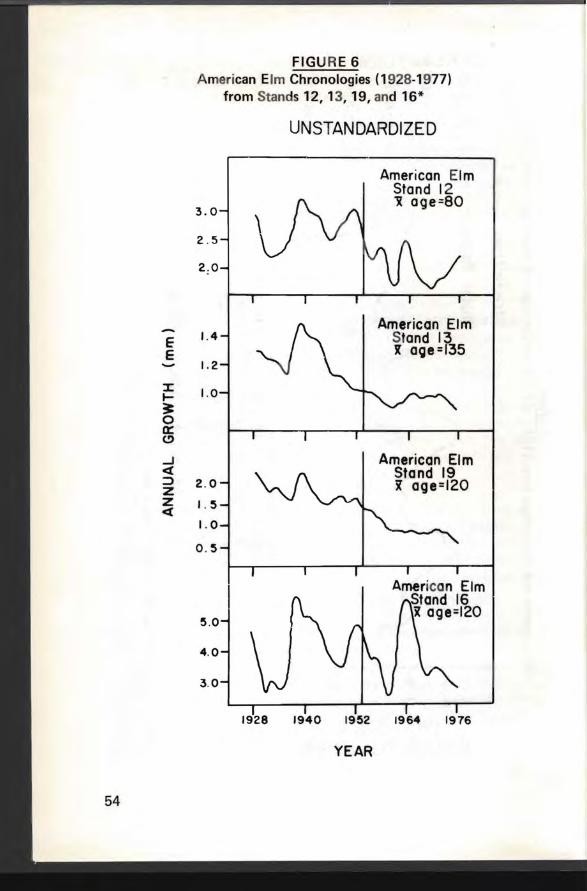
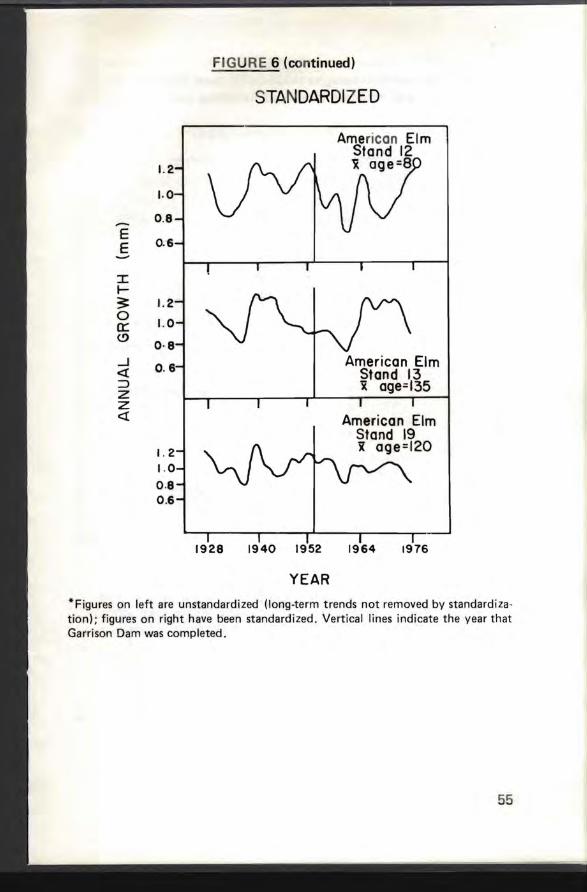
6 American E1m Chronologies (1928-1977) from Stands 12 13 19 and 1654
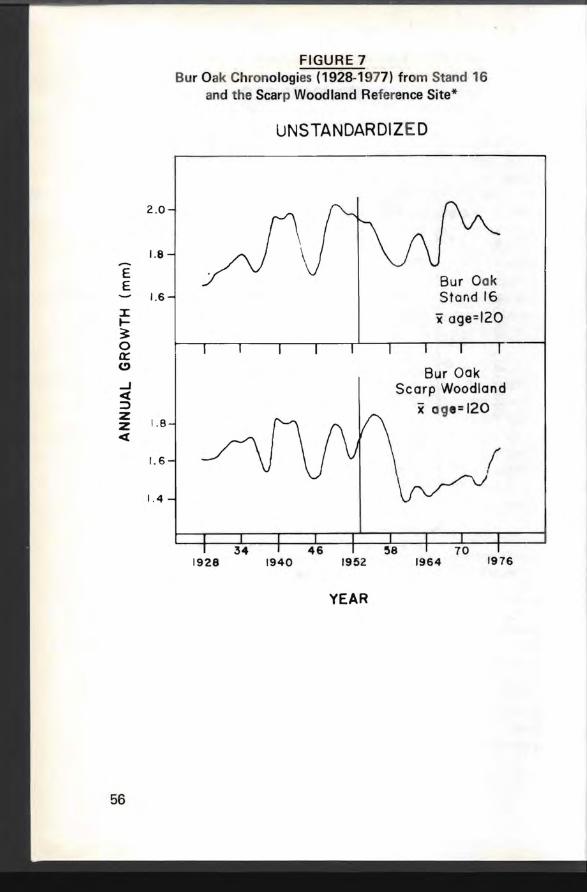
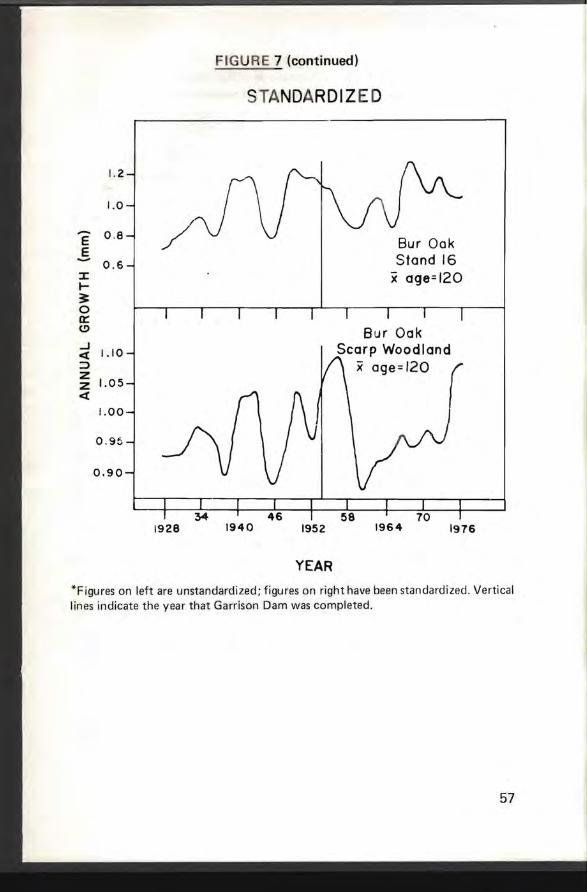
7 Bur Oak Chronologies (1928-1977) from Stand 16 and the Scarp Woodland Reference Site 56
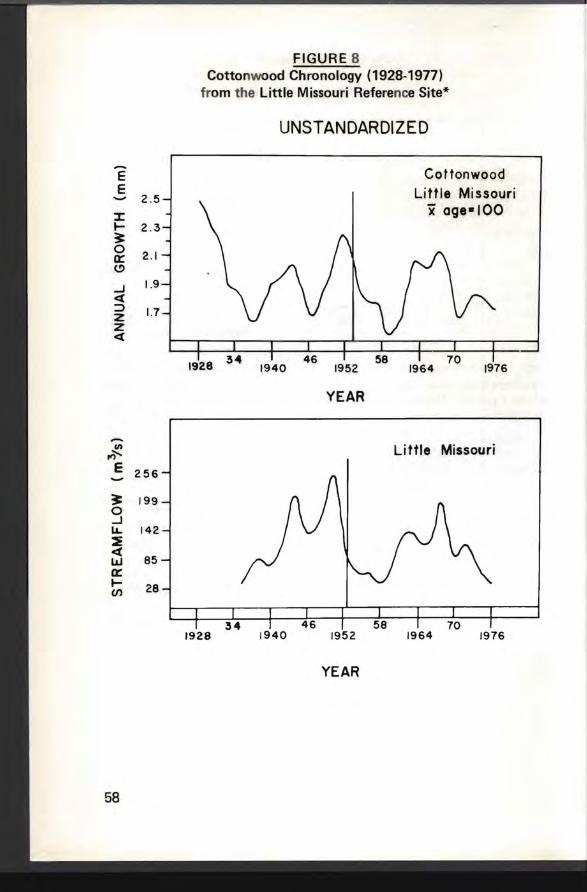
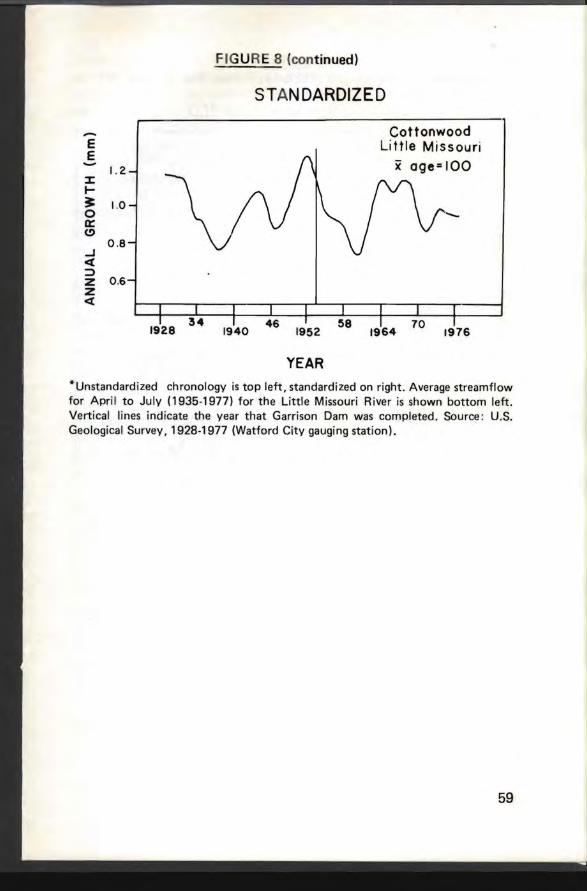
8 Cottonwood Chronology (1928-1977) from the Little Missouri Reference Site 58
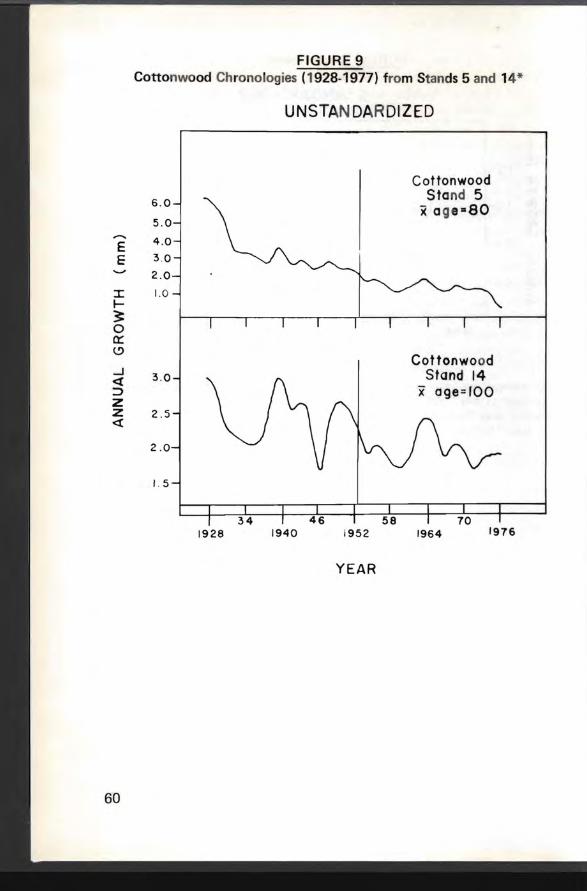
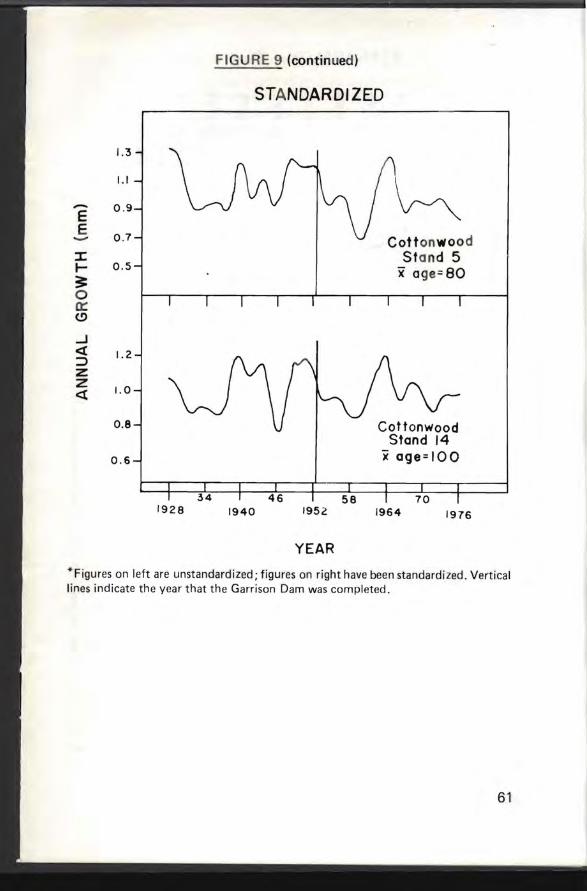
9 Cottonwood Chronologies (1928-1977) from Stands 5 and 14 60
10 Smoothed Plots of Spring AE Versus Year and Spring (May June July) Streamflow Versus Year 62
iv
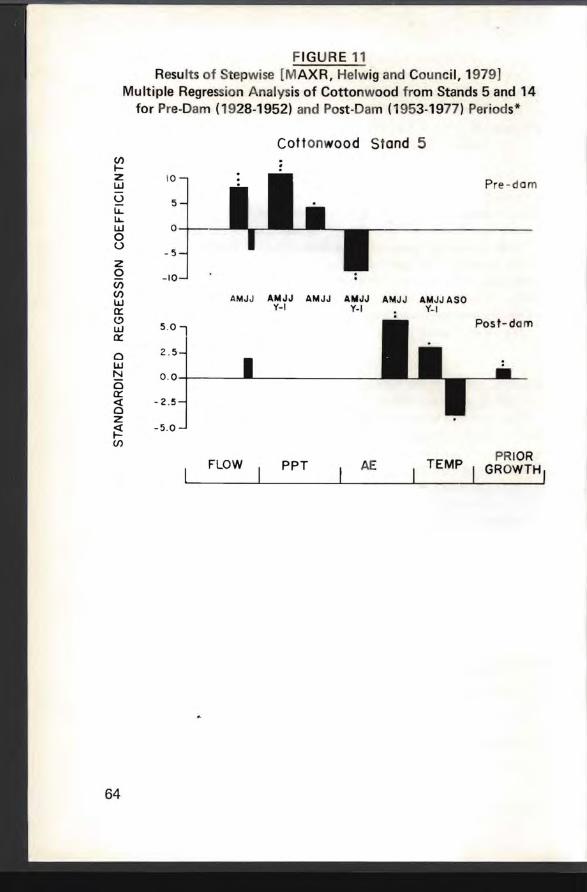
11 Results of Stepwise Mult iple Regression Analysis of Cottonwood from Stands 5 and 14 for Pre-Dam (1928-1952) and Post-Dam (1953-1977) Periods 64
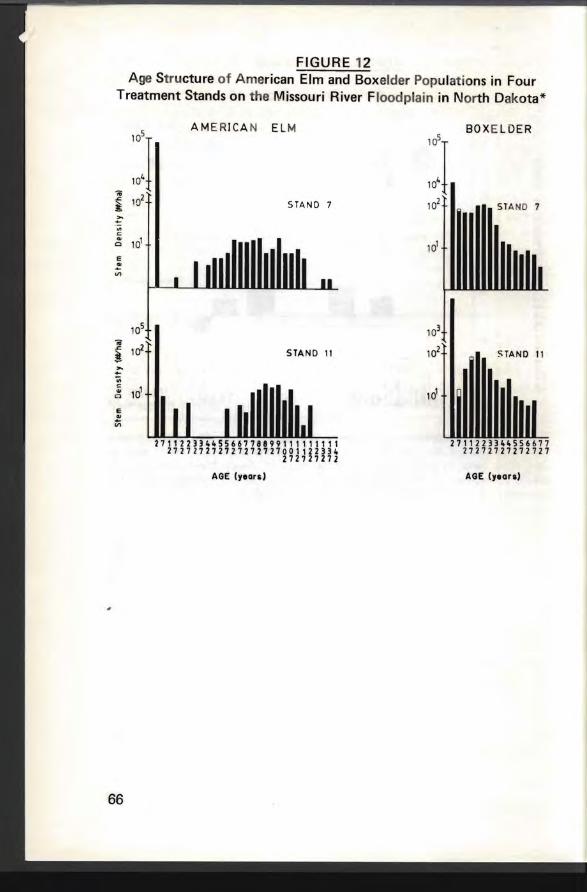
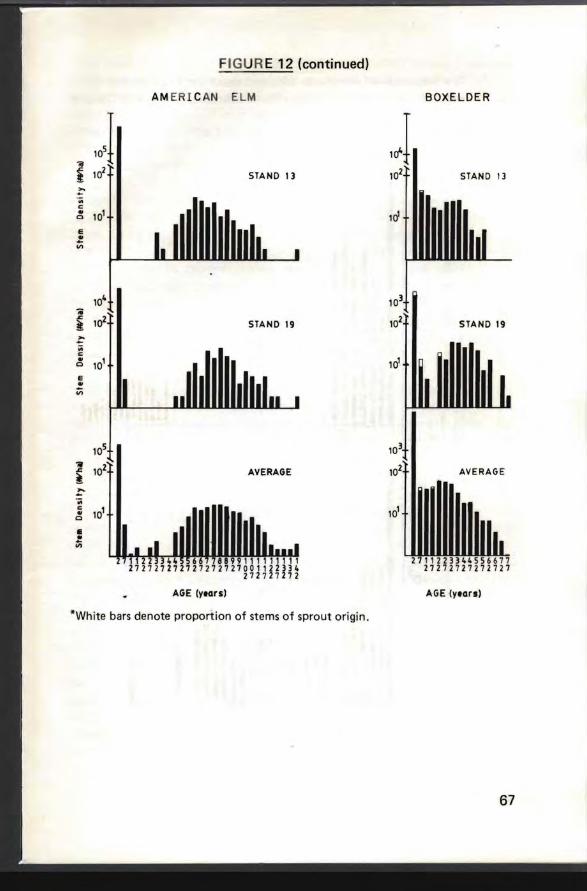
12 Age Structu re of American EIm and Boxelder Popu lations in Four Treatment Stands on the Missouri River Floodplain in North Dakota 66
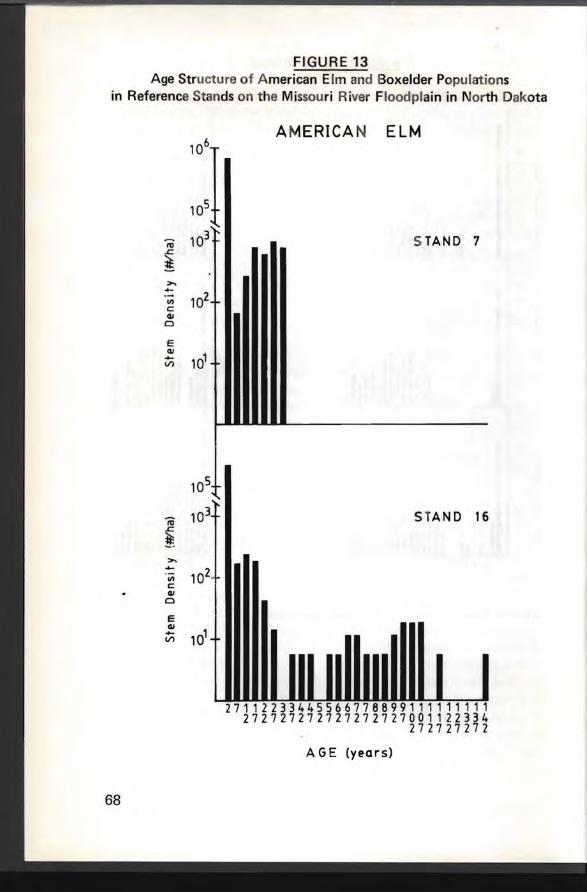
13 Age Structure of American E1m and Boxelder Populations in Reference Stands on the Missouri River Floodplain in North Dakota 68
LIST OF TABLES
1 Precipitation and AE Statistics for Pre-Dam (1935-1954) and Post-Dam (1955-1974) Periods73
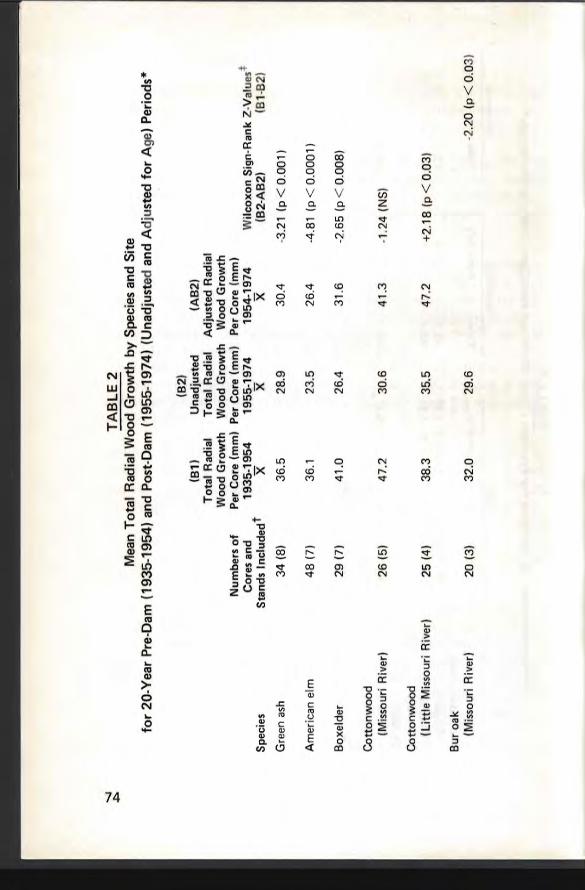
2 Mean Totall Radial Wood Growth by Species and Site for 20-Year Pre-Dam (1935-1954) and Post-Dam (1955-1974) (Unadjusted and Adjusted for Age) Periods 74
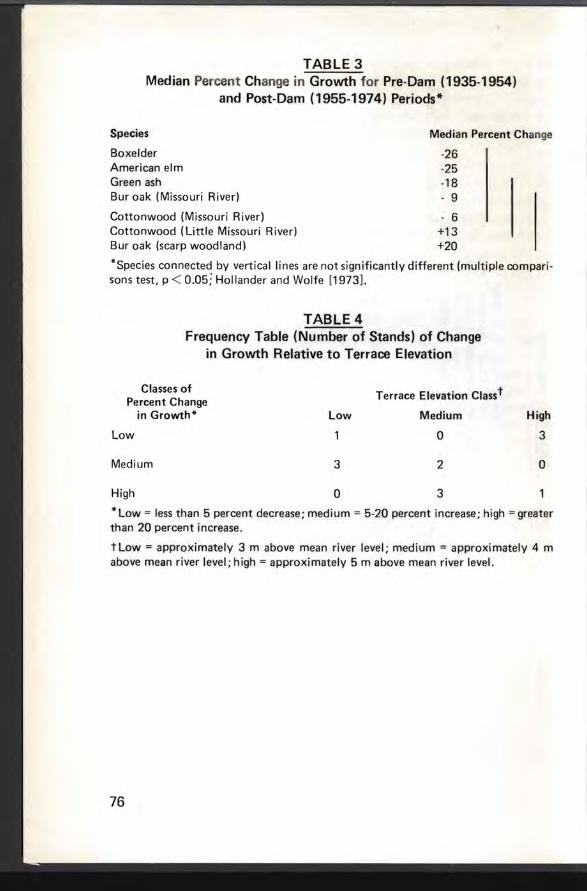
3 Median Percent Change in Growth for Pre-Dam (1935-1954) and Post-Dam (1955-1974) (Adjusted for Age) Periods76
4 Frequency Table (Number of Stands) of Change in Growth Relative to Terrace Elevation 76
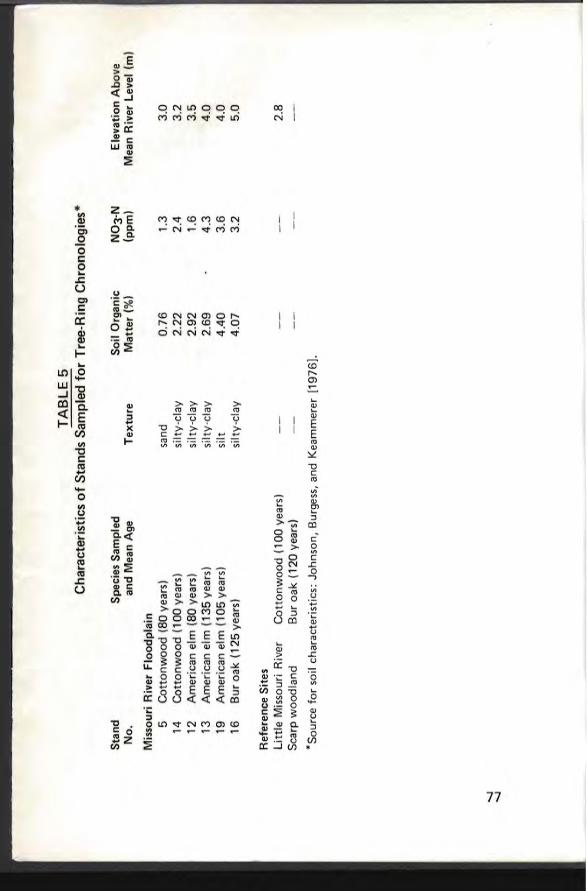
5 Characteristics of Stands Sampled for Tree-R ing Chronologies 77
6 Results of Stepwise Multiple Regression Analysis Using Tree-Ring Index as the Dependent Variable and 15 Independent Variables (Climate Streamflow Previous Years Growth) 78
7 Resu Its from the Modified Regression Model 82
8 Missouri River Erosion and Deposition Rates at Various Time Intervals 82
9 Missouri River Land Use Changes Since Early Settlement 83
v
vi
LIST OF MICROF ICH ES
1 Missou ri River Channel Changes insert
2 Missouri River Floodplain Land Use insert
ACKNOW LEDGMENTS
A number of colleagues assisted us during t he course of the project N Fetcher (Duke Un iversity) T Shar ik (Vi rginia Tech) R Burgess (SUNY-Syracuse) and J Cairns Jr (V irgi nia Tech) We especially t hank R Phipps of the USGS Tree- Ring Lab fo r the use of the Reston Vi rgin ia facilities G Holtzman and the Virginia Tech Stat ist ical Consu lting Lab advised us in statistical matters The North Dakota Historical Society and the North Dakota Water Commission provided maps and other historical information Robert Levis (Cross Ranch) and the Natu re Conservancy were helpful during the field work
Special acknowledgment is made to the following who generously gave their time to a critical review of the manuscript Benjamin L Everitt Division of Water Resources State of Utah Salt Lake City Marjorie M Holland Department of BiologyColiege of New Rochelle New Rochelle New York and Philip A Robertson Department of Botany Southern Illinois University at Carbondaie Acknowledgment is made also to Nancy L Chapman for editorial processing and typesetting and to Gretshychen S Bingman for layout composition
ABSTRACT
It is generally expected that construction and operation of a floodplain protection project will alter a river systems hydro logic regimen But this altered regimen also has been suspected of having major long-term efshyfects on the natural dynamics of riparian ecosystems that remain in gaps between large reservoirs This study confirms that hypothesis by docushymenting some of those impacts in an area between Garrison Dam and Oahe Reservoir on the Missouri River in south-central North Dakota Specifically it examines post-dam changes in river meandering rate floodplain forest composition tree population structure and tree growth rate
Post-dam hydrologic regimen differs markedly from the pre-dam regimen Although precipitation and actual evapotranspiration have changed little since Garrison Dams construction streamflow patterns have changed considerably Large amounts of water are now released for electricity generation in the nongrowing-season months and streamflow for June (mid-growing season) is now lower than June flows recorded in the drought years of the 1930s Post-dam flow patterns therefore are out of phase with the vernal growth pattern typical of floodplain trees Since the dams construction flooding has been eliminated on terraces more than 2 m above mean river level thus reducing moisture and nutrient influx to higher terraces River meandering has all but ceased accretion rates have fallen to 1 percent and erosion rates to 25 percent of pre-dam levels
Data yvere collected at 13 forest stands with in the 130-river-km study area and at two reference sites (one on a stream unaltered by flood conshytrol structures and the other a scarp woodland located above the floodshyplain) Floodplain tree species studied were cottonwood (Populus delshytoides) peach-leaved willow (Salix amygdaloides) boxelder (Acer negunshydo) green ash (Fraxinus pennsylvanica var lanceolata) American e lm (Ulmus americana) and bur oak (Quercus macrocarpa) Evaluation of the data revealed that Garrison Dam and Oahe Reservoir have had significant impact on the areas riparian ecosystem including altering streamflow patterns eliminating much of the flooding and silt deposition that had occurred along the pre-dam river decreasing river meandering rates but widening the river channel causing a decline in radial tree growth in species whose natural sources of moisture have been altered by the dam changing the composition of floodplain forests by preventing regenerashy
2
tion of Populus-Salix forests and lowering seedling survivorsh ip of Ulmus americana and Acer negundo and encouraging t he clearing of f loodplain forests for agr icul ture with improved irrigation opportunities
Resu Its of th is study shou Id have appl ication to f orests on other floodshyplains where the natural hydrologic regimen has been altered by man This research should stimulate further study of riparian ecosystems so that a more general assessment can be made of the ecologica l effects of floodplain protection
Key Words Floodplains Floodplain Protection Floods Forests Dams Riparian Ecosystems Riparian Vegetation Rivers River Meandering Growth Survivor~hip Land Use North Dakota Missouri River
INTRODUCTION
The ecological impacts of constructing impoundments on river systems are many and varied On-site impacts have been t he focus of most reshysearch [Baxter 1977] A few stud ies document t he rap id loss of native riparian habitats wi t hin the impoundment basin (for example Yeager [1949] ) but most eva luate changes in aquat ic organisms and water qualshyity during and after th e f illing of reservoi rs [Kujawa 1974 Ridley and Steele 1975] Off-site impacts of reservoir construction have received little study except for t he r iver env ironment itse lf (water quali ty mon ishytoring fish population dynamics) Potential downstream effects assoshyciated wi th adjacent fl oodp la in ecosystems have been neglected perhaps because (1) the effects are not immediately noticeable and hence less dramatic compared to the changes associated w ith t he filling of resershyvoirs or (2) native riparian ecosystems had on many fl oodplains la rgely been removed for agriculture before dam const ruct ion Recently KosshyIer [1979] noted serious gaps in research concerning wetl andf lood intershyrelationsh ips and the reaction of wetl ands and floodplai ns to stress
Trees on floodplains in semi-arid regions exhibit vernal growth patterns [Brown Lowe and Hausler 1977 Everitt 1980) That is growth occurs earlly in the growing season when water is readi ly avai lable and ceases in mid-summer as moisture is depleted Production and dissemination of seeds also occur in the sp r ing Although moisture is of major importance to the distribution and growth of f loodplain trees the relat ive imporshytance of the various sources of water available is poorly known
Potentiai sources of moisture f or floodpllain trees include overbank fl oodshying groundwater and precipitation (capillary water) Overbank f looding is responsible for much physical damage to f lloodplain trees [McKenzie 1936 Sigafoos 1964] and in humid cII imates may be responsible for the distribution of floodplain species according to their tolerance to flooding [Bedinger 1971 Bell and del Moral 1977 Robertson Weaver and Cavashynaugh 1978] In dry climates however flooding may benefit trees by saturating the rooting zone and raising the water t able just before the onset of growth
The dynamics of riparian woodlands are closely t ied to the dynamics of two physical processes flooding and river meandering Significant changes in the rates of these natural perturbations would be expected to alter the properties of riparian ecosystems and the f lloodplain landshy
3
4
scape Our stu dies indicate that the cessation of fl ood ing and related changes in hydrologic regimen associated with the presence and operashytion of reservoirs are having major and long-term effects on the natural dynamics of remnant riparian ecosystems This conclusion is based on investigations of a protected floodpla1in bounded north and south by two large reservoirs along the upper Missouri River in North Dakota
Johnson Burgess and Keammerer [1976] first noted that major ecologishycal changes in riparian ecosystems along this stretch of the Missouri River had been init iated by reservoir construction The pu rpose of this research was specifically to test three hypotheses [Johnson Burgess and Keamshymerer 1976] through new field research in 1979 and 1980 The three hypotheses were that the altered hydrologic regimen caused by the presshyence and operation of reservoirs had initiated (1) adecline in d iameter growth rate of trees (2) a reduction in river meandering rate and landshyscape composition and diversity and (3) changes in the population strucshyture of several important tree species Tests of the three hypotheses are considered separately in th is report effects on tree growth are considered first meandering rate and forest composition sec~md and population structure third Histork and recent patterns of Iand use change also are analyzed in the second section
STUDY AREA
The study area included floodplain forests along a 130-rriver km portion of the Missouri River Valley located in south-central North Dakota (Figshyure 1) Garrison Dam (Lake Sakakawea) completed in 1953 forms the northern border while the Oahe Reservoir some 10 km south of Bisshymarck forms the southern border Most forests studied were on the floodplain within the study area however reference sites for tree growth analysis were selected in scarp woodlands west of Price North Dakota and along the Little Missouri River in western North Dakota (Figure 1) The climate of the study area is characterized by low humidity and low annual precipitation Mean annual precipitation is 39 cm 70 percent of it occurring during the growing season (approximately May 10 to Sepshytember 27) [Randich and Hatchett 1966]
I Physiography
This segment of the Missouri Valley lies in the Missouri Slope district of the Glaciated Missouri Plateau section of the Great Plains physioshygraphic province [Fenneman 1931 Lemkeand Colton 1958 Clayton 1962] The valley is trench-I ike varying in width from about 1 km to more than 11 km and is cut as much as 170 m below an upland undershylain by glacial drift and Tertiary and Cretaceous bedrock The trench is floored by a broad floodplain bounded locally by terraces The floodshyplain descends from an el1evation of 515 m at Garrison Dam to 494 m at the junction with Oahe Reservoir a total drop of 21 m in about 130 river km giving an overall gradient of about 015 m per km
II Geologic History
This segment of the Missouri Valley did not exist before Quaternary glaciation The preglacial Missouri flowed northeastward from Montana across the northwest corner of North Dakota into Saskatchewan [Lemke et aI 1965] and was diverted into its present course by southwestward advancing -continental ice sheets The timing and sequence of events inshyvolved in this diversion are not completely known
The most recent studies of this problem are by Bluemle [1971] and Carlshyson [1973] both of whom suggest a complex history of diversions by various ice advances which forced the Missouri into a course involving segments of eastward-trending preglacial valleys and new segments cut
5
6
by water diverted across former divides Bluemle shows that the wide segments of the present trench are those that were parts of preglac ial val leys and t he narrow segments are those that were cut by water diverted across divides He also suggests that f inal diverting and assumption of the present cou rse of the Missouri did not occur until late Wisconsinan time less than 15000 years ago
The terraces along the trench were developed as the river incised itsel f below former floodplain levels leaving remnants of those floodplains Some of them are eroded bedrock surfaces mantled with glacial drift and represent f loodplains formed in reoccupied preglacial valley segshyments formed during pre-Wisconsinan glacial diversion [Carlson 1973] Other terraces are underlain by sand and gravel and resulted from glacial valley trains [Brockman et aI 1979]
The defin itive study of Missouri River terraces has not yet been made and various authors who have studied different segments of t he trench disagree on the number of terraces and their historical interpretation Kume and Hanson [1965] recognized four terrace levels in Burleigh County two high outwash terraces and two low alluvial terraces Carlson [1973] working in Mercer and Oliver counties recognized only two tershyraces an upper one that corresponded to the high outwash terraces of Kume and Hanson and a lower one that included their two lower alluvial terraces Carlson believed that the two lower terraces represent the preshydam floodplain
Post-glacial changes in the trench have not been great The floodplain was established and modified by lateral cutting of the meandering river The valley walls have been gullied by new dra inage lines eroding headward into adjacent uplands and by slopewash Wind has piled sand into dunes locally and soils have formed on the various trench sediments
III Geologic Materials of the Trench
The trench walls expose the various materials cut through by the eroding river At the top are glacial sediments (generally thin and locally lacking) including till and lesser amounts of glacio-fluvial sands and gravels loess eolian sand and glacial lake sediments ~Iost of the depth of the t rench is cut in bedrock of early Tertia ry and (in the Bismarck-Mandan area) late Cretaceous age [Kume and Hanson1965 B luemle 1971 Carlson 1973] The Tertiary units include interbedded sands silts clays shales
and lignite beds belonging to the Paleocene Cannonbal l Slope Bullion Creek and Sentinel Butte formations The late Cretaceous beds are mudstones sandy sh ales sandstones and I ign ites of the Hell Creek f orshymation
Most of the high terraces are underlain by sand and gravel and are loessshycovered in some areas but some are underlain by drift-mantl ed bedrock [Kume and Hanson 1965 Carlson 1973] The low terraces essentially the modern pre-dam floodplain are underlain by recent alluvium includshying flood overbank deposits channel deposits and natural levee deposits Overbank silts and clays compose about 90 percent of these sediments with sand and gravel of channel and levee deposits composing about 10 percent [B luemle 1971] The thickness of this Holocene component may be as much as 35 m or more but it is often difficult to distinguish from similar glacial sediments upon which it rests
IV Soils
Soils of the Missouri trench have been described in county soil surveys of McLean County [Brockman et aI 1979] Olliver County [Weiser 1975] Mercer County [Wilhelm 1978] and Burleigh County [Stout et aI 1974] The floodplain soils that support the forests of the study area are Entisols of the Typic Ustifluvent or Typic Fluvaquept subgroups The Havrelon series dominates generally comprising 50 to 75 percent of the floodplain soils It is formed from loamy alluvium on the slightly higher elevations and is calcareous and well drained It has moderate permeability high available water capacity medium natural fertility and low organic matter
Areas of sandy alluvium such as natural levees and inter-channel islands are occupied mainly by the Banks series which has moderately rapid permeability low available water capacity low natural fertility and low organic matter Clayey alluvium of floodplain depressions (mainly oxshybows) is occupied mainly by the Lallie series which has slow permeabilshyity high available water capacity low natural fertility and low organic matter
Floodplain soil profiles tend to have thin greyish A horizons no B horishyzons and C horizons that vary somewhat in texture because of alluvial stratification All horizons tend to be mildly to moderately aikaline
7
8
V Stream Hydrology
The filling of Lake Sakakawea began in November 1953 At that time the natural hydrologic regimen was replaced by a controlled-release regishymen and the river began a series of adjustments to this alteration
Two major alterations in downstream regimen could be expected to result from damming (1) reduction of peak annual flow (mean annual flood) because of impoundment of excess runoff and (2) reduction of sediment load because of sediment deposition in the reservoir from upshystream
Continuous daily discharge records from 1928 to present recorded at the US Geological Survey Gauging Station No 06342500 at Bismarck (120 km downstream from the dam) permit a comparison of the preshydam and post-dam discharge These data show no significant change in overall discharge The mean of daily discharge readings for 25 pre-dam years (water years 1928-29 to 1952-53) is 1999 cms compared to 2204 cms for 25 post-dam years (water years 1954-55 through 1978-79) This decrease in discharge because of the initial filling of the reservoir (1953shy1963) was offset by the low discharges resulting from the dry climate of the 1930s
Seasonality of discharge has changed considerably The pre-dam (1928shy1952) pattern of monthly streamflow shows peak flow occurring from Apri l to July and minimum flow occurring from December to March (Figure 2) The sharp peaks in streamflow in the spring and early sumshymer in the pre-dam period are largely absent after 1953 Overall peak flow now occurs in February and March instead of April May and June and minimum flow occurs mainly in May and September instead of January and February
Seasonal flow rates are especially different for the months of June and February (Figure 3) June streamflow in the drought years of the 1930s was much higher than June streamflow since completion of the dam Extrapolating from gauge height the spring water table on the average would be considerably lower since 1953 and the late-summer water table would perhaps be higher Therefore the period of peak flow is now out of phase with the vernal growth pattern typical of floodplain trees
Mean annual low flow (mean of the lowest mean daily discharge readings
over a number of years) has been increased by abou t 155 percent Mean annual low fl ow for the 25 pre-dam years was 405 cms compared to 1 032 cms for the 25 post-dam years The minimum annual low flow for the 25 pre-dam years was 167 cms (January 1940) compared to 372 cms (March 1955) in the 25 post-dam years an increase of about 122 percent
I n addition to these changes in flow changes in the sed iment load could also be expected Both suspended load and bed load from upstream are trapped in the reservoir Thus the water released into the trench below the dam is essentially sediment-free and able to acquire a new load from materials available in the trench Unfortunately data are not available to compare pre-dam and post-dam sediment loads
Overbank flooding is the element most obviously missing from the postshydam floodplain environment Flooding now occurs on only the lowest terraces in part as a result of local ice jams in the spring Flooding above the 2-m terrace elevation has been eliminated (Figure 4) In the past the 3-m elevation was flooded on the average of once in 35 years and the 4-m elevation approx imately once in 6 years Terrace elevations of the stands sampled ranged from 3 to 5 m above mean river level The highest stand was flooded on the average of once in 25 years Because of ice jams in the pre-dam period the above frequencies are probably low for some locales Landowners report higher flood frequencies (25 percent or greater)
The mean annual flood (mean of the highest mean daily discharge readshyings over a number of years) has been reduced by about 68 percent Mean annual flood for the 25 pre-dam years was 11064 cms compared to 3554 cms for the 25 post-dam years The maximum annual flood (highest mean daily discharge reading) for the 25-year pre-dam period was 33736 cms (April 1952) compared to 6394 (July 1975) lin the 25 post-dam years a reduction of 81 percent
VI Natural Vegetation Dynamics
The predominant vegetation of the region is mixed grass prairie [Kuchshyler 1964] Small pockets of scarp woodland occur in protected upland ravines but the most extensive forests occur on the floodplain Clearing for agricu Itu re has reduced these forests to about 50 percent of their original extent Floodplain tree species include cottonwood (Populus
9
10
deltoides) peach-leaved willow (Salix amygdaloides) boxelder (A cer negundo) green ash (Fraxinus pennsylvanica var lanceolata) A merican elm (Ulmus americana) and bur oak (Quercus macrocarpa)
Most of t he worlds fl oodp lains have been formed by the effects of deposition and overbank flow [Wolman and Leopold 1957] Deposit ion as we as erosion is dependent upon lateral m igration of the river across the floodp lain A s the r iver deposit s alluv ium on the inside of a meanshyder it erodes mater ial from the opposite bankline Overbank flow usually results from heavy spring rains combined wi th rapid snow melt Downshycutting by t he river and upbuilding of the terrace from alluvial deposishytion during f loods eventually leaves some terraces well above the active floodp lain Leopold Wol man and Miller [1964] referred to such r iver terraces as t he abandoned f loodpla in
Vegetation patterns correspond to the dynamics of deposition and eroshysion Lateral movement of the river in it iates a dynamic series of vegetashytion events As t he river meanders it erodes away estab lished banks often covered w ith fo rest vegetation in different stages of devel opment However fully exposed alluvium deposited in the inside of river curves is prime habitat fo r the establ ishment of t ree seedl ings of pioneer species (for example cottonwood peach-leaved w i llow) Of the six tree species occurr ing on the floodplain only cottonwood and willow germinate and persist under t hese conditions Cottonwood and willow are classic pioshyneer species the seeds of neither species germinate under a forest canopy or in light gaps This illustrates the importance of point bar deposition by the meander ing river in maintaining cottonwood-willow commu nities as an important and integral component of the floodplain ecosystem
If cottonwood-wi now communities remain uneroded forest s of these tree species will develop Should they be missed by t he meandering river for centuries however the overstory will be replaced by admixtures of green ash boxelder Amer ican elm and bur oak through natural successhysion Thus there is a strong positive correlation between terrace elevati on and forest successional stage Higher terraces that have escaped erosion and were exposed to fewer floods of less intensity are more likely to contain vegetation of advanced successional stages
The cessation of floodi ng and a decline in the meandering rate would have at least two major consequences (1) reduce the amount of subshystrate (freshly deposited alluvium) for the regeneration of new cott onshy
wood-wil low forests and (2) allow a greater proportion of existing forests to age and change type t hrough natura l succession The net effect would be to reduce the land area of cottonwood-will ow forest now the most extensive forest t ype in favor of forests of ash boxelder elm and oak Old cottonwood-wil low forests exhib it the greatest tree species diversity [Johnson Burgess and Keammerer 1976] and have the greatest r ichness and density of breeding birds [H ibbard 1972] T he major forest communities also exhibit divergent understory species mineral cycl ing patterns and fau na [ Kroodsma 1970 Hibbard 1972 Keammerer 1972 Keammerer Johnson and Burgess 1975]
11
12
T REE GROWTH
Research to t est t he hypothesis that alteration of the hydrologic regimen was responsible for decreased tree growth had three components First we examined the degree to which environmental variables important to tree growth had changed from pre-dam to post-dam periods Second cumulative growth of trees was compared during two 20-year periods to determine pre-dam and post-dam growth patterns Third tree-ring chronologies were constructed and the growth patterns related statisshytically to a series of environmental variables using multiple regression procedu res
I Methods
Th irteen forest stands (Figure 1) were selected for tree core sampl i ng The stands included a range of vegetation and physiographic conditions and showed little or no sign of current or past disturbance One refershyence site was located along the Little Missouri River in western Nort h Dakota with in the Theodore Roosevelt National Park (Figure 1) The Little Missouri is a free-flowing stream whose flow patterns have not been altered by flood control structures Cottonwood and willow preshydominate although green ash boxelder and American elm occur as well The Little Missouri is a much smaller river than the Missouri average flows are 1733 for the Little Missouri and 6409 cms for the Missouri [US Geological Survey 1928-1977]
A second reference site was a scarp woodland [Wells 1965] located above the floodplain (Figure 1) Vegetation was similar in composition to that of the mesic terraces of the Missouri River with bur oak green ash American elm and boxelder the dominant tree species Scarp woodland trees rely exclusively on precipitation which is concentrated in local ravines Growth of these trees should more closely ref lect patshy
terns of precipitation than floodplain trees
The reference sites were selected because they were similar to the M1isshysouri River floodplain sites in vegetation and general climatic conditions but had not undergone any major environmental modifications between pre- and post -dam periods The term reference was used rather than IIcontrol because a number of small differences existed between refershyence and treatment sites (for example 39 cm mean annual precipitation for the Missouri 37 cm for the Little Missouri)
Trees were selected for sampling if they were at least 70 years old and displayed no sign s of disease or decay Also trees were exc luded if a nearby competitor had d ied Tree cores were collected using an increshyment borer and were dried mounted and surfaced A number of cores were initially measu red with a dendrochronometer to establish a system of cross-dating to facilitate accurate measurement of the remaining samshyples [Stokes and Smi ley 1968]
Three 20-year increments of growth (two pre-dam periods 1915-1934 1935-1954 one post-dam period 1955-1974) were measured for aU cores Because diameter growth of trees usually decreases with age it was necessary to adjust the measurements of the post-dam growth to compare them to groyvth during the immediate pre-dam period when trees were younger Standard dendrochronological procedures to correct for aging [F ritts 1976] were not su itable here as none discrim inates beshytween decrease in growth due to age and decrease due to long-term envishyronmental changes (for example altered river hydrology) low-frequency trends are removed
To correct for age we adjusted (increased) postdam growth by multishyplying it by the proportional change in growth that occurred between the two pre-dam periods The proportional change or multiplier was the quotient calculated by dividing growth during the first pre-dam period (1915-1934) by growth during the second (1935-1954) Cores that showed a growth decline between the pre-dam periods were adjusted in the above manner for all species except bur oak (henceforth referred to as adjusted for age) For example a core with 50 mm and 40 mm growth respectively during the first and second pre-dam periods would result in a multiplier of 125 Therefore the growth during the post-dam period say 20 mm would be adjusted to 25 mm Our method thus assumes a uniform rate of decline in growth with age Bur oak was not adjusted because most cores were from old trees that showed small inshycreases not decreases in growth between the two pre-dam periods
Finally 90 of the cores used above in the inter-period comparisons were selected for multiple regression analysis to examine year-to-year variation in growth in relation to environment Cores were selected from stands for wh ich there were at least 8 cores per species from trees at least 80 years old except for elm in stand 16 where only 3 cores were available The number of cores per species for the Missouri River floodshyplain was 24 for cottonwood 30 for elm and 12 for oak with 8 for
13
14
cottonwood on the Little Missouri and 16 for oak in the scarp wood land
Individual ri ng w idt hs were measured for a 50-year period (1928-1 977) for each core Measurements were standard ized (converted to indices) by fitting a polynomia l curve to the data and then dividing each ring width by the corresponding curve value (henceforth referred to as standshyardized) In this way long-term trends in growth were removed (for example due to senescence) and year-to-year variation was emphasized [F ritts 1976] The computer program used in the standardization proshycedure was developed at the Laboratory of Tree- Ring Research in Tuscon Arizona [Fritts Mosimann and Botroff 1969] and adapted for use by the US Geologlical Survey Tree-R ing Laboratory in Reston Virshygin ia R ing-widtl indices for all cores from a stand were averaged by species to construct chronologies three of cottonwood (including one from the Little Missouri) two of oak (including one from the scarp woodland) and three of elm
Precipitation data were from the US Weather Bureau station at Bisshymarck To integrate temperature (energy) and moisture actual evaposhytranspiration (AE) was also calculated [Thornthwaite and Mather 1957] and used as an independent varlable in growth correlations AE was calshyculated assuming 25 cm of available water per 15 cm of soil a surface rooting zone of 12 m and equal water availability between field capacshyity and permanent wilting point (-15 bars) [Johnson Burgess and Keamshymerer 1976]
II Results and Discussion
A Environmental Variables
Primary environmental variables potentially important to tree growth during the two periods included precipitation groundwater overbank flooding and soils To determine whether low precipitation might have been responsible for the decrease in tree growth during the post-dam period Johnson Burgess and Keammerer [1976] compared average anshynual precipitation and AE for two 15-year periods 1940-1954 and 1955shy1969 They found a slight decrease in both parameters in the post-dam period We also found a slight decrease in average annual precipitation and AE for two 20-year periods and for the primary growing season months (April May June and July) although the means were not sigshynificantly different (p lt 075) and the minimum values were much
smaller in t he pre-dam period (Table 1) I t is unl ikel y that the small average decrease in AE and precipi tat ion cou ld have caused a large deshycline in growth in the post -dam period A s w ill be shown later t ree growth of one reference si te actuall y increased signi ficant ly du r ing t he post-dam period
Depth to the water table ranges from near zero to 9 m in t he study area [Greenman 1953] Water table depth changes seasonally in response t o periods of aquifer recharge and discharge (Figure 5) Rech arge occurs mainly in early spring from lateral movement of water f rom t he Missouri River at high stages (bank storage) subsurface flow from ad jacent bedshyrock above the floodplain and percolation of soil grav itational water from precipitation an9 runoff Discharge from the aquifer occurs mainly in the summer as a result of transpiration flow to the Missouri River at low stages and irrigation pumping [Randich and Hatchett 1966] The water table on terraces adjacent to rivers can respond rapidly to changes in river stage however the response decreases w it h increasing distance from the channel [Weist 1971 Grannemann and Sharp 1979]
Current re leases from Garrison Dam are related primarily to generation of electricity Peak demands occur during the coldest months and to a lesser extent the warmest months [US Army Corps of Engineers 1980] although the seasonal pattern is highly variable It is di ff icult to detershymine the effect of changing river gauge height (flow) on water table depths at all distances from the river although the greatest changes probably have occurred nearest the river channel Unfortunately we can find no data on pre-dam water table depths and seasonal fl uctuashytions in the study area and can only speculate as to p re-dam water table conditions However irrigation and seasonal fluctuation in river stage have noticeably ch anged since completion of Garrison Dam There has been increasing use of aquifers for pumped irrigation water which would have lowered the water table during the growing season
Several stands were located in areas fl100ded periodically from concenshytrated upland ru noff The highest of these (stand 16) was situated at the edge of the floodplain adjacent to the bedrock terrace Three ravines draining a large upland area empt ied into the stand According to local reports it is flooded most years in the spring at times of snow melt and heavy precipitation Moisture conditions for this stand were markedly different from terraces of similar elevation that received no concentrated runoff Not only did vegetation composition of t h is stand differ from
15
16
dr ier terraces but as will be shown later t ree growth showed distinctly different pat t erns
Soils in the study area are alluvial in or igin and high in textural va rishyability not only between but also within stands Past f loods deposited lenses of sands si Its and clays varyi ng in th ickness th roughout the floodshyplain With the cessation of flooding the deposition of silt on terraces and accompanying nutrient enrichment have been eliminated Yet the cessation of flooding also aldows for a build-up of organic matter on tershyraces where it was previously scoured and removed by flood waters Changes in soi ll characteristilcs as a result of flood cessation are most Iikely not of as immediate importance to tree growth as the alteration in the hydrologi~ regimen However soils could have had an effect on the growth response of a tree to altered moisture conditions
B I nter-Perilod Comparisons of Cumulative Growth
Average cumulative growth of trees was compared between the immeshydiate pre-dam (1935-1954) and post-dam (1955-1974) periods AI species on the Missouri River floodplain decreased in growth in the postshydam period (Table 2) comparing post-dam growth (adjusted for age) to growth in the pre-dam period The trends are very similar to those of Johnson Burgess and Keammerer [1976] even though they are based on different sets of tree cores In contrast post-dam growth of oak (unshyadjusted) and cottonwood at the reference sites was greater than growth during the pre-dam period Application of the Wilcoxon sign-rank test [Holllander and Wolfe 1973] to growth during the pre- and post-dam periods showed that the decreases on the Missouri River floodplain were statisticaHy significant for all species except cottonwood the cottonshywood reference site showed a statistically significant increase but the increase in oak growth in the scarp woodland was not significant (Table 2)
In a separate analysis the percent change between pre- and post-dam (adjusted for age) periods was computed for each core and the median percent change computed for each species (Table 3) Percentages ranged from about a 25 percent decline to a 20 percent increase Largest declines were for boxelder elm and ash with moderate decreases for cottonshywood and bur oak on the Missouri River floodplain Comparatively large increases were exhibited by the two reference sites Based on results from a mUltiple comparisons test [Hollander and Wolfe 1973] the growth
decli nes for boxelder and elm were sign ifican t ly different from the inshycreases on th e reference sites and ash was significantly different from oak o n t he scarp woodland reference site Diffe rences am ong species o n t he Missouri River f loodplain were not stat isti cally sign ificant nor were the differences for bur oak a nd cottonwood between floodp lai n and reference sites
An atte mpt was made to rel ate changes in growth to va rious envi ronshymental condi t ions such as soil cha racteri st ics and topog rap h ic positio n (for example elevation above mean river leve l) Percent change in growth of all spec ies was determ ined for each stand The stands were then ran ked into lowmediumhigh classes of change This procedure was repeated for all three so il characte ristics (ava ilable water capacity organic matter and soil texture) and for stand elevation Frequency tables were conshystructed for growth classes and the classes for each env ironmental varishyable No trends were found for t he so il character istics Terrace e levat ion versus percent change in growth however showed a dist inct trend (Table 4) On the uppermost terraces growth was little changed on t he middle terraces growth showed the greatest decline and on the lowest terraces growth decreased moderately
Trees on low terraces (2-3 m above mean river level ) which were flooded most frequently in the pre-dam period and are rarely flooded now were expected to have shown the largest decrease in growth However growth decreased more on the middle terraces than on the lower terraces The relative depth to the water table on a terrace may be more important for growth than flood frequency Trees on low terraces are closer to the water table and to the river and could more effectively utilize pulses of high flow (for example after heavy precipitat ion) compared to those of the upper terraces
Tree growth on high terraces showed the least amount of change beshytween the periods Although the water ta ble was likely at greater depths on these terraces and only occasionally accessible to t rees (even in the pre-dam period) most of these stands received additional moisture from concentrated upland runoff Many trees here showed increases not decreases in growth For example stand 16 reportedly was flooded most years by runoff from upland ravines E 1m in stand 16 showed no change in growth between pre- and post-dam periods compared to a deshycrease of 25 percent over the study area Runoff is clearly important to the growth of trees on high terraces adjacent ot the uplands
17
18
T he observed decrease in the growth of elm was not caused by Dutch elm disease since trees in the Bismarck area have been infected onl y in t he last several years Johnson Burgess and Keammerer [1976] observed a decrease in growt h of trees sampled in 1969 before the disease had spread to centra l Nort h Dakota The elms that we sampled 10 years after their study sh owed t he same magnitude of decl ine in growt h
C Patterns of A nnual Radial Tree Growth
Cottonwood elm and oak were se lected fo r multivariate analysis to examine year-to-year variation in growth in relation to environment These species were selected because each is representative of a different stage lin the development of the floodplain forest and therefore may be affected differently by the altered hydrologic regimen Also patterns of pre- and post-dam growth differed among these species Percent change in the growth of bur oak and cotton was the smallest between the two periods whereas elm showed a large decrease in growth in all but the most mesic stands
Seven tree-r ing chronologies were constructed from stands along the Missouri (two from stand 16) and two chronologies were constructed for the reference sites (Table 5) Both unstandardized and standardized chronologies were constructed and smoothed [Tukey 1977 3RSSH 3RSSH3] for each site except for elm in stand 16 where just the unstandshyardized chronology was used (Figures 6 through 9) Low growth during the 1930s (especially 1936-1937) in 1946 and in 1961 was common to all of the tree-ring chronologies These were periods of low spring streamflow and AE (Figure 10) During the pre-dam period most chronshyologies exhibited two peaks in growth between 1938 and 1944 I n the post-dam period most chronologies showed peak growth in 1965 coinshycident with high spring AE Thus t here was a close correspondence beshytween macroclimate and the growth of floodplain trees
But perhaps of more significance were the years 1952 and 1955 In April of 1952 one of the largest floods on record for the Missouri River inunshydated the entire floodplain It was however a year of low AE All chronshyologies except those from stand 13 (Figure 6) and the scarp woodland showed high growth in 1952 This illustrates the compensating effect that overbank flooding had on tree growth in years of low AE In 1955 t he reverse conditions prevailed spri ng AE was high while streamflow (releases from the dam) was low Growth in 1955 for all chronologies
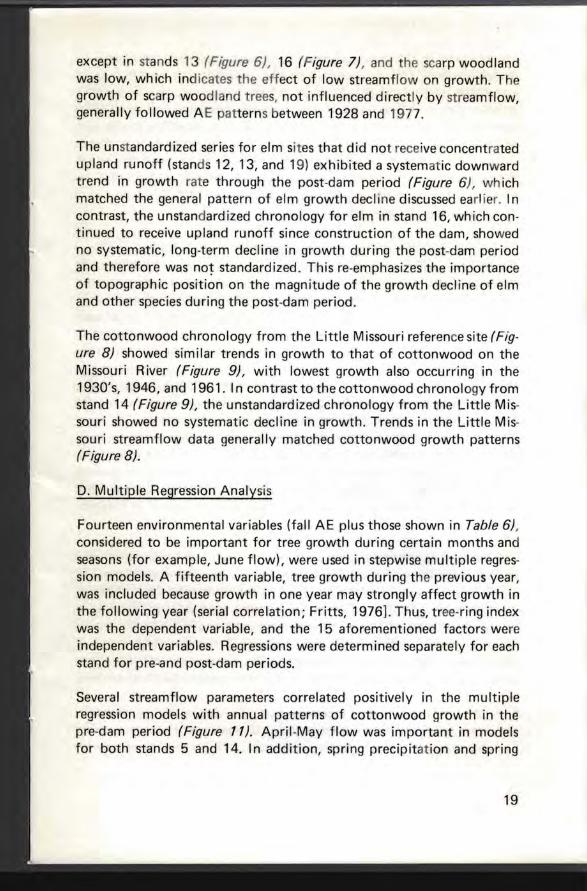
except in stands 13 (Figure 6) 16 (Figure 7) and t he scarp woodland was low wh ich ind icates the effect of low streamflow on growth The growth of scarp woodland trees not influenced directly by streamflow generally followed A E patterns between 1928 and 1977
The unstandardized series for elm sites that did not receive concentrated upland runoff (stands 12 13 and 19) exhibited a systemat ic downward trend in growth rate through the post-dam period (Figure 6) wh ich matched the general pattern of elm growth decline discussed ear lier In contrast the unstandardized chronology for elm in stand 16 which conshytinued to receive upland runoff since construction of the dam showed no systematic long-term decline in growth during the post-dam period and therefore was no~ standardized This re-emphasizes the importance of topographic position on the magnitude of the growth decline of elm and other species during the post-dam period
The cottonwood chronology from the Little Missouri reference site (Figshyure 8) showed similar trends in growth to that of cottonwood on the Missouri River (Figure 9) with lowest growth also occurring in the 1930s 1946 and 1961 I n contrast to the cottonwood chronology from stand 14 (Figure 9) the unstandardized chronology from the Little Misshysouri showed no systematic decl ine in growth Trends in the Little M isshysouri streamflow data generally matched cottonwood growth patterns (Figure 8)
D Multiple Regression Analysis
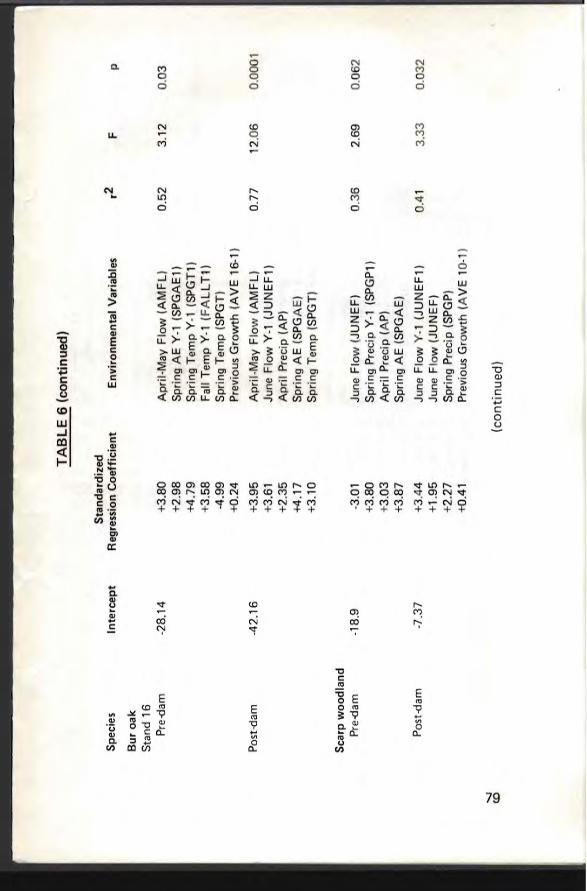
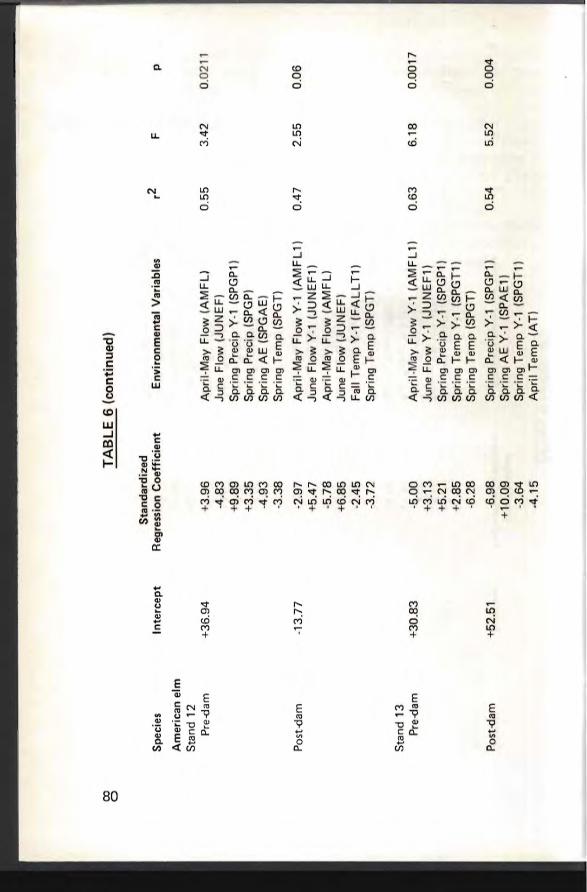
Fourteen environmental variables (fall AE plus those shown in Table 6) considered to be important for tree growth during certain months and seasons (for example June flow) were used in stepwise multiple regresshysion models A fifteenth variable tree growth during the previous year was included because growth in one year may strongly affect growth in the following year (serial correlation Fritts 1976] Thus tree-ring index was the dependent variable and the 15 aforementioned factors were independent variables Regressions were determined separately for each stand for pre-and post-dam periods
Several streamflow parameters correlated positively in the mUltiple regression models with annual patterns of cottonwood growth in the pre-dam period (Figure 11) Apri l-May flow was important in models for both stands 5 and 14 In addition spring precipitat ion and spring
19
20
preCIpitation in the previous year (Y-1) were posi t ively correlated in models for both stands The ana lysis also indicated that growth may be suppressed when April precipitation is high (negatively correlated with growth Figure 11) because it may pro long saturated so il condi tions (low oxygen) after March -April flood s High June fl ow (negatively corshyrelated Figure 11) flooded low terraces near the river such as stands 5 and 14 or ra ised the water table excessively during this important growing season month and therefore may have been responsible for deshycreased stem growth by lim iting root oxygenation High June f lows were common in the pre-dam period (Figure 2)
Correlation patterns for cottonwood shifted markedl y from streamflow and spring precipitation in the pre-dam period to AE and temperature in the post-dam period (Figure 11) Of the streamflow parameters only June flow was positively correlated with growth (stand 5) in the post-dam period Thus very high flows in June in the pre-dam period could have reduced overall growth but h igh flows within a much lower range in the post-dam period (Table 3) could have been benef icial Growth in both stands was positively correlated with spring AE and spring tempershyature in the previous year and negatively correlated with fal l temperature in the previous year Low fall temperature in the previous year would have resulted in greater soil moisture storage over the w inter The negashytive correlation with spring precipitation in stand 14 appears to be spurshyious a situation not uncommon in the application of multivariate techshyniques to ecological data [Pitt and Heady 1978] Overall the general lack of correlation with streamf1low suggests that moisture su pplied by the river is now less important to the growth of cottonwood in t he postshydam period
Cottonwood presence has been used as an indicator of a high water t able since it tends to be phreatophytic [Meinzer 1927 ] Hayes and Stoeckler [1935] classified cottonwood as a shallow-rooted t ree laquo 2 m) however its roots may ex tend to much greater depths especially on floodplains where the process of terrace development continually buries the trunks of trees [Everitt 1968] Older cottonwoods that grow on terraces 3 m above mean river level yet that germinated on low terraces just above river level may have roots that extend to the original depth of rooting
With the alteration in flow regimen especially during the growing seashyson there has l ikely been a corresponding change in depth to water table For example with a lower spring water table the roots of trees may no
longer extend to the capillary fri nge thus growth might depend more on surface soil moisture from rai nfa ll than on groundwater T his shift in response from one source of moisture to another indicated t hat the dam has indirect ly affected cottonwood water rel ations Cottonwood was perhaps less affected by altered streamflow t han other species beshycause of its deep root system proximity to the river where the water table was most accessible and possession of a root system more responshysive to changes in water su pply
Most positive correlations with bur oak growth in stand 16 during the pre-dam period were with variables of the previous year including growth temperature and AE (Table 6) Regression coefficients for the post-dam period in c r~ased considerably positive correlations were for current year precipitation AE and temperature in the spring The reshygression coefficients for the scarp woodland models were low (036 041) and are therefore not discussed With respect to the observed positive correlation between oak growth and streamflow variables it should be recalled that post-dam streamflow was mainly a reflection of releases from the dam However high streamflow events were also caused lin part by runoff from short heavy rains or rapid snowmelt The frequency of these events may have been independent of total monthly precipitation For example total monthly precipitation does not indicate whether there were many days of light rain or a few days of heavy rain with the rest of the month dry For these reasons the relationsh ip between oak growth and streamflow was only correlative and not causal
Regression coefficients for American elm were higher than the scarp woodland oak values but still considerably less than those of the cottonshywood models Patterns of correlation shown by at least two of the three elm stands during the pre-dam period were positive correlation with April-May flow and spring precipitation in the previous year and negative corre1lation with spring temperature The patterns are decidedly different in the post-dam period April-May flow was negatively correlated and June flow was positively correlated with growth However there was little pattern among stands with respect to the numerous other variables included in the regression models The correlation pattern for elm apshypears to be high Iy variable among sites and between periods and little can be generalized from the multiple regression analyses
The chronologies were also used in a reduced model growth = sp ring AE and spring streamflow in a linear modeling procedure [Helwig and
21
22
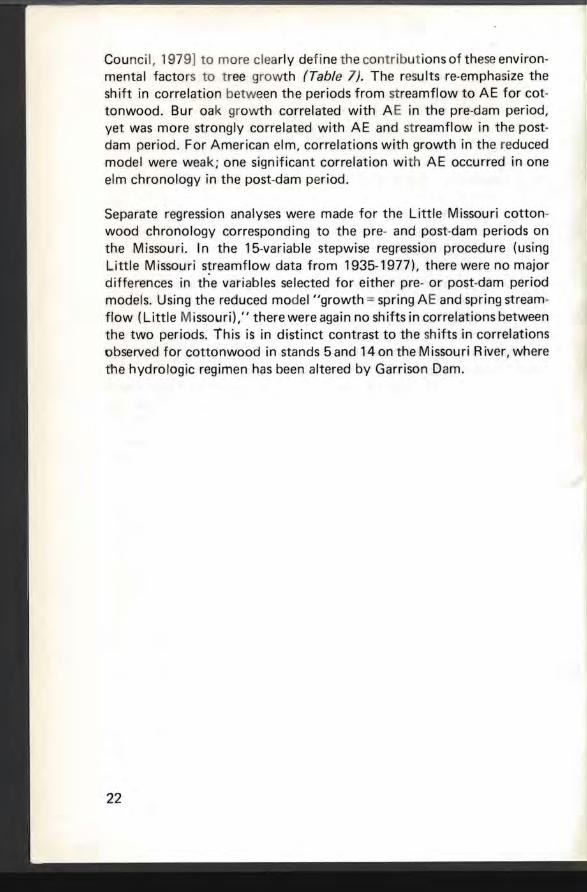
Counci l 1979] to more clea rly defi ne the contribut ions of these environshymental facto rs to t ree growth (Table 7) The results re-emphasize the shift in correlation between the periods from streamflow to AE for cotshytonwood Bur oak growth correlated with A E in the pre-dam period yet was more strongly correlated with AE and streamflow in the postshydam period For American ellm correlations with growth in the reduced model were weak one significant correlation wi th AE occurred in one elm chronology in the post-dam period
Separate regression analyses were made for the Little Missouri cottonshywood chronology corresponding to the pre- and post-dam periods on the Missouri In the 15-variable stepwise regression procedure (using Little M issou ri s~reamflow data from 1935-1977) there were no major differences in the variables selected for either pre- or post-dam period models Using the reduced model growth = spring A E and spring streamshyflow (Little M issouri) there were again no shifts in correlations between the two periods This is in distinct contrast to the shifts lin correlations observed for cottonwood in stands 5 and 14 on the Missou ri River where the hydrologic regimen has been altered by Garrison Dam
LAND USE AND RIVE R HYDROLOGY
Johnson Burgess and Keammerer [1976] expected that because of reshyduced spring flooding (lower peak flows) and bank stabil ization the rate of river meandering had slowed since construct ion of the dam T his hypothesis is evaluated in this section by analyzing historic and present river meandering rates Also in this section the rates and di rections of land use change since initial settlement are analyzed and di scussed Such an analysis is important since current vegetation patterns are closely linked to past land use
I Methods
A River Meandering Rate
Historic and recent rates of meandering of the Missouri River were detershymined from channel change maps within the study area Positions of the river over time were transferred to a common base map at a scale of 124000 Several sources of linformation were used General Land Office summary records describe the position of the river channel f rom 1872 to 1881 An additional set of archival maps was prepared in 1891 by the Missouri River Commission The aerial photographic record of the study area began in 1938 Photographs recording channel position were available for several time periods up to the present Additional informashytion on pre-dam channel position was available from maps prepared by the US Army Corps of Engineers in 1945
The pre-dam meandering rate was determined from channel positions in 1881 1891 and 1945 From the common base maps an electronic digitizer was used to determine the amount of eroded and deposited land in each time interval This total area was divided by the number of years in the time interval to compute average annual erosion and deposishytion for the period Post-dam meandering rate was determined by comshyparing the position of the river compiled from US Geological Survey photographs (1969) to current (1979) channel as shown by Corps of Engineers photographs Meandering rates were independently determined for the period 1938-1972 by the Corps wh ich used aerial photogramshymetric techniques and range line surveys
Also field surveys were conducted to assist in mapping historic ch annel positions Five to 10 cottonwood trees on each terrace level on several
23
24
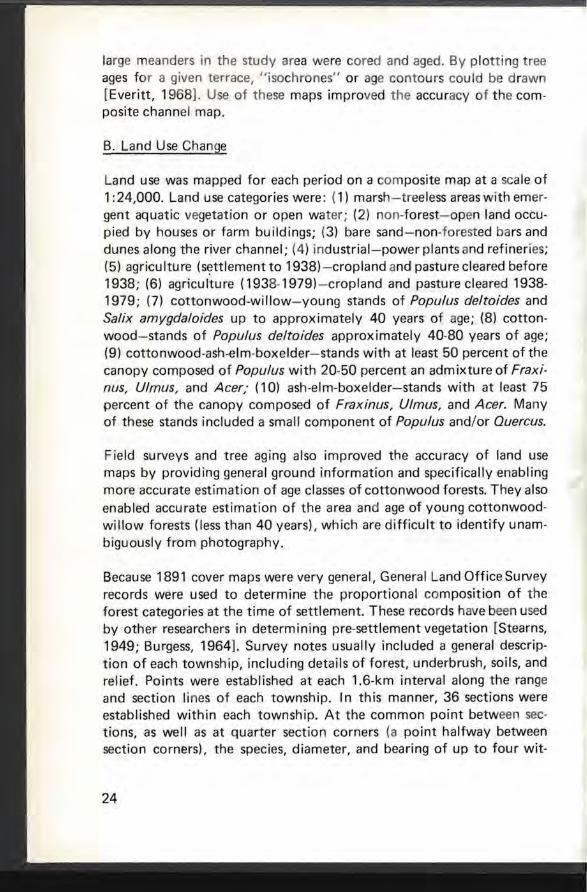
large meanders in the study area were cored and aged By p lotting t ree ages fo r a given terrace isochro nes or age contours could be d rawn [Everitt 1968] Use of these maps improved the accuracy of th e comshyposite channel map
B Land Use Change
Land use was mapped for each period on a com posite map at a scale of 1 24000 Land use categories were (1) marsh-treeless areas with emershygent aquatic vegetation or open water (2) non-forest - o pen land occushypied by houses or farm buildings (3) bare sand-non-forest ed ba rs and dunes along the river channel (4) ind ustrial-power plants and refineries (5) agriculture (s~tt l ement to 1938)-cropland and pasture cleared before 1938 (6) agriculture (1938- 1979) - cropland and pasture cleared 1938shy1979 (7) cottonwood-willow-young stands of Populus deltoides and Salix amygdaloides up to approximately 40 years of age (8) cottonshywood-stands of Populus deltoides approximately 40-80 years of age (9) cottonwood-ash-elm-boxelder-stands with at least 50 percent of the canopy composed of Populus with 20-50 percent an admixture of Fraxishynus Ulmus and Acer (10) ash-elm-boxelder-stands with at least 75 percent of the canopy composed of Fraxinus Ulmus and Acer Many of these stands included a small component of Populus andor Quercus
Field surveys and tree aging also improved the accuracy of land use maps by providing general ground information and specifically enabling more accurate estimation of age classes of cottonwood forests They also enabled accurate estimation of the area and age of young cottonwoodshywi lIow forests (less than 40 years) wh ich are di fficu It to identify u namshybiguously from photography
Because 1891 cover maps were very general General Land Office Survey records were used to determine the proportional composition of the forest categories at the time of settlement These reco rds have been used by other researchers in determining pre-settlement vegetation [Stearns 1949 Burgess 1964] Survey notes usually included a general descripshytion of each township including deta ils of forest underbrush soils and relief Points were established at each 16-km interval along the range and section li nes of each township In this manner 36 sections were established within each township At the common point between secshytions as well as at quarter section corners (a point halfway between section corners) the species diameter and bearing of up to four witshy
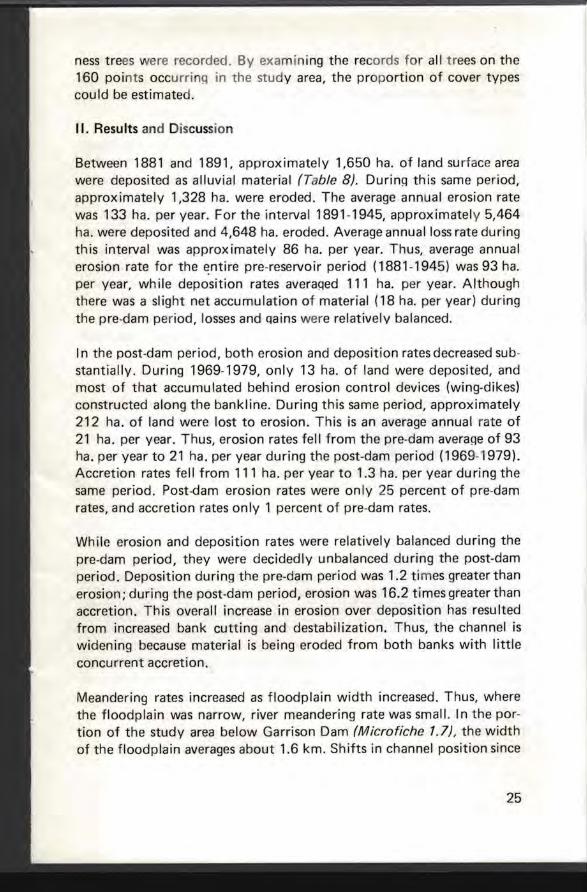
ness trees were recorded By examining the records for all trees on the 160 points occurri n~ in the study area the proportion of cover types could be estimated
II Resu Its and Discussion
Between 1881 and 1891 approx imately 1650 ha of land su rface area were deposited as alluvial material (Table 8) Durin~ this same period approximately 1328 ha were eroded The average annual erosion rate was 133 ha per year For the interval 1891-1945 approximatel y 5464 ha were deposited and 4648 ha eroded Average annual loss rate during th is interval was approx imately 86 ha per year Thus average annual erosion rate for the ~ntire pre-reservoir period (1881-1945) was 93 ha per year wh ile deposition rates averaqed 111 ha per year Although there was a slight net accumulation of material (18 ha per year) during the pre-dam period losses and qains were relatively balanced
In the post-dam period both erosion and deposition rates decreased subshystantially Dur ing 1969-1979 only 13 ha of land were deposited and most of that accumulated behind erosion control devices (wing-dikes) constructed along the bankline During this same period approximately 212 ha of land were lost to erosion This is an average annual rat e of 21 ha per year Thus erosion rates fell from the pre-dam avera~e of 93 ha per year to 21 ha per year during the post-dam period (1969-1979) Accretion rates fell from 111 ha per year to 13 ha per year during the same period Post-dam erosion rates were only 25 percent of pre-dam rates and accretion rates only 1 percent of pre-dam rates
Vhi lle erosion and deposition rates were relatively balanced during the pre-dam period they were decidedly unbalanced during the post-dam period Deposition during the pre-dam period was 12 ti mes greater than erosion during the post-dam period erosion was 162 times greater than accretion This overal ll increase in erosion over deposition has resulted from increased bank cutting and destabilization Thus the channel is widening because material is being eroded from both banks with little concurrent accretion
Meandering rates increased as floodplain width increased Thus where the floodplain was narrow river meandering rate was small In the porshytion of the study area below Garrison Dam (Microfiche 17) the width of the floodplain averages about 16 km Shifts in channel position since
25
26
1872 have averaged approx imately 06 km I n the study area south of Bismarck (Microfiche 11) t he floodplain is approximately 116 km in width Channel changes since 1872 have averaged approximate ly 24 km result ing in red istribution of la rge am ou nts of alluvium
The model of Schumm [1969] would predict t hat the reduction of f loodshying and bed-material load resulting from dam emplacement will lead to an increase in channel sinuosity and a decrease in meander wavelength Thus the natural response involves considerable lateral cutting unti l the channel reaches equilibrium with the new regimen In the study area however an extensive series of bank-stabilization structures conshystructed by the Corps of Engineers since dam emplacement has preshyvented natural c~annel response and has actually led to a considerable post-dam reduction in lateral channel shifting The Schumm model also predicts a decrease in channel width but the actual channel has been widening T he cause of this anomalous response may be that the stream is expend ing energy in eroding and transporting sediment from both channel walls instead of unilateral channel shifting
The dramatic decline in erosion and accretion rates since the construcshytion of Garrison Dam and the change in the balance between the two are beginning to have an impact on natural rates of reforestation by cottonwood and willow Currently approximately 35 percent of the floodplain forest is composed of cottonwood forests less than 80 years old forests with cottonwood trees less than 150 years old comprise 78 percent of the total Thus forests with cottonwood as the primary dominant currently make up the large majority of the floodplain forests
On active f loodpllains Everitt [1968] proposed a logarithmic decline in the area of the floodplain occupied by forests of increasing age that is young forests should occupy the largest proportion and old forests the smallest I f the meandering rate were to decl ine su bstantially thereby decreasing the likelihood of erosion and increasing mean stand age the pattern may at equ iI ibriu m become reversed that is old f orests wou Id occupy a larger area than young forests This is the pattern now emerging on this protected floodplain cottonwood forests less than 40 years of age now occupy only 8 percent of the total forest area while forests of 40 to 80 years comprise 23 percent of the total We expect the proporshytion of young cottonwood forests to decline in rough proportion to the decline in accretion rates A new equilibrium composition would be reached in less than two centuries and cottonwood forests will probshy
ably comprise at the most only 5-10 percent of the t otal forest area The remainder would include forests of more advanced successional age dominated by green ash and boxelder especially the f ormer Cottonshywood stands of t he future will be small in extent and primari ly located behind w ing-dikes and other erosion control dev ices Few if any cotshytonwood forests w ill occupy broad terraces more than several meters above mean river level The distr ibu t ion of cottonwood shou Id t heref ore become more rest ricted that is a strand species occurring in close proximity to the river
Settlement has brought many significant changes in the ex tent and comshyposition of the floodpl ain vegetation (Microfiches 2 1 th rough 28) The largest changes involved the clearing of fo rests for agricultural purposes By 1938 approximately 38 percent of the floodplain forest had been cleared for agriculture or about 07 percent per year over t he 1881shy1938 period (Table 9) Thus clea ring proceeded at a rapid rate after the General Land Office Survey of 1872-1881 No mention of agricu lture on the floodplain was made in the Survey notes however some cultivashytion had occurred in the adjacent prairie uplands An additional 18 pershycent of the forest was cleared for cu Itivation between 1938 and 1979 or about 05 percent per year
I ndustrial development on the floodplain is a recent phenomenon occurshyring mostly after the construction of Garrison Dam Less than 1 percent of the land area is used by industry Marshes and sand dunes also comshyprise less than 1 percent of the fl oodplain area Marsh area has changed little since presettlement but bare sand has decreased since the cessation of floods Large floods in the pre-dam period scou red and deposited sand on low terraces near the r iver channel
General Land Office Survey notes indicate that the preset tlement floodshyplain was almost completely wooded Young cottonwood forests less than 40 years old occupied about 14 percent of the floodplain forest These may have occupied a larger proportion of the forest area because young trees were generally not used as witness trees in the land survey
Approximately 53 percent of the forest was composed of cottonwoods 40-80 years old Thirty percent of the forest was in the old cottonwood type while only 3 pelrcent of the forests were of advanced successional age These included ash elm boxelder and bur oak with occasional large cottonwoods
27
28
Presently fo rest vegetation comprises about 44 percent of the floodplain area about 8 percent of t his total is composed of young stands of cottonshywood and willow less than 40 years of age Most of these have regenershyated since the closing of Garrison Dam in 1954 on alluvium deposited du ring the 1952 flood In many areas these stands are severely browsed by beaver and scoured by ice in the spring resu lting in frequent damage to aboveground stems Thus individual plants are older than they appear Because these stands are on low terraces with a high water table are flooded occasionally and are on soils unproductive for crops only 6 percent of this forest type has been cleared since their establishment at various times during the past 40 years
Approximately 23 percent of the existing floodplain forest was comshyposed of stands of cottonwood ranging in age from 40 to 80 years Forshyests in th is age class generally occurred on more productive soils howshyever they were still on low terraces with relatively sandy soils Agriculshytural clearing has removed about 52 percent of these stands since their establishment Clearing of forests of this age has increased since the 1930s because of floodplain protection and access to irrigation
The most extensive forest category is age class 80-150 years-47 percent of the total forest area These stands contain large cottonwood trees with young green ash American elm and boxelder These forests are located on intermediate terrace elevations About 43 percent of forests in th is category have been cleared for agricu Iture
The remaining forest type makes up 22 percent of the total forest area These forests contain green ash American elm boxelder and few scatshytered cottonwoods andor bur oak Since settlement 75 percent of this forest type has been cleared for agriculture This high rate of clearing is due to the location of these stands on high terraces removed from most floods and the presence of more productive soils for agriculture
Overall the rate of forest clearing was at its maximum during the early settlement period before 1938 Although the rate of clearing has been somewhat lower during the period after 1938 field observations indicate a surge in clearing since 1970 when irrigation became more widespread Soils that were perhaps of marginal productivity and therefore left forshyested cou ld be made more productive with additional water from irrigashytion Deforestation continues at a rate that is probably greater than the average rate of 05 percent for the 1938-1979 period
It is difficu lt t o accurate ly est imate the forest type proport ions on the presettlement flood plain primarily because the surveyors selected against choosing small trees as wi tness trees Young witness trees less than about 12 cm diameter at breast height (dbh) did not occur in the data set so the proportion of small cottonwood forests was significantly underestishymated The estimate of only 3 percent of the total forest area occupied by forests of advanced successional age is especially interesting since the current proportion is about 22 percent and these forests wh ich ocshycurred on better soils were preferentially cleared We do not know with certa inty the reasons for th is but we suspect that it is an artifact of past timber practices Large cottonwood trees (50-100 years old) occurr1ing with an understory canopy of ash elm and boxelder were preferred trees for lumbering ~elective cutting of these trees would have in effect shifted these stands from the mixed cottonwood forest type to the most advanced successional stage Cottonwood does not reproduce in the tree gaps of older forests
29
30
TREE POPULATION STRUCTURE
An underrepresentation of sap ling-size reproduction of American elm and boxelder was observed by Johnson Burgess and Keammerer [1976] however they sampled only trees 12 cm dbh and larger and did not determine age only size Extrapolation from size to age is often inaccurshyate [ Harcombe and Marks 1978] This research was designed to develop complete age structure diagrams in both treatment and reference stands to test the hypothesis that altered hydrologic regimen had affected tree population structu re The survey of Johnson Burgess and Keammerer indicated that the population structure of another important climax tree species green ash was unchanged from pre-dam condi tions
I Methods
Four former stands of Johnson Burgess and Keammerer [1976] were selected for study ( stands 7 11 13 and 19) I n addition to these treatshyment stands other stands or portions of treatment stands (7 16 and 23) were included as contro l or refe rence sites Because surface water occurred in the spri ng in these stands either from upland runoff or from rising groundwater these reference stands represented an environment closest to that of flooded stands in the pre-dam period If reproduction was as underrepresented in the wetter reference sites as in the treatment sites then the in itial hypothesis that underrepresentation was due to flood cessation would have to be rejected Boxe lder was a major species in stands 7 and 23 while American elm was dominant in stands 1 t 13 and 19 Reference stand 7 (a section of treatment stand 7) was an abanshydoned channel of the Little Heart River on the Missouri River floodp lain near Oahe Reservoir wh ilch fills with water in the spring Reference stands 16 and 23 were flooded almost annually by concentrated upland runoff A ll stands were on one terrace level and had undergone no significant cutting grazing or burning during the previous 30 years Sampling ocshycurred during the summer of 1979
I n each stand parallel and equidistant lines were arranged perpend icular to the course of the river Sample plots were located at random points within 25-m segments along each transect line The sample unit consisted of nested circular plots 250 m2 for stems greater than 10 cm dbh (trees) 100 m2 for stems less than 10 cm dbh but taller than 05 m (saplings) and 1 m2 for stems less than 05 m tall (seedlings) Four 1-m2 plots were random Iy placed with in each 100-m2 plot Twenty-one plots were samshy
pled in stands 11 and 19 and 23 in stands 7 and 13 Because the refershyence stands were much smaller than the t reat ment sites sample sizes were smaller reference stand 7 (three plots) reference stand 16 (seven plots) and stand 23 (two plots)
Stem diameter at breast height was measured f or all boxelder and elm trees and saplings that occurred in t he quadrats Ages of seedlings were determined by counting terminal bud scars or cutting and aging directly I ncrement cores were collected from several saplings and trees in each plot and age was determined in t he laboratory Small saplings were cored using a micro-increment borer A ges for all stems were computed using the natural growth function f(x a b) = a( 1 - e-b x ) where x = dbh and f(x) == age [Parton and Innis 1972] The curve for each species was selected that minimized the residual sums of squares and yielded the greatest measure of fit [Helwig and Council 1979] For elm a = 143 b = 002956 (r2 = 094) For boxelder a = 106 b = 002388 (r2 = 095) All samples of each species were pooled for t he age-size regressions
Size and age structural diagrams were constructed separately by computshying the density of stems in each size or age class Because the relat ionshyship between age and size was close to being linear the curves in both graphs exh ibited the same basic form Boxelder stems of sprout origin were tallied separately to show the contribution of sprouting to overall population structure Data were divided into five-year age classes
II Results and Discussion
Age distributions for American elm (Figure 12) showed low densiti es of saplings and small trees and high densities of seedlings and large trees Three of the four treatment stands showed a complete absence of stems in one of the two young age classes The average of all four stands also showed lowest densities in the two sapling classes The data clearly indishycate that post-reservoir conditions allowed substantial germination and initial establishment of seedlings seedling densities in the first age class averaged 110000 per ha However seedlings must have thinned rapidly since stems from several years old to about 45 years old were relatively rare High densities of elm seedlings were also noted during field surveys in 1969-70 by Keammerer [1972] and underrepresentation of sapl ings and small trees was observed by Johnson Burgess and Keammerer [1976] Reduction in elm density occurred in stems from several years old to those that would have been approximately 20 years old when
3 1
32
Garri so n Dam became operational
Age distribut ion fo r boxel der also showed underrepresentation in t he small age classes but th e reduction was less dramatic than for elm (Figshyure 12) Again seedl ing reproduction was considerable altho ugh at lower overall densities than elm Mortali ty between seedlings and smal l tree classes was considerable thereby resulting in fewer saplings than trees Underrepresentation is most evident in stems several years o id to about 25 years old Thus boxelder showed a somewhat narrower age gap than elm Reduction in stem density appeared in age classes that corresponded cIIosely to the time since flooding was eliminated by Garshyrison Dam
Age distributions in reference stands showed different patterns (Figure 13) Age distributions for both species appeared to be more balanced [lJIeyer 1952] that is age classes between 5 and 45 years were considshyerably Iess underrepresented than in treatment sites In our survey of reproduction on the floodplain one observation held true-h igh sapling densities of American elm andor boxelder were always associated with the few siteS that received supplemental moisture either from a rising groundwater table near Oahe Reservoir or in areas that received upland runoff
Therefore the data suggest that moisture was the primary factor responshysible for underrepresentation in the age structure of these two species Supplemental moisture to these forests would in the pre-reservoir years have been provided by both a surface recharging of the rooting zone by overbank flooding and a high water table in the early growing season months when river height was generally maximum However in the abshysence of these sources of moisture seedlings would now depend on preshycipitation alone to enable growth to the deeper post-reservoir water table We believe that the reduction in available moisture was the likely cause of the extremelly high seedling mortality and the movement of only a small fraction of elm and boxelder seedlings into the tree-size classes The natura l range of elm extends to only a few counties west of the study area in North Dakota while boxelder extends west into the drier conditions of eastern and central Montana Interestingly the species less able to tolerate drier cl imatic conditions (elm) was also the species that showed the greatest underrepresentation in age structure in the drier post-dam floodplain
Ch anges in the hydrologic regimen may have also cau sed greate r morshytality of established saplings in the yea rs im mediately follow ing Garrison Dam T hus t he o bservation in t he age structural d iagrams for elm (Figshyure 12) that increased mortality began two decades before Garrison Dam (that is cu rren t 45-year-old age c lass) may be the resu lt of increased morta lity of sa plings t hat were 20 years old or younger in the years folshylowing dam construction Perhaps the root systems of saplings were too poorly developed to ut il ize gro undwater o r to persist on it alone At the wetter reference sites mo rta lity of saplings of this age did not appear to have increased substantially over pre-dam levels
I n contrast t he mortality of establ ished boxelder sapl ings appears to have continued at pre-dam levels the change in hydrologic regimen appeared to increase only the mortality of young boxe lder seedlings that is individuals established after 1954 The larger proportion of stems that had died and resprouted in treatment stands also indicates that these seedlings were under greater stress than those in reference sites
Since livestock grazing could also have caused seedling-sapling mortality t he grazing history of the treatment stands was obta ined from landshyowners Stand 7 had not been grazed since the 1920 s stands 11 and 13 had not been grazed since 1950 and stand 19 had been grazed one year in the early 1970s but otherwise had not been grazed during the postshydam period Grazing therefore has been light or nonexistent in the treatment stands and was probably not the reason fo r the gap in age structure Furthermore if the ingestion and trampling by cattle were responsible for increased mortal ity other woody tree species wou Id likewise also have been affected yet green ash saplings of all age classes were numerous in treatment stands
Browsing by deer has also been shown to affect the population structure of preferred species [Swift 1948] Although American elm is a preferred browse species in this region damage to it from browsing was not noticeshyable in our treatment stands
In streamside forests in the East many large elms (Ulmus americana L and Ulmus rubra Muhl) have died from Dutch elm disease We saw no evidence of diseased elms on the floodplain in our study area however the disease has killed many urban trees in Bismarck Since elm trees are affected to a greater extent than seedlings and saplings [Stipes and Camshypana 198 1] the disease is not considered a cause for the Ilow densities
33
34
of elm saplings Underrepresentat ion was already observed by Johnson Burgess and Keammerer (1976] during the 1969 and 1970 fie ld seasons about t he time Du tch elm disease had spread to central North Dakota [Stipes and Campana 1981 ]
Although the natural form of the age structure curve of c llimax or equilibrium tree populations had been thought to be negative exponenshytial [Meyer 1952] recent studies have indicated that underrepresentashytion in sapll ing size classes is a widespread phenomenon [Christensen 1977 Harcombe and Marks 1978] Harcom be and Marks sampled forest stands in the Big Thicket of southeastern Texas that ranged from dry uplands through mesic sllopes to wet river floodplains They showed a high incidence of underrepresentation of sapl ings of cl imax tree species in wet and mesic forests but a lower incidence in dry upland forests They argued that the cause of the underrepresentation was competition for Iight between the seed Iings and sapl ings of overstory tree species and understory tree and shrub species They suggested that underrepresenshytation in wet and mesic forests was natural and caused by increased morshytality of seedlings because of shad ing by understory trees (for examp1le Carpinus caroinianaj
Patterns of underrepresentation in age structure f or the M issou ri River floodplain were nearly identical with those of southeastern Texas exshycept we believe that underrepresentation in our study was caused by lack of moisture not light The canopy of old floodplain forests along the Missouri River is relative ly open Hibbard [1972] showed that in these forests canopy cover ranged from 65 to 80 percent A lso neither boxelder nor elm is ilntolerant of shade [Baker 1949] Saplings of these species were no more abundant along stand edges or in large canopy gaps where light would have been more available
In summary our results indicate a significant decline in the abundance of American elm and boxelder on the Missouri River floodplain in the study area Current overstory densities of these species cannot be mai1nshytained given the low density of saplings In the case of American elm the decline will accelerate if Dutch elm disease begins to affect canopy trees Assuming that current trends continue the importance of these species in the overstory should consistently decline over t ime until only scattered trees remain or even become local ly elliminated Trees wHI beshycome primadly restricted to the few small wet sites either near the backshyup of Oahe Reservoir or in places where intermittent streams flow onto
the floodplain Seedlings may continue to be numerous unti l affected by restricted seed d ispersal from a dwi ndling nu mber of canopy trees Because green ash reproduction of all age classes was ubiquitous and dense it should become an increasingly important canopy species
Available evidence points to the altered hydrologic regimen as the cause of reduced recruitment of boxelder and elm trees however in the abshysence of pre-dam age structure and hydrologic information th is conclushysion must be considered tentative We clearly need additional informashytion from other f loodplains both natural and altered to solve the undershyrepresentation problem
35
36
CONCLUSIONS
1 The hydro logic regi men of the Missouri River has been altered conshysiderabl y by t he construction of Garri son Dam Wh ile precipitation and A E have shown no significant changes between pre- and post-dam periods streamflow patterns have changed markedly Peak flow no longer occurs early in the growing season and consequently is out of phase with the vernal growth pattern typical of floodpla in trees A larger proportion of the annual flow is now released in the non-growing season mont hs and therefore is unavailable for growth Now flow in Ju ne is usually less than it was du ri ng the drought years of the 1930s River flow data indicate a general lowering of the spring and ea rly summer water table since Garr ison Dam
2 Flood ing has been el im inated on terraces greater than 2 m above mean river level thus decreasing the moisture available to floodplain ecoshysystems at the start of the growing season The accompanying deposishytion of nutrient-rich si It has also ceased
3 Both erosion and deposit ion rates by the river have decreased subshystantially since Garr ison Dam I n effect river meandering has all but ceased Accretion rates have fallen to 1 percent of their pre-dam level and erosion rates to 25 percent of pre-dam levels The net effect was a widen ing of the river channel by erosion on both banks and little concurrent deposition
4 Results showed that decreases in radial tree growth in the post-dam period were not uniform throughout the floodplain but depended on species and location with respect to the river Trees on terraces at t he edge of the floodp ~ ain that received concentrated runoff from upland ravines (for example bur oak) and those with deep root systems (for example cottonwood) on low terraces close to the water table have been least affected by the altered hydrologic regimen Growth of cotshytonwood and bur oak on reference sites unaffected by damming of the Missouri River increased significantly in the post -dam period The most pronounced decrease in tree growth (for example boxelder American elm) occurred on higher terraces that received little or no upland runoff
5 Lack of flooding and a lowered spring water tab le are implicated in the decline of radial tree growth For example with a lower spring
water table the roots of established trees may no longer extend t o the cap illary f ringe Thus growth might depend more upon spr ing A E than on groundwater This shift in response from one source of moisshyture to another (from groundwater to precip itat ion) was ex hibited in the regression ana lysis of cottonwood growth chrono logies The ab shysence of overbank flooding may have had a greater effect on the growth of trees (for example American el m) on dry upper t erraces well above the water table that did not receive upland runoff A Ishythouglh these terraces were only infrequently flooded before 1953 the supplemental moisture provided by floods just before the onset of growth could have augmented growth for several consecutive years and compensated for years of low predpitation
6 Lack of accretion by the r iver in the post-dam period spells a decline in the proportion of the floodplain forest occup ied by cottonwoodshywillow forests The decline is already observable and will continue until in a century or more cottonwood forests will occupy only a fraction of their current proportion Cottonwoods will be relegated to a river marg inal position being especially prominent behind wingshydikes
7 We believe that the decline in cottonwood abundance and ubiquity will be accompanied by a decline in American elm because of a rapidly declining growth rate almost complete absence of seedling survivorshyship on most sites and the impending effects of Dutch elm disease Some remnant elm stands may persist on sites with an artificially elevated water table near the Oahe Reservoir and on high terraces that receive upland runoff Boxelder which exhibited greater survivorship but was still underrepresented in the sapling size classes may exhibit a slower decline Although growth rate of green ash has also declined it exhibits balanced population structure and will likely increase its abundance and ubiquity in coming decades Thus the current obsershyvations foretell a drastic decline in cottonwood and elm abundance a moderate-to-slow decline in boxelder prominence and an increase in green ash Overall the aipha and beta diversities of the forest overshystory should decline
8 Clearing for agriculture has claimed slightly over half (55 percent) of the original floodplain forest The rate appears to have accelerated during the last decade because of opportunities to irrigate croplands Should these trends continue future native forests may be mai ntained
37
38
only in protected areas such as the Riverdale and Oahe Game Manageshyment Areas and in private reserves (for example Cross Ranch The Nature Conservancy) However forests protected from clearing and other disturbances remai n unprotected from the ecological effects of altered river hydrology
9 The effects of altered hydrology on floodplain ecosystem dynamics need further study on other forested floodplains particularly where pre-dam biological information is available or where nearby wild rivers could serve as good controls Where significant effects of floodplain protection are suspected an index of impact could be der ived by comparing pre-dam gauge height (flood frequency) and seasonal flow patterns to pre-dam patterns Greater departure from pre-dam patshyterns would suggest greater potential impact on natural floodplain ecosystems
LITERATURE CITED
Baker F S 1949 A Revised Tolerance Table Journal of Forestry 47 179-81
Baxter R M 1977 Environmental Effects of Dams and I mpoundshyments I n Annual Review of Ecology and Systen7atics Vol 8 R F Johnson editor pp 255-83 Palo Alto Californ ia Annual Rev iews Inc
Bedinger M S 1971 Forest Species as Indicators of Flooding in the Lower White River Valley Arkansas Professional Paper 750-C US Geological Survey US Department of the Interior Washington
Bell D T and R del Moral 1977 Vegetation Gradients in the Streamshyside Forest of Hickory Creek Will County Illinois Bulletin Torrey Botanical Club 1 04 127-35
Bluemle J P 1971 Geology of McLean County North Dakota North Dakota Geological Survey Bulletin No 60 Pt 1 North Dakota State Water Conservation Commission Grand Forks
Brockman L C et aI 1974 Soil Survey of A1cLean County North Dakota Soil Conservation Service US Department of Agriculture Wash ington
Brown D E C H Lowe and J F Hausler 1977 Southwestern R iparshyian Communities Their Biotic Importance and Management in Arizona In Importance Preservation and Management of Riparian Habitats pp 201-11 General Technical Report RM-43 US Forest Service US Deshypartment of Agriculture Washington
Burgess R L 1964 Ninety Years of Vegetational Change in a Townshyship in Eastern North Dakota Proceedings North Dakota Academy of Science 18 84-94
Campbell C J and W Green 1968 Perpetual Succession of StreamshyChannel Vegetation in a Semiarid Region Arizona Academy ofScience Journal 5 86-98
39
40
Carlson C G 1973 Geology of Mercer and Oliver Counties North Dakota North Dakota Geological Survey Bul letin No 56 Pt 1 Nort h Dakota State Water Conservation Commission Grand Forks
Christensen N Lt 1977 Changes in Structu re Pattern and Diversity A ssociated with Climax Forest Maturation in Piedmont North Carolina American Midland Naturalist 97 176-88
Clayton L 1962 Glacial Geology of Logan and McIntosh Counties North Dakota North Dakota Geological Su rvey Bulleti n No 37 North Dakota State Water Conservation Commission Grand Forks
Everitt B L 1968 Use of the Cottonwood in an I nvestigation of the Recent History of a Floodplain American Journal ofScience 266417shy39
----- 1980 Ecology of Saltcedar-A Plea for Research Environshymental Geology 377-84
Fenneman N M 193 1 Physiography of the Western United States New York McGraw-Hili Book Co
Fritts H C 1976 Tree Rings and Climate New York Academic Press Inc
Fritts H C J E Mosimann and C P Botroff 1969 A Revised Comshyputer Program for Standardizing Tree-Ring Series Tree-Ring Bulletin 29 15-20
Gary H L 1965 Some Site Relations in Three Floodplain Communishyties in Central Arizona Arizona Academy of Science Journal3(4) 209shy12
Grannemann N G and J M Sharp Jr 1979 AHuvial Hydrogeology of the Lower Missouri River Vaey Journal of Hydrology 4085-99
Greenman D W 1953 Reconnaissance of the Missouri River Pumping Units Between Garrison Dam and Bismarck North Dakota Unpublished paper compiled as part of a US Department of the Interior program for development of the Missouri River Basin Water Resources Division US Geological Survey US Department of t he Interior Washington
Johnson W C R L Burgess and W R Keammerer 1976 Forshyest Overstory Vegetation and Environment on the Missouri River Floodplain in North Dakota Ecological Monographs 4659-84
middot J 1 f Lf
Harcombe P A and P L Marks 1978 Tree Diameter Distributions and Replacement Processes in Southeast Texas Forests Forest Science 24 153-66
Hayes F A and J H Stoeckler 1935 Soil and Forest Re lat ionsh ips of the Shelterbelt Zone I n Possibilities of Shel terbelt Planting in the Plains Region pp 111-15 Special Bulletin US Forest Service US Department of Agricu Iture Ilash ington
Helwig J T and K A Council editors 1979 SAS Users Guide Rashyleigh North Carol ina SAS I nst itute Inc
Hibbard E A 1972 Vertebrate Ecology and Zoogeography of t he ~issouri River Val ley in North Dakota PhD dissertation North Dashykota State University Fargo
Hollander M and D A Wolfe 1973 Nonparametric Statistical Methods New York John Wi ley and Sons
Keammerer W R W C Johnson and R L Burgess 1975 Floristic Analysis of the Missouri River Bottomland Forests in North Dakota Canadian Field-Naturalist 895-19
Kosier J A 1979 Regulating Critical Riparian Lands A Cha llenge in I ntergovernmental Cooperation I n Strategies for Protection and Management of Floodplain Wetlands and Other Riparian Ecosystems R R Johnson and J F McCormick editors pp 332-35 Symposium Proceedings December 11-13 1978 Calloway Gardens Georgia
Kroodsma R L 1970 North Dakota Species Pairs I Hybridization in Buntings Grosbeaks and Orioles PhD dissertation North Dakota State University Fargo
Kuchler A W 1964 Potential Natural Vegetation of t he Contermishynous United States (map) Special Publication American Geograph ical Society INew York
Kujawa M 1974 Plankton Studies on a Recently I mpounded Resershyvoir Journal of Environmental Health 37 252-55
41
42
Kume J and D E Hanson 1965 Geology and Water Resources of Burshyleigh County North Dakota North Dakota Geologicall Survey Bulletin No 42 Pt 1 North Dakota State Water Conservation Commission Grand Forks
Lemke R W and R B Colton 1958 Summary of the Pleistocene Geology of North Dakota In Midwestern Friends of the Pleistocene Guidebook 9th Annual Field Conference Miscellaneous Serial No 10 North Dakota Geological Survey Grand Forks
Lemke R W et aI 1965 Quaternary Geology of the Northern Great Plains In The Quaternary of the United States H E Wright Jr and D J Frey editors pp 15-27 Princeton New Jersey Princeton Univershysity Press
Leopolld L B M G Wolman and J P Miller 1964 Fluvial Processes in Geomorphology San Francisco W H Freeman
McKenzie M A 1936 Flood Injury to Trees Science 83(2154) 412-13
Meinzer O E 1927 Plants as Indicators of Groundwater Water Supply Paper 577 US Geological Survey US Department of the Interior Washington
Meyer H A 1952 Structure Growth and Diameter in Balanced Uneven-Aged Forests Journal of Forestry 5085-92
Parton W J and G S Innis 1972 Some Graphs and Their Functional Forms Technical Report No 153 Natural Resource Ecology Laborashytory Colorado State University Fort Collins
Pitt M D and H F Heady 1978 Responses of Annual Vegetation to Temperature and Rainfall Patterns in Northern California Ecology 59(2) 336-50
Randich P G and J L Hatchett 1966 Geology and Groundwater Reshysources of Burleigh County North Dakota Part II Groundwater Re-shysources North Dakota Geological Survey Bulletin No 42 North Dakota State Water Conservation Commission Grand Forks
Ridley J E and J A Steele 1975 Ecological A spects of River Imshypoundment In River Ecology B A Whitton editor pp 565-87 Berkeley and Los Angeles University of California Press
Robertson P A G T Weaver and J A Cavanaugh 1978 Vegetation and Tree Species Patterns Near the Northern Term inus of the Southern Floodplain Forest Ecological tllonographs 48249-67
Schumm S A 1969 R iver Metamorphosis American Society of Civil Engineers Journal Hydraulics Division 95(HY1) 254-73
Stearns F W 1949 liN inety Years Change in a Northern Hardwood Forest in Wisconsin Ecology 30350-58
Stokes M A and T L Smiley 1968 An Introduction to Tree-Ring Dating Chicago University of Chicago Press
Stout H R et aI 1974 Soil Survey of Burleigh County North Dakota Soil Conservation Service US Department of Agriculture Washington
Swift E 1948 Wisconsin Deer Damage to Forest Reproduction SurveyshyFinal Report Publication 347 Wisconsin Conservation Department Madison
Thornthwaite C W and J R Mather 1957 I nstructlions and Tables for Computing Potential Evapotranspiration and Water Balance Pubshylications in Climatology 10 181-311
Tukey J W 1977 Exploratory Data Analysis Reading Massachusetts Addison-Wesley Publishing Co
US Army Corps of Engineers Omaha District 1980 Personal comshymunication
US Geological Survey US Department of the Interior 1928-1 977 Water Resources Data for North Dakota 1928-1977 North Dakota State Geological Survey Bismarck
US Weather Bureau 1935-1974 Climatological Data North Dakota Annual Summary 1935-1974 Washington
43
44
Weiser P K 1975 Soil Survey of Oliver County North Dakota Soil Conservation Service US Department of A gricultu re Washington
Weist W G Jr 1971 Geology and Ground-Water System in the Gila River Phreatophyte Project Area Graham County Arizona Gila River Phreatophyte Project Professional Paper 655-D US Geological Survey US Department of the Interior Washington
Wells P V 1965 Scarp Woodlands Transported Grassland Soils and the Concept of Grassland Climate in the Great Plains Region Science 148 246-49
Wilhelm F J ~ 978 Soil Survey of Mercer County North Dakota Soil Conservation Service US Department of Agriculture Washington
Wolman M G and L B Leopold 1957 River Floodplains Some Obshyservations on Their Formation Professional Paper 282-C 37 -107 US Geological Survey US Department of the Interior Washington
Yeager A F 1935 Root Systems of Certain Trees and Shrubs Grown on Prairie Soils Journal of Agricultural Research 51 1085-92
Yeager L E 1949 Effect of Permanent Flooding in a River Bottom Timber Area Illinois Natural History Survey Bulletin 2533-65
FIGU RES
FIG
UR
E 1
L
oca
tio
n a
nd N
um
ber
of
Stu
dy
Site
s in
No
rth
Dak
ota
Wa
tfo
rd
Cif
y
o B
1
6
32
4
8
Sca
le
(km
)
Pri
mar
y st
udy
area
is
betw
een
Gar
riso
n D
am a
nd O
ahe
Res
ervo
ir T
he L
ittl
e M
isso
uri
Riv
er r
efer
ence
sit
e is
wit
hin
the
The
odor
e R
oose
vel
t N
atio
nal
Par
k
and
the
scar
p w
oodl
and
refe
renc
e si
te i
s w
est
of P
rice
N
orth
Dak
ota
Sta
nd
~
-J
nu
mbe
rs a
re t
hose
of
John
son
Bur
gess
an
d K
eam
mer
er [
1976
]
~
00
~
c o o CD
~
CD
Q
en
~
CD -Q) E
o 0
J U
FIG
UR
E 2
M
on
thly
Str
eam
flo
w (
19
28
-1 9
77
) fr
om
th
e B
ism
arck
Gau
ging
Sta
tion
on
th
e M
isso
uri
Riv
er
2300TI-~r-~or--r---------r----~--------r----~----r-------------r---~----~----~--~----~
112~
1150
5H
19
44
23
00
In~
U5
0
51~
Year
JI)
In
In
N
19 4
5
194
6
~
25
00
c 0 0 Q
) 172~
I
~
II~O
I fh
~
Q)
~7~
Q) E
0 0
~ ~h
~
I I
I1
96
2
19
63
1
96
4
196~
19
68
1
96
7
19
68
1
96
9
19
70
19
71
19
72
1
97
3
19
74
1
97
5
19
76
1
97
7
FIG
UR
E 2
(co
nti
nu
ed
)
~
(J
Yea
r
S
ou
rce
US
G
eolo
gica
l S
urv
ey
19
28
-19
77
T
he
pri
mar
y gr
owin
g se
aso
n m
on
ths
(May
Ju
ne
an
d J
uly
) ar
e re
pre
sen
ted
by
bla
ck
bars
G
arri
son
Dam
was
co
mp
lete
d i
n A
pril
19
53
S
trea
mfl
ow
is
used
her
e in
stea
d o
f ga
uge
hei
gh
t si
nce
the
latt
er d
ata
wer
e n
ot
avai
lshy
~
able
fo
r so
me
yea
rs
Th
ere
was
usu
ally
a s
tro
ng
co
rrel
atio
n b
etw
een
gau
ge h
eig
ht
and
str
eam
flo
w (
for
exam
ple
fo
r th
e m
on
th o
f (0
O
cto
ber
19
72
R
2 =
09
98
7
Y =
42
81
7x
-2
32
02
)
(J1
o
F
IGU
RE
3
Str
ea
mfl
ow
fo
r Ju
ne a
nd F
eb
rua
ry 1
928-
1977
at
the
Bis
mar
ck G
augi
ng S
tatio
n o
n th
e M
isso
uri
Riv
er
19
82
- ~ rt) E
-
14
16
~
V
I
r
June
S
tre
am
flo
w
~
0 J u ~
85
0
lt
W
0
en
28
3
192
8
19
34
1
94
0
19
46
19
52
1958
1
96
4
1970
1
97
6
YE
AR
CJ1 ~
- ~ rt) E - ~ o J
LL ~
ltt w
a
Ishy (f)
991
70
8
42
5
142
FIG
UR
E 3
(co
ntin
ue
d)
Fe
bru
ary
S
f re
am
flo
w
19
28
1
93
4
19
40
1
94
6
19
52
1
95
8
19
64
1
97
0
YEA
R V
erti
cal
line
indi
cate
s th
e ye
ar t
hat
Gar
riso
n D
am w
as c
ompl
eted
S
ourc
e U
S
Geo
logi
cal
Sur
vey
I 19
28-1
977
19
76
60
40
20
FIGURE 4 Percent Chance of Overbank Flooding at Different
Terrace Elevations Based on the Relationship Between Maximum Gauge Heights and Known Terrace Elevations
100~----------------------------------------------
80 pre- damD
()
z Ci ~l post-dam0 0 -l lL
-l laquo gt z z laquo LL 0
LLJ U Z laquo L u ~ 0
20 30 4 0 50 60
TERRACE ELEVATION
(meters above mean river level)
Source us Geological Survey 1928-1977 (Bismarck gauging station on the Misshysouri River)
52
00 10
a
IJJ
03
~-
ltE
~~
~I UJ
J 1
5
-m
~ ~
21
a
W
C
2
7
FIG
UR
E 5
G
rou
nd
wat
er a
nd S
trea
mfl
ow
Dat
a (1
97
1-1
97
3)
fro
m t
he
Mis
sour
i R
iver
nea
r B
ism
arck
Str
eam
flow
Wat
er T
able
~
r-
~
1
I I
I
J
I
I
I
II
1 J
11
I
IJ
_
shy
II
I
~
M
J J
J
M J
J
M J
J
I I
I 19
71
1972
19
73
MO
NT
H
AN
D
YE
AR
(J)
1415
~
0
fTI
~ 1132 raquo
~
84
9
r o 5
6 6 ~
shy
3 2
83
~
USG
S te
st w
ell
no
138-
080-
08-A
BA
1
loca
ted
appr
oxim
atel
y 1
km f
rom
the
Mis
sour
i R
iver
and
app
roxi
mat
ely
2 km
sou
th o
f B
ism
arck
P
rim
ary
grow
ing
seas
on
mon
ths
of
May
Ju
ne
and
July
are
rep
rese
nted
by
M
JJ
Str
eam
flow
dat
a fr
om B
ism
arck
C
Jl ga
ugin
g st
atio
n S
ourc
e U
S
Geo
logi
cal
Sur
vey
192
8-19
77
w
E E
I tshy~ 0 a ()
J ~ gt z z ~
54
FIGU RE 6 A merican Elm Chronologies (1 928-1 977)
from Stands 12 13 19 and 16
30
25
14
12
10
20
15
10
05
5 0
40
30
UNSTANDARDIZED
YEAR
American EI m Stand 12 1 age=80
American Elm Stand 13 i aoe=135
American EI m Stand 19 i age=120
American Elm Stand 16 i age=120
1976
-shyE E-
12
10
08
06
12
10
0middot8
12 10
08 06
FIGURE 6 (continued)
1928
STANDARDIZED
1940 1952
YEAR
American Elm Stand 12 x age=8
American Elm Stand 13 x age=135
Amer ican Elm Stand 19 i age=120
1964 1916
Figures on left are unstandardized (long-term trends not removed by standardizashytion) figures on right have been standardized Vertical lines indicate the year that Garrison Dam was completed
55
56
FIGURE 7 Bur Oak Chronologies (1928-1 977) from Stand 16
and the Scarp Woodland Reference Site
UNSTANDARDIZED
20
18
E E
16
I tshy~ 0 a C)
Bur Oak J Scarp Woodlandlaquo ) x oge= 120z
1 8z laquo
16 ( I
Bur Oak Stand 16
X age=120
14
1928 1940 1952 1964 1976
YEAR
FIGURE 7 (continued)
STANDARDIZ ED
12
10
- 08 E Bur Oak E- 06 Stand 16
I X age=120 ~ 0 a () Bur Oak J
110 Scarp Woodland ~ gt x age= 120 z z 105 ~
100
09gt
090
1928 1940 1952 1964 1976
YEAR Figures on left are unstandardized figures on right have been standardized Vertical lines indicate the year that Garrison Dam was completed
57
-E E
25
c toshy 23 ~ 0
21a ()
- 19 ~ ~ 17Z Z ~
en ~
E 256
~ 199 0 J LL 142 ~ ~
85W a Ishy 28en
58
FIGURE 8 Cottonwood Chronology (1928-1977)
from the Litt~e Missouri Reference Site
1928
1928
UNSTANDARDIZED
1940 1952
YEAR
1952
YEAR
Cottonwood Little Missouri
i age-IOO
1964 1976
Little Missouri
1964 1976
FIGURE 8 (continued)
STANDARDIZED
Cottonwood E E- 1 2
Little Missouri
x age= 100 c Ishy~ 10 0 a ()
08 ~ ltt =gt Z 06 Z ltt
Unstandardized chronology is top left standardized on right Average streamflow for April to July (1935-1977) for the Little Missouri River is shown bottom left Vertical lines indicate the year that Garrison Dam was completed Source US Geological Survey 1928-1977 (Watford City gaugi ng station)
59
E E
I Ishy~ o a lt- J ltt gt z z ltt
60
FIGURE 9 Cottonwood Chronologies (1928-1977) f rom Stands 5 and 14
6 0
50
40
3 0
20
10
30
2 5
20
1 5
1928
UNSTANDARDIZED
1940 1952
YEAR
Cottonwood Stand 5
c age=80
Cottonwood Stand 14
x age= faa
1964 1976
13
11
-E 0 9
E- 07
05
12
10
08
06
FIGURE 9 (continued)
STANDARDIZED
1940 1952
YEAR
Cotton wood Stan d 5
x age=80
Cottonwood Stand 14
x age=IOO
1964 1976
Figures on left are unstandardized figures on right have been standardized Vertical lines indicate the year that the Garrison Dam was completed
61
C)
f)
F
IGU
RE
10
S
moo
thed
Pio
ts o
f S
prin
g A
E V
ersu
s Y
ear
and
Spr
ing
(May
Ju
ne
July
) S
tre
am
flo
w V
ersu
s Y
ea
r
AE
Str
ea
mfl
ow
83
76
2
96
E
70
2
89
(J -
64
W
lt
t 5
7
~
r
v
shy
28
3
27
7
51
2
71
44
~
-
2 6
4
25
8
19
28
1
93
4
19
40
1
94
6
19
52
1
95
8
19
64
1
97
0
197
6
YEAR
Ver
tica
l li
ne i
nd
icat
es t
he y
ear
that
Gar
riso
n D
am w
as c
om
ple
ted
(J)
-t
n
fTI
lgt
~
r 0 ~
0 c 3 ~
en
64
FIGUR E 11 Results of Stepwise [MAXR Helwig and Council 1979]
Multip le Regression Analysis of Cottonwood from Stands 5 and 14 for Pre-Dam (1928-1952) and Post-Dam (1953-1977) Periods
Cottonwood Stand 5 CJ) t-Z 10
Pre -d am U w
5li ~ w 0 0 U
-5 Z Q -10 CJ) CJ)
AMJJ AMJJ AMJJ AMJJ AMJJ AMJJ ASOW V-I Y-I V-Ia () LLJ
Post-dam5 0 a
2 5 0 UJ N 0 0 0 a lt - 2 5 0 Z
~ -50
en PR IOR
FLOW PPT AE TEMP GROWTH
FIGURE 11 (continued)
(f) ~ Z 10 LLJ U 5ii ~ 0 0 0
-5 Z 0
-10 () () UJ a C)uJ 10 a
50 UJ N 0 0 ~ -5 ~ 0 Z -10 ~ (f)
Cottonwood Stand 14
Pre- dam
AMJJ AMJJ AMJJ AMJJ ANJJ ASO Y-I Y-I
Post- dam
FLOW PPT AE TEMP PRIOR I I GROWTH I
Fourteen environmental variables and a variable for the previous years growth (shown in Table 6 plus fall AE) were available to the stepwise selection process Only those variables significant at the 0100 level are shown Bars represent standshyardization regression coefficient and dots above or below bars indicate levels of sigshynificance bull ~ 005 bullbull ~ 001 bullbull ~ 0001 [Fritts 1976]
65
66
FIGURE 12 Age Structure of American Elm and Boxelder Populations in Four
Treatment Stands on the Missouri River Floodplain in North Dakota
AME RICA N EL M BOX E LDER
1 1 Ii c 2
10 STAND 7 STAND 7~ gt
oil lt= GI Cl 10
E GI
Vl
5 310 10
c Ii
02 11 102 STAND 11
gtshy Ui
n II 10 10
GIE
VI
STAND
27112233445566778899111111111 2711223344556677 272727272727272727001122334 27272727272727
272727272
AGE (years) AGE (years)
FIGUR E 12 (continued)
AM ER IC AN ELM BOXELDER
Ii
i ~ iii c
0
E VI
ii ~
~ iii c
0
E
iii
~ ~
~ ~ iii c
0
bull VI
101 10
2 STAND 13
0
104
102 STAND 19
10
510
2
44 6
AVERAGE10
10
I
8899111111111 272727272727272727001122334
272727272
AGE (years)
White bars denote proportion of stems of sprout origin
STAND 13
310
210 STAND 19
0
AVERAGE
2 11223344556677 27272727272727
AGE (years)
67
68
FIGURE 13 Age Structure of American E 1m and Boxelder Populations
in Reference Stands on the Missouri River Floodplain in North Dakota
AMERICA N ELM
105 ~ I ~
S TAND 16iii 103bull I
~ gt-
I) 102~ c QJ
0
E
V) -QJ
101-
~27112233445566778899111111111 272727272727272727001122334
272727272
AGE (years)
1 m 103
I
gtshy
I) 102 c 41
0
E -QJ
101Vi
S TAND 7
103
FIGURE 13 (continued)
ro c
gt
I)
c ClI
0
E ClI
V) -
ro c
~ gt
I)
c QJ
0
E QJ
V) -
STAND 23
102
101
L 104
103
BOXELDE R
I
STAND 16
102
101
2711223344556677 27272727272727
AGE (years)
69
TABLES
TA
BL
E 1
P
reci
pita
tion
and
AE
Sta
tistic
s fo
r P
re-D
am (
19
35
-19
54
) an
d P
ost-
Dam
(1
95
5-1
97
4)
Per
iods
Mea
n M
axi
mu
m
Min
imu
m
To
tal
Ap
ril-
July
T
ota
l A
pri
l-Ju
ly
To
tal
Ap
ril-
Ju
ly
Pre
cip
ita
tio
n (
cm)
Pre
-dam
P
ost-
dam
4
03
(S
O 9
1)
382
(S
O 7
2)
23
6 (
SO
75
) 22
4 (
SO
65
) 5
16
54
7
34
4
33
0
152
27
1
27
126
AE
(cm
) P
re-d
am
Pos
t-da
m
381
(S
O 7
6)
361
(S
O 7
6)
29
6 (
SO
64
) 2
92
(S
O 6
6)
46
7
514
37
2
36
8
170
2
36
1
12
169
So
urc
e
US
W
eath
er B
urea
u C
lima
tolo
gic
al
Dat
a
-J
W
~ T
AB
LE
2
Mea
n T
ota
l R
adia
l W
ood
Gro
wth
by
Spe
cies
and
Site
fo
r 20
-Yea
r P
re-D
am (
19
35
-19
54
) an
d P
ost-
Dam
(1
95
5-1
97
4)
(Un
ad
just
ed a
nd A
dju
sted
fo
r A
ge)
Per
iods
Spe
cies
Gre
en a
sh
Am
eric
an e
lm
Box
elde
r
Co
tto
nw
oo
d
(Mis
sour
i R
iver
)
Co
tto
nw
oo
d
(Lit
tle
Mis
sour
i R
iver
)
BU
r oa
k (M
isso
uri
Riv
er)
(B2)
(B
1)
Una
djus
ted
(AB
2)
To
tal
Rad
ial
To
tall
Rad
ial
Ad
just
ed
Rad
ial
Woo
d G
row
th
Woo
d G
row
th
Woo
d G
row
th
Num
bers
of
Per
Cor
e (m
m)
Per
Cor
e (m
m)
Per
Cor
e (m
m)
Cor
es a
nd
11
93
5-1
95
4
19
55
-19
74
1
95
4-1
97
4
Sta
nds
Incl
ud
ed
t X
X
X
34
(8)
3
65
2
89
30
4
48
(7)
36
1
23
5
264
29
(7
) 4
10
26
4
316
26 (
5)
47
2
30
6
41
3
25 (
4)
38
3
35
5
47
2
20 (
3)
32
0
29
6
Wilc
oxo
n S
ign-
Ran
k Z
-Val
ues
f (B
2-A
B2
)
-32
1 (p
lt 0
001
)
-48
1 (p
lt 0
0001
)
-26
5 (p
lt 0
00
8)
-12
4 (N
S)
+2
18
(p
lt 0
03
)
(B1-
B2
)
-22
0 (
p lt
00
3)
TA
BL
E 2
(co
ntin
ue
d)
(82
) (8
1)
Un
adju
sted
(A
82
) T
ota
l R
adia
l T
ota
l R
adia
l A
dju
sted
Rad
ial
Wo
od
Gro
wth
W
ood
Gro
wth
W
oo
d G
row
th
Nu
mb
ers
of
Per
Co
re (
mm
) P
er C
ore
(m
m)
Per
Co
re (
mm
)
Spe
cies
C
ores
an
d
Sta
nd
s In
clu
ded
t 19
35-1
954
X
1955
-197
4 X
19
54-1
974
X
Wil
cox
on
Sig
n-R
ank
Z-V
alu
es
(8
2-A
82
) (8
1-8
2)
Bur
oak
(S
carp
wo
od
lan
d)
10 (
1)
171
1
93
-1
4
8 (
NS
)
See
tex
t fo
r m
eth
od
of
adju
stm
ent
Po
st-d
am g
row
th o
f b
ur
oak
was
no
t ad
just
ed b
ecau
se m
ost
cas
es s
ho
wed
an
incr
ease
in
gro
wth
b
etw
een
th
e tw
o p
re-d
am p
erio
ds
tPar
enth
eses
in
dic
ate
stan
ds
incl
ud
ed
tSo
urc
e H
oll
and
er a
nd
Wol
fe [
1973
]
(J
1
76
TABLE 3 Median Percent Change in Growth for Pre-Dam (1935-1954)
and Post-Dam (1955-1974) Periods
Species Median Percent Change
Boxelder -26 American elm -25 Green ash -18 Bur oak (Missouri River) - 9
Cottonwood (Missouri River) - 6 Cottonwood (little Missouri River) +13 Bur oak (scarp woodland) +20
Species connected by vertical lines are not significantly different (multiple comparishysons test p lt 005 Hollander and Wolfe [1973]
TABLE 4 Frequency Table (Number of Stands) of Change
in Growth Relative to Terrace Elevation
Classes of Percent Change Terrace Elevation Class t
in Growth Low Medium High
Low 0 3
Medium 3 2 0
High 0 3
Low = less than 5 percent decrease medium = 5-20 percent increase high =greater than 20 percent increase
t Low = approximately 3 m above mean river level medium = approximately 4 m above mean river level high = approximately 5 m above mean river level
TA
BL
E 5
C
hara
cter
isti
cs o
f S
tan
ds
Sam
pled
for
Tre
e-R
ing
Chr
onol
ogie
s
Sta
nd
Spe
cies
Sam
pled
S
oil
Org
an
ic
N0
3-N
N
o
and
Mea
n A
ge
Te
xtu
re
Ma
tte
r (
) (p
pm
)
Mis
sou
ri R
ive
r F
loo
dp
lain
5
Co
tto
nw
oo
d (
80
yea
rs)
sand
0
76
1
3
14
Co
tto
nw
oo
d (
10
0 y
ears
) si
lty-
cla
y 2
22
2
4
12
A
me
rica
n e
lm (
80
yea
rs)
silt
y-cl
ay
29
2
16
1
3
Am
eri
can
elm
(1
35
yea
rs)
silt
y-c
lay
26
9
43
1
9
Am
eri
can
elm
(1
05
yea
rs)
silt
4
40
3
6
16
B
ur
oa
k (1
25
yea
rs)
silt
y-cl
ay
40
7
32
Ref
eren
ce S
ites
Lit
tle
Mis
sour
i R
iver
C
ott
on
wo
od
(1
00
yea
rs)
Sca
rp w
oo
dla
nd
B
ur
oa
k (1
20
yea
rs)
So
urc
e f
or
soil
cha
ract
eri
stic
s J
oh
nso
n
Bur
gess
an
d K
ea
mm
ere
r [1
97
6]
Ele
vatio
n A
bov
e
Mea
n R
ive
middotr Le
vel
(m)
30
32
3
5
40
4
0
50
28
-J
-J
-J co
TA
BL
E 6
R
esul
ts o
f S
tep
wis
e M
ulti
ple
Reg
ress
ion
Ana
lysi
s U
sing
Tre
e-R
ing
Inde
x as
th
e D
epen
den
t V
aria
ble
an
d 1
5 I
nd
epen
den
t V
aria
bles
(C
lim
ate
Str
eam
flo
w
Pre
viou
s Y
ear
s G
row
th)
Sta
ndar
dize
d S
peci
es
Inte
rce
pt
Reg
ress
ion
Co
eff
icie
nt
Co
tto
nw
oo
d
Sta
nd 5
P
re-d
am
-27
6 +
82
8
-20
3 +
36
0
+3
33
-3
52
Pos
t-da
m
-64
8 +
16
9
+5
76
+
26
2
-37
3 +
04
2
Sta
nd 1
4 P
re-d
am
-21
7 +
41
0
+3
24
-2
48
+6
62
+0 4
7
Post
-dam
-1
5
+4
20
-5
44
+11
71
+2
99
-34
9
En
viro
nm
en
tal
Var
iabl
es
Ap
ril-
Ma
y F
low
(A
MF
L)
Ju
ne F
low
(JU
NE
F)
Spr
ing
Pre
cip
Y-l
(S
PG
P1)
S
prin
g P
reci
p (S
PG
P)
Spr
ing
AE
Y-l
(S
PG
AE
1)
June
Flo
w (
JUN
EF
)
Spr
ing
AE
(S
PG
AE
)
Spr
i ng
Te
mp
Y-l
(S
PG
T1)
F
all
Te
mp
Y-l
(F
AL
LT
1)
Pre
viou
s G
row
th (
AV
E 5
-1)
A p
ril-
May
Flo
w (
AM
FL
)
Spr
ing
Pre
cip
Y-1
(S
PG
P1)
A
pri
l P
reci
p (A
P)
S
pri
ng
Pre
cip
(SP
GP
) P
revi
ous
Gro
wth
(A
VE
14
-1)
Spr
ing
Pre
cip
Y-l
(S
PG
P 1
)
Spr
ing
Pre
cip
(SP
GP
) S
prin
g A
E (
SP
GA
E)
S
pri n
g T
em
p Y
-l (
SP
GT1
)
Fal
l T
emp
Ymiddotl
(F
A L
LT
1)
r2
F
p
08
2
162
3 0
0001
0 7
1 8
61
00
00
3
07
3
98
6
00
001
07
5 10
61
00
001
TA
BL
E 6
(co
ntin
ue
d)
Sta
ndar
dize
d S
peci
es
Inte
rce
pt
Reg
ress
ion
Co
eff
icie
nt
En
viro
nm
en
tal
Var
iabl
es
r2
F p
Bur
oak
S
tand
16
Pre
-dam
-2
814
+
38
0
Ap
ril-
Ma
y F
low
(A
MF
L)
05
2
312
0
03
+2
98
S
prin
g A
E Y
-1
(SP
GA
E 1
) +
47
9
Spr
ing
Te
mp
Y-1
(S
PG
T1)
+
35
8
Fal
l T
em
p Y
-1
(FA
LLT
l)
-49
9 S
prin
g T
emp
(SP
GT
) +
024
P
revi
ous
Gro
wth
(A
VE
16-
1)
Pos
t-dam
-4
216
+
39
5
Ap
ril-
Ma
y F
low
(A
MF
L)
077
12
06
00
00
1 +3
61
June
Flo
w Y
-1
(JU
NE
F1
) +
23
5
Ap
ril
Pre
cip
(AP
) +
417
S
prin
g A
E (
SP
G A
E )
+3
10
S
prin
g T
em
p (
SP
GT
)
Sca
rp w
oo
dla
nd
P
re-d
am
-18
9 -3
01
June
Flo
w (
JUN
EF
) 0
36
269
0
06
2 +
38
0
Spr
ing
Pre
cip
Y-1
(S
PG
P1)
+
30
3
Ap
ril
Pre
cip
(A P
) +
387
S
prin
g A
E (
SP
GA
E)
Pos
t-dam
-7
37
+34
4 Ju
ne F
low
Y-1
(J
UN
EF
1)
04
1
33
3 0
032
+
19
5
June
Flo
w (
JUN
EF
) +
227
S
prin
g P
reci
p (S
PG
P)
+04
1 P
revi
ous
Gro
wth
(A
VE
10
-1)
-J co
(co
nti
nu
ed
)
00
a
TA
BL
E 6
(co
nti
nu
ed
)
Sta
ndar
dize
d S
peci
es
Inte
rce
pt
Reg
ress
ion
Co
eff
icie
nt
En
viro
nm
en
tal
Var
iabl
es
r2
F
p
Am
eri
can
elm
S
tand
12
Pre~am
+3
69
4
+3
96
A
pri
l-M
ay
Flo
w (
AM
FL
) 0
55
3
42
00
211
-48
3 Ju
ne F
low
(JU
NE
F)
+9
89
S
prin
g P
reci
p Y
-1
(SP
GP
1)
+3
35
S
prin
g P
reci
p (S
PG
P)
-49
3 S
prin
g A
E (
SP
GA
E)
-33
8 S
prin
g T
emp
(SP
GT
)
Post~am
-13
77
-29
7 A
pri
l-M
ay
Flo
w Y
-1
(AM
F L
1)
04
7
25
5
00
6
+5
47
June
Fl o
w Y
-1
(JU
NE
F1
) -5
78
A
pri
l-M
ay
Flo
w (
AM
FL
) +
68
5
June
Flo
w (
JUN
EF
) -2
45
Fal
l T
em
p Y
-1
(FA
LL
T1
) -3
72
Spr
ing
Te
mp
(S
PG
T)
Sta
nd 1
3 Pre~am
+3
08
3
-50
0 A
pri
l-M
ay
Flo
w Y
-1
(AM
FL
1)
06
3
61
8
00
01
7
+3
13
Ju
ne F
low
Y-1
(J
UN
EF
1)
+52
1 S
prin
g P
reci
p Y
-1
(SP
GP
1)
+2
85
S
prin
g T
em
p Y
-1
(SP
GT
1)
-62
8 S
prin
g T
em
p (
SP
GT
)
Post~am
+52
51
-69
8 S
prin
g P
reci
p Y
-1
(SP
GP
1)
05
4
552
0
00
4
+1
00
9
Spr
ing
AE
Y-1
(S
PA
E1)
-3
64
Spr
ing
Te
mp
Y-1
(S
PG
T1)
-4
15
Ap
ril
Te
mp
(A
T)
TA
BL
E 6
(co
ntin
ue
d)
Sta
ndar
dize
d S
peci
es
Inte
rce
pt
Reg
ress
ion
Co
eff
icie
nt
En
viro
nm
en
tal
Var
iabl
es
r2
F
p
Sta
nd 1
9
Pre
ltlam
+
19
98
+
39
5
Ap
ril-
Ma
y F
low
(A
MF
L)
05
1 3
70
0
01
76
+
11
06
S
prin
g P
reci
p Y
-1
(SP
GP
1)
-99
4 S
prin
g A
E Y
-1
(SP
GA
E1)
-4
91
Spr
ing
Te
mp
(S
PG
T)
Pos
tltla
m
-11
34
+4
57
Ap
ril-
Ma
y F
low
Y-1
(A
MF
L1)
0
67
73
8
00
00
6 -5
44
Ap
ril-
Ma
y F
low
(A
MF
L)
+6
29
Ju
ne F
low
(JU
NE
F)
-19
7 A
pri
l P
reci
p (A
P)
+3
47
S
prin
g A
E (
SP
GA
E)
co
82
TABLE 7 Results from the Modified Regression Model
Stand Pre-Dam Post-Dam
Cottonwood 5 Streamflow A E
(0004) t (001)
14 Streamflow AE (002) (001 )
Elm 12
13
19 AE (003)
Oak 16 AE AE
(005) (0006)
Streamflow (0006)
Scarp woodland AE (005)
Growth = growing season AE and growi ng season streamflow using the G LM proshycedure in SAS [Helwig and Council 1979] Growing season is May June and July
tParentheses indicate levels of significance
TABLE 8 Missouri River Erosion and Deposition Rates at Various Time Intervals
Time Total Erosion Total Deposit ion Interval Time (yr) Erosion (ha) Rate (hayr) Deposition Rate (ha yr)
1881-1891 10 1328 133 1650 165
1891-1945 54 4648 86 5464 101
1945-1969 22 1704 77 937 43
1969-1979 10 212 21 13 13
TA
BL
E 9
M
isso
uri
Riv
er L
and
Use
Cha
nges
Sin
ce E
arly
Set
tlem
ent
Per
cen
tage
of
Cov
erag
e
Cat
egor
y T
ime
Peri
od
Pre
-set
tlem
ent
Pos
t-se
ttle
men
t
Agr
icul
ture
18
72-1
938
38
A
gric
ultu
re
1938
-197
9 18
C
otto
nwoo
d w
illo
w
lt 40
yea
rs o
f ag
e 14
3
Cot
ton
woo
d 40
-80
year
s o
f ag
e p3
10
C
otto
nwoo
d a
sh
elm
bo
xeld
er
80-1
50 y
ears
of
age
30
21
Ash
el
m
boxe
lder
gt
150
yea
rs o
f ag
e 3
10
co
w
(I)
w CJ z C ()
W (I)
l I
Q Z C
J W Z Z C ()
ac w gt ac
The Virginia Water Resources Research Center is a federal-state partnership agency attempting to find solutions to the states water resources problems through careful research and analysis Established at Virginia Polytechnic Inshystitute and State University under provisions of the Water Research and Develshyopment Act of 1978 (PL 95-467) the Center serves six primary functions
bull It studies the states water and related land-use problems including their ecological political economic institutional legal and social i mpl ications
bull It sponsors coordinates and administers research investigations of these problems
bull It collectsmiddotand disseminates information about water resources and water resources research
bull It provides training opportunities in research for future water scienshytists enrolled at the states colleges and universities
bull It provides other public services to the state in a wide variety of forms
bull It facilitates coordinated actions among universities state agencies and other institutions
More information on programs and activities may be obtained by writing or te lephoning the Center
Vi rgin ia Tech does not discriminate against employees students or applicants on the basis of race sex handicap age veteran status national origin religion or political affiliation The Un iversity is subject to Titles VI and VII of the Civil Rights Act of 1964 Title IX of the Education Amendments of 1972 Sections 503 and 504 of the Rehabilitation Act of 1973 the Age Discrimination in Employment Act the Vietnam Era Veteran Readjustment Assistance Act of 1974 Federal Executive Order 11246 Governor Robbs State Executive Order Number One and all other rules and regulations that are applicable Anyone having questions concerning any of those regulations should contact the Equal OpportunityAffirmative Action Office
Virginia Water Resources Research Center Virginia Polytechnic Institute and State University
617 North Main Street Blacksburg Virginia 24060-3397
Phone (703)961-5624

US EPA - A WBERC LIBRAR Y
11111111111111111111111111111111111111111111111111307011004 8407 7
Altered Hydrology of the Missouri River and
Its Effects on Floodplain Forest Ecosystems
W Carter Johnson Peggy W Reily
L Scott Andrews James F McLellan
Department of Biology Virginia Polytechnic Institute and State University
John A Brophy
Department of Geology North Dakota State University
Fargo North Dakota 58102
The work upon which this report is based was supported in part by funds provided by the United States Department of the Interior
Project B-1 08-VA VP I-VWR RC-BU LL 139
35C
A publication of Virginia Water Resources Research Center
Virginia Polytechnic Institute and State University Blacksburg Virginia 24060-3397
ii
middot v l-7 n I Contents of th is pub l ication do not necessarily reflect
the views and policies of the United States Department of the Interior nor does mention of t rade names
of commercia l products const it ute their endorsement or recommendat ion for use by the United States government
Additional copies of this publication while the supply last s may be obtained f rom
the Virginia Water Resources Research Center Single copies are provided free to persons
and organizations within Virginia For those out-of-state the charge is $6 a copy
if payment accompanies the order or $8 a copy if billing is t o follow
TABLE OF CONTENTS
List of Figures iv
List of Tables v
List of Microfiches vi
Acknowledgments vi
Abst ract 1
Introduction 3
Study Area 5 I Physiography 5
II Geologic History 5 III Geologic Materials of the Trench 6 IV Soils 7 V Stream Hydrology 8
VI Natural Vegetation Dynamics 9
Tree Growth 12 I Methods 12
II Results and Discussion 14 A Environmental Variables 14 B I nter-Period Comparisons of Cumulative Growth 16 C Patterns of Annual Radial Tree Growth 18 D Multiple Regression Analysis 19
Land Use and River Hydrology 23 I Methods 23
A River Meandering Rate bull 23 B Land Use Change 24
II Resu Its and Discussion 25
Tree Population Structure 30 I Methods 30
II Results and Discussion 31
Conclusions 36
iii
Literature Cited 39
Figures 45
Tables 71
Microfiches insert
LIST OF FIGURES
1 Location and Number of Study Sites in North Dakota 47
2 Monthly Streamflow (1928-1977) from the Bismarck Gauging Station on the Missouri River 48
3 Streamflow for June and February 1928-1977 at the Bismarck Gauging Station on the Missouri River 50
4 Percent Change of Overbank Flooding at Different Terrace Elevations Based on the Relationship Between Maximum Gauge Heights and Known Terrace Elevations 52
5 Groundwater and Streamflow Data (1971-1973) from the Missouri River near Bismarck 53
6 American E1m Chronologies (1928-1977) from Stands 12 13 19 and 1654
7 Bur Oak Chronologies (1928-1977) from Stand 16 and the Scarp Woodland Reference Site 56
8 Cottonwood Chronology (1928-1977) from the Little Missouri Reference Site 58
9 Cottonwood Chronologies (1928-1977) from Stands 5 and 14 60
10 Smoothed Plots of Spring AE Versus Year and Spring (May June July) Streamflow Versus Year 62
iv
11 Results of Stepwise Mult iple Regression Analysis of Cottonwood from Stands 5 and 14 for Pre-Dam (1928-1952) and Post-Dam (1953-1977) Periods 64
12 Age Structu re of American EIm and Boxelder Popu lations in Four Treatment Stands on the Missouri River Floodplain in North Dakota 66
13 Age Structure of American E1m and Boxelder Populations in Reference Stands on the Missouri River Floodplain in North Dakota 68
LIST OF TABLES
1 Precipitation and AE Statistics for Pre-Dam (1935-1954) and Post-Dam (1955-1974) Periods73
2 Mean Totall Radial Wood Growth by Species and Site for 20-Year Pre-Dam (1935-1954) and Post-Dam (1955-1974) (Unadjusted and Adjusted for Age) Periods 74
3 Median Percent Change in Growth for Pre-Dam (1935-1954) and Post-Dam (1955-1974) (Adjusted for Age) Periods76
4 Frequency Table (Number of Stands) of Change in Growth Relative to Terrace Elevation 76
5 Characteristics of Stands Sampled for Tree-R ing Chronologies 77
6 Results of Stepwise Multiple Regression Analysis Using Tree-Ring Index as the Dependent Variable and 15 Independent Variables (Climate Streamflow Previous Years Growth) 78
7 Resu Its from the Modified Regression Model 82
8 Missouri River Erosion and Deposition Rates at Various Time Intervals 82
9 Missouri River Land Use Changes Since Early Settlement 83
v
vi
LIST OF MICROF ICH ES
1 Missou ri River Channel Changes insert
2 Missouri River Floodplain Land Use insert
ACKNOW LEDGMENTS
A number of colleagues assisted us during t he course of the project N Fetcher (Duke Un iversity) T Shar ik (Vi rginia Tech) R Burgess (SUNY-Syracuse) and J Cairns Jr (V irgi nia Tech) We especially t hank R Phipps of the USGS Tree- Ring Lab fo r the use of the Reston Vi rgin ia facilities G Holtzman and the Virginia Tech Stat ist ical Consu lting Lab advised us in statistical matters The North Dakota Historical Society and the North Dakota Water Commission provided maps and other historical information Robert Levis (Cross Ranch) and the Natu re Conservancy were helpful during the field work
Special acknowledgment is made to the following who generously gave their time to a critical review of the manuscript Benjamin L Everitt Division of Water Resources State of Utah Salt Lake City Marjorie M Holland Department of BiologyColiege of New Rochelle New Rochelle New York and Philip A Robertson Department of Botany Southern Illinois University at Carbondaie Acknowledgment is made also to Nancy L Chapman for editorial processing and typesetting and to Gretshychen S Bingman for layout composition
ABSTRACT
It is generally expected that construction and operation of a floodplain protection project will alter a river systems hydro logic regimen But this altered regimen also has been suspected of having major long-term efshyfects on the natural dynamics of riparian ecosystems that remain in gaps between large reservoirs This study confirms that hypothesis by docushymenting some of those impacts in an area between Garrison Dam and Oahe Reservoir on the Missouri River in south-central North Dakota Specifically it examines post-dam changes in river meandering rate floodplain forest composition tree population structure and tree growth rate
Post-dam hydrologic regimen differs markedly from the pre-dam regimen Although precipitation and actual evapotranspiration have changed little since Garrison Dams construction streamflow patterns have changed considerably Large amounts of water are now released for electricity generation in the nongrowing-season months and streamflow for June (mid-growing season) is now lower than June flows recorded in the drought years of the 1930s Post-dam flow patterns therefore are out of phase with the vernal growth pattern typical of floodplain trees Since the dams construction flooding has been eliminated on terraces more than 2 m above mean river level thus reducing moisture and nutrient influx to higher terraces River meandering has all but ceased accretion rates have fallen to 1 percent and erosion rates to 25 percent of pre-dam levels
Data yvere collected at 13 forest stands with in the 130-river-km study area and at two reference sites (one on a stream unaltered by flood conshytrol structures and the other a scarp woodland located above the floodshyplain) Floodplain tree species studied were cottonwood (Populus delshytoides) peach-leaved willow (Salix amygdaloides) boxelder (Acer negunshydo) green ash (Fraxinus pennsylvanica var lanceolata) American e lm (Ulmus americana) and bur oak (Quercus macrocarpa) Evaluation of the data revealed that Garrison Dam and Oahe Reservoir have had significant impact on the areas riparian ecosystem including altering streamflow patterns eliminating much of the flooding and silt deposition that had occurred along the pre-dam river decreasing river meandering rates but widening the river channel causing a decline in radial tree growth in species whose natural sources of moisture have been altered by the dam changing the composition of floodplain forests by preventing regenerashy
2
tion of Populus-Salix forests and lowering seedling survivorsh ip of Ulmus americana and Acer negundo and encouraging t he clearing of f loodplain forests for agr icul ture with improved irrigation opportunities
Resu Its of th is study shou Id have appl ication to f orests on other floodshyplains where the natural hydrologic regimen has been altered by man This research should stimulate further study of riparian ecosystems so that a more general assessment can be made of the ecologica l effects of floodplain protection
Key Words Floodplains Floodplain Protection Floods Forests Dams Riparian Ecosystems Riparian Vegetation Rivers River Meandering Growth Survivor~hip Land Use North Dakota Missouri River
INTRODUCTION
The ecological impacts of constructing impoundments on river systems are many and varied On-site impacts have been t he focus of most reshysearch [Baxter 1977] A few stud ies document t he rap id loss of native riparian habitats wi t hin the impoundment basin (for example Yeager [1949] ) but most eva luate changes in aquat ic organisms and water qualshyity during and after th e f illing of reservoi rs [Kujawa 1974 Ridley and Steele 1975] Off-site impacts of reservoir construction have received little study except for t he r iver env ironment itse lf (water quali ty mon ishytoring fish population dynamics) Potential downstream effects assoshyciated wi th adjacent fl oodp la in ecosystems have been neglected perhaps because (1) the effects are not immediately noticeable and hence less dramatic compared to the changes associated w ith t he filling of resershyvoirs or (2) native riparian ecosystems had on many fl oodplains la rgely been removed for agriculture before dam const ruct ion Recently KosshyIer [1979] noted serious gaps in research concerning wetl andf lood intershyrelationsh ips and the reaction of wetl ands and floodplai ns to stress
Trees on floodplains in semi-arid regions exhibit vernal growth patterns [Brown Lowe and Hausler 1977 Everitt 1980) That is growth occurs earlly in the growing season when water is readi ly avai lable and ceases in mid-summer as moisture is depleted Production and dissemination of seeds also occur in the sp r ing Although moisture is of major importance to the distribution and growth of f loodplain trees the relat ive imporshytance of the various sources of water available is poorly known
Potentiai sources of moisture f or floodpllain trees include overbank fl oodshying groundwater and precipitation (capillary water) Overbank f looding is responsible for much physical damage to f lloodplain trees [McKenzie 1936 Sigafoos 1964] and in humid cII imates may be responsible for the distribution of floodplain species according to their tolerance to flooding [Bedinger 1971 Bell and del Moral 1977 Robertson Weaver and Cavashynaugh 1978] In dry climates however flooding may benefit trees by saturating the rooting zone and raising the water t able just before the onset of growth
The dynamics of riparian woodlands are closely t ied to the dynamics of two physical processes flooding and river meandering Significant changes in the rates of these natural perturbations would be expected to alter the properties of riparian ecosystems and the f lloodplain landshy
3
4
scape Our stu dies indicate that the cessation of fl ood ing and related changes in hydrologic regimen associated with the presence and operashytion of reservoirs are having major and long-term effects on the natural dynamics of remnant riparian ecosystems This conclusion is based on investigations of a protected floodpla1in bounded north and south by two large reservoirs along the upper Missouri River in North Dakota
Johnson Burgess and Keammerer [1976] first noted that major ecologishycal changes in riparian ecosystems along this stretch of the Missouri River had been init iated by reservoir construction The pu rpose of this research was specifically to test three hypotheses [Johnson Burgess and Keamshymerer 1976] through new field research in 1979 and 1980 The three hypotheses were that the altered hydrologic regimen caused by the presshyence and operation of reservoirs had initiated (1) adecline in d iameter growth rate of trees (2) a reduction in river meandering rate and landshyscape composition and diversity and (3) changes in the population strucshyture of several important tree species Tests of the three hypotheses are considered separately in th is report effects on tree growth are considered first meandering rate and forest composition sec~md and population structure third Histork and recent patterns of Iand use change also are analyzed in the second section
STUDY AREA
The study area included floodplain forests along a 130-rriver km portion of the Missouri River Valley located in south-central North Dakota (Figshyure 1) Garrison Dam (Lake Sakakawea) completed in 1953 forms the northern border while the Oahe Reservoir some 10 km south of Bisshymarck forms the southern border Most forests studied were on the floodplain within the study area however reference sites for tree growth analysis were selected in scarp woodlands west of Price North Dakota and along the Little Missouri River in western North Dakota (Figure 1) The climate of the study area is characterized by low humidity and low annual precipitation Mean annual precipitation is 39 cm 70 percent of it occurring during the growing season (approximately May 10 to Sepshytember 27) [Randich and Hatchett 1966]
I Physiography
This segment of the Missouri Valley lies in the Missouri Slope district of the Glaciated Missouri Plateau section of the Great Plains physioshygraphic province [Fenneman 1931 Lemkeand Colton 1958 Clayton 1962] The valley is trench-I ike varying in width from about 1 km to more than 11 km and is cut as much as 170 m below an upland undershylain by glacial drift and Tertiary and Cretaceous bedrock The trench is floored by a broad floodplain bounded locally by terraces The floodshyplain descends from an el1evation of 515 m at Garrison Dam to 494 m at the junction with Oahe Reservoir a total drop of 21 m in about 130 river km giving an overall gradient of about 015 m per km
II Geologic History
This segment of the Missouri Valley did not exist before Quaternary glaciation The preglacial Missouri flowed northeastward from Montana across the northwest corner of North Dakota into Saskatchewan [Lemke et aI 1965] and was diverted into its present course by southwestward advancing -continental ice sheets The timing and sequence of events inshyvolved in this diversion are not completely known
The most recent studies of this problem are by Bluemle [1971] and Carlshyson [1973] both of whom suggest a complex history of diversions by various ice advances which forced the Missouri into a course involving segments of eastward-trending preglacial valleys and new segments cut
5
6
by water diverted across former divides Bluemle shows that the wide segments of the present trench are those that were parts of preglac ial val leys and t he narrow segments are those that were cut by water diverted across divides He also suggests that f inal diverting and assumption of the present cou rse of the Missouri did not occur until late Wisconsinan time less than 15000 years ago
The terraces along the trench were developed as the river incised itsel f below former floodplain levels leaving remnants of those floodplains Some of them are eroded bedrock surfaces mantled with glacial drift and represent f loodplains formed in reoccupied preglacial valley segshyments formed during pre-Wisconsinan glacial diversion [Carlson 1973] Other terraces are underlain by sand and gravel and resulted from glacial valley trains [Brockman et aI 1979]
The defin itive study of Missouri River terraces has not yet been made and various authors who have studied different segments of t he trench disagree on the number of terraces and their historical interpretation Kume and Hanson [1965] recognized four terrace levels in Burleigh County two high outwash terraces and two low alluvial terraces Carlson [1973] working in Mercer and Oliver counties recognized only two tershyraces an upper one that corresponded to the high outwash terraces of Kume and Hanson and a lower one that included their two lower alluvial terraces Carlson believed that the two lower terraces represent the preshydam floodplain
Post-glacial changes in the trench have not been great The floodplain was established and modified by lateral cutting of the meandering river The valley walls have been gullied by new dra inage lines eroding headward into adjacent uplands and by slopewash Wind has piled sand into dunes locally and soils have formed on the various trench sediments
III Geologic Materials of the Trench
The trench walls expose the various materials cut through by the eroding river At the top are glacial sediments (generally thin and locally lacking) including till and lesser amounts of glacio-fluvial sands and gravels loess eolian sand and glacial lake sediments ~Iost of the depth of the t rench is cut in bedrock of early Tertia ry and (in the Bismarck-Mandan area) late Cretaceous age [Kume and Hanson1965 B luemle 1971 Carlson 1973] The Tertiary units include interbedded sands silts clays shales
and lignite beds belonging to the Paleocene Cannonbal l Slope Bullion Creek and Sentinel Butte formations The late Cretaceous beds are mudstones sandy sh ales sandstones and I ign ites of the Hell Creek f orshymation
Most of the high terraces are underlain by sand and gravel and are loessshycovered in some areas but some are underlain by drift-mantl ed bedrock [Kume and Hanson 1965 Carlson 1973] The low terraces essentially the modern pre-dam floodplain are underlain by recent alluvium includshying flood overbank deposits channel deposits and natural levee deposits Overbank silts and clays compose about 90 percent of these sediments with sand and gravel of channel and levee deposits composing about 10 percent [B luemle 1971] The thickness of this Holocene component may be as much as 35 m or more but it is often difficult to distinguish from similar glacial sediments upon which it rests
IV Soils
Soils of the Missouri trench have been described in county soil surveys of McLean County [Brockman et aI 1979] Olliver County [Weiser 1975] Mercer County [Wilhelm 1978] and Burleigh County [Stout et aI 1974] The floodplain soils that support the forests of the study area are Entisols of the Typic Ustifluvent or Typic Fluvaquept subgroups The Havrelon series dominates generally comprising 50 to 75 percent of the floodplain soils It is formed from loamy alluvium on the slightly higher elevations and is calcareous and well drained It has moderate permeability high available water capacity medium natural fertility and low organic matter
Areas of sandy alluvium such as natural levees and inter-channel islands are occupied mainly by the Banks series which has moderately rapid permeability low available water capacity low natural fertility and low organic matter Clayey alluvium of floodplain depressions (mainly oxshybows) is occupied mainly by the Lallie series which has slow permeabilshyity high available water capacity low natural fertility and low organic matter
Floodplain soil profiles tend to have thin greyish A horizons no B horishyzons and C horizons that vary somewhat in texture because of alluvial stratification All horizons tend to be mildly to moderately aikaline
7
8
V Stream Hydrology
The filling of Lake Sakakawea began in November 1953 At that time the natural hydrologic regimen was replaced by a controlled-release regishymen and the river began a series of adjustments to this alteration
Two major alterations in downstream regimen could be expected to result from damming (1) reduction of peak annual flow (mean annual flood) because of impoundment of excess runoff and (2) reduction of sediment load because of sediment deposition in the reservoir from upshystream
Continuous daily discharge records from 1928 to present recorded at the US Geological Survey Gauging Station No 06342500 at Bismarck (120 km downstream from the dam) permit a comparison of the preshydam and post-dam discharge These data show no significant change in overall discharge The mean of daily discharge readings for 25 pre-dam years (water years 1928-29 to 1952-53) is 1999 cms compared to 2204 cms for 25 post-dam years (water years 1954-55 through 1978-79) This decrease in discharge because of the initial filling of the reservoir (1953shy1963) was offset by the low discharges resulting from the dry climate of the 1930s
Seasonality of discharge has changed considerably The pre-dam (1928shy1952) pattern of monthly streamflow shows peak flow occurring from Apri l to July and minimum flow occurring from December to March (Figure 2) The sharp peaks in streamflow in the spring and early sumshymer in the pre-dam period are largely absent after 1953 Overall peak flow now occurs in February and March instead of April May and June and minimum flow occurs mainly in May and September instead of January and February
Seasonal flow rates are especially different for the months of June and February (Figure 3) June streamflow in the drought years of the 1930s was much higher than June streamflow since completion of the dam Extrapolating from gauge height the spring water table on the average would be considerably lower since 1953 and the late-summer water table would perhaps be higher Therefore the period of peak flow is now out of phase with the vernal growth pattern typical of floodplain trees
Mean annual low flow (mean of the lowest mean daily discharge readings
over a number of years) has been increased by abou t 155 percent Mean annual low fl ow for the 25 pre-dam years was 405 cms compared to 1 032 cms for the 25 post-dam years The minimum annual low flow for the 25 pre-dam years was 167 cms (January 1940) compared to 372 cms (March 1955) in the 25 post-dam years an increase of about 122 percent
I n addition to these changes in flow changes in the sed iment load could also be expected Both suspended load and bed load from upstream are trapped in the reservoir Thus the water released into the trench below the dam is essentially sediment-free and able to acquire a new load from materials available in the trench Unfortunately data are not available to compare pre-dam and post-dam sediment loads
Overbank flooding is the element most obviously missing from the postshydam floodplain environment Flooding now occurs on only the lowest terraces in part as a result of local ice jams in the spring Flooding above the 2-m terrace elevation has been eliminated (Figure 4) In the past the 3-m elevation was flooded on the average of once in 35 years and the 4-m elevation approx imately once in 6 years Terrace elevations of the stands sampled ranged from 3 to 5 m above mean river level The highest stand was flooded on the average of once in 25 years Because of ice jams in the pre-dam period the above frequencies are probably low for some locales Landowners report higher flood frequencies (25 percent or greater)
The mean annual flood (mean of the highest mean daily discharge readshyings over a number of years) has been reduced by about 68 percent Mean annual flood for the 25 pre-dam years was 11064 cms compared to 3554 cms for the 25 post-dam years The maximum annual flood (highest mean daily discharge reading) for the 25-year pre-dam period was 33736 cms (April 1952) compared to 6394 (July 1975) lin the 25 post-dam years a reduction of 81 percent
VI Natural Vegetation Dynamics
The predominant vegetation of the region is mixed grass prairie [Kuchshyler 1964] Small pockets of scarp woodland occur in protected upland ravines but the most extensive forests occur on the floodplain Clearing for agricu Itu re has reduced these forests to about 50 percent of their original extent Floodplain tree species include cottonwood (Populus
9
10
deltoides) peach-leaved willow (Salix amygdaloides) boxelder (A cer negundo) green ash (Fraxinus pennsylvanica var lanceolata) A merican elm (Ulmus americana) and bur oak (Quercus macrocarpa)
Most of t he worlds fl oodp lains have been formed by the effects of deposition and overbank flow [Wolman and Leopold 1957] Deposit ion as we as erosion is dependent upon lateral m igration of the river across the floodp lain A s the r iver deposit s alluv ium on the inside of a meanshyder it erodes mater ial from the opposite bankline Overbank flow usually results from heavy spring rains combined wi th rapid snow melt Downshycutting by t he river and upbuilding of the terrace from alluvial deposishytion during f loods eventually leaves some terraces well above the active floodp lain Leopold Wol man and Miller [1964] referred to such r iver terraces as t he abandoned f loodpla in
Vegetation patterns correspond to the dynamics of deposition and eroshysion Lateral movement of the river in it iates a dynamic series of vegetashytion events As t he river meanders it erodes away estab lished banks often covered w ith fo rest vegetation in different stages of devel opment However fully exposed alluvium deposited in the inside of river curves is prime habitat fo r the establ ishment of t ree seedl ings of pioneer species (for example cottonwood peach-leaved w i llow) Of the six tree species occurr ing on the floodplain only cottonwood and willow germinate and persist under t hese conditions Cottonwood and willow are classic pioshyneer species the seeds of neither species germinate under a forest canopy or in light gaps This illustrates the importance of point bar deposition by the meander ing river in maintaining cottonwood-willow commu nities as an important and integral component of the floodplain ecosystem
If cottonwood-wi now communities remain uneroded forest s of these tree species will develop Should they be missed by t he meandering river for centuries however the overstory will be replaced by admixtures of green ash boxelder Amer ican elm and bur oak through natural successhysion Thus there is a strong positive correlation between terrace elevati on and forest successional stage Higher terraces that have escaped erosion and were exposed to fewer floods of less intensity are more likely to contain vegetation of advanced successional stages
The cessation of floodi ng and a decline in the meandering rate would have at least two major consequences (1) reduce the amount of subshystrate (freshly deposited alluvium) for the regeneration of new cott onshy
wood-wil low forests and (2) allow a greater proportion of existing forests to age and change type t hrough natura l succession The net effect would be to reduce the land area of cottonwood-will ow forest now the most extensive forest t ype in favor of forests of ash boxelder elm and oak Old cottonwood-wil low forests exhib it the greatest tree species diversity [Johnson Burgess and Keammerer 1976] and have the greatest r ichness and density of breeding birds [H ibbard 1972] T he major forest communities also exhibit divergent understory species mineral cycl ing patterns and fau na [ Kroodsma 1970 Hibbard 1972 Keammerer 1972 Keammerer Johnson and Burgess 1975]
11
12
T REE GROWTH
Research to t est t he hypothesis that alteration of the hydrologic regimen was responsible for decreased tree growth had three components First we examined the degree to which environmental variables important to tree growth had changed from pre-dam to post-dam periods Second cumulative growth of trees was compared during two 20-year periods to determine pre-dam and post-dam growth patterns Third tree-ring chronologies were constructed and the growth patterns related statisshytically to a series of environmental variables using multiple regression procedu res
I Methods
Th irteen forest stands (Figure 1) were selected for tree core sampl i ng The stands included a range of vegetation and physiographic conditions and showed little or no sign of current or past disturbance One refershyence site was located along the Little Missouri River in western Nort h Dakota with in the Theodore Roosevelt National Park (Figure 1) The Little Missouri is a free-flowing stream whose flow patterns have not been altered by flood control structures Cottonwood and willow preshydominate although green ash boxelder and American elm occur as well The Little Missouri is a much smaller river than the Missouri average flows are 1733 for the Little Missouri and 6409 cms for the Missouri [US Geological Survey 1928-1977]
A second reference site was a scarp woodland [Wells 1965] located above the floodplain (Figure 1) Vegetation was similar in composition to that of the mesic terraces of the Missouri River with bur oak green ash American elm and boxelder the dominant tree species Scarp woodland trees rely exclusively on precipitation which is concentrated in local ravines Growth of these trees should more closely ref lect patshy
terns of precipitation than floodplain trees
The reference sites were selected because they were similar to the M1isshysouri River floodplain sites in vegetation and general climatic conditions but had not undergone any major environmental modifications between pre- and post -dam periods The term reference was used rather than IIcontrol because a number of small differences existed between refershyence and treatment sites (for example 39 cm mean annual precipitation for the Missouri 37 cm for the Little Missouri)
Trees were selected for sampling if they were at least 70 years old and displayed no sign s of disease or decay Also trees were exc luded if a nearby competitor had d ied Tree cores were collected using an increshyment borer and were dried mounted and surfaced A number of cores were initially measu red with a dendrochronometer to establish a system of cross-dating to facilitate accurate measurement of the remaining samshyples [Stokes and Smi ley 1968]
Three 20-year increments of growth (two pre-dam periods 1915-1934 1935-1954 one post-dam period 1955-1974) were measured for aU cores Because diameter growth of trees usually decreases with age it was necessary to adjust the measurements of the post-dam growth to compare them to groyvth during the immediate pre-dam period when trees were younger Standard dendrochronological procedures to correct for aging [F ritts 1976] were not su itable here as none discrim inates beshytween decrease in growth due to age and decrease due to long-term envishyronmental changes (for example altered river hydrology) low-frequency trends are removed
To correct for age we adjusted (increased) postdam growth by multishyplying it by the proportional change in growth that occurred between the two pre-dam periods The proportional change or multiplier was the quotient calculated by dividing growth during the first pre-dam period (1915-1934) by growth during the second (1935-1954) Cores that showed a growth decline between the pre-dam periods were adjusted in the above manner for all species except bur oak (henceforth referred to as adjusted for age) For example a core with 50 mm and 40 mm growth respectively during the first and second pre-dam periods would result in a multiplier of 125 Therefore the growth during the post-dam period say 20 mm would be adjusted to 25 mm Our method thus assumes a uniform rate of decline in growth with age Bur oak was not adjusted because most cores were from old trees that showed small inshycreases not decreases in growth between the two pre-dam periods
Finally 90 of the cores used above in the inter-period comparisons were selected for multiple regression analysis to examine year-to-year variation in growth in relation to environment Cores were selected from stands for wh ich there were at least 8 cores per species from trees at least 80 years old except for elm in stand 16 where only 3 cores were available The number of cores per species for the Missouri River floodshyplain was 24 for cottonwood 30 for elm and 12 for oak with 8 for
13
14
cottonwood on the Little Missouri and 16 for oak in the scarp wood land
Individual ri ng w idt hs were measured for a 50-year period (1928-1 977) for each core Measurements were standard ized (converted to indices) by fitting a polynomia l curve to the data and then dividing each ring width by the corresponding curve value (henceforth referred to as standshyardized) In this way long-term trends in growth were removed (for example due to senescence) and year-to-year variation was emphasized [F ritts 1976] The computer program used in the standardization proshycedure was developed at the Laboratory of Tree- Ring Research in Tuscon Arizona [Fritts Mosimann and Botroff 1969] and adapted for use by the US Geologlical Survey Tree-R ing Laboratory in Reston Virshygin ia R ing-widtl indices for all cores from a stand were averaged by species to construct chronologies three of cottonwood (including one from the Little Missouri) two of oak (including one from the scarp woodland) and three of elm
Precipitation data were from the US Weather Bureau station at Bisshymarck To integrate temperature (energy) and moisture actual evaposhytranspiration (AE) was also calculated [Thornthwaite and Mather 1957] and used as an independent varlable in growth correlations AE was calshyculated assuming 25 cm of available water per 15 cm of soil a surface rooting zone of 12 m and equal water availability between field capacshyity and permanent wilting point (-15 bars) [Johnson Burgess and Keamshymerer 1976]
II Results and Discussion
A Environmental Variables
Primary environmental variables potentially important to tree growth during the two periods included precipitation groundwater overbank flooding and soils To determine whether low precipitation might have been responsible for the decrease in tree growth during the post-dam period Johnson Burgess and Keammerer [1976] compared average anshynual precipitation and AE for two 15-year periods 1940-1954 and 1955shy1969 They found a slight decrease in both parameters in the post-dam period We also found a slight decrease in average annual precipitation and AE for two 20-year periods and for the primary growing season months (April May June and July) although the means were not sigshynificantly different (p lt 075) and the minimum values were much
smaller in t he pre-dam period (Table 1) I t is unl ikel y that the small average decrease in AE and precipi tat ion cou ld have caused a large deshycline in growth in the post -dam period A s w ill be shown later t ree growth of one reference si te actuall y increased signi ficant ly du r ing t he post-dam period
Depth to the water table ranges from near zero to 9 m in t he study area [Greenman 1953] Water table depth changes seasonally in response t o periods of aquifer recharge and discharge (Figure 5) Rech arge occurs mainly in early spring from lateral movement of water f rom t he Missouri River at high stages (bank storage) subsurface flow from ad jacent bedshyrock above the floodplain and percolation of soil grav itational water from precipitation an9 runoff Discharge from the aquifer occurs mainly in the summer as a result of transpiration flow to the Missouri River at low stages and irrigation pumping [Randich and Hatchett 1966] The water table on terraces adjacent to rivers can respond rapidly to changes in river stage however the response decreases w it h increasing distance from the channel [Weist 1971 Grannemann and Sharp 1979]
Current re leases from Garrison Dam are related primarily to generation of electricity Peak demands occur during the coldest months and to a lesser extent the warmest months [US Army Corps of Engineers 1980] although the seasonal pattern is highly variable It is di ff icult to detershymine the effect of changing river gauge height (flow) on water table depths at all distances from the river although the greatest changes probably have occurred nearest the river channel Unfortunately we can find no data on pre-dam water table depths and seasonal fl uctuashytions in the study area and can only speculate as to p re-dam water table conditions However irrigation and seasonal fluctuation in river stage have noticeably ch anged since completion of Garrison Dam There has been increasing use of aquifers for pumped irrigation water which would have lowered the water table during the growing season
Several stands were located in areas fl100ded periodically from concenshytrated upland ru noff The highest of these (stand 16) was situated at the edge of the floodplain adjacent to the bedrock terrace Three ravines draining a large upland area empt ied into the stand According to local reports it is flooded most years in the spring at times of snow melt and heavy precipitation Moisture conditions for this stand were markedly different from terraces of similar elevation that received no concentrated runoff Not only did vegetation composition of t h is stand differ from
15
16
dr ier terraces but as will be shown later t ree growth showed distinctly different pat t erns
Soils in the study area are alluvial in or igin and high in textural va rishyability not only between but also within stands Past f loods deposited lenses of sands si Its and clays varyi ng in th ickness th roughout the floodshyplain With the cessation of flooding the deposition of silt on terraces and accompanying nutrient enrichment have been eliminated Yet the cessation of flooding also aldows for a build-up of organic matter on tershyraces where it was previously scoured and removed by flood waters Changes in soi ll characteristilcs as a result of flood cessation are most Iikely not of as immediate importance to tree growth as the alteration in the hydrologi~ regimen However soils could have had an effect on the growth response of a tree to altered moisture conditions
B I nter-Perilod Comparisons of Cumulative Growth
Average cumulative growth of trees was compared between the immeshydiate pre-dam (1935-1954) and post-dam (1955-1974) periods AI species on the Missouri River floodplain decreased in growth in the postshydam period (Table 2) comparing post-dam growth (adjusted for age) to growth in the pre-dam period The trends are very similar to those of Johnson Burgess and Keammerer [1976] even though they are based on different sets of tree cores In contrast post-dam growth of oak (unshyadjusted) and cottonwood at the reference sites was greater than growth during the pre-dam period Application of the Wilcoxon sign-rank test [Holllander and Wolfe 1973] to growth during the pre- and post-dam periods showed that the decreases on the Missouri River floodplain were statisticaHy significant for all species except cottonwood the cottonshywood reference site showed a statistically significant increase but the increase in oak growth in the scarp woodland was not significant (Table 2)
In a separate analysis the percent change between pre- and post-dam (adjusted for age) periods was computed for each core and the median percent change computed for each species (Table 3) Percentages ranged from about a 25 percent decline to a 20 percent increase Largest declines were for boxelder elm and ash with moderate decreases for cottonshywood and bur oak on the Missouri River floodplain Comparatively large increases were exhibited by the two reference sites Based on results from a mUltiple comparisons test [Hollander and Wolfe 1973] the growth
decli nes for boxelder and elm were sign ifican t ly different from the inshycreases on th e reference sites and ash was significantly different from oak o n t he scarp woodland reference site Diffe rences am ong species o n t he Missouri River f loodplain were not stat isti cally sign ificant nor were the differences for bur oak a nd cottonwood between floodp lai n and reference sites
An atte mpt was made to rel ate changes in growth to va rious envi ronshymental condi t ions such as soil cha racteri st ics and topog rap h ic positio n (for example elevation above mean river leve l) Percent change in growth of all spec ies was determ ined for each stand The stands were then ran ked into lowmediumhigh classes of change This procedure was repeated for all three so il characte ristics (ava ilable water capacity organic matter and soil texture) and for stand elevation Frequency tables were conshystructed for growth classes and the classes for each env ironmental varishyable No trends were found for t he so il character istics Terrace e levat ion versus percent change in growth however showed a dist inct trend (Table 4) On the uppermost terraces growth was little changed on t he middle terraces growth showed the greatest decline and on the lowest terraces growth decreased moderately
Trees on low terraces (2-3 m above mean river level ) which were flooded most frequently in the pre-dam period and are rarely flooded now were expected to have shown the largest decrease in growth However growth decreased more on the middle terraces than on the lower terraces The relative depth to the water table on a terrace may be more important for growth than flood frequency Trees on low terraces are closer to the water table and to the river and could more effectively utilize pulses of high flow (for example after heavy precipitat ion) compared to those of the upper terraces
Tree growth on high terraces showed the least amount of change beshytween the periods Although the water ta ble was likely at greater depths on these terraces and only occasionally accessible to t rees (even in the pre-dam period) most of these stands received additional moisture from concentrated upland runoff Many trees here showed increases not decreases in growth For example stand 16 reportedly was flooded most years by runoff from upland ravines E 1m in stand 16 showed no change in growth between pre- and post-dam periods compared to a deshycrease of 25 percent over the study area Runoff is clearly important to the growth of trees on high terraces adjacent ot the uplands
17
18
T he observed decrease in the growth of elm was not caused by Dutch elm disease since trees in the Bismarck area have been infected onl y in t he last several years Johnson Burgess and Keammerer [1976] observed a decrease in growt h of trees sampled in 1969 before the disease had spread to centra l Nort h Dakota The elms that we sampled 10 years after their study sh owed t he same magnitude of decl ine in growt h
C Patterns of A nnual Radial Tree Growth
Cottonwood elm and oak were se lected fo r multivariate analysis to examine year-to-year variation in growth in relation to environment These species were selected because each is representative of a different stage lin the development of the floodplain forest and therefore may be affected differently by the altered hydrologic regimen Also patterns of pre- and post-dam growth differed among these species Percent change in the growth of bur oak and cotton was the smallest between the two periods whereas elm showed a large decrease in growth in all but the most mesic stands
Seven tree-r ing chronologies were constructed from stands along the Missouri (two from stand 16) and two chronologies were constructed for the reference sites (Table 5) Both unstandardized and standardized chronologies were constructed and smoothed [Tukey 1977 3RSSH 3RSSH3] for each site except for elm in stand 16 where just the unstandshyardized chronology was used (Figures 6 through 9) Low growth during the 1930s (especially 1936-1937) in 1946 and in 1961 was common to all of the tree-ring chronologies These were periods of low spring streamflow and AE (Figure 10) During the pre-dam period most chronshyologies exhibited two peaks in growth between 1938 and 1944 I n the post-dam period most chronologies showed peak growth in 1965 coinshycident with high spring AE Thus t here was a close correspondence beshytween macroclimate and the growth of floodplain trees
But perhaps of more significance were the years 1952 and 1955 In April of 1952 one of the largest floods on record for the Missouri River inunshydated the entire floodplain It was however a year of low AE All chronshyologies except those from stand 13 (Figure 6) and the scarp woodland showed high growth in 1952 This illustrates the compensating effect that overbank flooding had on tree growth in years of low AE In 1955 t he reverse conditions prevailed spri ng AE was high while streamflow (releases from the dam) was low Growth in 1955 for all chronologies
except in stands 13 (Figure 6) 16 (Figure 7) and t he scarp woodland was low wh ich ind icates the effect of low streamflow on growth The growth of scarp woodland trees not influenced directly by streamflow generally followed A E patterns between 1928 and 1977
The unstandardized series for elm sites that did not receive concentrated upland runoff (stands 12 13 and 19) exhibited a systemat ic downward trend in growth rate through the post-dam period (Figure 6) wh ich matched the general pattern of elm growth decline discussed ear lier In contrast the unstandardized chronology for elm in stand 16 which conshytinued to receive upland runoff since construction of the dam showed no systematic long-term decline in growth during the post-dam period and therefore was no~ standardized This re-emphasizes the importance of topographic position on the magnitude of the growth decline of elm and other species during the post-dam period
The cottonwood chronology from the Little Missouri reference site (Figshyure 8) showed similar trends in growth to that of cottonwood on the Missouri River (Figure 9) with lowest growth also occurring in the 1930s 1946 and 1961 I n contrast to the cottonwood chronology from stand 14 (Figure 9) the unstandardized chronology from the Little Misshysouri showed no systematic decl ine in growth Trends in the Little M isshysouri streamflow data generally matched cottonwood growth patterns (Figure 8)
D Multiple Regression Analysis
Fourteen environmental variables (fall AE plus those shown in Table 6) considered to be important for tree growth during certain months and seasons (for example June flow) were used in stepwise multiple regresshysion models A fifteenth variable tree growth during the previous year was included because growth in one year may strongly affect growth in the following year (serial correlation Fritts 1976] Thus tree-ring index was the dependent variable and the 15 aforementioned factors were independent variables Regressions were determined separately for each stand for pre-and post-dam periods
Several streamflow parameters correlated positively in the mUltiple regression models with annual patterns of cottonwood growth in the pre-dam period (Figure 11) Apri l-May flow was important in models for both stands 5 and 14 In addition spring precipitat ion and spring
19
20
preCIpitation in the previous year (Y-1) were posi t ively correlated in models for both stands The ana lysis also indicated that growth may be suppressed when April precipitation is high (negatively correlated with growth Figure 11) because it may pro long saturated so il condi tions (low oxygen) after March -April flood s High June fl ow (negatively corshyrelated Figure 11) flooded low terraces near the river such as stands 5 and 14 or ra ised the water table excessively during this important growing season month and therefore may have been responsible for deshycreased stem growth by lim iting root oxygenation High June f lows were common in the pre-dam period (Figure 2)
Correlation patterns for cottonwood shifted markedl y from streamflow and spring precipitation in the pre-dam period to AE and temperature in the post-dam period (Figure 11) Of the streamflow parameters only June flow was positively correlated with growth (stand 5) in the post-dam period Thus very high flows in June in the pre-dam period could have reduced overall growth but h igh flows within a much lower range in the post-dam period (Table 3) could have been benef icial Growth in both stands was positively correlated with spring AE and spring tempershyature in the previous year and negatively correlated with fal l temperature in the previous year Low fall temperature in the previous year would have resulted in greater soil moisture storage over the w inter The negashytive correlation with spring precipitation in stand 14 appears to be spurshyious a situation not uncommon in the application of multivariate techshyniques to ecological data [Pitt and Heady 1978] Overall the general lack of correlation with streamf1low suggests that moisture su pplied by the river is now less important to the growth of cottonwood in t he postshydam period
Cottonwood presence has been used as an indicator of a high water t able since it tends to be phreatophytic [Meinzer 1927 ] Hayes and Stoeckler [1935] classified cottonwood as a shallow-rooted t ree laquo 2 m) however its roots may ex tend to much greater depths especially on floodplains where the process of terrace development continually buries the trunks of trees [Everitt 1968] Older cottonwoods that grow on terraces 3 m above mean river level yet that germinated on low terraces just above river level may have roots that extend to the original depth of rooting
With the alteration in flow regimen especially during the growing seashyson there has l ikely been a corresponding change in depth to water table For example with a lower spring water table the roots of trees may no
longer extend to the capillary fri nge thus growth might depend more on surface soil moisture from rai nfa ll than on groundwater T his shift in response from one source of moisture to another indicated t hat the dam has indirect ly affected cottonwood water rel ations Cottonwood was perhaps less affected by altered streamflow t han other species beshycause of its deep root system proximity to the river where the water table was most accessible and possession of a root system more responshysive to changes in water su pply
Most positive correlations with bur oak growth in stand 16 during the pre-dam period were with variables of the previous year including growth temperature and AE (Table 6) Regression coefficients for the post-dam period in c r~ased considerably positive correlations were for current year precipitation AE and temperature in the spring The reshygression coefficients for the scarp woodland models were low (036 041) and are therefore not discussed With respect to the observed positive correlation between oak growth and streamflow variables it should be recalled that post-dam streamflow was mainly a reflection of releases from the dam However high streamflow events were also caused lin part by runoff from short heavy rains or rapid snowmelt The frequency of these events may have been independent of total monthly precipitation For example total monthly precipitation does not indicate whether there were many days of light rain or a few days of heavy rain with the rest of the month dry For these reasons the relationsh ip between oak growth and streamflow was only correlative and not causal
Regression coefficients for American elm were higher than the scarp woodland oak values but still considerably less than those of the cottonshywood models Patterns of correlation shown by at least two of the three elm stands during the pre-dam period were positive correlation with April-May flow and spring precipitation in the previous year and negative corre1lation with spring temperature The patterns are decidedly different in the post-dam period April-May flow was negatively correlated and June flow was positively correlated with growth However there was little pattern among stands with respect to the numerous other variables included in the regression models The correlation pattern for elm apshypears to be high Iy variable among sites and between periods and little can be generalized from the multiple regression analyses
The chronologies were also used in a reduced model growth = sp ring AE and spring streamflow in a linear modeling procedure [Helwig and
21
22
Counci l 1979] to more clea rly defi ne the contribut ions of these environshymental facto rs to t ree growth (Table 7) The results re-emphasize the shift in correlation between the periods from streamflow to AE for cotshytonwood Bur oak growth correlated with A E in the pre-dam period yet was more strongly correlated with AE and streamflow in the postshydam period For American ellm correlations with growth in the reduced model were weak one significant correlation wi th AE occurred in one elm chronology in the post-dam period
Separate regression analyses were made for the Little Missouri cottonshywood chronology corresponding to the pre- and post-dam periods on the Missouri In the 15-variable stepwise regression procedure (using Little M issou ri s~reamflow data from 1935-1977) there were no major differences in the variables selected for either pre- or post-dam period models Using the reduced model growth = spring A E and spring streamshyflow (Little M issouri) there were again no shifts in correlations between the two periods This is in distinct contrast to the shifts lin correlations observed for cottonwood in stands 5 and 14 on the Missou ri River where the hydrologic regimen has been altered by Garrison Dam
LAND USE AND RIVE R HYDROLOGY
Johnson Burgess and Keammerer [1976] expected that because of reshyduced spring flooding (lower peak flows) and bank stabil ization the rate of river meandering had slowed since construct ion of the dam T his hypothesis is evaluated in this section by analyzing historic and present river meandering rates Also in this section the rates and di rections of land use change since initial settlement are analyzed and di scussed Such an analysis is important since current vegetation patterns are closely linked to past land use
I Methods
A River Meandering Rate
Historic and recent rates of meandering of the Missouri River were detershymined from channel change maps within the study area Positions of the river over time were transferred to a common base map at a scale of 124000 Several sources of linformation were used General Land Office summary records describe the position of the river channel f rom 1872 to 1881 An additional set of archival maps was prepared in 1891 by the Missouri River Commission The aerial photographic record of the study area began in 1938 Photographs recording channel position were available for several time periods up to the present Additional informashytion on pre-dam channel position was available from maps prepared by the US Army Corps of Engineers in 1945
The pre-dam meandering rate was determined from channel positions in 1881 1891 and 1945 From the common base maps an electronic digitizer was used to determine the amount of eroded and deposited land in each time interval This total area was divided by the number of years in the time interval to compute average annual erosion and deposishytion for the period Post-dam meandering rate was determined by comshyparing the position of the river compiled from US Geological Survey photographs (1969) to current (1979) channel as shown by Corps of Engineers photographs Meandering rates were independently determined for the period 1938-1972 by the Corps wh ich used aerial photogramshymetric techniques and range line surveys
Also field surveys were conducted to assist in mapping historic ch annel positions Five to 10 cottonwood trees on each terrace level on several
23
24
large meanders in the study area were cored and aged By p lotting t ree ages fo r a given terrace isochro nes or age contours could be d rawn [Everitt 1968] Use of these maps improved the accuracy of th e comshyposite channel map
B Land Use Change
Land use was mapped for each period on a com posite map at a scale of 1 24000 Land use categories were (1) marsh-treeless areas with emershygent aquatic vegetation or open water (2) non-forest - o pen land occushypied by houses or farm buildings (3) bare sand-non-forest ed ba rs and dunes along the river channel (4) ind ustrial-power plants and refineries (5) agriculture (s~tt l ement to 1938)-cropland and pasture cleared before 1938 (6) agriculture (1938- 1979) - cropland and pasture cleared 1938shy1979 (7) cottonwood-willow-young stands of Populus deltoides and Salix amygdaloides up to approximately 40 years of age (8) cottonshywood-stands of Populus deltoides approximately 40-80 years of age (9) cottonwood-ash-elm-boxelder-stands with at least 50 percent of the canopy composed of Populus with 20-50 percent an admixture of Fraxishynus Ulmus and Acer (10) ash-elm-boxelder-stands with at least 75 percent of the canopy composed of Fraxinus Ulmus and Acer Many of these stands included a small component of Populus andor Quercus
Field surveys and tree aging also improved the accuracy of land use maps by providing general ground information and specifically enabling more accurate estimation of age classes of cottonwood forests They also enabled accurate estimation of the area and age of young cottonwoodshywi lIow forests (less than 40 years) wh ich are di fficu It to identify u namshybiguously from photography
Because 1891 cover maps were very general General Land Office Survey records were used to determine the proportional composition of the forest categories at the time of settlement These reco rds have been used by other researchers in determining pre-settlement vegetation [Stearns 1949 Burgess 1964] Survey notes usually included a general descripshytion of each township including deta ils of forest underbrush soils and relief Points were established at each 16-km interval along the range and section li nes of each township In this manner 36 sections were established within each township At the common point between secshytions as well as at quarter section corners (a point halfway between section corners) the species diameter and bearing of up to four witshy
ness trees were recorded By examining the records for all trees on the 160 points occurri n~ in the study area the proportion of cover types could be estimated
II Resu Its and Discussion
Between 1881 and 1891 approx imately 1650 ha of land su rface area were deposited as alluvial material (Table 8) Durin~ this same period approximately 1328 ha were eroded The average annual erosion rate was 133 ha per year For the interval 1891-1945 approximatel y 5464 ha were deposited and 4648 ha eroded Average annual loss rate during th is interval was approx imately 86 ha per year Thus average annual erosion rate for the ~ntire pre-reservoir period (1881-1945) was 93 ha per year wh ile deposition rates averaqed 111 ha per year Although there was a slight net accumulation of material (18 ha per year) during the pre-dam period losses and qains were relatively balanced
In the post-dam period both erosion and deposition rates decreased subshystantially Dur ing 1969-1979 only 13 ha of land were deposited and most of that accumulated behind erosion control devices (wing-dikes) constructed along the bankline During this same period approximately 212 ha of land were lost to erosion This is an average annual rat e of 21 ha per year Thus erosion rates fell from the pre-dam avera~e of 93 ha per year to 21 ha per year during the post-dam period (1969-1979) Accretion rates fell from 111 ha per year to 13 ha per year during the same period Post-dam erosion rates were only 25 percent of pre-dam rates and accretion rates only 1 percent of pre-dam rates
Vhi lle erosion and deposition rates were relatively balanced during the pre-dam period they were decidedly unbalanced during the post-dam period Deposition during the pre-dam period was 12 ti mes greater than erosion during the post-dam period erosion was 162 times greater than accretion This overal ll increase in erosion over deposition has resulted from increased bank cutting and destabilization Thus the channel is widening because material is being eroded from both banks with little concurrent accretion
Meandering rates increased as floodplain width increased Thus where the floodplain was narrow river meandering rate was small In the porshytion of the study area below Garrison Dam (Microfiche 17) the width of the floodplain averages about 16 km Shifts in channel position since
25
26
1872 have averaged approx imately 06 km I n the study area south of Bismarck (Microfiche 11) t he floodplain is approximately 116 km in width Channel changes since 1872 have averaged approximate ly 24 km result ing in red istribution of la rge am ou nts of alluvium
The model of Schumm [1969] would predict t hat the reduction of f loodshying and bed-material load resulting from dam emplacement will lead to an increase in channel sinuosity and a decrease in meander wavelength Thus the natural response involves considerable lateral cutting unti l the channel reaches equilibrium with the new regimen In the study area however an extensive series of bank-stabilization structures conshystructed by the Corps of Engineers since dam emplacement has preshyvented natural c~annel response and has actually led to a considerable post-dam reduction in lateral channel shifting The Schumm model also predicts a decrease in channel width but the actual channel has been widening T he cause of this anomalous response may be that the stream is expend ing energy in eroding and transporting sediment from both channel walls instead of unilateral channel shifting
The dramatic decline in erosion and accretion rates since the construcshytion of Garrison Dam and the change in the balance between the two are beginning to have an impact on natural rates of reforestation by cottonwood and willow Currently approximately 35 percent of the floodplain forest is composed of cottonwood forests less than 80 years old forests with cottonwood trees less than 150 years old comprise 78 percent of the total Thus forests with cottonwood as the primary dominant currently make up the large majority of the floodplain forests
On active f loodpllains Everitt [1968] proposed a logarithmic decline in the area of the floodplain occupied by forests of increasing age that is young forests should occupy the largest proportion and old forests the smallest I f the meandering rate were to decl ine su bstantially thereby decreasing the likelihood of erosion and increasing mean stand age the pattern may at equ iI ibriu m become reversed that is old f orests wou Id occupy a larger area than young forests This is the pattern now emerging on this protected floodplain cottonwood forests less than 40 years of age now occupy only 8 percent of the total forest area while forests of 40 to 80 years comprise 23 percent of the total We expect the proporshytion of young cottonwood forests to decline in rough proportion to the decline in accretion rates A new equilibrium composition would be reached in less than two centuries and cottonwood forests will probshy
ably comprise at the most only 5-10 percent of the t otal forest area The remainder would include forests of more advanced successional age dominated by green ash and boxelder especially the f ormer Cottonshywood stands of t he future will be small in extent and primari ly located behind w ing-dikes and other erosion control dev ices Few if any cotshytonwood forests w ill occupy broad terraces more than several meters above mean river level The distr ibu t ion of cottonwood shou Id t heref ore become more rest ricted that is a strand species occurring in close proximity to the river
Settlement has brought many significant changes in the ex tent and comshyposition of the floodpl ain vegetation (Microfiches 2 1 th rough 28) The largest changes involved the clearing of fo rests for agricultural purposes By 1938 approximately 38 percent of the floodplain forest had been cleared for agriculture or about 07 percent per year over t he 1881shy1938 period (Table 9) Thus clea ring proceeded at a rapid rate after the General Land Office Survey of 1872-1881 No mention of agricu lture on the floodplain was made in the Survey notes however some cultivashytion had occurred in the adjacent prairie uplands An additional 18 pershycent of the forest was cleared for cu Itivation between 1938 and 1979 or about 05 percent per year
I ndustrial development on the floodplain is a recent phenomenon occurshyring mostly after the construction of Garrison Dam Less than 1 percent of the land area is used by industry Marshes and sand dunes also comshyprise less than 1 percent of the fl oodplain area Marsh area has changed little since presettlement but bare sand has decreased since the cessation of floods Large floods in the pre-dam period scou red and deposited sand on low terraces near the r iver channel
General Land Office Survey notes indicate that the preset tlement floodshyplain was almost completely wooded Young cottonwood forests less than 40 years old occupied about 14 percent of the floodplain forest These may have occupied a larger proportion of the forest area because young trees were generally not used as witness trees in the land survey
Approximately 53 percent of the forest was composed of cottonwoods 40-80 years old Thirty percent of the forest was in the old cottonwood type while only 3 pelrcent of the forests were of advanced successional age These included ash elm boxelder and bur oak with occasional large cottonwoods
27
28
Presently fo rest vegetation comprises about 44 percent of the floodplain area about 8 percent of t his total is composed of young stands of cottonshywood and willow less than 40 years of age Most of these have regenershyated since the closing of Garrison Dam in 1954 on alluvium deposited du ring the 1952 flood In many areas these stands are severely browsed by beaver and scoured by ice in the spring resu lting in frequent damage to aboveground stems Thus individual plants are older than they appear Because these stands are on low terraces with a high water table are flooded occasionally and are on soils unproductive for crops only 6 percent of this forest type has been cleared since their establishment at various times during the past 40 years
Approximately 23 percent of the existing floodplain forest was comshyposed of stands of cottonwood ranging in age from 40 to 80 years Forshyests in th is age class generally occurred on more productive soils howshyever they were still on low terraces with relatively sandy soils Agriculshytural clearing has removed about 52 percent of these stands since their establishment Clearing of forests of this age has increased since the 1930s because of floodplain protection and access to irrigation
The most extensive forest category is age class 80-150 years-47 percent of the total forest area These stands contain large cottonwood trees with young green ash American elm and boxelder These forests are located on intermediate terrace elevations About 43 percent of forests in th is category have been cleared for agricu Iture
The remaining forest type makes up 22 percent of the total forest area These forests contain green ash American elm boxelder and few scatshytered cottonwoods andor bur oak Since settlement 75 percent of this forest type has been cleared for agriculture This high rate of clearing is due to the location of these stands on high terraces removed from most floods and the presence of more productive soils for agriculture
Overall the rate of forest clearing was at its maximum during the early settlement period before 1938 Although the rate of clearing has been somewhat lower during the period after 1938 field observations indicate a surge in clearing since 1970 when irrigation became more widespread Soils that were perhaps of marginal productivity and therefore left forshyested cou ld be made more productive with additional water from irrigashytion Deforestation continues at a rate that is probably greater than the average rate of 05 percent for the 1938-1979 period
It is difficu lt t o accurate ly est imate the forest type proport ions on the presettlement flood plain primarily because the surveyors selected against choosing small trees as wi tness trees Young witness trees less than about 12 cm diameter at breast height (dbh) did not occur in the data set so the proportion of small cottonwood forests was significantly underestishymated The estimate of only 3 percent of the total forest area occupied by forests of advanced successional age is especially interesting since the current proportion is about 22 percent and these forests wh ich ocshycurred on better soils were preferentially cleared We do not know with certa inty the reasons for th is but we suspect that it is an artifact of past timber practices Large cottonwood trees (50-100 years old) occurr1ing with an understory canopy of ash elm and boxelder were preferred trees for lumbering ~elective cutting of these trees would have in effect shifted these stands from the mixed cottonwood forest type to the most advanced successional stage Cottonwood does not reproduce in the tree gaps of older forests
29
30
TREE POPULATION STRUCTURE
An underrepresentation of sap ling-size reproduction of American elm and boxelder was observed by Johnson Burgess and Keammerer [1976] however they sampled only trees 12 cm dbh and larger and did not determine age only size Extrapolation from size to age is often inaccurshyate [ Harcombe and Marks 1978] This research was designed to develop complete age structure diagrams in both treatment and reference stands to test the hypothesis that altered hydrologic regimen had affected tree population structu re The survey of Johnson Burgess and Keammerer indicated that the population structure of another important climax tree species green ash was unchanged from pre-dam condi tions
I Methods
Four former stands of Johnson Burgess and Keammerer [1976] were selected for study ( stands 7 11 13 and 19) I n addition to these treatshyment stands other stands or portions of treatment stands (7 16 and 23) were included as contro l or refe rence sites Because surface water occurred in the spri ng in these stands either from upland runoff or from rising groundwater these reference stands represented an environment closest to that of flooded stands in the pre-dam period If reproduction was as underrepresented in the wetter reference sites as in the treatment sites then the in itial hypothesis that underrepresentation was due to flood cessation would have to be rejected Boxe lder was a major species in stands 7 and 23 while American elm was dominant in stands 1 t 13 and 19 Reference stand 7 (a section of treatment stand 7) was an abanshydoned channel of the Little Heart River on the Missouri River floodp lain near Oahe Reservoir wh ilch fills with water in the spring Reference stands 16 and 23 were flooded almost annually by concentrated upland runoff A ll stands were on one terrace level and had undergone no significant cutting grazing or burning during the previous 30 years Sampling ocshycurred during the summer of 1979
I n each stand parallel and equidistant lines were arranged perpend icular to the course of the river Sample plots were located at random points within 25-m segments along each transect line The sample unit consisted of nested circular plots 250 m2 for stems greater than 10 cm dbh (trees) 100 m2 for stems less than 10 cm dbh but taller than 05 m (saplings) and 1 m2 for stems less than 05 m tall (seedlings) Four 1-m2 plots were random Iy placed with in each 100-m2 plot Twenty-one plots were samshy
pled in stands 11 and 19 and 23 in stands 7 and 13 Because the refershyence stands were much smaller than the t reat ment sites sample sizes were smaller reference stand 7 (three plots) reference stand 16 (seven plots) and stand 23 (two plots)
Stem diameter at breast height was measured f or all boxelder and elm trees and saplings that occurred in t he quadrats Ages of seedlings were determined by counting terminal bud scars or cutting and aging directly I ncrement cores were collected from several saplings and trees in each plot and age was determined in t he laboratory Small saplings were cored using a micro-increment borer A ges for all stems were computed using the natural growth function f(x a b) = a( 1 - e-b x ) where x = dbh and f(x) == age [Parton and Innis 1972] The curve for each species was selected that minimized the residual sums of squares and yielded the greatest measure of fit [Helwig and Council 1979] For elm a = 143 b = 002956 (r2 = 094) For boxelder a = 106 b = 002388 (r2 = 095) All samples of each species were pooled for t he age-size regressions
Size and age structural diagrams were constructed separately by computshying the density of stems in each size or age class Because the relat ionshyship between age and size was close to being linear the curves in both graphs exh ibited the same basic form Boxelder stems of sprout origin were tallied separately to show the contribution of sprouting to overall population structure Data were divided into five-year age classes
II Results and Discussion
Age distributions for American elm (Figure 12) showed low densiti es of saplings and small trees and high densities of seedlings and large trees Three of the four treatment stands showed a complete absence of stems in one of the two young age classes The average of all four stands also showed lowest densities in the two sapling classes The data clearly indishycate that post-reservoir conditions allowed substantial germination and initial establishment of seedlings seedling densities in the first age class averaged 110000 per ha However seedlings must have thinned rapidly since stems from several years old to about 45 years old were relatively rare High densities of elm seedlings were also noted during field surveys in 1969-70 by Keammerer [1972] and underrepresentation of sapl ings and small trees was observed by Johnson Burgess and Keammerer [1976] Reduction in elm density occurred in stems from several years old to those that would have been approximately 20 years old when
3 1
32
Garri so n Dam became operational
Age distribut ion fo r boxel der also showed underrepresentation in t he small age classes but th e reduction was less dramatic than for elm (Figshyure 12) Again seedl ing reproduction was considerable altho ugh at lower overall densities than elm Mortali ty between seedlings and smal l tree classes was considerable thereby resulting in fewer saplings than trees Underrepresentation is most evident in stems several years o id to about 25 years old Thus boxelder showed a somewhat narrower age gap than elm Reduction in stem density appeared in age classes that corresponded cIIosely to the time since flooding was eliminated by Garshyrison Dam
Age distributions in reference stands showed different patterns (Figure 13) Age distributions for both species appeared to be more balanced [lJIeyer 1952] that is age classes between 5 and 45 years were considshyerably Iess underrepresented than in treatment sites In our survey of reproduction on the floodplain one observation held true-h igh sapling densities of American elm andor boxelder were always associated with the few siteS that received supplemental moisture either from a rising groundwater table near Oahe Reservoir or in areas that received upland runoff
Therefore the data suggest that moisture was the primary factor responshysible for underrepresentation in the age structure of these two species Supplemental moisture to these forests would in the pre-reservoir years have been provided by both a surface recharging of the rooting zone by overbank flooding and a high water table in the early growing season months when river height was generally maximum However in the abshysence of these sources of moisture seedlings would now depend on preshycipitation alone to enable growth to the deeper post-reservoir water table We believe that the reduction in available moisture was the likely cause of the extremelly high seedling mortality and the movement of only a small fraction of elm and boxelder seedlings into the tree-size classes The natura l range of elm extends to only a few counties west of the study area in North Dakota while boxelder extends west into the drier conditions of eastern and central Montana Interestingly the species less able to tolerate drier cl imatic conditions (elm) was also the species that showed the greatest underrepresentation in age structure in the drier post-dam floodplain
Ch anges in the hydrologic regimen may have also cau sed greate r morshytality of established saplings in the yea rs im mediately follow ing Garrison Dam T hus t he o bservation in t he age structural d iagrams for elm (Figshyure 12) that increased mortality began two decades before Garrison Dam (that is cu rren t 45-year-old age c lass) may be the resu lt of increased morta lity of sa plings t hat were 20 years old or younger in the years folshylowing dam construction Perhaps the root systems of saplings were too poorly developed to ut il ize gro undwater o r to persist on it alone At the wetter reference sites mo rta lity of saplings of this age did not appear to have increased substantially over pre-dam levels
I n contrast t he mortality of establ ished boxelder sapl ings appears to have continued at pre-dam levels the change in hydrologic regimen appeared to increase only the mortality of young boxe lder seedlings that is individuals established after 1954 The larger proportion of stems that had died and resprouted in treatment stands also indicates that these seedlings were under greater stress than those in reference sites
Since livestock grazing could also have caused seedling-sapling mortality t he grazing history of the treatment stands was obta ined from landshyowners Stand 7 had not been grazed since the 1920 s stands 11 and 13 had not been grazed since 1950 and stand 19 had been grazed one year in the early 1970s but otherwise had not been grazed during the postshydam period Grazing therefore has been light or nonexistent in the treatment stands and was probably not the reason fo r the gap in age structure Furthermore if the ingestion and trampling by cattle were responsible for increased mortal ity other woody tree species wou Id likewise also have been affected yet green ash saplings of all age classes were numerous in treatment stands
Browsing by deer has also been shown to affect the population structure of preferred species [Swift 1948] Although American elm is a preferred browse species in this region damage to it from browsing was not noticeshyable in our treatment stands
In streamside forests in the East many large elms (Ulmus americana L and Ulmus rubra Muhl) have died from Dutch elm disease We saw no evidence of diseased elms on the floodplain in our study area however the disease has killed many urban trees in Bismarck Since elm trees are affected to a greater extent than seedlings and saplings [Stipes and Camshypana 198 1] the disease is not considered a cause for the Ilow densities
33
34
of elm saplings Underrepresentat ion was already observed by Johnson Burgess and Keammerer (1976] during the 1969 and 1970 fie ld seasons about t he time Du tch elm disease had spread to central North Dakota [Stipes and Campana 1981 ]
Although the natural form of the age structure curve of c llimax or equilibrium tree populations had been thought to be negative exponenshytial [Meyer 1952] recent studies have indicated that underrepresentashytion in sapll ing size classes is a widespread phenomenon [Christensen 1977 Harcombe and Marks 1978] Harcom be and Marks sampled forest stands in the Big Thicket of southeastern Texas that ranged from dry uplands through mesic sllopes to wet river floodplains They showed a high incidence of underrepresentation of sapl ings of cl imax tree species in wet and mesic forests but a lower incidence in dry upland forests They argued that the cause of the underrepresentation was competition for Iight between the seed Iings and sapl ings of overstory tree species and understory tree and shrub species They suggested that underrepresenshytation in wet and mesic forests was natural and caused by increased morshytality of seedlings because of shad ing by understory trees (for examp1le Carpinus caroinianaj
Patterns of underrepresentation in age structure f or the M issou ri River floodplain were nearly identical with those of southeastern Texas exshycept we believe that underrepresentation in our study was caused by lack of moisture not light The canopy of old floodplain forests along the Missouri River is relative ly open Hibbard [1972] showed that in these forests canopy cover ranged from 65 to 80 percent A lso neither boxelder nor elm is ilntolerant of shade [Baker 1949] Saplings of these species were no more abundant along stand edges or in large canopy gaps where light would have been more available
In summary our results indicate a significant decline in the abundance of American elm and boxelder on the Missouri River floodplain in the study area Current overstory densities of these species cannot be mai1nshytained given the low density of saplings In the case of American elm the decline will accelerate if Dutch elm disease begins to affect canopy trees Assuming that current trends continue the importance of these species in the overstory should consistently decline over t ime until only scattered trees remain or even become local ly elliminated Trees wHI beshycome primadly restricted to the few small wet sites either near the backshyup of Oahe Reservoir or in places where intermittent streams flow onto
the floodplain Seedlings may continue to be numerous unti l affected by restricted seed d ispersal from a dwi ndling nu mber of canopy trees Because green ash reproduction of all age classes was ubiquitous and dense it should become an increasingly important canopy species
Available evidence points to the altered hydrologic regimen as the cause of reduced recruitment of boxelder and elm trees however in the abshysence of pre-dam age structure and hydrologic information th is conclushysion must be considered tentative We clearly need additional informashytion from other f loodplains both natural and altered to solve the undershyrepresentation problem
35
36
CONCLUSIONS
1 The hydro logic regi men of the Missouri River has been altered conshysiderabl y by t he construction of Garri son Dam Wh ile precipitation and A E have shown no significant changes between pre- and post-dam periods streamflow patterns have changed markedly Peak flow no longer occurs early in the growing season and consequently is out of phase with the vernal growth pattern typical of floodpla in trees A larger proportion of the annual flow is now released in the non-growing season mont hs and therefore is unavailable for growth Now flow in Ju ne is usually less than it was du ri ng the drought years of the 1930s River flow data indicate a general lowering of the spring and ea rly summer water table since Garr ison Dam
2 Flood ing has been el im inated on terraces greater than 2 m above mean river level thus decreasing the moisture available to floodplain ecoshysystems at the start of the growing season The accompanying deposishytion of nutrient-rich si It has also ceased
3 Both erosion and deposit ion rates by the river have decreased subshystantially since Garr ison Dam I n effect river meandering has all but ceased Accretion rates have fallen to 1 percent of their pre-dam level and erosion rates to 25 percent of pre-dam levels The net effect was a widen ing of the river channel by erosion on both banks and little concurrent deposition
4 Results showed that decreases in radial tree growth in the post-dam period were not uniform throughout the floodplain but depended on species and location with respect to the river Trees on terraces at t he edge of the floodp ~ ain that received concentrated runoff from upland ravines (for example bur oak) and those with deep root systems (for example cottonwood) on low terraces close to the water table have been least affected by the altered hydrologic regimen Growth of cotshytonwood and bur oak on reference sites unaffected by damming of the Missouri River increased significantly in the post -dam period The most pronounced decrease in tree growth (for example boxelder American elm) occurred on higher terraces that received little or no upland runoff
5 Lack of flooding and a lowered spring water tab le are implicated in the decline of radial tree growth For example with a lower spring
water table the roots of established trees may no longer extend t o the cap illary f ringe Thus growth might depend more upon spr ing A E than on groundwater This shift in response from one source of moisshyture to another (from groundwater to precip itat ion) was ex hibited in the regression ana lysis of cottonwood growth chrono logies The ab shysence of overbank flooding may have had a greater effect on the growth of trees (for example American el m) on dry upper t erraces well above the water table that did not receive upland runoff A Ishythouglh these terraces were only infrequently flooded before 1953 the supplemental moisture provided by floods just before the onset of growth could have augmented growth for several consecutive years and compensated for years of low predpitation
6 Lack of accretion by the r iver in the post-dam period spells a decline in the proportion of the floodplain forest occup ied by cottonwoodshywillow forests The decline is already observable and will continue until in a century or more cottonwood forests will occupy only a fraction of their current proportion Cottonwoods will be relegated to a river marg inal position being especially prominent behind wingshydikes
7 We believe that the decline in cottonwood abundance and ubiquity will be accompanied by a decline in American elm because of a rapidly declining growth rate almost complete absence of seedling survivorshyship on most sites and the impending effects of Dutch elm disease Some remnant elm stands may persist on sites with an artificially elevated water table near the Oahe Reservoir and on high terraces that receive upland runoff Boxelder which exhibited greater survivorship but was still underrepresented in the sapling size classes may exhibit a slower decline Although growth rate of green ash has also declined it exhibits balanced population structure and will likely increase its abundance and ubiquity in coming decades Thus the current obsershyvations foretell a drastic decline in cottonwood and elm abundance a moderate-to-slow decline in boxelder prominence and an increase in green ash Overall the aipha and beta diversities of the forest overshystory should decline
8 Clearing for agriculture has claimed slightly over half (55 percent) of the original floodplain forest The rate appears to have accelerated during the last decade because of opportunities to irrigate croplands Should these trends continue future native forests may be mai ntained
37
38
only in protected areas such as the Riverdale and Oahe Game Manageshyment Areas and in private reserves (for example Cross Ranch The Nature Conservancy) However forests protected from clearing and other disturbances remai n unprotected from the ecological effects of altered river hydrology
9 The effects of altered hydrology on floodplain ecosystem dynamics need further study on other forested floodplains particularly where pre-dam biological information is available or where nearby wild rivers could serve as good controls Where significant effects of floodplain protection are suspected an index of impact could be der ived by comparing pre-dam gauge height (flood frequency) and seasonal flow patterns to pre-dam patterns Greater departure from pre-dam patshyterns would suggest greater potential impact on natural floodplain ecosystems
LITERATURE CITED
Baker F S 1949 A Revised Tolerance Table Journal of Forestry 47 179-81
Baxter R M 1977 Environmental Effects of Dams and I mpoundshyments I n Annual Review of Ecology and Systen7atics Vol 8 R F Johnson editor pp 255-83 Palo Alto Californ ia Annual Rev iews Inc
Bedinger M S 1971 Forest Species as Indicators of Flooding in the Lower White River Valley Arkansas Professional Paper 750-C US Geological Survey US Department of the Interior Washington
Bell D T and R del Moral 1977 Vegetation Gradients in the Streamshyside Forest of Hickory Creek Will County Illinois Bulletin Torrey Botanical Club 1 04 127-35
Bluemle J P 1971 Geology of McLean County North Dakota North Dakota Geological Survey Bulletin No 60 Pt 1 North Dakota State Water Conservation Commission Grand Forks
Brockman L C et aI 1974 Soil Survey of A1cLean County North Dakota Soil Conservation Service US Department of Agriculture Wash ington
Brown D E C H Lowe and J F Hausler 1977 Southwestern R iparshyian Communities Their Biotic Importance and Management in Arizona In Importance Preservation and Management of Riparian Habitats pp 201-11 General Technical Report RM-43 US Forest Service US Deshypartment of Agriculture Washington
Burgess R L 1964 Ninety Years of Vegetational Change in a Townshyship in Eastern North Dakota Proceedings North Dakota Academy of Science 18 84-94
Campbell C J and W Green 1968 Perpetual Succession of StreamshyChannel Vegetation in a Semiarid Region Arizona Academy ofScience Journal 5 86-98
39
40
Carlson C G 1973 Geology of Mercer and Oliver Counties North Dakota North Dakota Geological Survey Bul letin No 56 Pt 1 Nort h Dakota State Water Conservation Commission Grand Forks
Christensen N Lt 1977 Changes in Structu re Pattern and Diversity A ssociated with Climax Forest Maturation in Piedmont North Carolina American Midland Naturalist 97 176-88
Clayton L 1962 Glacial Geology of Logan and McIntosh Counties North Dakota North Dakota Geological Su rvey Bulleti n No 37 North Dakota State Water Conservation Commission Grand Forks
Everitt B L 1968 Use of the Cottonwood in an I nvestigation of the Recent History of a Floodplain American Journal ofScience 266417shy39
----- 1980 Ecology of Saltcedar-A Plea for Research Environshymental Geology 377-84
Fenneman N M 193 1 Physiography of the Western United States New York McGraw-Hili Book Co
Fritts H C 1976 Tree Rings and Climate New York Academic Press Inc
Fritts H C J E Mosimann and C P Botroff 1969 A Revised Comshyputer Program for Standardizing Tree-Ring Series Tree-Ring Bulletin 29 15-20
Gary H L 1965 Some Site Relations in Three Floodplain Communishyties in Central Arizona Arizona Academy of Science Journal3(4) 209shy12
Grannemann N G and J M Sharp Jr 1979 AHuvial Hydrogeology of the Lower Missouri River Vaey Journal of Hydrology 4085-99
Greenman D W 1953 Reconnaissance of the Missouri River Pumping Units Between Garrison Dam and Bismarck North Dakota Unpublished paper compiled as part of a US Department of the Interior program for development of the Missouri River Basin Water Resources Division US Geological Survey US Department of t he Interior Washington
Johnson W C R L Burgess and W R Keammerer 1976 Forshyest Overstory Vegetation and Environment on the Missouri River Floodplain in North Dakota Ecological Monographs 4659-84
middot J 1 f Lf
Harcombe P A and P L Marks 1978 Tree Diameter Distributions and Replacement Processes in Southeast Texas Forests Forest Science 24 153-66
Hayes F A and J H Stoeckler 1935 Soil and Forest Re lat ionsh ips of the Shelterbelt Zone I n Possibilities of Shel terbelt Planting in the Plains Region pp 111-15 Special Bulletin US Forest Service US Department of Agricu Iture Ilash ington
Helwig J T and K A Council editors 1979 SAS Users Guide Rashyleigh North Carol ina SAS I nst itute Inc
Hibbard E A 1972 Vertebrate Ecology and Zoogeography of t he ~issouri River Val ley in North Dakota PhD dissertation North Dashykota State University Fargo
Hollander M and D A Wolfe 1973 Nonparametric Statistical Methods New York John Wi ley and Sons
Keammerer W R W C Johnson and R L Burgess 1975 Floristic Analysis of the Missouri River Bottomland Forests in North Dakota Canadian Field-Naturalist 895-19
Kosier J A 1979 Regulating Critical Riparian Lands A Cha llenge in I ntergovernmental Cooperation I n Strategies for Protection and Management of Floodplain Wetlands and Other Riparian Ecosystems R R Johnson and J F McCormick editors pp 332-35 Symposium Proceedings December 11-13 1978 Calloway Gardens Georgia
Kroodsma R L 1970 North Dakota Species Pairs I Hybridization in Buntings Grosbeaks and Orioles PhD dissertation North Dakota State University Fargo
Kuchler A W 1964 Potential Natural Vegetation of t he Contermishynous United States (map) Special Publication American Geograph ical Society INew York
Kujawa M 1974 Plankton Studies on a Recently I mpounded Resershyvoir Journal of Environmental Health 37 252-55
41
42
Kume J and D E Hanson 1965 Geology and Water Resources of Burshyleigh County North Dakota North Dakota Geologicall Survey Bulletin No 42 Pt 1 North Dakota State Water Conservation Commission Grand Forks
Lemke R W and R B Colton 1958 Summary of the Pleistocene Geology of North Dakota In Midwestern Friends of the Pleistocene Guidebook 9th Annual Field Conference Miscellaneous Serial No 10 North Dakota Geological Survey Grand Forks
Lemke R W et aI 1965 Quaternary Geology of the Northern Great Plains In The Quaternary of the United States H E Wright Jr and D J Frey editors pp 15-27 Princeton New Jersey Princeton Univershysity Press
Leopolld L B M G Wolman and J P Miller 1964 Fluvial Processes in Geomorphology San Francisco W H Freeman
McKenzie M A 1936 Flood Injury to Trees Science 83(2154) 412-13
Meinzer O E 1927 Plants as Indicators of Groundwater Water Supply Paper 577 US Geological Survey US Department of the Interior Washington
Meyer H A 1952 Structure Growth and Diameter in Balanced Uneven-Aged Forests Journal of Forestry 5085-92
Parton W J and G S Innis 1972 Some Graphs and Their Functional Forms Technical Report No 153 Natural Resource Ecology Laborashytory Colorado State University Fort Collins
Pitt M D and H F Heady 1978 Responses of Annual Vegetation to Temperature and Rainfall Patterns in Northern California Ecology 59(2) 336-50
Randich P G and J L Hatchett 1966 Geology and Groundwater Reshysources of Burleigh County North Dakota Part II Groundwater Re-shysources North Dakota Geological Survey Bulletin No 42 North Dakota State Water Conservation Commission Grand Forks
Ridley J E and J A Steele 1975 Ecological A spects of River Imshypoundment In River Ecology B A Whitton editor pp 565-87 Berkeley and Los Angeles University of California Press
Robertson P A G T Weaver and J A Cavanaugh 1978 Vegetation and Tree Species Patterns Near the Northern Term inus of the Southern Floodplain Forest Ecological tllonographs 48249-67
Schumm S A 1969 R iver Metamorphosis American Society of Civil Engineers Journal Hydraulics Division 95(HY1) 254-73
Stearns F W 1949 liN inety Years Change in a Northern Hardwood Forest in Wisconsin Ecology 30350-58
Stokes M A and T L Smiley 1968 An Introduction to Tree-Ring Dating Chicago University of Chicago Press
Stout H R et aI 1974 Soil Survey of Burleigh County North Dakota Soil Conservation Service US Department of Agriculture Washington
Swift E 1948 Wisconsin Deer Damage to Forest Reproduction SurveyshyFinal Report Publication 347 Wisconsin Conservation Department Madison
Thornthwaite C W and J R Mather 1957 I nstructlions and Tables for Computing Potential Evapotranspiration and Water Balance Pubshylications in Climatology 10 181-311
Tukey J W 1977 Exploratory Data Analysis Reading Massachusetts Addison-Wesley Publishing Co
US Army Corps of Engineers Omaha District 1980 Personal comshymunication
US Geological Survey US Department of the Interior 1928-1 977 Water Resources Data for North Dakota 1928-1977 North Dakota State Geological Survey Bismarck
US Weather Bureau 1935-1974 Climatological Data North Dakota Annual Summary 1935-1974 Washington
43
44
Weiser P K 1975 Soil Survey of Oliver County North Dakota Soil Conservation Service US Department of A gricultu re Washington
Weist W G Jr 1971 Geology and Ground-Water System in the Gila River Phreatophyte Project Area Graham County Arizona Gila River Phreatophyte Project Professional Paper 655-D US Geological Survey US Department of the Interior Washington
Wells P V 1965 Scarp Woodlands Transported Grassland Soils and the Concept of Grassland Climate in the Great Plains Region Science 148 246-49
Wilhelm F J ~ 978 Soil Survey of Mercer County North Dakota Soil Conservation Service US Department of Agriculture Washington
Wolman M G and L B Leopold 1957 River Floodplains Some Obshyservations on Their Formation Professional Paper 282-C 37 -107 US Geological Survey US Department of the Interior Washington
Yeager A F 1935 Root Systems of Certain Trees and Shrubs Grown on Prairie Soils Journal of Agricultural Research 51 1085-92
Yeager L E 1949 Effect of Permanent Flooding in a River Bottom Timber Area Illinois Natural History Survey Bulletin 2533-65
FIGU RES
FIG
UR
E 1
L
oca
tio
n a
nd N
um
ber
of
Stu
dy
Site
s in
No
rth
Dak
ota
Wa
tfo
rd
Cif
y
o B
1
6
32
4
8
Sca
le
(km
)
Pri
mar
y st
udy
area
is
betw
een
Gar
riso
n D
am a
nd O
ahe
Res
ervo
ir T
he L
ittl
e M
isso
uri
Riv
er r
efer
ence
sit
e is
wit
hin
the
The
odor
e R
oose
vel
t N
atio
nal
Par
k
and
the
scar
p w
oodl
and
refe
renc
e si
te i
s w
est
of P
rice
N
orth
Dak
ota
Sta
nd
~
-J
nu
mbe
rs a
re t
hose
of
John
son
Bur
gess
an
d K
eam
mer
er [
1976
]
~
00
~
c o o CD
~
CD
Q
en
~
CD -Q) E
o 0
J U
FIG
UR
E 2
M
on
thly
Str
eam
flo
w (
19
28
-1 9
77
) fr
om
th
e B
ism
arck
Gau
ging
Sta
tion
on
th
e M
isso
uri
Riv
er
2300TI-~r-~or--r---------r----~--------r----~----r-------------r---~----~----~--~----~
112~
1150
5H
19
44
23
00
In~
U5
0
51~
Year
JI)
In
In
N
19 4
5
194
6
~
25
00
c 0 0 Q
) 172~
I
~
II~O
I fh
~
Q)
~7~
Q) E
0 0
~ ~h
~
I I
I1
96
2
19
63
1
96
4
196~
19
68
1
96
7
19
68
1
96
9
19
70
19
71
19
72
1
97
3
19
74
1
97
5
19
76
1
97
7
FIG
UR
E 2
(co
nti
nu
ed
)
~
(J
Yea
r
S
ou
rce
US
G
eolo
gica
l S
urv
ey
19
28
-19
77
T
he
pri
mar
y gr
owin
g se
aso
n m
on
ths
(May
Ju
ne
an
d J
uly
) ar
e re
pre
sen
ted
by
bla
ck
bars
G
arri
son
Dam
was
co
mp
lete
d i
n A
pril
19
53
S
trea
mfl
ow
is
used
her
e in
stea
d o
f ga
uge
hei
gh
t si
nce
the
latt
er d
ata
wer
e n
ot
avai
lshy
~
able
fo
r so
me
yea
rs
Th
ere
was
usu
ally
a s
tro
ng
co
rrel
atio
n b
etw
een
gau
ge h
eig
ht
and
str
eam
flo
w (
for
exam
ple
fo
r th
e m
on
th o
f (0
O
cto
ber
19
72
R
2 =
09
98
7
Y =
42
81
7x
-2
32
02
)
(J1
o
F
IGU
RE
3
Str
ea
mfl
ow
fo
r Ju
ne a
nd F
eb
rua
ry 1
928-
1977
at
the
Bis
mar
ck G
augi
ng S
tatio
n o
n th
e M
isso
uri
Riv
er
19
82
- ~ rt) E
-
14
16
~
V
I
r
June
S
tre
am
flo
w
~
0 J u ~
85
0
lt
W
0
en
28
3
192
8
19
34
1
94
0
19
46
19
52
1958
1
96
4
1970
1
97
6
YE
AR
CJ1 ~
- ~ rt) E - ~ o J
LL ~
ltt w
a
Ishy (f)
991
70
8
42
5
142
FIG
UR
E 3
(co
ntin
ue
d)
Fe
bru
ary
S
f re
am
flo
w
19
28
1
93
4
19
40
1
94
6
19
52
1
95
8
19
64
1
97
0
YEA
R V
erti
cal
line
indi
cate
s th
e ye
ar t
hat
Gar
riso
n D
am w
as c
ompl
eted
S
ourc
e U
S
Geo
logi
cal
Sur
vey
I 19
28-1
977
19
76
60
40
20
FIGURE 4 Percent Chance of Overbank Flooding at Different
Terrace Elevations Based on the Relationship Between Maximum Gauge Heights and Known Terrace Elevations
100~----------------------------------------------
80 pre- damD
()
z Ci ~l post-dam0 0 -l lL
-l laquo gt z z laquo LL 0
LLJ U Z laquo L u ~ 0
20 30 4 0 50 60
TERRACE ELEVATION
(meters above mean river level)
Source us Geological Survey 1928-1977 (Bismarck gauging station on the Misshysouri River)
52
00 10
a
IJJ
03
~-
ltE
~~
~I UJ
J 1
5
-m
~ ~
21
a
W
C
2
7
FIG
UR
E 5
G
rou
nd
wat
er a
nd S
trea
mfl
ow
Dat
a (1
97
1-1
97
3)
fro
m t
he
Mis
sour
i R
iver
nea
r B
ism
arck
Str
eam
flow
Wat
er T
able
~
r-
~
1
I I
I
J
I
I
I
II
1 J
11
I
IJ
_
shy
II
I
~
M
J J
J
M J
J
M J
J
I I
I 19
71
1972
19
73
MO
NT
H
AN
D
YE
AR
(J)
1415
~
0
fTI
~ 1132 raquo
~
84
9
r o 5
6 6 ~
shy
3 2
83
~
USG
S te
st w
ell
no
138-
080-
08-A
BA
1
loca
ted
appr
oxim
atel
y 1
km f
rom
the
Mis
sour
i R
iver
and
app
roxi
mat
ely
2 km
sou
th o
f B
ism
arck
P
rim
ary
grow
ing
seas
on
mon
ths
of
May
Ju
ne
and
July
are
rep
rese
nted
by
M
JJ
Str
eam
flow
dat
a fr
om B
ism
arck
C
Jl ga
ugin
g st
atio
n S
ourc
e U
S
Geo
logi
cal
Sur
vey
192
8-19
77
w
E E
I tshy~ 0 a ()
J ~ gt z z ~
54
FIGU RE 6 A merican Elm Chronologies (1 928-1 977)
from Stands 12 13 19 and 16
30
25
14
12
10
20
15
10
05
5 0
40
30
UNSTANDARDIZED
YEAR
American EI m Stand 12 1 age=80
American Elm Stand 13 i aoe=135
American EI m Stand 19 i age=120
American Elm Stand 16 i age=120
1976
-shyE E-
12
10
08
06
12
10
0middot8
12 10
08 06
FIGURE 6 (continued)
1928
STANDARDIZED
1940 1952
YEAR
American Elm Stand 12 x age=8
American Elm Stand 13 x age=135
Amer ican Elm Stand 19 i age=120
1964 1916
Figures on left are unstandardized (long-term trends not removed by standardizashytion) figures on right have been standardized Vertical lines indicate the year that Garrison Dam was completed
55
56
FIGURE 7 Bur Oak Chronologies (1928-1 977) from Stand 16
and the Scarp Woodland Reference Site
UNSTANDARDIZED
20
18
E E
16
I tshy~ 0 a C)
Bur Oak J Scarp Woodlandlaquo ) x oge= 120z
1 8z laquo
16 ( I
Bur Oak Stand 16
X age=120
14
1928 1940 1952 1964 1976
YEAR
FIGURE 7 (continued)
STANDARDIZ ED
12
10
- 08 E Bur Oak E- 06 Stand 16
I X age=120 ~ 0 a () Bur Oak J
110 Scarp Woodland ~ gt x age= 120 z z 105 ~
100
09gt
090
1928 1940 1952 1964 1976
YEAR Figures on left are unstandardized figures on right have been standardized Vertical lines indicate the year that Garrison Dam was completed
57
-E E
25
c toshy 23 ~ 0
21a ()
- 19 ~ ~ 17Z Z ~
en ~
E 256
~ 199 0 J LL 142 ~ ~
85W a Ishy 28en
58
FIGURE 8 Cottonwood Chronology (1928-1977)
from the Litt~e Missouri Reference Site
1928
1928
UNSTANDARDIZED
1940 1952
YEAR
1952
YEAR
Cottonwood Little Missouri
i age-IOO
1964 1976
Little Missouri
1964 1976
FIGURE 8 (continued)
STANDARDIZED
Cottonwood E E- 1 2
Little Missouri
x age= 100 c Ishy~ 10 0 a ()
08 ~ ltt =gt Z 06 Z ltt
Unstandardized chronology is top left standardized on right Average streamflow for April to July (1935-1977) for the Little Missouri River is shown bottom left Vertical lines indicate the year that Garrison Dam was completed Source US Geological Survey 1928-1977 (Watford City gaugi ng station)
59
E E
I Ishy~ o a lt- J ltt gt z z ltt
60
FIGURE 9 Cottonwood Chronologies (1928-1977) f rom Stands 5 and 14
6 0
50
40
3 0
20
10
30
2 5
20
1 5
1928
UNSTANDARDIZED
1940 1952
YEAR
Cottonwood Stand 5
c age=80
Cottonwood Stand 14
x age= faa
1964 1976
13
11
-E 0 9
E- 07
05
12
10
08
06
FIGURE 9 (continued)
STANDARDIZED
1940 1952
YEAR
Cotton wood Stan d 5
x age=80
Cottonwood Stand 14
x age=IOO
1964 1976
Figures on left are unstandardized figures on right have been standardized Vertical lines indicate the year that the Garrison Dam was completed
61
C)
f)
F
IGU
RE
10
S
moo
thed
Pio
ts o
f S
prin
g A
E V
ersu
s Y
ear
and
Spr
ing
(May
Ju
ne
July
) S
tre
am
flo
w V
ersu
s Y
ea
r
AE
Str
ea
mfl
ow
83
76
2
96
E
70
2
89
(J -
64
W
lt
t 5
7
~
r
v
shy
28
3
27
7
51
2
71
44
~
-
2 6
4
25
8
19
28
1
93
4
19
40
1
94
6
19
52
1
95
8
19
64
1
97
0
197
6
YEAR
Ver
tica
l li
ne i
nd
icat
es t
he y
ear
that
Gar
riso
n D
am w
as c
om
ple
ted
(J)
-t
n
fTI
lgt
~
r 0 ~
0 c 3 ~
en
64
FIGUR E 11 Results of Stepwise [MAXR Helwig and Council 1979]
Multip le Regression Analysis of Cottonwood from Stands 5 and 14 for Pre-Dam (1928-1952) and Post-Dam (1953-1977) Periods
Cottonwood Stand 5 CJ) t-Z 10
Pre -d am U w
5li ~ w 0 0 U
-5 Z Q -10 CJ) CJ)
AMJJ AMJJ AMJJ AMJJ AMJJ AMJJ ASOW V-I Y-I V-Ia () LLJ
Post-dam5 0 a
2 5 0 UJ N 0 0 0 a lt - 2 5 0 Z
~ -50
en PR IOR
FLOW PPT AE TEMP GROWTH
FIGURE 11 (continued)
(f) ~ Z 10 LLJ U 5ii ~ 0 0 0
-5 Z 0
-10 () () UJ a C)uJ 10 a
50 UJ N 0 0 ~ -5 ~ 0 Z -10 ~ (f)
Cottonwood Stand 14
Pre- dam
AMJJ AMJJ AMJJ AMJJ ANJJ ASO Y-I Y-I
Post- dam
FLOW PPT AE TEMP PRIOR I I GROWTH I
Fourteen environmental variables and a variable for the previous years growth (shown in Table 6 plus fall AE) were available to the stepwise selection process Only those variables significant at the 0100 level are shown Bars represent standshyardization regression coefficient and dots above or below bars indicate levels of sigshynificance bull ~ 005 bullbull ~ 001 bullbull ~ 0001 [Fritts 1976]
65
66
FIGURE 12 Age Structure of American Elm and Boxelder Populations in Four
Treatment Stands on the Missouri River Floodplain in North Dakota
AME RICA N EL M BOX E LDER
1 1 Ii c 2
10 STAND 7 STAND 7~ gt
oil lt= GI Cl 10
E GI
Vl
5 310 10
c Ii
02 11 102 STAND 11
gtshy Ui
n II 10 10
GIE
VI
STAND
27112233445566778899111111111 2711223344556677 272727272727272727001122334 27272727272727
272727272
AGE (years) AGE (years)
FIGUR E 12 (continued)
AM ER IC AN ELM BOXELDER
Ii
i ~ iii c
0
E VI
ii ~
~ iii c
0
E
iii
~ ~
~ ~ iii c
0
bull VI
101 10
2 STAND 13
0
104
102 STAND 19
10
510
2
44 6
AVERAGE10
10
I
8899111111111 272727272727272727001122334
272727272
AGE (years)
White bars denote proportion of stems of sprout origin
STAND 13
310
210 STAND 19
0
AVERAGE
2 11223344556677 27272727272727
AGE (years)
67
68
FIGURE 13 Age Structure of American E 1m and Boxelder Populations
in Reference Stands on the Missouri River Floodplain in North Dakota
AMERICA N ELM
105 ~ I ~
S TAND 16iii 103bull I
~ gt-
I) 102~ c QJ
0
E
V) -QJ
101-
~27112233445566778899111111111 272727272727272727001122334
272727272
AGE (years)
1 m 103
I
gtshy
I) 102 c 41
0
E -QJ
101Vi
S TAND 7
103
FIGURE 13 (continued)
ro c
gt
I)
c ClI
0
E ClI
V) -
ro c
~ gt
I)
c QJ
0
E QJ
V) -
STAND 23
102
101
L 104
103
BOXELDE R
I
STAND 16
102
101
2711223344556677 27272727272727
AGE (years)
69
TABLES
TA
BL
E 1
P
reci
pita
tion
and
AE
Sta
tistic
s fo
r P
re-D
am (
19
35
-19
54
) an
d P
ost-
Dam
(1
95
5-1
97
4)
Per
iods
Mea
n M
axi
mu
m
Min
imu
m
To
tal
Ap
ril-
July
T
ota
l A
pri
l-Ju
ly
To
tal
Ap
ril-
Ju
ly
Pre
cip
ita
tio
n (
cm)
Pre
-dam
P
ost-
dam
4
03
(S
O 9
1)
382
(S
O 7
2)
23
6 (
SO
75
) 22
4 (
SO
65
) 5
16
54
7
34
4
33
0
152
27
1
27
126
AE
(cm
) P
re-d
am
Pos
t-da
m
381
(S
O 7
6)
361
(S
O 7
6)
29
6 (
SO
64
) 2
92
(S
O 6
6)
46
7
514
37
2
36
8
170
2
36
1
12
169
So
urc
e
US
W
eath
er B
urea
u C
lima
tolo
gic
al
Dat
a
-J
W
~ T
AB
LE
2
Mea
n T
ota
l R
adia
l W
ood
Gro
wth
by
Spe
cies
and
Site
fo
r 20
-Yea
r P
re-D
am (
19
35
-19
54
) an
d P
ost-
Dam
(1
95
5-1
97
4)
(Un
ad
just
ed a
nd A
dju
sted
fo
r A
ge)
Per
iods
Spe
cies
Gre
en a
sh
Am
eric
an e
lm
Box
elde
r
Co
tto
nw
oo
d
(Mis
sour
i R
iver
)
Co
tto
nw
oo
d
(Lit
tle
Mis
sour
i R
iver
)
BU
r oa
k (M
isso
uri
Riv
er)
(B2)
(B
1)
Una
djus
ted
(AB
2)
To
tal
Rad
ial
To
tall
Rad
ial
Ad
just
ed
Rad
ial
Woo
d G
row
th
Woo
d G
row
th
Woo
d G
row
th
Num
bers
of
Per
Cor
e (m
m)
Per
Cor
e (m
m)
Per
Cor
e (m
m)
Cor
es a
nd
11
93
5-1
95
4
19
55
-19
74
1
95
4-1
97
4
Sta
nds
Incl
ud
ed
t X
X
X
34
(8)
3
65
2
89
30
4
48
(7)
36
1
23
5
264
29
(7
) 4
10
26
4
316
26 (
5)
47
2
30
6
41
3
25 (
4)
38
3
35
5
47
2
20 (
3)
32
0
29
6
Wilc
oxo
n S
ign-
Ran
k Z
-Val
ues
f (B
2-A
B2
)
-32
1 (p
lt 0
001
)
-48
1 (p
lt 0
0001
)
-26
5 (p
lt 0
00
8)
-12
4 (N
S)
+2
18
(p
lt 0
03
)
(B1-
B2
)
-22
0 (
p lt
00
3)
TA
BL
E 2
(co
ntin
ue
d)
(82
) (8
1)
Un
adju
sted
(A
82
) T
ota
l R
adia
l T
ota
l R
adia
l A
dju
sted
Rad
ial
Wo
od
Gro
wth
W
ood
Gro
wth
W
oo
d G
row
th
Nu
mb
ers
of
Per
Co
re (
mm
) P
er C
ore
(m
m)
Per
Co
re (
mm
)
Spe
cies
C
ores
an
d
Sta
nd
s In
clu
ded
t 19
35-1
954
X
1955
-197
4 X
19
54-1
974
X
Wil
cox
on
Sig
n-R
ank
Z-V
alu
es
(8
2-A
82
) (8
1-8
2)
Bur
oak
(S
carp
wo
od
lan
d)
10 (
1)
171
1
93
-1
4
8 (
NS
)
See
tex
t fo
r m
eth
od
of
adju
stm
ent
Po
st-d
am g
row
th o
f b
ur
oak
was
no
t ad
just
ed b
ecau
se m
ost
cas
es s
ho
wed
an
incr
ease
in
gro
wth
b
etw
een
th
e tw
o p
re-d
am p
erio
ds
tPar
enth
eses
in
dic
ate
stan
ds
incl
ud
ed
tSo
urc
e H
oll
and
er a
nd
Wol
fe [
1973
]
(J
1
76
TABLE 3 Median Percent Change in Growth for Pre-Dam (1935-1954)
and Post-Dam (1955-1974) Periods
Species Median Percent Change
Boxelder -26 American elm -25 Green ash -18 Bur oak (Missouri River) - 9
Cottonwood (Missouri River) - 6 Cottonwood (little Missouri River) +13 Bur oak (scarp woodland) +20
Species connected by vertical lines are not significantly different (multiple comparishysons test p lt 005 Hollander and Wolfe [1973]
TABLE 4 Frequency Table (Number of Stands) of Change
in Growth Relative to Terrace Elevation
Classes of Percent Change Terrace Elevation Class t
in Growth Low Medium High
Low 0 3
Medium 3 2 0
High 0 3
Low = less than 5 percent decrease medium = 5-20 percent increase high =greater than 20 percent increase
t Low = approximately 3 m above mean river level medium = approximately 4 m above mean river level high = approximately 5 m above mean river level
TA
BL
E 5
C
hara
cter
isti
cs o
f S
tan
ds
Sam
pled
for
Tre
e-R
ing
Chr
onol
ogie
s
Sta
nd
Spe
cies
Sam
pled
S
oil
Org
an
ic
N0
3-N
N
o
and
Mea
n A
ge
Te
xtu
re
Ma
tte
r (
) (p
pm
)
Mis
sou
ri R
ive
r F
loo
dp
lain
5
Co
tto
nw
oo
d (
80
yea
rs)
sand
0
76
1
3
14
Co
tto
nw
oo
d (
10
0 y
ears
) si
lty-
cla
y 2
22
2
4
12
A
me
rica
n e
lm (
80
yea
rs)
silt
y-cl
ay
29
2
16
1
3
Am
eri
can
elm
(1
35
yea
rs)
silt
y-c
lay
26
9
43
1
9
Am
eri
can
elm
(1
05
yea
rs)
silt
4
40
3
6
16
B
ur
oa
k (1
25
yea
rs)
silt
y-cl
ay
40
7
32
Ref
eren
ce S
ites
Lit
tle
Mis
sour
i R
iver
C
ott
on
wo
od
(1
00
yea
rs)
Sca
rp w
oo
dla
nd
B
ur
oa
k (1
20
yea
rs)
So
urc
e f
or
soil
cha
ract
eri
stic
s J
oh
nso
n
Bur
gess
an
d K
ea
mm
ere
r [1
97
6]
Ele
vatio
n A
bov
e
Mea
n R
ive
middotr Le
vel
(m)
30
32
3
5
40
4
0
50
28
-J
-J
-J co
TA
BL
E 6
R
esul
ts o
f S
tep
wis
e M
ulti
ple
Reg
ress
ion
Ana
lysi
s U
sing
Tre
e-R
ing
Inde
x as
th
e D
epen
den
t V
aria
ble
an
d 1
5 I
nd
epen
den
t V
aria
bles
(C
lim
ate
Str
eam
flo
w
Pre
viou
s Y
ear
s G
row
th)
Sta
ndar
dize
d S
peci
es
Inte
rce
pt
Reg
ress
ion
Co
eff
icie
nt
Co
tto
nw
oo
d
Sta
nd 5
P
re-d
am
-27
6 +
82
8
-20
3 +
36
0
+3
33
-3
52
Pos
t-da
m
-64
8 +
16
9
+5
76
+
26
2
-37
3 +
04
2
Sta
nd 1
4 P
re-d
am
-21
7 +
41
0
+3
24
-2
48
+6
62
+0 4
7
Post
-dam
-1
5
+4
20
-5
44
+11
71
+2
99
-34
9
En
viro
nm
en
tal
Var
iabl
es
Ap
ril-
Ma
y F
low
(A
MF
L)
Ju
ne F
low
(JU
NE
F)
Spr
ing
Pre
cip
Y-l
(S
PG
P1)
S
prin
g P
reci
p (S
PG
P)
Spr
ing
AE
Y-l
(S
PG
AE
1)
June
Flo
w (
JUN
EF
)
Spr
ing
AE
(S
PG
AE
)
Spr
i ng
Te
mp
Y-l
(S
PG
T1)
F
all
Te
mp
Y-l
(F
AL
LT
1)
Pre
viou
s G
row
th (
AV
E 5
-1)
A p
ril-
May
Flo
w (
AM
FL
)
Spr
ing
Pre
cip
Y-1
(S
PG
P1)
A
pri
l P
reci
p (A
P)
S
pri
ng
Pre
cip
(SP
GP
) P
revi
ous
Gro
wth
(A
VE
14
-1)
Spr
ing
Pre
cip
Y-l
(S
PG
P 1
)
Spr
ing
Pre
cip
(SP
GP
) S
prin
g A
E (
SP
GA
E)
S
pri n
g T
em
p Y
-l (
SP
GT1
)
Fal
l T
emp
Ymiddotl
(F
A L
LT
1)
r2
F
p
08
2
162
3 0
0001
0 7
1 8
61
00
00
3
07
3
98
6
00
001
07
5 10
61
00
001
TA
BL
E 6
(co
ntin
ue
d)
Sta
ndar
dize
d S
peci
es
Inte
rce
pt
Reg
ress
ion
Co
eff
icie
nt
En
viro
nm
en
tal
Var
iabl
es
r2
F p
Bur
oak
S
tand
16
Pre
-dam
-2
814
+
38
0
Ap
ril-
Ma
y F
low
(A
MF
L)
05
2
312
0
03
+2
98
S
prin
g A
E Y
-1
(SP
GA
E 1
) +
47
9
Spr
ing
Te
mp
Y-1
(S
PG
T1)
+
35
8
Fal
l T
em
p Y
-1
(FA
LLT
l)
-49
9 S
prin
g T
emp
(SP
GT
) +
024
P
revi
ous
Gro
wth
(A
VE
16-
1)
Pos
t-dam
-4
216
+
39
5
Ap
ril-
Ma
y F
low
(A
MF
L)
077
12
06
00
00
1 +3
61
June
Flo
w Y
-1
(JU
NE
F1
) +
23
5
Ap
ril
Pre
cip
(AP
) +
417
S
prin
g A
E (
SP
G A
E )
+3
10
S
prin
g T
em
p (
SP
GT
)
Sca
rp w
oo
dla
nd
P
re-d
am
-18
9 -3
01
June
Flo
w (
JUN
EF
) 0
36
269
0
06
2 +
38
0
Spr
ing
Pre
cip
Y-1
(S
PG
P1)
+
30
3
Ap
ril
Pre
cip
(A P
) +
387
S
prin
g A
E (
SP
GA
E)
Pos
t-dam
-7
37
+34
4 Ju
ne F
low
Y-1
(J
UN
EF
1)
04
1
33
3 0
032
+
19
5
June
Flo
w (
JUN
EF
) +
227
S
prin
g P
reci
p (S
PG
P)
+04
1 P
revi
ous
Gro
wth
(A
VE
10
-1)
-J co
(co
nti
nu
ed
)
00
a
TA
BL
E 6
(co
nti
nu
ed
)
Sta
ndar
dize
d S
peci
es
Inte
rce
pt
Reg
ress
ion
Co
eff
icie
nt
En
viro
nm
en
tal
Var
iabl
es
r2
F
p
Am
eri
can
elm
S
tand
12
Pre~am
+3
69
4
+3
96
A
pri
l-M
ay
Flo
w (
AM
FL
) 0
55
3
42
00
211
-48
3 Ju
ne F
low
(JU
NE
F)
+9
89
S
prin
g P
reci
p Y
-1
(SP
GP
1)
+3
35
S
prin
g P
reci
p (S
PG
P)
-49
3 S
prin
g A
E (
SP
GA
E)
-33
8 S
prin
g T
emp
(SP
GT
)
Post~am
-13
77
-29
7 A
pri
l-M
ay
Flo
w Y
-1
(AM
F L
1)
04
7
25
5
00
6
+5
47
June
Fl o
w Y
-1
(JU
NE
F1
) -5
78
A
pri
l-M
ay
Flo
w (
AM
FL
) +
68
5
June
Flo
w (
JUN
EF
) -2
45
Fal
l T
em
p Y
-1
(FA
LL
T1
) -3
72
Spr
ing
Te
mp
(S
PG
T)
Sta
nd 1
3 Pre~am
+3
08
3
-50
0 A
pri
l-M
ay
Flo
w Y
-1
(AM
FL
1)
06
3
61
8
00
01
7
+3
13
Ju
ne F
low
Y-1
(J
UN
EF
1)
+52
1 S
prin
g P
reci
p Y
-1
(SP
GP
1)
+2
85
S
prin
g T
em
p Y
-1
(SP
GT
1)
-62
8 S
prin
g T
em
p (
SP
GT
)
Post~am
+52
51
-69
8 S
prin
g P
reci
p Y
-1
(SP
GP
1)
05
4
552
0
00
4
+1
00
9
Spr
ing
AE
Y-1
(S
PA
E1)
-3
64
Spr
ing
Te
mp
Y-1
(S
PG
T1)
-4
15
Ap
ril
Te
mp
(A
T)
TA
BL
E 6
(co
ntin
ue
d)
Sta
ndar
dize
d S
peci
es
Inte
rce
pt
Reg
ress
ion
Co
eff
icie
nt
En
viro
nm
en
tal
Var
iabl
es
r2
F
p
Sta
nd 1
9
Pre
ltlam
+
19
98
+
39
5
Ap
ril-
Ma
y F
low
(A
MF
L)
05
1 3
70
0
01
76
+
11
06
S
prin
g P
reci
p Y
-1
(SP
GP
1)
-99
4 S
prin
g A
E Y
-1
(SP
GA
E1)
-4
91
Spr
ing
Te
mp
(S
PG
T)
Pos
tltla
m
-11
34
+4
57
Ap
ril-
Ma
y F
low
Y-1
(A
MF
L1)
0
67
73
8
00
00
6 -5
44
Ap
ril-
Ma
y F
low
(A
MF
L)
+6
29
Ju
ne F
low
(JU
NE
F)
-19
7 A
pri
l P
reci
p (A
P)
+3
47
S
prin
g A
E (
SP
GA
E)
co
82
TABLE 7 Results from the Modified Regression Model
Stand Pre-Dam Post-Dam
Cottonwood 5 Streamflow A E
(0004) t (001)
14 Streamflow AE (002) (001 )
Elm 12
13
19 AE (003)
Oak 16 AE AE
(005) (0006)
Streamflow (0006)
Scarp woodland AE (005)
Growth = growing season AE and growi ng season streamflow using the G LM proshycedure in SAS [Helwig and Council 1979] Growing season is May June and July
tParentheses indicate levels of significance
TABLE 8 Missouri River Erosion and Deposition Rates at Various Time Intervals
Time Total Erosion Total Deposit ion Interval Time (yr) Erosion (ha) Rate (hayr) Deposition Rate (ha yr)
1881-1891 10 1328 133 1650 165
1891-1945 54 4648 86 5464 101
1945-1969 22 1704 77 937 43
1969-1979 10 212 21 13 13
TA
BL
E 9
M
isso
uri
Riv
er L
and
Use
Cha
nges
Sin
ce E
arly
Set
tlem
ent
Per
cen
tage
of
Cov
erag
e
Cat
egor
y T
ime
Peri
od
Pre
-set
tlem
ent
Pos
t-se
ttle
men
t
Agr
icul
ture
18
72-1
938
38
A
gric
ultu
re
1938
-197
9 18
C
otto
nwoo
d w
illo
w
lt 40
yea
rs o
f ag
e 14
3
Cot
ton
woo
d 40
-80
year
s o
f ag
e p3
10
C
otto
nwoo
d a
sh
elm
bo
xeld
er
80-1
50 y
ears
of
age
30
21
Ash
el
m
boxe
lder
gt
150
yea
rs o
f ag
e 3
10
co
w
(I)
w CJ z C ()
W (I)
l I
Q Z C
J W Z Z C ()
ac w gt ac
The Virginia Water Resources Research Center is a federal-state partnership agency attempting to find solutions to the states water resources problems through careful research and analysis Established at Virginia Polytechnic Inshystitute and State University under provisions of the Water Research and Develshyopment Act of 1978 (PL 95-467) the Center serves six primary functions
bull It studies the states water and related land-use problems including their ecological political economic institutional legal and social i mpl ications
bull It sponsors coordinates and administers research investigations of these problems
bull It collectsmiddotand disseminates information about water resources and water resources research
bull It provides training opportunities in research for future water scienshytists enrolled at the states colleges and universities
bull It provides other public services to the state in a wide variety of forms
bull It facilitates coordinated actions among universities state agencies and other institutions
More information on programs and activities may be obtained by writing or te lephoning the Center
Vi rgin ia Tech does not discriminate against employees students or applicants on the basis of race sex handicap age veteran status national origin religion or political affiliation The Un iversity is subject to Titles VI and VII of the Civil Rights Act of 1964 Title IX of the Education Amendments of 1972 Sections 503 and 504 of the Rehabilitation Act of 1973 the Age Discrimination in Employment Act the Vietnam Era Veteran Readjustment Assistance Act of 1974 Federal Executive Order 11246 Governor Robbs State Executive Order Number One and all other rules and regulations that are applicable Anyone having questions concerning any of those regulations should contact the Equal OpportunityAffirmative Action Office
Virginia Water Resources Research Center Virginia Polytechnic Institute and State University
617 North Main Street Blacksburg Virginia 24060-3397
Phone (703)961-5624
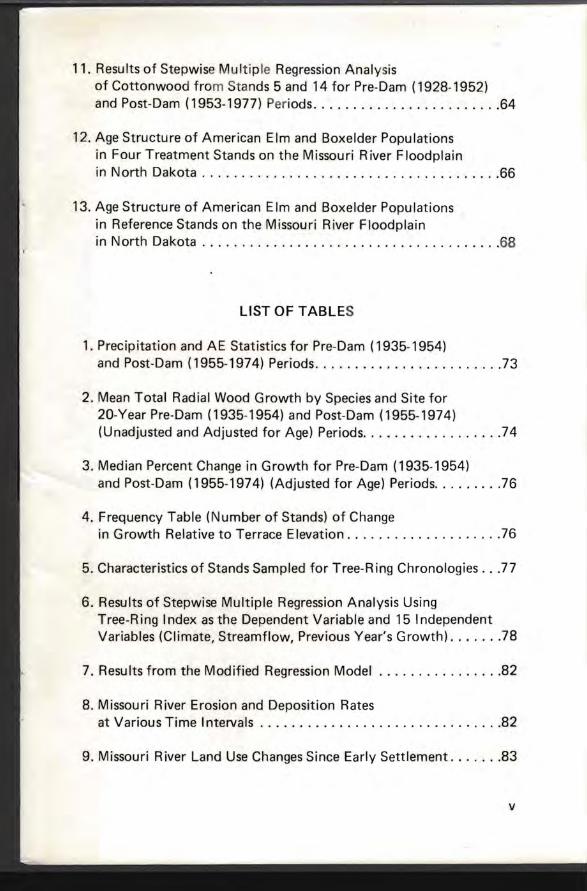

2
tion of Populus-Salix forests and lowering seedling survivorsh ip of Ulmus americana and Acer negundo and encouraging t he clearing of f loodplain forests for agr icul ture with improved irrigation opportunities
Resu Its of th is study shou Id have appl ication to f orests on other floodshyplains where the natural hydrologic regimen has been altered by man This research should stimulate further study of riparian ecosystems so that a more general assessment can be made of the ecologica l effects of floodplain protection
Key Words Floodplains Floodplain Protection Floods Forests Dams Riparian Ecosystems Riparian Vegetation Rivers River Meandering Growth Survivor~hip Land Use North Dakota Missouri River
INTRODUCTION
The ecological impacts of constructing impoundments on river systems are many and varied On-site impacts have been t he focus of most reshysearch [Baxter 1977] A few stud ies document t he rap id loss of native riparian habitats wi t hin the impoundment basin (for example Yeager [1949] ) but most eva luate changes in aquat ic organisms and water qualshyity during and after th e f illing of reservoi rs [Kujawa 1974 Ridley and Steele 1975] Off-site impacts of reservoir construction have received little study except for t he r iver env ironment itse lf (water quali ty mon ishytoring fish population dynamics) Potential downstream effects assoshyciated wi th adjacent fl oodp la in ecosystems have been neglected perhaps because (1) the effects are not immediately noticeable and hence less dramatic compared to the changes associated w ith t he filling of resershyvoirs or (2) native riparian ecosystems had on many fl oodplains la rgely been removed for agriculture before dam const ruct ion Recently KosshyIer [1979] noted serious gaps in research concerning wetl andf lood intershyrelationsh ips and the reaction of wetl ands and floodplai ns to stress
Trees on floodplains in semi-arid regions exhibit vernal growth patterns [Brown Lowe and Hausler 1977 Everitt 1980) That is growth occurs earlly in the growing season when water is readi ly avai lable and ceases in mid-summer as moisture is depleted Production and dissemination of seeds also occur in the sp r ing Although moisture is of major importance to the distribution and growth of f loodplain trees the relat ive imporshytance of the various sources of water available is poorly known
Potentiai sources of moisture f or floodpllain trees include overbank fl oodshying groundwater and precipitation (capillary water) Overbank f looding is responsible for much physical damage to f lloodplain trees [McKenzie 1936 Sigafoos 1964] and in humid cII imates may be responsible for the distribution of floodplain species according to their tolerance to flooding [Bedinger 1971 Bell and del Moral 1977 Robertson Weaver and Cavashynaugh 1978] In dry climates however flooding may benefit trees by saturating the rooting zone and raising the water t able just before the onset of growth
The dynamics of riparian woodlands are closely t ied to the dynamics of two physical processes flooding and river meandering Significant changes in the rates of these natural perturbations would be expected to alter the properties of riparian ecosystems and the f lloodplain landshy
3
4
scape Our stu dies indicate that the cessation of fl ood ing and related changes in hydrologic regimen associated with the presence and operashytion of reservoirs are having major and long-term effects on the natural dynamics of remnant riparian ecosystems This conclusion is based on investigations of a protected floodpla1in bounded north and south by two large reservoirs along the upper Missouri River in North Dakota
Johnson Burgess and Keammerer [1976] first noted that major ecologishycal changes in riparian ecosystems along this stretch of the Missouri River had been init iated by reservoir construction The pu rpose of this research was specifically to test three hypotheses [Johnson Burgess and Keamshymerer 1976] through new field research in 1979 and 1980 The three hypotheses were that the altered hydrologic regimen caused by the presshyence and operation of reservoirs had initiated (1) adecline in d iameter growth rate of trees (2) a reduction in river meandering rate and landshyscape composition and diversity and (3) changes in the population strucshyture of several important tree species Tests of the three hypotheses are considered separately in th is report effects on tree growth are considered first meandering rate and forest composition sec~md and population structure third Histork and recent patterns of Iand use change also are analyzed in the second section
STUDY AREA
The study area included floodplain forests along a 130-rriver km portion of the Missouri River Valley located in south-central North Dakota (Figshyure 1) Garrison Dam (Lake Sakakawea) completed in 1953 forms the northern border while the Oahe Reservoir some 10 km south of Bisshymarck forms the southern border Most forests studied were on the floodplain within the study area however reference sites for tree growth analysis were selected in scarp woodlands west of Price North Dakota and along the Little Missouri River in western North Dakota (Figure 1) The climate of the study area is characterized by low humidity and low annual precipitation Mean annual precipitation is 39 cm 70 percent of it occurring during the growing season (approximately May 10 to Sepshytember 27) [Randich and Hatchett 1966]
I Physiography
This segment of the Missouri Valley lies in the Missouri Slope district of the Glaciated Missouri Plateau section of the Great Plains physioshygraphic province [Fenneman 1931 Lemkeand Colton 1958 Clayton 1962] The valley is trench-I ike varying in width from about 1 km to more than 11 km and is cut as much as 170 m below an upland undershylain by glacial drift and Tertiary and Cretaceous bedrock The trench is floored by a broad floodplain bounded locally by terraces The floodshyplain descends from an el1evation of 515 m at Garrison Dam to 494 m at the junction with Oahe Reservoir a total drop of 21 m in about 130 river km giving an overall gradient of about 015 m per km
II Geologic History
This segment of the Missouri Valley did not exist before Quaternary glaciation The preglacial Missouri flowed northeastward from Montana across the northwest corner of North Dakota into Saskatchewan [Lemke et aI 1965] and was diverted into its present course by southwestward advancing -continental ice sheets The timing and sequence of events inshyvolved in this diversion are not completely known
The most recent studies of this problem are by Bluemle [1971] and Carlshyson [1973] both of whom suggest a complex history of diversions by various ice advances which forced the Missouri into a course involving segments of eastward-trending preglacial valleys and new segments cut
5
6
by water diverted across former divides Bluemle shows that the wide segments of the present trench are those that were parts of preglac ial val leys and t he narrow segments are those that were cut by water diverted across divides He also suggests that f inal diverting and assumption of the present cou rse of the Missouri did not occur until late Wisconsinan time less than 15000 years ago
The terraces along the trench were developed as the river incised itsel f below former floodplain levels leaving remnants of those floodplains Some of them are eroded bedrock surfaces mantled with glacial drift and represent f loodplains formed in reoccupied preglacial valley segshyments formed during pre-Wisconsinan glacial diversion [Carlson 1973] Other terraces are underlain by sand and gravel and resulted from glacial valley trains [Brockman et aI 1979]
The defin itive study of Missouri River terraces has not yet been made and various authors who have studied different segments of t he trench disagree on the number of terraces and their historical interpretation Kume and Hanson [1965] recognized four terrace levels in Burleigh County two high outwash terraces and two low alluvial terraces Carlson [1973] working in Mercer and Oliver counties recognized only two tershyraces an upper one that corresponded to the high outwash terraces of Kume and Hanson and a lower one that included their two lower alluvial terraces Carlson believed that the two lower terraces represent the preshydam floodplain
Post-glacial changes in the trench have not been great The floodplain was established and modified by lateral cutting of the meandering river The valley walls have been gullied by new dra inage lines eroding headward into adjacent uplands and by slopewash Wind has piled sand into dunes locally and soils have formed on the various trench sediments
III Geologic Materials of the Trench
The trench walls expose the various materials cut through by the eroding river At the top are glacial sediments (generally thin and locally lacking) including till and lesser amounts of glacio-fluvial sands and gravels loess eolian sand and glacial lake sediments ~Iost of the depth of the t rench is cut in bedrock of early Tertia ry and (in the Bismarck-Mandan area) late Cretaceous age [Kume and Hanson1965 B luemle 1971 Carlson 1973] The Tertiary units include interbedded sands silts clays shales
and lignite beds belonging to the Paleocene Cannonbal l Slope Bullion Creek and Sentinel Butte formations The late Cretaceous beds are mudstones sandy sh ales sandstones and I ign ites of the Hell Creek f orshymation
Most of the high terraces are underlain by sand and gravel and are loessshycovered in some areas but some are underlain by drift-mantl ed bedrock [Kume and Hanson 1965 Carlson 1973] The low terraces essentially the modern pre-dam floodplain are underlain by recent alluvium includshying flood overbank deposits channel deposits and natural levee deposits Overbank silts and clays compose about 90 percent of these sediments with sand and gravel of channel and levee deposits composing about 10 percent [B luemle 1971] The thickness of this Holocene component may be as much as 35 m or more but it is often difficult to distinguish from similar glacial sediments upon which it rests
IV Soils
Soils of the Missouri trench have been described in county soil surveys of McLean County [Brockman et aI 1979] Olliver County [Weiser 1975] Mercer County [Wilhelm 1978] and Burleigh County [Stout et aI 1974] The floodplain soils that support the forests of the study area are Entisols of the Typic Ustifluvent or Typic Fluvaquept subgroups The Havrelon series dominates generally comprising 50 to 75 percent of the floodplain soils It is formed from loamy alluvium on the slightly higher elevations and is calcareous and well drained It has moderate permeability high available water capacity medium natural fertility and low organic matter
Areas of sandy alluvium such as natural levees and inter-channel islands are occupied mainly by the Banks series which has moderately rapid permeability low available water capacity low natural fertility and low organic matter Clayey alluvium of floodplain depressions (mainly oxshybows) is occupied mainly by the Lallie series which has slow permeabilshyity high available water capacity low natural fertility and low organic matter
Floodplain soil profiles tend to have thin greyish A horizons no B horishyzons and C horizons that vary somewhat in texture because of alluvial stratification All horizons tend to be mildly to moderately aikaline
7
8
V Stream Hydrology
The filling of Lake Sakakawea began in November 1953 At that time the natural hydrologic regimen was replaced by a controlled-release regishymen and the river began a series of adjustments to this alteration
Two major alterations in downstream regimen could be expected to result from damming (1) reduction of peak annual flow (mean annual flood) because of impoundment of excess runoff and (2) reduction of sediment load because of sediment deposition in the reservoir from upshystream
Continuous daily discharge records from 1928 to present recorded at the US Geological Survey Gauging Station No 06342500 at Bismarck (120 km downstream from the dam) permit a comparison of the preshydam and post-dam discharge These data show no significant change in overall discharge The mean of daily discharge readings for 25 pre-dam years (water years 1928-29 to 1952-53) is 1999 cms compared to 2204 cms for 25 post-dam years (water years 1954-55 through 1978-79) This decrease in discharge because of the initial filling of the reservoir (1953shy1963) was offset by the low discharges resulting from the dry climate of the 1930s
Seasonality of discharge has changed considerably The pre-dam (1928shy1952) pattern of monthly streamflow shows peak flow occurring from Apri l to July and minimum flow occurring from December to March (Figure 2) The sharp peaks in streamflow in the spring and early sumshymer in the pre-dam period are largely absent after 1953 Overall peak flow now occurs in February and March instead of April May and June and minimum flow occurs mainly in May and September instead of January and February
Seasonal flow rates are especially different for the months of June and February (Figure 3) June streamflow in the drought years of the 1930s was much higher than June streamflow since completion of the dam Extrapolating from gauge height the spring water table on the average would be considerably lower since 1953 and the late-summer water table would perhaps be higher Therefore the period of peak flow is now out of phase with the vernal growth pattern typical of floodplain trees
Mean annual low flow (mean of the lowest mean daily discharge readings
over a number of years) has been increased by abou t 155 percent Mean annual low fl ow for the 25 pre-dam years was 405 cms compared to 1 032 cms for the 25 post-dam years The minimum annual low flow for the 25 pre-dam years was 167 cms (January 1940) compared to 372 cms (March 1955) in the 25 post-dam years an increase of about 122 percent
I n addition to these changes in flow changes in the sed iment load could also be expected Both suspended load and bed load from upstream are trapped in the reservoir Thus the water released into the trench below the dam is essentially sediment-free and able to acquire a new load from materials available in the trench Unfortunately data are not available to compare pre-dam and post-dam sediment loads
Overbank flooding is the element most obviously missing from the postshydam floodplain environment Flooding now occurs on only the lowest terraces in part as a result of local ice jams in the spring Flooding above the 2-m terrace elevation has been eliminated (Figure 4) In the past the 3-m elevation was flooded on the average of once in 35 years and the 4-m elevation approx imately once in 6 years Terrace elevations of the stands sampled ranged from 3 to 5 m above mean river level The highest stand was flooded on the average of once in 25 years Because of ice jams in the pre-dam period the above frequencies are probably low for some locales Landowners report higher flood frequencies (25 percent or greater)
The mean annual flood (mean of the highest mean daily discharge readshyings over a number of years) has been reduced by about 68 percent Mean annual flood for the 25 pre-dam years was 11064 cms compared to 3554 cms for the 25 post-dam years The maximum annual flood (highest mean daily discharge reading) for the 25-year pre-dam period was 33736 cms (April 1952) compared to 6394 (July 1975) lin the 25 post-dam years a reduction of 81 percent
VI Natural Vegetation Dynamics
The predominant vegetation of the region is mixed grass prairie [Kuchshyler 1964] Small pockets of scarp woodland occur in protected upland ravines but the most extensive forests occur on the floodplain Clearing for agricu Itu re has reduced these forests to about 50 percent of their original extent Floodplain tree species include cottonwood (Populus
9
10
deltoides) peach-leaved willow (Salix amygdaloides) boxelder (A cer negundo) green ash (Fraxinus pennsylvanica var lanceolata) A merican elm (Ulmus americana) and bur oak (Quercus macrocarpa)
Most of t he worlds fl oodp lains have been formed by the effects of deposition and overbank flow [Wolman and Leopold 1957] Deposit ion as we as erosion is dependent upon lateral m igration of the river across the floodp lain A s the r iver deposit s alluv ium on the inside of a meanshyder it erodes mater ial from the opposite bankline Overbank flow usually results from heavy spring rains combined wi th rapid snow melt Downshycutting by t he river and upbuilding of the terrace from alluvial deposishytion during f loods eventually leaves some terraces well above the active floodp lain Leopold Wol man and Miller [1964] referred to such r iver terraces as t he abandoned f loodpla in
Vegetation patterns correspond to the dynamics of deposition and eroshysion Lateral movement of the river in it iates a dynamic series of vegetashytion events As t he river meanders it erodes away estab lished banks often covered w ith fo rest vegetation in different stages of devel opment However fully exposed alluvium deposited in the inside of river curves is prime habitat fo r the establ ishment of t ree seedl ings of pioneer species (for example cottonwood peach-leaved w i llow) Of the six tree species occurr ing on the floodplain only cottonwood and willow germinate and persist under t hese conditions Cottonwood and willow are classic pioshyneer species the seeds of neither species germinate under a forest canopy or in light gaps This illustrates the importance of point bar deposition by the meander ing river in maintaining cottonwood-willow commu nities as an important and integral component of the floodplain ecosystem
If cottonwood-wi now communities remain uneroded forest s of these tree species will develop Should they be missed by t he meandering river for centuries however the overstory will be replaced by admixtures of green ash boxelder Amer ican elm and bur oak through natural successhysion Thus there is a strong positive correlation between terrace elevati on and forest successional stage Higher terraces that have escaped erosion and were exposed to fewer floods of less intensity are more likely to contain vegetation of advanced successional stages
The cessation of floodi ng and a decline in the meandering rate would have at least two major consequences (1) reduce the amount of subshystrate (freshly deposited alluvium) for the regeneration of new cott onshy
wood-wil low forests and (2) allow a greater proportion of existing forests to age and change type t hrough natura l succession The net effect would be to reduce the land area of cottonwood-will ow forest now the most extensive forest t ype in favor of forests of ash boxelder elm and oak Old cottonwood-wil low forests exhib it the greatest tree species diversity [Johnson Burgess and Keammerer 1976] and have the greatest r ichness and density of breeding birds [H ibbard 1972] T he major forest communities also exhibit divergent understory species mineral cycl ing patterns and fau na [ Kroodsma 1970 Hibbard 1972 Keammerer 1972 Keammerer Johnson and Burgess 1975]
11
12
T REE GROWTH
Research to t est t he hypothesis that alteration of the hydrologic regimen was responsible for decreased tree growth had three components First we examined the degree to which environmental variables important to tree growth had changed from pre-dam to post-dam periods Second cumulative growth of trees was compared during two 20-year periods to determine pre-dam and post-dam growth patterns Third tree-ring chronologies were constructed and the growth patterns related statisshytically to a series of environmental variables using multiple regression procedu res
I Methods
Th irteen forest stands (Figure 1) were selected for tree core sampl i ng The stands included a range of vegetation and physiographic conditions and showed little or no sign of current or past disturbance One refershyence site was located along the Little Missouri River in western Nort h Dakota with in the Theodore Roosevelt National Park (Figure 1) The Little Missouri is a free-flowing stream whose flow patterns have not been altered by flood control structures Cottonwood and willow preshydominate although green ash boxelder and American elm occur as well The Little Missouri is a much smaller river than the Missouri average flows are 1733 for the Little Missouri and 6409 cms for the Missouri [US Geological Survey 1928-1977]
A second reference site was a scarp woodland [Wells 1965] located above the floodplain (Figure 1) Vegetation was similar in composition to that of the mesic terraces of the Missouri River with bur oak green ash American elm and boxelder the dominant tree species Scarp woodland trees rely exclusively on precipitation which is concentrated in local ravines Growth of these trees should more closely ref lect patshy
terns of precipitation than floodplain trees
The reference sites were selected because they were similar to the M1isshysouri River floodplain sites in vegetation and general climatic conditions but had not undergone any major environmental modifications between pre- and post -dam periods The term reference was used rather than IIcontrol because a number of small differences existed between refershyence and treatment sites (for example 39 cm mean annual precipitation for the Missouri 37 cm for the Little Missouri)
Trees were selected for sampling if they were at least 70 years old and displayed no sign s of disease or decay Also trees were exc luded if a nearby competitor had d ied Tree cores were collected using an increshyment borer and were dried mounted and surfaced A number of cores were initially measu red with a dendrochronometer to establish a system of cross-dating to facilitate accurate measurement of the remaining samshyples [Stokes and Smi ley 1968]
Three 20-year increments of growth (two pre-dam periods 1915-1934 1935-1954 one post-dam period 1955-1974) were measured for aU cores Because diameter growth of trees usually decreases with age it was necessary to adjust the measurements of the post-dam growth to compare them to groyvth during the immediate pre-dam period when trees were younger Standard dendrochronological procedures to correct for aging [F ritts 1976] were not su itable here as none discrim inates beshytween decrease in growth due to age and decrease due to long-term envishyronmental changes (for example altered river hydrology) low-frequency trends are removed
To correct for age we adjusted (increased) postdam growth by multishyplying it by the proportional change in growth that occurred between the two pre-dam periods The proportional change or multiplier was the quotient calculated by dividing growth during the first pre-dam period (1915-1934) by growth during the second (1935-1954) Cores that showed a growth decline between the pre-dam periods were adjusted in the above manner for all species except bur oak (henceforth referred to as adjusted for age) For example a core with 50 mm and 40 mm growth respectively during the first and second pre-dam periods would result in a multiplier of 125 Therefore the growth during the post-dam period say 20 mm would be adjusted to 25 mm Our method thus assumes a uniform rate of decline in growth with age Bur oak was not adjusted because most cores were from old trees that showed small inshycreases not decreases in growth between the two pre-dam periods
Finally 90 of the cores used above in the inter-period comparisons were selected for multiple regression analysis to examine year-to-year variation in growth in relation to environment Cores were selected from stands for wh ich there were at least 8 cores per species from trees at least 80 years old except for elm in stand 16 where only 3 cores were available The number of cores per species for the Missouri River floodshyplain was 24 for cottonwood 30 for elm and 12 for oak with 8 for
13
14
cottonwood on the Little Missouri and 16 for oak in the scarp wood land
Individual ri ng w idt hs were measured for a 50-year period (1928-1 977) for each core Measurements were standard ized (converted to indices) by fitting a polynomia l curve to the data and then dividing each ring width by the corresponding curve value (henceforth referred to as standshyardized) In this way long-term trends in growth were removed (for example due to senescence) and year-to-year variation was emphasized [F ritts 1976] The computer program used in the standardization proshycedure was developed at the Laboratory of Tree- Ring Research in Tuscon Arizona [Fritts Mosimann and Botroff 1969] and adapted for use by the US Geologlical Survey Tree-R ing Laboratory in Reston Virshygin ia R ing-widtl indices for all cores from a stand were averaged by species to construct chronologies three of cottonwood (including one from the Little Missouri) two of oak (including one from the scarp woodland) and three of elm
Precipitation data were from the US Weather Bureau station at Bisshymarck To integrate temperature (energy) and moisture actual evaposhytranspiration (AE) was also calculated [Thornthwaite and Mather 1957] and used as an independent varlable in growth correlations AE was calshyculated assuming 25 cm of available water per 15 cm of soil a surface rooting zone of 12 m and equal water availability between field capacshyity and permanent wilting point (-15 bars) [Johnson Burgess and Keamshymerer 1976]
II Results and Discussion
A Environmental Variables
Primary environmental variables potentially important to tree growth during the two periods included precipitation groundwater overbank flooding and soils To determine whether low precipitation might have been responsible for the decrease in tree growth during the post-dam period Johnson Burgess and Keammerer [1976] compared average anshynual precipitation and AE for two 15-year periods 1940-1954 and 1955shy1969 They found a slight decrease in both parameters in the post-dam period We also found a slight decrease in average annual precipitation and AE for two 20-year periods and for the primary growing season months (April May June and July) although the means were not sigshynificantly different (p lt 075) and the minimum values were much
smaller in t he pre-dam period (Table 1) I t is unl ikel y that the small average decrease in AE and precipi tat ion cou ld have caused a large deshycline in growth in the post -dam period A s w ill be shown later t ree growth of one reference si te actuall y increased signi ficant ly du r ing t he post-dam period
Depth to the water table ranges from near zero to 9 m in t he study area [Greenman 1953] Water table depth changes seasonally in response t o periods of aquifer recharge and discharge (Figure 5) Rech arge occurs mainly in early spring from lateral movement of water f rom t he Missouri River at high stages (bank storage) subsurface flow from ad jacent bedshyrock above the floodplain and percolation of soil grav itational water from precipitation an9 runoff Discharge from the aquifer occurs mainly in the summer as a result of transpiration flow to the Missouri River at low stages and irrigation pumping [Randich and Hatchett 1966] The water table on terraces adjacent to rivers can respond rapidly to changes in river stage however the response decreases w it h increasing distance from the channel [Weist 1971 Grannemann and Sharp 1979]
Current re leases from Garrison Dam are related primarily to generation of electricity Peak demands occur during the coldest months and to a lesser extent the warmest months [US Army Corps of Engineers 1980] although the seasonal pattern is highly variable It is di ff icult to detershymine the effect of changing river gauge height (flow) on water table depths at all distances from the river although the greatest changes probably have occurred nearest the river channel Unfortunately we can find no data on pre-dam water table depths and seasonal fl uctuashytions in the study area and can only speculate as to p re-dam water table conditions However irrigation and seasonal fluctuation in river stage have noticeably ch anged since completion of Garrison Dam There has been increasing use of aquifers for pumped irrigation water which would have lowered the water table during the growing season
Several stands were located in areas fl100ded periodically from concenshytrated upland ru noff The highest of these (stand 16) was situated at the edge of the floodplain adjacent to the bedrock terrace Three ravines draining a large upland area empt ied into the stand According to local reports it is flooded most years in the spring at times of snow melt and heavy precipitation Moisture conditions for this stand were markedly different from terraces of similar elevation that received no concentrated runoff Not only did vegetation composition of t h is stand differ from
15
16
dr ier terraces but as will be shown later t ree growth showed distinctly different pat t erns
Soils in the study area are alluvial in or igin and high in textural va rishyability not only between but also within stands Past f loods deposited lenses of sands si Its and clays varyi ng in th ickness th roughout the floodshyplain With the cessation of flooding the deposition of silt on terraces and accompanying nutrient enrichment have been eliminated Yet the cessation of flooding also aldows for a build-up of organic matter on tershyraces where it was previously scoured and removed by flood waters Changes in soi ll characteristilcs as a result of flood cessation are most Iikely not of as immediate importance to tree growth as the alteration in the hydrologi~ regimen However soils could have had an effect on the growth response of a tree to altered moisture conditions
B I nter-Perilod Comparisons of Cumulative Growth
Average cumulative growth of trees was compared between the immeshydiate pre-dam (1935-1954) and post-dam (1955-1974) periods AI species on the Missouri River floodplain decreased in growth in the postshydam period (Table 2) comparing post-dam growth (adjusted for age) to growth in the pre-dam period The trends are very similar to those of Johnson Burgess and Keammerer [1976] even though they are based on different sets of tree cores In contrast post-dam growth of oak (unshyadjusted) and cottonwood at the reference sites was greater than growth during the pre-dam period Application of the Wilcoxon sign-rank test [Holllander and Wolfe 1973] to growth during the pre- and post-dam periods showed that the decreases on the Missouri River floodplain were statisticaHy significant for all species except cottonwood the cottonshywood reference site showed a statistically significant increase but the increase in oak growth in the scarp woodland was not significant (Table 2)
In a separate analysis the percent change between pre- and post-dam (adjusted for age) periods was computed for each core and the median percent change computed for each species (Table 3) Percentages ranged from about a 25 percent decline to a 20 percent increase Largest declines were for boxelder elm and ash with moderate decreases for cottonshywood and bur oak on the Missouri River floodplain Comparatively large increases were exhibited by the two reference sites Based on results from a mUltiple comparisons test [Hollander and Wolfe 1973] the growth
decli nes for boxelder and elm were sign ifican t ly different from the inshycreases on th e reference sites and ash was significantly different from oak o n t he scarp woodland reference site Diffe rences am ong species o n t he Missouri River f loodplain were not stat isti cally sign ificant nor were the differences for bur oak a nd cottonwood between floodp lai n and reference sites
An atte mpt was made to rel ate changes in growth to va rious envi ronshymental condi t ions such as soil cha racteri st ics and topog rap h ic positio n (for example elevation above mean river leve l) Percent change in growth of all spec ies was determ ined for each stand The stands were then ran ked into lowmediumhigh classes of change This procedure was repeated for all three so il characte ristics (ava ilable water capacity organic matter and soil texture) and for stand elevation Frequency tables were conshystructed for growth classes and the classes for each env ironmental varishyable No trends were found for t he so il character istics Terrace e levat ion versus percent change in growth however showed a dist inct trend (Table 4) On the uppermost terraces growth was little changed on t he middle terraces growth showed the greatest decline and on the lowest terraces growth decreased moderately
Trees on low terraces (2-3 m above mean river level ) which were flooded most frequently in the pre-dam period and are rarely flooded now were expected to have shown the largest decrease in growth However growth decreased more on the middle terraces than on the lower terraces The relative depth to the water table on a terrace may be more important for growth than flood frequency Trees on low terraces are closer to the water table and to the river and could more effectively utilize pulses of high flow (for example after heavy precipitat ion) compared to those of the upper terraces
Tree growth on high terraces showed the least amount of change beshytween the periods Although the water ta ble was likely at greater depths on these terraces and only occasionally accessible to t rees (even in the pre-dam period) most of these stands received additional moisture from concentrated upland runoff Many trees here showed increases not decreases in growth For example stand 16 reportedly was flooded most years by runoff from upland ravines E 1m in stand 16 showed no change in growth between pre- and post-dam periods compared to a deshycrease of 25 percent over the study area Runoff is clearly important to the growth of trees on high terraces adjacent ot the uplands
17
18
T he observed decrease in the growth of elm was not caused by Dutch elm disease since trees in the Bismarck area have been infected onl y in t he last several years Johnson Burgess and Keammerer [1976] observed a decrease in growt h of trees sampled in 1969 before the disease had spread to centra l Nort h Dakota The elms that we sampled 10 years after their study sh owed t he same magnitude of decl ine in growt h
C Patterns of A nnual Radial Tree Growth
Cottonwood elm and oak were se lected fo r multivariate analysis to examine year-to-year variation in growth in relation to environment These species were selected because each is representative of a different stage lin the development of the floodplain forest and therefore may be affected differently by the altered hydrologic regimen Also patterns of pre- and post-dam growth differed among these species Percent change in the growth of bur oak and cotton was the smallest between the two periods whereas elm showed a large decrease in growth in all but the most mesic stands
Seven tree-r ing chronologies were constructed from stands along the Missouri (two from stand 16) and two chronologies were constructed for the reference sites (Table 5) Both unstandardized and standardized chronologies were constructed and smoothed [Tukey 1977 3RSSH 3RSSH3] for each site except for elm in stand 16 where just the unstandshyardized chronology was used (Figures 6 through 9) Low growth during the 1930s (especially 1936-1937) in 1946 and in 1961 was common to all of the tree-ring chronologies These were periods of low spring streamflow and AE (Figure 10) During the pre-dam period most chronshyologies exhibited two peaks in growth between 1938 and 1944 I n the post-dam period most chronologies showed peak growth in 1965 coinshycident with high spring AE Thus t here was a close correspondence beshytween macroclimate and the growth of floodplain trees
But perhaps of more significance were the years 1952 and 1955 In April of 1952 one of the largest floods on record for the Missouri River inunshydated the entire floodplain It was however a year of low AE All chronshyologies except those from stand 13 (Figure 6) and the scarp woodland showed high growth in 1952 This illustrates the compensating effect that overbank flooding had on tree growth in years of low AE In 1955 t he reverse conditions prevailed spri ng AE was high while streamflow (releases from the dam) was low Growth in 1955 for all chronologies
except in stands 13 (Figure 6) 16 (Figure 7) and t he scarp woodland was low wh ich ind icates the effect of low streamflow on growth The growth of scarp woodland trees not influenced directly by streamflow generally followed A E patterns between 1928 and 1977
The unstandardized series for elm sites that did not receive concentrated upland runoff (stands 12 13 and 19) exhibited a systemat ic downward trend in growth rate through the post-dam period (Figure 6) wh ich matched the general pattern of elm growth decline discussed ear lier In contrast the unstandardized chronology for elm in stand 16 which conshytinued to receive upland runoff since construction of the dam showed no systematic long-term decline in growth during the post-dam period and therefore was no~ standardized This re-emphasizes the importance of topographic position on the magnitude of the growth decline of elm and other species during the post-dam period
The cottonwood chronology from the Little Missouri reference site (Figshyure 8) showed similar trends in growth to that of cottonwood on the Missouri River (Figure 9) with lowest growth also occurring in the 1930s 1946 and 1961 I n contrast to the cottonwood chronology from stand 14 (Figure 9) the unstandardized chronology from the Little Misshysouri showed no systematic decl ine in growth Trends in the Little M isshysouri streamflow data generally matched cottonwood growth patterns (Figure 8)
D Multiple Regression Analysis
Fourteen environmental variables (fall AE plus those shown in Table 6) considered to be important for tree growth during certain months and seasons (for example June flow) were used in stepwise multiple regresshysion models A fifteenth variable tree growth during the previous year was included because growth in one year may strongly affect growth in the following year (serial correlation Fritts 1976] Thus tree-ring index was the dependent variable and the 15 aforementioned factors were independent variables Regressions were determined separately for each stand for pre-and post-dam periods
Several streamflow parameters correlated positively in the mUltiple regression models with annual patterns of cottonwood growth in the pre-dam period (Figure 11) Apri l-May flow was important in models for both stands 5 and 14 In addition spring precipitat ion and spring
19
20
preCIpitation in the previous year (Y-1) were posi t ively correlated in models for both stands The ana lysis also indicated that growth may be suppressed when April precipitation is high (negatively correlated with growth Figure 11) because it may pro long saturated so il condi tions (low oxygen) after March -April flood s High June fl ow (negatively corshyrelated Figure 11) flooded low terraces near the river such as stands 5 and 14 or ra ised the water table excessively during this important growing season month and therefore may have been responsible for deshycreased stem growth by lim iting root oxygenation High June f lows were common in the pre-dam period (Figure 2)
Correlation patterns for cottonwood shifted markedl y from streamflow and spring precipitation in the pre-dam period to AE and temperature in the post-dam period (Figure 11) Of the streamflow parameters only June flow was positively correlated with growth (stand 5) in the post-dam period Thus very high flows in June in the pre-dam period could have reduced overall growth but h igh flows within a much lower range in the post-dam period (Table 3) could have been benef icial Growth in both stands was positively correlated with spring AE and spring tempershyature in the previous year and negatively correlated with fal l temperature in the previous year Low fall temperature in the previous year would have resulted in greater soil moisture storage over the w inter The negashytive correlation with spring precipitation in stand 14 appears to be spurshyious a situation not uncommon in the application of multivariate techshyniques to ecological data [Pitt and Heady 1978] Overall the general lack of correlation with streamf1low suggests that moisture su pplied by the river is now less important to the growth of cottonwood in t he postshydam period
Cottonwood presence has been used as an indicator of a high water t able since it tends to be phreatophytic [Meinzer 1927 ] Hayes and Stoeckler [1935] classified cottonwood as a shallow-rooted t ree laquo 2 m) however its roots may ex tend to much greater depths especially on floodplains where the process of terrace development continually buries the trunks of trees [Everitt 1968] Older cottonwoods that grow on terraces 3 m above mean river level yet that germinated on low terraces just above river level may have roots that extend to the original depth of rooting
With the alteration in flow regimen especially during the growing seashyson there has l ikely been a corresponding change in depth to water table For example with a lower spring water table the roots of trees may no
longer extend to the capillary fri nge thus growth might depend more on surface soil moisture from rai nfa ll than on groundwater T his shift in response from one source of moisture to another indicated t hat the dam has indirect ly affected cottonwood water rel ations Cottonwood was perhaps less affected by altered streamflow t han other species beshycause of its deep root system proximity to the river where the water table was most accessible and possession of a root system more responshysive to changes in water su pply
Most positive correlations with bur oak growth in stand 16 during the pre-dam period were with variables of the previous year including growth temperature and AE (Table 6) Regression coefficients for the post-dam period in c r~ased considerably positive correlations were for current year precipitation AE and temperature in the spring The reshygression coefficients for the scarp woodland models were low (036 041) and are therefore not discussed With respect to the observed positive correlation between oak growth and streamflow variables it should be recalled that post-dam streamflow was mainly a reflection of releases from the dam However high streamflow events were also caused lin part by runoff from short heavy rains or rapid snowmelt The frequency of these events may have been independent of total monthly precipitation For example total monthly precipitation does not indicate whether there were many days of light rain or a few days of heavy rain with the rest of the month dry For these reasons the relationsh ip between oak growth and streamflow was only correlative and not causal
Regression coefficients for American elm were higher than the scarp woodland oak values but still considerably less than those of the cottonshywood models Patterns of correlation shown by at least two of the three elm stands during the pre-dam period were positive correlation with April-May flow and spring precipitation in the previous year and negative corre1lation with spring temperature The patterns are decidedly different in the post-dam period April-May flow was negatively correlated and June flow was positively correlated with growth However there was little pattern among stands with respect to the numerous other variables included in the regression models The correlation pattern for elm apshypears to be high Iy variable among sites and between periods and little can be generalized from the multiple regression analyses
The chronologies were also used in a reduced model growth = sp ring AE and spring streamflow in a linear modeling procedure [Helwig and
21
22
Counci l 1979] to more clea rly defi ne the contribut ions of these environshymental facto rs to t ree growth (Table 7) The results re-emphasize the shift in correlation between the periods from streamflow to AE for cotshytonwood Bur oak growth correlated with A E in the pre-dam period yet was more strongly correlated with AE and streamflow in the postshydam period For American ellm correlations with growth in the reduced model were weak one significant correlation wi th AE occurred in one elm chronology in the post-dam period
Separate regression analyses were made for the Little Missouri cottonshywood chronology corresponding to the pre- and post-dam periods on the Missouri In the 15-variable stepwise regression procedure (using Little M issou ri s~reamflow data from 1935-1977) there were no major differences in the variables selected for either pre- or post-dam period models Using the reduced model growth = spring A E and spring streamshyflow (Little M issouri) there were again no shifts in correlations between the two periods This is in distinct contrast to the shifts lin correlations observed for cottonwood in stands 5 and 14 on the Missou ri River where the hydrologic regimen has been altered by Garrison Dam
LAND USE AND RIVE R HYDROLOGY
Johnson Burgess and Keammerer [1976] expected that because of reshyduced spring flooding (lower peak flows) and bank stabil ization the rate of river meandering had slowed since construct ion of the dam T his hypothesis is evaluated in this section by analyzing historic and present river meandering rates Also in this section the rates and di rections of land use change since initial settlement are analyzed and di scussed Such an analysis is important since current vegetation patterns are closely linked to past land use
I Methods
A River Meandering Rate
Historic and recent rates of meandering of the Missouri River were detershymined from channel change maps within the study area Positions of the river over time were transferred to a common base map at a scale of 124000 Several sources of linformation were used General Land Office summary records describe the position of the river channel f rom 1872 to 1881 An additional set of archival maps was prepared in 1891 by the Missouri River Commission The aerial photographic record of the study area began in 1938 Photographs recording channel position were available for several time periods up to the present Additional informashytion on pre-dam channel position was available from maps prepared by the US Army Corps of Engineers in 1945
The pre-dam meandering rate was determined from channel positions in 1881 1891 and 1945 From the common base maps an electronic digitizer was used to determine the amount of eroded and deposited land in each time interval This total area was divided by the number of years in the time interval to compute average annual erosion and deposishytion for the period Post-dam meandering rate was determined by comshyparing the position of the river compiled from US Geological Survey photographs (1969) to current (1979) channel as shown by Corps of Engineers photographs Meandering rates were independently determined for the period 1938-1972 by the Corps wh ich used aerial photogramshymetric techniques and range line surveys
Also field surveys were conducted to assist in mapping historic ch annel positions Five to 10 cottonwood trees on each terrace level on several
23
24
large meanders in the study area were cored and aged By p lotting t ree ages fo r a given terrace isochro nes or age contours could be d rawn [Everitt 1968] Use of these maps improved the accuracy of th e comshyposite channel map
B Land Use Change
Land use was mapped for each period on a com posite map at a scale of 1 24000 Land use categories were (1) marsh-treeless areas with emershygent aquatic vegetation or open water (2) non-forest - o pen land occushypied by houses or farm buildings (3) bare sand-non-forest ed ba rs and dunes along the river channel (4) ind ustrial-power plants and refineries (5) agriculture (s~tt l ement to 1938)-cropland and pasture cleared before 1938 (6) agriculture (1938- 1979) - cropland and pasture cleared 1938shy1979 (7) cottonwood-willow-young stands of Populus deltoides and Salix amygdaloides up to approximately 40 years of age (8) cottonshywood-stands of Populus deltoides approximately 40-80 years of age (9) cottonwood-ash-elm-boxelder-stands with at least 50 percent of the canopy composed of Populus with 20-50 percent an admixture of Fraxishynus Ulmus and Acer (10) ash-elm-boxelder-stands with at least 75 percent of the canopy composed of Fraxinus Ulmus and Acer Many of these stands included a small component of Populus andor Quercus
Field surveys and tree aging also improved the accuracy of land use maps by providing general ground information and specifically enabling more accurate estimation of age classes of cottonwood forests They also enabled accurate estimation of the area and age of young cottonwoodshywi lIow forests (less than 40 years) wh ich are di fficu It to identify u namshybiguously from photography
Because 1891 cover maps were very general General Land Office Survey records were used to determine the proportional composition of the forest categories at the time of settlement These reco rds have been used by other researchers in determining pre-settlement vegetation [Stearns 1949 Burgess 1964] Survey notes usually included a general descripshytion of each township including deta ils of forest underbrush soils and relief Points were established at each 16-km interval along the range and section li nes of each township In this manner 36 sections were established within each township At the common point between secshytions as well as at quarter section corners (a point halfway between section corners) the species diameter and bearing of up to four witshy
ness trees were recorded By examining the records for all trees on the 160 points occurri n~ in the study area the proportion of cover types could be estimated
II Resu Its and Discussion
Between 1881 and 1891 approx imately 1650 ha of land su rface area were deposited as alluvial material (Table 8) Durin~ this same period approximately 1328 ha were eroded The average annual erosion rate was 133 ha per year For the interval 1891-1945 approximatel y 5464 ha were deposited and 4648 ha eroded Average annual loss rate during th is interval was approx imately 86 ha per year Thus average annual erosion rate for the ~ntire pre-reservoir period (1881-1945) was 93 ha per year wh ile deposition rates averaqed 111 ha per year Although there was a slight net accumulation of material (18 ha per year) during the pre-dam period losses and qains were relatively balanced
In the post-dam period both erosion and deposition rates decreased subshystantially Dur ing 1969-1979 only 13 ha of land were deposited and most of that accumulated behind erosion control devices (wing-dikes) constructed along the bankline During this same period approximately 212 ha of land were lost to erosion This is an average annual rat e of 21 ha per year Thus erosion rates fell from the pre-dam avera~e of 93 ha per year to 21 ha per year during the post-dam period (1969-1979) Accretion rates fell from 111 ha per year to 13 ha per year during the same period Post-dam erosion rates were only 25 percent of pre-dam rates and accretion rates only 1 percent of pre-dam rates
Vhi lle erosion and deposition rates were relatively balanced during the pre-dam period they were decidedly unbalanced during the post-dam period Deposition during the pre-dam period was 12 ti mes greater than erosion during the post-dam period erosion was 162 times greater than accretion This overal ll increase in erosion over deposition has resulted from increased bank cutting and destabilization Thus the channel is widening because material is being eroded from both banks with little concurrent accretion
Meandering rates increased as floodplain width increased Thus where the floodplain was narrow river meandering rate was small In the porshytion of the study area below Garrison Dam (Microfiche 17) the width of the floodplain averages about 16 km Shifts in channel position since
25
26
1872 have averaged approx imately 06 km I n the study area south of Bismarck (Microfiche 11) t he floodplain is approximately 116 km in width Channel changes since 1872 have averaged approximate ly 24 km result ing in red istribution of la rge am ou nts of alluvium
The model of Schumm [1969] would predict t hat the reduction of f loodshying and bed-material load resulting from dam emplacement will lead to an increase in channel sinuosity and a decrease in meander wavelength Thus the natural response involves considerable lateral cutting unti l the channel reaches equilibrium with the new regimen In the study area however an extensive series of bank-stabilization structures conshystructed by the Corps of Engineers since dam emplacement has preshyvented natural c~annel response and has actually led to a considerable post-dam reduction in lateral channel shifting The Schumm model also predicts a decrease in channel width but the actual channel has been widening T he cause of this anomalous response may be that the stream is expend ing energy in eroding and transporting sediment from both channel walls instead of unilateral channel shifting
The dramatic decline in erosion and accretion rates since the construcshytion of Garrison Dam and the change in the balance between the two are beginning to have an impact on natural rates of reforestation by cottonwood and willow Currently approximately 35 percent of the floodplain forest is composed of cottonwood forests less than 80 years old forests with cottonwood trees less than 150 years old comprise 78 percent of the total Thus forests with cottonwood as the primary dominant currently make up the large majority of the floodplain forests
On active f loodpllains Everitt [1968] proposed a logarithmic decline in the area of the floodplain occupied by forests of increasing age that is young forests should occupy the largest proportion and old forests the smallest I f the meandering rate were to decl ine su bstantially thereby decreasing the likelihood of erosion and increasing mean stand age the pattern may at equ iI ibriu m become reversed that is old f orests wou Id occupy a larger area than young forests This is the pattern now emerging on this protected floodplain cottonwood forests less than 40 years of age now occupy only 8 percent of the total forest area while forests of 40 to 80 years comprise 23 percent of the total We expect the proporshytion of young cottonwood forests to decline in rough proportion to the decline in accretion rates A new equilibrium composition would be reached in less than two centuries and cottonwood forests will probshy
ably comprise at the most only 5-10 percent of the t otal forest area The remainder would include forests of more advanced successional age dominated by green ash and boxelder especially the f ormer Cottonshywood stands of t he future will be small in extent and primari ly located behind w ing-dikes and other erosion control dev ices Few if any cotshytonwood forests w ill occupy broad terraces more than several meters above mean river level The distr ibu t ion of cottonwood shou Id t heref ore become more rest ricted that is a strand species occurring in close proximity to the river
Settlement has brought many significant changes in the ex tent and comshyposition of the floodpl ain vegetation (Microfiches 2 1 th rough 28) The largest changes involved the clearing of fo rests for agricultural purposes By 1938 approximately 38 percent of the floodplain forest had been cleared for agriculture or about 07 percent per year over t he 1881shy1938 period (Table 9) Thus clea ring proceeded at a rapid rate after the General Land Office Survey of 1872-1881 No mention of agricu lture on the floodplain was made in the Survey notes however some cultivashytion had occurred in the adjacent prairie uplands An additional 18 pershycent of the forest was cleared for cu Itivation between 1938 and 1979 or about 05 percent per year
I ndustrial development on the floodplain is a recent phenomenon occurshyring mostly after the construction of Garrison Dam Less than 1 percent of the land area is used by industry Marshes and sand dunes also comshyprise less than 1 percent of the fl oodplain area Marsh area has changed little since presettlement but bare sand has decreased since the cessation of floods Large floods in the pre-dam period scou red and deposited sand on low terraces near the r iver channel
General Land Office Survey notes indicate that the preset tlement floodshyplain was almost completely wooded Young cottonwood forests less than 40 years old occupied about 14 percent of the floodplain forest These may have occupied a larger proportion of the forest area because young trees were generally not used as witness trees in the land survey
Approximately 53 percent of the forest was composed of cottonwoods 40-80 years old Thirty percent of the forest was in the old cottonwood type while only 3 pelrcent of the forests were of advanced successional age These included ash elm boxelder and bur oak with occasional large cottonwoods
27
28
Presently fo rest vegetation comprises about 44 percent of the floodplain area about 8 percent of t his total is composed of young stands of cottonshywood and willow less than 40 years of age Most of these have regenershyated since the closing of Garrison Dam in 1954 on alluvium deposited du ring the 1952 flood In many areas these stands are severely browsed by beaver and scoured by ice in the spring resu lting in frequent damage to aboveground stems Thus individual plants are older than they appear Because these stands are on low terraces with a high water table are flooded occasionally and are on soils unproductive for crops only 6 percent of this forest type has been cleared since their establishment at various times during the past 40 years
Approximately 23 percent of the existing floodplain forest was comshyposed of stands of cottonwood ranging in age from 40 to 80 years Forshyests in th is age class generally occurred on more productive soils howshyever they were still on low terraces with relatively sandy soils Agriculshytural clearing has removed about 52 percent of these stands since their establishment Clearing of forests of this age has increased since the 1930s because of floodplain protection and access to irrigation
The most extensive forest category is age class 80-150 years-47 percent of the total forest area These stands contain large cottonwood trees with young green ash American elm and boxelder These forests are located on intermediate terrace elevations About 43 percent of forests in th is category have been cleared for agricu Iture
The remaining forest type makes up 22 percent of the total forest area These forests contain green ash American elm boxelder and few scatshytered cottonwoods andor bur oak Since settlement 75 percent of this forest type has been cleared for agriculture This high rate of clearing is due to the location of these stands on high terraces removed from most floods and the presence of more productive soils for agriculture
Overall the rate of forest clearing was at its maximum during the early settlement period before 1938 Although the rate of clearing has been somewhat lower during the period after 1938 field observations indicate a surge in clearing since 1970 when irrigation became more widespread Soils that were perhaps of marginal productivity and therefore left forshyested cou ld be made more productive with additional water from irrigashytion Deforestation continues at a rate that is probably greater than the average rate of 05 percent for the 1938-1979 period
It is difficu lt t o accurate ly est imate the forest type proport ions on the presettlement flood plain primarily because the surveyors selected against choosing small trees as wi tness trees Young witness trees less than about 12 cm diameter at breast height (dbh) did not occur in the data set so the proportion of small cottonwood forests was significantly underestishymated The estimate of only 3 percent of the total forest area occupied by forests of advanced successional age is especially interesting since the current proportion is about 22 percent and these forests wh ich ocshycurred on better soils were preferentially cleared We do not know with certa inty the reasons for th is but we suspect that it is an artifact of past timber practices Large cottonwood trees (50-100 years old) occurr1ing with an understory canopy of ash elm and boxelder were preferred trees for lumbering ~elective cutting of these trees would have in effect shifted these stands from the mixed cottonwood forest type to the most advanced successional stage Cottonwood does not reproduce in the tree gaps of older forests
29
30
TREE POPULATION STRUCTURE
An underrepresentation of sap ling-size reproduction of American elm and boxelder was observed by Johnson Burgess and Keammerer [1976] however they sampled only trees 12 cm dbh and larger and did not determine age only size Extrapolation from size to age is often inaccurshyate [ Harcombe and Marks 1978] This research was designed to develop complete age structure diagrams in both treatment and reference stands to test the hypothesis that altered hydrologic regimen had affected tree population structu re The survey of Johnson Burgess and Keammerer indicated that the population structure of another important climax tree species green ash was unchanged from pre-dam condi tions
I Methods
Four former stands of Johnson Burgess and Keammerer [1976] were selected for study ( stands 7 11 13 and 19) I n addition to these treatshyment stands other stands or portions of treatment stands (7 16 and 23) were included as contro l or refe rence sites Because surface water occurred in the spri ng in these stands either from upland runoff or from rising groundwater these reference stands represented an environment closest to that of flooded stands in the pre-dam period If reproduction was as underrepresented in the wetter reference sites as in the treatment sites then the in itial hypothesis that underrepresentation was due to flood cessation would have to be rejected Boxe lder was a major species in stands 7 and 23 while American elm was dominant in stands 1 t 13 and 19 Reference stand 7 (a section of treatment stand 7) was an abanshydoned channel of the Little Heart River on the Missouri River floodp lain near Oahe Reservoir wh ilch fills with water in the spring Reference stands 16 and 23 were flooded almost annually by concentrated upland runoff A ll stands were on one terrace level and had undergone no significant cutting grazing or burning during the previous 30 years Sampling ocshycurred during the summer of 1979
I n each stand parallel and equidistant lines were arranged perpend icular to the course of the river Sample plots were located at random points within 25-m segments along each transect line The sample unit consisted of nested circular plots 250 m2 for stems greater than 10 cm dbh (trees) 100 m2 for stems less than 10 cm dbh but taller than 05 m (saplings) and 1 m2 for stems less than 05 m tall (seedlings) Four 1-m2 plots were random Iy placed with in each 100-m2 plot Twenty-one plots were samshy
pled in stands 11 and 19 and 23 in stands 7 and 13 Because the refershyence stands were much smaller than the t reat ment sites sample sizes were smaller reference stand 7 (three plots) reference stand 16 (seven plots) and stand 23 (two plots)
Stem diameter at breast height was measured f or all boxelder and elm trees and saplings that occurred in t he quadrats Ages of seedlings were determined by counting terminal bud scars or cutting and aging directly I ncrement cores were collected from several saplings and trees in each plot and age was determined in t he laboratory Small saplings were cored using a micro-increment borer A ges for all stems were computed using the natural growth function f(x a b) = a( 1 - e-b x ) where x = dbh and f(x) == age [Parton and Innis 1972] The curve for each species was selected that minimized the residual sums of squares and yielded the greatest measure of fit [Helwig and Council 1979] For elm a = 143 b = 002956 (r2 = 094) For boxelder a = 106 b = 002388 (r2 = 095) All samples of each species were pooled for t he age-size regressions
Size and age structural diagrams were constructed separately by computshying the density of stems in each size or age class Because the relat ionshyship between age and size was close to being linear the curves in both graphs exh ibited the same basic form Boxelder stems of sprout origin were tallied separately to show the contribution of sprouting to overall population structure Data were divided into five-year age classes
II Results and Discussion
Age distributions for American elm (Figure 12) showed low densiti es of saplings and small trees and high densities of seedlings and large trees Three of the four treatment stands showed a complete absence of stems in one of the two young age classes The average of all four stands also showed lowest densities in the two sapling classes The data clearly indishycate that post-reservoir conditions allowed substantial germination and initial establishment of seedlings seedling densities in the first age class averaged 110000 per ha However seedlings must have thinned rapidly since stems from several years old to about 45 years old were relatively rare High densities of elm seedlings were also noted during field surveys in 1969-70 by Keammerer [1972] and underrepresentation of sapl ings and small trees was observed by Johnson Burgess and Keammerer [1976] Reduction in elm density occurred in stems from several years old to those that would have been approximately 20 years old when
3 1
32
Garri so n Dam became operational
Age distribut ion fo r boxel der also showed underrepresentation in t he small age classes but th e reduction was less dramatic than for elm (Figshyure 12) Again seedl ing reproduction was considerable altho ugh at lower overall densities than elm Mortali ty between seedlings and smal l tree classes was considerable thereby resulting in fewer saplings than trees Underrepresentation is most evident in stems several years o id to about 25 years old Thus boxelder showed a somewhat narrower age gap than elm Reduction in stem density appeared in age classes that corresponded cIIosely to the time since flooding was eliminated by Garshyrison Dam
Age distributions in reference stands showed different patterns (Figure 13) Age distributions for both species appeared to be more balanced [lJIeyer 1952] that is age classes between 5 and 45 years were considshyerably Iess underrepresented than in treatment sites In our survey of reproduction on the floodplain one observation held true-h igh sapling densities of American elm andor boxelder were always associated with the few siteS that received supplemental moisture either from a rising groundwater table near Oahe Reservoir or in areas that received upland runoff
Therefore the data suggest that moisture was the primary factor responshysible for underrepresentation in the age structure of these two species Supplemental moisture to these forests would in the pre-reservoir years have been provided by both a surface recharging of the rooting zone by overbank flooding and a high water table in the early growing season months when river height was generally maximum However in the abshysence of these sources of moisture seedlings would now depend on preshycipitation alone to enable growth to the deeper post-reservoir water table We believe that the reduction in available moisture was the likely cause of the extremelly high seedling mortality and the movement of only a small fraction of elm and boxelder seedlings into the tree-size classes The natura l range of elm extends to only a few counties west of the study area in North Dakota while boxelder extends west into the drier conditions of eastern and central Montana Interestingly the species less able to tolerate drier cl imatic conditions (elm) was also the species that showed the greatest underrepresentation in age structure in the drier post-dam floodplain
Ch anges in the hydrologic regimen may have also cau sed greate r morshytality of established saplings in the yea rs im mediately follow ing Garrison Dam T hus t he o bservation in t he age structural d iagrams for elm (Figshyure 12) that increased mortality began two decades before Garrison Dam (that is cu rren t 45-year-old age c lass) may be the resu lt of increased morta lity of sa plings t hat were 20 years old or younger in the years folshylowing dam construction Perhaps the root systems of saplings were too poorly developed to ut il ize gro undwater o r to persist on it alone At the wetter reference sites mo rta lity of saplings of this age did not appear to have increased substantially over pre-dam levels
I n contrast t he mortality of establ ished boxelder sapl ings appears to have continued at pre-dam levels the change in hydrologic regimen appeared to increase only the mortality of young boxe lder seedlings that is individuals established after 1954 The larger proportion of stems that had died and resprouted in treatment stands also indicates that these seedlings were under greater stress than those in reference sites
Since livestock grazing could also have caused seedling-sapling mortality t he grazing history of the treatment stands was obta ined from landshyowners Stand 7 had not been grazed since the 1920 s stands 11 and 13 had not been grazed since 1950 and stand 19 had been grazed one year in the early 1970s but otherwise had not been grazed during the postshydam period Grazing therefore has been light or nonexistent in the treatment stands and was probably not the reason fo r the gap in age structure Furthermore if the ingestion and trampling by cattle were responsible for increased mortal ity other woody tree species wou Id likewise also have been affected yet green ash saplings of all age classes were numerous in treatment stands
Browsing by deer has also been shown to affect the population structure of preferred species [Swift 1948] Although American elm is a preferred browse species in this region damage to it from browsing was not noticeshyable in our treatment stands
In streamside forests in the East many large elms (Ulmus americana L and Ulmus rubra Muhl) have died from Dutch elm disease We saw no evidence of diseased elms on the floodplain in our study area however the disease has killed many urban trees in Bismarck Since elm trees are affected to a greater extent than seedlings and saplings [Stipes and Camshypana 198 1] the disease is not considered a cause for the Ilow densities
33
34
of elm saplings Underrepresentat ion was already observed by Johnson Burgess and Keammerer (1976] during the 1969 and 1970 fie ld seasons about t he time Du tch elm disease had spread to central North Dakota [Stipes and Campana 1981 ]
Although the natural form of the age structure curve of c llimax or equilibrium tree populations had been thought to be negative exponenshytial [Meyer 1952] recent studies have indicated that underrepresentashytion in sapll ing size classes is a widespread phenomenon [Christensen 1977 Harcombe and Marks 1978] Harcom be and Marks sampled forest stands in the Big Thicket of southeastern Texas that ranged from dry uplands through mesic sllopes to wet river floodplains They showed a high incidence of underrepresentation of sapl ings of cl imax tree species in wet and mesic forests but a lower incidence in dry upland forests They argued that the cause of the underrepresentation was competition for Iight between the seed Iings and sapl ings of overstory tree species and understory tree and shrub species They suggested that underrepresenshytation in wet and mesic forests was natural and caused by increased morshytality of seedlings because of shad ing by understory trees (for examp1le Carpinus caroinianaj
Patterns of underrepresentation in age structure f or the M issou ri River floodplain were nearly identical with those of southeastern Texas exshycept we believe that underrepresentation in our study was caused by lack of moisture not light The canopy of old floodplain forests along the Missouri River is relative ly open Hibbard [1972] showed that in these forests canopy cover ranged from 65 to 80 percent A lso neither boxelder nor elm is ilntolerant of shade [Baker 1949] Saplings of these species were no more abundant along stand edges or in large canopy gaps where light would have been more available
In summary our results indicate a significant decline in the abundance of American elm and boxelder on the Missouri River floodplain in the study area Current overstory densities of these species cannot be mai1nshytained given the low density of saplings In the case of American elm the decline will accelerate if Dutch elm disease begins to affect canopy trees Assuming that current trends continue the importance of these species in the overstory should consistently decline over t ime until only scattered trees remain or even become local ly elliminated Trees wHI beshycome primadly restricted to the few small wet sites either near the backshyup of Oahe Reservoir or in places where intermittent streams flow onto
the floodplain Seedlings may continue to be numerous unti l affected by restricted seed d ispersal from a dwi ndling nu mber of canopy trees Because green ash reproduction of all age classes was ubiquitous and dense it should become an increasingly important canopy species
Available evidence points to the altered hydrologic regimen as the cause of reduced recruitment of boxelder and elm trees however in the abshysence of pre-dam age structure and hydrologic information th is conclushysion must be considered tentative We clearly need additional informashytion from other f loodplains both natural and altered to solve the undershyrepresentation problem
35
36
CONCLUSIONS
1 The hydro logic regi men of the Missouri River has been altered conshysiderabl y by t he construction of Garri son Dam Wh ile precipitation and A E have shown no significant changes between pre- and post-dam periods streamflow patterns have changed markedly Peak flow no longer occurs early in the growing season and consequently is out of phase with the vernal growth pattern typical of floodpla in trees A larger proportion of the annual flow is now released in the non-growing season mont hs and therefore is unavailable for growth Now flow in Ju ne is usually less than it was du ri ng the drought years of the 1930s River flow data indicate a general lowering of the spring and ea rly summer water table since Garr ison Dam
2 Flood ing has been el im inated on terraces greater than 2 m above mean river level thus decreasing the moisture available to floodplain ecoshysystems at the start of the growing season The accompanying deposishytion of nutrient-rich si It has also ceased
3 Both erosion and deposit ion rates by the river have decreased subshystantially since Garr ison Dam I n effect river meandering has all but ceased Accretion rates have fallen to 1 percent of their pre-dam level and erosion rates to 25 percent of pre-dam levels The net effect was a widen ing of the river channel by erosion on both banks and little concurrent deposition
4 Results showed that decreases in radial tree growth in the post-dam period were not uniform throughout the floodplain but depended on species and location with respect to the river Trees on terraces at t he edge of the floodp ~ ain that received concentrated runoff from upland ravines (for example bur oak) and those with deep root systems (for example cottonwood) on low terraces close to the water table have been least affected by the altered hydrologic regimen Growth of cotshytonwood and bur oak on reference sites unaffected by damming of the Missouri River increased significantly in the post -dam period The most pronounced decrease in tree growth (for example boxelder American elm) occurred on higher terraces that received little or no upland runoff
5 Lack of flooding and a lowered spring water tab le are implicated in the decline of radial tree growth For example with a lower spring
water table the roots of established trees may no longer extend t o the cap illary f ringe Thus growth might depend more upon spr ing A E than on groundwater This shift in response from one source of moisshyture to another (from groundwater to precip itat ion) was ex hibited in the regression ana lysis of cottonwood growth chrono logies The ab shysence of overbank flooding may have had a greater effect on the growth of trees (for example American el m) on dry upper t erraces well above the water table that did not receive upland runoff A Ishythouglh these terraces were only infrequently flooded before 1953 the supplemental moisture provided by floods just before the onset of growth could have augmented growth for several consecutive years and compensated for years of low predpitation
6 Lack of accretion by the r iver in the post-dam period spells a decline in the proportion of the floodplain forest occup ied by cottonwoodshywillow forests The decline is already observable and will continue until in a century or more cottonwood forests will occupy only a fraction of their current proportion Cottonwoods will be relegated to a river marg inal position being especially prominent behind wingshydikes
7 We believe that the decline in cottonwood abundance and ubiquity will be accompanied by a decline in American elm because of a rapidly declining growth rate almost complete absence of seedling survivorshyship on most sites and the impending effects of Dutch elm disease Some remnant elm stands may persist on sites with an artificially elevated water table near the Oahe Reservoir and on high terraces that receive upland runoff Boxelder which exhibited greater survivorship but was still underrepresented in the sapling size classes may exhibit a slower decline Although growth rate of green ash has also declined it exhibits balanced population structure and will likely increase its abundance and ubiquity in coming decades Thus the current obsershyvations foretell a drastic decline in cottonwood and elm abundance a moderate-to-slow decline in boxelder prominence and an increase in green ash Overall the aipha and beta diversities of the forest overshystory should decline
8 Clearing for agriculture has claimed slightly over half (55 percent) of the original floodplain forest The rate appears to have accelerated during the last decade because of opportunities to irrigate croplands Should these trends continue future native forests may be mai ntained
37
38
only in protected areas such as the Riverdale and Oahe Game Manageshyment Areas and in private reserves (for example Cross Ranch The Nature Conservancy) However forests protected from clearing and other disturbances remai n unprotected from the ecological effects of altered river hydrology
9 The effects of altered hydrology on floodplain ecosystem dynamics need further study on other forested floodplains particularly where pre-dam biological information is available or where nearby wild rivers could serve as good controls Where significant effects of floodplain protection are suspected an index of impact could be der ived by comparing pre-dam gauge height (flood frequency) and seasonal flow patterns to pre-dam patterns Greater departure from pre-dam patshyterns would suggest greater potential impact on natural floodplain ecosystems
LITERATURE CITED
Baker F S 1949 A Revised Tolerance Table Journal of Forestry 47 179-81
Baxter R M 1977 Environmental Effects of Dams and I mpoundshyments I n Annual Review of Ecology and Systen7atics Vol 8 R F Johnson editor pp 255-83 Palo Alto Californ ia Annual Rev iews Inc
Bedinger M S 1971 Forest Species as Indicators of Flooding in the Lower White River Valley Arkansas Professional Paper 750-C US Geological Survey US Department of the Interior Washington
Bell D T and R del Moral 1977 Vegetation Gradients in the Streamshyside Forest of Hickory Creek Will County Illinois Bulletin Torrey Botanical Club 1 04 127-35
Bluemle J P 1971 Geology of McLean County North Dakota North Dakota Geological Survey Bulletin No 60 Pt 1 North Dakota State Water Conservation Commission Grand Forks
Brockman L C et aI 1974 Soil Survey of A1cLean County North Dakota Soil Conservation Service US Department of Agriculture Wash ington
Brown D E C H Lowe and J F Hausler 1977 Southwestern R iparshyian Communities Their Biotic Importance and Management in Arizona In Importance Preservation and Management of Riparian Habitats pp 201-11 General Technical Report RM-43 US Forest Service US Deshypartment of Agriculture Washington
Burgess R L 1964 Ninety Years of Vegetational Change in a Townshyship in Eastern North Dakota Proceedings North Dakota Academy of Science 18 84-94
Campbell C J and W Green 1968 Perpetual Succession of StreamshyChannel Vegetation in a Semiarid Region Arizona Academy ofScience Journal 5 86-98
39
40
Carlson C G 1973 Geology of Mercer and Oliver Counties North Dakota North Dakota Geological Survey Bul letin No 56 Pt 1 Nort h Dakota State Water Conservation Commission Grand Forks
Christensen N Lt 1977 Changes in Structu re Pattern and Diversity A ssociated with Climax Forest Maturation in Piedmont North Carolina American Midland Naturalist 97 176-88
Clayton L 1962 Glacial Geology of Logan and McIntosh Counties North Dakota North Dakota Geological Su rvey Bulleti n No 37 North Dakota State Water Conservation Commission Grand Forks
Everitt B L 1968 Use of the Cottonwood in an I nvestigation of the Recent History of a Floodplain American Journal ofScience 266417shy39
----- 1980 Ecology of Saltcedar-A Plea for Research Environshymental Geology 377-84
Fenneman N M 193 1 Physiography of the Western United States New York McGraw-Hili Book Co
Fritts H C 1976 Tree Rings and Climate New York Academic Press Inc
Fritts H C J E Mosimann and C P Botroff 1969 A Revised Comshyputer Program for Standardizing Tree-Ring Series Tree-Ring Bulletin 29 15-20
Gary H L 1965 Some Site Relations in Three Floodplain Communishyties in Central Arizona Arizona Academy of Science Journal3(4) 209shy12
Grannemann N G and J M Sharp Jr 1979 AHuvial Hydrogeology of the Lower Missouri River Vaey Journal of Hydrology 4085-99
Greenman D W 1953 Reconnaissance of the Missouri River Pumping Units Between Garrison Dam and Bismarck North Dakota Unpublished paper compiled as part of a US Department of the Interior program for development of the Missouri River Basin Water Resources Division US Geological Survey US Department of t he Interior Washington
Johnson W C R L Burgess and W R Keammerer 1976 Forshyest Overstory Vegetation and Environment on the Missouri River Floodplain in North Dakota Ecological Monographs 4659-84
middot J 1 f Lf
Harcombe P A and P L Marks 1978 Tree Diameter Distributions and Replacement Processes in Southeast Texas Forests Forest Science 24 153-66
Hayes F A and J H Stoeckler 1935 Soil and Forest Re lat ionsh ips of the Shelterbelt Zone I n Possibilities of Shel terbelt Planting in the Plains Region pp 111-15 Special Bulletin US Forest Service US Department of Agricu Iture Ilash ington
Helwig J T and K A Council editors 1979 SAS Users Guide Rashyleigh North Carol ina SAS I nst itute Inc
Hibbard E A 1972 Vertebrate Ecology and Zoogeography of t he ~issouri River Val ley in North Dakota PhD dissertation North Dashykota State University Fargo
Hollander M and D A Wolfe 1973 Nonparametric Statistical Methods New York John Wi ley and Sons
Keammerer W R W C Johnson and R L Burgess 1975 Floristic Analysis of the Missouri River Bottomland Forests in North Dakota Canadian Field-Naturalist 895-19
Kosier J A 1979 Regulating Critical Riparian Lands A Cha llenge in I ntergovernmental Cooperation I n Strategies for Protection and Management of Floodplain Wetlands and Other Riparian Ecosystems R R Johnson and J F McCormick editors pp 332-35 Symposium Proceedings December 11-13 1978 Calloway Gardens Georgia
Kroodsma R L 1970 North Dakota Species Pairs I Hybridization in Buntings Grosbeaks and Orioles PhD dissertation North Dakota State University Fargo
Kuchler A W 1964 Potential Natural Vegetation of t he Contermishynous United States (map) Special Publication American Geograph ical Society INew York
Kujawa M 1974 Plankton Studies on a Recently I mpounded Resershyvoir Journal of Environmental Health 37 252-55
41
42
Kume J and D E Hanson 1965 Geology and Water Resources of Burshyleigh County North Dakota North Dakota Geologicall Survey Bulletin No 42 Pt 1 North Dakota State Water Conservation Commission Grand Forks
Lemke R W and R B Colton 1958 Summary of the Pleistocene Geology of North Dakota In Midwestern Friends of the Pleistocene Guidebook 9th Annual Field Conference Miscellaneous Serial No 10 North Dakota Geological Survey Grand Forks
Lemke R W et aI 1965 Quaternary Geology of the Northern Great Plains In The Quaternary of the United States H E Wright Jr and D J Frey editors pp 15-27 Princeton New Jersey Princeton Univershysity Press
Leopolld L B M G Wolman and J P Miller 1964 Fluvial Processes in Geomorphology San Francisco W H Freeman
McKenzie M A 1936 Flood Injury to Trees Science 83(2154) 412-13
Meinzer O E 1927 Plants as Indicators of Groundwater Water Supply Paper 577 US Geological Survey US Department of the Interior Washington
Meyer H A 1952 Structure Growth and Diameter in Balanced Uneven-Aged Forests Journal of Forestry 5085-92
Parton W J and G S Innis 1972 Some Graphs and Their Functional Forms Technical Report No 153 Natural Resource Ecology Laborashytory Colorado State University Fort Collins
Pitt M D and H F Heady 1978 Responses of Annual Vegetation to Temperature and Rainfall Patterns in Northern California Ecology 59(2) 336-50
Randich P G and J L Hatchett 1966 Geology and Groundwater Reshysources of Burleigh County North Dakota Part II Groundwater Re-shysources North Dakota Geological Survey Bulletin No 42 North Dakota State Water Conservation Commission Grand Forks
Ridley J E and J A Steele 1975 Ecological A spects of River Imshypoundment In River Ecology B A Whitton editor pp 565-87 Berkeley and Los Angeles University of California Press
Robertson P A G T Weaver and J A Cavanaugh 1978 Vegetation and Tree Species Patterns Near the Northern Term inus of the Southern Floodplain Forest Ecological tllonographs 48249-67
Schumm S A 1969 R iver Metamorphosis American Society of Civil Engineers Journal Hydraulics Division 95(HY1) 254-73
Stearns F W 1949 liN inety Years Change in a Northern Hardwood Forest in Wisconsin Ecology 30350-58
Stokes M A and T L Smiley 1968 An Introduction to Tree-Ring Dating Chicago University of Chicago Press
Stout H R et aI 1974 Soil Survey of Burleigh County North Dakota Soil Conservation Service US Department of Agriculture Washington
Swift E 1948 Wisconsin Deer Damage to Forest Reproduction SurveyshyFinal Report Publication 347 Wisconsin Conservation Department Madison
Thornthwaite C W and J R Mather 1957 I nstructlions and Tables for Computing Potential Evapotranspiration and Water Balance Pubshylications in Climatology 10 181-311
Tukey J W 1977 Exploratory Data Analysis Reading Massachusetts Addison-Wesley Publishing Co
US Army Corps of Engineers Omaha District 1980 Personal comshymunication
US Geological Survey US Department of the Interior 1928-1 977 Water Resources Data for North Dakota 1928-1977 North Dakota State Geological Survey Bismarck
US Weather Bureau 1935-1974 Climatological Data North Dakota Annual Summary 1935-1974 Washington
43
44
Weiser P K 1975 Soil Survey of Oliver County North Dakota Soil Conservation Service US Department of A gricultu re Washington
Weist W G Jr 1971 Geology and Ground-Water System in the Gila River Phreatophyte Project Area Graham County Arizona Gila River Phreatophyte Project Professional Paper 655-D US Geological Survey US Department of the Interior Washington
Wells P V 1965 Scarp Woodlands Transported Grassland Soils and the Concept of Grassland Climate in the Great Plains Region Science 148 246-49
Wilhelm F J ~ 978 Soil Survey of Mercer County North Dakota Soil Conservation Service US Department of Agriculture Washington
Wolman M G and L B Leopold 1957 River Floodplains Some Obshyservations on Their Formation Professional Paper 282-C 37 -107 US Geological Survey US Department of the Interior Washington
Yeager A F 1935 Root Systems of Certain Trees and Shrubs Grown on Prairie Soils Journal of Agricultural Research 51 1085-92
Yeager L E 1949 Effect of Permanent Flooding in a River Bottom Timber Area Illinois Natural History Survey Bulletin 2533-65
FIGU RES
FIG
UR
E 1
L
oca
tio
n a
nd N
um
ber
of
Stu
dy
Site
s in
No
rth
Dak
ota
Wa
tfo
rd
Cif
y
o B
1
6
32
4
8
Sca
le
(km
)
Pri
mar
y st
udy
area
is
betw
een
Gar
riso
n D
am a
nd O
ahe
Res
ervo
ir T
he L
ittl
e M
isso
uri
Riv
er r
efer
ence
sit
e is
wit
hin
the
The
odor
e R
oose
vel
t N
atio
nal
Par
k
and
the
scar
p w
oodl
and
refe
renc
e si
te i
s w
est
of P
rice
N
orth
Dak
ota
Sta
nd
~
-J
nu
mbe
rs a
re t
hose
of
John
son
Bur
gess
an
d K
eam
mer
er [
1976
]
~
00
~
c o o CD
~
CD
Q
en
~
CD -Q) E
o 0
J U
FIG
UR
E 2
M
on
thly
Str
eam
flo
w (
19
28
-1 9
77
) fr
om
th
e B
ism
arck
Gau
ging
Sta
tion
on
th
e M
isso
uri
Riv
er
2300TI-~r-~or--r---------r----~--------r----~----r-------------r---~----~----~--~----~
112~
1150
5H
19
44
23
00
In~
U5
0
51~
Year
JI)
In
In
N
19 4
5
194
6
~
25
00
c 0 0 Q
) 172~
I
~
II~O
I fh
~
Q)
~7~
Q) E
0 0
~ ~h
~
I I
I1
96
2
19
63
1
96
4
196~
19
68
1
96
7
19
68
1
96
9
19
70
19
71
19
72
1
97
3
19
74
1
97
5
19
76
1
97
7
FIG
UR
E 2
(co
nti
nu
ed
)
~
(J
Yea
r
S
ou
rce
US
G
eolo
gica
l S
urv
ey
19
28
-19
77
T
he
pri
mar
y gr
owin
g se
aso
n m
on
ths
(May
Ju
ne
an
d J
uly
) ar
e re
pre
sen
ted
by
bla
ck
bars
G
arri
son
Dam
was
co
mp
lete
d i
n A
pril
19
53
S
trea
mfl
ow
is
used
her
e in
stea
d o
f ga
uge
hei
gh
t si
nce
the
latt
er d
ata
wer
e n
ot
avai
lshy
~
able
fo
r so
me
yea
rs
Th
ere
was
usu
ally
a s
tro
ng
co
rrel
atio
n b
etw
een
gau
ge h
eig
ht
and
str
eam
flo
w (
for
exam
ple
fo
r th
e m
on
th o
f (0
O
cto
ber
19
72
R
2 =
09
98
7
Y =
42
81
7x
-2
32
02
)
(J1
o
F
IGU
RE
3
Str
ea
mfl
ow
fo
r Ju
ne a
nd F
eb
rua
ry 1
928-
1977
at
the
Bis
mar
ck G
augi
ng S
tatio
n o
n th
e M
isso
uri
Riv
er
19
82
- ~ rt) E
-
14
16
~
V
I
r
June
S
tre
am
flo
w
~
0 J u ~
85
0
lt
W
0
en
28
3
192
8
19
34
1
94
0
19
46
19
52
1958
1
96
4
1970
1
97
6
YE
AR
CJ1 ~
- ~ rt) E - ~ o J
LL ~
ltt w
a
Ishy (f)
991
70
8
42
5
142
FIG
UR
E 3
(co
ntin
ue
d)
Fe
bru
ary
S
f re
am
flo
w
19
28
1
93
4
19
40
1
94
6
19
52
1
95
8
19
64
1
97
0
YEA
R V
erti
cal
line
indi
cate
s th
e ye
ar t
hat
Gar
riso
n D
am w
as c
ompl
eted
S
ourc
e U
S
Geo
logi
cal
Sur
vey
I 19
28-1
977
19
76
60
40
20
FIGURE 4 Percent Chance of Overbank Flooding at Different
Terrace Elevations Based on the Relationship Between Maximum Gauge Heights and Known Terrace Elevations
100~----------------------------------------------
80 pre- damD
()
z Ci ~l post-dam0 0 -l lL
-l laquo gt z z laquo LL 0
LLJ U Z laquo L u ~ 0
20 30 4 0 50 60
TERRACE ELEVATION
(meters above mean river level)
Source us Geological Survey 1928-1977 (Bismarck gauging station on the Misshysouri River)
52
00 10
a
IJJ
03
~-
ltE
~~
~I UJ
J 1
5
-m
~ ~
21
a
W
C
2
7
FIG
UR
E 5
G
rou
nd
wat
er a
nd S
trea
mfl
ow
Dat
a (1
97
1-1
97
3)
fro
m t
he
Mis
sour
i R
iver
nea
r B
ism
arck
Str
eam
flow
Wat
er T
able
~
r-
~
1
I I
I
J
I
I
I
II
1 J
11
I
IJ
_
shy
II
I
~
M
J J
J
M J
J
M J
J
I I
I 19
71
1972
19
73
MO
NT
H
AN
D
YE
AR
(J)
1415
~
0
fTI
~ 1132 raquo
~
84
9
r o 5
6 6 ~
shy
3 2
83
~
USG
S te
st w
ell
no
138-
080-
08-A
BA
1
loca
ted
appr
oxim
atel
y 1
km f
rom
the
Mis
sour
i R
iver
and
app
roxi
mat
ely
2 km
sou
th o
f B
ism
arck
P
rim
ary
grow
ing
seas
on
mon
ths
of
May
Ju
ne
and
July
are
rep
rese
nted
by
M
JJ
Str
eam
flow
dat
a fr
om B
ism
arck
C
Jl ga
ugin
g st
atio
n S
ourc
e U
S
Geo
logi
cal
Sur
vey
192
8-19
77
w
E E
I tshy~ 0 a ()
J ~ gt z z ~
54
FIGU RE 6 A merican Elm Chronologies (1 928-1 977)
from Stands 12 13 19 and 16
30
25
14
12
10
20
15
10
05
5 0
40
30
UNSTANDARDIZED
YEAR
American EI m Stand 12 1 age=80
American Elm Stand 13 i aoe=135
American EI m Stand 19 i age=120
American Elm Stand 16 i age=120
1976
-shyE E-
12
10
08
06
12
10
0middot8
12 10
08 06
FIGURE 6 (continued)
1928
STANDARDIZED
1940 1952
YEAR
American Elm Stand 12 x age=8
American Elm Stand 13 x age=135
Amer ican Elm Stand 19 i age=120
1964 1916
Figures on left are unstandardized (long-term trends not removed by standardizashytion) figures on right have been standardized Vertical lines indicate the year that Garrison Dam was completed
55
56
FIGURE 7 Bur Oak Chronologies (1928-1 977) from Stand 16
and the Scarp Woodland Reference Site
UNSTANDARDIZED
20
18
E E
16
I tshy~ 0 a C)
Bur Oak J Scarp Woodlandlaquo ) x oge= 120z
1 8z laquo
16 ( I
Bur Oak Stand 16
X age=120
14
1928 1940 1952 1964 1976
YEAR
FIGURE 7 (continued)
STANDARDIZ ED
12
10
- 08 E Bur Oak E- 06 Stand 16
I X age=120 ~ 0 a () Bur Oak J
110 Scarp Woodland ~ gt x age= 120 z z 105 ~
100
09gt
090
1928 1940 1952 1964 1976
YEAR Figures on left are unstandardized figures on right have been standardized Vertical lines indicate the year that Garrison Dam was completed
57
-E E
25
c toshy 23 ~ 0
21a ()
- 19 ~ ~ 17Z Z ~
en ~
E 256
~ 199 0 J LL 142 ~ ~
85W a Ishy 28en
58
FIGURE 8 Cottonwood Chronology (1928-1977)
from the Litt~e Missouri Reference Site
1928
1928
UNSTANDARDIZED
1940 1952
YEAR
1952
YEAR
Cottonwood Little Missouri
i age-IOO
1964 1976
Little Missouri
1964 1976
FIGURE 8 (continued)
STANDARDIZED
Cottonwood E E- 1 2
Little Missouri
x age= 100 c Ishy~ 10 0 a ()
08 ~ ltt =gt Z 06 Z ltt
Unstandardized chronology is top left standardized on right Average streamflow for April to July (1935-1977) for the Little Missouri River is shown bottom left Vertical lines indicate the year that Garrison Dam was completed Source US Geological Survey 1928-1977 (Watford City gaugi ng station)
59
E E
I Ishy~ o a lt- J ltt gt z z ltt
60
FIGURE 9 Cottonwood Chronologies (1928-1977) f rom Stands 5 and 14
6 0
50
40
3 0
20
10
30
2 5
20
1 5
1928
UNSTANDARDIZED
1940 1952
YEAR
Cottonwood Stand 5
c age=80
Cottonwood Stand 14
x age= faa
1964 1976
13
11
-E 0 9
E- 07
05
12
10
08
06
FIGURE 9 (continued)
STANDARDIZED
1940 1952
YEAR
Cotton wood Stan d 5
x age=80
Cottonwood Stand 14
x age=IOO
1964 1976
Figures on left are unstandardized figures on right have been standardized Vertical lines indicate the year that the Garrison Dam was completed
61
C)
f)
F
IGU
RE
10
S
moo
thed
Pio
ts o
f S
prin
g A
E V
ersu
s Y
ear
and
Spr
ing
(May
Ju
ne
July
) S
tre
am
flo
w V
ersu
s Y
ea
r
AE
Str
ea
mfl
ow
83
76
2
96
E
70
2
89
(J -
64
W
lt
t 5
7
~
r
v
shy
28
3
27
7
51
2
71
44
~
-
2 6
4
25
8
19
28
1
93
4
19
40
1
94
6
19
52
1
95
8
19
64
1
97
0
197
6
YEAR
Ver
tica
l li
ne i
nd
icat
es t
he y
ear
that
Gar
riso
n D
am w
as c
om
ple
ted
(J)
-t
n
fTI
lgt
~
r 0 ~
0 c 3 ~
en
64
FIGUR E 11 Results of Stepwise [MAXR Helwig and Council 1979]
Multip le Regression Analysis of Cottonwood from Stands 5 and 14 for Pre-Dam (1928-1952) and Post-Dam (1953-1977) Periods
Cottonwood Stand 5 CJ) t-Z 10
Pre -d am U w
5li ~ w 0 0 U
-5 Z Q -10 CJ) CJ)
AMJJ AMJJ AMJJ AMJJ AMJJ AMJJ ASOW V-I Y-I V-Ia () LLJ
Post-dam5 0 a
2 5 0 UJ N 0 0 0 a lt - 2 5 0 Z
~ -50
en PR IOR
FLOW PPT AE TEMP GROWTH
FIGURE 11 (continued)
(f) ~ Z 10 LLJ U 5ii ~ 0 0 0
-5 Z 0
-10 () () UJ a C)uJ 10 a
50 UJ N 0 0 ~ -5 ~ 0 Z -10 ~ (f)
Cottonwood Stand 14
Pre- dam
AMJJ AMJJ AMJJ AMJJ ANJJ ASO Y-I Y-I
Post- dam
FLOW PPT AE TEMP PRIOR I I GROWTH I
Fourteen environmental variables and a variable for the previous years growth (shown in Table 6 plus fall AE) were available to the stepwise selection process Only those variables significant at the 0100 level are shown Bars represent standshyardization regression coefficient and dots above or below bars indicate levels of sigshynificance bull ~ 005 bullbull ~ 001 bullbull ~ 0001 [Fritts 1976]
65
66
FIGURE 12 Age Structure of American Elm and Boxelder Populations in Four
Treatment Stands on the Missouri River Floodplain in North Dakota
AME RICA N EL M BOX E LDER
1 1 Ii c 2
10 STAND 7 STAND 7~ gt
oil lt= GI Cl 10
E GI
Vl
5 310 10
c Ii
02 11 102 STAND 11
gtshy Ui
n II 10 10
GIE
VI
STAND
27112233445566778899111111111 2711223344556677 272727272727272727001122334 27272727272727
272727272
AGE (years) AGE (years)
FIGUR E 12 (continued)
AM ER IC AN ELM BOXELDER
Ii
i ~ iii c
0
E VI
ii ~
~ iii c
0
E
iii
~ ~
~ ~ iii c
0
bull VI
101 10
2 STAND 13
0
104
102 STAND 19
10
510
2
44 6
AVERAGE10
10
I
8899111111111 272727272727272727001122334
272727272
AGE (years)
White bars denote proportion of stems of sprout origin
STAND 13
310
210 STAND 19
0
AVERAGE
2 11223344556677 27272727272727
AGE (years)
67
68
FIGURE 13 Age Structure of American E 1m and Boxelder Populations
in Reference Stands on the Missouri River Floodplain in North Dakota
AMERICA N ELM
105 ~ I ~
S TAND 16iii 103bull I
~ gt-
I) 102~ c QJ
0
E
V) -QJ
101-
~27112233445566778899111111111 272727272727272727001122334
272727272
AGE (years)
1 m 103
I
gtshy
I) 102 c 41
0
E -QJ
101Vi
S TAND 7
103
FIGURE 13 (continued)
ro c
gt
I)
c ClI
0
E ClI
V) -
ro c
~ gt
I)
c QJ
0
E QJ
V) -
STAND 23
102
101
L 104
103
BOXELDE R
I
STAND 16
102
101
2711223344556677 27272727272727
AGE (years)
69
TABLES
TA
BL
E 1
P
reci
pita
tion
and
AE
Sta
tistic
s fo
r P
re-D
am (
19
35
-19
54
) an
d P
ost-
Dam
(1
95
5-1
97
4)
Per
iods
Mea
n M
axi
mu
m
Min
imu
m
To
tal
Ap
ril-
July
T
ota
l A
pri
l-Ju
ly
To
tal
Ap
ril-
Ju
ly
Pre
cip
ita
tio
n (
cm)
Pre
-dam
P
ost-
dam
4
03
(S
O 9
1)
382
(S
O 7
2)
23
6 (
SO
75
) 22
4 (
SO
65
) 5
16
54
7
34
4
33
0
152
27
1
27
126
AE
(cm
) P
re-d
am
Pos
t-da
m
381
(S
O 7
6)
361
(S
O 7
6)
29
6 (
SO
64
) 2
92
(S
O 6
6)
46
7
514
37
2
36
8
170
2
36
1
12
169
So
urc
e
US
W
eath
er B
urea
u C
lima
tolo
gic
al
Dat
a
-J
W
~ T
AB
LE
2
Mea
n T
ota
l R
adia
l W
ood
Gro
wth
by
Spe
cies
and
Site
fo
r 20
-Yea
r P
re-D
am (
19
35
-19
54
) an
d P
ost-
Dam
(1
95
5-1
97
4)
(Un
ad
just
ed a
nd A
dju
sted
fo
r A
ge)
Per
iods
Spe
cies
Gre
en a
sh
Am
eric
an e
lm
Box
elde
r
Co
tto
nw
oo
d
(Mis
sour
i R
iver
)
Co
tto
nw
oo
d
(Lit
tle
Mis
sour
i R
iver
)
BU
r oa
k (M
isso
uri
Riv
er)
(B2)
(B
1)
Una
djus
ted
(AB
2)
To
tal
Rad
ial
To
tall
Rad
ial
Ad
just
ed
Rad
ial
Woo
d G
row
th
Woo
d G
row
th
Woo
d G
row
th
Num
bers
of
Per
Cor
e (m
m)
Per
Cor
e (m
m)
Per
Cor
e (m
m)
Cor
es a
nd
11
93
5-1
95
4
19
55
-19
74
1
95
4-1
97
4
Sta
nds
Incl
ud
ed
t X
X
X
34
(8)
3
65
2
89
30
4
48
(7)
36
1
23
5
264
29
(7
) 4
10
26
4
316
26 (
5)
47
2
30
6
41
3
25 (
4)
38
3
35
5
47
2
20 (
3)
32
0
29
6
Wilc
oxo
n S
ign-
Ran
k Z
-Val
ues
f (B
2-A
B2
)
-32
1 (p
lt 0
001
)
-48
1 (p
lt 0
0001
)
-26
5 (p
lt 0
00
8)
-12
4 (N
S)
+2
18
(p
lt 0
03
)
(B1-
B2
)
-22
0 (
p lt
00
3)
TA
BL
E 2
(co
ntin
ue
d)
(82
) (8
1)
Un
adju
sted
(A
82
) T
ota
l R
adia
l T
ota
l R
adia
l A
dju
sted
Rad
ial
Wo
od
Gro
wth
W
ood
Gro
wth
W
oo
d G
row
th
Nu
mb
ers
of
Per
Co
re (
mm
) P
er C
ore
(m
m)
Per
Co
re (
mm
)
Spe
cies
C
ores
an
d
Sta
nd
s In
clu
ded
t 19
35-1
954
X
1955
-197
4 X
19
54-1
974
X
Wil
cox
on
Sig
n-R
ank
Z-V
alu
es
(8
2-A
82
) (8
1-8
2)
Bur
oak
(S
carp
wo
od
lan
d)
10 (
1)
171
1
93
-1
4
8 (
NS
)
See
tex
t fo
r m
eth
od
of
adju
stm
ent
Po
st-d
am g
row
th o
f b
ur
oak
was
no
t ad
just
ed b
ecau
se m
ost
cas
es s
ho
wed
an
incr
ease
in
gro
wth
b
etw
een
th
e tw
o p
re-d
am p
erio
ds
tPar
enth
eses
in
dic
ate
stan
ds
incl
ud
ed
tSo
urc
e H
oll
and
er a
nd
Wol
fe [
1973
]
(J
1
76
TABLE 3 Median Percent Change in Growth for Pre-Dam (1935-1954)
and Post-Dam (1955-1974) Periods
Species Median Percent Change
Boxelder -26 American elm -25 Green ash -18 Bur oak (Missouri River) - 9
Cottonwood (Missouri River) - 6 Cottonwood (little Missouri River) +13 Bur oak (scarp woodland) +20
Species connected by vertical lines are not significantly different (multiple comparishysons test p lt 005 Hollander and Wolfe [1973]
TABLE 4 Frequency Table (Number of Stands) of Change
in Growth Relative to Terrace Elevation
Classes of Percent Change Terrace Elevation Class t
in Growth Low Medium High
Low 0 3
Medium 3 2 0
High 0 3
Low = less than 5 percent decrease medium = 5-20 percent increase high =greater than 20 percent increase
t Low = approximately 3 m above mean river level medium = approximately 4 m above mean river level high = approximately 5 m above mean river level
TA
BL
E 5
C
hara
cter
isti
cs o
f S
tan
ds
Sam
pled
for
Tre
e-R
ing
Chr
onol
ogie
s
Sta
nd
Spe
cies
Sam
pled
S
oil
Org
an
ic
N0
3-N
N
o
and
Mea
n A
ge
Te
xtu
re
Ma
tte
r (
) (p
pm
)
Mis
sou
ri R
ive
r F
loo
dp
lain
5
Co
tto
nw
oo
d (
80
yea
rs)
sand
0
76
1
3
14
Co
tto
nw
oo
d (
10
0 y
ears
) si
lty-
cla
y 2
22
2
4
12
A
me
rica
n e
lm (
80
yea
rs)
silt
y-cl
ay
29
2
16
1
3
Am
eri
can
elm
(1
35
yea
rs)
silt
y-c
lay
26
9
43
1
9
Am
eri
can
elm
(1
05
yea
rs)
silt
4
40
3
6
16
B
ur
oa
k (1
25
yea
rs)
silt
y-cl
ay
40
7
32
Ref
eren
ce S
ites
Lit
tle
Mis
sour
i R
iver
C
ott
on
wo
od
(1
00
yea
rs)
Sca
rp w
oo
dla
nd
B
ur
oa
k (1
20
yea
rs)
So
urc
e f
or
soil
cha
ract
eri
stic
s J
oh
nso
n
Bur
gess
an
d K
ea
mm
ere
r [1
97
6]
Ele
vatio
n A
bov
e
Mea
n R
ive
middotr Le
vel
(m)
30
32
3
5
40
4
0
50
28
-J
-J
-J co
TA
BL
E 6
R
esul
ts o
f S
tep
wis
e M
ulti
ple
Reg
ress
ion
Ana
lysi
s U
sing
Tre
e-R
ing
Inde
x as
th
e D
epen
den
t V
aria
ble
an
d 1
5 I
nd
epen
den
t V
aria
bles
(C
lim
ate
Str
eam
flo
w
Pre
viou
s Y
ear
s G
row
th)
Sta
ndar
dize
d S
peci
es
Inte
rce
pt
Reg
ress
ion
Co
eff
icie
nt
Co
tto
nw
oo
d
Sta
nd 5
P
re-d
am
-27
6 +
82
8
-20
3 +
36
0
+3
33
-3
52
Pos
t-da
m
-64
8 +
16
9
+5
76
+
26
2
-37
3 +
04
2
Sta
nd 1
4 P
re-d
am
-21
7 +
41
0
+3
24
-2
48
+6
62
+0 4
7
Post
-dam
-1
5
+4
20
-5
44
+11
71
+2
99
-34
9
En
viro
nm
en
tal
Var
iabl
es
Ap
ril-
Ma
y F
low
(A
MF
L)
Ju
ne F
low
(JU
NE
F)
Spr
ing
Pre
cip
Y-l
(S
PG
P1)
S
prin
g P
reci
p (S
PG
P)
Spr
ing
AE
Y-l
(S
PG
AE
1)
June
Flo
w (
JUN
EF
)
Spr
ing
AE
(S
PG
AE
)
Spr
i ng
Te
mp
Y-l
(S
PG
T1)
F
all
Te
mp
Y-l
(F
AL
LT
1)
Pre
viou
s G
row
th (
AV
E 5
-1)
A p
ril-
May
Flo
w (
AM
FL
)
Spr
ing
Pre
cip
Y-1
(S
PG
P1)
A
pri
l P
reci
p (A
P)
S
pri
ng
Pre
cip
(SP
GP
) P
revi
ous
Gro
wth
(A
VE
14
-1)
Spr
ing
Pre
cip
Y-l
(S
PG
P 1
)
Spr
ing
Pre
cip
(SP
GP
) S
prin
g A
E (
SP
GA
E)
S
pri n
g T
em
p Y
-l (
SP
GT1
)
Fal
l T
emp
Ymiddotl
(F
A L
LT
1)
r2
F
p
08
2
162
3 0
0001
0 7
1 8
61
00
00
3
07
3
98
6
00
001
07
5 10
61
00
001
TA
BL
E 6
(co
ntin
ue
d)
Sta
ndar
dize
d S
peci
es
Inte
rce
pt
Reg
ress
ion
Co
eff
icie
nt
En
viro
nm
en
tal
Var
iabl
es
r2
F p
Bur
oak
S
tand
16
Pre
-dam
-2
814
+
38
0
Ap
ril-
Ma
y F
low
(A
MF
L)
05
2
312
0
03
+2
98
S
prin
g A
E Y
-1
(SP
GA
E 1
) +
47
9
Spr
ing
Te
mp
Y-1
(S
PG
T1)
+
35
8
Fal
l T
em
p Y
-1
(FA
LLT
l)
-49
9 S
prin
g T
emp
(SP
GT
) +
024
P
revi
ous
Gro
wth
(A
VE
16-
1)
Pos
t-dam
-4
216
+
39
5
Ap
ril-
Ma
y F
low
(A
MF
L)
077
12
06
00
00
1 +3
61
June
Flo
w Y
-1
(JU
NE
F1
) +
23
5
Ap
ril
Pre
cip
(AP
) +
417
S
prin
g A
E (
SP
G A
E )
+3
10
S
prin
g T
em
p (
SP
GT
)
Sca
rp w
oo
dla
nd
P
re-d
am
-18
9 -3
01
June
Flo
w (
JUN
EF
) 0
36
269
0
06
2 +
38
0
Spr
ing
Pre
cip
Y-1
(S
PG
P1)
+
30
3
Ap
ril
Pre
cip
(A P
) +
387
S
prin
g A
E (
SP
GA
E)
Pos
t-dam
-7
37
+34
4 Ju
ne F
low
Y-1
(J
UN
EF
1)
04
1
33
3 0
032
+
19
5
June
Flo
w (
JUN
EF
) +
227
S
prin
g P
reci
p (S
PG
P)
+04
1 P
revi
ous
Gro
wth
(A
VE
10
-1)
-J co
(co
nti
nu
ed
)
00
a
TA
BL
E 6
(co
nti
nu
ed
)
Sta
ndar
dize
d S
peci
es
Inte
rce
pt
Reg
ress
ion
Co
eff
icie
nt
En
viro
nm
en
tal
Var
iabl
es
r2
F
p
Am
eri
can
elm
S
tand
12
Pre~am
+3
69
4
+3
96
A
pri
l-M
ay
Flo
w (
AM
FL
) 0
55
3
42
00
211
-48
3 Ju
ne F
low
(JU
NE
F)
+9
89
S
prin
g P
reci
p Y
-1
(SP
GP
1)
+3
35
S
prin
g P
reci
p (S
PG
P)
-49
3 S
prin
g A
E (
SP
GA
E)
-33
8 S
prin
g T
emp
(SP
GT
)
Post~am
-13
77
-29
7 A
pri
l-M
ay
Flo
w Y
-1
(AM
F L
1)
04
7
25
5
00
6
+5
47
June
Fl o
w Y
-1
(JU
NE
F1
) -5
78
A
pri
l-M
ay
Flo
w (
AM
FL
) +
68
5
June
Flo
w (
JUN
EF
) -2
45
Fal
l T
em
p Y
-1
(FA
LL
T1
) -3
72
Spr
ing
Te
mp
(S
PG
T)
Sta
nd 1
3 Pre~am
+3
08
3
-50
0 A
pri
l-M
ay
Flo
w Y
-1
(AM
FL
1)
06
3
61
8
00
01
7
+3
13
Ju
ne F
low
Y-1
(J
UN
EF
1)
+52
1 S
prin
g P
reci
p Y
-1
(SP
GP
1)
+2
85
S
prin
g T
em
p Y
-1
(SP
GT
1)
-62
8 S
prin
g T
em
p (
SP
GT
)
Post~am
+52
51
-69
8 S
prin
g P
reci
p Y
-1
(SP
GP
1)
05
4
552
0
00
4
+1
00
9
Spr
ing
AE
Y-1
(S
PA
E1)
-3
64
Spr
ing
Te
mp
Y-1
(S
PG
T1)
-4
15
Ap
ril
Te
mp
(A
T)
TA
BL
E 6
(co
ntin
ue
d)
Sta
ndar
dize
d S
peci
es
Inte
rce
pt
Reg
ress
ion
Co
eff
icie
nt
En
viro
nm
en
tal
Var
iabl
es
r2
F
p
Sta
nd 1
9
Pre
ltlam
+
19
98
+
39
5
Ap
ril-
Ma
y F
low
(A
MF
L)
05
1 3
70
0
01
76
+
11
06
S
prin
g P
reci
p Y
-1
(SP
GP
1)
-99
4 S
prin
g A
E Y
-1
(SP
GA
E1)
-4
91
Spr
ing
Te
mp
(S
PG
T)
Pos
tltla
m
-11
34
+4
57
Ap
ril-
Ma
y F
low
Y-1
(A
MF
L1)
0
67
73
8
00
00
6 -5
44
Ap
ril-
Ma
y F
low
(A
MF
L)
+6
29
Ju
ne F
low
(JU
NE
F)
-19
7 A
pri
l P
reci
p (A
P)
+3
47
S
prin
g A
E (
SP
GA
E)
co
82
TABLE 7 Results from the Modified Regression Model
Stand Pre-Dam Post-Dam
Cottonwood 5 Streamflow A E
(0004) t (001)
14 Streamflow AE (002) (001 )
Elm 12
13
19 AE (003)
Oak 16 AE AE
(005) (0006)
Streamflow (0006)
Scarp woodland AE (005)
Growth = growing season AE and growi ng season streamflow using the G LM proshycedure in SAS [Helwig and Council 1979] Growing season is May June and July
tParentheses indicate levels of significance
TABLE 8 Missouri River Erosion and Deposition Rates at Various Time Intervals
Time Total Erosion Total Deposit ion Interval Time (yr) Erosion (ha) Rate (hayr) Deposition Rate (ha yr)
1881-1891 10 1328 133 1650 165
1891-1945 54 4648 86 5464 101
1945-1969 22 1704 77 937 43
1969-1979 10 212 21 13 13
TA
BL
E 9
M
isso
uri
Riv
er L
and
Use
Cha
nges
Sin
ce E
arly
Set
tlem
ent
Per
cen
tage
of
Cov
erag
e
Cat
egor
y T
ime
Peri
od
Pre
-set
tlem
ent
Pos
t-se
ttle
men
t
Agr
icul
ture
18
72-1
938
38
A
gric
ultu
re
1938
-197
9 18
C
otto
nwoo
d w
illo
w
lt 40
yea
rs o
f ag
e 14
3
Cot
ton
woo
d 40
-80
year
s o
f ag
e p3
10
C
otto
nwoo
d a
sh
elm
bo
xeld
er
80-1
50 y
ears
of
age
30
21
Ash
el
m
boxe
lder
gt
150
yea
rs o
f ag
e 3
10
co
w
(I)
w CJ z C ()
W (I)
l I
Q Z C
J W Z Z C ()
ac w gt ac
The Virginia Water Resources Research Center is a federal-state partnership agency attempting to find solutions to the states water resources problems through careful research and analysis Established at Virginia Polytechnic Inshystitute and State University under provisions of the Water Research and Develshyopment Act of 1978 (PL 95-467) the Center serves six primary functions
bull It studies the states water and related land-use problems including their ecological political economic institutional legal and social i mpl ications
bull It sponsors coordinates and administers research investigations of these problems
bull It collectsmiddotand disseminates information about water resources and water resources research
bull It provides training opportunities in research for future water scienshytists enrolled at the states colleges and universities
bull It provides other public services to the state in a wide variety of forms
bull It facilitates coordinated actions among universities state agencies and other institutions
More information on programs and activities may be obtained by writing or te lephoning the Center
Vi rgin ia Tech does not discriminate against employees students or applicants on the basis of race sex handicap age veteran status national origin religion or political affiliation The Un iversity is subject to Titles VI and VII of the Civil Rights Act of 1964 Title IX of the Education Amendments of 1972 Sections 503 and 504 of the Rehabilitation Act of 1973 the Age Discrimination in Employment Act the Vietnam Era Veteran Readjustment Assistance Act of 1974 Federal Executive Order 11246 Governor Robbs State Executive Order Number One and all other rules and regulations that are applicable Anyone having questions concerning any of those regulations should contact the Equal OpportunityAffirmative Action Office
Virginia Water Resources Research Center Virginia Polytechnic Institute and State University
617 North Main Street Blacksburg Virginia 24060-3397
Phone (703)961-5624
4
scape Our stu dies indicate that the cessation of fl ood ing and related changes in hydrologic regimen associated with the presence and operashytion of reservoirs are having major and long-term effects on the natural dynamics of remnant riparian ecosystems This conclusion is based on investigations of a protected floodpla1in bounded north and south by two large reservoirs along the upper Missouri River in North Dakota
Johnson Burgess and Keammerer [1976] first noted that major ecologishycal changes in riparian ecosystems along this stretch of the Missouri River had been init iated by reservoir construction The pu rpose of this research was specifically to test three hypotheses [Johnson Burgess and Keamshymerer 1976] through new field research in 1979 and 1980 The three hypotheses were that the altered hydrologic regimen caused by the presshyence and operation of reservoirs had initiated (1) adecline in d iameter growth rate of trees (2) a reduction in river meandering rate and landshyscape composition and diversity and (3) changes in the population strucshyture of several important tree species Tests of the three hypotheses are considered separately in th is report effects on tree growth are considered first meandering rate and forest composition sec~md and population structure third Histork and recent patterns of Iand use change also are analyzed in the second section
STUDY AREA
The study area included floodplain forests along a 130-rriver km portion of the Missouri River Valley located in south-central North Dakota (Figshyure 1) Garrison Dam (Lake Sakakawea) completed in 1953 forms the northern border while the Oahe Reservoir some 10 km south of Bisshymarck forms the southern border Most forests studied were on the floodplain within the study area however reference sites for tree growth analysis were selected in scarp woodlands west of Price North Dakota and along the Little Missouri River in western North Dakota (Figure 1) The climate of the study area is characterized by low humidity and low annual precipitation Mean annual precipitation is 39 cm 70 percent of it occurring during the growing season (approximately May 10 to Sepshytember 27) [Randich and Hatchett 1966]
I Physiography
This segment of the Missouri Valley lies in the Missouri Slope district of the Glaciated Missouri Plateau section of the Great Plains physioshygraphic province [Fenneman 1931 Lemkeand Colton 1958 Clayton 1962] The valley is trench-I ike varying in width from about 1 km to more than 11 km and is cut as much as 170 m below an upland undershylain by glacial drift and Tertiary and Cretaceous bedrock The trench is floored by a broad floodplain bounded locally by terraces The floodshyplain descends from an el1evation of 515 m at Garrison Dam to 494 m at the junction with Oahe Reservoir a total drop of 21 m in about 130 river km giving an overall gradient of about 015 m per km
II Geologic History
This segment of the Missouri Valley did not exist before Quaternary glaciation The preglacial Missouri flowed northeastward from Montana across the northwest corner of North Dakota into Saskatchewan [Lemke et aI 1965] and was diverted into its present course by southwestward advancing -continental ice sheets The timing and sequence of events inshyvolved in this diversion are not completely known
The most recent studies of this problem are by Bluemle [1971] and Carlshyson [1973] both of whom suggest a complex history of diversions by various ice advances which forced the Missouri into a course involving segments of eastward-trending preglacial valleys and new segments cut
5
6
by water diverted across former divides Bluemle shows that the wide segments of the present trench are those that were parts of preglac ial val leys and t he narrow segments are those that were cut by water diverted across divides He also suggests that f inal diverting and assumption of the present cou rse of the Missouri did not occur until late Wisconsinan time less than 15000 years ago
The terraces along the trench were developed as the river incised itsel f below former floodplain levels leaving remnants of those floodplains Some of them are eroded bedrock surfaces mantled with glacial drift and represent f loodplains formed in reoccupied preglacial valley segshyments formed during pre-Wisconsinan glacial diversion [Carlson 1973] Other terraces are underlain by sand and gravel and resulted from glacial valley trains [Brockman et aI 1979]
The defin itive study of Missouri River terraces has not yet been made and various authors who have studied different segments of t he trench disagree on the number of terraces and their historical interpretation Kume and Hanson [1965] recognized four terrace levels in Burleigh County two high outwash terraces and two low alluvial terraces Carlson [1973] working in Mercer and Oliver counties recognized only two tershyraces an upper one that corresponded to the high outwash terraces of Kume and Hanson and a lower one that included their two lower alluvial terraces Carlson believed that the two lower terraces represent the preshydam floodplain
Post-glacial changes in the trench have not been great The floodplain was established and modified by lateral cutting of the meandering river The valley walls have been gullied by new dra inage lines eroding headward into adjacent uplands and by slopewash Wind has piled sand into dunes locally and soils have formed on the various trench sediments
III Geologic Materials of the Trench
The trench walls expose the various materials cut through by the eroding river At the top are glacial sediments (generally thin and locally lacking) including till and lesser amounts of glacio-fluvial sands and gravels loess eolian sand and glacial lake sediments ~Iost of the depth of the t rench is cut in bedrock of early Tertia ry and (in the Bismarck-Mandan area) late Cretaceous age [Kume and Hanson1965 B luemle 1971 Carlson 1973] The Tertiary units include interbedded sands silts clays shales
and lignite beds belonging to the Paleocene Cannonbal l Slope Bullion Creek and Sentinel Butte formations The late Cretaceous beds are mudstones sandy sh ales sandstones and I ign ites of the Hell Creek f orshymation
Most of the high terraces are underlain by sand and gravel and are loessshycovered in some areas but some are underlain by drift-mantl ed bedrock [Kume and Hanson 1965 Carlson 1973] The low terraces essentially the modern pre-dam floodplain are underlain by recent alluvium includshying flood overbank deposits channel deposits and natural levee deposits Overbank silts and clays compose about 90 percent of these sediments with sand and gravel of channel and levee deposits composing about 10 percent [B luemle 1971] The thickness of this Holocene component may be as much as 35 m or more but it is often difficult to distinguish from similar glacial sediments upon which it rests
IV Soils
Soils of the Missouri trench have been described in county soil surveys of McLean County [Brockman et aI 1979] Olliver County [Weiser 1975] Mercer County [Wilhelm 1978] and Burleigh County [Stout et aI 1974] The floodplain soils that support the forests of the study area are Entisols of the Typic Ustifluvent or Typic Fluvaquept subgroups The Havrelon series dominates generally comprising 50 to 75 percent of the floodplain soils It is formed from loamy alluvium on the slightly higher elevations and is calcareous and well drained It has moderate permeability high available water capacity medium natural fertility and low organic matter
Areas of sandy alluvium such as natural levees and inter-channel islands are occupied mainly by the Banks series which has moderately rapid permeability low available water capacity low natural fertility and low organic matter Clayey alluvium of floodplain depressions (mainly oxshybows) is occupied mainly by the Lallie series which has slow permeabilshyity high available water capacity low natural fertility and low organic matter
Floodplain soil profiles tend to have thin greyish A horizons no B horishyzons and C horizons that vary somewhat in texture because of alluvial stratification All horizons tend to be mildly to moderately aikaline
7
8
V Stream Hydrology
The filling of Lake Sakakawea began in November 1953 At that time the natural hydrologic regimen was replaced by a controlled-release regishymen and the river began a series of adjustments to this alteration
Two major alterations in downstream regimen could be expected to result from damming (1) reduction of peak annual flow (mean annual flood) because of impoundment of excess runoff and (2) reduction of sediment load because of sediment deposition in the reservoir from upshystream
Continuous daily discharge records from 1928 to present recorded at the US Geological Survey Gauging Station No 06342500 at Bismarck (120 km downstream from the dam) permit a comparison of the preshydam and post-dam discharge These data show no significant change in overall discharge The mean of daily discharge readings for 25 pre-dam years (water years 1928-29 to 1952-53) is 1999 cms compared to 2204 cms for 25 post-dam years (water years 1954-55 through 1978-79) This decrease in discharge because of the initial filling of the reservoir (1953shy1963) was offset by the low discharges resulting from the dry climate of the 1930s
Seasonality of discharge has changed considerably The pre-dam (1928shy1952) pattern of monthly streamflow shows peak flow occurring from Apri l to July and minimum flow occurring from December to March (Figure 2) The sharp peaks in streamflow in the spring and early sumshymer in the pre-dam period are largely absent after 1953 Overall peak flow now occurs in February and March instead of April May and June and minimum flow occurs mainly in May and September instead of January and February
Seasonal flow rates are especially different for the months of June and February (Figure 3) June streamflow in the drought years of the 1930s was much higher than June streamflow since completion of the dam Extrapolating from gauge height the spring water table on the average would be considerably lower since 1953 and the late-summer water table would perhaps be higher Therefore the period of peak flow is now out of phase with the vernal growth pattern typical of floodplain trees
Mean annual low flow (mean of the lowest mean daily discharge readings
over a number of years) has been increased by abou t 155 percent Mean annual low fl ow for the 25 pre-dam years was 405 cms compared to 1 032 cms for the 25 post-dam years The minimum annual low flow for the 25 pre-dam years was 167 cms (January 1940) compared to 372 cms (March 1955) in the 25 post-dam years an increase of about 122 percent
I n addition to these changes in flow changes in the sed iment load could also be expected Both suspended load and bed load from upstream are trapped in the reservoir Thus the water released into the trench below the dam is essentially sediment-free and able to acquire a new load from materials available in the trench Unfortunately data are not available to compare pre-dam and post-dam sediment loads
Overbank flooding is the element most obviously missing from the postshydam floodplain environment Flooding now occurs on only the lowest terraces in part as a result of local ice jams in the spring Flooding above the 2-m terrace elevation has been eliminated (Figure 4) In the past the 3-m elevation was flooded on the average of once in 35 years and the 4-m elevation approx imately once in 6 years Terrace elevations of the stands sampled ranged from 3 to 5 m above mean river level The highest stand was flooded on the average of once in 25 years Because of ice jams in the pre-dam period the above frequencies are probably low for some locales Landowners report higher flood frequencies (25 percent or greater)
The mean annual flood (mean of the highest mean daily discharge readshyings over a number of years) has been reduced by about 68 percent Mean annual flood for the 25 pre-dam years was 11064 cms compared to 3554 cms for the 25 post-dam years The maximum annual flood (highest mean daily discharge reading) for the 25-year pre-dam period was 33736 cms (April 1952) compared to 6394 (July 1975) lin the 25 post-dam years a reduction of 81 percent
VI Natural Vegetation Dynamics
The predominant vegetation of the region is mixed grass prairie [Kuchshyler 1964] Small pockets of scarp woodland occur in protected upland ravines but the most extensive forests occur on the floodplain Clearing for agricu Itu re has reduced these forests to about 50 percent of their original extent Floodplain tree species include cottonwood (Populus
9
10
deltoides) peach-leaved willow (Salix amygdaloides) boxelder (A cer negundo) green ash (Fraxinus pennsylvanica var lanceolata) A merican elm (Ulmus americana) and bur oak (Quercus macrocarpa)
Most of t he worlds fl oodp lains have been formed by the effects of deposition and overbank flow [Wolman and Leopold 1957] Deposit ion as we as erosion is dependent upon lateral m igration of the river across the floodp lain A s the r iver deposit s alluv ium on the inside of a meanshyder it erodes mater ial from the opposite bankline Overbank flow usually results from heavy spring rains combined wi th rapid snow melt Downshycutting by t he river and upbuilding of the terrace from alluvial deposishytion during f loods eventually leaves some terraces well above the active floodp lain Leopold Wol man and Miller [1964] referred to such r iver terraces as t he abandoned f loodpla in
Vegetation patterns correspond to the dynamics of deposition and eroshysion Lateral movement of the river in it iates a dynamic series of vegetashytion events As t he river meanders it erodes away estab lished banks often covered w ith fo rest vegetation in different stages of devel opment However fully exposed alluvium deposited in the inside of river curves is prime habitat fo r the establ ishment of t ree seedl ings of pioneer species (for example cottonwood peach-leaved w i llow) Of the six tree species occurr ing on the floodplain only cottonwood and willow germinate and persist under t hese conditions Cottonwood and willow are classic pioshyneer species the seeds of neither species germinate under a forest canopy or in light gaps This illustrates the importance of point bar deposition by the meander ing river in maintaining cottonwood-willow commu nities as an important and integral component of the floodplain ecosystem
If cottonwood-wi now communities remain uneroded forest s of these tree species will develop Should they be missed by t he meandering river for centuries however the overstory will be replaced by admixtures of green ash boxelder Amer ican elm and bur oak through natural successhysion Thus there is a strong positive correlation between terrace elevati on and forest successional stage Higher terraces that have escaped erosion and were exposed to fewer floods of less intensity are more likely to contain vegetation of advanced successional stages
The cessation of floodi ng and a decline in the meandering rate would have at least two major consequences (1) reduce the amount of subshystrate (freshly deposited alluvium) for the regeneration of new cott onshy
wood-wil low forests and (2) allow a greater proportion of existing forests to age and change type t hrough natura l succession The net effect would be to reduce the land area of cottonwood-will ow forest now the most extensive forest t ype in favor of forests of ash boxelder elm and oak Old cottonwood-wil low forests exhib it the greatest tree species diversity [Johnson Burgess and Keammerer 1976] and have the greatest r ichness and density of breeding birds [H ibbard 1972] T he major forest communities also exhibit divergent understory species mineral cycl ing patterns and fau na [ Kroodsma 1970 Hibbard 1972 Keammerer 1972 Keammerer Johnson and Burgess 1975]
11
12
T REE GROWTH
Research to t est t he hypothesis that alteration of the hydrologic regimen was responsible for decreased tree growth had three components First we examined the degree to which environmental variables important to tree growth had changed from pre-dam to post-dam periods Second cumulative growth of trees was compared during two 20-year periods to determine pre-dam and post-dam growth patterns Third tree-ring chronologies were constructed and the growth patterns related statisshytically to a series of environmental variables using multiple regression procedu res
I Methods
Th irteen forest stands (Figure 1) were selected for tree core sampl i ng The stands included a range of vegetation and physiographic conditions and showed little or no sign of current or past disturbance One refershyence site was located along the Little Missouri River in western Nort h Dakota with in the Theodore Roosevelt National Park (Figure 1) The Little Missouri is a free-flowing stream whose flow patterns have not been altered by flood control structures Cottonwood and willow preshydominate although green ash boxelder and American elm occur as well The Little Missouri is a much smaller river than the Missouri average flows are 1733 for the Little Missouri and 6409 cms for the Missouri [US Geological Survey 1928-1977]
A second reference site was a scarp woodland [Wells 1965] located above the floodplain (Figure 1) Vegetation was similar in composition to that of the mesic terraces of the Missouri River with bur oak green ash American elm and boxelder the dominant tree species Scarp woodland trees rely exclusively on precipitation which is concentrated in local ravines Growth of these trees should more closely ref lect patshy
terns of precipitation than floodplain trees
The reference sites were selected because they were similar to the M1isshysouri River floodplain sites in vegetation and general climatic conditions but had not undergone any major environmental modifications between pre- and post -dam periods The term reference was used rather than IIcontrol because a number of small differences existed between refershyence and treatment sites (for example 39 cm mean annual precipitation for the Missouri 37 cm for the Little Missouri)
Trees were selected for sampling if they were at least 70 years old and displayed no sign s of disease or decay Also trees were exc luded if a nearby competitor had d ied Tree cores were collected using an increshyment borer and were dried mounted and surfaced A number of cores were initially measu red with a dendrochronometer to establish a system of cross-dating to facilitate accurate measurement of the remaining samshyples [Stokes and Smi ley 1968]
Three 20-year increments of growth (two pre-dam periods 1915-1934 1935-1954 one post-dam period 1955-1974) were measured for aU cores Because diameter growth of trees usually decreases with age it was necessary to adjust the measurements of the post-dam growth to compare them to groyvth during the immediate pre-dam period when trees were younger Standard dendrochronological procedures to correct for aging [F ritts 1976] were not su itable here as none discrim inates beshytween decrease in growth due to age and decrease due to long-term envishyronmental changes (for example altered river hydrology) low-frequency trends are removed
To correct for age we adjusted (increased) postdam growth by multishyplying it by the proportional change in growth that occurred between the two pre-dam periods The proportional change or multiplier was the quotient calculated by dividing growth during the first pre-dam period (1915-1934) by growth during the second (1935-1954) Cores that showed a growth decline between the pre-dam periods were adjusted in the above manner for all species except bur oak (henceforth referred to as adjusted for age) For example a core with 50 mm and 40 mm growth respectively during the first and second pre-dam periods would result in a multiplier of 125 Therefore the growth during the post-dam period say 20 mm would be adjusted to 25 mm Our method thus assumes a uniform rate of decline in growth with age Bur oak was not adjusted because most cores were from old trees that showed small inshycreases not decreases in growth between the two pre-dam periods
Finally 90 of the cores used above in the inter-period comparisons were selected for multiple regression analysis to examine year-to-year variation in growth in relation to environment Cores were selected from stands for wh ich there were at least 8 cores per species from trees at least 80 years old except for elm in stand 16 where only 3 cores were available The number of cores per species for the Missouri River floodshyplain was 24 for cottonwood 30 for elm and 12 for oak with 8 for
13
14
cottonwood on the Little Missouri and 16 for oak in the scarp wood land
Individual ri ng w idt hs were measured for a 50-year period (1928-1 977) for each core Measurements were standard ized (converted to indices) by fitting a polynomia l curve to the data and then dividing each ring width by the corresponding curve value (henceforth referred to as standshyardized) In this way long-term trends in growth were removed (for example due to senescence) and year-to-year variation was emphasized [F ritts 1976] The computer program used in the standardization proshycedure was developed at the Laboratory of Tree- Ring Research in Tuscon Arizona [Fritts Mosimann and Botroff 1969] and adapted for use by the US Geologlical Survey Tree-R ing Laboratory in Reston Virshygin ia R ing-widtl indices for all cores from a stand were averaged by species to construct chronologies three of cottonwood (including one from the Little Missouri) two of oak (including one from the scarp woodland) and three of elm
Precipitation data were from the US Weather Bureau station at Bisshymarck To integrate temperature (energy) and moisture actual evaposhytranspiration (AE) was also calculated [Thornthwaite and Mather 1957] and used as an independent varlable in growth correlations AE was calshyculated assuming 25 cm of available water per 15 cm of soil a surface rooting zone of 12 m and equal water availability between field capacshyity and permanent wilting point (-15 bars) [Johnson Burgess and Keamshymerer 1976]
II Results and Discussion
A Environmental Variables
Primary environmental variables potentially important to tree growth during the two periods included precipitation groundwater overbank flooding and soils To determine whether low precipitation might have been responsible for the decrease in tree growth during the post-dam period Johnson Burgess and Keammerer [1976] compared average anshynual precipitation and AE for two 15-year periods 1940-1954 and 1955shy1969 They found a slight decrease in both parameters in the post-dam period We also found a slight decrease in average annual precipitation and AE for two 20-year periods and for the primary growing season months (April May June and July) although the means were not sigshynificantly different (p lt 075) and the minimum values were much
smaller in t he pre-dam period (Table 1) I t is unl ikel y that the small average decrease in AE and precipi tat ion cou ld have caused a large deshycline in growth in the post -dam period A s w ill be shown later t ree growth of one reference si te actuall y increased signi ficant ly du r ing t he post-dam period
Depth to the water table ranges from near zero to 9 m in t he study area [Greenman 1953] Water table depth changes seasonally in response t o periods of aquifer recharge and discharge (Figure 5) Rech arge occurs mainly in early spring from lateral movement of water f rom t he Missouri River at high stages (bank storage) subsurface flow from ad jacent bedshyrock above the floodplain and percolation of soil grav itational water from precipitation an9 runoff Discharge from the aquifer occurs mainly in the summer as a result of transpiration flow to the Missouri River at low stages and irrigation pumping [Randich and Hatchett 1966] The water table on terraces adjacent to rivers can respond rapidly to changes in river stage however the response decreases w it h increasing distance from the channel [Weist 1971 Grannemann and Sharp 1979]
Current re leases from Garrison Dam are related primarily to generation of electricity Peak demands occur during the coldest months and to a lesser extent the warmest months [US Army Corps of Engineers 1980] although the seasonal pattern is highly variable It is di ff icult to detershymine the effect of changing river gauge height (flow) on water table depths at all distances from the river although the greatest changes probably have occurred nearest the river channel Unfortunately we can find no data on pre-dam water table depths and seasonal fl uctuashytions in the study area and can only speculate as to p re-dam water table conditions However irrigation and seasonal fluctuation in river stage have noticeably ch anged since completion of Garrison Dam There has been increasing use of aquifers for pumped irrigation water which would have lowered the water table during the growing season
Several stands were located in areas fl100ded periodically from concenshytrated upland ru noff The highest of these (stand 16) was situated at the edge of the floodplain adjacent to the bedrock terrace Three ravines draining a large upland area empt ied into the stand According to local reports it is flooded most years in the spring at times of snow melt and heavy precipitation Moisture conditions for this stand were markedly different from terraces of similar elevation that received no concentrated runoff Not only did vegetation composition of t h is stand differ from
15
16
dr ier terraces but as will be shown later t ree growth showed distinctly different pat t erns
Soils in the study area are alluvial in or igin and high in textural va rishyability not only between but also within stands Past f loods deposited lenses of sands si Its and clays varyi ng in th ickness th roughout the floodshyplain With the cessation of flooding the deposition of silt on terraces and accompanying nutrient enrichment have been eliminated Yet the cessation of flooding also aldows for a build-up of organic matter on tershyraces where it was previously scoured and removed by flood waters Changes in soi ll characteristilcs as a result of flood cessation are most Iikely not of as immediate importance to tree growth as the alteration in the hydrologi~ regimen However soils could have had an effect on the growth response of a tree to altered moisture conditions
B I nter-Perilod Comparisons of Cumulative Growth
Average cumulative growth of trees was compared between the immeshydiate pre-dam (1935-1954) and post-dam (1955-1974) periods AI species on the Missouri River floodplain decreased in growth in the postshydam period (Table 2) comparing post-dam growth (adjusted for age) to growth in the pre-dam period The trends are very similar to those of Johnson Burgess and Keammerer [1976] even though they are based on different sets of tree cores In contrast post-dam growth of oak (unshyadjusted) and cottonwood at the reference sites was greater than growth during the pre-dam period Application of the Wilcoxon sign-rank test [Holllander and Wolfe 1973] to growth during the pre- and post-dam periods showed that the decreases on the Missouri River floodplain were statisticaHy significant for all species except cottonwood the cottonshywood reference site showed a statistically significant increase but the increase in oak growth in the scarp woodland was not significant (Table 2)
In a separate analysis the percent change between pre- and post-dam (adjusted for age) periods was computed for each core and the median percent change computed for each species (Table 3) Percentages ranged from about a 25 percent decline to a 20 percent increase Largest declines were for boxelder elm and ash with moderate decreases for cottonshywood and bur oak on the Missouri River floodplain Comparatively large increases were exhibited by the two reference sites Based on results from a mUltiple comparisons test [Hollander and Wolfe 1973] the growth
decli nes for boxelder and elm were sign ifican t ly different from the inshycreases on th e reference sites and ash was significantly different from oak o n t he scarp woodland reference site Diffe rences am ong species o n t he Missouri River f loodplain were not stat isti cally sign ificant nor were the differences for bur oak a nd cottonwood between floodp lai n and reference sites
An atte mpt was made to rel ate changes in growth to va rious envi ronshymental condi t ions such as soil cha racteri st ics and topog rap h ic positio n (for example elevation above mean river leve l) Percent change in growth of all spec ies was determ ined for each stand The stands were then ran ked into lowmediumhigh classes of change This procedure was repeated for all three so il characte ristics (ava ilable water capacity organic matter and soil texture) and for stand elevation Frequency tables were conshystructed for growth classes and the classes for each env ironmental varishyable No trends were found for t he so il character istics Terrace e levat ion versus percent change in growth however showed a dist inct trend (Table 4) On the uppermost terraces growth was little changed on t he middle terraces growth showed the greatest decline and on the lowest terraces growth decreased moderately
Trees on low terraces (2-3 m above mean river level ) which were flooded most frequently in the pre-dam period and are rarely flooded now were expected to have shown the largest decrease in growth However growth decreased more on the middle terraces than on the lower terraces The relative depth to the water table on a terrace may be more important for growth than flood frequency Trees on low terraces are closer to the water table and to the river and could more effectively utilize pulses of high flow (for example after heavy precipitat ion) compared to those of the upper terraces
Tree growth on high terraces showed the least amount of change beshytween the periods Although the water ta ble was likely at greater depths on these terraces and only occasionally accessible to t rees (even in the pre-dam period) most of these stands received additional moisture from concentrated upland runoff Many trees here showed increases not decreases in growth For example stand 16 reportedly was flooded most years by runoff from upland ravines E 1m in stand 16 showed no change in growth between pre- and post-dam periods compared to a deshycrease of 25 percent over the study area Runoff is clearly important to the growth of trees on high terraces adjacent ot the uplands
17
18
T he observed decrease in the growth of elm was not caused by Dutch elm disease since trees in the Bismarck area have been infected onl y in t he last several years Johnson Burgess and Keammerer [1976] observed a decrease in growt h of trees sampled in 1969 before the disease had spread to centra l Nort h Dakota The elms that we sampled 10 years after their study sh owed t he same magnitude of decl ine in growt h
C Patterns of A nnual Radial Tree Growth
Cottonwood elm and oak were se lected fo r multivariate analysis to examine year-to-year variation in growth in relation to environment These species were selected because each is representative of a different stage lin the development of the floodplain forest and therefore may be affected differently by the altered hydrologic regimen Also patterns of pre- and post-dam growth differed among these species Percent change in the growth of bur oak and cotton was the smallest between the two periods whereas elm showed a large decrease in growth in all but the most mesic stands
Seven tree-r ing chronologies were constructed from stands along the Missouri (two from stand 16) and two chronologies were constructed for the reference sites (Table 5) Both unstandardized and standardized chronologies were constructed and smoothed [Tukey 1977 3RSSH 3RSSH3] for each site except for elm in stand 16 where just the unstandshyardized chronology was used (Figures 6 through 9) Low growth during the 1930s (especially 1936-1937) in 1946 and in 1961 was common to all of the tree-ring chronologies These were periods of low spring streamflow and AE (Figure 10) During the pre-dam period most chronshyologies exhibited two peaks in growth between 1938 and 1944 I n the post-dam period most chronologies showed peak growth in 1965 coinshycident with high spring AE Thus t here was a close correspondence beshytween macroclimate and the growth of floodplain trees
But perhaps of more significance were the years 1952 and 1955 In April of 1952 one of the largest floods on record for the Missouri River inunshydated the entire floodplain It was however a year of low AE All chronshyologies except those from stand 13 (Figure 6) and the scarp woodland showed high growth in 1952 This illustrates the compensating effect that overbank flooding had on tree growth in years of low AE In 1955 t he reverse conditions prevailed spri ng AE was high while streamflow (releases from the dam) was low Growth in 1955 for all chronologies
except in stands 13 (Figure 6) 16 (Figure 7) and t he scarp woodland was low wh ich ind icates the effect of low streamflow on growth The growth of scarp woodland trees not influenced directly by streamflow generally followed A E patterns between 1928 and 1977
The unstandardized series for elm sites that did not receive concentrated upland runoff (stands 12 13 and 19) exhibited a systemat ic downward trend in growth rate through the post-dam period (Figure 6) wh ich matched the general pattern of elm growth decline discussed ear lier In contrast the unstandardized chronology for elm in stand 16 which conshytinued to receive upland runoff since construction of the dam showed no systematic long-term decline in growth during the post-dam period and therefore was no~ standardized This re-emphasizes the importance of topographic position on the magnitude of the growth decline of elm and other species during the post-dam period
The cottonwood chronology from the Little Missouri reference site (Figshyure 8) showed similar trends in growth to that of cottonwood on the Missouri River (Figure 9) with lowest growth also occurring in the 1930s 1946 and 1961 I n contrast to the cottonwood chronology from stand 14 (Figure 9) the unstandardized chronology from the Little Misshysouri showed no systematic decl ine in growth Trends in the Little M isshysouri streamflow data generally matched cottonwood growth patterns (Figure 8)
D Multiple Regression Analysis
Fourteen environmental variables (fall AE plus those shown in Table 6) considered to be important for tree growth during certain months and seasons (for example June flow) were used in stepwise multiple regresshysion models A fifteenth variable tree growth during the previous year was included because growth in one year may strongly affect growth in the following year (serial correlation Fritts 1976] Thus tree-ring index was the dependent variable and the 15 aforementioned factors were independent variables Regressions were determined separately for each stand for pre-and post-dam periods
Several streamflow parameters correlated positively in the mUltiple regression models with annual patterns of cottonwood growth in the pre-dam period (Figure 11) Apri l-May flow was important in models for both stands 5 and 14 In addition spring precipitat ion and spring
19
20
preCIpitation in the previous year (Y-1) were posi t ively correlated in models for both stands The ana lysis also indicated that growth may be suppressed when April precipitation is high (negatively correlated with growth Figure 11) because it may pro long saturated so il condi tions (low oxygen) after March -April flood s High June fl ow (negatively corshyrelated Figure 11) flooded low terraces near the river such as stands 5 and 14 or ra ised the water table excessively during this important growing season month and therefore may have been responsible for deshycreased stem growth by lim iting root oxygenation High June f lows were common in the pre-dam period (Figure 2)
Correlation patterns for cottonwood shifted markedl y from streamflow and spring precipitation in the pre-dam period to AE and temperature in the post-dam period (Figure 11) Of the streamflow parameters only June flow was positively correlated with growth (stand 5) in the post-dam period Thus very high flows in June in the pre-dam period could have reduced overall growth but h igh flows within a much lower range in the post-dam period (Table 3) could have been benef icial Growth in both stands was positively correlated with spring AE and spring tempershyature in the previous year and negatively correlated with fal l temperature in the previous year Low fall temperature in the previous year would have resulted in greater soil moisture storage over the w inter The negashytive correlation with spring precipitation in stand 14 appears to be spurshyious a situation not uncommon in the application of multivariate techshyniques to ecological data [Pitt and Heady 1978] Overall the general lack of correlation with streamf1low suggests that moisture su pplied by the river is now less important to the growth of cottonwood in t he postshydam period
Cottonwood presence has been used as an indicator of a high water t able since it tends to be phreatophytic [Meinzer 1927 ] Hayes and Stoeckler [1935] classified cottonwood as a shallow-rooted t ree laquo 2 m) however its roots may ex tend to much greater depths especially on floodplains where the process of terrace development continually buries the trunks of trees [Everitt 1968] Older cottonwoods that grow on terraces 3 m above mean river level yet that germinated on low terraces just above river level may have roots that extend to the original depth of rooting
With the alteration in flow regimen especially during the growing seashyson there has l ikely been a corresponding change in depth to water table For example with a lower spring water table the roots of trees may no
longer extend to the capillary fri nge thus growth might depend more on surface soil moisture from rai nfa ll than on groundwater T his shift in response from one source of moisture to another indicated t hat the dam has indirect ly affected cottonwood water rel ations Cottonwood was perhaps less affected by altered streamflow t han other species beshycause of its deep root system proximity to the river where the water table was most accessible and possession of a root system more responshysive to changes in water su pply
Most positive correlations with bur oak growth in stand 16 during the pre-dam period were with variables of the previous year including growth temperature and AE (Table 6) Regression coefficients for the post-dam period in c r~ased considerably positive correlations were for current year precipitation AE and temperature in the spring The reshygression coefficients for the scarp woodland models were low (036 041) and are therefore not discussed With respect to the observed positive correlation between oak growth and streamflow variables it should be recalled that post-dam streamflow was mainly a reflection of releases from the dam However high streamflow events were also caused lin part by runoff from short heavy rains or rapid snowmelt The frequency of these events may have been independent of total monthly precipitation For example total monthly precipitation does not indicate whether there were many days of light rain or a few days of heavy rain with the rest of the month dry For these reasons the relationsh ip between oak growth and streamflow was only correlative and not causal
Regression coefficients for American elm were higher than the scarp woodland oak values but still considerably less than those of the cottonshywood models Patterns of correlation shown by at least two of the three elm stands during the pre-dam period were positive correlation with April-May flow and spring precipitation in the previous year and negative corre1lation with spring temperature The patterns are decidedly different in the post-dam period April-May flow was negatively correlated and June flow was positively correlated with growth However there was little pattern among stands with respect to the numerous other variables included in the regression models The correlation pattern for elm apshypears to be high Iy variable among sites and between periods and little can be generalized from the multiple regression analyses
The chronologies were also used in a reduced model growth = sp ring AE and spring streamflow in a linear modeling procedure [Helwig and
21
22
Counci l 1979] to more clea rly defi ne the contribut ions of these environshymental facto rs to t ree growth (Table 7) The results re-emphasize the shift in correlation between the periods from streamflow to AE for cotshytonwood Bur oak growth correlated with A E in the pre-dam period yet was more strongly correlated with AE and streamflow in the postshydam period For American ellm correlations with growth in the reduced model were weak one significant correlation wi th AE occurred in one elm chronology in the post-dam period
Separate regression analyses were made for the Little Missouri cottonshywood chronology corresponding to the pre- and post-dam periods on the Missouri In the 15-variable stepwise regression procedure (using Little M issou ri s~reamflow data from 1935-1977) there were no major differences in the variables selected for either pre- or post-dam period models Using the reduced model growth = spring A E and spring streamshyflow (Little M issouri) there were again no shifts in correlations between the two periods This is in distinct contrast to the shifts lin correlations observed for cottonwood in stands 5 and 14 on the Missou ri River where the hydrologic regimen has been altered by Garrison Dam
LAND USE AND RIVE R HYDROLOGY
Johnson Burgess and Keammerer [1976] expected that because of reshyduced spring flooding (lower peak flows) and bank stabil ization the rate of river meandering had slowed since construct ion of the dam T his hypothesis is evaluated in this section by analyzing historic and present river meandering rates Also in this section the rates and di rections of land use change since initial settlement are analyzed and di scussed Such an analysis is important since current vegetation patterns are closely linked to past land use
I Methods
A River Meandering Rate
Historic and recent rates of meandering of the Missouri River were detershymined from channel change maps within the study area Positions of the river over time were transferred to a common base map at a scale of 124000 Several sources of linformation were used General Land Office summary records describe the position of the river channel f rom 1872 to 1881 An additional set of archival maps was prepared in 1891 by the Missouri River Commission The aerial photographic record of the study area began in 1938 Photographs recording channel position were available for several time periods up to the present Additional informashytion on pre-dam channel position was available from maps prepared by the US Army Corps of Engineers in 1945
The pre-dam meandering rate was determined from channel positions in 1881 1891 and 1945 From the common base maps an electronic digitizer was used to determine the amount of eroded and deposited land in each time interval This total area was divided by the number of years in the time interval to compute average annual erosion and deposishytion for the period Post-dam meandering rate was determined by comshyparing the position of the river compiled from US Geological Survey photographs (1969) to current (1979) channel as shown by Corps of Engineers photographs Meandering rates were independently determined for the period 1938-1972 by the Corps wh ich used aerial photogramshymetric techniques and range line surveys
Also field surveys were conducted to assist in mapping historic ch annel positions Five to 10 cottonwood trees on each terrace level on several
23
24
large meanders in the study area were cored and aged By p lotting t ree ages fo r a given terrace isochro nes or age contours could be d rawn [Everitt 1968] Use of these maps improved the accuracy of th e comshyposite channel map
B Land Use Change
Land use was mapped for each period on a com posite map at a scale of 1 24000 Land use categories were (1) marsh-treeless areas with emershygent aquatic vegetation or open water (2) non-forest - o pen land occushypied by houses or farm buildings (3) bare sand-non-forest ed ba rs and dunes along the river channel (4) ind ustrial-power plants and refineries (5) agriculture (s~tt l ement to 1938)-cropland and pasture cleared before 1938 (6) agriculture (1938- 1979) - cropland and pasture cleared 1938shy1979 (7) cottonwood-willow-young stands of Populus deltoides and Salix amygdaloides up to approximately 40 years of age (8) cottonshywood-stands of Populus deltoides approximately 40-80 years of age (9) cottonwood-ash-elm-boxelder-stands with at least 50 percent of the canopy composed of Populus with 20-50 percent an admixture of Fraxishynus Ulmus and Acer (10) ash-elm-boxelder-stands with at least 75 percent of the canopy composed of Fraxinus Ulmus and Acer Many of these stands included a small component of Populus andor Quercus
Field surveys and tree aging also improved the accuracy of land use maps by providing general ground information and specifically enabling more accurate estimation of age classes of cottonwood forests They also enabled accurate estimation of the area and age of young cottonwoodshywi lIow forests (less than 40 years) wh ich are di fficu It to identify u namshybiguously from photography
Because 1891 cover maps were very general General Land Office Survey records were used to determine the proportional composition of the forest categories at the time of settlement These reco rds have been used by other researchers in determining pre-settlement vegetation [Stearns 1949 Burgess 1964] Survey notes usually included a general descripshytion of each township including deta ils of forest underbrush soils and relief Points were established at each 16-km interval along the range and section li nes of each township In this manner 36 sections were established within each township At the common point between secshytions as well as at quarter section corners (a point halfway between section corners) the species diameter and bearing of up to four witshy
ness trees were recorded By examining the records for all trees on the 160 points occurri n~ in the study area the proportion of cover types could be estimated
II Resu Its and Discussion
Between 1881 and 1891 approx imately 1650 ha of land su rface area were deposited as alluvial material (Table 8) Durin~ this same period approximately 1328 ha were eroded The average annual erosion rate was 133 ha per year For the interval 1891-1945 approximatel y 5464 ha were deposited and 4648 ha eroded Average annual loss rate during th is interval was approx imately 86 ha per year Thus average annual erosion rate for the ~ntire pre-reservoir period (1881-1945) was 93 ha per year wh ile deposition rates averaqed 111 ha per year Although there was a slight net accumulation of material (18 ha per year) during the pre-dam period losses and qains were relatively balanced
In the post-dam period both erosion and deposition rates decreased subshystantially Dur ing 1969-1979 only 13 ha of land were deposited and most of that accumulated behind erosion control devices (wing-dikes) constructed along the bankline During this same period approximately 212 ha of land were lost to erosion This is an average annual rat e of 21 ha per year Thus erosion rates fell from the pre-dam avera~e of 93 ha per year to 21 ha per year during the post-dam period (1969-1979) Accretion rates fell from 111 ha per year to 13 ha per year during the same period Post-dam erosion rates were only 25 percent of pre-dam rates and accretion rates only 1 percent of pre-dam rates
Vhi lle erosion and deposition rates were relatively balanced during the pre-dam period they were decidedly unbalanced during the post-dam period Deposition during the pre-dam period was 12 ti mes greater than erosion during the post-dam period erosion was 162 times greater than accretion This overal ll increase in erosion over deposition has resulted from increased bank cutting and destabilization Thus the channel is widening because material is being eroded from both banks with little concurrent accretion
Meandering rates increased as floodplain width increased Thus where the floodplain was narrow river meandering rate was small In the porshytion of the study area below Garrison Dam (Microfiche 17) the width of the floodplain averages about 16 km Shifts in channel position since
25
26
1872 have averaged approx imately 06 km I n the study area south of Bismarck (Microfiche 11) t he floodplain is approximately 116 km in width Channel changes since 1872 have averaged approximate ly 24 km result ing in red istribution of la rge am ou nts of alluvium
The model of Schumm [1969] would predict t hat the reduction of f loodshying and bed-material load resulting from dam emplacement will lead to an increase in channel sinuosity and a decrease in meander wavelength Thus the natural response involves considerable lateral cutting unti l the channel reaches equilibrium with the new regimen In the study area however an extensive series of bank-stabilization structures conshystructed by the Corps of Engineers since dam emplacement has preshyvented natural c~annel response and has actually led to a considerable post-dam reduction in lateral channel shifting The Schumm model also predicts a decrease in channel width but the actual channel has been widening T he cause of this anomalous response may be that the stream is expend ing energy in eroding and transporting sediment from both channel walls instead of unilateral channel shifting
The dramatic decline in erosion and accretion rates since the construcshytion of Garrison Dam and the change in the balance between the two are beginning to have an impact on natural rates of reforestation by cottonwood and willow Currently approximately 35 percent of the floodplain forest is composed of cottonwood forests less than 80 years old forests with cottonwood trees less than 150 years old comprise 78 percent of the total Thus forests with cottonwood as the primary dominant currently make up the large majority of the floodplain forests
On active f loodpllains Everitt [1968] proposed a logarithmic decline in the area of the floodplain occupied by forests of increasing age that is young forests should occupy the largest proportion and old forests the smallest I f the meandering rate were to decl ine su bstantially thereby decreasing the likelihood of erosion and increasing mean stand age the pattern may at equ iI ibriu m become reversed that is old f orests wou Id occupy a larger area than young forests This is the pattern now emerging on this protected floodplain cottonwood forests less than 40 years of age now occupy only 8 percent of the total forest area while forests of 40 to 80 years comprise 23 percent of the total We expect the proporshytion of young cottonwood forests to decline in rough proportion to the decline in accretion rates A new equilibrium composition would be reached in less than two centuries and cottonwood forests will probshy
ably comprise at the most only 5-10 percent of the t otal forest area The remainder would include forests of more advanced successional age dominated by green ash and boxelder especially the f ormer Cottonshywood stands of t he future will be small in extent and primari ly located behind w ing-dikes and other erosion control dev ices Few if any cotshytonwood forests w ill occupy broad terraces more than several meters above mean river level The distr ibu t ion of cottonwood shou Id t heref ore become more rest ricted that is a strand species occurring in close proximity to the river
Settlement has brought many significant changes in the ex tent and comshyposition of the floodpl ain vegetation (Microfiches 2 1 th rough 28) The largest changes involved the clearing of fo rests for agricultural purposes By 1938 approximately 38 percent of the floodplain forest had been cleared for agriculture or about 07 percent per year over t he 1881shy1938 period (Table 9) Thus clea ring proceeded at a rapid rate after the General Land Office Survey of 1872-1881 No mention of agricu lture on the floodplain was made in the Survey notes however some cultivashytion had occurred in the adjacent prairie uplands An additional 18 pershycent of the forest was cleared for cu Itivation between 1938 and 1979 or about 05 percent per year
I ndustrial development on the floodplain is a recent phenomenon occurshyring mostly after the construction of Garrison Dam Less than 1 percent of the land area is used by industry Marshes and sand dunes also comshyprise less than 1 percent of the fl oodplain area Marsh area has changed little since presettlement but bare sand has decreased since the cessation of floods Large floods in the pre-dam period scou red and deposited sand on low terraces near the r iver channel
General Land Office Survey notes indicate that the preset tlement floodshyplain was almost completely wooded Young cottonwood forests less than 40 years old occupied about 14 percent of the floodplain forest These may have occupied a larger proportion of the forest area because young trees were generally not used as witness trees in the land survey
Approximately 53 percent of the forest was composed of cottonwoods 40-80 years old Thirty percent of the forest was in the old cottonwood type while only 3 pelrcent of the forests were of advanced successional age These included ash elm boxelder and bur oak with occasional large cottonwoods
27
28
Presently fo rest vegetation comprises about 44 percent of the floodplain area about 8 percent of t his total is composed of young stands of cottonshywood and willow less than 40 years of age Most of these have regenershyated since the closing of Garrison Dam in 1954 on alluvium deposited du ring the 1952 flood In many areas these stands are severely browsed by beaver and scoured by ice in the spring resu lting in frequent damage to aboveground stems Thus individual plants are older than they appear Because these stands are on low terraces with a high water table are flooded occasionally and are on soils unproductive for crops only 6 percent of this forest type has been cleared since their establishment at various times during the past 40 years
Approximately 23 percent of the existing floodplain forest was comshyposed of stands of cottonwood ranging in age from 40 to 80 years Forshyests in th is age class generally occurred on more productive soils howshyever they were still on low terraces with relatively sandy soils Agriculshytural clearing has removed about 52 percent of these stands since their establishment Clearing of forests of this age has increased since the 1930s because of floodplain protection and access to irrigation
The most extensive forest category is age class 80-150 years-47 percent of the total forest area These stands contain large cottonwood trees with young green ash American elm and boxelder These forests are located on intermediate terrace elevations About 43 percent of forests in th is category have been cleared for agricu Iture
The remaining forest type makes up 22 percent of the total forest area These forests contain green ash American elm boxelder and few scatshytered cottonwoods andor bur oak Since settlement 75 percent of this forest type has been cleared for agriculture This high rate of clearing is due to the location of these stands on high terraces removed from most floods and the presence of more productive soils for agriculture
Overall the rate of forest clearing was at its maximum during the early settlement period before 1938 Although the rate of clearing has been somewhat lower during the period after 1938 field observations indicate a surge in clearing since 1970 when irrigation became more widespread Soils that were perhaps of marginal productivity and therefore left forshyested cou ld be made more productive with additional water from irrigashytion Deforestation continues at a rate that is probably greater than the average rate of 05 percent for the 1938-1979 period
It is difficu lt t o accurate ly est imate the forest type proport ions on the presettlement flood plain primarily because the surveyors selected against choosing small trees as wi tness trees Young witness trees less than about 12 cm diameter at breast height (dbh) did not occur in the data set so the proportion of small cottonwood forests was significantly underestishymated The estimate of only 3 percent of the total forest area occupied by forests of advanced successional age is especially interesting since the current proportion is about 22 percent and these forests wh ich ocshycurred on better soils were preferentially cleared We do not know with certa inty the reasons for th is but we suspect that it is an artifact of past timber practices Large cottonwood trees (50-100 years old) occurr1ing with an understory canopy of ash elm and boxelder were preferred trees for lumbering ~elective cutting of these trees would have in effect shifted these stands from the mixed cottonwood forest type to the most advanced successional stage Cottonwood does not reproduce in the tree gaps of older forests
29
30
TREE POPULATION STRUCTURE
An underrepresentation of sap ling-size reproduction of American elm and boxelder was observed by Johnson Burgess and Keammerer [1976] however they sampled only trees 12 cm dbh and larger and did not determine age only size Extrapolation from size to age is often inaccurshyate [ Harcombe and Marks 1978] This research was designed to develop complete age structure diagrams in both treatment and reference stands to test the hypothesis that altered hydrologic regimen had affected tree population structu re The survey of Johnson Burgess and Keammerer indicated that the population structure of another important climax tree species green ash was unchanged from pre-dam condi tions
I Methods
Four former stands of Johnson Burgess and Keammerer [1976] were selected for study ( stands 7 11 13 and 19) I n addition to these treatshyment stands other stands or portions of treatment stands (7 16 and 23) were included as contro l or refe rence sites Because surface water occurred in the spri ng in these stands either from upland runoff or from rising groundwater these reference stands represented an environment closest to that of flooded stands in the pre-dam period If reproduction was as underrepresented in the wetter reference sites as in the treatment sites then the in itial hypothesis that underrepresentation was due to flood cessation would have to be rejected Boxe lder was a major species in stands 7 and 23 while American elm was dominant in stands 1 t 13 and 19 Reference stand 7 (a section of treatment stand 7) was an abanshydoned channel of the Little Heart River on the Missouri River floodp lain near Oahe Reservoir wh ilch fills with water in the spring Reference stands 16 and 23 were flooded almost annually by concentrated upland runoff A ll stands were on one terrace level and had undergone no significant cutting grazing or burning during the previous 30 years Sampling ocshycurred during the summer of 1979
I n each stand parallel and equidistant lines were arranged perpend icular to the course of the river Sample plots were located at random points within 25-m segments along each transect line The sample unit consisted of nested circular plots 250 m2 for stems greater than 10 cm dbh (trees) 100 m2 for stems less than 10 cm dbh but taller than 05 m (saplings) and 1 m2 for stems less than 05 m tall (seedlings) Four 1-m2 plots were random Iy placed with in each 100-m2 plot Twenty-one plots were samshy
pled in stands 11 and 19 and 23 in stands 7 and 13 Because the refershyence stands were much smaller than the t reat ment sites sample sizes were smaller reference stand 7 (three plots) reference stand 16 (seven plots) and stand 23 (two plots)
Stem diameter at breast height was measured f or all boxelder and elm trees and saplings that occurred in t he quadrats Ages of seedlings were determined by counting terminal bud scars or cutting and aging directly I ncrement cores were collected from several saplings and trees in each plot and age was determined in t he laboratory Small saplings were cored using a micro-increment borer A ges for all stems were computed using the natural growth function f(x a b) = a( 1 - e-b x ) where x = dbh and f(x) == age [Parton and Innis 1972] The curve for each species was selected that minimized the residual sums of squares and yielded the greatest measure of fit [Helwig and Council 1979] For elm a = 143 b = 002956 (r2 = 094) For boxelder a = 106 b = 002388 (r2 = 095) All samples of each species were pooled for t he age-size regressions
Size and age structural diagrams were constructed separately by computshying the density of stems in each size or age class Because the relat ionshyship between age and size was close to being linear the curves in both graphs exh ibited the same basic form Boxelder stems of sprout origin were tallied separately to show the contribution of sprouting to overall population structure Data were divided into five-year age classes
II Results and Discussion
Age distributions for American elm (Figure 12) showed low densiti es of saplings and small trees and high densities of seedlings and large trees Three of the four treatment stands showed a complete absence of stems in one of the two young age classes The average of all four stands also showed lowest densities in the two sapling classes The data clearly indishycate that post-reservoir conditions allowed substantial germination and initial establishment of seedlings seedling densities in the first age class averaged 110000 per ha However seedlings must have thinned rapidly since stems from several years old to about 45 years old were relatively rare High densities of elm seedlings were also noted during field surveys in 1969-70 by Keammerer [1972] and underrepresentation of sapl ings and small trees was observed by Johnson Burgess and Keammerer [1976] Reduction in elm density occurred in stems from several years old to those that would have been approximately 20 years old when
3 1
32
Garri so n Dam became operational
Age distribut ion fo r boxel der also showed underrepresentation in t he small age classes but th e reduction was less dramatic than for elm (Figshyure 12) Again seedl ing reproduction was considerable altho ugh at lower overall densities than elm Mortali ty between seedlings and smal l tree classes was considerable thereby resulting in fewer saplings than trees Underrepresentation is most evident in stems several years o id to about 25 years old Thus boxelder showed a somewhat narrower age gap than elm Reduction in stem density appeared in age classes that corresponded cIIosely to the time since flooding was eliminated by Garshyrison Dam
Age distributions in reference stands showed different patterns (Figure 13) Age distributions for both species appeared to be more balanced [lJIeyer 1952] that is age classes between 5 and 45 years were considshyerably Iess underrepresented than in treatment sites In our survey of reproduction on the floodplain one observation held true-h igh sapling densities of American elm andor boxelder were always associated with the few siteS that received supplemental moisture either from a rising groundwater table near Oahe Reservoir or in areas that received upland runoff
Therefore the data suggest that moisture was the primary factor responshysible for underrepresentation in the age structure of these two species Supplemental moisture to these forests would in the pre-reservoir years have been provided by both a surface recharging of the rooting zone by overbank flooding and a high water table in the early growing season months when river height was generally maximum However in the abshysence of these sources of moisture seedlings would now depend on preshycipitation alone to enable growth to the deeper post-reservoir water table We believe that the reduction in available moisture was the likely cause of the extremelly high seedling mortality and the movement of only a small fraction of elm and boxelder seedlings into the tree-size classes The natura l range of elm extends to only a few counties west of the study area in North Dakota while boxelder extends west into the drier conditions of eastern and central Montana Interestingly the species less able to tolerate drier cl imatic conditions (elm) was also the species that showed the greatest underrepresentation in age structure in the drier post-dam floodplain
Ch anges in the hydrologic regimen may have also cau sed greate r morshytality of established saplings in the yea rs im mediately follow ing Garrison Dam T hus t he o bservation in t he age structural d iagrams for elm (Figshyure 12) that increased mortality began two decades before Garrison Dam (that is cu rren t 45-year-old age c lass) may be the resu lt of increased morta lity of sa plings t hat were 20 years old or younger in the years folshylowing dam construction Perhaps the root systems of saplings were too poorly developed to ut il ize gro undwater o r to persist on it alone At the wetter reference sites mo rta lity of saplings of this age did not appear to have increased substantially over pre-dam levels
I n contrast t he mortality of establ ished boxelder sapl ings appears to have continued at pre-dam levels the change in hydrologic regimen appeared to increase only the mortality of young boxe lder seedlings that is individuals established after 1954 The larger proportion of stems that had died and resprouted in treatment stands also indicates that these seedlings were under greater stress than those in reference sites
Since livestock grazing could also have caused seedling-sapling mortality t he grazing history of the treatment stands was obta ined from landshyowners Stand 7 had not been grazed since the 1920 s stands 11 and 13 had not been grazed since 1950 and stand 19 had been grazed one year in the early 1970s but otherwise had not been grazed during the postshydam period Grazing therefore has been light or nonexistent in the treatment stands and was probably not the reason fo r the gap in age structure Furthermore if the ingestion and trampling by cattle were responsible for increased mortal ity other woody tree species wou Id likewise also have been affected yet green ash saplings of all age classes were numerous in treatment stands
Browsing by deer has also been shown to affect the population structure of preferred species [Swift 1948] Although American elm is a preferred browse species in this region damage to it from browsing was not noticeshyable in our treatment stands
In streamside forests in the East many large elms (Ulmus americana L and Ulmus rubra Muhl) have died from Dutch elm disease We saw no evidence of diseased elms on the floodplain in our study area however the disease has killed many urban trees in Bismarck Since elm trees are affected to a greater extent than seedlings and saplings [Stipes and Camshypana 198 1] the disease is not considered a cause for the Ilow densities
33
34
of elm saplings Underrepresentat ion was already observed by Johnson Burgess and Keammerer (1976] during the 1969 and 1970 fie ld seasons about t he time Du tch elm disease had spread to central North Dakota [Stipes and Campana 1981 ]
Although the natural form of the age structure curve of c llimax or equilibrium tree populations had been thought to be negative exponenshytial [Meyer 1952] recent studies have indicated that underrepresentashytion in sapll ing size classes is a widespread phenomenon [Christensen 1977 Harcombe and Marks 1978] Harcom be and Marks sampled forest stands in the Big Thicket of southeastern Texas that ranged from dry uplands through mesic sllopes to wet river floodplains They showed a high incidence of underrepresentation of sapl ings of cl imax tree species in wet and mesic forests but a lower incidence in dry upland forests They argued that the cause of the underrepresentation was competition for Iight between the seed Iings and sapl ings of overstory tree species and understory tree and shrub species They suggested that underrepresenshytation in wet and mesic forests was natural and caused by increased morshytality of seedlings because of shad ing by understory trees (for examp1le Carpinus caroinianaj
Patterns of underrepresentation in age structure f or the M issou ri River floodplain were nearly identical with those of southeastern Texas exshycept we believe that underrepresentation in our study was caused by lack of moisture not light The canopy of old floodplain forests along the Missouri River is relative ly open Hibbard [1972] showed that in these forests canopy cover ranged from 65 to 80 percent A lso neither boxelder nor elm is ilntolerant of shade [Baker 1949] Saplings of these species were no more abundant along stand edges or in large canopy gaps where light would have been more available
In summary our results indicate a significant decline in the abundance of American elm and boxelder on the Missouri River floodplain in the study area Current overstory densities of these species cannot be mai1nshytained given the low density of saplings In the case of American elm the decline will accelerate if Dutch elm disease begins to affect canopy trees Assuming that current trends continue the importance of these species in the overstory should consistently decline over t ime until only scattered trees remain or even become local ly elliminated Trees wHI beshycome primadly restricted to the few small wet sites either near the backshyup of Oahe Reservoir or in places where intermittent streams flow onto
the floodplain Seedlings may continue to be numerous unti l affected by restricted seed d ispersal from a dwi ndling nu mber of canopy trees Because green ash reproduction of all age classes was ubiquitous and dense it should become an increasingly important canopy species
Available evidence points to the altered hydrologic regimen as the cause of reduced recruitment of boxelder and elm trees however in the abshysence of pre-dam age structure and hydrologic information th is conclushysion must be considered tentative We clearly need additional informashytion from other f loodplains both natural and altered to solve the undershyrepresentation problem
35
36
CONCLUSIONS
1 The hydro logic regi men of the Missouri River has been altered conshysiderabl y by t he construction of Garri son Dam Wh ile precipitation and A E have shown no significant changes between pre- and post-dam periods streamflow patterns have changed markedly Peak flow no longer occurs early in the growing season and consequently is out of phase with the vernal growth pattern typical of floodpla in trees A larger proportion of the annual flow is now released in the non-growing season mont hs and therefore is unavailable for growth Now flow in Ju ne is usually less than it was du ri ng the drought years of the 1930s River flow data indicate a general lowering of the spring and ea rly summer water table since Garr ison Dam
2 Flood ing has been el im inated on terraces greater than 2 m above mean river level thus decreasing the moisture available to floodplain ecoshysystems at the start of the growing season The accompanying deposishytion of nutrient-rich si It has also ceased
3 Both erosion and deposit ion rates by the river have decreased subshystantially since Garr ison Dam I n effect river meandering has all but ceased Accretion rates have fallen to 1 percent of their pre-dam level and erosion rates to 25 percent of pre-dam levels The net effect was a widen ing of the river channel by erosion on both banks and little concurrent deposition
4 Results showed that decreases in radial tree growth in the post-dam period were not uniform throughout the floodplain but depended on species and location with respect to the river Trees on terraces at t he edge of the floodp ~ ain that received concentrated runoff from upland ravines (for example bur oak) and those with deep root systems (for example cottonwood) on low terraces close to the water table have been least affected by the altered hydrologic regimen Growth of cotshytonwood and bur oak on reference sites unaffected by damming of the Missouri River increased significantly in the post -dam period The most pronounced decrease in tree growth (for example boxelder American elm) occurred on higher terraces that received little or no upland runoff
5 Lack of flooding and a lowered spring water tab le are implicated in the decline of radial tree growth For example with a lower spring
water table the roots of established trees may no longer extend t o the cap illary f ringe Thus growth might depend more upon spr ing A E than on groundwater This shift in response from one source of moisshyture to another (from groundwater to precip itat ion) was ex hibited in the regression ana lysis of cottonwood growth chrono logies The ab shysence of overbank flooding may have had a greater effect on the growth of trees (for example American el m) on dry upper t erraces well above the water table that did not receive upland runoff A Ishythouglh these terraces were only infrequently flooded before 1953 the supplemental moisture provided by floods just before the onset of growth could have augmented growth for several consecutive years and compensated for years of low predpitation
6 Lack of accretion by the r iver in the post-dam period spells a decline in the proportion of the floodplain forest occup ied by cottonwoodshywillow forests The decline is already observable and will continue until in a century or more cottonwood forests will occupy only a fraction of their current proportion Cottonwoods will be relegated to a river marg inal position being especially prominent behind wingshydikes
7 We believe that the decline in cottonwood abundance and ubiquity will be accompanied by a decline in American elm because of a rapidly declining growth rate almost complete absence of seedling survivorshyship on most sites and the impending effects of Dutch elm disease Some remnant elm stands may persist on sites with an artificially elevated water table near the Oahe Reservoir and on high terraces that receive upland runoff Boxelder which exhibited greater survivorship but was still underrepresented in the sapling size classes may exhibit a slower decline Although growth rate of green ash has also declined it exhibits balanced population structure and will likely increase its abundance and ubiquity in coming decades Thus the current obsershyvations foretell a drastic decline in cottonwood and elm abundance a moderate-to-slow decline in boxelder prominence and an increase in green ash Overall the aipha and beta diversities of the forest overshystory should decline
8 Clearing for agriculture has claimed slightly over half (55 percent) of the original floodplain forest The rate appears to have accelerated during the last decade because of opportunities to irrigate croplands Should these trends continue future native forests may be mai ntained
37
38
only in protected areas such as the Riverdale and Oahe Game Manageshyment Areas and in private reserves (for example Cross Ranch The Nature Conservancy) However forests protected from clearing and other disturbances remai n unprotected from the ecological effects of altered river hydrology
9 The effects of altered hydrology on floodplain ecosystem dynamics need further study on other forested floodplains particularly where pre-dam biological information is available or where nearby wild rivers could serve as good controls Where significant effects of floodplain protection are suspected an index of impact could be der ived by comparing pre-dam gauge height (flood frequency) and seasonal flow patterns to pre-dam patterns Greater departure from pre-dam patshyterns would suggest greater potential impact on natural floodplain ecosystems
LITERATURE CITED
Baker F S 1949 A Revised Tolerance Table Journal of Forestry 47 179-81
Baxter R M 1977 Environmental Effects of Dams and I mpoundshyments I n Annual Review of Ecology and Systen7atics Vol 8 R F Johnson editor pp 255-83 Palo Alto Californ ia Annual Rev iews Inc
Bedinger M S 1971 Forest Species as Indicators of Flooding in the Lower White River Valley Arkansas Professional Paper 750-C US Geological Survey US Department of the Interior Washington
Bell D T and R del Moral 1977 Vegetation Gradients in the Streamshyside Forest of Hickory Creek Will County Illinois Bulletin Torrey Botanical Club 1 04 127-35
Bluemle J P 1971 Geology of McLean County North Dakota North Dakota Geological Survey Bulletin No 60 Pt 1 North Dakota State Water Conservation Commission Grand Forks
Brockman L C et aI 1974 Soil Survey of A1cLean County North Dakota Soil Conservation Service US Department of Agriculture Wash ington
Brown D E C H Lowe and J F Hausler 1977 Southwestern R iparshyian Communities Their Biotic Importance and Management in Arizona In Importance Preservation and Management of Riparian Habitats pp 201-11 General Technical Report RM-43 US Forest Service US Deshypartment of Agriculture Washington
Burgess R L 1964 Ninety Years of Vegetational Change in a Townshyship in Eastern North Dakota Proceedings North Dakota Academy of Science 18 84-94
Campbell C J and W Green 1968 Perpetual Succession of StreamshyChannel Vegetation in a Semiarid Region Arizona Academy ofScience Journal 5 86-98
39
40
Carlson C G 1973 Geology of Mercer and Oliver Counties North Dakota North Dakota Geological Survey Bul letin No 56 Pt 1 Nort h Dakota State Water Conservation Commission Grand Forks
Christensen N Lt 1977 Changes in Structu re Pattern and Diversity A ssociated with Climax Forest Maturation in Piedmont North Carolina American Midland Naturalist 97 176-88
Clayton L 1962 Glacial Geology of Logan and McIntosh Counties North Dakota North Dakota Geological Su rvey Bulleti n No 37 North Dakota State Water Conservation Commission Grand Forks
Everitt B L 1968 Use of the Cottonwood in an I nvestigation of the Recent History of a Floodplain American Journal ofScience 266417shy39
----- 1980 Ecology of Saltcedar-A Plea for Research Environshymental Geology 377-84
Fenneman N M 193 1 Physiography of the Western United States New York McGraw-Hili Book Co
Fritts H C 1976 Tree Rings and Climate New York Academic Press Inc
Fritts H C J E Mosimann and C P Botroff 1969 A Revised Comshyputer Program for Standardizing Tree-Ring Series Tree-Ring Bulletin 29 15-20
Gary H L 1965 Some Site Relations in Three Floodplain Communishyties in Central Arizona Arizona Academy of Science Journal3(4) 209shy12
Grannemann N G and J M Sharp Jr 1979 AHuvial Hydrogeology of the Lower Missouri River Vaey Journal of Hydrology 4085-99
Greenman D W 1953 Reconnaissance of the Missouri River Pumping Units Between Garrison Dam and Bismarck North Dakota Unpublished paper compiled as part of a US Department of the Interior program for development of the Missouri River Basin Water Resources Division US Geological Survey US Department of t he Interior Washington
Johnson W C R L Burgess and W R Keammerer 1976 Forshyest Overstory Vegetation and Environment on the Missouri River Floodplain in North Dakota Ecological Monographs 4659-84
middot J 1 f Lf
Harcombe P A and P L Marks 1978 Tree Diameter Distributions and Replacement Processes in Southeast Texas Forests Forest Science 24 153-66
Hayes F A and J H Stoeckler 1935 Soil and Forest Re lat ionsh ips of the Shelterbelt Zone I n Possibilities of Shel terbelt Planting in the Plains Region pp 111-15 Special Bulletin US Forest Service US Department of Agricu Iture Ilash ington
Helwig J T and K A Council editors 1979 SAS Users Guide Rashyleigh North Carol ina SAS I nst itute Inc
Hibbard E A 1972 Vertebrate Ecology and Zoogeography of t he ~issouri River Val ley in North Dakota PhD dissertation North Dashykota State University Fargo
Hollander M and D A Wolfe 1973 Nonparametric Statistical Methods New York John Wi ley and Sons
Keammerer W R W C Johnson and R L Burgess 1975 Floristic Analysis of the Missouri River Bottomland Forests in North Dakota Canadian Field-Naturalist 895-19
Kosier J A 1979 Regulating Critical Riparian Lands A Cha llenge in I ntergovernmental Cooperation I n Strategies for Protection and Management of Floodplain Wetlands and Other Riparian Ecosystems R R Johnson and J F McCormick editors pp 332-35 Symposium Proceedings December 11-13 1978 Calloway Gardens Georgia
Kroodsma R L 1970 North Dakota Species Pairs I Hybridization in Buntings Grosbeaks and Orioles PhD dissertation North Dakota State University Fargo
Kuchler A W 1964 Potential Natural Vegetation of t he Contermishynous United States (map) Special Publication American Geograph ical Society INew York
Kujawa M 1974 Plankton Studies on a Recently I mpounded Resershyvoir Journal of Environmental Health 37 252-55
41
42
Kume J and D E Hanson 1965 Geology and Water Resources of Burshyleigh County North Dakota North Dakota Geologicall Survey Bulletin No 42 Pt 1 North Dakota State Water Conservation Commission Grand Forks
Lemke R W and R B Colton 1958 Summary of the Pleistocene Geology of North Dakota In Midwestern Friends of the Pleistocene Guidebook 9th Annual Field Conference Miscellaneous Serial No 10 North Dakota Geological Survey Grand Forks
Lemke R W et aI 1965 Quaternary Geology of the Northern Great Plains In The Quaternary of the United States H E Wright Jr and D J Frey editors pp 15-27 Princeton New Jersey Princeton Univershysity Press
Leopolld L B M G Wolman and J P Miller 1964 Fluvial Processes in Geomorphology San Francisco W H Freeman
McKenzie M A 1936 Flood Injury to Trees Science 83(2154) 412-13
Meinzer O E 1927 Plants as Indicators of Groundwater Water Supply Paper 577 US Geological Survey US Department of the Interior Washington
Meyer H A 1952 Structure Growth and Diameter in Balanced Uneven-Aged Forests Journal of Forestry 5085-92
Parton W J and G S Innis 1972 Some Graphs and Their Functional Forms Technical Report No 153 Natural Resource Ecology Laborashytory Colorado State University Fort Collins
Pitt M D and H F Heady 1978 Responses of Annual Vegetation to Temperature and Rainfall Patterns in Northern California Ecology 59(2) 336-50
Randich P G and J L Hatchett 1966 Geology and Groundwater Reshysources of Burleigh County North Dakota Part II Groundwater Re-shysources North Dakota Geological Survey Bulletin No 42 North Dakota State Water Conservation Commission Grand Forks
Ridley J E and J A Steele 1975 Ecological A spects of River Imshypoundment In River Ecology B A Whitton editor pp 565-87 Berkeley and Los Angeles University of California Press
Robertson P A G T Weaver and J A Cavanaugh 1978 Vegetation and Tree Species Patterns Near the Northern Term inus of the Southern Floodplain Forest Ecological tllonographs 48249-67
Schumm S A 1969 R iver Metamorphosis American Society of Civil Engineers Journal Hydraulics Division 95(HY1) 254-73
Stearns F W 1949 liN inety Years Change in a Northern Hardwood Forest in Wisconsin Ecology 30350-58
Stokes M A and T L Smiley 1968 An Introduction to Tree-Ring Dating Chicago University of Chicago Press
Stout H R et aI 1974 Soil Survey of Burleigh County North Dakota Soil Conservation Service US Department of Agriculture Washington
Swift E 1948 Wisconsin Deer Damage to Forest Reproduction SurveyshyFinal Report Publication 347 Wisconsin Conservation Department Madison
Thornthwaite C W and J R Mather 1957 I nstructlions and Tables for Computing Potential Evapotranspiration and Water Balance Pubshylications in Climatology 10 181-311
Tukey J W 1977 Exploratory Data Analysis Reading Massachusetts Addison-Wesley Publishing Co
US Army Corps of Engineers Omaha District 1980 Personal comshymunication
US Geological Survey US Department of the Interior 1928-1 977 Water Resources Data for North Dakota 1928-1977 North Dakota State Geological Survey Bismarck
US Weather Bureau 1935-1974 Climatological Data North Dakota Annual Summary 1935-1974 Washington
43
44
Weiser P K 1975 Soil Survey of Oliver County North Dakota Soil Conservation Service US Department of A gricultu re Washington
Weist W G Jr 1971 Geology and Ground-Water System in the Gila River Phreatophyte Project Area Graham County Arizona Gila River Phreatophyte Project Professional Paper 655-D US Geological Survey US Department of the Interior Washington
Wells P V 1965 Scarp Woodlands Transported Grassland Soils and the Concept of Grassland Climate in the Great Plains Region Science 148 246-49
Wilhelm F J ~ 978 Soil Survey of Mercer County North Dakota Soil Conservation Service US Department of Agriculture Washington
Wolman M G and L B Leopold 1957 River Floodplains Some Obshyservations on Their Formation Professional Paper 282-C 37 -107 US Geological Survey US Department of the Interior Washington
Yeager A F 1935 Root Systems of Certain Trees and Shrubs Grown on Prairie Soils Journal of Agricultural Research 51 1085-92
Yeager L E 1949 Effect of Permanent Flooding in a River Bottom Timber Area Illinois Natural History Survey Bulletin 2533-65
FIGU RES
FIG
UR
E 1
L
oca
tio
n a
nd N
um
ber
of
Stu
dy
Site
s in
No
rth
Dak
ota
Wa
tfo
rd
Cif
y
o B
1
6
32
4
8
Sca
le
(km
)
Pri
mar
y st
udy
area
is
betw
een
Gar
riso
n D
am a
nd O
ahe
Res
ervo
ir T
he L
ittl
e M
isso
uri
Riv
er r
efer
ence
sit
e is
wit
hin
the
The
odor
e R
oose
vel
t N
atio
nal
Par
k
and
the
scar
p w
oodl
and
refe
renc
e si
te i
s w
est
of P
rice
N
orth
Dak
ota
Sta
nd
~
-J
nu
mbe
rs a
re t
hose
of
John
son
Bur
gess
an
d K
eam
mer
er [
1976
]
~
00
~
c o o CD
~
CD
Q
en
~
CD -Q) E
o 0
J U
FIG
UR
E 2
M
on
thly
Str
eam
flo
w (
19
28
-1 9
77
) fr
om
th
e B
ism
arck
Gau
ging
Sta
tion
on
th
e M
isso
uri
Riv
er
2300TI-~r-~or--r---------r----~--------r----~----r-------------r---~----~----~--~----~
112~
1150
5H
19
44
23
00
In~
U5
0
51~
Year
JI)
In
In
N
19 4
5
194
6
~
25
00
c 0 0 Q
) 172~
I
~
II~O
I fh
~
Q)
~7~
Q) E
0 0
~ ~h
~
I I
I1
96
2
19
63
1
96
4
196~
19
68
1
96
7
19
68
1
96
9
19
70
19
71
19
72
1
97
3
19
74
1
97
5
19
76
1
97
7
FIG
UR
E 2
(co
nti
nu
ed
)
~
(J
Yea
r
S
ou
rce
US
G
eolo
gica
l S
urv
ey
19
28
-19
77
T
he
pri
mar
y gr
owin
g se
aso
n m
on
ths
(May
Ju
ne
an
d J
uly
) ar
e re
pre
sen
ted
by
bla
ck
bars
G
arri
son
Dam
was
co
mp
lete
d i
n A
pril
19
53
S
trea
mfl
ow
is
used
her
e in
stea
d o
f ga
uge
hei
gh
t si
nce
the
latt
er d
ata
wer
e n
ot
avai
lshy
~
able
fo
r so
me
yea
rs
Th
ere
was
usu
ally
a s
tro
ng
co
rrel
atio
n b
etw
een
gau
ge h
eig
ht
and
str
eam
flo
w (
for
exam
ple
fo
r th
e m
on
th o
f (0
O
cto
ber
19
72
R
2 =
09
98
7
Y =
42
81
7x
-2
32
02
)
(J1
o
F
IGU
RE
3
Str
ea
mfl
ow
fo
r Ju
ne a
nd F
eb
rua
ry 1
928-
1977
at
the
Bis
mar
ck G
augi
ng S
tatio
n o
n th
e M
isso
uri
Riv
er
19
82
- ~ rt) E
-
14
16
~
V
I
r
June
S
tre
am
flo
w
~
0 J u ~
85
0
lt
W
0
en
28
3
192
8
19
34
1
94
0
19
46
19
52
1958
1
96
4
1970
1
97
6
YE
AR
CJ1 ~
- ~ rt) E - ~ o J
LL ~
ltt w
a
Ishy (f)
991
70
8
42
5
142
FIG
UR
E 3
(co
ntin
ue
d)
Fe
bru
ary
S
f re
am
flo
w
19
28
1
93
4
19
40
1
94
6
19
52
1
95
8
19
64
1
97
0
YEA
R V
erti
cal
line
indi
cate
s th
e ye
ar t
hat
Gar
riso
n D
am w
as c
ompl
eted
S
ourc
e U
S
Geo
logi
cal
Sur
vey
I 19
28-1
977
19
76
60
40
20
FIGURE 4 Percent Chance of Overbank Flooding at Different
Terrace Elevations Based on the Relationship Between Maximum Gauge Heights and Known Terrace Elevations
100~----------------------------------------------
80 pre- damD
()
z Ci ~l post-dam0 0 -l lL
-l laquo gt z z laquo LL 0
LLJ U Z laquo L u ~ 0
20 30 4 0 50 60
TERRACE ELEVATION
(meters above mean river level)
Source us Geological Survey 1928-1977 (Bismarck gauging station on the Misshysouri River)
52
00 10
a
IJJ
03
~-
ltE
~~
~I UJ
J 1
5
-m
~ ~
21
a
W
C
2
7
FIG
UR
E 5
G
rou
nd
wat
er a
nd S
trea
mfl
ow
Dat
a (1
97
1-1
97
3)
fro
m t
he
Mis
sour
i R
iver
nea
r B
ism
arck
Str
eam
flow
Wat
er T
able
~
r-
~
1
I I
I
J
I
I
I
II
1 J
11
I
IJ
_
shy
II
I
~
M
J J
J
M J
J
M J
J
I I
I 19
71
1972
19
73
MO
NT
H
AN
D
YE
AR
(J)
1415
~
0
fTI
~ 1132 raquo
~
84
9
r o 5
6 6 ~
shy
3 2
83
~
USG
S te
st w
ell
no
138-
080-
08-A
BA
1
loca
ted
appr
oxim
atel
y 1
km f
rom
the
Mis
sour
i R
iver
and
app
roxi
mat
ely
2 km
sou
th o
f B
ism
arck
P
rim
ary
grow
ing
seas
on
mon
ths
of
May
Ju
ne
and
July
are
rep
rese
nted
by
M
JJ
Str
eam
flow
dat
a fr
om B
ism
arck
C
Jl ga
ugin
g st
atio
n S
ourc
e U
S
Geo
logi
cal
Sur
vey
192
8-19
77
w
E E
I tshy~ 0 a ()
J ~ gt z z ~
54
FIGU RE 6 A merican Elm Chronologies (1 928-1 977)
from Stands 12 13 19 and 16
30
25
14
12
10
20
15
10
05
5 0
40
30
UNSTANDARDIZED
YEAR
American EI m Stand 12 1 age=80
American Elm Stand 13 i aoe=135
American EI m Stand 19 i age=120
American Elm Stand 16 i age=120
1976
-shyE E-
12
10
08
06
12
10
0middot8
12 10
08 06
FIGURE 6 (continued)
1928
STANDARDIZED
1940 1952
YEAR
American Elm Stand 12 x age=8
American Elm Stand 13 x age=135
Amer ican Elm Stand 19 i age=120
1964 1916
Figures on left are unstandardized (long-term trends not removed by standardizashytion) figures on right have been standardized Vertical lines indicate the year that Garrison Dam was completed
55
56
FIGURE 7 Bur Oak Chronologies (1928-1 977) from Stand 16
and the Scarp Woodland Reference Site
UNSTANDARDIZED
20
18
E E
16
I tshy~ 0 a C)
Bur Oak J Scarp Woodlandlaquo ) x oge= 120z
1 8z laquo
16 ( I
Bur Oak Stand 16
X age=120
14
1928 1940 1952 1964 1976
YEAR
FIGURE 7 (continued)
STANDARDIZ ED
12
10
- 08 E Bur Oak E- 06 Stand 16
I X age=120 ~ 0 a () Bur Oak J
110 Scarp Woodland ~ gt x age= 120 z z 105 ~
100
09gt
090
1928 1940 1952 1964 1976
YEAR Figures on left are unstandardized figures on right have been standardized Vertical lines indicate the year that Garrison Dam was completed
57
-E E
25
c toshy 23 ~ 0
21a ()
- 19 ~ ~ 17Z Z ~
en ~
E 256
~ 199 0 J LL 142 ~ ~
85W a Ishy 28en
58
FIGURE 8 Cottonwood Chronology (1928-1977)
from the Litt~e Missouri Reference Site
1928
1928
UNSTANDARDIZED
1940 1952
YEAR
1952
YEAR
Cottonwood Little Missouri
i age-IOO
1964 1976
Little Missouri
1964 1976
FIGURE 8 (continued)
STANDARDIZED
Cottonwood E E- 1 2
Little Missouri
x age= 100 c Ishy~ 10 0 a ()
08 ~ ltt =gt Z 06 Z ltt
Unstandardized chronology is top left standardized on right Average streamflow for April to July (1935-1977) for the Little Missouri River is shown bottom left Vertical lines indicate the year that Garrison Dam was completed Source US Geological Survey 1928-1977 (Watford City gaugi ng station)
59
E E
I Ishy~ o a lt- J ltt gt z z ltt
60
FIGURE 9 Cottonwood Chronologies (1928-1977) f rom Stands 5 and 14
6 0
50
40
3 0
20
10
30
2 5
20
1 5
1928
UNSTANDARDIZED
1940 1952
YEAR
Cottonwood Stand 5
c age=80
Cottonwood Stand 14
x age= faa
1964 1976
13
11
-E 0 9
E- 07
05
12
10
08
06
FIGURE 9 (continued)
STANDARDIZED
1940 1952
YEAR
Cotton wood Stan d 5
x age=80
Cottonwood Stand 14
x age=IOO
1964 1976
Figures on left are unstandardized figures on right have been standardized Vertical lines indicate the year that the Garrison Dam was completed
61
C)
f)
F
IGU
RE
10
S
moo
thed
Pio
ts o
f S
prin
g A
E V
ersu
s Y
ear
and
Spr
ing
(May
Ju
ne
July
) S
tre
am
flo
w V
ersu
s Y
ea
r
AE
Str
ea
mfl
ow
83
76
2
96
E
70
2
89
(J -
64
W
lt
t 5
7
~
r
v
shy
28
3
27
7
51
2
71
44
~
-
2 6
4
25
8
19
28
1
93
4
19
40
1
94
6
19
52
1
95
8
19
64
1
97
0
197
6
YEAR
Ver
tica
l li
ne i
nd
icat
es t
he y
ear
that
Gar
riso
n D
am w
as c
om
ple
ted
(J)
-t
n
fTI
lgt
~
r 0 ~
0 c 3 ~
en
64
FIGUR E 11 Results of Stepwise [MAXR Helwig and Council 1979]
Multip le Regression Analysis of Cottonwood from Stands 5 and 14 for Pre-Dam (1928-1952) and Post-Dam (1953-1977) Periods
Cottonwood Stand 5 CJ) t-Z 10
Pre -d am U w
5li ~ w 0 0 U
-5 Z Q -10 CJ) CJ)
AMJJ AMJJ AMJJ AMJJ AMJJ AMJJ ASOW V-I Y-I V-Ia () LLJ
Post-dam5 0 a
2 5 0 UJ N 0 0 0 a lt - 2 5 0 Z
~ -50
en PR IOR
FLOW PPT AE TEMP GROWTH
FIGURE 11 (continued)
(f) ~ Z 10 LLJ U 5ii ~ 0 0 0
-5 Z 0
-10 () () UJ a C)uJ 10 a
50 UJ N 0 0 ~ -5 ~ 0 Z -10 ~ (f)
Cottonwood Stand 14
Pre- dam
AMJJ AMJJ AMJJ AMJJ ANJJ ASO Y-I Y-I
Post- dam
FLOW PPT AE TEMP PRIOR I I GROWTH I
Fourteen environmental variables and a variable for the previous years growth (shown in Table 6 plus fall AE) were available to the stepwise selection process Only those variables significant at the 0100 level are shown Bars represent standshyardization regression coefficient and dots above or below bars indicate levels of sigshynificance bull ~ 005 bullbull ~ 001 bullbull ~ 0001 [Fritts 1976]
65
66
FIGURE 12 Age Structure of American Elm and Boxelder Populations in Four
Treatment Stands on the Missouri River Floodplain in North Dakota
AME RICA N EL M BOX E LDER
1 1 Ii c 2
10 STAND 7 STAND 7~ gt
oil lt= GI Cl 10
E GI
Vl
5 310 10
c Ii
02 11 102 STAND 11
gtshy Ui
n II 10 10
GIE
VI
STAND
27112233445566778899111111111 2711223344556677 272727272727272727001122334 27272727272727
272727272
AGE (years) AGE (years)
FIGUR E 12 (continued)
AM ER IC AN ELM BOXELDER
Ii
i ~ iii c
0
E VI
ii ~
~ iii c
0
E
iii
~ ~
~ ~ iii c
0
bull VI
101 10
2 STAND 13
0
104
102 STAND 19
10
510
2
44 6
AVERAGE10
10
I
8899111111111 272727272727272727001122334
272727272
AGE (years)
White bars denote proportion of stems of sprout origin
STAND 13
310
210 STAND 19
0
AVERAGE
2 11223344556677 27272727272727
AGE (years)
67
68
FIGURE 13 Age Structure of American E 1m and Boxelder Populations
in Reference Stands on the Missouri River Floodplain in North Dakota
AMERICA N ELM
105 ~ I ~
S TAND 16iii 103bull I
~ gt-
I) 102~ c QJ
0
E
V) -QJ
101-
~27112233445566778899111111111 272727272727272727001122334
272727272
AGE (years)
1 m 103
I
gtshy
I) 102 c 41
0
E -QJ
101Vi
S TAND 7
103
FIGURE 13 (continued)
ro c
gt
I)
c ClI
0
E ClI
V) -
ro c
~ gt
I)
c QJ
0
E QJ
V) -
STAND 23
102
101
L 104
103
BOXELDE R
I
STAND 16
102
101
2711223344556677 27272727272727
AGE (years)
69
TABLES
TA
BL
E 1
P
reci
pita
tion
and
AE
Sta
tistic
s fo
r P
re-D
am (
19
35
-19
54
) an
d P
ost-
Dam
(1
95
5-1
97
4)
Per
iods
Mea
n M
axi
mu
m
Min
imu
m
To
tal
Ap
ril-
July
T
ota
l A
pri
l-Ju
ly
To
tal
Ap
ril-
Ju
ly
Pre
cip
ita
tio
n (
cm)
Pre
-dam
P
ost-
dam
4
03
(S
O 9
1)
382
(S
O 7
2)
23
6 (
SO
75
) 22
4 (
SO
65
) 5
16
54
7
34
4
33
0
152
27
1
27
126
AE
(cm
) P
re-d
am
Pos
t-da
m
381
(S
O 7
6)
361
(S
O 7
6)
29
6 (
SO
64
) 2
92
(S
O 6
6)
46
7
514
37
2
36
8
170
2
36
1
12
169
So
urc
e
US
W
eath
er B
urea
u C
lima
tolo
gic
al
Dat
a
-J
W
~ T
AB
LE
2
Mea
n T
ota
l R
adia
l W
ood
Gro
wth
by
Spe
cies
and
Site
fo
r 20
-Yea
r P
re-D
am (
19
35
-19
54
) an
d P
ost-
Dam
(1
95
5-1
97
4)
(Un
ad
just
ed a
nd A
dju
sted
fo
r A
ge)
Per
iods
Spe
cies
Gre
en a
sh
Am
eric
an e
lm
Box
elde
r
Co
tto
nw
oo
d
(Mis
sour
i R
iver
)
Co
tto
nw
oo
d
(Lit
tle
Mis
sour
i R
iver
)
BU
r oa
k (M
isso
uri
Riv
er)
(B2)
(B
1)
Una
djus
ted
(AB
2)
To
tal
Rad
ial
To
tall
Rad
ial
Ad
just
ed
Rad
ial
Woo
d G
row
th
Woo
d G
row
th
Woo
d G
row
th
Num
bers
of
Per
Cor
e (m
m)
Per
Cor
e (m
m)
Per
Cor
e (m
m)
Cor
es a
nd
11
93
5-1
95
4
19
55
-19
74
1
95
4-1
97
4
Sta
nds
Incl
ud
ed
t X
X
X
34
(8)
3
65
2
89
30
4
48
(7)
36
1
23
5
264
29
(7
) 4
10
26
4
316
26 (
5)
47
2
30
6
41
3
25 (
4)
38
3
35
5
47
2
20 (
3)
32
0
29
6
Wilc
oxo
n S
ign-
Ran
k Z
-Val
ues
f (B
2-A
B2
)
-32
1 (p
lt 0
001
)
-48
1 (p
lt 0
0001
)
-26
5 (p
lt 0
00
8)
-12
4 (N
S)
+2
18
(p
lt 0
03
)
(B1-
B2
)
-22
0 (
p lt
00
3)
TA
BL
E 2
(co
ntin
ue
d)
(82
) (8
1)
Un
adju
sted
(A
82
) T
ota
l R
adia
l T
ota
l R
adia
l A
dju
sted
Rad
ial
Wo
od
Gro
wth
W
ood
Gro
wth
W
oo
d G
row
th
Nu
mb
ers
of
Per
Co
re (
mm
) P
er C
ore
(m
m)
Per
Co
re (
mm
)
Spe
cies
C
ores
an
d
Sta
nd
s In
clu
ded
t 19
35-1
954
X
1955
-197
4 X
19
54-1
974
X
Wil
cox
on
Sig
n-R
ank
Z-V
alu
es
(8
2-A
82
) (8
1-8
2)
Bur
oak
(S
carp
wo
od
lan
d)
10 (
1)
171
1
93
-1
4
8 (
NS
)
See
tex
t fo
r m
eth
od
of
adju
stm
ent
Po
st-d
am g
row
th o
f b
ur
oak
was
no
t ad
just
ed b
ecau
se m
ost
cas
es s
ho
wed
an
incr
ease
in
gro
wth
b
etw
een
th
e tw
o p
re-d
am p
erio
ds
tPar
enth
eses
in
dic
ate
stan
ds
incl
ud
ed
tSo
urc
e H
oll
and
er a
nd
Wol
fe [
1973
]
(J
1
76
TABLE 3 Median Percent Change in Growth for Pre-Dam (1935-1954)
and Post-Dam (1955-1974) Periods
Species Median Percent Change
Boxelder -26 American elm -25 Green ash -18 Bur oak (Missouri River) - 9
Cottonwood (Missouri River) - 6 Cottonwood (little Missouri River) +13 Bur oak (scarp woodland) +20
Species connected by vertical lines are not significantly different (multiple comparishysons test p lt 005 Hollander and Wolfe [1973]
TABLE 4 Frequency Table (Number of Stands) of Change
in Growth Relative to Terrace Elevation
Classes of Percent Change Terrace Elevation Class t
in Growth Low Medium High
Low 0 3
Medium 3 2 0
High 0 3
Low = less than 5 percent decrease medium = 5-20 percent increase high =greater than 20 percent increase
t Low = approximately 3 m above mean river level medium = approximately 4 m above mean river level high = approximately 5 m above mean river level
TA
BL
E 5
C
hara
cter
isti
cs o
f S
tan
ds
Sam
pled
for
Tre
e-R
ing
Chr
onol
ogie
s
Sta
nd
Spe
cies
Sam
pled
S
oil
Org
an
ic
N0
3-N
N
o
and
Mea
n A
ge
Te
xtu
re
Ma
tte
r (
) (p
pm
)
Mis
sou
ri R
ive
r F
loo
dp
lain
5
Co
tto
nw
oo
d (
80
yea
rs)
sand
0
76
1
3
14
Co
tto
nw
oo
d (
10
0 y
ears
) si
lty-
cla
y 2
22
2
4
12
A
me
rica
n e
lm (
80
yea
rs)
silt
y-cl
ay
29
2
16
1
3
Am
eri
can
elm
(1
35
yea
rs)
silt
y-c
lay
26
9
43
1
9
Am
eri
can
elm
(1
05
yea
rs)
silt
4
40
3
6
16
B
ur
oa
k (1
25
yea
rs)
silt
y-cl
ay
40
7
32
Ref
eren
ce S
ites
Lit
tle
Mis
sour
i R
iver
C
ott
on
wo
od
(1
00
yea
rs)
Sca
rp w
oo
dla
nd
B
ur
oa
k (1
20
yea
rs)
So
urc
e f
or
soil
cha
ract
eri
stic
s J
oh
nso
n
Bur
gess
an
d K
ea
mm
ere
r [1
97
6]
Ele
vatio
n A
bov
e
Mea
n R
ive
middotr Le
vel
(m)
30
32
3
5
40
4
0
50
28
-J
-J
-J co
TA
BL
E 6
R
esul
ts o
f S
tep
wis
e M
ulti
ple
Reg
ress
ion
Ana
lysi
s U
sing
Tre
e-R
ing
Inde
x as
th
e D
epen
den
t V
aria
ble
an
d 1
5 I
nd
epen
den
t V
aria
bles
(C
lim
ate
Str
eam
flo
w
Pre
viou
s Y
ear
s G
row
th)
Sta
ndar
dize
d S
peci
es
Inte
rce
pt
Reg
ress
ion
Co
eff
icie
nt
Co
tto
nw
oo
d
Sta
nd 5
P
re-d
am
-27
6 +
82
8
-20
3 +
36
0
+3
33
-3
52
Pos
t-da
m
-64
8 +
16
9
+5
76
+
26
2
-37
3 +
04
2
Sta
nd 1
4 P
re-d
am
-21
7 +
41
0
+3
24
-2
48
+6
62
+0 4
7
Post
-dam
-1
5
+4
20
-5
44
+11
71
+2
99
-34
9
En
viro
nm
en
tal
Var
iabl
es
Ap
ril-
Ma
y F
low
(A
MF
L)
Ju
ne F
low
(JU
NE
F)
Spr
ing
Pre
cip
Y-l
(S
PG
P1)
S
prin
g P
reci
p (S
PG
P)
Spr
ing
AE
Y-l
(S
PG
AE
1)
June
Flo
w (
JUN
EF
)
Spr
ing
AE
(S
PG
AE
)
Spr
i ng
Te
mp
Y-l
(S
PG
T1)
F
all
Te
mp
Y-l
(F
AL
LT
1)
Pre
viou
s G
row
th (
AV
E 5
-1)
A p
ril-
May
Flo
w (
AM
FL
)
Spr
ing
Pre
cip
Y-1
(S
PG
P1)
A
pri
l P
reci
p (A
P)
S
pri
ng
Pre
cip
(SP
GP
) P
revi
ous
Gro
wth
(A
VE
14
-1)
Spr
ing
Pre
cip
Y-l
(S
PG
P 1
)
Spr
ing
Pre
cip
(SP
GP
) S
prin
g A
E (
SP
GA
E)
S
pri n
g T
em
p Y
-l (
SP
GT1
)
Fal
l T
emp
Ymiddotl
(F
A L
LT
1)
r2
F
p
08
2
162
3 0
0001
0 7
1 8
61
00
00
3
07
3
98
6
00
001
07
5 10
61
00
001
TA
BL
E 6
(co
ntin
ue
d)
Sta
ndar
dize
d S
peci
es
Inte
rce
pt
Reg
ress
ion
Co
eff
icie
nt
En
viro
nm
en
tal
Var
iabl
es
r2
F p
Bur
oak
S
tand
16
Pre
-dam
-2
814
+
38
0
Ap
ril-
Ma
y F
low
(A
MF
L)
05
2
312
0
03
+2
98
S
prin
g A
E Y
-1
(SP
GA
E 1
) +
47
9
Spr
ing
Te
mp
Y-1
(S
PG
T1)
+
35
8
Fal
l T
em
p Y
-1
(FA
LLT
l)
-49
9 S
prin
g T
emp
(SP
GT
) +
024
P
revi
ous
Gro
wth
(A
VE
16-
1)
Pos
t-dam
-4
216
+
39
5
Ap
ril-
Ma
y F
low
(A
MF
L)
077
12
06
00
00
1 +3
61
June
Flo
w Y
-1
(JU
NE
F1
) +
23
5
Ap
ril
Pre
cip
(AP
) +
417
S
prin
g A
E (
SP
G A
E )
+3
10
S
prin
g T
em
p (
SP
GT
)
Sca
rp w
oo
dla
nd
P
re-d
am
-18
9 -3
01
June
Flo
w (
JUN
EF
) 0
36
269
0
06
2 +
38
0
Spr
ing
Pre
cip
Y-1
(S
PG
P1)
+
30
3
Ap
ril
Pre
cip
(A P
) +
387
S
prin
g A
E (
SP
GA
E)
Pos
t-dam
-7
37
+34
4 Ju
ne F
low
Y-1
(J
UN
EF
1)
04
1
33
3 0
032
+
19
5
June
Flo
w (
JUN
EF
) +
227
S
prin
g P
reci
p (S
PG
P)
+04
1 P
revi
ous
Gro
wth
(A
VE
10
-1)
-J co
(co
nti
nu
ed
)
00
a
TA
BL
E 6
(co
nti
nu
ed
)
Sta
ndar
dize
d S
peci
es
Inte
rce
pt
Reg
ress
ion
Co
eff
icie
nt
En
viro
nm
en
tal
Var
iabl
es
r2
F
p
Am
eri
can
elm
S
tand
12
Pre~am
+3
69
4
+3
96
A
pri
l-M
ay
Flo
w (
AM
FL
) 0
55
3
42
00
211
-48
3 Ju
ne F
low
(JU
NE
F)
+9
89
S
prin
g P
reci
p Y
-1
(SP
GP
1)
+3
35
S
prin
g P
reci
p (S
PG
P)
-49
3 S
prin
g A
E (
SP
GA
E)
-33
8 S
prin
g T
emp
(SP
GT
)
Post~am
-13
77
-29
7 A
pri
l-M
ay
Flo
w Y
-1
(AM
F L
1)
04
7
25
5
00
6
+5
47
June
Fl o
w Y
-1
(JU
NE
F1
) -5
78
A
pri
l-M
ay
Flo
w (
AM
FL
) +
68
5
June
Flo
w (
JUN
EF
) -2
45
Fal
l T
em
p Y
-1
(FA
LL
T1
) -3
72
Spr
ing
Te
mp
(S
PG
T)
Sta
nd 1
3 Pre~am
+3
08
3
-50
0 A
pri
l-M
ay
Flo
w Y
-1
(AM
FL
1)
06
3
61
8
00
01
7
+3
13
Ju
ne F
low
Y-1
(J
UN
EF
1)
+52
1 S
prin
g P
reci
p Y
-1
(SP
GP
1)
+2
85
S
prin
g T
em
p Y
-1
(SP
GT
1)
-62
8 S
prin
g T
em
p (
SP
GT
)
Post~am
+52
51
-69
8 S
prin
g P
reci
p Y
-1
(SP
GP
1)
05
4
552
0
00
4
+1
00
9
Spr
ing
AE
Y-1
(S
PA
E1)
-3
64
Spr
ing
Te
mp
Y-1
(S
PG
T1)
-4
15
Ap
ril
Te
mp
(A
T)
TA
BL
E 6
(co
ntin
ue
d)
Sta
ndar
dize
d S
peci
es
Inte
rce
pt
Reg
ress
ion
Co
eff
icie
nt
En
viro
nm
en
tal
Var
iabl
es
r2
F
p
Sta
nd 1
9
Pre
ltlam
+
19
98
+
39
5
Ap
ril-
Ma
y F
low
(A
MF
L)
05
1 3
70
0
01
76
+
11
06
S
prin
g P
reci
p Y
-1
(SP
GP
1)
-99
4 S
prin
g A
E Y
-1
(SP
GA
E1)
-4
91
Spr
ing
Te
mp
(S
PG
T)
Pos
tltla
m
-11
34
+4
57
Ap
ril-
Ma
y F
low
Y-1
(A
MF
L1)
0
67
73
8
00
00
6 -5
44
Ap
ril-
Ma
y F
low
(A
MF
L)
+6
29
Ju
ne F
low
(JU
NE
F)
-19
7 A
pri
l P
reci
p (A
P)
+3
47
S
prin
g A
E (
SP
GA
E)
co
82
TABLE 7 Results from the Modified Regression Model
Stand Pre-Dam Post-Dam
Cottonwood 5 Streamflow A E
(0004) t (001)
14 Streamflow AE (002) (001 )
Elm 12
13
19 AE (003)
Oak 16 AE AE
(005) (0006)
Streamflow (0006)
Scarp woodland AE (005)
Growth = growing season AE and growi ng season streamflow using the G LM proshycedure in SAS [Helwig and Council 1979] Growing season is May June and July
tParentheses indicate levels of significance
TABLE 8 Missouri River Erosion and Deposition Rates at Various Time Intervals
Time Total Erosion Total Deposit ion Interval Time (yr) Erosion (ha) Rate (hayr) Deposition Rate (ha yr)
1881-1891 10 1328 133 1650 165
1891-1945 54 4648 86 5464 101
1945-1969 22 1704 77 937 43
1969-1979 10 212 21 13 13
TA
BL
E 9
M
isso
uri
Riv
er L
and
Use
Cha
nges
Sin
ce E
arly
Set
tlem
ent
Per
cen
tage
of
Cov
erag
e
Cat
egor
y T
ime
Peri
od
Pre
-set
tlem
ent
Pos
t-se
ttle
men
t
Agr
icul
ture
18
72-1
938
38
A
gric
ultu
re
1938
-197
9 18
C
otto
nwoo
d w
illo
w
lt 40
yea
rs o
f ag
e 14
3
Cot
ton
woo
d 40
-80
year
s o
f ag
e p3
10
C
otto
nwoo
d a
sh
elm
bo
xeld
er
80-1
50 y
ears
of
age
30
21
Ash
el
m
boxe
lder
gt
150
yea
rs o
f ag
e 3
10
co
w
(I)
w CJ z C ()
W (I)
l I
Q Z C
J W Z Z C ()
ac w gt ac
The Virginia Water Resources Research Center is a federal-state partnership agency attempting to find solutions to the states water resources problems through careful research and analysis Established at Virginia Polytechnic Inshystitute and State University under provisions of the Water Research and Develshyopment Act of 1978 (PL 95-467) the Center serves six primary functions
bull It studies the states water and related land-use problems including their ecological political economic institutional legal and social i mpl ications
bull It sponsors coordinates and administers research investigations of these problems
bull It collectsmiddotand disseminates information about water resources and water resources research
bull It provides training opportunities in research for future water scienshytists enrolled at the states colleges and universities
bull It provides other public services to the state in a wide variety of forms
bull It facilitates coordinated actions among universities state agencies and other institutions
More information on programs and activities may be obtained by writing or te lephoning the Center
Vi rgin ia Tech does not discriminate against employees students or applicants on the basis of race sex handicap age veteran status national origin religion or political affiliation The Un iversity is subject to Titles VI and VII of the Civil Rights Act of 1964 Title IX of the Education Amendments of 1972 Sections 503 and 504 of the Rehabilitation Act of 1973 the Age Discrimination in Employment Act the Vietnam Era Veteran Readjustment Assistance Act of 1974 Federal Executive Order 11246 Governor Robbs State Executive Order Number One and all other rules and regulations that are applicable Anyone having questions concerning any of those regulations should contact the Equal OpportunityAffirmative Action Office
Virginia Water Resources Research Center Virginia Polytechnic Institute and State University
617 North Main Street Blacksburg Virginia 24060-3397
Phone (703)961-5624

6
by water diverted across former divides Bluemle shows that the wide segments of the present trench are those that were parts of preglac ial val leys and t he narrow segments are those that were cut by water diverted across divides He also suggests that f inal diverting and assumption of the present cou rse of the Missouri did not occur until late Wisconsinan time less than 15000 years ago
The terraces along the trench were developed as the river incised itsel f below former floodplain levels leaving remnants of those floodplains Some of them are eroded bedrock surfaces mantled with glacial drift and represent f loodplains formed in reoccupied preglacial valley segshyments formed during pre-Wisconsinan glacial diversion [Carlson 1973] Other terraces are underlain by sand and gravel and resulted from glacial valley trains [Brockman et aI 1979]
The defin itive study of Missouri River terraces has not yet been made and various authors who have studied different segments of t he trench disagree on the number of terraces and their historical interpretation Kume and Hanson [1965] recognized four terrace levels in Burleigh County two high outwash terraces and two low alluvial terraces Carlson [1973] working in Mercer and Oliver counties recognized only two tershyraces an upper one that corresponded to the high outwash terraces of Kume and Hanson and a lower one that included their two lower alluvial terraces Carlson believed that the two lower terraces represent the preshydam floodplain
Post-glacial changes in the trench have not been great The floodplain was established and modified by lateral cutting of the meandering river The valley walls have been gullied by new dra inage lines eroding headward into adjacent uplands and by slopewash Wind has piled sand into dunes locally and soils have formed on the various trench sediments
III Geologic Materials of the Trench
The trench walls expose the various materials cut through by the eroding river At the top are glacial sediments (generally thin and locally lacking) including till and lesser amounts of glacio-fluvial sands and gravels loess eolian sand and glacial lake sediments ~Iost of the depth of the t rench is cut in bedrock of early Tertia ry and (in the Bismarck-Mandan area) late Cretaceous age [Kume and Hanson1965 B luemle 1971 Carlson 1973] The Tertiary units include interbedded sands silts clays shales
and lignite beds belonging to the Paleocene Cannonbal l Slope Bullion Creek and Sentinel Butte formations The late Cretaceous beds are mudstones sandy sh ales sandstones and I ign ites of the Hell Creek f orshymation
Most of the high terraces are underlain by sand and gravel and are loessshycovered in some areas but some are underlain by drift-mantl ed bedrock [Kume and Hanson 1965 Carlson 1973] The low terraces essentially the modern pre-dam floodplain are underlain by recent alluvium includshying flood overbank deposits channel deposits and natural levee deposits Overbank silts and clays compose about 90 percent of these sediments with sand and gravel of channel and levee deposits composing about 10 percent [B luemle 1971] The thickness of this Holocene component may be as much as 35 m or more but it is often difficult to distinguish from similar glacial sediments upon which it rests
IV Soils
Soils of the Missouri trench have been described in county soil surveys of McLean County [Brockman et aI 1979] Olliver County [Weiser 1975] Mercer County [Wilhelm 1978] and Burleigh County [Stout et aI 1974] The floodplain soils that support the forests of the study area are Entisols of the Typic Ustifluvent or Typic Fluvaquept subgroups The Havrelon series dominates generally comprising 50 to 75 percent of the floodplain soils It is formed from loamy alluvium on the slightly higher elevations and is calcareous and well drained It has moderate permeability high available water capacity medium natural fertility and low organic matter
Areas of sandy alluvium such as natural levees and inter-channel islands are occupied mainly by the Banks series which has moderately rapid permeability low available water capacity low natural fertility and low organic matter Clayey alluvium of floodplain depressions (mainly oxshybows) is occupied mainly by the Lallie series which has slow permeabilshyity high available water capacity low natural fertility and low organic matter
Floodplain soil profiles tend to have thin greyish A horizons no B horishyzons and C horizons that vary somewhat in texture because of alluvial stratification All horizons tend to be mildly to moderately aikaline
7
8
V Stream Hydrology
The filling of Lake Sakakawea began in November 1953 At that time the natural hydrologic regimen was replaced by a controlled-release regishymen and the river began a series of adjustments to this alteration
Two major alterations in downstream regimen could be expected to result from damming (1) reduction of peak annual flow (mean annual flood) because of impoundment of excess runoff and (2) reduction of sediment load because of sediment deposition in the reservoir from upshystream
Continuous daily discharge records from 1928 to present recorded at the US Geological Survey Gauging Station No 06342500 at Bismarck (120 km downstream from the dam) permit a comparison of the preshydam and post-dam discharge These data show no significant change in overall discharge The mean of daily discharge readings for 25 pre-dam years (water years 1928-29 to 1952-53) is 1999 cms compared to 2204 cms for 25 post-dam years (water years 1954-55 through 1978-79) This decrease in discharge because of the initial filling of the reservoir (1953shy1963) was offset by the low discharges resulting from the dry climate of the 1930s
Seasonality of discharge has changed considerably The pre-dam (1928shy1952) pattern of monthly streamflow shows peak flow occurring from Apri l to July and minimum flow occurring from December to March (Figure 2) The sharp peaks in streamflow in the spring and early sumshymer in the pre-dam period are largely absent after 1953 Overall peak flow now occurs in February and March instead of April May and June and minimum flow occurs mainly in May and September instead of January and February
Seasonal flow rates are especially different for the months of June and February (Figure 3) June streamflow in the drought years of the 1930s was much higher than June streamflow since completion of the dam Extrapolating from gauge height the spring water table on the average would be considerably lower since 1953 and the late-summer water table would perhaps be higher Therefore the period of peak flow is now out of phase with the vernal growth pattern typical of floodplain trees
Mean annual low flow (mean of the lowest mean daily discharge readings
over a number of years) has been increased by abou t 155 percent Mean annual low fl ow for the 25 pre-dam years was 405 cms compared to 1 032 cms for the 25 post-dam years The minimum annual low flow for the 25 pre-dam years was 167 cms (January 1940) compared to 372 cms (March 1955) in the 25 post-dam years an increase of about 122 percent
I n addition to these changes in flow changes in the sed iment load could also be expected Both suspended load and bed load from upstream are trapped in the reservoir Thus the water released into the trench below the dam is essentially sediment-free and able to acquire a new load from materials available in the trench Unfortunately data are not available to compare pre-dam and post-dam sediment loads
Overbank flooding is the element most obviously missing from the postshydam floodplain environment Flooding now occurs on only the lowest terraces in part as a result of local ice jams in the spring Flooding above the 2-m terrace elevation has been eliminated (Figure 4) In the past the 3-m elevation was flooded on the average of once in 35 years and the 4-m elevation approx imately once in 6 years Terrace elevations of the stands sampled ranged from 3 to 5 m above mean river level The highest stand was flooded on the average of once in 25 years Because of ice jams in the pre-dam period the above frequencies are probably low for some locales Landowners report higher flood frequencies (25 percent or greater)
The mean annual flood (mean of the highest mean daily discharge readshyings over a number of years) has been reduced by about 68 percent Mean annual flood for the 25 pre-dam years was 11064 cms compared to 3554 cms for the 25 post-dam years The maximum annual flood (highest mean daily discharge reading) for the 25-year pre-dam period was 33736 cms (April 1952) compared to 6394 (July 1975) lin the 25 post-dam years a reduction of 81 percent
VI Natural Vegetation Dynamics
The predominant vegetation of the region is mixed grass prairie [Kuchshyler 1964] Small pockets of scarp woodland occur in protected upland ravines but the most extensive forests occur on the floodplain Clearing for agricu Itu re has reduced these forests to about 50 percent of their original extent Floodplain tree species include cottonwood (Populus
9
10
deltoides) peach-leaved willow (Salix amygdaloides) boxelder (A cer negundo) green ash (Fraxinus pennsylvanica var lanceolata) A merican elm (Ulmus americana) and bur oak (Quercus macrocarpa)
Most of t he worlds fl oodp lains have been formed by the effects of deposition and overbank flow [Wolman and Leopold 1957] Deposit ion as we as erosion is dependent upon lateral m igration of the river across the floodp lain A s the r iver deposit s alluv ium on the inside of a meanshyder it erodes mater ial from the opposite bankline Overbank flow usually results from heavy spring rains combined wi th rapid snow melt Downshycutting by t he river and upbuilding of the terrace from alluvial deposishytion during f loods eventually leaves some terraces well above the active floodp lain Leopold Wol man and Miller [1964] referred to such r iver terraces as t he abandoned f loodpla in
Vegetation patterns correspond to the dynamics of deposition and eroshysion Lateral movement of the river in it iates a dynamic series of vegetashytion events As t he river meanders it erodes away estab lished banks often covered w ith fo rest vegetation in different stages of devel opment However fully exposed alluvium deposited in the inside of river curves is prime habitat fo r the establ ishment of t ree seedl ings of pioneer species (for example cottonwood peach-leaved w i llow) Of the six tree species occurr ing on the floodplain only cottonwood and willow germinate and persist under t hese conditions Cottonwood and willow are classic pioshyneer species the seeds of neither species germinate under a forest canopy or in light gaps This illustrates the importance of point bar deposition by the meander ing river in maintaining cottonwood-willow commu nities as an important and integral component of the floodplain ecosystem
If cottonwood-wi now communities remain uneroded forest s of these tree species will develop Should they be missed by t he meandering river for centuries however the overstory will be replaced by admixtures of green ash boxelder Amer ican elm and bur oak through natural successhysion Thus there is a strong positive correlation between terrace elevati on and forest successional stage Higher terraces that have escaped erosion and were exposed to fewer floods of less intensity are more likely to contain vegetation of advanced successional stages
The cessation of floodi ng and a decline in the meandering rate would have at least two major consequences (1) reduce the amount of subshystrate (freshly deposited alluvium) for the regeneration of new cott onshy
wood-wil low forests and (2) allow a greater proportion of existing forests to age and change type t hrough natura l succession The net effect would be to reduce the land area of cottonwood-will ow forest now the most extensive forest t ype in favor of forests of ash boxelder elm and oak Old cottonwood-wil low forests exhib it the greatest tree species diversity [Johnson Burgess and Keammerer 1976] and have the greatest r ichness and density of breeding birds [H ibbard 1972] T he major forest communities also exhibit divergent understory species mineral cycl ing patterns and fau na [ Kroodsma 1970 Hibbard 1972 Keammerer 1972 Keammerer Johnson and Burgess 1975]
11
12
T REE GROWTH
Research to t est t he hypothesis that alteration of the hydrologic regimen was responsible for decreased tree growth had three components First we examined the degree to which environmental variables important to tree growth had changed from pre-dam to post-dam periods Second cumulative growth of trees was compared during two 20-year periods to determine pre-dam and post-dam growth patterns Third tree-ring chronologies were constructed and the growth patterns related statisshytically to a series of environmental variables using multiple regression procedu res
I Methods
Th irteen forest stands (Figure 1) were selected for tree core sampl i ng The stands included a range of vegetation and physiographic conditions and showed little or no sign of current or past disturbance One refershyence site was located along the Little Missouri River in western Nort h Dakota with in the Theodore Roosevelt National Park (Figure 1) The Little Missouri is a free-flowing stream whose flow patterns have not been altered by flood control structures Cottonwood and willow preshydominate although green ash boxelder and American elm occur as well The Little Missouri is a much smaller river than the Missouri average flows are 1733 for the Little Missouri and 6409 cms for the Missouri [US Geological Survey 1928-1977]
A second reference site was a scarp woodland [Wells 1965] located above the floodplain (Figure 1) Vegetation was similar in composition to that of the mesic terraces of the Missouri River with bur oak green ash American elm and boxelder the dominant tree species Scarp woodland trees rely exclusively on precipitation which is concentrated in local ravines Growth of these trees should more closely ref lect patshy
terns of precipitation than floodplain trees
The reference sites were selected because they were similar to the M1isshysouri River floodplain sites in vegetation and general climatic conditions but had not undergone any major environmental modifications between pre- and post -dam periods The term reference was used rather than IIcontrol because a number of small differences existed between refershyence and treatment sites (for example 39 cm mean annual precipitation for the Missouri 37 cm for the Little Missouri)
Trees were selected for sampling if they were at least 70 years old and displayed no sign s of disease or decay Also trees were exc luded if a nearby competitor had d ied Tree cores were collected using an increshyment borer and were dried mounted and surfaced A number of cores were initially measu red with a dendrochronometer to establish a system of cross-dating to facilitate accurate measurement of the remaining samshyples [Stokes and Smi ley 1968]
Three 20-year increments of growth (two pre-dam periods 1915-1934 1935-1954 one post-dam period 1955-1974) were measured for aU cores Because diameter growth of trees usually decreases with age it was necessary to adjust the measurements of the post-dam growth to compare them to groyvth during the immediate pre-dam period when trees were younger Standard dendrochronological procedures to correct for aging [F ritts 1976] were not su itable here as none discrim inates beshytween decrease in growth due to age and decrease due to long-term envishyronmental changes (for example altered river hydrology) low-frequency trends are removed
To correct for age we adjusted (increased) postdam growth by multishyplying it by the proportional change in growth that occurred between the two pre-dam periods The proportional change or multiplier was the quotient calculated by dividing growth during the first pre-dam period (1915-1934) by growth during the second (1935-1954) Cores that showed a growth decline between the pre-dam periods were adjusted in the above manner for all species except bur oak (henceforth referred to as adjusted for age) For example a core with 50 mm and 40 mm growth respectively during the first and second pre-dam periods would result in a multiplier of 125 Therefore the growth during the post-dam period say 20 mm would be adjusted to 25 mm Our method thus assumes a uniform rate of decline in growth with age Bur oak was not adjusted because most cores were from old trees that showed small inshycreases not decreases in growth between the two pre-dam periods
Finally 90 of the cores used above in the inter-period comparisons were selected for multiple regression analysis to examine year-to-year variation in growth in relation to environment Cores were selected from stands for wh ich there were at least 8 cores per species from trees at least 80 years old except for elm in stand 16 where only 3 cores were available The number of cores per species for the Missouri River floodshyplain was 24 for cottonwood 30 for elm and 12 for oak with 8 for
13
14
cottonwood on the Little Missouri and 16 for oak in the scarp wood land
Individual ri ng w idt hs were measured for a 50-year period (1928-1 977) for each core Measurements were standard ized (converted to indices) by fitting a polynomia l curve to the data and then dividing each ring width by the corresponding curve value (henceforth referred to as standshyardized) In this way long-term trends in growth were removed (for example due to senescence) and year-to-year variation was emphasized [F ritts 1976] The computer program used in the standardization proshycedure was developed at the Laboratory of Tree- Ring Research in Tuscon Arizona [Fritts Mosimann and Botroff 1969] and adapted for use by the US Geologlical Survey Tree-R ing Laboratory in Reston Virshygin ia R ing-widtl indices for all cores from a stand were averaged by species to construct chronologies three of cottonwood (including one from the Little Missouri) two of oak (including one from the scarp woodland) and three of elm
Precipitation data were from the US Weather Bureau station at Bisshymarck To integrate temperature (energy) and moisture actual evaposhytranspiration (AE) was also calculated [Thornthwaite and Mather 1957] and used as an independent varlable in growth correlations AE was calshyculated assuming 25 cm of available water per 15 cm of soil a surface rooting zone of 12 m and equal water availability between field capacshyity and permanent wilting point (-15 bars) [Johnson Burgess and Keamshymerer 1976]
II Results and Discussion
A Environmental Variables
Primary environmental variables potentially important to tree growth during the two periods included precipitation groundwater overbank flooding and soils To determine whether low precipitation might have been responsible for the decrease in tree growth during the post-dam period Johnson Burgess and Keammerer [1976] compared average anshynual precipitation and AE for two 15-year periods 1940-1954 and 1955shy1969 They found a slight decrease in both parameters in the post-dam period We also found a slight decrease in average annual precipitation and AE for two 20-year periods and for the primary growing season months (April May June and July) although the means were not sigshynificantly different (p lt 075) and the minimum values were much
smaller in t he pre-dam period (Table 1) I t is unl ikel y that the small average decrease in AE and precipi tat ion cou ld have caused a large deshycline in growth in the post -dam period A s w ill be shown later t ree growth of one reference si te actuall y increased signi ficant ly du r ing t he post-dam period
Depth to the water table ranges from near zero to 9 m in t he study area [Greenman 1953] Water table depth changes seasonally in response t o periods of aquifer recharge and discharge (Figure 5) Rech arge occurs mainly in early spring from lateral movement of water f rom t he Missouri River at high stages (bank storage) subsurface flow from ad jacent bedshyrock above the floodplain and percolation of soil grav itational water from precipitation an9 runoff Discharge from the aquifer occurs mainly in the summer as a result of transpiration flow to the Missouri River at low stages and irrigation pumping [Randich and Hatchett 1966] The water table on terraces adjacent to rivers can respond rapidly to changes in river stage however the response decreases w it h increasing distance from the channel [Weist 1971 Grannemann and Sharp 1979]
Current re leases from Garrison Dam are related primarily to generation of electricity Peak demands occur during the coldest months and to a lesser extent the warmest months [US Army Corps of Engineers 1980] although the seasonal pattern is highly variable It is di ff icult to detershymine the effect of changing river gauge height (flow) on water table depths at all distances from the river although the greatest changes probably have occurred nearest the river channel Unfortunately we can find no data on pre-dam water table depths and seasonal fl uctuashytions in the study area and can only speculate as to p re-dam water table conditions However irrigation and seasonal fluctuation in river stage have noticeably ch anged since completion of Garrison Dam There has been increasing use of aquifers for pumped irrigation water which would have lowered the water table during the growing season
Several stands were located in areas fl100ded periodically from concenshytrated upland ru noff The highest of these (stand 16) was situated at the edge of the floodplain adjacent to the bedrock terrace Three ravines draining a large upland area empt ied into the stand According to local reports it is flooded most years in the spring at times of snow melt and heavy precipitation Moisture conditions for this stand were markedly different from terraces of similar elevation that received no concentrated runoff Not only did vegetation composition of t h is stand differ from
15
16
dr ier terraces but as will be shown later t ree growth showed distinctly different pat t erns
Soils in the study area are alluvial in or igin and high in textural va rishyability not only between but also within stands Past f loods deposited lenses of sands si Its and clays varyi ng in th ickness th roughout the floodshyplain With the cessation of flooding the deposition of silt on terraces and accompanying nutrient enrichment have been eliminated Yet the cessation of flooding also aldows for a build-up of organic matter on tershyraces where it was previously scoured and removed by flood waters Changes in soi ll characteristilcs as a result of flood cessation are most Iikely not of as immediate importance to tree growth as the alteration in the hydrologi~ regimen However soils could have had an effect on the growth response of a tree to altered moisture conditions
B I nter-Perilod Comparisons of Cumulative Growth
Average cumulative growth of trees was compared between the immeshydiate pre-dam (1935-1954) and post-dam (1955-1974) periods AI species on the Missouri River floodplain decreased in growth in the postshydam period (Table 2) comparing post-dam growth (adjusted for age) to growth in the pre-dam period The trends are very similar to those of Johnson Burgess and Keammerer [1976] even though they are based on different sets of tree cores In contrast post-dam growth of oak (unshyadjusted) and cottonwood at the reference sites was greater than growth during the pre-dam period Application of the Wilcoxon sign-rank test [Holllander and Wolfe 1973] to growth during the pre- and post-dam periods showed that the decreases on the Missouri River floodplain were statisticaHy significant for all species except cottonwood the cottonshywood reference site showed a statistically significant increase but the increase in oak growth in the scarp woodland was not significant (Table 2)
In a separate analysis the percent change between pre- and post-dam (adjusted for age) periods was computed for each core and the median percent change computed for each species (Table 3) Percentages ranged from about a 25 percent decline to a 20 percent increase Largest declines were for boxelder elm and ash with moderate decreases for cottonshywood and bur oak on the Missouri River floodplain Comparatively large increases were exhibited by the two reference sites Based on results from a mUltiple comparisons test [Hollander and Wolfe 1973] the growth
decli nes for boxelder and elm were sign ifican t ly different from the inshycreases on th e reference sites and ash was significantly different from oak o n t he scarp woodland reference site Diffe rences am ong species o n t he Missouri River f loodplain were not stat isti cally sign ificant nor were the differences for bur oak a nd cottonwood between floodp lai n and reference sites
An atte mpt was made to rel ate changes in growth to va rious envi ronshymental condi t ions such as soil cha racteri st ics and topog rap h ic positio n (for example elevation above mean river leve l) Percent change in growth of all spec ies was determ ined for each stand The stands were then ran ked into lowmediumhigh classes of change This procedure was repeated for all three so il characte ristics (ava ilable water capacity organic matter and soil texture) and for stand elevation Frequency tables were conshystructed for growth classes and the classes for each env ironmental varishyable No trends were found for t he so il character istics Terrace e levat ion versus percent change in growth however showed a dist inct trend (Table 4) On the uppermost terraces growth was little changed on t he middle terraces growth showed the greatest decline and on the lowest terraces growth decreased moderately
Trees on low terraces (2-3 m above mean river level ) which were flooded most frequently in the pre-dam period and are rarely flooded now were expected to have shown the largest decrease in growth However growth decreased more on the middle terraces than on the lower terraces The relative depth to the water table on a terrace may be more important for growth than flood frequency Trees on low terraces are closer to the water table and to the river and could more effectively utilize pulses of high flow (for example after heavy precipitat ion) compared to those of the upper terraces
Tree growth on high terraces showed the least amount of change beshytween the periods Although the water ta ble was likely at greater depths on these terraces and only occasionally accessible to t rees (even in the pre-dam period) most of these stands received additional moisture from concentrated upland runoff Many trees here showed increases not decreases in growth For example stand 16 reportedly was flooded most years by runoff from upland ravines E 1m in stand 16 showed no change in growth between pre- and post-dam periods compared to a deshycrease of 25 percent over the study area Runoff is clearly important to the growth of trees on high terraces adjacent ot the uplands
17
18
T he observed decrease in the growth of elm was not caused by Dutch elm disease since trees in the Bismarck area have been infected onl y in t he last several years Johnson Burgess and Keammerer [1976] observed a decrease in growt h of trees sampled in 1969 before the disease had spread to centra l Nort h Dakota The elms that we sampled 10 years after their study sh owed t he same magnitude of decl ine in growt h
C Patterns of A nnual Radial Tree Growth
Cottonwood elm and oak were se lected fo r multivariate analysis to examine year-to-year variation in growth in relation to environment These species were selected because each is representative of a different stage lin the development of the floodplain forest and therefore may be affected differently by the altered hydrologic regimen Also patterns of pre- and post-dam growth differed among these species Percent change in the growth of bur oak and cotton was the smallest between the two periods whereas elm showed a large decrease in growth in all but the most mesic stands
Seven tree-r ing chronologies were constructed from stands along the Missouri (two from stand 16) and two chronologies were constructed for the reference sites (Table 5) Both unstandardized and standardized chronologies were constructed and smoothed [Tukey 1977 3RSSH 3RSSH3] for each site except for elm in stand 16 where just the unstandshyardized chronology was used (Figures 6 through 9) Low growth during the 1930s (especially 1936-1937) in 1946 and in 1961 was common to all of the tree-ring chronologies These were periods of low spring streamflow and AE (Figure 10) During the pre-dam period most chronshyologies exhibited two peaks in growth between 1938 and 1944 I n the post-dam period most chronologies showed peak growth in 1965 coinshycident with high spring AE Thus t here was a close correspondence beshytween macroclimate and the growth of floodplain trees
But perhaps of more significance were the years 1952 and 1955 In April of 1952 one of the largest floods on record for the Missouri River inunshydated the entire floodplain It was however a year of low AE All chronshyologies except those from stand 13 (Figure 6) and the scarp woodland showed high growth in 1952 This illustrates the compensating effect that overbank flooding had on tree growth in years of low AE In 1955 t he reverse conditions prevailed spri ng AE was high while streamflow (releases from the dam) was low Growth in 1955 for all chronologies
except in stands 13 (Figure 6) 16 (Figure 7) and t he scarp woodland was low wh ich ind icates the effect of low streamflow on growth The growth of scarp woodland trees not influenced directly by streamflow generally followed A E patterns between 1928 and 1977
The unstandardized series for elm sites that did not receive concentrated upland runoff (stands 12 13 and 19) exhibited a systemat ic downward trend in growth rate through the post-dam period (Figure 6) wh ich matched the general pattern of elm growth decline discussed ear lier In contrast the unstandardized chronology for elm in stand 16 which conshytinued to receive upland runoff since construction of the dam showed no systematic long-term decline in growth during the post-dam period and therefore was no~ standardized This re-emphasizes the importance of topographic position on the magnitude of the growth decline of elm and other species during the post-dam period
The cottonwood chronology from the Little Missouri reference site (Figshyure 8) showed similar trends in growth to that of cottonwood on the Missouri River (Figure 9) with lowest growth also occurring in the 1930s 1946 and 1961 I n contrast to the cottonwood chronology from stand 14 (Figure 9) the unstandardized chronology from the Little Misshysouri showed no systematic decl ine in growth Trends in the Little M isshysouri streamflow data generally matched cottonwood growth patterns (Figure 8)
D Multiple Regression Analysis
Fourteen environmental variables (fall AE plus those shown in Table 6) considered to be important for tree growth during certain months and seasons (for example June flow) were used in stepwise multiple regresshysion models A fifteenth variable tree growth during the previous year was included because growth in one year may strongly affect growth in the following year (serial correlation Fritts 1976] Thus tree-ring index was the dependent variable and the 15 aforementioned factors were independent variables Regressions were determined separately for each stand for pre-and post-dam periods
Several streamflow parameters correlated positively in the mUltiple regression models with annual patterns of cottonwood growth in the pre-dam period (Figure 11) Apri l-May flow was important in models for both stands 5 and 14 In addition spring precipitat ion and spring
19
20
preCIpitation in the previous year (Y-1) were posi t ively correlated in models for both stands The ana lysis also indicated that growth may be suppressed when April precipitation is high (negatively correlated with growth Figure 11) because it may pro long saturated so il condi tions (low oxygen) after March -April flood s High June fl ow (negatively corshyrelated Figure 11) flooded low terraces near the river such as stands 5 and 14 or ra ised the water table excessively during this important growing season month and therefore may have been responsible for deshycreased stem growth by lim iting root oxygenation High June f lows were common in the pre-dam period (Figure 2)
Correlation patterns for cottonwood shifted markedl y from streamflow and spring precipitation in the pre-dam period to AE and temperature in the post-dam period (Figure 11) Of the streamflow parameters only June flow was positively correlated with growth (stand 5) in the post-dam period Thus very high flows in June in the pre-dam period could have reduced overall growth but h igh flows within a much lower range in the post-dam period (Table 3) could have been benef icial Growth in both stands was positively correlated with spring AE and spring tempershyature in the previous year and negatively correlated with fal l temperature in the previous year Low fall temperature in the previous year would have resulted in greater soil moisture storage over the w inter The negashytive correlation with spring precipitation in stand 14 appears to be spurshyious a situation not uncommon in the application of multivariate techshyniques to ecological data [Pitt and Heady 1978] Overall the general lack of correlation with streamf1low suggests that moisture su pplied by the river is now less important to the growth of cottonwood in t he postshydam period
Cottonwood presence has been used as an indicator of a high water t able since it tends to be phreatophytic [Meinzer 1927 ] Hayes and Stoeckler [1935] classified cottonwood as a shallow-rooted t ree laquo 2 m) however its roots may ex tend to much greater depths especially on floodplains where the process of terrace development continually buries the trunks of trees [Everitt 1968] Older cottonwoods that grow on terraces 3 m above mean river level yet that germinated on low terraces just above river level may have roots that extend to the original depth of rooting
With the alteration in flow regimen especially during the growing seashyson there has l ikely been a corresponding change in depth to water table For example with a lower spring water table the roots of trees may no
longer extend to the capillary fri nge thus growth might depend more on surface soil moisture from rai nfa ll than on groundwater T his shift in response from one source of moisture to another indicated t hat the dam has indirect ly affected cottonwood water rel ations Cottonwood was perhaps less affected by altered streamflow t han other species beshycause of its deep root system proximity to the river where the water table was most accessible and possession of a root system more responshysive to changes in water su pply
Most positive correlations with bur oak growth in stand 16 during the pre-dam period were with variables of the previous year including growth temperature and AE (Table 6) Regression coefficients for the post-dam period in c r~ased considerably positive correlations were for current year precipitation AE and temperature in the spring The reshygression coefficients for the scarp woodland models were low (036 041) and are therefore not discussed With respect to the observed positive correlation between oak growth and streamflow variables it should be recalled that post-dam streamflow was mainly a reflection of releases from the dam However high streamflow events were also caused lin part by runoff from short heavy rains or rapid snowmelt The frequency of these events may have been independent of total monthly precipitation For example total monthly precipitation does not indicate whether there were many days of light rain or a few days of heavy rain with the rest of the month dry For these reasons the relationsh ip between oak growth and streamflow was only correlative and not causal
Regression coefficients for American elm were higher than the scarp woodland oak values but still considerably less than those of the cottonshywood models Patterns of correlation shown by at least two of the three elm stands during the pre-dam period were positive correlation with April-May flow and spring precipitation in the previous year and negative corre1lation with spring temperature The patterns are decidedly different in the post-dam period April-May flow was negatively correlated and June flow was positively correlated with growth However there was little pattern among stands with respect to the numerous other variables included in the regression models The correlation pattern for elm apshypears to be high Iy variable among sites and between periods and little can be generalized from the multiple regression analyses
The chronologies were also used in a reduced model growth = sp ring AE and spring streamflow in a linear modeling procedure [Helwig and
21
22
Counci l 1979] to more clea rly defi ne the contribut ions of these environshymental facto rs to t ree growth (Table 7) The results re-emphasize the shift in correlation between the periods from streamflow to AE for cotshytonwood Bur oak growth correlated with A E in the pre-dam period yet was more strongly correlated with AE and streamflow in the postshydam period For American ellm correlations with growth in the reduced model were weak one significant correlation wi th AE occurred in one elm chronology in the post-dam period
Separate regression analyses were made for the Little Missouri cottonshywood chronology corresponding to the pre- and post-dam periods on the Missouri In the 15-variable stepwise regression procedure (using Little M issou ri s~reamflow data from 1935-1977) there were no major differences in the variables selected for either pre- or post-dam period models Using the reduced model growth = spring A E and spring streamshyflow (Little M issouri) there were again no shifts in correlations between the two periods This is in distinct contrast to the shifts lin correlations observed for cottonwood in stands 5 and 14 on the Missou ri River where the hydrologic regimen has been altered by Garrison Dam
LAND USE AND RIVE R HYDROLOGY
Johnson Burgess and Keammerer [1976] expected that because of reshyduced spring flooding (lower peak flows) and bank stabil ization the rate of river meandering had slowed since construct ion of the dam T his hypothesis is evaluated in this section by analyzing historic and present river meandering rates Also in this section the rates and di rections of land use change since initial settlement are analyzed and di scussed Such an analysis is important since current vegetation patterns are closely linked to past land use
I Methods
A River Meandering Rate
Historic and recent rates of meandering of the Missouri River were detershymined from channel change maps within the study area Positions of the river over time were transferred to a common base map at a scale of 124000 Several sources of linformation were used General Land Office summary records describe the position of the river channel f rom 1872 to 1881 An additional set of archival maps was prepared in 1891 by the Missouri River Commission The aerial photographic record of the study area began in 1938 Photographs recording channel position were available for several time periods up to the present Additional informashytion on pre-dam channel position was available from maps prepared by the US Army Corps of Engineers in 1945
The pre-dam meandering rate was determined from channel positions in 1881 1891 and 1945 From the common base maps an electronic digitizer was used to determine the amount of eroded and deposited land in each time interval This total area was divided by the number of years in the time interval to compute average annual erosion and deposishytion for the period Post-dam meandering rate was determined by comshyparing the position of the river compiled from US Geological Survey photographs (1969) to current (1979) channel as shown by Corps of Engineers photographs Meandering rates were independently determined for the period 1938-1972 by the Corps wh ich used aerial photogramshymetric techniques and range line surveys
Also field surveys were conducted to assist in mapping historic ch annel positions Five to 10 cottonwood trees on each terrace level on several
23
24
large meanders in the study area were cored and aged By p lotting t ree ages fo r a given terrace isochro nes or age contours could be d rawn [Everitt 1968] Use of these maps improved the accuracy of th e comshyposite channel map
B Land Use Change
Land use was mapped for each period on a com posite map at a scale of 1 24000 Land use categories were (1) marsh-treeless areas with emershygent aquatic vegetation or open water (2) non-forest - o pen land occushypied by houses or farm buildings (3) bare sand-non-forest ed ba rs and dunes along the river channel (4) ind ustrial-power plants and refineries (5) agriculture (s~tt l ement to 1938)-cropland and pasture cleared before 1938 (6) agriculture (1938- 1979) - cropland and pasture cleared 1938shy1979 (7) cottonwood-willow-young stands of Populus deltoides and Salix amygdaloides up to approximately 40 years of age (8) cottonshywood-stands of Populus deltoides approximately 40-80 years of age (9) cottonwood-ash-elm-boxelder-stands with at least 50 percent of the canopy composed of Populus with 20-50 percent an admixture of Fraxishynus Ulmus and Acer (10) ash-elm-boxelder-stands with at least 75 percent of the canopy composed of Fraxinus Ulmus and Acer Many of these stands included a small component of Populus andor Quercus
Field surveys and tree aging also improved the accuracy of land use maps by providing general ground information and specifically enabling more accurate estimation of age classes of cottonwood forests They also enabled accurate estimation of the area and age of young cottonwoodshywi lIow forests (less than 40 years) wh ich are di fficu It to identify u namshybiguously from photography
Because 1891 cover maps were very general General Land Office Survey records were used to determine the proportional composition of the forest categories at the time of settlement These reco rds have been used by other researchers in determining pre-settlement vegetation [Stearns 1949 Burgess 1964] Survey notes usually included a general descripshytion of each township including deta ils of forest underbrush soils and relief Points were established at each 16-km interval along the range and section li nes of each township In this manner 36 sections were established within each township At the common point between secshytions as well as at quarter section corners (a point halfway between section corners) the species diameter and bearing of up to four witshy
ness trees were recorded By examining the records for all trees on the 160 points occurri n~ in the study area the proportion of cover types could be estimated
II Resu Its and Discussion
Between 1881 and 1891 approx imately 1650 ha of land su rface area were deposited as alluvial material (Table 8) Durin~ this same period approximately 1328 ha were eroded The average annual erosion rate was 133 ha per year For the interval 1891-1945 approximatel y 5464 ha were deposited and 4648 ha eroded Average annual loss rate during th is interval was approx imately 86 ha per year Thus average annual erosion rate for the ~ntire pre-reservoir period (1881-1945) was 93 ha per year wh ile deposition rates averaqed 111 ha per year Although there was a slight net accumulation of material (18 ha per year) during the pre-dam period losses and qains were relatively balanced
In the post-dam period both erosion and deposition rates decreased subshystantially Dur ing 1969-1979 only 13 ha of land were deposited and most of that accumulated behind erosion control devices (wing-dikes) constructed along the bankline During this same period approximately 212 ha of land were lost to erosion This is an average annual rat e of 21 ha per year Thus erosion rates fell from the pre-dam avera~e of 93 ha per year to 21 ha per year during the post-dam period (1969-1979) Accretion rates fell from 111 ha per year to 13 ha per year during the same period Post-dam erosion rates were only 25 percent of pre-dam rates and accretion rates only 1 percent of pre-dam rates
Vhi lle erosion and deposition rates were relatively balanced during the pre-dam period they were decidedly unbalanced during the post-dam period Deposition during the pre-dam period was 12 ti mes greater than erosion during the post-dam period erosion was 162 times greater than accretion This overal ll increase in erosion over deposition has resulted from increased bank cutting and destabilization Thus the channel is widening because material is being eroded from both banks with little concurrent accretion
Meandering rates increased as floodplain width increased Thus where the floodplain was narrow river meandering rate was small In the porshytion of the study area below Garrison Dam (Microfiche 17) the width of the floodplain averages about 16 km Shifts in channel position since
25
26
1872 have averaged approx imately 06 km I n the study area south of Bismarck (Microfiche 11) t he floodplain is approximately 116 km in width Channel changes since 1872 have averaged approximate ly 24 km result ing in red istribution of la rge am ou nts of alluvium
The model of Schumm [1969] would predict t hat the reduction of f loodshying and bed-material load resulting from dam emplacement will lead to an increase in channel sinuosity and a decrease in meander wavelength Thus the natural response involves considerable lateral cutting unti l the channel reaches equilibrium with the new regimen In the study area however an extensive series of bank-stabilization structures conshystructed by the Corps of Engineers since dam emplacement has preshyvented natural c~annel response and has actually led to a considerable post-dam reduction in lateral channel shifting The Schumm model also predicts a decrease in channel width but the actual channel has been widening T he cause of this anomalous response may be that the stream is expend ing energy in eroding and transporting sediment from both channel walls instead of unilateral channel shifting
The dramatic decline in erosion and accretion rates since the construcshytion of Garrison Dam and the change in the balance between the two are beginning to have an impact on natural rates of reforestation by cottonwood and willow Currently approximately 35 percent of the floodplain forest is composed of cottonwood forests less than 80 years old forests with cottonwood trees less than 150 years old comprise 78 percent of the total Thus forests with cottonwood as the primary dominant currently make up the large majority of the floodplain forests
On active f loodpllains Everitt [1968] proposed a logarithmic decline in the area of the floodplain occupied by forests of increasing age that is young forests should occupy the largest proportion and old forests the smallest I f the meandering rate were to decl ine su bstantially thereby decreasing the likelihood of erosion and increasing mean stand age the pattern may at equ iI ibriu m become reversed that is old f orests wou Id occupy a larger area than young forests This is the pattern now emerging on this protected floodplain cottonwood forests less than 40 years of age now occupy only 8 percent of the total forest area while forests of 40 to 80 years comprise 23 percent of the total We expect the proporshytion of young cottonwood forests to decline in rough proportion to the decline in accretion rates A new equilibrium composition would be reached in less than two centuries and cottonwood forests will probshy
ably comprise at the most only 5-10 percent of the t otal forest area The remainder would include forests of more advanced successional age dominated by green ash and boxelder especially the f ormer Cottonshywood stands of t he future will be small in extent and primari ly located behind w ing-dikes and other erosion control dev ices Few if any cotshytonwood forests w ill occupy broad terraces more than several meters above mean river level The distr ibu t ion of cottonwood shou Id t heref ore become more rest ricted that is a strand species occurring in close proximity to the river
Settlement has brought many significant changes in the ex tent and comshyposition of the floodpl ain vegetation (Microfiches 2 1 th rough 28) The largest changes involved the clearing of fo rests for agricultural purposes By 1938 approximately 38 percent of the floodplain forest had been cleared for agriculture or about 07 percent per year over t he 1881shy1938 period (Table 9) Thus clea ring proceeded at a rapid rate after the General Land Office Survey of 1872-1881 No mention of agricu lture on the floodplain was made in the Survey notes however some cultivashytion had occurred in the adjacent prairie uplands An additional 18 pershycent of the forest was cleared for cu Itivation between 1938 and 1979 or about 05 percent per year
I ndustrial development on the floodplain is a recent phenomenon occurshyring mostly after the construction of Garrison Dam Less than 1 percent of the land area is used by industry Marshes and sand dunes also comshyprise less than 1 percent of the fl oodplain area Marsh area has changed little since presettlement but bare sand has decreased since the cessation of floods Large floods in the pre-dam period scou red and deposited sand on low terraces near the r iver channel
General Land Office Survey notes indicate that the preset tlement floodshyplain was almost completely wooded Young cottonwood forests less than 40 years old occupied about 14 percent of the floodplain forest These may have occupied a larger proportion of the forest area because young trees were generally not used as witness trees in the land survey
Approximately 53 percent of the forest was composed of cottonwoods 40-80 years old Thirty percent of the forest was in the old cottonwood type while only 3 pelrcent of the forests were of advanced successional age These included ash elm boxelder and bur oak with occasional large cottonwoods
27
28
Presently fo rest vegetation comprises about 44 percent of the floodplain area about 8 percent of t his total is composed of young stands of cottonshywood and willow less than 40 years of age Most of these have regenershyated since the closing of Garrison Dam in 1954 on alluvium deposited du ring the 1952 flood In many areas these stands are severely browsed by beaver and scoured by ice in the spring resu lting in frequent damage to aboveground stems Thus individual plants are older than they appear Because these stands are on low terraces with a high water table are flooded occasionally and are on soils unproductive for crops only 6 percent of this forest type has been cleared since their establishment at various times during the past 40 years
Approximately 23 percent of the existing floodplain forest was comshyposed of stands of cottonwood ranging in age from 40 to 80 years Forshyests in th is age class generally occurred on more productive soils howshyever they were still on low terraces with relatively sandy soils Agriculshytural clearing has removed about 52 percent of these stands since their establishment Clearing of forests of this age has increased since the 1930s because of floodplain protection and access to irrigation
The most extensive forest category is age class 80-150 years-47 percent of the total forest area These stands contain large cottonwood trees with young green ash American elm and boxelder These forests are located on intermediate terrace elevations About 43 percent of forests in th is category have been cleared for agricu Iture
The remaining forest type makes up 22 percent of the total forest area These forests contain green ash American elm boxelder and few scatshytered cottonwoods andor bur oak Since settlement 75 percent of this forest type has been cleared for agriculture This high rate of clearing is due to the location of these stands on high terraces removed from most floods and the presence of more productive soils for agriculture
Overall the rate of forest clearing was at its maximum during the early settlement period before 1938 Although the rate of clearing has been somewhat lower during the period after 1938 field observations indicate a surge in clearing since 1970 when irrigation became more widespread Soils that were perhaps of marginal productivity and therefore left forshyested cou ld be made more productive with additional water from irrigashytion Deforestation continues at a rate that is probably greater than the average rate of 05 percent for the 1938-1979 period
It is difficu lt t o accurate ly est imate the forest type proport ions on the presettlement flood plain primarily because the surveyors selected against choosing small trees as wi tness trees Young witness trees less than about 12 cm diameter at breast height (dbh) did not occur in the data set so the proportion of small cottonwood forests was significantly underestishymated The estimate of only 3 percent of the total forest area occupied by forests of advanced successional age is especially interesting since the current proportion is about 22 percent and these forests wh ich ocshycurred on better soils were preferentially cleared We do not know with certa inty the reasons for th is but we suspect that it is an artifact of past timber practices Large cottonwood trees (50-100 years old) occurr1ing with an understory canopy of ash elm and boxelder were preferred trees for lumbering ~elective cutting of these trees would have in effect shifted these stands from the mixed cottonwood forest type to the most advanced successional stage Cottonwood does not reproduce in the tree gaps of older forests
29
30
TREE POPULATION STRUCTURE
An underrepresentation of sap ling-size reproduction of American elm and boxelder was observed by Johnson Burgess and Keammerer [1976] however they sampled only trees 12 cm dbh and larger and did not determine age only size Extrapolation from size to age is often inaccurshyate [ Harcombe and Marks 1978] This research was designed to develop complete age structure diagrams in both treatment and reference stands to test the hypothesis that altered hydrologic regimen had affected tree population structu re The survey of Johnson Burgess and Keammerer indicated that the population structure of another important climax tree species green ash was unchanged from pre-dam condi tions
I Methods
Four former stands of Johnson Burgess and Keammerer [1976] were selected for study ( stands 7 11 13 and 19) I n addition to these treatshyment stands other stands or portions of treatment stands (7 16 and 23) were included as contro l or refe rence sites Because surface water occurred in the spri ng in these stands either from upland runoff or from rising groundwater these reference stands represented an environment closest to that of flooded stands in the pre-dam period If reproduction was as underrepresented in the wetter reference sites as in the treatment sites then the in itial hypothesis that underrepresentation was due to flood cessation would have to be rejected Boxe lder was a major species in stands 7 and 23 while American elm was dominant in stands 1 t 13 and 19 Reference stand 7 (a section of treatment stand 7) was an abanshydoned channel of the Little Heart River on the Missouri River floodp lain near Oahe Reservoir wh ilch fills with water in the spring Reference stands 16 and 23 were flooded almost annually by concentrated upland runoff A ll stands were on one terrace level and had undergone no significant cutting grazing or burning during the previous 30 years Sampling ocshycurred during the summer of 1979
I n each stand parallel and equidistant lines were arranged perpend icular to the course of the river Sample plots were located at random points within 25-m segments along each transect line The sample unit consisted of nested circular plots 250 m2 for stems greater than 10 cm dbh (trees) 100 m2 for stems less than 10 cm dbh but taller than 05 m (saplings) and 1 m2 for stems less than 05 m tall (seedlings) Four 1-m2 plots were random Iy placed with in each 100-m2 plot Twenty-one plots were samshy
pled in stands 11 and 19 and 23 in stands 7 and 13 Because the refershyence stands were much smaller than the t reat ment sites sample sizes were smaller reference stand 7 (three plots) reference stand 16 (seven plots) and stand 23 (two plots)
Stem diameter at breast height was measured f or all boxelder and elm trees and saplings that occurred in t he quadrats Ages of seedlings were determined by counting terminal bud scars or cutting and aging directly I ncrement cores were collected from several saplings and trees in each plot and age was determined in t he laboratory Small saplings were cored using a micro-increment borer A ges for all stems were computed using the natural growth function f(x a b) = a( 1 - e-b x ) where x = dbh and f(x) == age [Parton and Innis 1972] The curve for each species was selected that minimized the residual sums of squares and yielded the greatest measure of fit [Helwig and Council 1979] For elm a = 143 b = 002956 (r2 = 094) For boxelder a = 106 b = 002388 (r2 = 095) All samples of each species were pooled for t he age-size regressions
Size and age structural diagrams were constructed separately by computshying the density of stems in each size or age class Because the relat ionshyship between age and size was close to being linear the curves in both graphs exh ibited the same basic form Boxelder stems of sprout origin were tallied separately to show the contribution of sprouting to overall population structure Data were divided into five-year age classes
II Results and Discussion
Age distributions for American elm (Figure 12) showed low densiti es of saplings and small trees and high densities of seedlings and large trees Three of the four treatment stands showed a complete absence of stems in one of the two young age classes The average of all four stands also showed lowest densities in the two sapling classes The data clearly indishycate that post-reservoir conditions allowed substantial germination and initial establishment of seedlings seedling densities in the first age class averaged 110000 per ha However seedlings must have thinned rapidly since stems from several years old to about 45 years old were relatively rare High densities of elm seedlings were also noted during field surveys in 1969-70 by Keammerer [1972] and underrepresentation of sapl ings and small trees was observed by Johnson Burgess and Keammerer [1976] Reduction in elm density occurred in stems from several years old to those that would have been approximately 20 years old when
3 1
32
Garri so n Dam became operational
Age distribut ion fo r boxel der also showed underrepresentation in t he small age classes but th e reduction was less dramatic than for elm (Figshyure 12) Again seedl ing reproduction was considerable altho ugh at lower overall densities than elm Mortali ty between seedlings and smal l tree classes was considerable thereby resulting in fewer saplings than trees Underrepresentation is most evident in stems several years o id to about 25 years old Thus boxelder showed a somewhat narrower age gap than elm Reduction in stem density appeared in age classes that corresponded cIIosely to the time since flooding was eliminated by Garshyrison Dam
Age distributions in reference stands showed different patterns (Figure 13) Age distributions for both species appeared to be more balanced [lJIeyer 1952] that is age classes between 5 and 45 years were considshyerably Iess underrepresented than in treatment sites In our survey of reproduction on the floodplain one observation held true-h igh sapling densities of American elm andor boxelder were always associated with the few siteS that received supplemental moisture either from a rising groundwater table near Oahe Reservoir or in areas that received upland runoff
Therefore the data suggest that moisture was the primary factor responshysible for underrepresentation in the age structure of these two species Supplemental moisture to these forests would in the pre-reservoir years have been provided by both a surface recharging of the rooting zone by overbank flooding and a high water table in the early growing season months when river height was generally maximum However in the abshysence of these sources of moisture seedlings would now depend on preshycipitation alone to enable growth to the deeper post-reservoir water table We believe that the reduction in available moisture was the likely cause of the extremelly high seedling mortality and the movement of only a small fraction of elm and boxelder seedlings into the tree-size classes The natura l range of elm extends to only a few counties west of the study area in North Dakota while boxelder extends west into the drier conditions of eastern and central Montana Interestingly the species less able to tolerate drier cl imatic conditions (elm) was also the species that showed the greatest underrepresentation in age structure in the drier post-dam floodplain
Ch anges in the hydrologic regimen may have also cau sed greate r morshytality of established saplings in the yea rs im mediately follow ing Garrison Dam T hus t he o bservation in t he age structural d iagrams for elm (Figshyure 12) that increased mortality began two decades before Garrison Dam (that is cu rren t 45-year-old age c lass) may be the resu lt of increased morta lity of sa plings t hat were 20 years old or younger in the years folshylowing dam construction Perhaps the root systems of saplings were too poorly developed to ut il ize gro undwater o r to persist on it alone At the wetter reference sites mo rta lity of saplings of this age did not appear to have increased substantially over pre-dam levels
I n contrast t he mortality of establ ished boxelder sapl ings appears to have continued at pre-dam levels the change in hydrologic regimen appeared to increase only the mortality of young boxe lder seedlings that is individuals established after 1954 The larger proportion of stems that had died and resprouted in treatment stands also indicates that these seedlings were under greater stress than those in reference sites
Since livestock grazing could also have caused seedling-sapling mortality t he grazing history of the treatment stands was obta ined from landshyowners Stand 7 had not been grazed since the 1920 s stands 11 and 13 had not been grazed since 1950 and stand 19 had been grazed one year in the early 1970s but otherwise had not been grazed during the postshydam period Grazing therefore has been light or nonexistent in the treatment stands and was probably not the reason fo r the gap in age structure Furthermore if the ingestion and trampling by cattle were responsible for increased mortal ity other woody tree species wou Id likewise also have been affected yet green ash saplings of all age classes were numerous in treatment stands
Browsing by deer has also been shown to affect the population structure of preferred species [Swift 1948] Although American elm is a preferred browse species in this region damage to it from browsing was not noticeshyable in our treatment stands
In streamside forests in the East many large elms (Ulmus americana L and Ulmus rubra Muhl) have died from Dutch elm disease We saw no evidence of diseased elms on the floodplain in our study area however the disease has killed many urban trees in Bismarck Since elm trees are affected to a greater extent than seedlings and saplings [Stipes and Camshypana 198 1] the disease is not considered a cause for the Ilow densities
33
34
of elm saplings Underrepresentat ion was already observed by Johnson Burgess and Keammerer (1976] during the 1969 and 1970 fie ld seasons about t he time Du tch elm disease had spread to central North Dakota [Stipes and Campana 1981 ]
Although the natural form of the age structure curve of c llimax or equilibrium tree populations had been thought to be negative exponenshytial [Meyer 1952] recent studies have indicated that underrepresentashytion in sapll ing size classes is a widespread phenomenon [Christensen 1977 Harcombe and Marks 1978] Harcom be and Marks sampled forest stands in the Big Thicket of southeastern Texas that ranged from dry uplands through mesic sllopes to wet river floodplains They showed a high incidence of underrepresentation of sapl ings of cl imax tree species in wet and mesic forests but a lower incidence in dry upland forests They argued that the cause of the underrepresentation was competition for Iight between the seed Iings and sapl ings of overstory tree species and understory tree and shrub species They suggested that underrepresenshytation in wet and mesic forests was natural and caused by increased morshytality of seedlings because of shad ing by understory trees (for examp1le Carpinus caroinianaj
Patterns of underrepresentation in age structure f or the M issou ri River floodplain were nearly identical with those of southeastern Texas exshycept we believe that underrepresentation in our study was caused by lack of moisture not light The canopy of old floodplain forests along the Missouri River is relative ly open Hibbard [1972] showed that in these forests canopy cover ranged from 65 to 80 percent A lso neither boxelder nor elm is ilntolerant of shade [Baker 1949] Saplings of these species were no more abundant along stand edges or in large canopy gaps where light would have been more available
In summary our results indicate a significant decline in the abundance of American elm and boxelder on the Missouri River floodplain in the study area Current overstory densities of these species cannot be mai1nshytained given the low density of saplings In the case of American elm the decline will accelerate if Dutch elm disease begins to affect canopy trees Assuming that current trends continue the importance of these species in the overstory should consistently decline over t ime until only scattered trees remain or even become local ly elliminated Trees wHI beshycome primadly restricted to the few small wet sites either near the backshyup of Oahe Reservoir or in places where intermittent streams flow onto
the floodplain Seedlings may continue to be numerous unti l affected by restricted seed d ispersal from a dwi ndling nu mber of canopy trees Because green ash reproduction of all age classes was ubiquitous and dense it should become an increasingly important canopy species
Available evidence points to the altered hydrologic regimen as the cause of reduced recruitment of boxelder and elm trees however in the abshysence of pre-dam age structure and hydrologic information th is conclushysion must be considered tentative We clearly need additional informashytion from other f loodplains both natural and altered to solve the undershyrepresentation problem
35
36
CONCLUSIONS
1 The hydro logic regi men of the Missouri River has been altered conshysiderabl y by t he construction of Garri son Dam Wh ile precipitation and A E have shown no significant changes between pre- and post-dam periods streamflow patterns have changed markedly Peak flow no longer occurs early in the growing season and consequently is out of phase with the vernal growth pattern typical of floodpla in trees A larger proportion of the annual flow is now released in the non-growing season mont hs and therefore is unavailable for growth Now flow in Ju ne is usually less than it was du ri ng the drought years of the 1930s River flow data indicate a general lowering of the spring and ea rly summer water table since Garr ison Dam
2 Flood ing has been el im inated on terraces greater than 2 m above mean river level thus decreasing the moisture available to floodplain ecoshysystems at the start of the growing season The accompanying deposishytion of nutrient-rich si It has also ceased
3 Both erosion and deposit ion rates by the river have decreased subshystantially since Garr ison Dam I n effect river meandering has all but ceased Accretion rates have fallen to 1 percent of their pre-dam level and erosion rates to 25 percent of pre-dam levels The net effect was a widen ing of the river channel by erosion on both banks and little concurrent deposition
4 Results showed that decreases in radial tree growth in the post-dam period were not uniform throughout the floodplain but depended on species and location with respect to the river Trees on terraces at t he edge of the floodp ~ ain that received concentrated runoff from upland ravines (for example bur oak) and those with deep root systems (for example cottonwood) on low terraces close to the water table have been least affected by the altered hydrologic regimen Growth of cotshytonwood and bur oak on reference sites unaffected by damming of the Missouri River increased significantly in the post -dam period The most pronounced decrease in tree growth (for example boxelder American elm) occurred on higher terraces that received little or no upland runoff
5 Lack of flooding and a lowered spring water tab le are implicated in the decline of radial tree growth For example with a lower spring
water table the roots of established trees may no longer extend t o the cap illary f ringe Thus growth might depend more upon spr ing A E than on groundwater This shift in response from one source of moisshyture to another (from groundwater to precip itat ion) was ex hibited in the regression ana lysis of cottonwood growth chrono logies The ab shysence of overbank flooding may have had a greater effect on the growth of trees (for example American el m) on dry upper t erraces well above the water table that did not receive upland runoff A Ishythouglh these terraces were only infrequently flooded before 1953 the supplemental moisture provided by floods just before the onset of growth could have augmented growth for several consecutive years and compensated for years of low predpitation
6 Lack of accretion by the r iver in the post-dam period spells a decline in the proportion of the floodplain forest occup ied by cottonwoodshywillow forests The decline is already observable and will continue until in a century or more cottonwood forests will occupy only a fraction of their current proportion Cottonwoods will be relegated to a river marg inal position being especially prominent behind wingshydikes
7 We believe that the decline in cottonwood abundance and ubiquity will be accompanied by a decline in American elm because of a rapidly declining growth rate almost complete absence of seedling survivorshyship on most sites and the impending effects of Dutch elm disease Some remnant elm stands may persist on sites with an artificially elevated water table near the Oahe Reservoir and on high terraces that receive upland runoff Boxelder which exhibited greater survivorship but was still underrepresented in the sapling size classes may exhibit a slower decline Although growth rate of green ash has also declined it exhibits balanced population structure and will likely increase its abundance and ubiquity in coming decades Thus the current obsershyvations foretell a drastic decline in cottonwood and elm abundance a moderate-to-slow decline in boxelder prominence and an increase in green ash Overall the aipha and beta diversities of the forest overshystory should decline
8 Clearing for agriculture has claimed slightly over half (55 percent) of the original floodplain forest The rate appears to have accelerated during the last decade because of opportunities to irrigate croplands Should these trends continue future native forests may be mai ntained
37
38
only in protected areas such as the Riverdale and Oahe Game Manageshyment Areas and in private reserves (for example Cross Ranch The Nature Conservancy) However forests protected from clearing and other disturbances remai n unprotected from the ecological effects of altered river hydrology
9 The effects of altered hydrology on floodplain ecosystem dynamics need further study on other forested floodplains particularly where pre-dam biological information is available or where nearby wild rivers could serve as good controls Where significant effects of floodplain protection are suspected an index of impact could be der ived by comparing pre-dam gauge height (flood frequency) and seasonal flow patterns to pre-dam patterns Greater departure from pre-dam patshyterns would suggest greater potential impact on natural floodplain ecosystems
LITERATURE CITED
Baker F S 1949 A Revised Tolerance Table Journal of Forestry 47 179-81
Baxter R M 1977 Environmental Effects of Dams and I mpoundshyments I n Annual Review of Ecology and Systen7atics Vol 8 R F Johnson editor pp 255-83 Palo Alto Californ ia Annual Rev iews Inc
Bedinger M S 1971 Forest Species as Indicators of Flooding in the Lower White River Valley Arkansas Professional Paper 750-C US Geological Survey US Department of the Interior Washington
Bell D T and R del Moral 1977 Vegetation Gradients in the Streamshyside Forest of Hickory Creek Will County Illinois Bulletin Torrey Botanical Club 1 04 127-35
Bluemle J P 1971 Geology of McLean County North Dakota North Dakota Geological Survey Bulletin No 60 Pt 1 North Dakota State Water Conservation Commission Grand Forks
Brockman L C et aI 1974 Soil Survey of A1cLean County North Dakota Soil Conservation Service US Department of Agriculture Wash ington
Brown D E C H Lowe and J F Hausler 1977 Southwestern R iparshyian Communities Their Biotic Importance and Management in Arizona In Importance Preservation and Management of Riparian Habitats pp 201-11 General Technical Report RM-43 US Forest Service US Deshypartment of Agriculture Washington
Burgess R L 1964 Ninety Years of Vegetational Change in a Townshyship in Eastern North Dakota Proceedings North Dakota Academy of Science 18 84-94
Campbell C J and W Green 1968 Perpetual Succession of StreamshyChannel Vegetation in a Semiarid Region Arizona Academy ofScience Journal 5 86-98
39
40
Carlson C G 1973 Geology of Mercer and Oliver Counties North Dakota North Dakota Geological Survey Bul letin No 56 Pt 1 Nort h Dakota State Water Conservation Commission Grand Forks
Christensen N Lt 1977 Changes in Structu re Pattern and Diversity A ssociated with Climax Forest Maturation in Piedmont North Carolina American Midland Naturalist 97 176-88
Clayton L 1962 Glacial Geology of Logan and McIntosh Counties North Dakota North Dakota Geological Su rvey Bulleti n No 37 North Dakota State Water Conservation Commission Grand Forks
Everitt B L 1968 Use of the Cottonwood in an I nvestigation of the Recent History of a Floodplain American Journal ofScience 266417shy39
----- 1980 Ecology of Saltcedar-A Plea for Research Environshymental Geology 377-84
Fenneman N M 193 1 Physiography of the Western United States New York McGraw-Hili Book Co
Fritts H C 1976 Tree Rings and Climate New York Academic Press Inc
Fritts H C J E Mosimann and C P Botroff 1969 A Revised Comshyputer Program for Standardizing Tree-Ring Series Tree-Ring Bulletin 29 15-20
Gary H L 1965 Some Site Relations in Three Floodplain Communishyties in Central Arizona Arizona Academy of Science Journal3(4) 209shy12
Grannemann N G and J M Sharp Jr 1979 AHuvial Hydrogeology of the Lower Missouri River Vaey Journal of Hydrology 4085-99
Greenman D W 1953 Reconnaissance of the Missouri River Pumping Units Between Garrison Dam and Bismarck North Dakota Unpublished paper compiled as part of a US Department of the Interior program for development of the Missouri River Basin Water Resources Division US Geological Survey US Department of t he Interior Washington
Johnson W C R L Burgess and W R Keammerer 1976 Forshyest Overstory Vegetation and Environment on the Missouri River Floodplain in North Dakota Ecological Monographs 4659-84
middot J 1 f Lf
Harcombe P A and P L Marks 1978 Tree Diameter Distributions and Replacement Processes in Southeast Texas Forests Forest Science 24 153-66
Hayes F A and J H Stoeckler 1935 Soil and Forest Re lat ionsh ips of the Shelterbelt Zone I n Possibilities of Shel terbelt Planting in the Plains Region pp 111-15 Special Bulletin US Forest Service US Department of Agricu Iture Ilash ington
Helwig J T and K A Council editors 1979 SAS Users Guide Rashyleigh North Carol ina SAS I nst itute Inc
Hibbard E A 1972 Vertebrate Ecology and Zoogeography of t he ~issouri River Val ley in North Dakota PhD dissertation North Dashykota State University Fargo
Hollander M and D A Wolfe 1973 Nonparametric Statistical Methods New York John Wi ley and Sons
Keammerer W R W C Johnson and R L Burgess 1975 Floristic Analysis of the Missouri River Bottomland Forests in North Dakota Canadian Field-Naturalist 895-19
Kosier J A 1979 Regulating Critical Riparian Lands A Cha llenge in I ntergovernmental Cooperation I n Strategies for Protection and Management of Floodplain Wetlands and Other Riparian Ecosystems R R Johnson and J F McCormick editors pp 332-35 Symposium Proceedings December 11-13 1978 Calloway Gardens Georgia
Kroodsma R L 1970 North Dakota Species Pairs I Hybridization in Buntings Grosbeaks and Orioles PhD dissertation North Dakota State University Fargo
Kuchler A W 1964 Potential Natural Vegetation of t he Contermishynous United States (map) Special Publication American Geograph ical Society INew York
Kujawa M 1974 Plankton Studies on a Recently I mpounded Resershyvoir Journal of Environmental Health 37 252-55
41
42
Kume J and D E Hanson 1965 Geology and Water Resources of Burshyleigh County North Dakota North Dakota Geologicall Survey Bulletin No 42 Pt 1 North Dakota State Water Conservation Commission Grand Forks
Lemke R W and R B Colton 1958 Summary of the Pleistocene Geology of North Dakota In Midwestern Friends of the Pleistocene Guidebook 9th Annual Field Conference Miscellaneous Serial No 10 North Dakota Geological Survey Grand Forks
Lemke R W et aI 1965 Quaternary Geology of the Northern Great Plains In The Quaternary of the United States H E Wright Jr and D J Frey editors pp 15-27 Princeton New Jersey Princeton Univershysity Press
Leopolld L B M G Wolman and J P Miller 1964 Fluvial Processes in Geomorphology San Francisco W H Freeman
McKenzie M A 1936 Flood Injury to Trees Science 83(2154) 412-13
Meinzer O E 1927 Plants as Indicators of Groundwater Water Supply Paper 577 US Geological Survey US Department of the Interior Washington
Meyer H A 1952 Structure Growth and Diameter in Balanced Uneven-Aged Forests Journal of Forestry 5085-92
Parton W J and G S Innis 1972 Some Graphs and Their Functional Forms Technical Report No 153 Natural Resource Ecology Laborashytory Colorado State University Fort Collins
Pitt M D and H F Heady 1978 Responses of Annual Vegetation to Temperature and Rainfall Patterns in Northern California Ecology 59(2) 336-50
Randich P G and J L Hatchett 1966 Geology and Groundwater Reshysources of Burleigh County North Dakota Part II Groundwater Re-shysources North Dakota Geological Survey Bulletin No 42 North Dakota State Water Conservation Commission Grand Forks
Ridley J E and J A Steele 1975 Ecological A spects of River Imshypoundment In River Ecology B A Whitton editor pp 565-87 Berkeley and Los Angeles University of California Press
Robertson P A G T Weaver and J A Cavanaugh 1978 Vegetation and Tree Species Patterns Near the Northern Term inus of the Southern Floodplain Forest Ecological tllonographs 48249-67
Schumm S A 1969 R iver Metamorphosis American Society of Civil Engineers Journal Hydraulics Division 95(HY1) 254-73
Stearns F W 1949 liN inety Years Change in a Northern Hardwood Forest in Wisconsin Ecology 30350-58
Stokes M A and T L Smiley 1968 An Introduction to Tree-Ring Dating Chicago University of Chicago Press
Stout H R et aI 1974 Soil Survey of Burleigh County North Dakota Soil Conservation Service US Department of Agriculture Washington
Swift E 1948 Wisconsin Deer Damage to Forest Reproduction SurveyshyFinal Report Publication 347 Wisconsin Conservation Department Madison
Thornthwaite C W and J R Mather 1957 I nstructlions and Tables for Computing Potential Evapotranspiration and Water Balance Pubshylications in Climatology 10 181-311
Tukey J W 1977 Exploratory Data Analysis Reading Massachusetts Addison-Wesley Publishing Co
US Army Corps of Engineers Omaha District 1980 Personal comshymunication
US Geological Survey US Department of the Interior 1928-1 977 Water Resources Data for North Dakota 1928-1977 North Dakota State Geological Survey Bismarck
US Weather Bureau 1935-1974 Climatological Data North Dakota Annual Summary 1935-1974 Washington
43
44
Weiser P K 1975 Soil Survey of Oliver County North Dakota Soil Conservation Service US Department of A gricultu re Washington
Weist W G Jr 1971 Geology and Ground-Water System in the Gila River Phreatophyte Project Area Graham County Arizona Gila River Phreatophyte Project Professional Paper 655-D US Geological Survey US Department of the Interior Washington
Wells P V 1965 Scarp Woodlands Transported Grassland Soils and the Concept of Grassland Climate in the Great Plains Region Science 148 246-49
Wilhelm F J ~ 978 Soil Survey of Mercer County North Dakota Soil Conservation Service US Department of Agriculture Washington
Wolman M G and L B Leopold 1957 River Floodplains Some Obshyservations on Their Formation Professional Paper 282-C 37 -107 US Geological Survey US Department of the Interior Washington
Yeager A F 1935 Root Systems of Certain Trees and Shrubs Grown on Prairie Soils Journal of Agricultural Research 51 1085-92
Yeager L E 1949 Effect of Permanent Flooding in a River Bottom Timber Area Illinois Natural History Survey Bulletin 2533-65
FIGU RES
FIG
UR
E 1
L
oca
tio
n a
nd N
um
ber
of
Stu
dy
Site
s in
No
rth
Dak
ota
Wa
tfo
rd
Cif
y
o B
1
6
32
4
8
Sca
le
(km
)
Pri
mar
y st
udy
area
is
betw
een
Gar
riso
n D
am a
nd O
ahe
Res
ervo
ir T
he L
ittl
e M
isso
uri
Riv
er r
efer
ence
sit
e is
wit
hin
the
The
odor
e R
oose
vel
t N
atio
nal
Par
k
and
the
scar
p w
oodl
and
refe
renc
e si
te i
s w
est
of P
rice
N
orth
Dak
ota
Sta
nd
~
-J
nu
mbe
rs a
re t
hose
of
John
son
Bur
gess
an
d K
eam
mer
er [
1976
]
~
00
~
c o o CD
~
CD
Q
en
~
CD -Q) E
o 0
J U
FIG
UR
E 2
M
on
thly
Str
eam
flo
w (
19
28
-1 9
77
) fr
om
th
e B
ism
arck
Gau
ging
Sta
tion
on
th
e M
isso
uri
Riv
er
2300TI-~r-~or--r---------r----~--------r----~----r-------------r---~----~----~--~----~
112~
1150
5H
19
44
23
00
In~
U5
0
51~
Year
JI)
In
In
N
19 4
5
194
6
~
25
00
c 0 0 Q
) 172~
I
~
II~O
I fh
~
Q)
~7~
Q) E
0 0
~ ~h
~
I I
I1
96
2
19
63
1
96
4
196~
19
68
1
96
7
19
68
1
96
9
19
70
19
71
19
72
1
97
3
19
74
1
97
5
19
76
1
97
7
FIG
UR
E 2
(co
nti
nu
ed
)
~
(J
Yea
r
S
ou
rce
US
G
eolo
gica
l S
urv
ey
19
28
-19
77
T
he
pri
mar
y gr
owin
g se
aso
n m
on
ths
(May
Ju
ne
an
d J
uly
) ar
e re
pre
sen
ted
by
bla
ck
bars
G
arri
son
Dam
was
co
mp
lete
d i
n A
pril
19
53
S
trea
mfl
ow
is
used
her
e in
stea
d o
f ga
uge
hei
gh
t si
nce
the
latt
er d
ata
wer
e n
ot
avai
lshy
~
able
fo
r so
me
yea
rs
Th
ere
was
usu
ally
a s
tro
ng
co
rrel
atio
n b
etw
een
gau
ge h
eig
ht
and
str
eam
flo
w (
for
exam
ple
fo
r th
e m
on
th o
f (0
O
cto
ber
19
72
R
2 =
09
98
7
Y =
42
81
7x
-2
32
02
)
(J1
o
F
IGU
RE
3
Str
ea
mfl
ow
fo
r Ju
ne a
nd F
eb
rua
ry 1
928-
1977
at
the
Bis
mar
ck G
augi
ng S
tatio
n o
n th
e M
isso
uri
Riv
er
19
82
- ~ rt) E
-
14
16
~
V
I
r
June
S
tre
am
flo
w
~
0 J u ~
85
0
lt
W
0
en
28
3
192
8
19
34
1
94
0
19
46
19
52
1958
1
96
4
1970
1
97
6
YE
AR
CJ1 ~
- ~ rt) E - ~ o J
LL ~
ltt w
a
Ishy (f)
991
70
8
42
5
142
FIG
UR
E 3
(co
ntin
ue
d)
Fe
bru
ary
S
f re
am
flo
w
19
28
1
93
4
19
40
1
94
6
19
52
1
95
8
19
64
1
97
0
YEA
R V
erti
cal
line
indi
cate
s th
e ye
ar t
hat
Gar
riso
n D
am w
as c
ompl
eted
S
ourc
e U
S
Geo
logi
cal
Sur
vey
I 19
28-1
977
19
76
60
40
20
FIGURE 4 Percent Chance of Overbank Flooding at Different
Terrace Elevations Based on the Relationship Between Maximum Gauge Heights and Known Terrace Elevations
100~----------------------------------------------
80 pre- damD
()
z Ci ~l post-dam0 0 -l lL
-l laquo gt z z laquo LL 0
LLJ U Z laquo L u ~ 0
20 30 4 0 50 60
TERRACE ELEVATION
(meters above mean river level)
Source us Geological Survey 1928-1977 (Bismarck gauging station on the Misshysouri River)
52
00 10
a
IJJ
03
~-
ltE
~~
~I UJ
J 1
5
-m
~ ~
21
a
W
C
2
7
FIG
UR
E 5
G
rou
nd
wat
er a
nd S
trea
mfl
ow
Dat
a (1
97
1-1
97
3)
fro
m t
he
Mis
sour
i R
iver
nea
r B
ism
arck
Str
eam
flow
Wat
er T
able
~
r-
~
1
I I
I
J
I
I
I
II
1 J
11
I
IJ
_
shy
II
I
~
M
J J
J
M J
J
M J
J
I I
I 19
71
1972
19
73
MO
NT
H
AN
D
YE
AR
(J)
1415
~
0
fTI
~ 1132 raquo
~
84
9
r o 5
6 6 ~
shy
3 2
83
~
USG
S te
st w
ell
no
138-
080-
08-A
BA
1
loca
ted
appr
oxim
atel
y 1
km f
rom
the
Mis
sour
i R
iver
and
app
roxi
mat
ely
2 km
sou
th o
f B
ism
arck
P
rim
ary
grow
ing
seas
on
mon
ths
of
May
Ju
ne
and
July
are
rep
rese
nted
by
M
JJ
Str
eam
flow
dat
a fr
om B
ism
arck
C
Jl ga
ugin
g st
atio
n S
ourc
e U
S
Geo
logi
cal
Sur
vey
192
8-19
77
w
E E
I tshy~ 0 a ()
J ~ gt z z ~
54
FIGU RE 6 A merican Elm Chronologies (1 928-1 977)
from Stands 12 13 19 and 16
30
25
14
12
10
20
15
10
05
5 0
40
30
UNSTANDARDIZED
YEAR
American EI m Stand 12 1 age=80
American Elm Stand 13 i aoe=135
American EI m Stand 19 i age=120
American Elm Stand 16 i age=120
1976
-shyE E-
12
10
08
06
12
10
0middot8
12 10
08 06
FIGURE 6 (continued)
1928
STANDARDIZED
1940 1952
YEAR
American Elm Stand 12 x age=8
American Elm Stand 13 x age=135
Amer ican Elm Stand 19 i age=120
1964 1916
Figures on left are unstandardized (long-term trends not removed by standardizashytion) figures on right have been standardized Vertical lines indicate the year that Garrison Dam was completed
55
56
FIGURE 7 Bur Oak Chronologies (1928-1 977) from Stand 16
and the Scarp Woodland Reference Site
UNSTANDARDIZED
20
18
E E
16
I tshy~ 0 a C)
Bur Oak J Scarp Woodlandlaquo ) x oge= 120z
1 8z laquo
16 ( I
Bur Oak Stand 16
X age=120
14
1928 1940 1952 1964 1976
YEAR
FIGURE 7 (continued)
STANDARDIZ ED
12
10
- 08 E Bur Oak E- 06 Stand 16
I X age=120 ~ 0 a () Bur Oak J
110 Scarp Woodland ~ gt x age= 120 z z 105 ~
100
09gt
090
1928 1940 1952 1964 1976
YEAR Figures on left are unstandardized figures on right have been standardized Vertical lines indicate the year that Garrison Dam was completed
57
-E E
25
c toshy 23 ~ 0
21a ()
- 19 ~ ~ 17Z Z ~
en ~
E 256
~ 199 0 J LL 142 ~ ~
85W a Ishy 28en
58
FIGURE 8 Cottonwood Chronology (1928-1977)
from the Litt~e Missouri Reference Site
1928
1928
UNSTANDARDIZED
1940 1952
YEAR
1952
YEAR
Cottonwood Little Missouri
i age-IOO
1964 1976
Little Missouri
1964 1976
FIGURE 8 (continued)
STANDARDIZED
Cottonwood E E- 1 2
Little Missouri
x age= 100 c Ishy~ 10 0 a ()
08 ~ ltt =gt Z 06 Z ltt
Unstandardized chronology is top left standardized on right Average streamflow for April to July (1935-1977) for the Little Missouri River is shown bottom left Vertical lines indicate the year that Garrison Dam was completed Source US Geological Survey 1928-1977 (Watford City gaugi ng station)
59
E E
I Ishy~ o a lt- J ltt gt z z ltt
60
FIGURE 9 Cottonwood Chronologies (1928-1977) f rom Stands 5 and 14
6 0
50
40
3 0
20
10
30
2 5
20
1 5
1928
UNSTANDARDIZED
1940 1952
YEAR
Cottonwood Stand 5
c age=80
Cottonwood Stand 14
x age= faa
1964 1976
13
11
-E 0 9
E- 07
05
12
10
08
06
FIGURE 9 (continued)
STANDARDIZED
1940 1952
YEAR
Cotton wood Stan d 5
x age=80
Cottonwood Stand 14
x age=IOO
1964 1976
Figures on left are unstandardized figures on right have been standardized Vertical lines indicate the year that the Garrison Dam was completed
61
C)
f)
F
IGU
RE
10
S
moo
thed
Pio
ts o
f S
prin
g A
E V
ersu
s Y
ear
and
Spr
ing
(May
Ju
ne
July
) S
tre
am
flo
w V
ersu
s Y
ea
r
AE
Str
ea
mfl
ow
83
76
2
96
E
70
2
89
(J -
64
W
lt
t 5
7
~
r
v
shy
28
3
27
7
51
2
71
44
~
-
2 6
4
25
8
19
28
1
93
4
19
40
1
94
6
19
52
1
95
8
19
64
1
97
0
197
6
YEAR
Ver
tica
l li
ne i
nd
icat
es t
he y
ear
that
Gar
riso
n D
am w
as c
om
ple
ted
(J)
-t
n
fTI
lgt
~
r 0 ~
0 c 3 ~
en
64
FIGUR E 11 Results of Stepwise [MAXR Helwig and Council 1979]
Multip le Regression Analysis of Cottonwood from Stands 5 and 14 for Pre-Dam (1928-1952) and Post-Dam (1953-1977) Periods
Cottonwood Stand 5 CJ) t-Z 10
Pre -d am U w
5li ~ w 0 0 U
-5 Z Q -10 CJ) CJ)
AMJJ AMJJ AMJJ AMJJ AMJJ AMJJ ASOW V-I Y-I V-Ia () LLJ
Post-dam5 0 a
2 5 0 UJ N 0 0 0 a lt - 2 5 0 Z
~ -50
en PR IOR
FLOW PPT AE TEMP GROWTH
FIGURE 11 (continued)
(f) ~ Z 10 LLJ U 5ii ~ 0 0 0
-5 Z 0
-10 () () UJ a C)uJ 10 a
50 UJ N 0 0 ~ -5 ~ 0 Z -10 ~ (f)
Cottonwood Stand 14
Pre- dam
AMJJ AMJJ AMJJ AMJJ ANJJ ASO Y-I Y-I
Post- dam
FLOW PPT AE TEMP PRIOR I I GROWTH I
Fourteen environmental variables and a variable for the previous years growth (shown in Table 6 plus fall AE) were available to the stepwise selection process Only those variables significant at the 0100 level are shown Bars represent standshyardization regression coefficient and dots above or below bars indicate levels of sigshynificance bull ~ 005 bullbull ~ 001 bullbull ~ 0001 [Fritts 1976]
65
66
FIGURE 12 Age Structure of American Elm and Boxelder Populations in Four
Treatment Stands on the Missouri River Floodplain in North Dakota
AME RICA N EL M BOX E LDER
1 1 Ii c 2
10 STAND 7 STAND 7~ gt
oil lt= GI Cl 10
E GI
Vl
5 310 10
c Ii
02 11 102 STAND 11
gtshy Ui
n II 10 10
GIE
VI
STAND
27112233445566778899111111111 2711223344556677 272727272727272727001122334 27272727272727
272727272
AGE (years) AGE (years)
FIGUR E 12 (continued)
AM ER IC AN ELM BOXELDER
Ii
i ~ iii c
0
E VI
ii ~
~ iii c
0
E
iii
~ ~
~ ~ iii c
0
bull VI
101 10
2 STAND 13
0
104
102 STAND 19
10
510
2
44 6
AVERAGE10
10
I
8899111111111 272727272727272727001122334
272727272
AGE (years)
White bars denote proportion of stems of sprout origin
STAND 13
310
210 STAND 19
0
AVERAGE
2 11223344556677 27272727272727
AGE (years)
67
68
FIGURE 13 Age Structure of American E 1m and Boxelder Populations
in Reference Stands on the Missouri River Floodplain in North Dakota
AMERICA N ELM
105 ~ I ~
S TAND 16iii 103bull I
~ gt-
I) 102~ c QJ
0
E
V) -QJ
101-
~27112233445566778899111111111 272727272727272727001122334
272727272
AGE (years)
1 m 103
I
gtshy
I) 102 c 41
0
E -QJ
101Vi
S TAND 7
103
FIGURE 13 (continued)
ro c
gt
I)
c ClI
0
E ClI
V) -
ro c
~ gt
I)
c QJ
0
E QJ
V) -
STAND 23
102
101
L 104
103
BOXELDE R
I
STAND 16
102
101
2711223344556677 27272727272727
AGE (years)
69
TABLES
TA
BL
E 1
P
reci
pita
tion
and
AE
Sta
tistic
s fo
r P
re-D
am (
19
35
-19
54
) an
d P
ost-
Dam
(1
95
5-1
97
4)
Per
iods
Mea
n M
axi
mu
m
Min
imu
m
To
tal
Ap
ril-
July
T
ota
l A
pri
l-Ju
ly
To
tal
Ap
ril-
Ju
ly
Pre
cip
ita
tio
n (
cm)
Pre
-dam
P
ost-
dam
4
03
(S
O 9
1)
382
(S
O 7
2)
23
6 (
SO
75
) 22
4 (
SO
65
) 5
16
54
7
34
4
33
0
152
27
1
27
126
AE
(cm
) P
re-d
am
Pos
t-da
m
381
(S
O 7
6)
361
(S
O 7
6)
29
6 (
SO
64
) 2
92
(S
O 6
6)
46
7
514
37
2
36
8
170
2
36
1
12
169
So
urc
e
US
W
eath
er B
urea
u C
lima
tolo
gic
al
Dat
a
-J
W
~ T
AB
LE
2
Mea
n T
ota
l R
adia
l W
ood
Gro
wth
by
Spe
cies
and
Site
fo
r 20
-Yea
r P
re-D
am (
19
35
-19
54
) an
d P
ost-
Dam
(1
95
5-1
97
4)
(Un
ad
just
ed a
nd A
dju
sted
fo
r A
ge)
Per
iods
Spe
cies
Gre
en a
sh
Am
eric
an e
lm
Box
elde
r
Co
tto
nw
oo
d
(Mis
sour
i R
iver
)
Co
tto
nw
oo
d
(Lit
tle
Mis
sour
i R
iver
)
BU
r oa
k (M
isso
uri
Riv
er)
(B2)
(B
1)
Una
djus
ted
(AB
2)
To
tal
Rad
ial
To
tall
Rad
ial
Ad
just
ed
Rad
ial
Woo
d G
row
th
Woo
d G
row
th
Woo
d G
row
th
Num
bers
of
Per
Cor
e (m
m)
Per
Cor
e (m
m)
Per
Cor
e (m
m)
Cor
es a
nd
11
93
5-1
95
4
19
55
-19
74
1
95
4-1
97
4
Sta
nds
Incl
ud
ed
t X
X
X
34
(8)
3
65
2
89
30
4
48
(7)
36
1
23
5
264
29
(7
) 4
10
26
4
316
26 (
5)
47
2
30
6
41
3
25 (
4)
38
3
35
5
47
2
20 (
3)
32
0
29
6
Wilc
oxo
n S
ign-
Ran
k Z
-Val
ues
f (B
2-A
B2
)
-32
1 (p
lt 0
001
)
-48
1 (p
lt 0
0001
)
-26
5 (p
lt 0
00
8)
-12
4 (N
S)
+2
18
(p
lt 0
03
)
(B1-
B2
)
-22
0 (
p lt
00
3)
TA
BL
E 2
(co
ntin
ue
d)
(82
) (8
1)
Un
adju
sted
(A
82
) T
ota
l R
adia
l T
ota
l R
adia
l A
dju
sted
Rad
ial
Wo
od
Gro
wth
W
ood
Gro
wth
W
oo
d G
row
th
Nu
mb
ers
of
Per
Co
re (
mm
) P
er C
ore
(m
m)
Per
Co
re (
mm
)
Spe
cies
C
ores
an
d
Sta
nd
s In
clu
ded
t 19
35-1
954
X
1955
-197
4 X
19
54-1
974
X
Wil
cox
on
Sig
n-R
ank
Z-V
alu
es
(8
2-A
82
) (8
1-8
2)
Bur
oak
(S
carp
wo
od
lan
d)
10 (
1)
171
1
93
-1
4
8 (
NS
)
See
tex
t fo
r m
eth
od
of
adju
stm
ent
Po
st-d
am g
row
th o
f b
ur
oak
was
no
t ad
just
ed b
ecau
se m
ost
cas
es s
ho
wed
an
incr
ease
in
gro
wth
b
etw
een
th
e tw
o p
re-d
am p
erio
ds
tPar
enth
eses
in
dic
ate
stan
ds
incl
ud
ed
tSo
urc
e H
oll
and
er a
nd
Wol
fe [
1973
]
(J
1
76
TABLE 3 Median Percent Change in Growth for Pre-Dam (1935-1954)
and Post-Dam (1955-1974) Periods
Species Median Percent Change
Boxelder -26 American elm -25 Green ash -18 Bur oak (Missouri River) - 9
Cottonwood (Missouri River) - 6 Cottonwood (little Missouri River) +13 Bur oak (scarp woodland) +20
Species connected by vertical lines are not significantly different (multiple comparishysons test p lt 005 Hollander and Wolfe [1973]
TABLE 4 Frequency Table (Number of Stands) of Change
in Growth Relative to Terrace Elevation
Classes of Percent Change Terrace Elevation Class t
in Growth Low Medium High
Low 0 3
Medium 3 2 0
High 0 3
Low = less than 5 percent decrease medium = 5-20 percent increase high =greater than 20 percent increase
t Low = approximately 3 m above mean river level medium = approximately 4 m above mean river level high = approximately 5 m above mean river level
TA
BL
E 5
C
hara
cter
isti
cs o
f S
tan
ds
Sam
pled
for
Tre
e-R
ing
Chr
onol
ogie
s
Sta
nd
Spe
cies
Sam
pled
S
oil
Org
an
ic
N0
3-N
N
o
and
Mea
n A
ge
Te
xtu
re
Ma
tte
r (
) (p
pm
)
Mis
sou
ri R
ive
r F
loo
dp
lain
5
Co
tto
nw
oo
d (
80
yea
rs)
sand
0
76
1
3
14
Co
tto
nw
oo
d (
10
0 y
ears
) si
lty-
cla
y 2
22
2
4
12
A
me
rica
n e
lm (
80
yea
rs)
silt
y-cl
ay
29
2
16
1
3
Am
eri
can
elm
(1
35
yea
rs)
silt
y-c
lay
26
9
43
1
9
Am
eri
can
elm
(1
05
yea
rs)
silt
4
40
3
6
16
B
ur
oa
k (1
25
yea
rs)
silt
y-cl
ay
40
7
32
Ref
eren
ce S
ites
Lit
tle
Mis
sour
i R
iver
C
ott
on
wo
od
(1
00
yea
rs)
Sca
rp w
oo
dla
nd
B
ur
oa
k (1
20
yea
rs)
So
urc
e f
or
soil
cha
ract
eri
stic
s J
oh
nso
n
Bur
gess
an
d K
ea
mm
ere
r [1
97
6]
Ele
vatio
n A
bov
e
Mea
n R
ive
middotr Le
vel
(m)
30
32
3
5
40
4
0
50
28
-J
-J
-J co
TA
BL
E 6
R
esul
ts o
f S
tep
wis
e M
ulti
ple
Reg
ress
ion
Ana
lysi
s U
sing
Tre
e-R
ing
Inde
x as
th
e D
epen
den
t V
aria
ble
an
d 1
5 I
nd
epen
den
t V
aria
bles
(C
lim
ate
Str
eam
flo
w
Pre
viou
s Y
ear
s G
row
th)
Sta
ndar
dize
d S
peci
es
Inte
rce
pt
Reg
ress
ion
Co
eff
icie
nt
Co
tto
nw
oo
d
Sta
nd 5
P
re-d
am
-27
6 +
82
8
-20
3 +
36
0
+3
33
-3
52
Pos
t-da
m
-64
8 +
16
9
+5
76
+
26
2
-37
3 +
04
2
Sta
nd 1
4 P
re-d
am
-21
7 +
41
0
+3
24
-2
48
+6
62
+0 4
7
Post
-dam
-1
5
+4
20
-5
44
+11
71
+2
99
-34
9
En
viro
nm
en
tal
Var
iabl
es
Ap
ril-
Ma
y F
low
(A
MF
L)
Ju
ne F
low
(JU
NE
F)
Spr
ing
Pre
cip
Y-l
(S
PG
P1)
S
prin
g P
reci
p (S
PG
P)
Spr
ing
AE
Y-l
(S
PG
AE
1)
June
Flo
w (
JUN
EF
)
Spr
ing
AE
(S
PG
AE
)
Spr
i ng
Te
mp
Y-l
(S
PG
T1)
F
all
Te
mp
Y-l
(F
AL
LT
1)
Pre
viou
s G
row
th (
AV
E 5
-1)
A p
ril-
May
Flo
w (
AM
FL
)
Spr
ing
Pre
cip
Y-1
(S
PG
P1)
A
pri
l P
reci
p (A
P)
S
pri
ng
Pre
cip
(SP
GP
) P
revi
ous
Gro
wth
(A
VE
14
-1)
Spr
ing
Pre
cip
Y-l
(S
PG
P 1
)
Spr
ing
Pre
cip
(SP
GP
) S
prin
g A
E (
SP
GA
E)
S
pri n
g T
em
p Y
-l (
SP
GT1
)
Fal
l T
emp
Ymiddotl
(F
A L
LT
1)
r2
F
p
08
2
162
3 0
0001
0 7
1 8
61
00
00
3
07
3
98
6
00
001
07
5 10
61
00
001
TA
BL
E 6
(co
ntin
ue
d)
Sta
ndar
dize
d S
peci
es
Inte
rce
pt
Reg
ress
ion
Co
eff
icie
nt
En
viro
nm
en
tal
Var
iabl
es
r2
F p
Bur
oak
S
tand
16
Pre
-dam
-2
814
+
38
0
Ap
ril-
Ma
y F
low
(A
MF
L)
05
2
312
0
03
+2
98
S
prin
g A
E Y
-1
(SP
GA
E 1
) +
47
9
Spr
ing
Te
mp
Y-1
(S
PG
T1)
+
35
8
Fal
l T
em
p Y
-1
(FA
LLT
l)
-49
9 S
prin
g T
emp
(SP
GT
) +
024
P
revi
ous
Gro
wth
(A
VE
16-
1)
Pos
t-dam
-4
216
+
39
5
Ap
ril-
Ma
y F
low
(A
MF
L)
077
12
06
00
00
1 +3
61
June
Flo
w Y
-1
(JU
NE
F1
) +
23
5
Ap
ril
Pre
cip
(AP
) +
417
S
prin
g A
E (
SP
G A
E )
+3
10
S
prin
g T
em
p (
SP
GT
)
Sca
rp w
oo
dla
nd
P
re-d
am
-18
9 -3
01
June
Flo
w (
JUN
EF
) 0
36
269
0
06
2 +
38
0
Spr
ing
Pre
cip
Y-1
(S
PG
P1)
+
30
3
Ap
ril
Pre
cip
(A P
) +
387
S
prin
g A
E (
SP
GA
E)
Pos
t-dam
-7
37
+34
4 Ju
ne F
low
Y-1
(J
UN
EF
1)
04
1
33
3 0
032
+
19
5
June
Flo
w (
JUN
EF
) +
227
S
prin
g P
reci
p (S
PG
P)
+04
1 P
revi
ous
Gro
wth
(A
VE
10
-1)
-J co
(co
nti
nu
ed
)
00
a
TA
BL
E 6
(co
nti
nu
ed
)
Sta
ndar
dize
d S
peci
es
Inte
rce
pt
Reg
ress
ion
Co
eff
icie
nt
En
viro
nm
en
tal
Var
iabl
es
r2
F
p
Am
eri
can
elm
S
tand
12
Pre~am
+3
69
4
+3
96
A
pri
l-M
ay
Flo
w (
AM
FL
) 0
55
3
42
00
211
-48
3 Ju
ne F
low
(JU
NE
F)
+9
89
S
prin
g P
reci
p Y
-1
(SP
GP
1)
+3
35
S
prin
g P
reci
p (S
PG
P)
-49
3 S
prin
g A
E (
SP
GA
E)
-33
8 S
prin
g T
emp
(SP
GT
)
Post~am
-13
77
-29
7 A
pri
l-M
ay
Flo
w Y
-1
(AM
F L
1)
04
7
25
5
00
6
+5
47
June
Fl o
w Y
-1
(JU
NE
F1
) -5
78
A
pri
l-M
ay
Flo
w (
AM
FL
) +
68
5
June
Flo
w (
JUN
EF
) -2
45
Fal
l T
em
p Y
-1
(FA
LL
T1
) -3
72
Spr
ing
Te
mp
(S
PG
T)
Sta
nd 1
3 Pre~am
+3
08
3
-50
0 A
pri
l-M
ay
Flo
w Y
-1
(AM
FL
1)
06
3
61
8
00
01
7
+3
13
Ju
ne F
low
Y-1
(J
UN
EF
1)
+52
1 S
prin
g P
reci
p Y
-1
(SP
GP
1)
+2
85
S
prin
g T
em
p Y
-1
(SP
GT
1)
-62
8 S
prin
g T
em
p (
SP
GT
)
Post~am
+52
51
-69
8 S
prin
g P
reci
p Y
-1
(SP
GP
1)
05
4
552
0
00
4
+1
00
9
Spr
ing
AE
Y-1
(S
PA
E1)
-3
64
Spr
ing
Te
mp
Y-1
(S
PG
T1)
-4
15
Ap
ril
Te
mp
(A
T)
TA
BL
E 6
(co
ntin
ue
d)
Sta
ndar
dize
d S
peci
es
Inte
rce
pt
Reg
ress
ion
Co
eff
icie
nt
En
viro
nm
en
tal
Var
iabl
es
r2
F
p
Sta
nd 1
9
Pre
ltlam
+
19
98
+
39
5
Ap
ril-
Ma
y F
low
(A
MF
L)
05
1 3
70
0
01
76
+
11
06
S
prin
g P
reci
p Y
-1
(SP
GP
1)
-99
4 S
prin
g A
E Y
-1
(SP
GA
E1)
-4
91
Spr
ing
Te
mp
(S
PG
T)
Pos
tltla
m
-11
34
+4
57
Ap
ril-
Ma
y F
low
Y-1
(A
MF
L1)
0
67
73
8
00
00
6 -5
44
Ap
ril-
Ma
y F
low
(A
MF
L)
+6
29
Ju
ne F
low
(JU
NE
F)
-19
7 A
pri
l P
reci
p (A
P)
+3
47
S
prin
g A
E (
SP
GA
E)
co
82
TABLE 7 Results from the Modified Regression Model
Stand Pre-Dam Post-Dam
Cottonwood 5 Streamflow A E
(0004) t (001)
14 Streamflow AE (002) (001 )
Elm 12
13
19 AE (003)
Oak 16 AE AE
(005) (0006)
Streamflow (0006)
Scarp woodland AE (005)
Growth = growing season AE and growi ng season streamflow using the G LM proshycedure in SAS [Helwig and Council 1979] Growing season is May June and July
tParentheses indicate levels of significance
TABLE 8 Missouri River Erosion and Deposition Rates at Various Time Intervals
Time Total Erosion Total Deposit ion Interval Time (yr) Erosion (ha) Rate (hayr) Deposition Rate (ha yr)
1881-1891 10 1328 133 1650 165
1891-1945 54 4648 86 5464 101
1945-1969 22 1704 77 937 43
1969-1979 10 212 21 13 13
TA
BL
E 9
M
isso
uri
Riv
er L
and
Use
Cha
nges
Sin
ce E
arly
Set
tlem
ent
Per
cen
tage
of
Cov
erag
e
Cat
egor
y T
ime
Peri
od
Pre
-set
tlem
ent
Pos
t-se
ttle
men
t
Agr
icul
ture
18
72-1
938
38
A
gric
ultu
re
1938
-197
9 18
C
otto
nwoo
d w
illo
w
lt 40
yea
rs o
f ag
e 14
3
Cot
ton
woo
d 40
-80
year
s o
f ag
e p3
10
C
otto
nwoo
d a
sh
elm
bo
xeld
er
80-1
50 y
ears
of
age
30
21
Ash
el
m
boxe
lder
gt
150
yea
rs o
f ag
e 3
10
co
w
(I)
w CJ z C ()
W (I)
l I
Q Z C
J W Z Z C ()
ac w gt ac
The Virginia Water Resources Research Center is a federal-state partnership agency attempting to find solutions to the states water resources problems through careful research and analysis Established at Virginia Polytechnic Inshystitute and State University under provisions of the Water Research and Develshyopment Act of 1978 (PL 95-467) the Center serves six primary functions
bull It studies the states water and related land-use problems including their ecological political economic institutional legal and social i mpl ications
bull It sponsors coordinates and administers research investigations of these problems
bull It collectsmiddotand disseminates information about water resources and water resources research
bull It provides training opportunities in research for future water scienshytists enrolled at the states colleges and universities
bull It provides other public services to the state in a wide variety of forms
bull It facilitates coordinated actions among universities state agencies and other institutions
More information on programs and activities may be obtained by writing or te lephoning the Center
Vi rgin ia Tech does not discriminate against employees students or applicants on the basis of race sex handicap age veteran status national origin religion or political affiliation The Un iversity is subject to Titles VI and VII of the Civil Rights Act of 1964 Title IX of the Education Amendments of 1972 Sections 503 and 504 of the Rehabilitation Act of 1973 the Age Discrimination in Employment Act the Vietnam Era Veteran Readjustment Assistance Act of 1974 Federal Executive Order 11246 Governor Robbs State Executive Order Number One and all other rules and regulations that are applicable Anyone having questions concerning any of those regulations should contact the Equal OpportunityAffirmative Action Office
Virginia Water Resources Research Center Virginia Polytechnic Institute and State University
617 North Main Street Blacksburg Virginia 24060-3397
Phone (703)961-5624