Embed Size (px)
Citation preview

1
THE BUSINESS CASE FOR SUSTAINABLE
AGRICULTURE IN ASIA
by
Juan Pablo Garcia, Ashlyn Gurley, Joanna Herrmann,
Michelle Mabson, Purnima Subramanian, Monica Wyant
A project submitted
in partial fulfillment of the requirements
for the degree of:
Master of Science
(Natural Resources and Environment)
at the University of Michigan
April 2015
Faculty Advisor:
Professor Shelie Miller
2
Abstract
Kellogg Company sources agricultural commodities from around the world to manufacture its
products; the company is committed to enhancing the natural resources and livelihoods of the
areas and people from whom it sources its ingredients. As part of its Project K Initiative, Kellogg
is working to build the global supply chain of the future by making investments in emerging
markets. Kellogg seeks to understand how its current work in Thailand and India (with rice and
corn, respectively) impacts the triple bottom line. Specifically, this research evaluates impacts
on the environment, farmer livelihoods, and with regards to improving Kellogg’s top/bottom
lines and security of supply.
Rice represents a particular sourcing priority for the Asia Pacific and Africa region because it is
needed by every plant in the region and is central for the production of two of Kellogg’s most
celebrated brands: Rice Krispies and Special K. The company uses a specific variety - medium
grain rice - for the production of its cereal. Historically, medium grain rice has grown only in
certain temperate regions; however, increasing climatic stress in these areas and the need for a
reliable medium grain rice supply to meet the needs of the growing Asia Pacific region led
Kellogg to develop its own variety of seed able to grow in tropical climates. In 2014, Kellogg
implemented a medium grain rice pilot program in Thailand.
This project uses farmer and expert survey results and desktop research to determine if Kellogg’s
initiative can provide a viable source of medium grain rice to support the manufacturing of
Kellogg products in Asia Pacific while improving farmer livelihoods through improved
agronomic practices and income security and reducing negative impacts on the environment. The
primary objective of the survey and subsequent analysis was to determine the necessary elements
to create a secure and sustainable supply chain for medium grain rice production in Thailand, and
to present interventions Kellogg Company can implement to improve production.
Corn is the main ingredient incorporated into a number of products including the iconic Corn
Flakes cereal brand. In India, low cost corn, grown with non-GMO seeds, represent
characteristics that are paramount for continued use in Kellogg products. Currently, corn
accounts for 9% of total cereal production in India with numbers doubling in the past decade and
expected to increase. Nonetheless, yields are about half of the global average with climactic
conditions and limited technical resources contributing to lack of capacity to increase quality and
quantity of yields.
Through interactions with farmers and millers, complexities within the corn supply chain have
been better understood. Survey results gleaned from farmer interviews reveal that a combination
of pre-harvest and post-harvest practices contributes to the lessened quality and quantity of corn.
Additionally, senior-level management identified their concerns and willingness to support
proposed strategy interventions based on responses from farmers. Overall, considering farmer
and miller perspectives along with senior-level management provides the opportunity to identify
the most viable intervention strategies that are low cost and will have a net benefit for key
stakeholders.
3
Table of Contents Executive Summary .......................................................................................................................................... 4
Introduction .......................................................................................................................................................... 4
Project Objectives............................................................................................................................................. 5
Corn in India.......................................................................................................................................................... 6
Kellogg’s Supply Network. .............................................................................................................................. 7
History of Kellogg Corn Flakes & Brand Legacy ............................................................................... 8
Kellogg Presence in India .............................................................................................................................. 9
Peer Practices and Sustainability Initiatives................................................................................... 10
Research Methodology ................................................................................................................................. 11
Survey Development. ..................................................................................................................................... 11
Farmer, Mill & Trader Interviews. ............................................................................................................. 12
Mill and Trader Survey. ................................................................................................................................ 13
Kellogg Leadership Survey. ......................................................................................................................... 13
Interview bias. .................................................................................................................................................. 13
Survey Analysis ................................................................................................................................................. 13
Farmer Survey Statistics and Insights. ...................................................................................................... 13
Table: 1 Farmer Demographics .............................................................................................................. 14
Table 2: Farmer Practices ........................................................................................................................ 14
Table 3: Farmer Expectations and Concerns ...................................................................................... 15
Mill Survey Insights. ...................................................................................................................................... 16
Internal Management Survey Insights. ..................................................................................................... 16
Model Approach ............................................................................................................................................... 17
Model Description and Analysis .............................................................................................................. 17
Materiality Assessment Matrix. .................................................................................................................. 17
Identification of Intervention Strategies .......................................................................................... 20
Cost-Benefit Evaluation of Intervention Strategies. ............................................................................. 21
Assumptions and results in Cost-Benefit Analysis ....................................................................... 21
Cost Categories. .............................................................................................................................................. 22
Benefit Categories. ......................................................................................................................................... 23
Results. ............................................................................................................................................................... 23
Recommendation and Next Steps .......................................................................................................... 23
Partnership opportunities. ............................................................................................................................. 24
Appendix .............................................................................................................................................................. 26

4
Executive Summary The purpose of this project is to identify interventions in the supply chain in order to increase the
quality and quantity of corn yields in India. Utilizing a stakeholder materiality assessment,
identified priorities have been further analyzed utilizing a cost-benefit analysis (CBA) that
identifies and quantifies costs, benefits, challenges and tradeoffs.
Corn is the main ingredient incorporated into a number of products, including the iconic Corn
Flakes cereal brand. In India, low cost corn, grown with non-GMO seeds represent
characteristics that are paramount for continued use in Kellogg products. Currently, corn
accounts for 9% of total cereal production in India with numbers doubling in the past decade and
expected to increase.1 Nonetheless, yields are about half of the global average with climactic
conditions and limited technical resources contributing to lack of capacity to increase quality and
quantity of yields.
Through interactions with farmers and millers, complexities within the corn supply chain have
been better understood. Additionally, demographic information, key practices and key concerns
were identified through survey dissemination. Survey results gleaned from farmer interviews
reveal that a combination of pre-harvest and post-harvest practices contributes to the lessened
quality and quantity of corn. Additionally, a survey of senior-level management and subsequent
materiality assessment identified their concerns and willingness to support proposed strategy
interventions based on responses from farmers.
Intervention strategies focus on three key areas – technical assistance, post-harvest intervention,
and pre-harvest intervention – that can be employed to improve quality and quantity of corn
yields. The intervention strategies were then analyzed using a CBA; subsequently, net cost and
benefit scenarios were created for each strategy. Accounting for both farmers and millers
perspectives along with senior-level management provided the ability to identify the most viable
intervention strategies that are low cost and have a net benefit for key stakeholders.
Introduction
The Kellogg Company leads as a socially responsible, sustainable company by working to source
commodities from around the world in a manner consistent with its purpose to “nourish families
to they can flourish and thrive.”2
1 Ministry of Commerce and Industry, Government of India. (2015). “Indian Agriculture Industry.” Retrieved from:
http://www.ibef.org/industry/agriculture-india 2 Kellogg Company. (2014). “About Kellogg Company.” Retrieved from:
http://www.kelloggcompany.com/en_US/our-vision-purpose.html

5
The company has continued its commitment to supporting communities and families with its
newly stated Global Sustainability 2020 Commitments, in which the company has made
dramatic commitments to support responsible sourcing through the use of sustainable agriculture,
smallholder farmers, and female and minority workers.3 The company has also made significant
commitments to conserve natural resources through projects to reduce energy, water, waste and
excess packaging in its operations.4
The Global Sustainability 2020 Commitments represent significant global commitments across
all of the Kellogg business units. The company has the following reportable segments, either
based on product category or geographic location: U.S. Morning Foods, U.S. Snacks, U.S.
Specialty, North America Other, Europe, Latin America, and Asia Pacific.5 Of these business
units, one of the fastest growing is the Asia Pacific region, which posted a 3.1% growth in sales
in 2014, driven by strong cereal sales in India, Southeast Asia and Japan.6
Within Asia Pacific, corn is an important raw material in production. As the Asia Pacific
business unit continues to grow, corn will become increasingly important in procurement,
specifically Indian corn. Corn from India can be procured non-GMO, which is important for
various Asian markets and it can be procured at low cost while also providing markets to
shareholder farmers.
Project Objectives
A team of University of Michigan’s School of Natural Resources and Environment students
surveyed corn growers on a ten-day trip to India, with 2-3 days spent in Pune and Sangli,
respectively. The following objectives were derived from the survey and upstream supply- chain
stakeholder interactions along with the procurement team at Kellogg Company, Mumbai in order
to primarily improve the quality and quantity of corn produced7 in the Indian operations of
Kellogg Company.
1. Analyze scenarios relating farmer-level and miller-level in the supply chain utilizing a data
driven stakeholder materiality assessment to identify the most significant and applicable
intervention strategy by Kellogg Company for positive impact on all relevant stakeholders.
3 Kellogg Company. (2014). “Global Sustainability 2020 Commitments.” Retrieved from:
http://www.kelloggcompany.com/content/dam/kelloggcompanyus/corporate_responsibility/pdf/2014/Sustainability_
2020Commitments_Final.pdf 4 Kellogg Company. (2014). “Global Sustainability 2020 Commitments.” Retrieved from:
http://www.kelloggcompany.com/content/dam/kelloggcompanyus/corporate_responsibility/pdf/2014/Sustainability_
2020Commitments_Final.pdf 5 Kellogg Company. (2014). “2014 Annual Report Form 10-K.” p.66 Retrieved from:
http://investor.kelloggs.com/files/doc_financials/annual_reports/K_2013_10-K%20with%20supplement.pdf 6 Kellogg Company. (2014). “2014 Annual Report Form 10-K.” p.19 Retrieved from:
http://investor.kelloggs.com/files/doc_financials/annual_reports/K_2013_10-K%20with%20supplement.pdf 7 Based on internal stakeholder survey preferences

6
2. Address the identified significant and applicable intervention strategy derived, using cost-
benefit analysis; combining the creation of shared value as increased livelihood for farmers,
decreased procurement costs and complexity for millers as well as Kellogg Company in order to
secure the supply chain and create value through Corporate Social Responsibility practices for
Kellogg Company in the long run.
3. Utilize interview data to provide evaluation of the potential economic and societal impacts to
the stakeholders involved and measurable environmental impacts within each applicable
intervention strategy.
Corn in India
Growing crops in India can be a challenging and complex endeavor. The Indian agricultural
sector accounts for 18% of GDP and employs half the country’s workforce.8 The country has
many strides over the past few years towards significantly boosting yields through the increased
use of hybrids and research.
Although India has abundant natural resources, growing across these regions is difficult because
the country is so diverse. The India Ministry of Earth Sciences has identified 127 agro-climatic
zones in India; this means each zone has a distinct rainfall pattern, soil type, irrigation
availability and cropping options.9 Identifying the best seeds and inputs for a specific region are
particularly challenging because climactic zones can vary in as small as region as 10 kilometers.
Farmers within this distance of one another in different zones should not be using the same
seeds, which is extremely challenging from a technical assistance perspective.
The Government of India has implemented many projects over recent years aimed at increasing
investment in the food processing industry, investing in infrastructure and technology for
farmers, and stabilizing market process for farmers in time of volatility.10 One such initiative is
aimed at providing insurance to farmers to protect them against price risk; the effort aimed
toward encouraging crop diversification.11
Currently corn is the third most important cereal crop after rice and wheat, accounting for 9% of
total grain production.12 Corn production has nearly doubled over the past decade from 14
million metric tons in 2003 to 23 million metric tons in 2013. The increase in acreage has been
8 Ministry of Commerce and Industry, Government of India. (2014). “Indian Agriculture Industry.” Retrieved from:
http://www.ibef.org/industry/agriculture-india.aspx 9 Ministry of Earth Sciences, Agricultural Meteorological Division. (2015). “Delineation of Agroclimactic Zones of
India under National Agricultural Research Project (NARP)”. Retrieved from:
http://www.imdagrimet.gov.in/node/290 10 Ministry of Commerce and Industry, Government of India. (2015). “Indian Agriculture Industry.” Retrieved from:
http://www.ibef.org/industry/agriculture-india.aspx 11 Ministry of Commerce and Industry, Government of India. (2015). “Indian Agriculture Industry.” Retrieved from:
http://www.ibef.org/industry/agriculture-india 12 Singh, A.D. (2014). “India Maize Summit ’14.” P.11. Retrieved from:
http://www.ficci.com/spdocument/20386/India-Maize-2014_v2.pdf

7
the result of low labor costs, and a lower water table in the rice belt. Despite the rapid increase,
it’s still estimated that only 60% of corn production is under hybrid cultivation.
In India, corn yields lag far behind the rest of the world at roughly half the global average.13
Reasons include: climatic conditions resulting in
drought, excess water associated with increased
pressure of diseases, lack of development of single
cross hybrid technology, limited adoption of
improved technology, deficiencies in the
production and distribution system of quality seed,
small farm holdings and limited resource
availability to farmers.14
Despite these hurdles, the Indian government has
been encouraging the cultivation of corn by raising
baseline prices that must be paid at mandi markets.
In 2013, the government set a baseline price for Rs
1,310 per quintal, comparatively high compared to
rich and other grains.15 This is because corn is a
resilient crop that can be easily used by the starch
and feed meal industries.
Kellogg’s Supply Network. The corn supply
chain of India is composed of many actors working
to supply the market. The actors within this supply
chain consist of farmers, traders, and millers. This
complex supply chain composed of various actors
provides difficulty in allowing Kellogg direct
visibility to the lowest levels of its supply
network.
At the base of the supply chain, farmers produce
corn throughout two growing seasons, July-October, and October-March. Corn in grown in nine
states throughout India.16 (See Appendix A for a map of growing region.) Farmers then choose to
either sell their crop at local mandi markets or to traders.
Mandi markets are local markets where commodities are auctioned off. Crop prices at local mandis
depend on a government minimum baseline price, and the quality and quantity of corn being sold
on that given day.
13 Singh, A.D. (2014). “India Maize Summit ’14.” P.13. Retrieved from:
http://www.ficci.com/spdocument/20386/India-Maize-2014_v2.pdf 14 Singh, A.D. (2014). “India Maize Summit ’14.” P.13. Retrieved from:
http://www.ficci.com/spdocument/20386/India-Maize-2014_v2.pdf 15 Singh, A.D. (2014). “India Maize Summit ’14.” P.21. Retrieved from:
http://www.ficci.com/spdocument/20386/India-Maize-2014_v2.pdf 16 Retrieved from: http://www.ficci.com/spdocument/20386/India-Maize-2014_v2.pdf

8
Traders go to local villages to buy crops directly from farmers and often store crops in their own
warehouses before selling in mandi markets. A farmer might choose to sell to a trader to avoid the
trip to the mandi, or if he needs funds immediately. Traders act as credit for farmers in the off
season, but their interest rates can run much higher than banks or other more formal lending
mechanisms. Traders working on behalf of mills also go to mandi markets to buy corn for
processing into corn grit product needed to its corn flakes.
In the case of Kellogg Company, multiple actors involved in the agricultural supply chain have
affected the supply of corn needed to ensure quality raw material for the company’s signature Corn
Flakes cereal product line. The company’s Asia Pacific division producing in India, is now
working with a complex supply chain
Unfortunately, because of competing priorities at various levels of the supply chain, the company
is faced with many chronic problems in procuring sufficient amounts of quality corn for
production. The problems center on issues that influence yield and quality, and can mainly be
segregated into pre and post-harvest issues.
Pre-harvest issues include types of seed used and water access. There was a high occurrence of
“seed mixing” among poorer farmers surveyed. There is a very high potential for yields to grow
as a result of farmers adopting better quality seeds, especially higher quality hybrids.17 Seed
mixing occurs at the mandi level and at the field level when farmers mix different brands of seeds
together for planting.
Post-harvest issues include drying and storage. Mills that were surveyed in India had high rejection
rates from the occurrence of aflatoxin fungus in crops. Aflatoxin is a fungus that’s caused in corn
by moisture and heat stress; toxic to warm-blooded animals, any grain infested with the fungus
cannot be accepted.18 Aflatoxin fungus and grain damage can be reduced with proper grain and
decobbing procedures, proper handling procedures, minimal reuse of grain sacks, which can host
fungus from season to season. The potential for both of these issues to be addressed with technical
assistance is also significant. After improved quality yields are obtained, Kellogg Company will
be able to achieve a continual supply of product for corn flake production.
History of Kellogg Corn Flakes & Brand Legacy
Corn is the main cereal incorporated into a number of products including the iconic Corn Flakes
as well as Corn Pops, Frosted Flakes, Crunchy Nut, Fruit Loops, Crispix and more19. Kellogg’s
Corn Flakes have been an American household staple since the early 20th century. The first batch
17 Kesireddy, R. R. (2014). Hybrid Maize Market Set To Double in Two Years. Economic Times. Retrieved from:
http://economictimes.indiatimes.com/markets/commodities/hybrid-maize-seed-market-set-to-double-in-two-
years/articleshow/33471034.cms 18 Sumner, P.E. & Lee, D. (2012). Reducing Aflatoxin in Corn During Harvest and Storage. University of Georgia
Cooperative Extension Journal. Retrieved from: http://extension.uga.edu/publications/files/pdf/B%201231_3.PDF 19 Kellogg Company. “Our Brands.” (2011). Cereal Products. Retrieved from:
http://www.kelloggs.com/en_US/product-search.pt-Cereal*.html

9
of the iconic cereal was created by founder W.K. Kellogg and his brother, Dr. John Harvey
Kellogg in 1906 and has since become a household brand in over 180 countries, worldwide20.
The cereal maverick continued to innovate within the ready-to-eat cereal market, creating new
production line and packaging techniques and expanding production to new markets like Canada,
Australia, England all before W.K. Kellogg’s death in 1951. Continuing through the 1950s,
Kellogg production expanded into Mexico and New Zealand2.
As a response to increased awareness of the importance of nutrition and the role of fitness,
Kellogg became the first cereal company to list the sugar content on the side panel of its
products2. In 1997, Kellogg’s created the W.K. Kellogg Institute for Food and Nutrition
Research (WKKI), which is committed to creating ‘great-tasting’ food from ‘wholesome grains’,
including the staple, corn. One decade later, WKKI expanded to include a 157,000 square-foot
pilot plant with office space in order to grow Kellogg’s global center for research and innovation
activities21.
Kellogg Presence in India
Two of the most popular Kellogg brands in India include the original Corn Flakes and Chocos –
a chocolaty cereal brand of children around the country.22 According to the Kellogg Company
2013 Annual Investors Report, the Asia Pacific division internal net sales grew by 3.0% resulting
from ‘favorable volume’ and offset by ‘unfavorable pricing/mix.’23 The growth was propelled by
steady cereal performance in India, Southeast Asia and Japan. In addition, as of February 2014,
new manufacturing & manufacturing facilities have been established in India, Japan and South
Korea5.
As of August 2014, Kellogg India launched the ‘No More Excuses’ campaign – an initiative
aimed at helping women ‘get rid of their excuses’ and manage their weight in a healthy way
utilizing Kellogg Special K24. The campaign features brand ambassador Deepika Padukone, a
prominent Indian film actress and model, who helps to motivate women to engage with her in a
weight management journey. Kellogg India has stated that it is committed to educating Indian
consumers about the importance of breakfast cereal as a means to address nutrition and fitness.6
This report is well aligned with Kellogg Company’s Global Sustainability 2020 Commitments,
declared in August 2014. Such commitments include responsible sourcing, sustainable
20 Kellogg Company. “Our History.” (2011). Our Best Days Are Yours. Retrieved from:
http://www.kelloggs.com/en_US/our-history.html 21 Kellogg Company. “Kellogg Company to Expand.” (2007). News Room, W.K. Kellogg Institute for Food and Nutrition Research. Retrieved from: http://newsroom.kelloggcompany.com/index.php?s=27529&item=76229 22 Kellogg Company. India Brands (2012). “Brands and Products.” Retrieved from: https://www.kelloggcompany.co.in/Brand_Landing.aspx 23 Kellogg Company. (2013). “2013 Annual Report – Fiscal Year End December 28, 2013.“ Retrieved from: http://investor.kelloggs.com/files/doc_financials/annual_reports/K_2013_10-K%20with%20supplement.pdf 24 Kellogg Company, India. (2014). “Kellogg’s Special K Gives Women a Reason to Get Back to Live with ‘No More Excuses’.” Retrieved from: http://investor.kelloggs.com/files/doc_financials/annual_reports/K_2013_10-K%20with%20supplement.pdf
10
agriculture and assisting smallholder farmers2. In India and around the globe, smallholder
farmers play an integral role in sustaining the global food supply and this report contributes
directly to identifying and understanding the risks and opportunities such farmers face in specific
regions. As stated within the 2020 report, ‘Kellogg will continue to support agricultural
suppliers, millers and farmers… [and will] do its part to minimize the impacts of agricultural
production and help the agricultural sector be more sustainable2. Sourcing of corn in India
requires a direct association with millers who obtain corn from smallholder farmers. Ultimately,
this assessment will help to identify the needs of millers along with the needs of smallholder
farmers in order to help build relationships and drive sustainability improvements along the
supply chain in India.
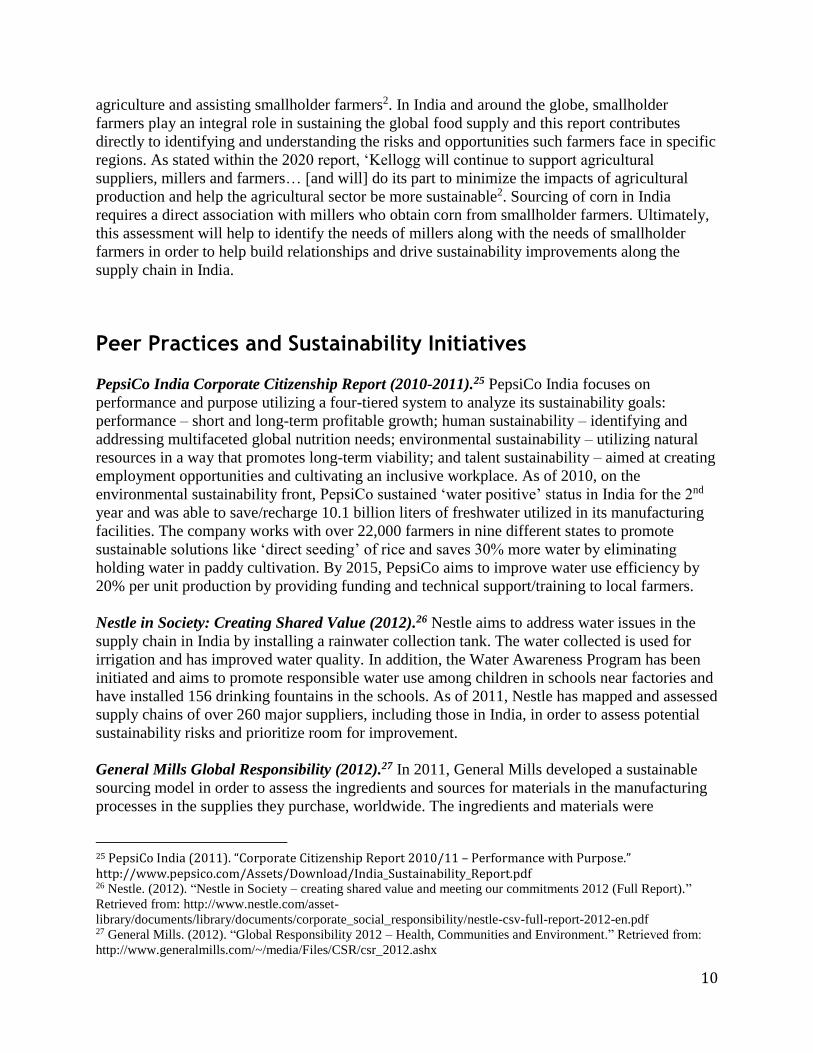
Peer Practices and Sustainability Initiatives
PepsiCo India Corporate Citizenship Report (2010-2011).25 PepsiCo India focuses on
performance and purpose utilizing a four-tiered system to analyze its sustainability goals:
performance – short and long-term profitable growth; human sustainability – identifying and
addressing multifaceted global nutrition needs; environmental sustainability – utilizing natural
resources in a way that promotes long-term viability; and talent sustainability – aimed at creating
employment opportunities and cultivating an inclusive workplace. As of 2010, on the
environmental sustainability front, PepsiCo sustained ‘water positive’ status in India for the 2nd
year and was able to save/recharge 10.1 billion liters of freshwater utilized in its manufacturing
facilities. The company works with over 22,000 farmers in nine different states to promote
sustainable solutions like ‘direct seeding’ of rice and saves 30% more water by eliminating
holding water in paddy cultivation. By 2015, PepsiCo aims to improve water use efficiency by
20% per unit production by providing funding and technical support/training to local farmers.
Nestle in Society: Creating Shared Value (2012).26 Nestle aims to address water issues in the
supply chain in India by installing a rainwater collection tank. The water collected is used for
irrigation and has improved water quality. In addition, the Water Awareness Program has been
initiated and aims to promote responsible water use among children in schools near factories and
have installed 156 drinking fountains in the schools. As of 2011, Nestle has mapped and assessed
supply chains of over 260 major suppliers, including those in India, in order to assess potential
sustainability risks and prioritize room for improvement.
General Mills Global Responsibility (2012).27 In 2011, General Mills developed a sustainable
sourcing model in order to assess the ingredients and sources for materials in the manufacturing
processes in the supplies they purchase, worldwide. The ingredients and materials were
25 PepsiCo India (2011). “Corporate Citizenship Report 2010/11 – Performance with Purpose.” http://www.pepsico.com/Assets/Download/India_Sustainability_Report.pdf 26 Nestle. (2012). “Nestle in Society – creating shared value and meeting our commitments 2012 (Full Report).”
Retrieved from: http://www.nestle.com/asset-
library/documents/library/documents/corporate_social_responsibility/nestle-csv-full-report-2012-en.pdf 27 General Mills. (2012). “Global Responsibility 2012 – Health, Communities and Environment.” Retrieved from:
http://www.generalmills.com/~/media/Files/CSR/csr_2012.ashx

11
measured against dozens of potential risk categories, including ‘animal welfare, greenhouse gas
emissions, soil loss, water quality and water use’. With this model, GM is developing strategies
to address sustainable sourcing of key ingredients. In addition, GM has collected ‘supplier
scorecards’ from its top suppliers in order to assess data on ‘energy use, greenhouse gas
emissions, water and solid waste generation’ that may be associated with the
ingredients/materials utilized in products.
Research Methodology
The team used a mixed methods approach to conduct the project, involving grower and expert
interviews and a literature review. The work involved: (1) a comprehensive literature review and
interviews to develop the survey, (2) Corn farmer field interviews using the customized survey
along with interviews with mill owners and traders, and (3) consolidation of collected data, best
practices and intervention analysis.
Survey Development. To form the survey that would be deployed to smallholder farmers, mill
owners and traders in India, the team examined existing surveys and tools developed by
reputable NGOs and agricultural organizations working in the region. The team conducted
interviews with stakeholders in and outside of the Kellogg organization to understand ongoing
project. These sources included:
● Amy Braun, Senior Sustainability Manager, Kellogg Company, Global HQ, USA
● Alicia Perdon, Advanced Innovation Team, Kellogg Company, Global HQ, USA
● Atul Chavan, Senior Manager of Ingredients Procurement, Kellogg Company, Asia
Pacific & Africa
● Neval Dnyanoba, Manager of Grain Science, Kellogg Company, India
● Chris Stevens, Head of Agribusiness and Agronomy, Kellogg Company, Asia Pacific and
Africa
● Ed Thistlethwaite, Senior Regional Manager, Agribusiness, Kellogg Company, Asia &
Africa
● Randal Dell, Agricultural Strategy Manager-Great Lakes, The Nature Conservancy
● Whitney Gantt, Global Director for mAgriculture, Grameen Foundation
● Simon Winter, Senior Vice President, TechnoServe
● Robyn Meeks, Assistant Professor, University of Michigan School of Natural Resources
and Environment
● Ravi Anupindi, Professor of Operations Management, University of Michigan Stephen
M. Ross School of Business
● Andrew Jones, Assistant Professor of Environmental Health Sciences, University of
Michigan School of Public Health
The following resources were used to develop the base survey:
● Sustainable Agriculture Initiative (SAI) Farmer Sustainability Assessment 2.0: The
SAI Agricultural Initiative was formed in 2002 by Nestle, Unilever, and Danone to
12
facilitate sharing of sustainable agricultural practices. The farmer sustainability
assessment tool is a checklist for farmers to assess their sustainability practices.28
● Progress out of Poverty (PPI): A Grameen Foundation developed measurement tool for
organizations to integrate poverty data into their assessments.29
● Unilever Sustainable Agriculture Code: Developed in 2010, this code is Unilever’s
definition of sustainable agriculture and outlines expectations of all raw material
suppliers.30
● Living Standards Measurement Study (LSMS) - Integrated Surveys on Agriculture:
A household survey project established by the Bill and Melinda Gates Foundation and the
Development Research Group at the World Bank to foster innovation and efficiency in
research on the links between agriculture and poverty reduction.31
● Sustainability Assessment of Food and Agriculture Systems (SAFA): Food and
Agriculture Organization of the United Nations built on existing efforts and developed
this framework to act as a universal standard for the food and agriculture industry.32
The final, 114-question survey went through a series of revisions and was reviewed by Amy
Braun, and Atul Chavan for adaptation to the local context before deployment.
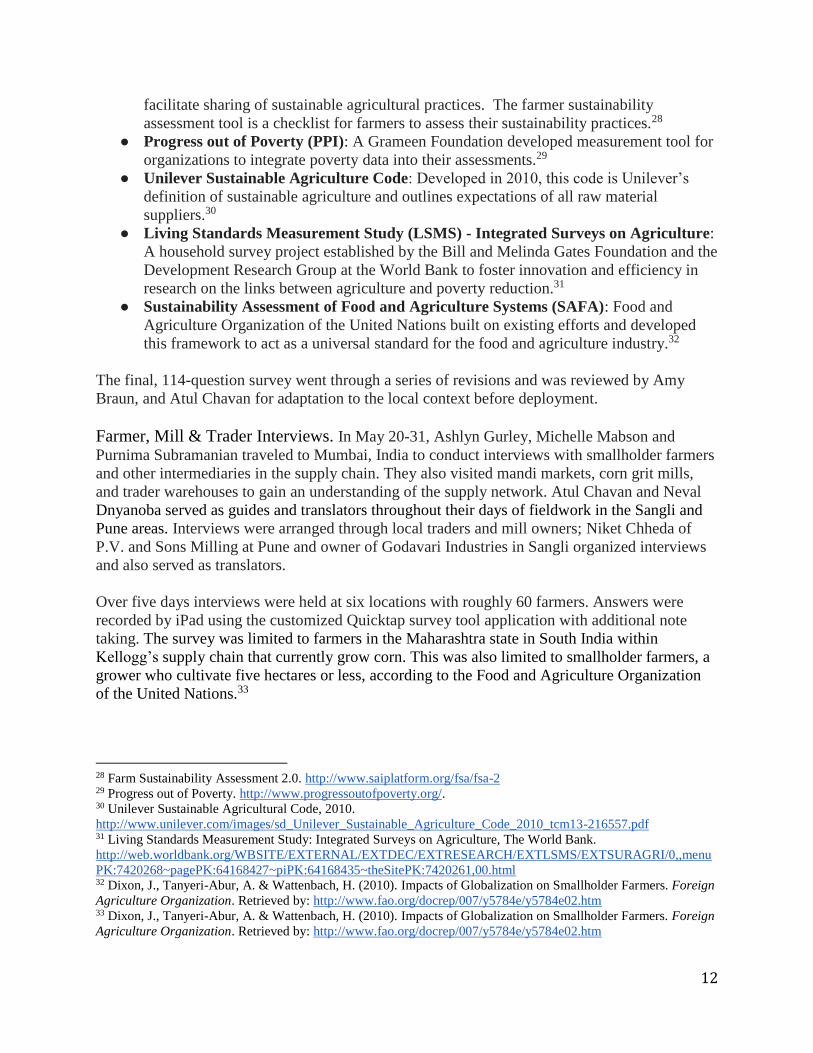
Farmer, Mill & Trader Interviews. In May 20-31, Ashlyn Gurley, Michelle Mabson and
Purnima Subramanian traveled to Mumbai, India to conduct interviews with smallholder farmers
and other intermediaries in the supply chain. They also visited mandi markets, corn grit mills,
and trader warehouses to gain an understanding of the supply network. Atul Chavan and Neval
Dnyanoba served as guides and translators throughout their days of fieldwork in the Sangli and
Pune areas. Interviews were arranged through local traders and mill owners; Niket Chheda of
P.V. and Sons Milling at Pune and owner of Godavari Industries in Sangli organized interviews
and also served as translators.
Over five days interviews were held at six locations with roughly 60 farmers. Answers were
recorded by iPad using the customized Quicktap survey tool application with additional note
taking. The survey was limited to farmers in the Maharashtra state in South India within
Kellogg’s supply chain that currently grow corn. This was also limited to smallholder farmers, a
grower who cultivate five hectares or less, according to the Food and Agriculture Organization
of the United Nations.33
28 Farm Sustainability Assessment 2.0. http://www.saiplatform.org/fsa/fsa-2 29 Progress out of Poverty. http://www.progressoutofpoverty.org/. 30 Unilever Sustainable Agricultural Code, 2010.
http://www.unilever.com/images/sd_Unilever_Sustainable_Agriculture_Code_2010_tcm13-216557.pdf 31 Living Standards Measurement Study: Integrated Surveys on Agriculture, The World Bank.
http://web.worldbank.org/WBSITE/EXTERNAL/EXTDEC/EXTRESEARCH/EXTLSMS/EXTSURAGRI/0,,menu
PK:7420268~pagePK:64168427~piPK:64168435~theSitePK:7420261,00.html 32 Dixon, J., Tanyeri-Abur, A. & Wattenbach, H. (2010). Impacts of Globalization on Smallholder Farmers. Foreign
Agriculture Organization. Retrieved by: http://www.fao.org/docrep/007/y5784e/y5784e02.htm 33 Dixon, J., Tanyeri-Abur, A. & Wattenbach, H. (2010). Impacts of Globalization on Smallholder Farmers. Foreign
Agriculture Organization. Retrieved by: http://www.fao.org/docrep/007/y5784e/y5784e02.htm

13
Mill and Trader Survey. The initial survey was developed with the intent to collect farmer-
level data that would aid in garnering a full picture of the economic, social and environmental
status of smallholder farmers interacting with Kellogg supply chain in India. Once in Mumbai, it
was revealed that other components to the supply chain included the mill and traders, integral
intermediaries between the farmer and Kellogg. To understand this relationship, a survey for mill
owners and traders were created in country and administered to the mill owners visited and
several traders. In creating the mill-level survey, questions were developed based on the
relationship between Kellogg and two mills, P.V. and Sons Milling in Pune and Godavari
Industries in Sangli. This relationship was defined from the initial meeting between the team,
Atul Chavan, senior procurement manager for Kellogg India, and Neval Dnyanoba, Kellogg
grain scientist.
Kellogg Leadership Survey. Once survey results and trends were analyzed, a second survey
was developed using Google Forms to assess how the views of senior-level management within
Kellogg Company across regions compares to the view of both farmers and millers. This survey
is important for providing context for understanding the varying perspectives of each stakeholder
across the value chain, especially management’s views of the issues within the value chain.
Results will provide direction for developing and understanding ease of implementation, the
willingness to support specific intervention strategies and level of importance that stakeholders
place on individual strategies in order to weigh different objectives within the modeling
instruments outlined in later sections.
Interview bias. As with any data, especially reported through translators, a level of bias and
inaccuracy must be assumed. This can be attributed to farmer comprehension of questions,
translation inaccuracies, and groupthink (i.e. when other farmers were listening/helping with
responses). Some difficulty was also realized in obtaining surveys in country. Approximately
half (36 out of 60 interviewed) of the farmer surveys were obtained from groups of farmers at
local mandi auction markets, and the other half (24 out of 60) of the surveys were obtained from
one on one interviews with farmers at their residences. In addition, most interviewed farmers
were also already colleagues or business associates of mill owners, they may have felt a conflict
of interest in answering questions. While the project team does not attempt to quantify or project
the impact of these considerations, their presence must be acknowledged.
Survey Analysis
Farmer Survey Statistics and Insights. The primary stakeholders surveyed in this analysis
were corn growing farmers in the state of Maharashtra. Due to the presence of a complex supply
chain network in the country, it is impractical to determine whether all farmers interviewed
produced corn for Kellogg’s in the past or will do so in the future. The outcome of the survey
was to determine the qualities and practices of an average small-holder corn farmer in the state,
their shortcomings, short and long term objectives and to identify areas of external assistance and
interventions that is most likely to create direct value to them.

14
Table: 1 Farmer Demographics
Demographics Percentage/Average Value Range (if applicable)
Gender: Male 100%
Age 36 23-50
Type of Ownership: Land
owners
100%
Years of Ownership 9.2 Years 4-30 Years
Land Holding Size 4.05 Hectares 1.0125-38.88 Hectares
Income $7777/Annum $5000-$18500/Annum
Yields Obtained 1.132 Tons/Hectare 1.01 - 1.62 Tons/Hectare
Table 2: Farmer Practices (Italicized text: applicable for developing materiality assessment)
General Practices Percentage of Respondents
Use of government extension and other
information services: Yes
43%
Use of government extension and other
information services: Never
2%
Top most sought after information:
Seed Variety
Fertilizer Use
Soil conservation methods
Planting methods
Prices for farmed products
Available markets
33%
10%
0%
0%
0%
0%
Pre-Harvest Practices Percentage of Respondents/ Value
Most popular seed variety: Syngenta 36%
Use of irrigation: Yes (Use of Aquifers or
bores)
36%
Use of irrigation: No (Rain-fed) 64%
Prominent practice for soil quality
maintenance:
Crop Rotation
100%
Average seeds used per Hectare 23 Kgs
Dominant crop rotated with: Sorghum 61%
Post-Harvest Practices Percentage of Respondents/ Value
Average period of drying: On open ground 3.5 Weeks
Average storage period 3.5 Months
Storage methods:
Gunny/polyester sacks (often reused)
97%

15
Loose in barns 3%
Presence of Aflatoxin fungus reported: often 90%
Mixing of seed varieties during
drying/storage
100%
Table 3: Farmer Expectations and Concerns (Italicized text: applicable for developing materiality assessment)
Farmer Expectations and Concerns Percentage of Respondents/ Value
Willingness to join Farmer Cooperative:
Under the right circumstances without having
to take initiatives
83%
Type of information expected from buyer:
Seed Variety
100% [for yield improvement]
Expect weather related risks 88.89%
Satisfaction with access to market price
information: Yes
80%
Satisfaction with price received: No 60%
Resources needed for growing better quality
corn:
Better weather conditions (including water
access): 55%
Better inputs: 27%
Technical Assistance: 9%
Pricing: 9%
Based on the survey and direct interaction with various groups of corn farmers in the surveyed
region, the biggest farming concerns were identified in a manner that can be utilized by Kellogg
Company to suitably assist the corn growers with practical intervention strategies.
Under each area of farmer survey assessment as grouped in the three tables above, survey
statistics and verbal interaction facilitated in identifying the most common and prominent issue
for farmers interviewed.
Use of government extension services and other technical assistance services was irregular and
often seen as a burdensome procedure; therefore most farmers did not actively seek them. This
makes provision of technical assistance a potentially rewarding intervention if offered in a
manner that allows better access to farmers. Out of the farmers that made use of government and
other technical services, the most sought after information were about quality of seed variety and
type of fertilizer. Water access is not uniform among all farmers in the two regions surveyed,
while it was relatively for the rich farmers with larger land holdings to irrigate, the poorer
farmers depended mostly on rainfall. Although most farmers used local seed brands as they were
cheaper, farmers often mixed seed varieties in different plots of their sowing. At 36%, Syngenta
brand was the most popular seed variety reportedly used, but often not the only seed variety used
by the farmer in a season. Other seed variety brands used included Pioneer, Kaveri, Cargill, and
Champion. Post-harvest practices, another determinant of corn quality, involved open air drying
on bare ground.

16
This practice often causes variation in corn moisture content and allows growth of aflatoxin
fungus. Drying is followed by de-cobbing and the corn kernels are stored in gunny or polyester
sacks that are often reused. Reuse of bags causes further spread of fungus from the corn that was
previously stored in these bags. A better practice calls for the use of fresh/clean bags. 60% of the
farmers surveyed were dissatisfied with the price obtained for their corn at the mandi and this is
most likely attributed to the post-harvest practices that influence quality and the mixing of seed
variety which is undesirable to the mandis’ direct customers, the mill. Mandis are increasingly
adopting practices of screening corn for aflatoxin and presence of the fungus yields a lower price
to the farmer.
Most of the farmer concerns such as information about the weather and use of adaptive growing
techniques, information on seed variety and other basic post-harvest practices can be directly
addressed via direct technical assistance.
Mill Survey Insights. Mills are the most important and direct stakeholders to Kellogg. Based on
the interaction with the millers, it is essential to note that millers have the biggest stake in the
intervention processes and are actively willing to cooperate and strategize with Kellogg’s to
derive mutual benefits from the interventions. The most tangible and direct value created through
interventions at the farmer level will be realized by the millers in the form of reduced complexity
in their procurement networks and decrease in direct operation costs due to better quality grain,
segregated by variety for their different milling processes.
Typically both the mills produce 30-35% of their raw corn into grits used by Kellogg Company;
30% is used for producing corn meal; 30% for corn feed and 10% corn flour. In the current
scenario, the biggest cause of rejection and operational strain faced by the mill owners is the raw
material corn obtained in mixed varieties, followed by the occurrence of the aflatoxin fungus.
The two reasons cause the millers to have a constant need for devising strategic alternate
sourcing networks, adding to their variable costs. Both millers are unable to communicate their
quality needs directly to the farmers or the traders because of the established supply network
system. Godavari Industries currently has a procurement network within a 600 KM radius from
their mills and P.V. & Sons has one 300 KM radius from their mill. Cost of raw material goes up
to 60-65% of their total costs. Based on our interaction with the mill, we also came across
Internal Management Survey Insights. The objective of the survey sent to Kellogg’s internal
management was to garner the management’s vision for this project and detail their priorities in
stakeholder engagement in the context of technical and economic feasibility and willingness to
implement various interventions.
Survey response indicated to the primary objective of the project as “increasing quality and
quantity of corn procured”, which expects to secure the supply chain in the long run through
creation of shared value and benchmarking corporate social responsibility practices. This
suggests that the reasonable need lies in gradually improving current farming practices and
eliminating the difficulties faced on the grounds of rejection of poor quality of corn. Procuring
increased quantity is also integral to the company at this juncture, when the company sales have

17
grown by 3% owing to growth in the Asia-Pacific region34. The survey also indicates the
importance of ease of implementation of the project to Kellogg Company in the context of
reduced costs, higher returns and minimal time in intervention implementation all weighted
equally important. The concluding analysis was built based on the survey inputs of Kellogg
leadership.
Model Approach
The proposed interventions are expected to create shared value with external stakeholders of the
upstream supply chain. It is therefore essential to assess and evaluate the priorities of the various
stakeholder groups (i.e. the Farmer, Miller and Kellogg Company) and assess their priorities
using a multi-criterion assessment process for strategic intervention development. Based on our
surveys, we have garnered a list of priorities which is mapped on to a matrix using the
materiality assessment approach. Materiality assessment is a process in sustainability reporting
as endorsed by the Global Reporting Initiative35. It is an exercise in stakeholder engagement to
identify key issues or “Material Aspects” on which the corporation or business must seek to
intervene.36
Model Description and Analysis Materiality Assessment Matrix. The major intersection of priority areas/criteria identified
from the 3 surveys is defined below:
Priorities Definition
Provision of Direct Inputs The need for and ease of implementation in
providing farmers with direct inputs such as
seeds, water access, drying and storage
equipment along with technical assistance.
Formation of Maize Co-operative for Farmers The need for and ease of implementation in
assisting the initiation and formation of a self-
regulated farmer’s maize co-operative in the
state.
Address Climate Risks and Water
Availability
The need for addressing and assisting farmers
with technical support and providing access to
water co-joint with relevant organizations and
scientific researchers.
34 Kellogg Company. (2013). “2013 Annual Report Form 10-K.” p.19 Retrieved from:
http://investor.kelloggs.com/files/doc_financials/annual_reports/K_2013_10-K%20with%20supplement.pdf 35 Global Reporting Initiative. (2015). “Materiality in the Context of the GRI Framework.” Retrieved from:
https://www.globalreporting.org/reporting/G3andg3-1/guidelines-
online/TechnicalProtocol/Pages/MaterialityInTheContextOfTheGRIReportingFramework.aspx 36 Global Reporting Initiative. (2015). “GRI G4 Implementation Manual.” P. 12. Retrieved from:
https://www.globalreporting.org/reporting/G3andg3-1/guidelines-
online/TechnicalProtocol/Pages/MaterialityInTheContextOfTheGRIReportingFramework.aspx

18
Provision of Technical Assistance The need for and ease of implementation in
providing resources to communicate valuable
technical information to help improve both
pre and post- harvest practices.
Address Environmental Sustainability The need for and the ease of implementation
for addressing and optimizing the various
aspects of environmental sustainability
including soil health, crop strength, use of
fertilizers, water management, and
environment friendly storage practices.
Address Interventions to Stabilize/Secure
Market Price of Corn
The need for and the ease in implementation
of applicable interventions that could help
stabilize crop prices for both the buyer and
the seller through appropriate contract
growing.
Secure Trade/Supply Chain The need to secure trade with the current
entities in the long term with minimal
discrepancies to all entities involved.
Address Intervention to Improve Corn Yields The need for and ease of implementation to
directly improve corn yields as it is the major
cause of concern for farmers in the country,
obtaining yields less than half of the current
yields in the United States.
Address Intervention to Improve Post-Harvest
Corn Quality
The need for and ease of implementation to
directly improve corn quality through relevant
support and interventions to improve post-
harvest practices.
The various priorities described above were scored on a scale of 1-7 and weighted across its
significance to both stakeholders in order to determine the absolute essential priority, from which
an intervention strategy could be developed.
The priorities for the farmer were scored on the basis of need, ease of access and feasibility in
the geographical and cultural context of farmer. The priorities for the miller were scored on the
basis of possible interest in intervention strategy and the level of tangible value realized. The
priorities of Kellogg Company were scored on the grounds of ease of implementation that
includes fewer costs, higher returns, frequency and complexity of engagement with different
stakeholders, time required to implement strategy and creation of tangible corporate social
responsibility value and standards. The combined materiality assessments for this particular
system of supply chain are mapped below.

19
Above: Materiality Assessment Matrix for Farmer and Kellogg Company. Priorities
highlighted in purple were analyzed using CBA. (*Overlapping points)
Above: Materiality Assessment Matrix for Mill and Kellogg Company. Priorities
highlighted in purple were analyzed using CBA.
2, 5
3, 4
4, 3
6, 7 7, 7
5, 3
2
3
4
5
6
7
8
1 2 3 4 5 6 7 8
Imp
ort
ance
to
Mill
ers
Importance to Kellogg Company
Miller-Kellogg's Materiality Assessment
Farmer Maize Co-operative
Direct Inputs
Climate/Water Risks
*Secure trade/supply-chain
*Yields
*Market Price Stability
*Post-HarvestQuality
*Technical Assistnace
Environmental Sustainability
6, 42, 4
3, 7
4, 6 7, 6
7, 76, 7
7, 4.5
5, 5
2
3
4
5
6
7
8
1 2 3 4 5 6 7 8
Imp
ort
ance
to
Far
me
rs
Importance to Kellogg Company
Farmer-Kellogg Co. Materiality Assessment
Farmer Maize Co-operative
Direct Inputs
Climate/Water Risks
Secure trade/supply-chain
Yields
Stability of Market Prices
Post-Harvest Quality
Technical Assistnace
Environmental Sustainability

20
Based on the materiality map identified for the 3 stakeholders, we find that the most common
highly valued priorities are:
Provision of Technical Assistance
Address Interventions to Stabilize/Secure Market Price of Corn
Address Intervention to Improve Post-Harvest Corn Quality
Address Intervention to Improve Corn Yields
From knowledge and understanding of the system interactions, variability’s and constraints at
play in each of the above priorities, intervention strategies were developed and a cost-benefit
analysis was evaluated for each intervention strategy.
Identification of Intervention Strategies
Based on the materiality map for the 3 stakeholders, the most common highly valued priorities
were identified. From these priorities, three main intervention strategies were developed for
analysis as follows:
1. Provision of Technical Assistance: This intervention would entail direct farmer
engagement through hiring a knowledgeable individual to carry out relevant extension
services through direct communication with farmers in the field. This form of
communication is expected to address most important issues around pre and post-harvest
quality of corn and developing trust and long term relationships with farmers. However,
with such an intervention strategy, there is no guarantee of the benefits derived as there is
no guarantee that the assisted farmer would sell to Kellogg’s through the mandi system.
There is also no clear incentive for the farmer to implement some of the best practices that
may be cost intensive (such as buying clean gunny bags for each harvest, or premier
quality seeds of the same variety). Other challenges include identifying and maintaining
relationships with farmers in the long run where in even if benefits are tangibly realized,
they will require a few years’ time for such realization.
2. Stabilize Market Prices of Corn through intervention at the Post Harvest Level: This
intervention seeks to address three of the top priorities combined with two methods of
intervention strategy.
Strategy 1: Providing technical assistance with direct farmer contract: This
intervention includes direct technical engagement and assistance as well as
provision post-harvest equipment. This includes buyback contracts with farmers.
Strategy 2: Providing inputs and direct farmer contract: In this intervention, direct
technical assistance will be provided through the mill using mill personnel,
provision of post-harvest equipment to farmers. This includes farmer buyback
contracts. The assumption here is that it is more cost effective for the miller to
directly assist on the ground, as they already have local relationships. Whereas if
the mill provides direct inputs as well, it would be reflected in the increase of
procurement costs from mill to Kellogg’s.

21
While this intervention primarily seeks to eliminate occurrence of aflatoxin in the supply
chain, it also guarantees reaping direct benefits. However challenges surrounding control
over quality of seed variety used and mixing along with the need to gain farmer trust and
alter existing supply network will need to be further addressed.
3. Stabilize Market Prices of Corn through intervention at the Pre Harvest Level: This
intervention also seeks to address three of the top priorities combined with two methods of
intervention strategy with a focus on pre-harvest practices.
Strategy 1: Providing technical assistance with direct farmer contract: This
intervention includes direct extension services, and providing inputs such a
uniform quality seeds at a contracted subsidy. This also includes direct farmer
contracting, essentially a buyback guarantee.
Strategy 2: Providing inputs and direct farmer contracting: This intervention
entails direct extension services, but that they will be provided through the
mill-by-mill personnel. Costs for provision of quality seeds for corn produced
by the farmers at a subsidy is also calculated. In order to derive full benefits of
this intervention, a contract must be agreed upon between the farmer and
buyer.
While this intervention primarily seeks to enhance crop quality and yields in the supply
chain, it also guarantees reaping direct benefits. However there would be challenges in
identifying the right variety of quality seed to be widely distributed along with the need to
gain farmer trust and alter existing supply network. There may also be the need to
additionally support farmers with post-harvest techniques.
Cost-Benefit Evaluation of Intervention Strategies. For each of the intervention strategies
identified, the concurrent costs and benefits were estimated. While the benefits are mostly
intangible, usually realized indirectly, some of the benefits have been quantified as applicable in
the long term such as monetizing reduction in raw-material and sourcing cost to mills which is
reflected in procurement costs to Kellogg’s; monetizing absence of procurement cost fluctuation
and value of corporate social responsibility in each case. Translation of benefits in the form of
reduced operational costs from improved quality of procurement is usually more directly realized
at the mill level. Increased quantity of procurement does not necessarily translate into direct
benefits to Kellogg as there has been no major or quantified cost to changes in operation
management due to unavailability of corn grits as there is a cushion of alternative supply from
having two mill sources.
Assumptions and results in Cost-Benefit Analysis
Following are the assumptions in quantifying values in the cost-benefit analysis. The quantified
values may be altered as is subjective during project implementation. [Numerical results and
analyses for cost benefit model have been omitted from this report, as they are based on
proprietary data of Kellogg Company. What follows is a broad summary of the model setup and
findings.]
22
All calculations were based on average data for the year 2013
Most benefits are intangible and may not be realized directly or immediately
It is assumed in interventions #2 and #3 farmers require an incentive to accept and sign
contract for an “assistance and buy-back” scheme
CSR value quantified: embedded in CSR value are mostly intangible or indirectly
realized values such as increased profitability from enhanced brand reputation and
insulation from direct or indirect regulatory penalties (such as the CSR mandate
regulation in India). This is valued in the form of increased consumer purchase
intentions37. An increase in purchase intention although quantified as 1.4% for tech
service sector corporations was used and 30% of such intentions was assumed to be
realized. Additional coefficients used were score for social responsibility initiative, a
farmer livelihood score based on the type of intervention (i.e. score used in famer’s
materiality assessment priorities) and a coefficient for the percentage of product lines that
used corn in the Asia-Pacific region. All of the coefficients were used as a function of
Kellogg’s Asia Pacific sales revenue38 for the year 2013.
The analysis was done for a period of 6 years in total, i.e. 5 additional years from the year
of implementation.
Each intervention’s cost-benefit analysis was done involving two scenarios, i.e.
optimistic and conservative. In the optimistic scenario the benefits are assumed to be
realized fully from year 2 with CSR value being realized in year 6. In the conservative
scenario, partial benefits were found to be realized in year 2, 3, 4 and full benefits in year
5, 6 without any consideration of CSR value.
Optimistic and conservative scenarios in the analysis are limited in considering all
possibilities.
Cost Categories. Broad cost categories identified for each intervention strategy entail the
following. The costs values were evaluated based on knowledge sourced internally from
Kellogg’s, information sourced from surveys on the ground and online information search.
• 1. Provision of Technical Assistance: Costs associated with appointing personnel and
providing onsite technical resources and periodic interaction with diverse farmer groups.
• 2. Stabilize Market Prices of Corn through intervention at the Post Harvest Level: Costs
associated with provision of direct technical assistance and resources (drying/storage
inputs) via contract in strategy 1, verses mill supported provision of technical assistance
and resources via contract in strategy 2.
• 3. Stabilize Market Prices of Corn through intervention at the Pre Harvest Level: Costs
associated with provision of direct technical assistance and resources (subsidized quality
seeds) via contract in strategy 1, verses mill supported provision of technical assistance
and resources via contract in strategy 2.
37 McKinsey and Company publication, “What really drives value in corporate responsibility?” Dec 2011. Retrieved
from http://bit.ly/1DGxGbh 38 Kellogg Company. (2013). “2013 Annual Report Form 10-K.” p.19 Retrieved from:
http://investor.kelloggs.com/files/doc_financials/annual_reports/K_2013_10-K%20with%20supplement.pdf
23
Benefit Categories. Broad benefit categories identified for each intervention strategy entail the
following. The benefit values were evaluated based on knowledge sourced internally from
Kellogg’s, information sourced from surveys on the ground and online information search.
• 1. Provision of Technical Assistance: Benefits associated with reduced mixing of seed
varieties, improved quality from better drying practices and long term CSR values.
• 2. Stabilize Market Prices of Corn through intervention at the Post Harvest Level:
Benefits associated with procurement cost stability for both Kellogg’s and Mill from
contract procurement, quality and farming practice improvement at the post-harvest level,
i.e. with elimination of aflatoxin fungus, long term CSR values and additionally costs
saved with mill support for strategy 2.
• 3. Stabilize Market Prices of Corn through intervention at the Pre Harvest Level: Benefits
associated with procurement cost stability for both Kellogg’s and Mill from contract
procurement, substantial quality and farming practice improvement at the pre and post-
harvest level, with not only the elimination of aflatoxin fungus but with bigger, harder
corn that makes superior quality corn grits thereby reducing mill’s operational costs, long
term CSR values and additionally costs saved with mill support for strategy 2.
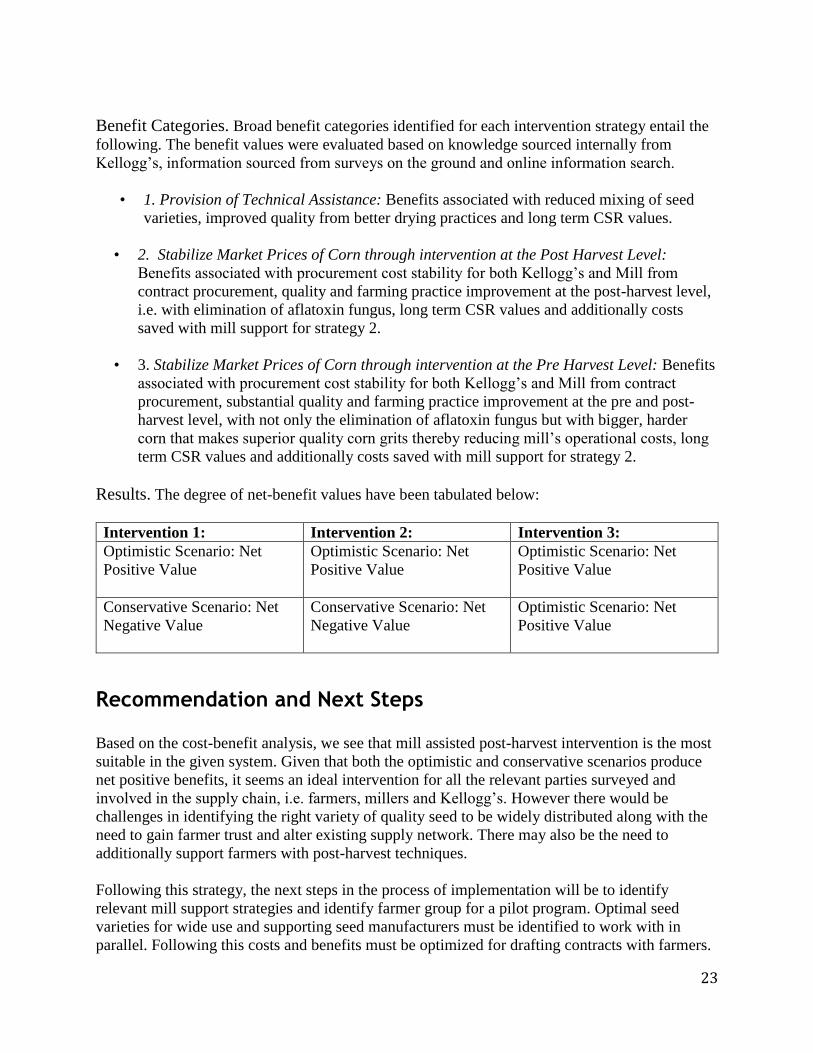
Results. The degree of net-benefit values have been tabulated below:
Intervention 1: Intervention 2: Intervention 3:
Optimistic Scenario: Net
Positive Value
Optimistic Scenario: Net
Positive Value
Optimistic Scenario: Net
Positive Value
Conservative Scenario: Net
Negative Value
Conservative Scenario: Net
Negative Value
Optimistic Scenario: Net
Positive Value
Recommendation and Next Steps Based on the cost-benefit analysis, we see that mill assisted post-harvest intervention is the most
suitable in the given system. Given that both the optimistic and conservative scenarios produce
net positive benefits, it seems an ideal intervention for all the relevant parties surveyed and
involved in the supply chain, i.e. farmers, millers and Kellogg’s. However there would be
challenges in identifying the right variety of quality seed to be widely distributed along with the
need to gain farmer trust and alter existing supply network. There may also be the need to
additionally support farmers with post-harvest techniques.
Following this strategy, the next steps in the process of implementation will be to identify
relevant mill support strategies and identify farmer group for a pilot program. Optimal seed
varieties for wide use and supporting seed manufacturers must be identified to work with in
parallel. Following this costs and benefits must be optimized for drafting contracts with farmers.

24
Once the pilot program is conducted and assessed for benefits, the program can be scaled up to
meet potential needs.
Partnership opportunities. Some of the potential partnership opportunities identified in order to
fulfill the recommended intervention are as below.
International Maize and Wheat Improvement Center (CIMMYT)
CIMMYT works to develop research and training services to improve farming systems for maize
and wheat39. Through prolonged partnership with national governments, development banks and
private agencies, CIMMYT is committed to reducing poverty and hunger while promoting
sustainability in the increase of maize and wheat crop systems36. The aforementioned objectives
align directly with the Global Sustainability 2020 Commitments as well as the continued
partnership with Mas Agro. Mas Agro is an initiative that bridges smallholder and women
farmers with agricultural research and development organizations to raise crop yields, increase
incomes and reduce climate change in Mexico40 – this effort can be leveraged by forging the
existing relationship in Mexico and bridging the efforts on the ground in India.
Currently, the CIMMYT office in India works directly with scientists to improve the quality of
maize through use of test plots carried out in different climactic zones. Projects address the
growing issue of water availability, a critical concern identified through surveys from
smallholder farmers41. Understanding that most maize is grown under rain-fed conditions and the
water variability that farmers face, CIMMYT has partnered with a number of India-based
organizations to focus on developing drought and temporary waterlogging tolerant maize
varieties38. Such hybrids are ready to be tested and may serve as an opportunity for Kellogg to
take advantage of in helping to identify farmers who are interested in taking part in the trials.
Syngenta Test Plots:
Some of the other challenges identified on the ground were farmer’s inaccessibility to seed test
plots. This inaccessibility hinders farmers from being able to test out quality seed varieties
thereby relying primarily on large-scale trial and error in selecting seed varieties. Potential
collaboration with Syngenta for getting access to test plots brings about a more comprehensive
approach in prioritizing farmer needs and addressing the recommended intervention.
In 2014, Syngenta created the Good Growth Plan, which outlines Syngenta’s commitment to
maintaining a sustainable food system and its goals to make measureable impacts by 202042.
Several commitments, including empowerment of smallholders and increased crop efficiency
39 International Maize and Wheat Improvement Center (2015). Who We Are. Received from:
http://www.cimmyt.org/en/who-we-are 40 Kellogg Newsroom Press Release (2014) Kellogg Committed To Empowering Women And Smallholder Farmers
– 01/08/14. Received from: http://newsroom.kelloggcompany.com/2014-01-08-Kellogg-Committed-To-
Empowering-Women-And-Smallholder-Farmers 41 International Maize and Wheat Improvement Center (2015). India and CIMMYT – Highlights of a longstanding
partnership for agricultural development. Received from:
http://www.cimmyt.org/en/component/docman/doc_download/25-india-cimmyt 42 Syngenta Global (2014) Good Growth Plan. Received from:
http://www.syngenta.com/global/corporate/en/goodgrowthplan/Documents/pdf/The%20Good%20Growth%20Plan_
%2016pp%20brochure%20ENG.pdf

25
align with the Global Sustainability 2020 Commitments, outlined above. “Reference farms39” are
being built across various geographies in order to measure baseline benchmarks for different
crops with the ultimate goal being to increase crop yields. In 2012, Syngenta worked to grow
corn using less water to address the drought that U.S. farmers were facing at the time. Even
under drought conditions, yields increased by 10-20 percent when compared to conventionally
farmed plots39.
Syngenta India operates two business divisions including crop protection and seed processing in
three locations43. Published test plot results are not available online, however information on
U.S. test plots are available to the public. As noted above, such reference farms include data on a
variety of seed brands, including Pioneer and DeKalb and provide information on yield, grain
moisture – in order to understand which seeds perform best within each geographical location,
and number of seeds planted44. A partnership to develop similar test plots in Maharashtra, India
would provide smallholder farmers with the ability to evaluate seed quality and yields with
relatively low risk.
43 Syngenta Global (2015). India Vision and Business Divisions. Received from:
http://www.syngenta.com/global/corporate/en/about-syngenta/countries/pages/in.aspx 44 Syngenta U.S. Agriculture and Seeds (2015). NK Corn Plot Report – Monroe, MI. Received from:
http://www3.syngenta.com/country/us/en/agriculture/seeds/corn/nk/Pages/plot-
report.aspx?PlotId=1098700&location=Milan-MI-48160

26
Appendix Appendix A

27
Appendix B: Mill Component Pricing Chart 45
45 Assumptions based on the mill survey and Chopra, S., & Meindl, P. (1997). Supply Chain Management: Strategy,
Planning & Operation; Not reflective of actual component pricing
Component Percentage of
Mill's costs
Raw Material & Procurement
Logistics Costs
60%
Cost of corn kernel 30%
Cost of bags 15%
Corn Procurement Logistics 15%
Fixed Operational Costs 15%
Capital 7%
Labor 8%
Variable Operational Costs 25%
Electricity 16%
Maintenance 4%
Rejections/line management 2%
Labor 3%

28
Appendix C: Farmer Survey
Name
What is your gender? Male Or Female
Age
Do you have children? Yes or No
Of your male children ages 5-12, what
percentage attends school regularly (more
than 80% of the time)?
less than 25%; 25-49%; 50-74%; 75-99%;
100%
Are you a(n) a: Owner farmer; b. Rented/tenant
farmer; c. Lease farmer; d.Farmer
manager for an individual land owner
How many years have you: owned the
farm/ is your lease/ work for the same
individual?
Is anyone in your household a member of
a farmer group or cooperative?
Yes/No
If yes, which one(s)?
If no, Is there a farmer group or
cooperative you would like to join?
What does success mean to you?
Which has been your best production year
and why was that (i.e. what does successful
mean)?
How do you measure profitability? Yield per hectare; How much of the yields
are sold at desired price; Margin;
Total land on farm (per type of ownership) In acres
How many hectares of corn do you grow?
How long (in years) have you grown corn?

29
How did learn to farm?
What was your yield in tons per hectare
for your last growing cycle per crop?
What would have helped you to grow
more?
How much did you sell from your last
growing cycle per crop? (in kg)
Did you sell your corn at the baseline price
set by the government? If no, was it sold
above or below the baseline?
What price did you receive for your
production last growing cycle? (Rs)
Were you satisfied with the price you
received from your crop last year?
Yes; I'm not sure; No
How do you decide whether to go to a
trader or the mandi?
How do you access pricing information? a. Gov't extension services ; NGOs;
Private services/ Farmer Co-ops; Agro-
chemical experts; Neighbour; Village
leader; Newspapers; SMS: Radio; Mill
Are you satisfied with the access to pricing
information that you have?
Yes; No
30
Tell us about any government extensions
you use for farming?
Does the trader/mandi have specifications
or restrictions about the corn you sell?
Yes ; No
Is there any incentive to improve quality?
What % of last year's rice/corn harvest
was rejected or sold at a reduced price?
What services or information would you
like to receive from your buyer?
What is the biggest determinant of when
you harvest?
needing money; Crops mature; Weather;
Availability of transportation or Storage
resources; Need to plant next crop; Other
For next year, do you think your crop will
be:
better; same ; worse
And why?
What technical assistance access do you
have to help you grow your crop?
Are you satisfied with your access to
technical assistance?
Yes; No
In the last production year, how many
times did you receive training or advice
from an extension worker/agronomist?
What was the advice?
Where did you get it?
31
What information, technology, or
resources would be most helpful in
improving your crops and yields?
What would be most important/helpful to
you if you were to grow corn (education,
technology, inputs)?
What are your main costs in producing
corn?
labor; pesticides; fertilizer; land; water;
seeds; machinery; electricity
What is the cost of producing corn per
hectare?
Do you have access to credit? Yes or No
Are any of your crop inputs provided on
credit? (by bank? by middleman?)
What are the terms (length?)? The interest
rate?
Do you have crop insurance?
How do you select which variety you grow
(i.e. how do you make an informed
choice)?
Where do you buy your seeds from (i.e.
how do you ensure they are high quality)?
Which seed varieties do you use? Syngenta; Monsanto; Pioneer; Kaveri;
Other

32
Why do you use these seed varieties?
Do you think your seed is high quality? Yes or No
How many seeds do you plant per ha?
Do you mix seed varieties? How many
varieties and why?
Do you reuse seeds post harvest for the
next viable season?
How do you improve the productivity of
your soil?
Minimum tillage to preserve structure;
Add fertilizer; Crop rotation; Organic
manure
Do you use change your crops from
planting season to season to improve your
soil (i.e. crop rotation)?
Yes or No
What is your rotation plan per cycle?
(Interviewer, write season #: # ha of crop)
Have you worried about the following
risks in the past year?
government policy ; economic situation;
rising costs; falling crop prices; debt; poor
yields; weather; community relationships;
insufficient labor; land disputes; land
scarcity; lack of buyers.
Which is the biggest worry from above?
Do you consider yourself at risk from
weather variations (e.g. floods, droughts,
etc)?
Yes or No
Do you use irrigation? Yes or No
How do you source your water for
irrigation
Aquifer/bore; River/lake; Man made
dams; Rainfed/none;

33
What is your water irrigation method? flood; channel
Do you ever suffer from water shortage? Yes or No
How do you manage your water usage?
Do you apply fertilizer? Yes or No
If yes, what kind?
How many times per crop?
How much fertilizer in kg/ha? do you
apply in each application (interviewer:
separate with commas)
What is the ratio of nutrients (N:P:K) in
each application? (interviewer: put the
ratio separated by " : " i.e.: 16:20:0,
15:15:15…)
If 100% equals the ideal amount of
fertilizer that you would like to use, what
% of that amount were you able to use last
year?
Where do you get your fertilizer?
How do you decide how much nutrients to
add each crop cycle?
Do you conduct soil tests? Yes or No
If yes, how often and which tests?
How do you control for pests?
34
Where do you get your pesticides?
Are you satisfied with this access you have
to pesticides?
Yes or No
Where do you get your herbicides?
Are you satisfied with this access you have
to herbicides?
Yes or No
Have you received safe application
training for herbicides/pesticides?
Yes or No
If yes, from who?
How many non family members did you
employ last crop cycle?
How many family members worked on the
farm last crop cycle?
How many of your paid workers are
women?
How many family members who work on
the farm are women?
Who does most of the work on the rice
crop, such as weeding, harvesting, etc?
Mainly men from the family; Mainly
women from family; Mainly boys; Mainly
girls; Hired Labor
What is your household income? (per
year)
Do you have off-farm income? If yes, how
much?

35
Do you have any outstanding debt? Yes or No
If yes, how much?
Do you have savings? Yes or No
Of your female children ages 5-12, what
percentage attends school regularly (more
than 80% of the time)?
What is the highest grade your over 12
children have completed?
What is the highest grade that the male
spouse has completed?
What is the highest grade that the female
spouse has completed?
Do you have electricity? Yes or No
If no, what do you use for lighting?
Has there ever been financial stress on
your family? (getting at food security)
Yes or No
If yes, how often did this happen? Often/frequently; Sometimes; Rarely
Do you level your land prior to planting?
How or why not?

36
Do you use animals for crop management?
How do you harvest your corn? (manual
and machinery)
What kind of machinery do you
specifically use for corn?
Do you dry your corn after harvest? Yes or No
if yes, how do you dry it? On the ground; Artificial heating; Other
methods
Where/ how do you normally store your
corn?
metal bins; loose in sheds; in bags; other
Average time period of storage (months)
During storage do you - store with husk; store without husk
Do you ever have problems with fungal
growth before or after harvest? Black
fungal growth on the tip of the corn
(aflotoxin growth)
How do you transport your harvest to
from storage to market?
Which of the following have you tried to
find information on?
Fertilizer use; recommended seed variety;
Soil conservation methods; Planting
methods; Pricing information; Places to
sell produce
Which of the following were you successful
in finding information on?
Fertilizer use; recommended seed variety;
Soil conservation methods; Planting
methods; Pricing information; Places to
sell produce

37
Which of these sources of information do
you trust?
Gov't extension services, NGOs; Traders;
Millers; ; Newspapers; Radio; Farmer co-
ops; Neighbor; Village leader; Agro-
chemical experts
What three things do you aspire to achieve
in your life?
Expand my farming activities; Buy own
farm equipment; Have a modern home;
Educate Children; Off-farm
business/employment; Own
transportation; own milling machine
Interviewer to answer: Were there any
special circumstances about this
interview?
Do you have a smart phone? If yes, do you
use it to access information? How?
Appendix D: Mill Survey
How many years has the mill been in operation?
How many employees do you have?
How many of these employees are women?
What is the monthly processing capacity of the mill? (Tons?)
How many different corn varieties come to the mill?
What percentage of each variety of products is produced from corn? (Feed,
Flour, Meal, Grits)
Do you have other customers for your grits product?

38
How do you assess the quality of the incoming corn? Who sets these quality
standards- internally, or the customer?
What is the best corn variety for the milling process?
What characteristics of corn determine the best type to mill? What qualities
does this corn have that makes it ideal?
How do you communicate quality requirements to Mandi traders?
What are the grounds for the grounds for grain from the Mandi being
rejected? What percentage of grain has been rejected in the last year?
What are biggest costs of operating? How much are your annual expenses?
What are your annual revenues?
From how far away do you source?
Do you own the trucks that transport the corn? Where does the product go
from here? How do you store your grain prior to processing?
How do you store your grain prior to processing? Do you utilize private or
government owned warehouses for storage? Why?
Tell us about your supply network. Does it vary based on climate, demand,
the number of farmers, and traders?