Embed Size (px)
Citation preview

c~~sus OF INDIA 2001
SEltTES~3 HIMACHAL PRADESH
Paper 1 of 2001
PROVISIONAL POPULATION TOTALS
RL. BISOTRA of the Indzan AdmInistratIve ServIce
Director of Census Operations HImachal Pradesh

HIMACHAL PRADESH CENSUS FAMILY
2001
DIRECTOR R L Sisotra
I.AS
DEPUTY DIRECl'OR K S Thakur
ASSISTANT DIRECTORS A S Negi, L R Kallyar
SATISTICAL INVESTIGA TOilS GRADE-II T N Sharat, P C Naml, Y C Negl, H S Grover,
Baldev Singh, R C Sharma
STATISTICAL INVESTIGATORS GRADE-III C M Azad, R S Negl, R K Sharma, N C Chakraborty, R S Thakur, Shanta Prasad, R D Bah, Chander Mohan, Laiq Ram, Ram Lal Thakur
SENIOR COMPILERS Malkiat Ral, Dhlrender Prasad Smt Usha Kuman, Sunnder Mohan, Mohar Smgh, Narpat Ram
R D Arvrnd, Office Supdt 8 R Sharma, Asstt D D Sharma Asstt Tuisl Dass Jalkar, Asstl
PERSONAL
COMPILERS S C Yadav, R C Chandel, Smt Neelam Sharma, Knshan Dass, J D Pandlyar,
Parma Ram, Smt Neema Devl, And Thakur, R S Chandel, S S Namta, Smt SUnita Ram, Smt Shanta Sharma, Bhlkham Ram, AS Jassal, Knshan Lal
UDCs Kapil Kumar Prem Prakash Purshotam Singh Pawan Kumar Vlrender Singh
ADMINISTRATION AND ACCOUNTS
LDCs Mundrlka Prasad Rajlv Dubey GC Jaiswal Klran Kumar, HPMO DhanVJr Singh, Gs Opr Bala Ram, Rec Keeper
MAP SECTION
DAFTRIES HetRam JogmderLaI Bah Ram
OTHER GROUP 'D' STAFF Dhayan Dass Labhu Ram Swaroop Chand Puran Chand Om Prakash Ramesh Chand-II Maya Sukh Daulat Ram Ramesh Chand-I Smt Leela Ved
PRINTING SECTION Glan Chand, Confidential Asstt Sukh Ram, Dnver
Smt Veena Thakur, Cartographer Parma Nand Sharma, Sr DraWIng Asstt Het Ram Verma, Sr Draughtsman Shankar Lal Panhar, Sr Draughtsman Vidya Sagar Kaushal, Sr Draughtsrnan Hans Raj Thakur, Draughtsman
Sohan Lal Qauml, Sr Tech Asstl (Ptg ) Som Knshan Sharma, Pntg Inspector Bhagat Ram Sharma, Proof Reader
11

CONTENTS
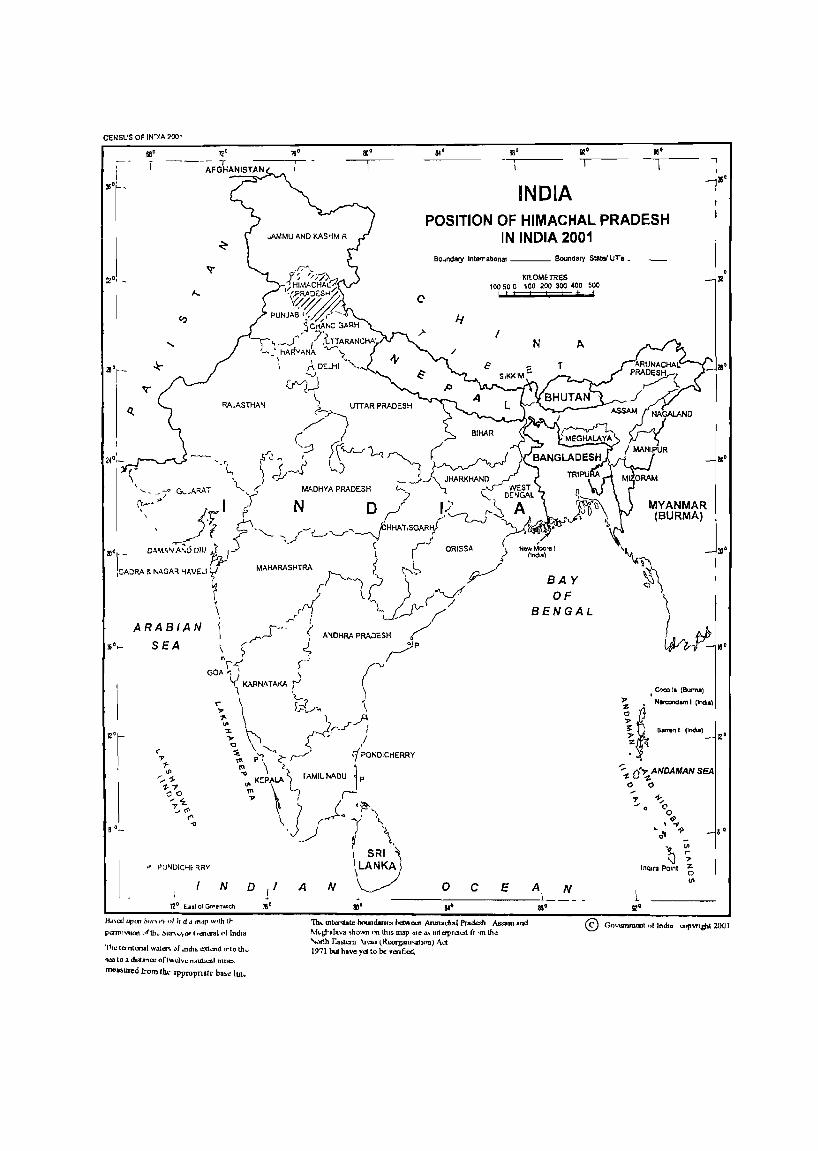
PosItIOn of HImachal Pradesh In IndIa 2001
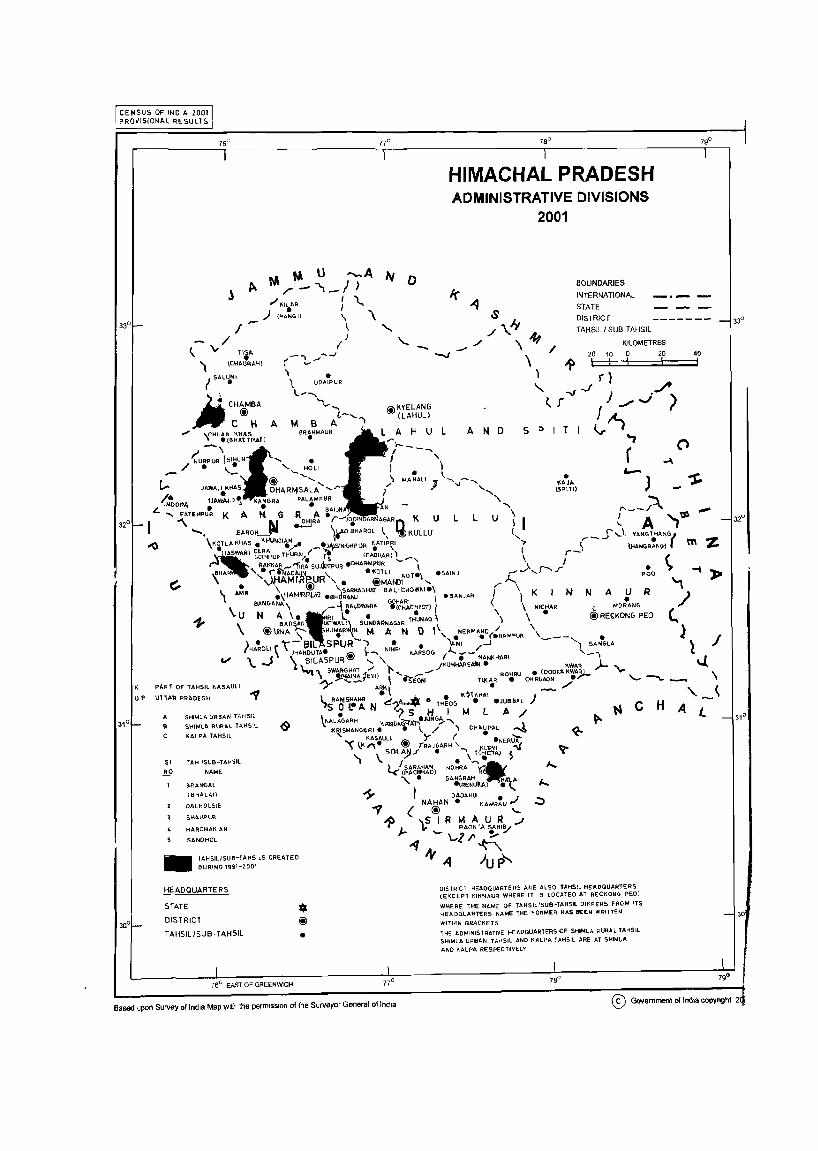
Admmlstratlve DIvIsIons of HImachal Prddesh 2001
Preface
FIgures at a Glance
FIgures at a Glance for IndIa and StatesfUmon Territones
State HIghlIghts - Important facts
Introductory Note
Tables:
1) Table 1
11) Table 2
lll) Table 3
IV) Table 4
Maps:
PopulatIOn dlstnbutlOn Percentage decadal growth rate, sex-RatIO and PopulatIOn denSIty for State/Dlstncts
Percentage decadal vanatIOn In PopulatIOn SInce 1901 for StatelDlstncts
Sex-ratio smce 1901 for State/Dlstncts
PopulatIOn m the age-group 0-6, Number of hterates,LIteracy rate by sex for State and DIstrICts
1 Percentage decadal growth rate 199 I -200 I (DIstnct)
2 PopulatIon denSIty 2001 (DIstncts)
3 Sex-ratIO (DIstncts)
4 LIteracy rate for persons and females(Dlstncts) 2001
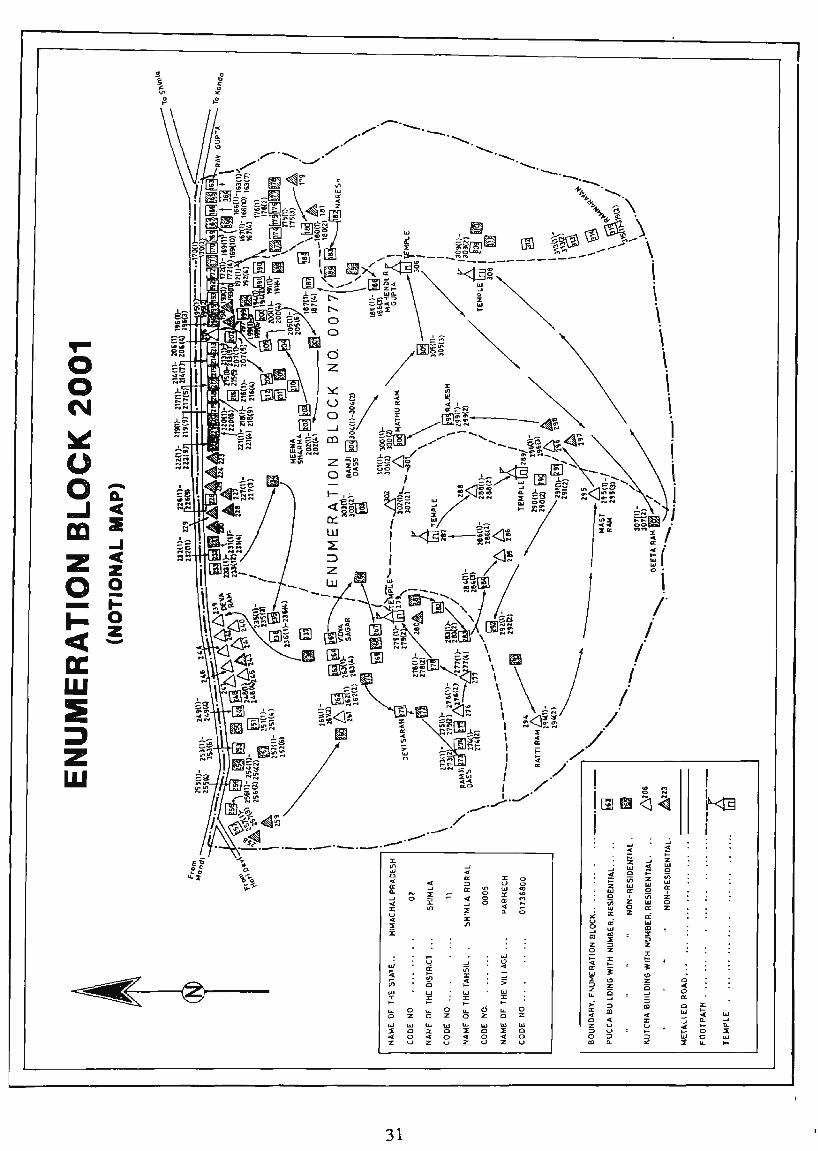
5 NotIonal Map of Enumerators Block
III
Pages
V
VII
IX-X
XI
XII- XIII
1- 2
5-19
21
22
23
24
27
28
29
30
31
Charts and Diagrams :
I ComparatIve SIze of populatIOn of StateslUts
2 ComparatIve SIze of area and populatIOn of the dIstncts 2001
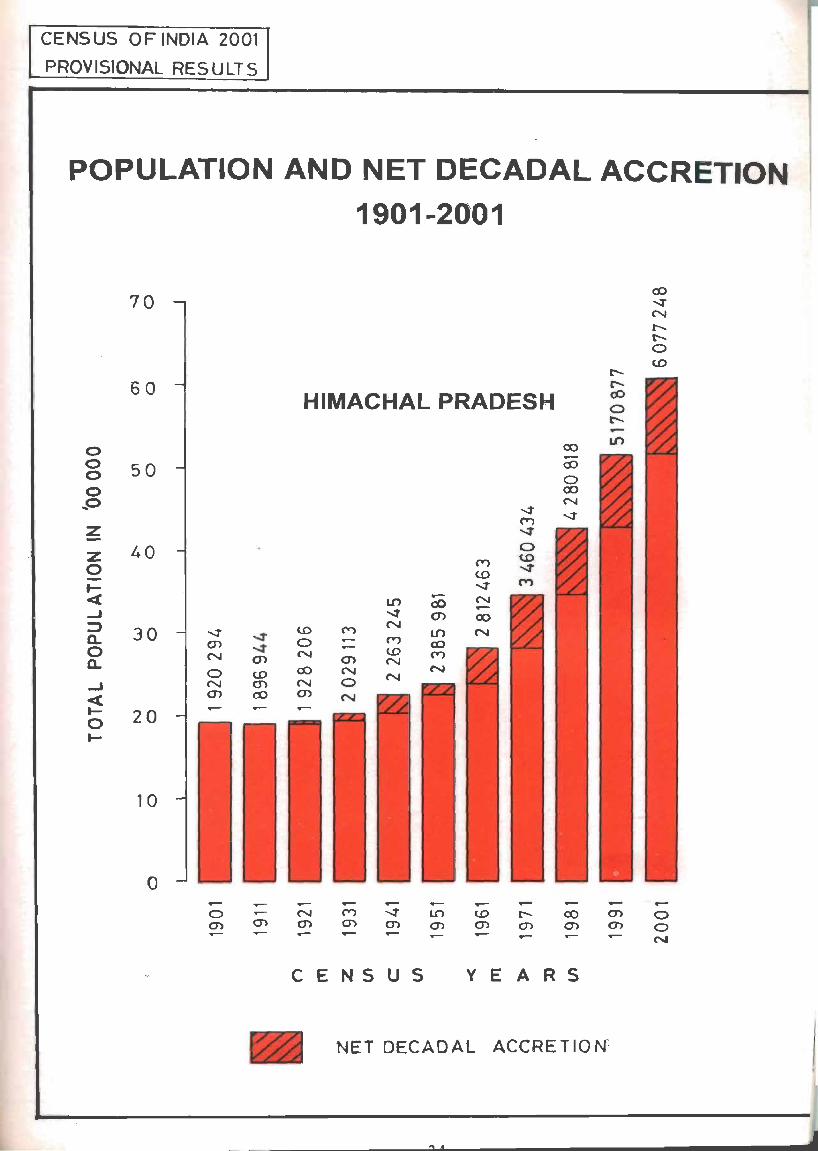
3 PopulatIon and net decadal accretIOn 1901-2001
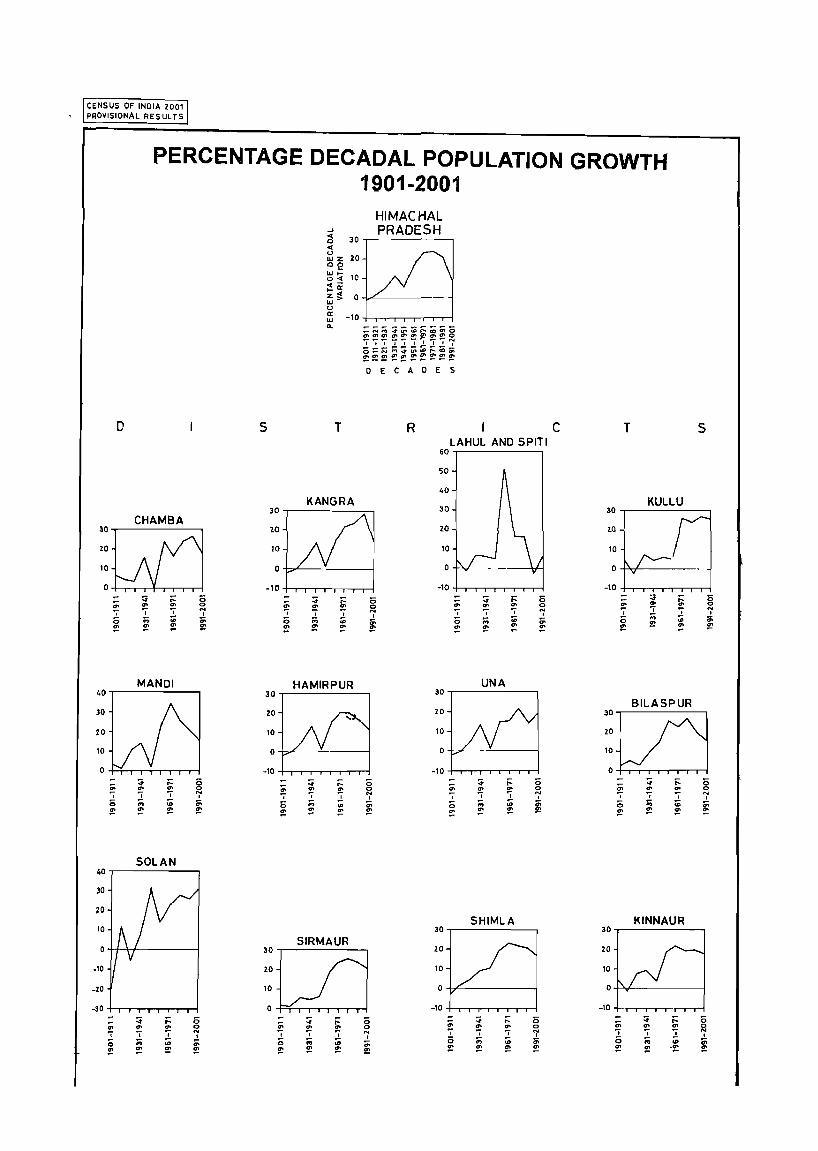
4 Percentage decadal populatIOn growth-I 9.01 .. 2,.001 for dIStncts
5 Sex-ratIo 1901-2001
6 Trends III sex-ratIo for DIstncts 1901-2001
7 LIteracy rate for DIstncts 2001
8 Female lIteracy rate of dIStncts 2001
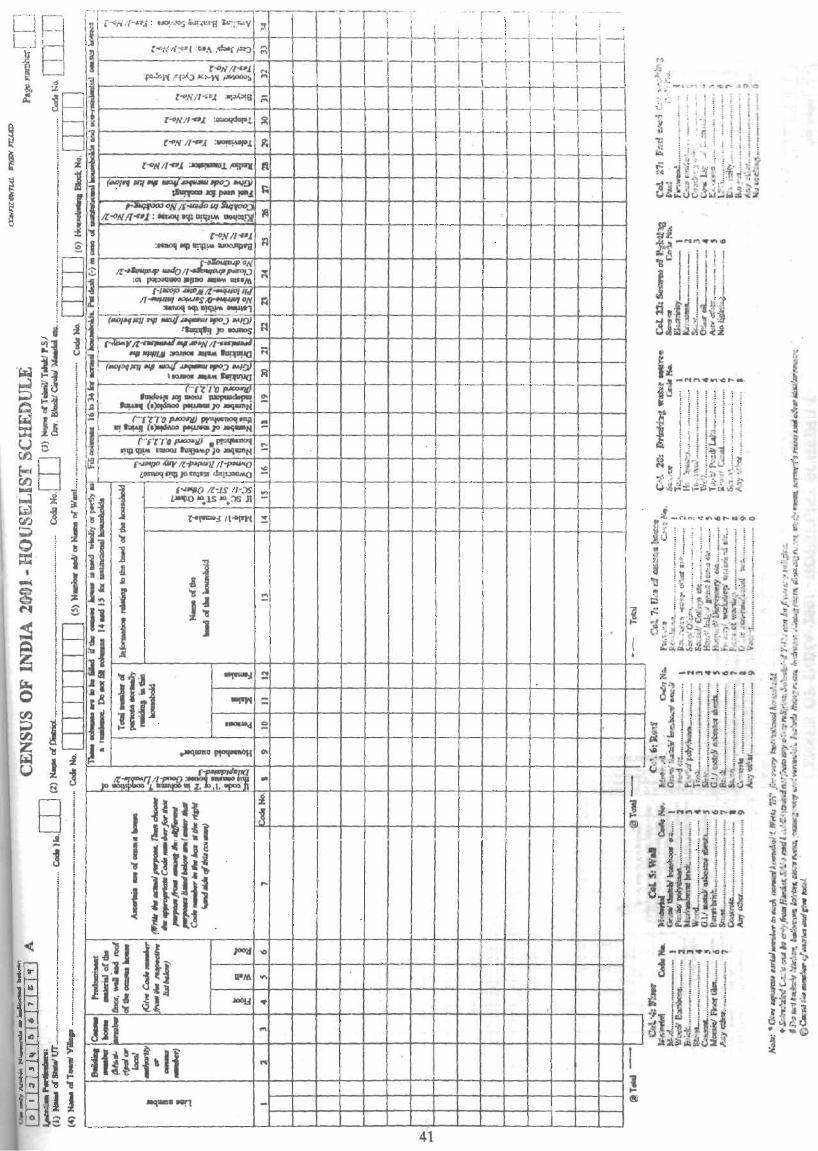
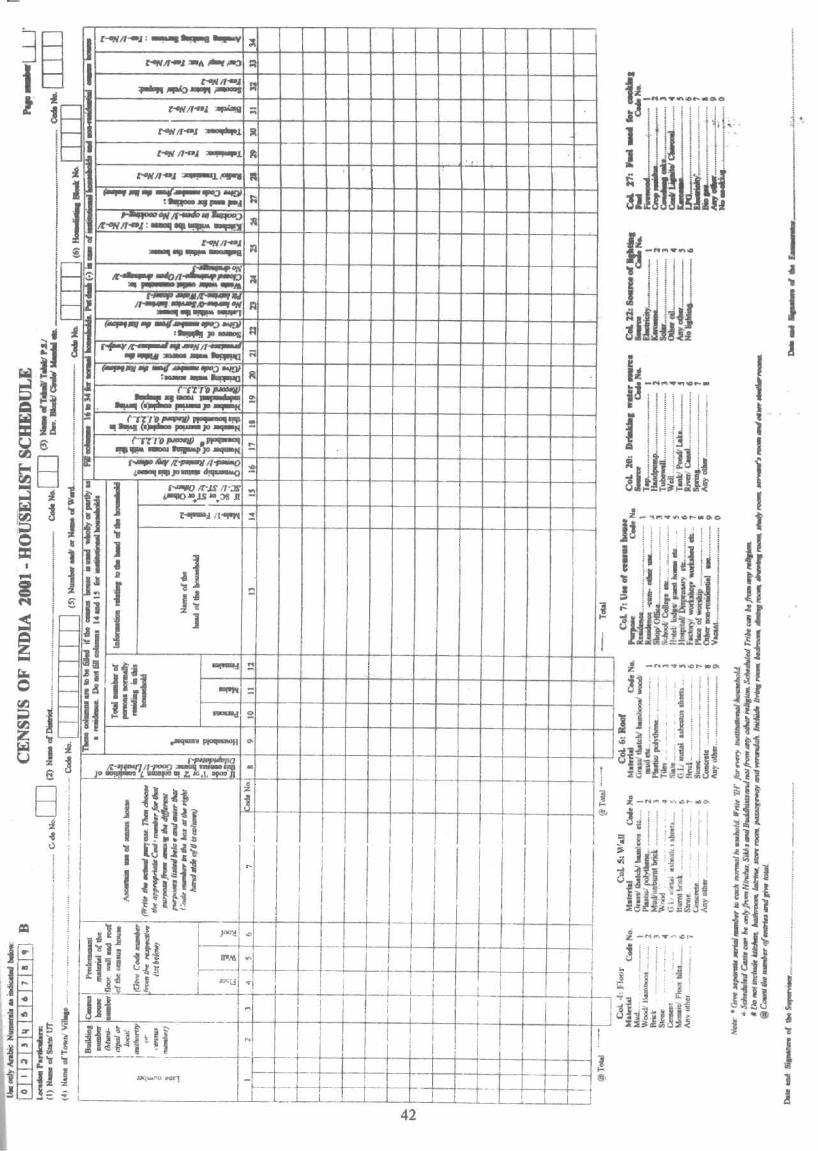
Houselist Schedule
Household Schedule
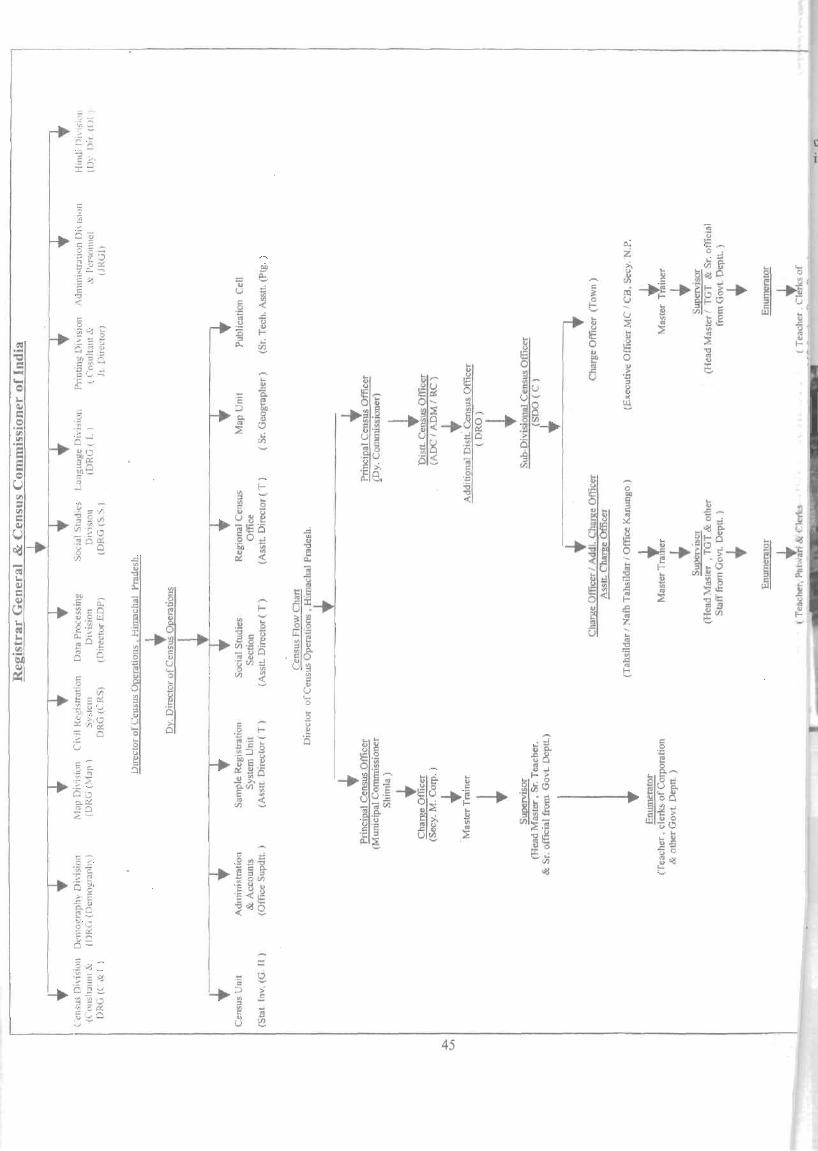
Organisational Chart of Census Heirarchy
Photographs
IV
32
33
34
35
36
37
38
39
41-42
43-44
45
CENSUS OF IN,)IA 200'
,
t 1
T
611'
T
RA.ASTHA'I
j
~T
1-}3.".,,00 upw ,)un. t'\ j" h d d tR.ir With tr pam''>.''Iton 11fthl.. ~ur.qor (,enaal f'f india
111e tffTltonal wattT"; .)f .nd18 extend tMo th ...
'ICC! to .a mance oft\\ot."v~ Tldutlc:aJ mUCI
measured from th. appropnak b.,,~ hn.
'16'
A
118'
INDIA POSITION OF HIMACHAL PRADESH
IN INDIA 2001 BOundary Int"",abon.1 ___ Boundary Stater urI _
KILOMETRES 100500 100 200 300 400 500
I N
!II'
MYANMAR
, 32
,~BURMA)~ ••
~~\
L~., , c- I, IBtrnII)
~ • N_am I lind .. ,
~ ¥ Ba",," I (Ind .. , , ". ..,. _ 12 % 'I
-;.~ O"'i'.t,. ANDAMAN SEA
C <:)
::. 1-", (>
0 ~
~ I "11' ,,~ -Q
tJ> ,.. .".
Inalra POint Z. 0 III
1. 112"
s'
Th. mt..-ute hoonclu"". bdw"", Arun.dI.1 Pradesh Assam and Mt.ghllava '1hown M tillS map are dl .. ntterpret~ fr 1m the
® G()vemmmt ul Incba t.;opmgfrt 2001
"'.mh Eastern \rca.\Reorg.m'llll"",) A.ct 1971 but hove yd. to be venficd.

CENSUS OF INDIA ZOOI PRO~ISlaNAl RE SUlTS
/-/
'M M U ....... A /- ...... _1>
I\,.
~ "\ \ )
(
IV
"-
0
'-. -..
HIMACHAL PRADESH ADMINISTRATIVE DIVISIONS
2001
If .q
./ _,
BOUNDARIES
INTERNATIONAL
STATE DISTRICT
TAHSIL I SUB TAHSIL
V TlSA • \CH<lJIIAHl (-'l..,J--' , . -..J 20 10
KILOMETRES
o 20
'\ UDAIPUR
l .........
I SAl~NI
'" "'"...., ~-'-
MBA )
@KYELANG (LAHUL) MCHAMBA
@
C H A "., \CHUAR KWAS BRAHMAUR A H U L A N D 5 PIT
~"::~::,,: j--', / • \. • '- HOLI I ) .- - "'..... . \ .__
(... @ ..... , MANALI 'I ..... ~..... • ) ":WAll-"HAS DHI>,RMSALA ..... .r • " \.. (~~i.t,)
"~ORA iJAWALI)·4 K.ANGRA PALAMPI:IR ''\. A L • • • ~ '" FATEH~UR K A N G R A \ 1'_-/
....... llAROH_jII 'LAO SHAROl ~ KULLU ( ,
40
-I "\ M ~RA Q K U L L U \ [ A "'" 'lSI
\ t<:HA Kl-fUNOIAN ~... ..... - S'-\ 't'ANGl'HA.
NGI Kill A 5 ~RA -;,.-e _!!I)lS.\!i{:kIPUR ~ATlP~1 '> r • , m SWA~) ""PIPue THURA)/ j. (PAD,",R») I r _) \HANG"AN(H
K
u.
• 5 ._..-, \ ~ IlAKKAR ... 'TIRA su4l<pu~ .DHAR"'PUR I ,I
" ',. \*"AO~N \ • "OTLI .SAINJ ,- ./.._)-...r • \ • ,).HAMfR@UR \. @MANDfUT~, r J..... POO
... AM. \ HAMIRPUR dSARI<AGHAT SA,ltHOW'I., I \ K N N A U R \ BANuA~~ .BK R4H.J GOHAR" ~ • BAN.JAR 1
\ 11 \ - -\ BAl.""""'. .(CHAtHY07) I (\ NICHA" C MO:ANO
N A' .,., ~. ., '\ •
\
BAR~AR .TWAl), SUNO~~NAGAR THUNAO, ) @ RE~KONG PEO
@UNA ....... \ HU~RW(" MAN 0 \ ~ NE~M'NO / '-
)
• _ _ ". • (.A.MPUR '- __ •
HAROli r "\ al[ SPUR") • • )A"I /-l - ') SANGLA , 'HA.OOT.. r-. ~ -.. NlHAI KA"SOG J.... ~ _ '-\. J \. SILASPUR I!< '- \ I • "A"'><"RI -,
, ,~ _ .WARGHAT" " .IKUMHAR5..u. • ~WAR )- ...
PART OF TAHSIL KASAUll
U1 'TAJl PRADESH
""l \ ~INA ~EVI) \..._ ..... ..-- _.. ROHAU • (000." KWM) "" A.,.. "'-_ .~EONI Tlf.AR • CHIR[J.AON·.......- '-~ ;I' ARKIt • ./
A
e
51
.!!Q.
SHfMlA URBAN TAHSil
SrI\lI,\'lI.. RUR~l i~HS\l
KALPA TAHSil ..
TAH 1SUB-TAHSIL
BRANGAl
(BHALAi)
DAl~OUS!E:
HARCHAKIAN
SANDHOl
_ TAHSILIsue-TAHSILS CREttTEO
OURING 1991 -2001
HEADQUARTERS
STATE
DISTRICT
TAHSIL/SUB-TAHSIL
76° EAST OF GREENWICH
* @
•
l RA"1SHAHR • -' A ... B • KQT.KHAI ) -'5 0 t. A N '?,,_ lHEOG .JUBBAl
• ,?s 1-1 I M l A / \NALAGARH ~At4I)A.hlrA'T .... JUH(;~,
KRISHANG'*RH. • \.. / ) CHAUPiD.L "'" " KA$AUl\ Y ( ..._
"( \., ",. @ rRAJGA'H' NERU~ " \. SOtAji...t • """\ ~t~J.. ~
) 1 SARAHAN NO~RA--"""tl: "'<'" (PACHHAO} Rt " • ~A.NGRAH H"~AI
I ·lRENUI<A) .....
1- OMJAHU • J <d NAHAN." '''"AU ,., :::J
1 (' @ '-"? "S I R M A U ~ ../
)- L- '- PAONTA SAHI~
~ll' !--At -t-"'\
'" -4 )u p"
c
DISTRICT HEAOQUARTERS A~E ALSO TAHSIL HEADQUARTERS (EI(CEPT KINNAUR WHERE IT IS LOCAlED AT RECIo;QN<J PEQ)
WI:iERE THE NA-ME OF TAHSIL/SUB-TAHSIL DIf:FERS FROM ITS HEADQUARTERS NAME THE FORMER HAS BEEN WRfTlE'"
WITHIN BRACKETS iHE ADMINISTRATIVE HEADQUARTERS OF SHIMLA ~URAl TAHSil SHIMLA URBtr.N TAo.ISIL AND KALPA TAHSIL ARE: AT SH!IrotLA
AND KALPA RESPECTiVELY
H
-I»
Based upon Survey of India Map wdr !he permIssion of the Surveyor General of IMla ® Govemment of 100\8 copynghl 2


PREFACE
IndIa has a proud tradItIOn of contmuous census takmg SInce 1872 Arthshastra and Am-e-Akban contam referenl,c to census takmg for the purpose of tax collectIOn and as')es~mg able bodIed youths for army In modem tImes the c,ensus facts and figure~ pre')ent souo-economlC, cultural and demographIc profile of <;oclety Census 2001 IS the 14th decennIal census, 6th after Independence and first of the 21,t Lcntury and the new nullennlUm In Illmachal Pradesh, It IS 5th smce 1961 as separate umt EarlIer, It u<;ed to be conducted alongwith Punjab
Census OperatlOn IS organIzed m two phases (1) Househstmg- m WhIch habitats of people are 10cated,IdentIfied and structures numbered In other words, the houschstmg operatIOn done about a year m advance of actual populatIOn count. gIves an Idea about reSIdentIal houses, workplaces and vacant house~ beSIdes the baSIC amenIties aVaIlable to each household Thl'> tIme mformatIOns about posseSSIOn of radIOTV,velucle,telephone,utlhzmg aVaIlable bankmg facIlItIeS by the households were also collected (11) EnumeratIOn- 1 e populatIOn count-m whll,h 23 questlons were convassed beSIdes a questIOn about cultIVators ThIS tlme questIOn on dIsabIhty was also convassed
TrIbal areas of HImachal Pradesh has dIfficult terram and hostIle geoclImatlc condItIOns due to whIC,h It IS not pOSSIble to conduct census dUrIng the months of February/March Therefore, as per past practIce the census was conduded m dIstncts of Lahul & SPItI,Shlmla and snow bound areas of other dIstncts VlZ Kullu, Mandl, Chamba and Kangra-durlllg September/October,2000 In other areas, the Census was conducted m February/March,2001 alongwIth other States and UnIon terntones of the country EnumeratIon In KUll1aur dIstrIct could not be conducted due to unprecedented floods on 31 ~t July, 2001 Now on restoratIOn of road commumcatIOn, the enumeratIOn wlll be conducted from 12-5-2001 to 31-5-2001 SImIlarly, the ~tate had to conduct electIOn::. to Panchayati Raj ms1ttutIOns and urban bodIes In November/December, 2000 The maJonty of enumerators and officers were common to electlOns and Census OperatIOn Therefore dates for traInIng and l.onduct of electlOn as well as Census OperatIOns were fixed by mutual consultatIOn WIth State ElectlOn CommISSIOn I am thankful to Sh K C Sharma, State ElectIOn CommlS::'IOner for domg the needful
Enumerator'> and SupervIsors dra\\TI from varIOUS Central/State government departments and publIc undertakmgs were tramed 21961 such Enumerator'> ISupervisors were deployed for houselIstmg and enumeratIOn both In <;nowbound and other area~ of the State
The DIrectorate of Census OperatIOns has well knIt team of dedIcated officers and offic1als who tOlled hard to consohdate the efforts put dunng the entIre census operatIOn m the field enablmg to bnng out Paper 1 of 2001- PrOVISIOnal PopulatlOn Totals DespIte dIfficultIeS m the field, the trammg, househstmg and enumeratIOn were conducted and concluded WIth the actlVe cooperatIon and
IX
partICIpatIOn of everyone m the dIStrIct admllllstratlon The Deputy COnUnISSlOners, theIr officers and others who partlcipated m trus operatIOn are worthy of smcere thanks
I am thankful to Shn A K GOSWaInI, Cruef Secretary, HImachal Pradesh who has always been gUldmg and mspmng us and the Deputy COmmISSIOners to accomplIsh tms gIgantIc operatIOn
My staff and myself are thankful to Sh J K BanthIa, RegIstrar General & Census CommISSIOner, India for trmely guIdance and support and msprrmg us constantly dunng the entIre operatlon
The present publtcatlon presents prOVISIOnal populatIOn of HImachal Pradesh as on 1-3-2001 It contams populatIOn figures at a glance, growth of populatIOn, denSIty and lIteracy There are about 25 Census publIcatIOns winch Will be brought out m due course
Last but not least, I dedIcate fins volume to two partners m census takIng the person enumerated and the enumerator
Shlmla March 28th
, 2001
x
R.L.Bisotra, DIrector of Census OperatIOns,
Hrmachal Pradesh,SHIMLA
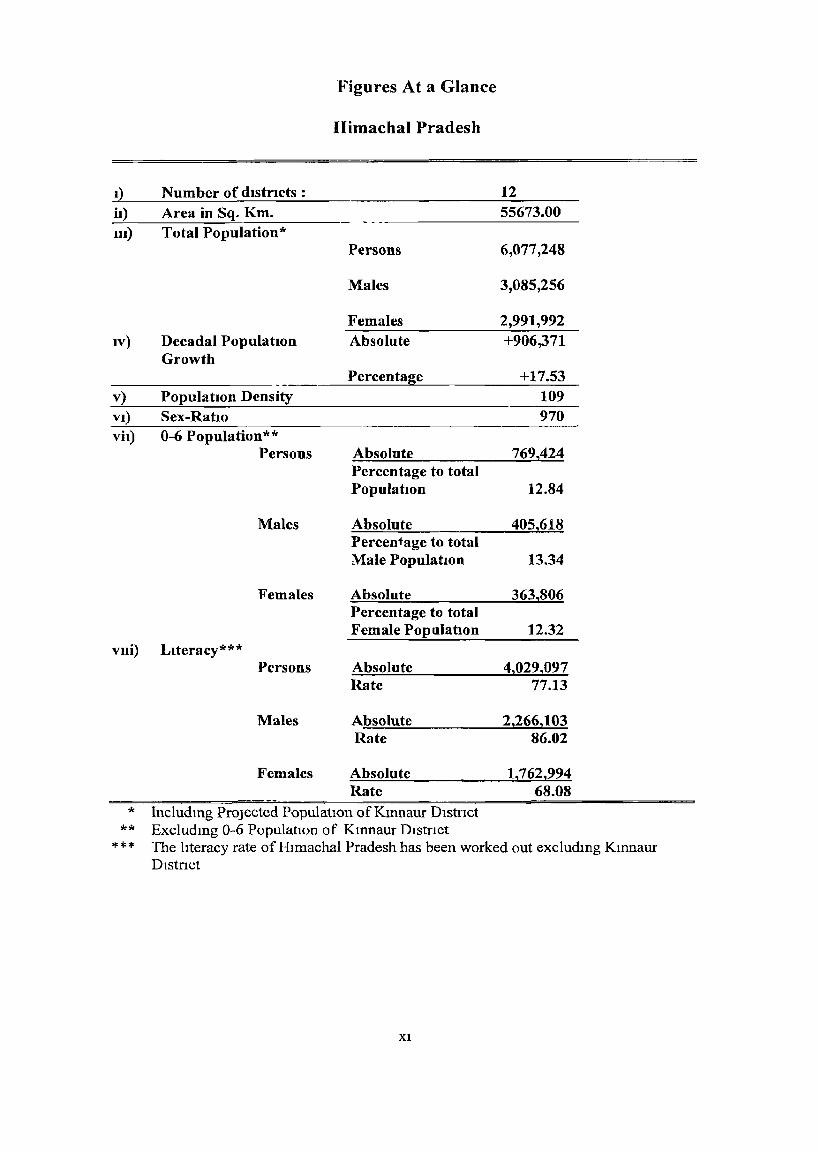
Figures At a Glance
Himachal Pradesh
I} Number of dIstrIcts: 12 h) Area in Sq. Km. 55673.00
Ill) Total Population* Persons 6,077,248
Males 3,085,256
Females 2,991,992 IV) Decadal Population Absolute +906,371
Growth Percentage +17.53
v) PopulatIon Density 109 VI) Sex-Ratio 970 vii) 0-6 Population**
Persons Absolute 769,424 Percen tage to total PopulatIOn 12.84
Males Absolute 405,618 Percentage to total Male PopulatIOn 13.34
Females Absolute 363,806 Percentage to total Female Population 12.32
vlli) Literacy*** Persons Absolute 4,029,097
Rate 77.13
Males Absolute 2,266,103 Rate 86.02
Females Absolute 1,762,994 Rate 68.08
* Includmg Projected PopulatIon of Kmnaur DIstnct ** Excludmg 0-6 PopulatIOn of Kmnaur DtstrIct
*** The lIteracy rate of }-hmachal Pradesh has been worked out excludmg Kmnaur DIstnct
Xl
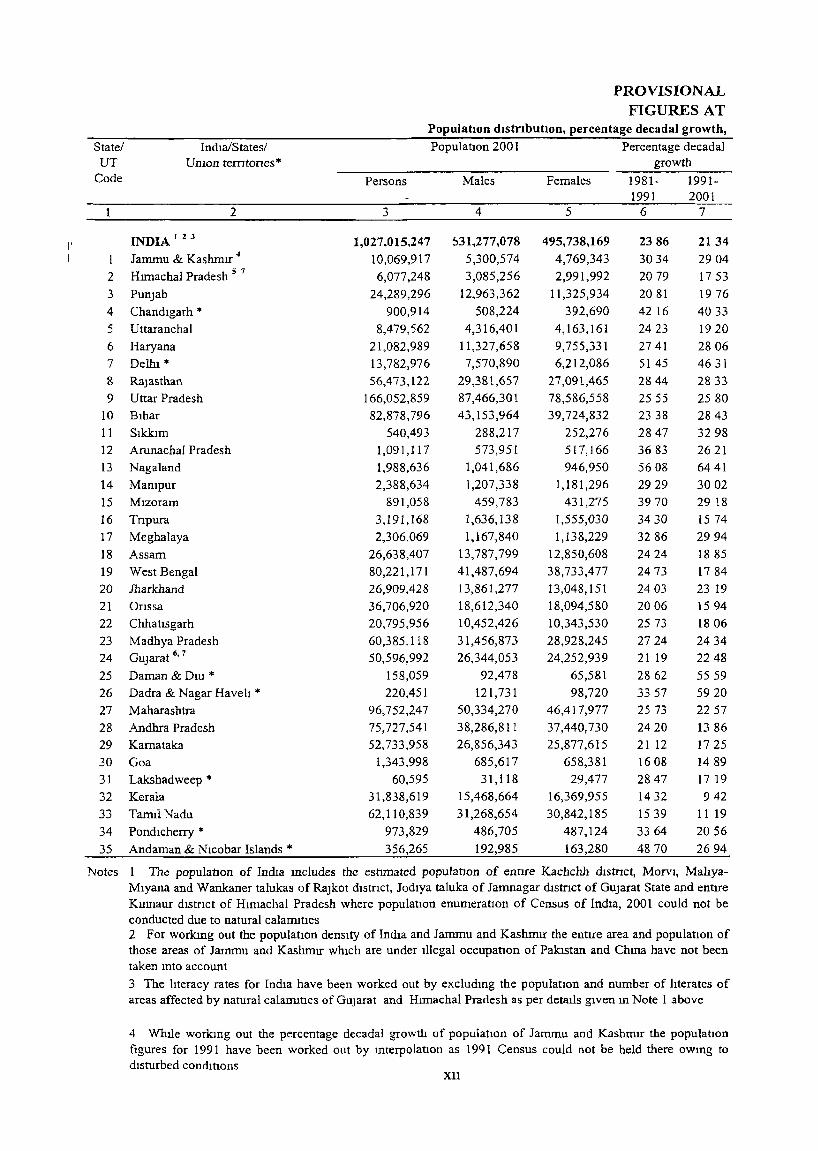
PROVISIONAL FIGURES AT
PopulatIon distrIbutIon, percentage decadal growth,
State/ Indla/States/ PopulatIOn 2001 Percentage decadal UT Umon temtones* growth
Code Persons Males Females 1981- 1991-1991 2001
2 3 4 5 6 7
I' INDIA 12 J 1,027,015,247 :'31,277,078 495,738,169 2386 2134
I Jammu & Kashmrr ~ 10,069,917 5,300,574 4,769,343 3034 2904
2 Hrrnachal Pradesh 5 7 6,077,248 3,085,256 2,991,992 2079 1753
3 Punjab 24,289,296 12,963,362 11,325,934 2081 1976
4 Chandlgarh * 900,914 508,224 392,690 42 16 4033
5 Uttaranchal 8,479,562 4,316,401 4,163,161 2423 1920
6 Haryana 21,082,989 11,327,658 9,755,331 27 41 2806 7 Delhi * 13,782,976 7,570,890 6,212,086 5145 4631
8 Rajasthan 56,473,122 29,381,657 27,091,465 2844 2833
9 Uttar Pradesh 166,052,859 87,466,301 78,586,558 2555 2580 10 Blhar 82,878,796 43,153,964 39,724,832 2338 2843
11 Sikkim 540,493 288,217 252,276 2847 3298 12 Arunachal Pradesh 1,091,117 573,951 517,166 3683 2621 13 Nagaland 1,988,636 1,041,686 946,950 5608 6441
14 Mampur 2,388,634 1,207,338 1,181,296 2929 3002
15 Mizoram 891,058 459,783 431,275 3970 2918
16 Tnpura 3,191,168 1,636,138 1,555,030 3430 IS 74
17 Meghalaya 2,306,069 1,167,840 1,138,229 3286 2994
18 Assam 26,638,407 13,787,799 12,850,608 2424 1885
19 West Bengal 80,221,171 41,487,694 38,733,477 2473 17 84
20 lharkhand 26,909,428 13,861,277 13,048,151 2403 23 19
21 Onssa 36,706,920 18,612,340 18,094,580 2006 1594
22 Chhansgarh 20,795,956 10,452,426 10,343,530 2573 1806
23 Madhya Pradesh 60,385,118 31,456,873 28,928,245 2724 2434 24 GUJarat 6,1 50,596,992 26,344,053 24,252,939 21 19 2248
25 Daman & Dm * 158,059 92,478 65,581 2862 5559
26 Dadra & Nagar Havel! * 220,451 121,731 98,720 3357 592O
27 Maharashtra 96,752,247 50,334,270 46,417,977 2573 2257
28 Andhra Pradesh 75,727,541 38,286,811 37,440,730 2420 13 86
29 Kamataka 52,733,958 26,856,343 25,877,615 21 12 1725
30 Goa 1,343,998 685,617 658,381 1608 1489
31 Lakshadweep * 60,595 31,118 29,477 2847 17 19
32 Kerala 31,838,619 15,468,664 16,369,955 1432 942
33 TamIl Nadu 62,110,839 31,268,654 30,842,185 1539 11 19
34 PondIcherry * 973,829 486,705 487,124 3364 2056
35 Andaman & Nlcobar Islands * 356,265 192,985 163,280 4870 2694
Notes 1 The populatIOn of IndIa mcludes the estrrnated populatlOn of entIre Kachchh dIstrIct, MOTYl, Mahya-Mlyana and Wankaner talukas of RaJkot dIStnct, Jodlya taluka of Jamnagar dIstrIct of GUJarat State and entire KllIDaUT dIstrIct of Himachal Pradesh where populatIon enumeratIOn of Census of IndIa, 2001 could not be conducted due to namral calarrunes 2 For workmg out the populatlOn denSIty of IndIa and Jammu and KashmIr the entrre area and populanon of those areas of Jammu and Kashmrr WhICh are under Illegal occupatIon of Palastan and Chma have not been taken mto account
3 The lIteracy rates for IndIa have been worked out by excludmg the populatIon and number of hterates of areas affected by namral caiarmties of GUJarat and Hrmachal Pradesh as per details glVen m Note 1 above
4 WhIle workmg out the percentage decadal growth of populatIOn of Jammu and KashmIr the populanon figures for 1991 have been worked out by mterpolatlOn as 1991 Census could not be held there owmg to dIsturbed condlttons
xu

POPULATION TOTALS 200] A GLANCE sex ratIO, populatIOn densIty and literacy rate
Sex ratIo PopulatIOn density Literacy rate 200 I Indla/States/ State/ ( females per 1,000 males) (per sq km) Uruon temtones* UT
1991 2001 1991 2001 Persons Males Females Code
8 9 10 11 12 13 14 2
927 933 267 324 65.38 7585 5416 123 INDIA
896 900 77 99 5446 6575 41 82 4 Jammu & Kashmrr
976 970 93 109 77 13 8602 6808 5, 7 HImachal Pradesh 2 882 874 403 482 6995 7563 6355 Punjab 3 790 773 5,632 7,903 81 76 8565 7665 '" Chandlgarh 4 936 964 133 159 72 28 8401 6026 Cttaranchal 5 865 861 372 477 6859 7925 5631 Haryana 6 827 821 6,352 9,294 8J 82 8737 7500 * Dellu 7 910 922 129 165 6103 7646 4434 Rajasthan 8 876 898 548 689 5736 7023 4298 Uttar Pradesh 9 907 921 685 880 4753 6032 3357 BIhar 10
878 875 57 76 6968 7673 6146 Slkkrm 11
859 901 10 13 5474 6407 4424 Arunachal Pradesh 12
886 909 73 120 67 11 71 77 6192 Nagaland 13
958 978 82 107 6887 7787 5970 "Mampur 14
921 938 33 42 8849 9069 86 n MlZoram 15
945 950 263 304 7366 8147 6541 rnpura 16
955 975 79 103 6331 6614 6041 Meghalaya 17
923 932 286 340 6428 7193 5603 Assam 18
917 934 767 904 6922 77 58 6022 West Bengal 19
922 941 274 338 5413 6794 3938 lharkhand 20
971 972 203 236 6361 7595 5097 Onssa 21
985 990 130 154 65 18 77 86 5240 ChhatIsgarh 22
912 920 158 196 6411 7680 5028 Madhya Pradesh 23
934 921 211 258 6997 8050 5860 67 GUJarat 24
969 709 907 1,411 8109 8840 7037 * Daman & DIU 25
952 811 282 449 6003 7332 4299 * Dadra & Nagar Haveh 26
934 922 257 314.. 77 27 8627 6751 Maharashtra 27
972 978 242 275 61 11 7085 51 17 Andhra Pradesh 28
960 964 235 275 6704 7629 5745 Kamataka 29
967 960 316 363 8232 8888 7551 Goa 30
943 947 1,616 1,894 8752 93 15 8156 * Lakshadweep 31
1,036 1,058 749 819 9092 9420 8786 Kerala 32
974 986 429 478 7347 8233 64 55 TamIl Nadu 33
979 1,001 1,683 2,029 8149 8889 7413 * Pondlcherry 34
818 846 34 43 81 18 8607 7529 * Andaman & Nlcobar Island!. 35
5 Figures shown agamst Hrmachal Pradesh have been amved at after mcludmg the estImated figures of entIre KInnaur dlstnct of Htmachal Pradesh where the populatIOn enumeratIOn of Census of IndIa, 2001 could not be conducted due to natural calamIty
6 Figures shown agamst GUJarat ha"e been amved at after mcludmg the estImated figures of entIre Kachchh dlstnct, MOfVI,
Mahya-MIyana and Wankaner talukas of RaJkot dlstnct, Jodlya taluka of Jamnagar dIstrIct of GUJarat State where the population enumeratIOn of Census of IndIa, 2001 could not be conducted due to natural calamity
7 LIteracy rates shown agamst HImachal Pradesh and Gu]arat do not mclude areas affected by natural caiarmhes, the detaIls of whIch are gIVen m Note 1 above
Xlll

State HIghlIghts - Certam Important Facts, Himachal Pradesh
1 NotIficatIOn No GAB-2B(1 )-3/99 dated 24-11-99 Issued by State Government under the Ccnsm, Act 1948 appomtmg Census Officers at vanous leveb for 2001 Census
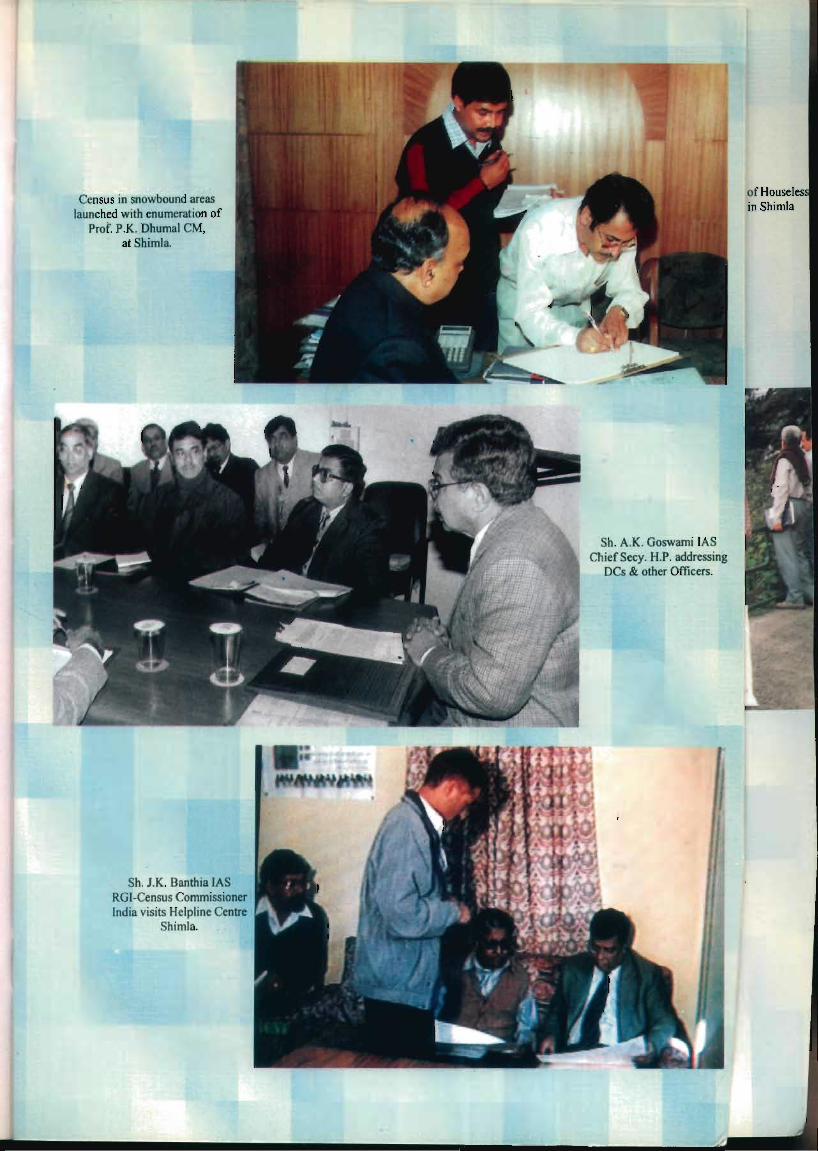
2 State level Meetmg/Trammg of Census Officers held at HImachal Pradesh Secretanat on 31-1-2000 under the ChaIrmanshIp of Sh A K Goswarm, Cruef Secretary, HImachal Pradesh
3 DIrectors Conference on traImng module held at HIP A, Shlmla From 29th
June to 30th June,2000 under the Chamnanshlp of Sh J K Banthm,IAS RegIstrar General & Census ComnllssIOner, IndIa
4 Orders of Freezmg of AdmImstratI ve Boundanes by 31 st December,1999 Issued by the RegIstrar General & Census CommIsSIOner, IndIa VIde order No 9/20/94-CD dated 8-11-99 was followed
5 Number of vIllages of Himachal Pradesh mcreased from 19,388 (1991) to 20,118 for 2001 Census due to settlement m some dIstncts of the State
6 State's Topography IS pecubar as such Census IS conducted m Nonsynchronous (InaccessIble) areas and General Areas separately m the month" of September-October, 2000 and February-March,2001 respectIvely
7 Kmnaur dIstnct of the State was badly affected by Natural Calamity of heavy floods on the mtervenmg mght of 31 st July and 1st August, 2000 as such the EnumeratIOn had to be postponed tIlll'vIay, 2001
8 ElectIons to PanchayatI Raj InstItutIOns and Urban Local bodIes were held m November-December, 2000 when the Census process was m progress Enumerators/SupervIsors and tahsIllblock level officers were deployed for conductmg electIOns Before that they have to undergo varIOUS rounds of trammg MaJonty of these officers/supervIsors/enumerators were also engaged III trammg and conductmg enumeratlon III snowbound areas The adjustment of dates for trammg and enumeratIOn were worked out aVOldmg the overlappmg of deployment of the staff
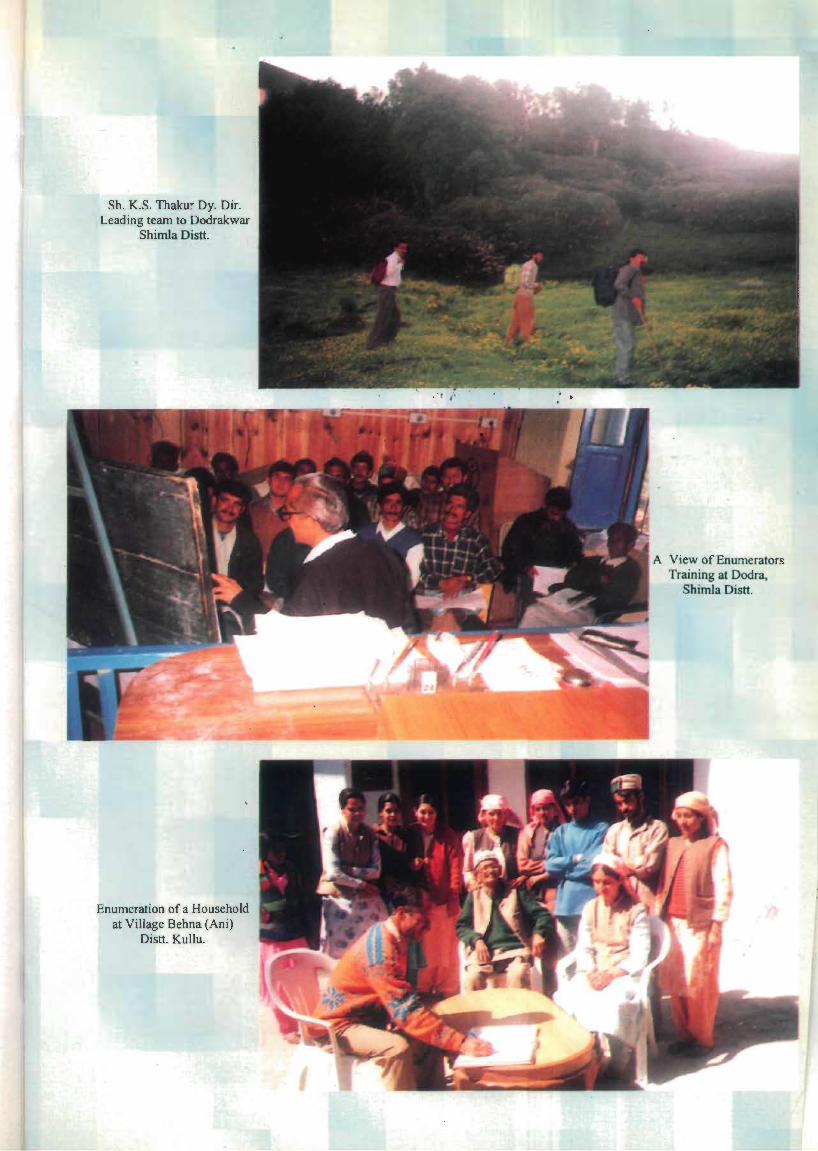
9 40 Kms Journey on foot had to be undertaken to reach Dodrakwar the charge headquarter m dIstnct ShImla for tramIllg of enumerators and supervIsors
10 Hon'ble ChIef Mlmster of HImachal Pradesh Sh Prem Kumar Dhumal maugurated the Census takmg III HImachal Pradesh m Non-synchronous areas on 11 th September, 2000 at Shimia

11 HIS Excellency the Governor of HImachal Pradesh, Sh Vlshnukant ShastrI, and HIs Excellency the Governor of HImachal Pradesh, Sh Sura] Bhan, were enumerated dunng 200 1 Census
12 Census Duectorate shIfted from Boswell, Park-8A office to Hlmadan Block, eGO Complex, Longwood Smmla-l ill October, 2000 dunng peak penod of Census OperatIOns The Duectorate was estabhshed at Boswell m September, 1959 when Sh R C Pal Smgh,lAS took over as Census Supenntendent,Hrmachal Pradesh
13 Sluvratn FaIr held ill Mandl dIstrIct from 22nd to 28th February, 2001 durmg EnumeratIon penod F ebruary-March,200 I
14 Marl Mela held m Una dIstnct whIch started from 3 rd March, 2001 PreparatIOns started we f 20th February, 2001 durmg enumeratIOn penod
15 Helplme Centres created at State CapItal Smmla dunng EnumeratIOn m September, 2000 and Sh J K BanthIa,IAS,Reglstrar General, IndIa VISIted the centre on 30 9 2000 Later on such practIce was followed for general areas
16 The responsIbIlIty of conduct of EnumeratIOn of each dlstnct was gIven to Team Leaders of the rank ofDD/ADlInvestIgators
2

INTRODUCTION ANALYSIS OF PROVISIONAL
POPULATION AND TABLES


INTRODUCTION
The Census takIng IS one of the bIggest arummstratIve operatIOns m the country whIch alms at enumeratmg the largest populatIOn next only to Chma The Census Org lmsatlOn assumed Its permanence WIth the creatIOn of a permanent post of Reglstrar General and Ex-officIO Census CommlssIOner,Indla In 1958 under the overall admInIstratIve control of MImstry of Home Affa1rs, Govt of IndIa Subsequently the actIVIties of the office of the RegIstrar General & Census CorrumssIOner, IndIa have expanded theIr scope as well as complete momtonng of ClYil RegIstratIOn , Sample RegIstratIOn data and vanous Socml and AnthropologIcal studIes throughout the country
Census OrgamsatIOn IS headed by the RegIstrar General & Census ComrmssIOner, India at the apex level In each StatefUmon terrItory there IS a Census DIrectorate headed by the DIrector of Census OperatlOn mvanably an lAS officer generally from the concerned StatelUruon terrItory Dunng the mtercensal penod the DIrectorates are headed by It DirectorlDy DIrector belongmg to the 01 gamzatlOn
The Census OperatIOn IS carned out through the State Govt machmery at vanous levels under the statutory proVIsIons of Census Act 1 948 However, the techmcal knowhow IS provIded by the Census Staff
After the Issue of notIficatIOn for conduct of 2001 Census by Govt of J ndIa, Census mechamsm IS moblhsed by the appomtment of the RegIstrar General and Census
CommISSIOner for the entue country and appomtment of the Census DIrectors m the StateslU Ts Consequently the State Govt Issued notificatIOn vIde No GAB-2B (1)-3/99 dated 24 11 99 under the Census Act,1948 appoIntmg the Deputy CommIssIoner III
respect of each dlstnct and CommlssJOner MunIcIpal CorporatIOn Shlmla as the Pnnclpal Census Officers for Census 2001 To aSSIst them III routIlle day to day functIOn for conduct of Census AddItIOnal DIstnct Maglstratesl Additlonal Deputy ComrmSSlOners m the dIstncts and Asstt CommISSIoner MUnICIpal CorporatIOn Slumla were notIfied as DIstnct Census Officers and DIstnct Revenue Officers as AddItIOnal DIstnct Census Officers for the twm operatIOns 1 e Househstmg and EnumeratIOn for 2001 Census The Sub-dIvIsIOnal MagIstrates were deSIgnated as Sub-dIvISIonal Census Officer~ to supervIse the census work m theIr respectIve Sub-dIvISIons Below the DIstrIcts/Sub-dIvISIons then at TahsIVsub-tahsIl,Mumcipal CommIttees, Nagar Panchayats, Cantonment Boards and Census towns are the field cen'iUS uruts Accordmgly the TahslldarslNaIb-tahslldars and Office Kanungos were appomted as Charge Officers! Addl Charge Officers and Asstt Charge Officers Whereas III urban areas the ExecutIve Officers of the Mumcipal CommIttees and Cantonment Boards, Secretanes of the Nagar Panchayats were appomted as Charge Officers for thelf respect1ve urban Un..lts There was slmllar parallel sct-up fOf the mIlitary and para-mIlItary orgamzatIOn for conduct of populatIOn enumeratlon of 2001 Census III the restrIcted areas of the State The enumeratIOn m such restncted areas has been conducted by the officerslstaff of the respectIve organIzatIOn The other census functJOnanes such as Enumerators and SupervIsors were drawn from the state and central government departments These are mo"tly teachers, revenue offiCIals, employees of local bodIes and other state and central government employees
Himachal Pradesh compnses of 12 dIstrICts, 52 sub-dIvISIOns, 75 tahslls, 34 subtahsIls and 20118 vdlages dS agamst 19388 VIllages durmg 1991 Census The Increase m
5

the numbel of vIllages IS due to the completIOn of Settlement Operation m some of the dIstncts of the State The number of statutory towns In the State IS 56 wIth one Ccnsus town As such there IS decrease of one town smce 1991 Census Nagar Panchayat Baddl III Solan dIStrIct has been created as new Nagar Panchayat after 1991 Census whereas Sarahan, Nagar Panchayat of Pachhad tahsIl of Slrmaur dIStrIct has been denotified by the State Government Pandoh Census town of 1991 Census lost Its entIty as town In Mandl dIstrIct and Mant Khas of Kangra dIstnct IS new Census town for 200 1 Census DhallI, Nagar Panchayat of Shimia dIStrIct has been merged WIth Shimia MunICIpal Corporation
The preparatIOn for Census 2001 commenced m the begInrung of the year of 1998 and the baSIC task was to update and finalIse the lIsts of dIstncts, tahsIls, sub-tahslls/towns and VIllages The State Govt Issued orders for freezmg of boundarIes for 2001 Census follOWIng the orders of RGI VIde order No 9/20/94-CD, dated 8 11 99 For the first tIme In the hIstory of Census, a new system has been evolved to allot eIght dIgIt permanent locatIOn codes to each VIllage The permanent locatIOn code thus deVIsed may then be used as standard code m the subsequent censuses Once the the permanent locatIOn codes are assIgned to each VIllage, tracmg of preCIse locatIOn of a VIllage on account of JUrISdIctIOnal changes m the boundarIes of varIOUS admirustrative areas withm the State wIll not pose a problem CreatIon of a new admmistratIve areas, bIfurcatIOn of vIllages,merger of VIllages among the rural components and merger of rural areas Into urban area whIch normally pose senous comparabIhty problem of populatIOn data IS expected to be solved by thIs system
The next major step was to proceed from vIllage/ward level to smaller unIt of enumeratIon blocks for the purpose to enllst all the bUIldmgs/Census houses The Census Itself was conducted m two stages . FIrst bemg househstIng operatIOn and second -enumeratlon The Househstmg OperatIOn IS generally done In advance by about a year of the actual populatIon enumeratIOn Durmg the Househstmg OperatIOn beSIdes enhstmg the blllldmgs/Census houses other data have also been collected I e type of matenal used for the constructIon of the house,uses of census houses,hvmg rooms and vanety of facIlItIes available to the household such as dnnkmg water, electncIty, tOIlet, fuel used for cookIng etc The Househst schedule of 2001 census has been modIfied to some extent over the househst of 1991 Census In order to collect the addItIOnal mformatIOn whIch could throw lIght on the hvmg condItIOns of people The addItIonal questIons convassed durmg the houselIstmg operatIOn of 2001 Census relate to the condItIon of census house whether It IS In good or ltveable or dIlapIdated condItIon, number of mamed couples In household, number of mamed couples haVIng mdependent sleepmg room, waste water outlet, avaIlabIlIty of bath room and kItchen WithIn the house, possession of radlO/transistor, teleVISIon telephone, bIcycle, scooter/motorcycle/Moped,car/Jeep/van etc by household and aV311tnp hankmD <;ervlC(,<; ""' ....
The system of collectmg mdividual partIculars of each person through the IndIVIdual SlIp m earher Censuses has been done away With In thIS Census IndIVIdual partIculars have been collected through Household Schedule contammg 23 questIOns WIth an extra questIOn for households engaged m cultivatlOn/plantatIOn ThIs tIme, questIOn on dIsabIlIty was also added m the Household Schedule SIgnature of respondent gIVIng the mformatlOn about questIons was also obtamed on the household schedule ThIs tIme, appropnate code numbers were aSSIgned In respect of most of the questIOns of Household Schedules facIlItatmg theIr scannIng and processmg III the Computers
6
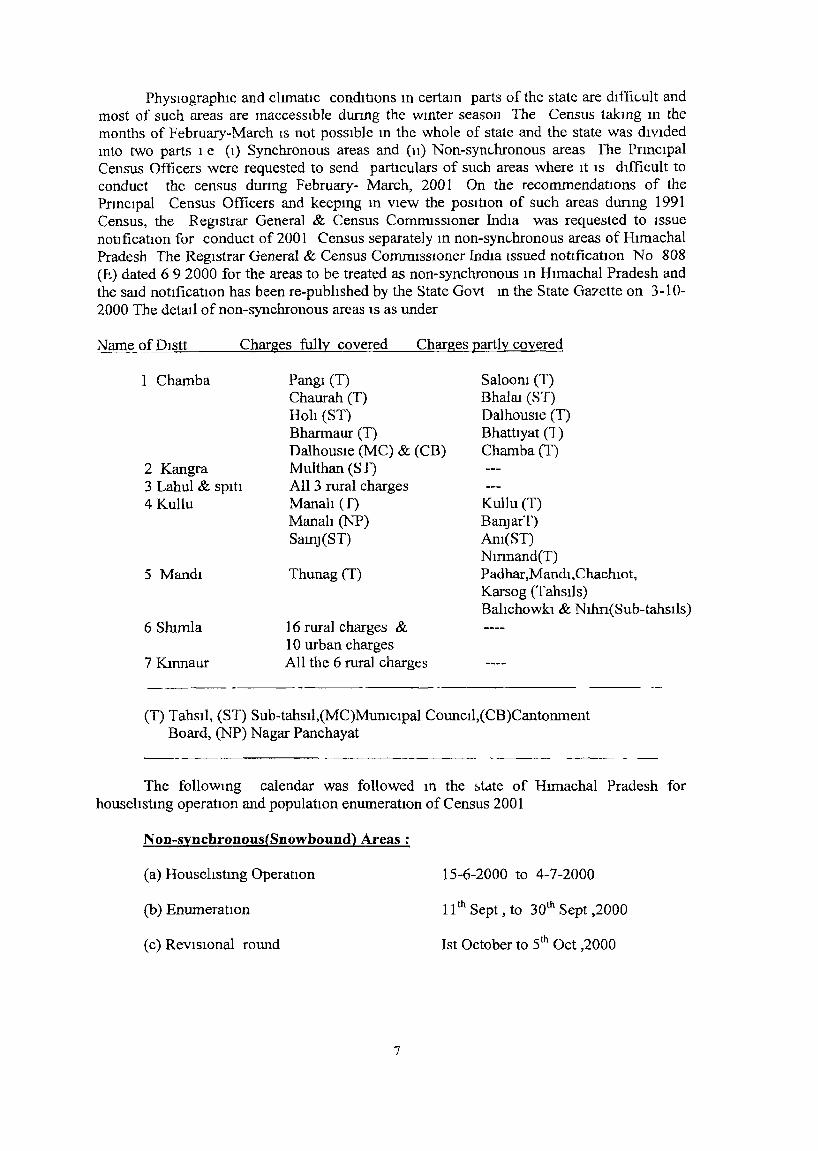
PhYSIOgraphIc and clImatIc condItIons m certam parts of the state are dIfficult and most of such areas are maccesslble dUring the wmter season The Census taklOg m the months of February~March IS not possIble In the whole of state and the state was dIVIded mto two parts 1 e (1) Synchronous areas and (11) Non~synchronous areas rhe Pnnclpal Census Officers were requested to send partIculars of such areas where It IS dIfficult to conduct the census durmg February- March, 200 1 On the recommendatIOns of the Prmcipal Census Officers and keepmg m VIew the posItIon of such areas dUring 1991 Census, the RegIstrar General & Census ComnllssIOner IndIa was requested to Issue notIficatIOn for conduct of 2001 Census separately m non-synchronous areas of HImachal Pradesh The RegIstrar General & Census COImmsslOner IndIa Issued notlficatIOn No 808 (r.) dated 6 9 2000 for the areas to be treated as non-synchronous m HImachal Pradesh and the said notificatIOn has been re-publIshed by the State Govt III the State Ga7ette on 3~10-2000 The detall of non-synchronous areas IS as under
Name_of Dlstt
I Chamba
Charges fully covered
Pangl (T) Chaurah (T) Hob (ST) Bharrnaur (T)
Charges partly covered
2 Kangra DalhouSIe (MC) & (CB) Multhan (Sf)
Saloom (T) Bhalru (ST) DalhOUSIe (T) BhattIyat (1) Chamba (T)
3 Lahul & SpltI 4 Kullu
5 Mandl
6 Slumla
7 Kmnaur
All 3 rural charges Manah (f) Manah (NP) Sam] (ST)
Thunag (T)
16 rural charges & 10 urban charges All the 6 rural charges
Kullu (T) BanJarT) Am(ST) Nmnand(T) Padhar,Mandl,ChachlOt, Karsog (TahSlls) Bahchowkl & Nlhn(Sub-tahsl1s)
(T) TahSIl, (ST) Sub-tahsIl,(MC)Mumclpal CouncIl,(CB)Cantonment Board, (NP) Nagar Panchayat
The followmg calendar was followed III the ~tdte of HImachal Pradesh for houseltstmg operatIOn and populatIOn enumeratIOn of Census 2001
N on-synchronous(Snowbound) Areas:
(a) Househstmg OperatIOn
(b) EnumeratIOn
( c) RevlsIOnal round
7
15-6-2000 to 4-7-2000
11 th Sept, to 30th Sept ,2000
1st October to 5th Oct ,2000

(d) Reference date
General Areas:
(a) Househstmg OperatIOn
(b) EnumeratIOn
(c) Revisional round
(d) Reference date
1st October,2000 (00 00 hrs )
17-4-2000 to 6-5-2000
9th to 28th February,200l
1st to 5th March,200l
1st March, 2001(0000 hrs)
However, enumeratIOn of populatIOn In Kmnaur dlstnct could not be held on the scheduled dates due to the great havoc caused by the flood durmg the months of July-August,2000 The flood affected 3 sub-divisions of of Kmnaur dlstnct resultIng a great loss to the human lIves and loss of property of the government and the people The entrre dIStnCt of Kmnaur remaIned cut off from rest of the State/country The commurucatIOn and transport means were totally dIsrupted due to flood Therefore, conduct of populatIOn enumeratIOn of 2001 Census had to be postponed Now the enumeratIOn m the entne Kmnaur dIstnct wIll be conducted between 12th to 31 st May, 2001 However, the present paper Includes the projected populatlOn of Kmnaur dIstnct for 2001 Census
SpecIal efforts were made for publIc awareness about Census 2001 by usmg varIOUS publIcIty means I e through radIO, Doordarshan, audIO-vIdeo vIsuals, stIckers and posters etc FacIlIty of local cable centers In towns have been used for VIdeo vIsuals Tills exerCIse proved useful m coverage and collectIOn of quahtydata
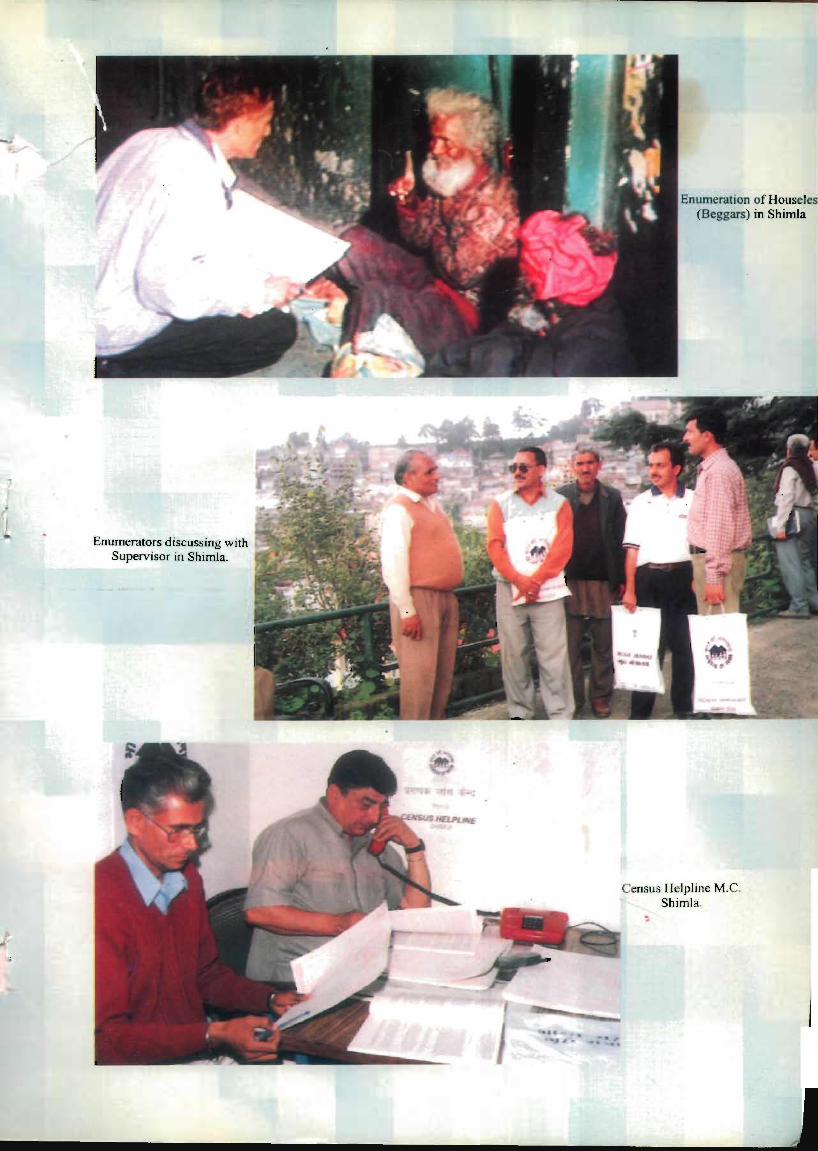
Durmg populatIon enumeratIOn of ShImla MUnICIpal CorporatIOn the State capItal of Htmachal Pradesh, three Helplme Centres were establIshed where the ~taff of the Census DIrectorate was present to provIde clanficatIOns to the enumerators and supervisors on the spot about the census concepts durmg ongOIng enumeratIOn between 11th September to 30th September. 2000 ThIS exerCIse has proved of a great help for fillmg-up the Household Schedules correctly Sh J K Bantrua,IAS, RegIstrar General & Census CommIsSIOner, IndIa also VIsIted the census helplme center m the office of the CommIssloner, MUnICIpal CorporatlOn Shimia where the filled-m household schedules were mspected and RegIstrar General & Census CommISSIoner, India addressed the enumerators and supervIsors present m the helplme center Later on thIS system has been extended and followed durmg the enumeratIOn m the general areas of HImachal Pradesh between 9th February to 28th February, 2001 The Census helplme centers proved to be great help to the enumerators and supervIsors for conduct of enumeratIOn The gathermg of enumerators and supervlsors at these helplme centers helped m pubhc awareness
GUJJars and GaddIS semI-nomads mIgrate from hIgher reaches to plam areas durmg September/October SpeCIal efforts were made to ensure theIr countmg before they left for plam areas and Issued passes mdicatmg therem that they have
8
been counted and should not be counted agam when they are m plam areas dunng February/March, 2001 Such passes were Issued to all households In snowbound area!:> where enumeratIOn was conducted m Septembcr/October,2000
The Census OperatlOn was conducted successfully for WhICh credIt goes to everybody who partICIpated m It partIcularly the people of the <;;tate
9

ANAL YSIS OF PROVISIO~AL POPULATION
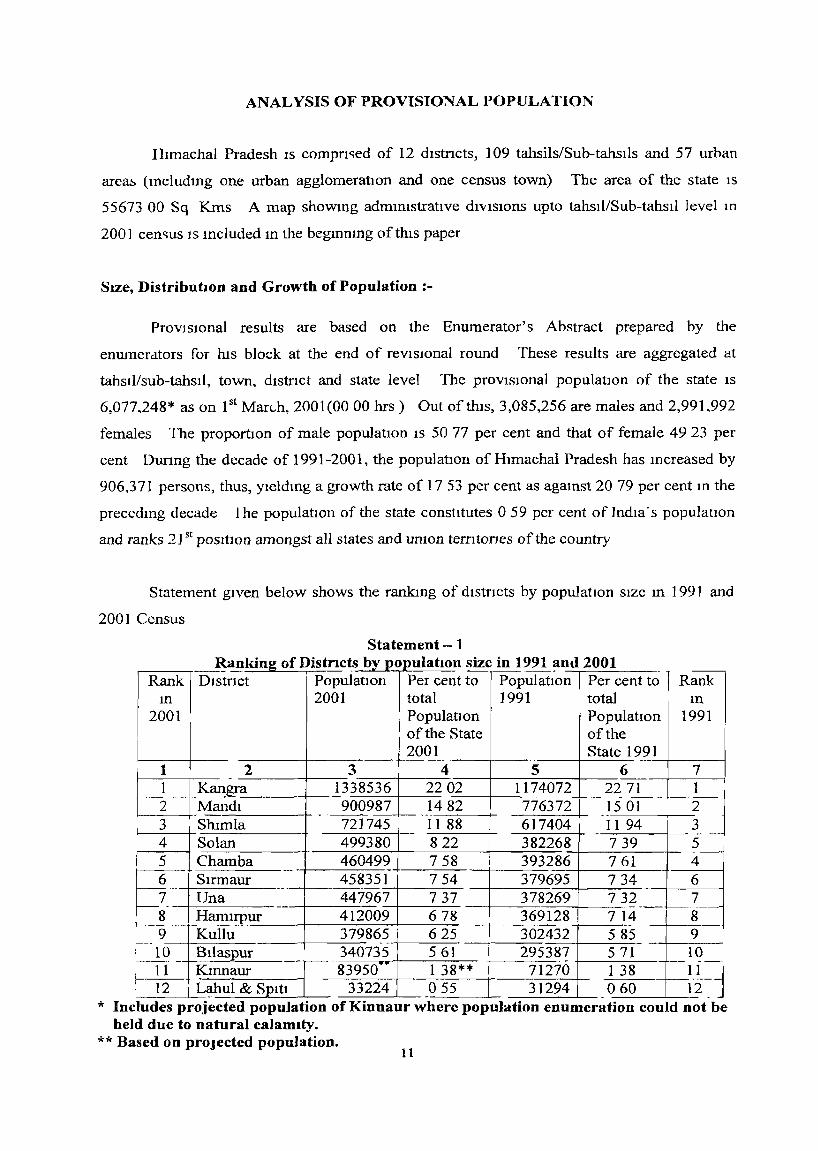
Illmachal Pradesh IS compn<:ed of 12 dIStrIctS, ] 09 tahsils/Sub-tahslls and 57 urban
area~ (mcludmg one urban agglomeratIon and one census town) The area of the state IS
55673 00 Sq Kms A map showmg admmistratlve dIvISIons upto tahsiliSub-tahstl level In
2001 cen<;us IS mcluded m the begmnmg oftrus paper
SIZe, DistributIOn and Growth of Population :-
PrOVISIOnal results are based on the Enumerator's Abstract prepared by the
enumerdtors for rus block at the end of revlslonal round These results are aggregated at
tahSIl/sub-tahsIl, town, dlstnct and state level The provlslOnal populatIOn of the state IS
6,077.248* as on 1st March. 2001(0000 hrs) Out of thIS, 3,085,256 are males and 2,99}.992
females The proportIOn of male populatIon IS 50 77 per cent and that of female 49 23 per
cent Dunng the decade of 1991-2001, the populatIon ofHlmachal Pradesh has mcreased by
906,371 persons, thus, Yleldmg a growth rate of 17 53 per cent as agamst 2079 per cent m the
precedmg decade I he populatIOn of the state constItutes 059 pcr cent of IndIa"s populatIOn
and ranks 21 st pOSItIOn amongst all states and umon terntones of the country
Statement gIven below shows the rankmg of dlstncts by populatIOn SIze III 1991 and
2001 Census
Statement - 1
- -Populat{on 1 Per cent to 1 -
Rank DIstnct PopulatIon Per cent to Rank III 2001 total 1991 total III
Ranking of Districts b 0 ulahon size in 1991 and 2001
2001 PopulatlOn PopuiatlOn 1991
~2 of the State of the 2001 State 1991
3 4 5 6 7
~~ 1338536 2202 1174072 2271 1 -andl 900987 1482 776372 15 01 2
~ - --
lliShun1a 721745 11 88 617404 11 94 3 Solan 499380
- --822 382268 739 5
Chamba 460499 758 393286 761 4 R= Smnaur 458351 754 379695 734 6 --Una 447967 737 378269 732 7 - -
8 Hamlrpur 412009 678 369128 714 8 9 Kullu 379865 625 302432 585 9
r-IO Bllaspur 340735 561 295387 571 10
r----u - 11-Kmnaur 83950 1 38** 71270 1 38 12 j Lahul & SPltl 33224 055 I 31294 060
----12 - - - -. . . * Includes prOjected populatIOn of Kmnaur where popUlation enumeration could not be
held due to natural calamity. ** Based on projected population.
11

Kangra dIstnct ranks first among the dIstncts WIth populatIOn of 1,338,536 persons
accountmg for 22 02 per cent of the total populatIOn of the state In 2001 census About half of
populatIOn IS concentrated m dIStrIct Kangra, Mandl and Shimla The ranks of dlstncts
accordmg to the SIze of populatIOn has not undergone much change durmg 1991-2001 except
• Solan dIstnct whIch has Improved Its pOSItIOn to fourth place ~ agamst fifth plac~ 'W 1991
Census Chamba dIStrIct has moved down to fifth P9s1tIOn In 200 l' agamst the fourth place In
precedmg Census
Table-l of thIs paper gIves the detaIls of dIstrIbutIOn, decadal growth rate, sex ratIO
and densIty of populatIOn for the state and dIStrIctS These trarts of populatIOn are analysed In
succeedmg paragraphs
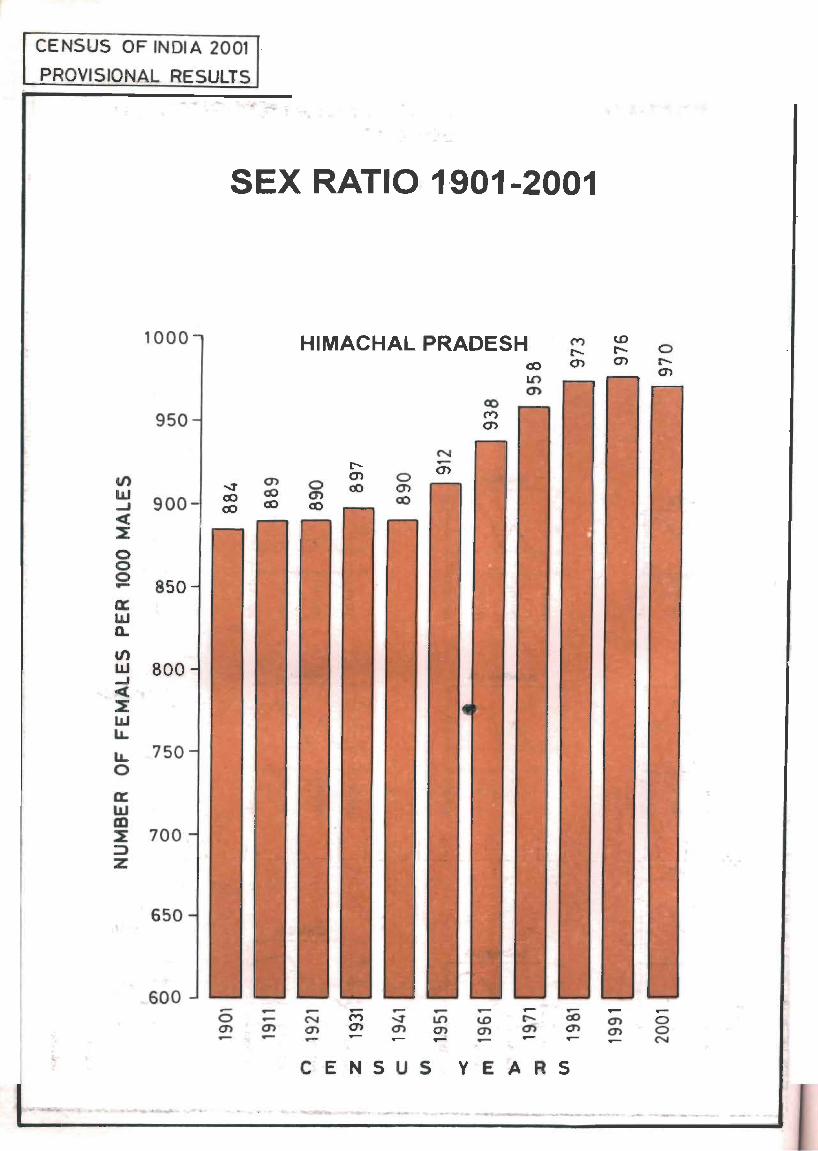
Trend in Sex Ratio :
Sex ratIO IS Important demographIc mdlcator and IS defined as number of females per
1000 males 2001 Census shows sex ratIO of970 females per 1000 males agamst 976 females
In 1991 Census (Table-3) The pOSItIon of sex ratIO In the state In 2001 Census IS
comparatIvely better than the sex ratIO of 933 females In the country The sex ratIO has been
nsmg steadIly smce 1901 when It was 884 females per 1000 males and crossed the mark of
900 females In 1951 Census Afterwards It contmued to fluctuate between 912 m 1951 and
the maXImum value of 976 females m 1991 Census wluch could be termed as an Ideal ratIO m
the state
The pattern of sex ratIo m the dIStncts IS almost the SImIlar as reflected In the state
average except the dIstncts of Lahul & Splti and KInnaur where sex ratIO contmued to declIne
and fluctuate smce 1961 Census due to selective mIgratlon Durmg the perIod of 1901-2001,
the lowest value of sex ratIO of 767 fem~les was recorded In Lahul & SPltI In 1981 Census
whereas Kmnaur(85]) dIStrIct shows the lowest value of sex ratIO In 2001 Census In 1991
Census, there were five dIstncts haVIng sex ratIO above the panty Ime (1000 females per 1000
males) and hIghest sex ratIO has been returned by Harmrpur(1105 females) followed by
Kangra(1024), Una(l017), MandI(1013) and BIlaspur(1002) dIstrIct In remamIng seven
dIStrIcts, the sex ratIO was below the state average figures of 976 females per 1000 males In
1991 Census, the lowest sex ratIo of 817 females per 1000 males has been regIstered In Lahul
& SPltl dlstnct and mamtams thIS rank even m 2001 Census WIth lower value of 804 females
In 2001 Census, Hamlfpur dIStnCt agam retams Its top pOSItIOn and has returned sex ratIO of
the 1102 females per 1000 males In 1991 Census, the sex ratio was below 900 females per
1000 males m four dIstncts VIZ Lahul & Spltl(817), Slrmaur(897), Shlmla(894) and
12

KInndUr~ 856) But m present ccnsu!:) of 200 L Smndur dIstnct has margmally Improved ItS sex
ratIO and has nscn to 901 females per 1000 males and m Solan dIstnct, thIl:> sex ratIO has fallen
from 909 females m 1991 to 853 females In 2001 Census
Statemcnt-2 dS gIven below sho,"s the rankmg of dIstrIcts In terms of sex ratIO In both
ccnsuses of 1991 and 2001
Statement - 2 Ranking of Districts by Sex-ratio
[ Rank In I DIstnct Sex-ratIo (Number of ~ I Rankl
lr=2°101 I ~ 2 females per 1000 males 1991 I
: _ _----tf---_. 20~1 T 19t--t-
r=~ I~::ur . :~~~ L:~~~ =H t=! =l_tJ:d1 -- ~ 1014 I ~ 1013 4=-1
H s- I BII-as-p-ur__ ~~~ -=r -:~~~=L- ; 1 6 Chamba 961' 949 6
f 7 - Kullu _ ---g28 ==t 920 - ~ 7
l_8 SlOnaur _901 ---t- 897 tJ I _9_-l-S_h_lm_Ia ___ -+ __ 8_9_8 __J ___ 89_!_ I ~
~111201 Solan _8_?3__ 909 8 _ Kmnaur* 851 * 856 illI
Lahul & SpIt! 804 817 2 <L--_-'-_______ -'--_
* On the basis of Projected population.
A bove statement reveals that Hrumrpur and Kangra dIStrIcts maIntaIn theIr fIrst
and second ranks m both Censuses of] 991 and 2001 though the value of sex ratIO has
slIghtly declIned dUrIng thIS penod Una dIStnCt has been relegated to 4th pOSItIOn In
2001 Cen<;us agamst the thIrd rank m 1991 and ItS posItlOn IS taken by Mandl dIstnct
m 2001 Census Bllaspur, Chamba and Kullu dIstncts contmue to keep theIr ranks
mtact m both Censuses despitc the fact that sex ratIO has declmed In Bllaspur from
1002 females m 1991 to 992 females III 200 1 There IS a httle Improvement m sex
ratIO III Slrmaur and Shlmla dIStrIctS In 2001 As a result of thIS, their POSItIon has
changed to 8th and 9th III 200 1 Census agaInst 9th and 10th ranks m 1991 Census
respectIvely There lS conSiderable decrease In sex ratIO III Solan(853) dIstrIct m 2001
and It occuples lOth pOSItIon Instead of 8th POSItIon among the dIstncts m 1991 Census
Lahul & SPIt! distflct contmues to be In the tall end of all dlstncts WIth last posItlOn In
both censuses of 1991 and 2001 and IS followed by Kmnaur dIstrIct Map Included III
thIS paper shows varIation In seA ratIO In four ranges whIle diagrams bnng out the
changIng trend In sex raho
13
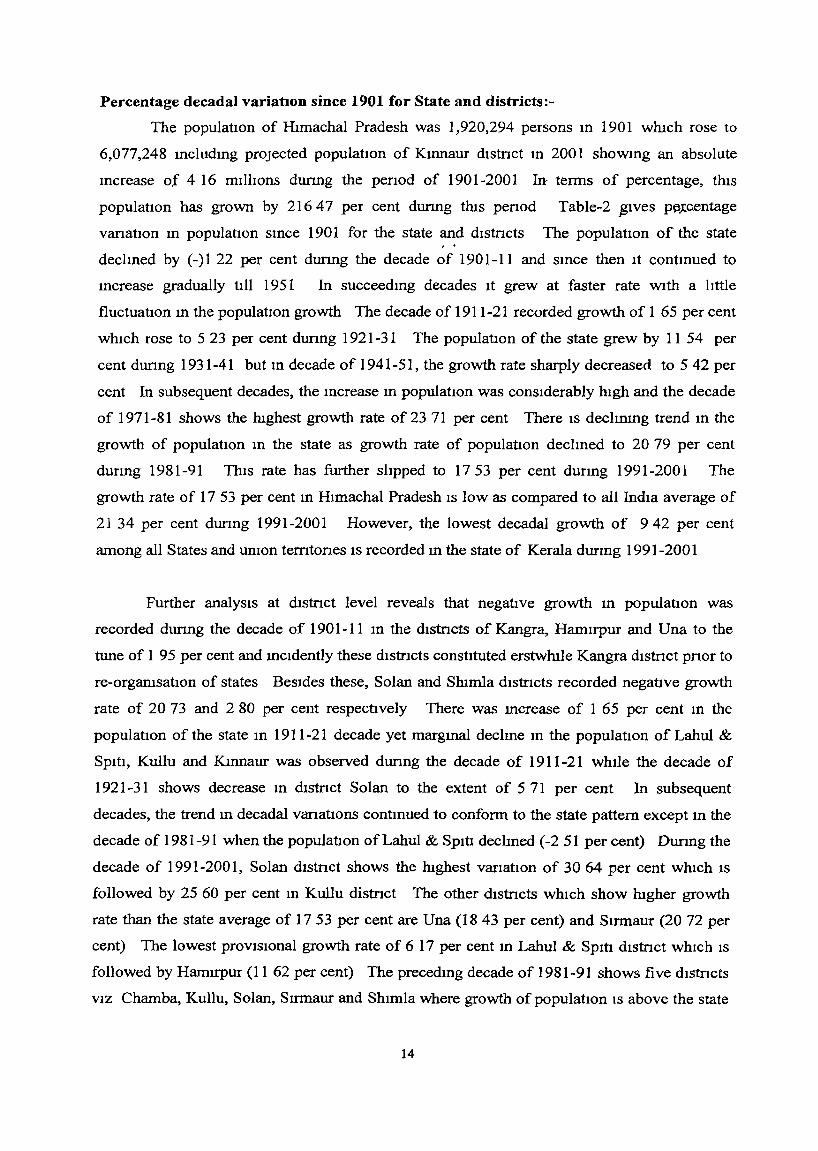
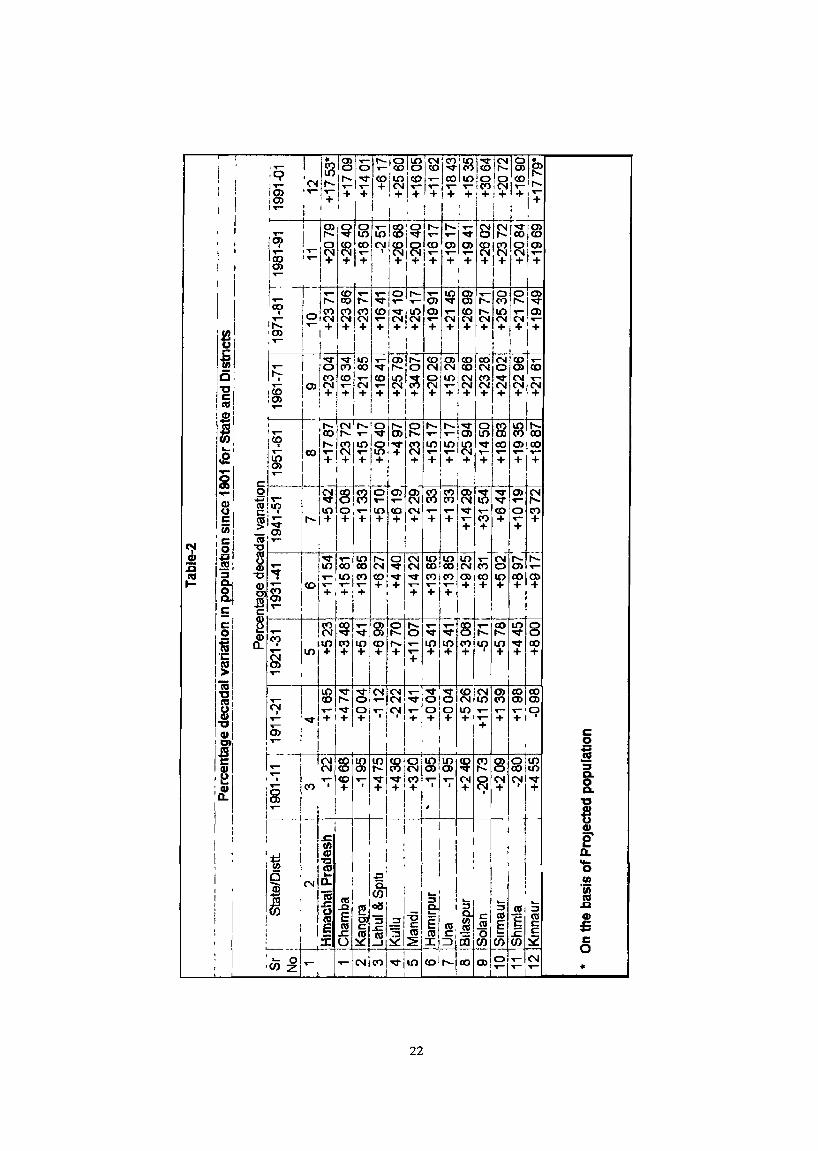
Percentage decadal variatIOn since 1901 for State and districts:-
The populatIon of HImachal Pradesh was 1,920,294 persons m 1901 whIch rose to
6,077,248 mcludmg projected populatIOn of Kmnaur dIStnct m 2001 shoWIng an absolute
mcrease of 4 16 mIllIons dunng the penod of 1901-2001 In terms of percentage, thIS
populatIon has grown by 216 47 per cent dunng thIs penod Table-2 j51ves p~.(c.entage
vanatIOn m populatIOn smce 1901 for the state and dIstncts The populatIOn of the state , .
declIned by (-)1 22 per cent dunng the decade of 1901-11 and smce then It contmued to
Increase gradually tIll 1951 In succeedmg decades It grew at faster rate WIth a httle
fluctuatlon In the populatIOn growth The decade of 1911-21 recorded growth of 1 65 per cent
whIch rose to 5 23 per cent dunng 1921-31 The populatIOn of the state grew by 11 54 per
cent dunng 1931-41 but m decade of 1941-51, the growth rate sharply decreased to 5 42 per
cent In subsequent decades, the mcrease III populatIon was consIderably hIgh and the decade
of 1971-81 shows the hIghest growth rate of 2371 per cent There IS declInmg trend m the
growth of populatIOn m the state as growth rate of populatIOn declIned to 20 79 per cent
durIng 1981-91 ThIS rate has further slIpped to 17 53 per cent durmg 1991-2001 The
growth rate of 17 53 per cent In HImachal Pradesh IS low as compared to all IndIa average of
21 34 per cent dunng 1991-2001 However, the lowest decadal growth of 942 per cent
among all States and umon terntones IS recorded 111 the state of Kerala dunng 1991-2001
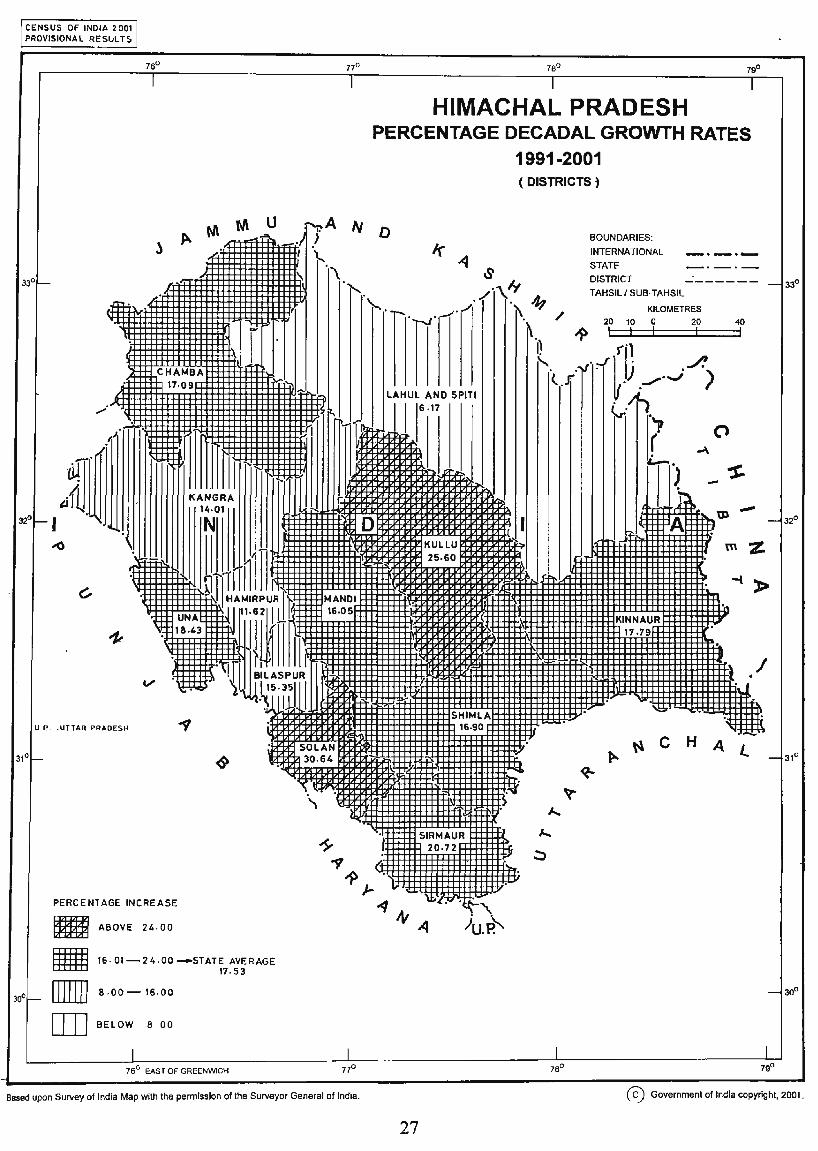
Further analysIs at dIstnct level reveals that negatIve growth m populatIOn was
recorded durmg the decade of 1901-11 III the dIStncts of Kangra, Hamirpur and Una to the
tune of 1 95 per cent and mCIdently these dIStrIctS constItuted erstwhIle Kangra dIStnct pnor to
re-orgamsatIOn of states BeSIdes these, Solan and ShImla dIStrIcts recorded negatIve growth
rate of 2073 and 280 per cent respectIvely There was mcrease of 1 65 per cent m the
populatIon of the state m 1911-21 decade yet margmal declme m the populatIOn of Lahul &
SPItI, KulIu and KInnaur was observed dunng the decade of 1911-21 whIle the decade of
1921-31 shows decrease In dIStrIct Solan to the extent of 5 71 per cent In subsequent
decades, the trend In decadal varIatIOns contmued to conform to the state pattern except 111 the
decade of 1981-91 when the populatIOn of Lahul & SPIt! declmed (-2 51 per cent) Dunng the
decade of 1991-2001, Solan dIStnCt shows the hIghest vanatIOn of 30 64 per cent WhICh IS
followed by 25 60 per cent m KuHu distrIct The other dIstncts whIch show hIgher growth
rate than the state average of 17 53 per cent are Una (18 43 per cent) and Sumaur (20 72 per
cent) The lowest prOVISIOnal growth rate of 6 17 per cent m Lahul & SPItl dIStnCt WhICh IS
followed by Hamrrpur (11 62 per cent) The precedIng decade of 1981-91 shows five dIStrIcts
VIZ Chamba, KuHu, Solan, Sirmaur and ShImla where growth of populatIOn IS above the state
14

average (20 79 per t-t:nt) dgamsl IULlf lhstllcls U1 2001 Cen;:,us Map shoWIng glOl,\-th of
populatlOn dunng 1991-2001 mc1uded III tlus pubhcatlOn bnngs out the change m growth of
populatIOn very clearly and help m understandmg the data m relatIon to space BeSIdes thI,),
curve dIagrams Illustrate the trend m the change of populatlOn m edch dIstnct durmg the
peflod of 1901-2001
Density of Population :
rhe denSIty of populatlOn reflects the ratIo between populatlOn and land The
denSIty of populatlOn m the state IS 109 persons per km2 m 2001 Census agamst 93 persons
per km2 m 1991 Census Thus there IS net addItIon of 16 persons per km2 m the state dunng
the decade of 199] -2001 The denSIty of populatlOn m the state of HImachal Pradesh IS qUIte
low If It IS compared WIth all IndIa average of 324 persons pef km2
The hIghest denSIty of populatIon IS recorded m Harmrpur dlstnct, where 11 IS 369
persons per km2, dUd IS followed b} Bllaspur (292), 1}na(291), Solan(258) and Kangra(231)
dIstncts Mandl dlstnct also shows hIgh concentratlOn of populatlOn havmg 228 persons per
km2 The lowest denSIty of two persons per knl IS recorded m Lahul and SPItl dlstnct though
thIS dIstnct IS bIggest m terms of area 111 the ~tate but dIstnbutIOn of populatIOn IS very sparse
The denSIty of populatIon IS also low m the dIstrIctS of Charnba(7 1) and Kullu(69)
Statement 3 gIven below shows the rankmg of dIstncts m terms of denSIty of
populatIOn m 1 991 and 2001 Censuses
Statement - 3 Rankin of DIstricts b PO_l)ulation density - ~
I Rankm2001 DIStrIct PopulatlOn denSIty
Rank 199 - ~ ~ ~
2001
I
1991
E, ~ ~
I 2 3 4
IHantI!JlUI ,
I ~
1 I 369 I 330 I ~
') Rl1~-1nlIT ?92 253 • ------... - ..... 1:: I ~ ., Una 291 246 3 ~
4 Solan 258 197 5 --5 Kangra 233 205 4 6 Mandl 228 197 6 - -
> 7 Srrmaur , 162 134 7
~ 8 ShImla 141 120 8
~
E±1 Chamba 71 - 60 9 Kullu 69 55 10
-~~-
, Kmnaur 13* 11 11 - I Lahul & SPltl - ~
2_ ~
2 2 12 -* On the basis of Projected population.
15

Hrumrpur, Bl1aspur and Una dIstncts occupy first three posItIons III both the Censuses
Only Solan dIstrIct has Improved ItS rank to fourth pOSItIon by replacmg Kangra dIstnct to
fifth rank whIle m remammg dIStrIctS, there IS no change m the rankmg dunng 1991-2001
Map gIven m thIS publIcatIOn, brmgs out regIOnal vanatIOn III the denSIty of populatIOn III the
state as revealed by data of 200 1 Census
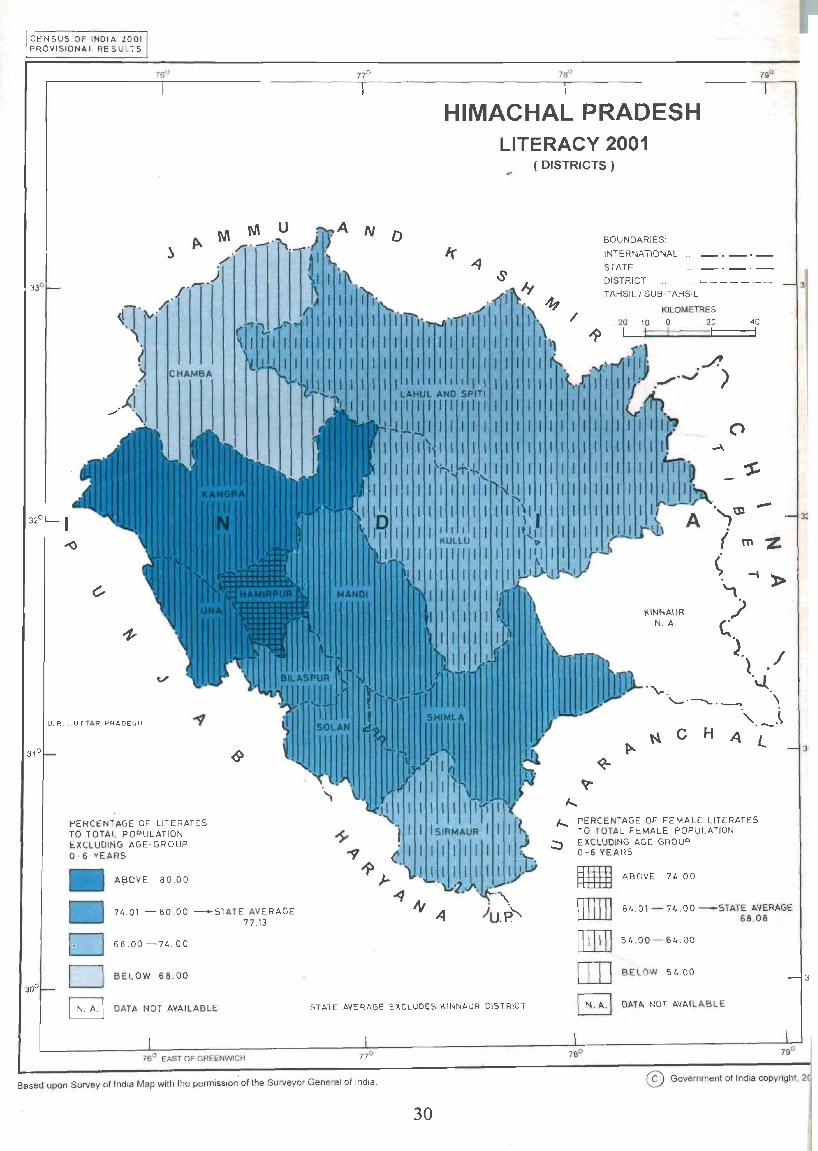
Llteracy'-
Chlldren below 7 years of age have been treated ILlIterate, even If he or she may be
able to read and wnte With understandmg Of the total populatIOn 6,077,248 III the state,
4,029,097 persons (excludmg Kmnaur illstnct) have been recorded hterates III 2001 census
These lIterates are 2,266,103 males and 1,762,994 females The prOVIsIOnal percentage of
lIterates to the total populatIon excludmg the chIldren below 7 years of age comes to 77 13 per
cent m the state The proportIon of lIterates has mcreased from 63 86 per cent m 1991 to
77 13 per cent m 2001 The proportIon of total lIterates m the state IS more than all Indla's
average of 65 38 per cent literates III 2001 Census
Table-4 gIven m tlus publIcatIOn depIcts the data at dIstrIct level of total populatIon,
populatlOn III age-group 0-6 years, number of hterates and percentage of hterates The hIghest
percentage of hterates IS recorded m Hrumrpur dIStnct where thIs proportIOn of lIterates comes
to 83 16 per cent and IS closely followed by Una(81 09) and Kangra(80 68) dIstrIcts The
other dIstncts havmg lIteracy rate above the state average of 77 13 per cent are ShImla(79 68),
BIlaspur(78 80) and Solan(77 16) In remammg five dIStrIcts, the lIteracy rate IS below the
state average whIle the lIteracy rate of Kmnaur IS not yet aVailable The lowest proportIon of
63 73 per cent lIterates IS shown by Chamba dIstnct and IS followed by Smnaur(70 85), Lahul
& SPltl(73 17), KuIlu(73 36) and Mandl(75 86) dIStrIctS
The lIteracy among the male populatIon IS 86 02 per cent of the total males excludmg
the chIldren of 0-6 years age-group III 2001 census The lIteracy among the female populatIon
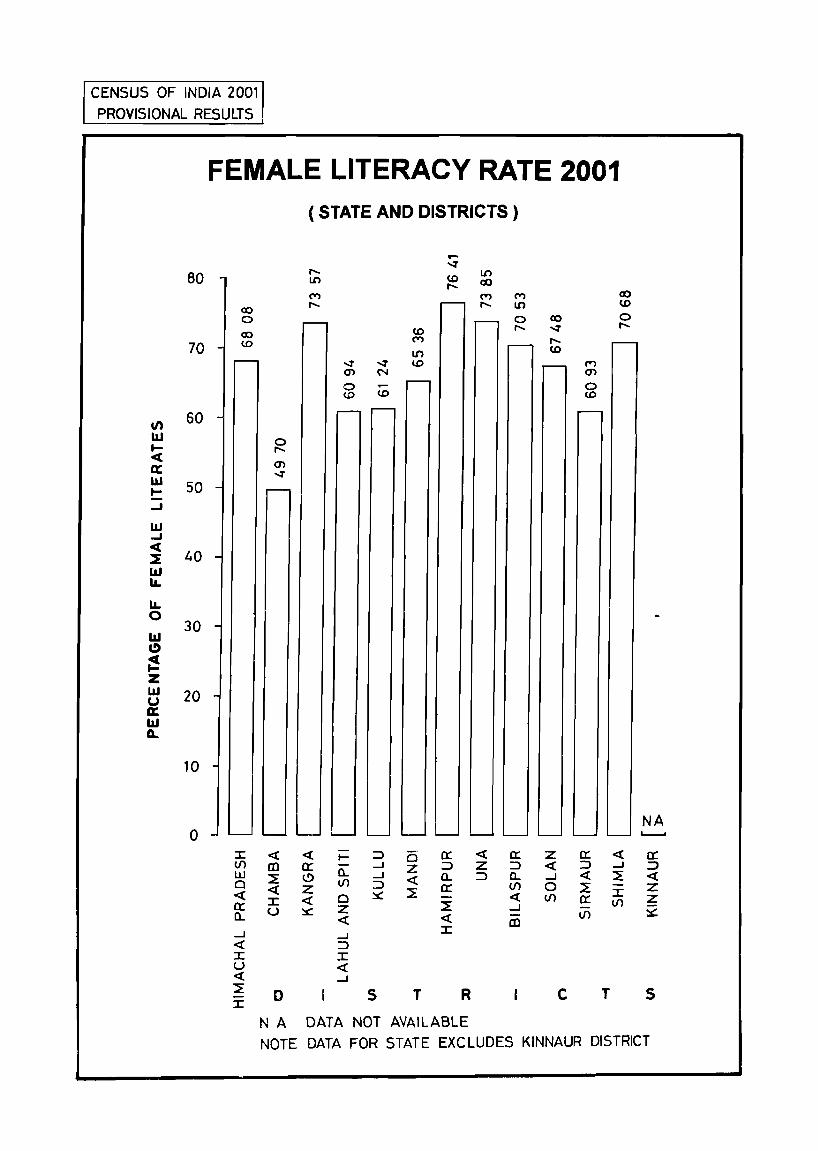
IS stIll behmd and It IS 6808 per cent m the state
The female lIteracy ill dIstnct, Chamba contmues to be at bottom havmg the
49 70 per cent female lIterates whereas m all other dIstrIcts, thIs proportIon IS above 60 00 per
cent The percentage of female lIterates to total females excludmg the age-group of 0-6 years
IS above the state average of 68 08 per cent III Kangra, Hamlrpur, Una, BIlaspur and Shlmla
dIStrIcts The dIstncts WhICh fall below the state average are Chamba, Kullu, Lahul & SPItI, ~
Mandl, Solan and Smnaur
16
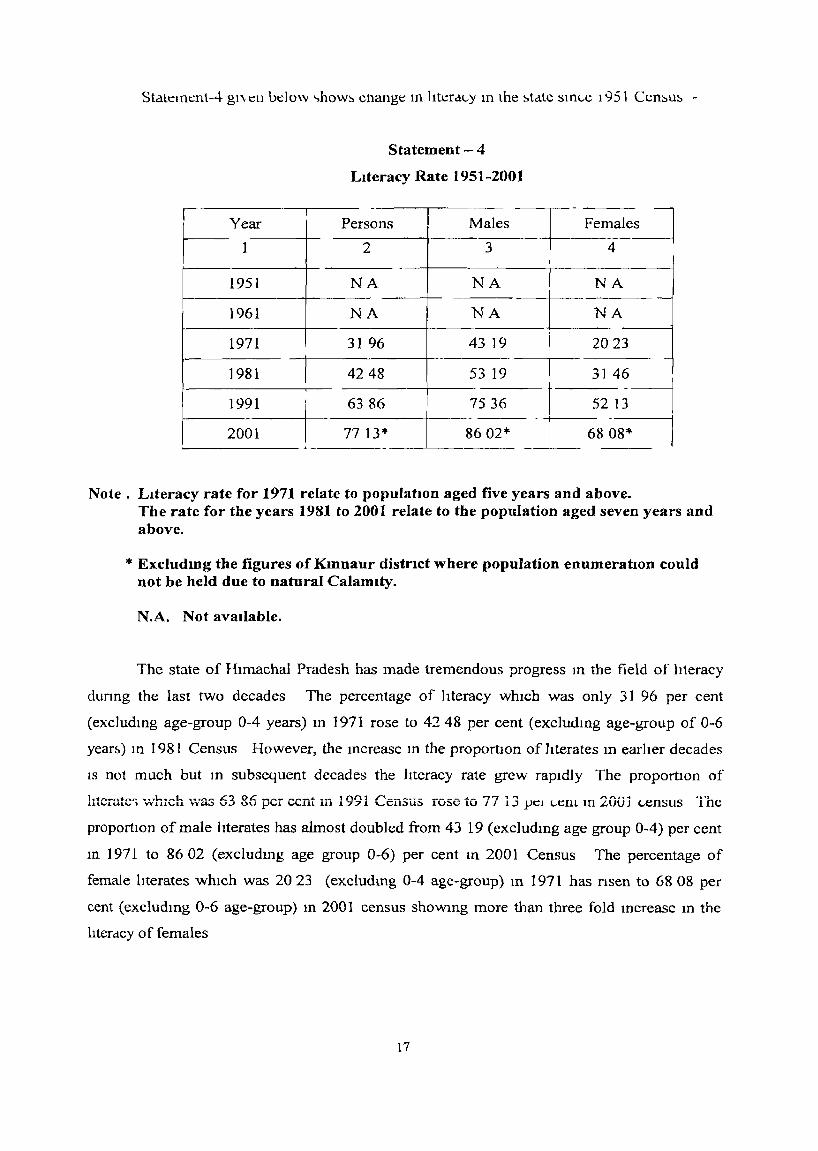
StalelOt:nt-4 &1\ ell bdow "how::. cnange 111 hkrd<..Y m the ::.tate Slnl"C 1 951 Cen::,u~ -
I I
r--Y~ar
1951
1961
1971
1981
1991 I
-I 2001
Statement - 4
LIteracy Rate 1951-2001
-I Persons Males
2 3 -
NA NA
NA NA I 31 96 4319 +_
-4248 53 19
6386 7536 - -
77 13* 8602*
Fen:~l;~ 4
NA -
NA
2023 -
3146
1 52 13 -
6808*
Note. Llteracy rate for 1971 relate to populatIOn aged five years and above. The rate for the years 1981 to 200t relate to the population aged seven years and above.
* Excludmg the figures of Kmnaur district where population enumeratIOn could not be held due to natural Calamity.
N.A. Not avaIlable.
The state of HImachal Pradesh has made tremendous progress In the field of lIteracy
dunng the last two decades The percentage of hteracy WhICh was only 31 96 per cent
(exc]udmg age-group 0-4 years) m 1971 rose to 42 48 per cent (excludmg age-group of 0-6
year~) m 1981 Census However, the mcrease m the proportIOn of lIterates m earher decades
IS not much but In subsequent decades the lIteracy rate grew rapIdly The proportIOn of
lIterate'> V.h1Ch 'vvas 63 &6 pcr ccnt in 1991 Census rose to 77 13 jJt::I l"eIll In 200 j ("ensus The
proportIOn of male lIterates has almost doubled from 43 19 (excludmg age group 0-4) per cent
m 1971 to 8602 (excludmg age group 0-6) per cent In 2001 Census The percentage of
female lIterates whIch was 20 23 (excludmg 0-4 age-group) m 1971 has nsen to 68 08 per
cent (excludmg 0-6 age-group) m 2001 census showmg more than three fold mcrease m the
hterdcy of females
17

Statement-5 gIven below shows the lIteracy rates by sex for the state and dlstncts [or
both censuses of 199] and 2001
Statement - 5
Literacy rate by sex for State and Districts
I ~ Persons
~ ~
LIteracy rate . , SI -
State/DIStrIct Males Females No .
~-
1991 2001 1991 2001 199] 2001
1 2 3 4 5 6 7 8
HImachal Pradesh 63.86 77.13* 75.36 86.02* 52.13 68.08*
1 Chamba 4470 6373 5996 7722 2857 4970
2 Kangra 7057 8068 80 12 88 19 61 39 7357
3 Lahul & SPItl 5682 73 17 71 78 8276 3805 6094
4 Kullu 5482 7336 6964 8455 3853 6124
5 Mandl 6274 7586 7665 8667 4912 6536 ._
6 Hamlrpur 7488 83 16 85 11 9086 6590 7641 I-- ~
7 Una 7091 81 09 81 15 8849 61 OJ 73 85 -
8 Btlaspur 6717 7880 7797 8713 5655 7053
9 Solan 6330 7716 7467 8535 5069 6748
10 Smnaur 5162 7085 6320 7973 3845 6093 I-----~ - -
11 Shlmla 6461 7968 7596 8772 51 75 7068 .
12 Kmnaur 5836 NA 7204 NA 4204 NA .
~ .
Note: LIteracy rate IS the percentage ofhterates to populatIOn aged 7 years and above
* Excludmg Kmnaur dIstrIct N.A. Not avaIlable
The proportIOn of lIterates m the state as well as m dIstncts has mcreased consIderably
durmg the decade 1991-2001 The percentage of total hterates excludmg 0-6 age-group was
oj ~o percent In lYYI WhICh has rIsen to 77 13 percent m 2001 thus resultmg In net Increase III
the proportIOn of lIterates by 13 27 percent durmg 1991-2001 All dIStnctS m the state show
Improvement In lIteracy III 2001 Census over 1991 Census of varymg order However. one
dlstmctIve feature of ltteracy IS that the dIStricts whIch were havmg lower rate of lIteracy In
1991 have shown much more Improvement m the lIteracy m terms of net mcrease In the
proportIOn of lIterates The mcrease of 19 23 percent In the proportIOn of literates In Smnaur
dIstnct IS hIghest where percentage of lIterates has mcreased from 51 62 percent In 1991 to
7085 percent m 2001 The other dIStricts whIch show hIgher mcrease m the proportIOn of
18
lIterates dunng 1991-2001 are Chamba(19 03 per cent), Kullu(18 54 per cent) and Lahul &
SPltl(16 35 per cent)
A~ regards the male hteracy, percentage ofma1e hterates has Increased from 75 36 per
cent 111 1991 to 8602 per cent In 2001 Yleldmg an mcrcase of 10 66 per cent In the proportIOn
of male lIterates Durmg 1991-2001, female lIteracy rate has changed from 52 13 per cent m
1991 to 68 08 per cent In 2001 Census showmg a net Increase of 15 95 per cent In the
proportIOn of female lIterates
19


Table-1
Population distribution, Percentage decaaal growtn rate, 5ex-rano ana Population density
pr II ---- - - 1- -- --POP~I~tlon 20~ - -; -Percentage fSex-ratlo (Number I PopulatIon No StatelDlstt ;---____ -r- i decadal Growth I of females per I density per
I Persons Males J Females : rate I 1000 males) sq km I I I j1981-9S 1991-01 1 1991 I 2001 11991 I 2001
1 I 2 '3, 4 :' 5 '6 7 1~ 8 c-I 9 '1Dp 11 Himachal Pradesh i 6,077,248 '3]85,256 r,991.992 +20791 +T753*1 --9i6 1-970* I 93 10~~
1 Chamba _L 460,499 234,812 225,687 +26401 +17091 949 I 961 {60 71 2 Kangra --- -- -r 1,338,536. 660,224 I 678,312 +1850! +14 011 1~r 1,0271 205! 233 3 'Lahul & SPIn _ -i: _ .23,224 L~~!?j __ 14,81_!_t __ ~~_~ ~ _ _76_17_: __ J~1LL __ _§_9~ L---~-~-- _l_ 4 Kullu 379,865 I 197,035 I 182,830 I +26681 +2560 920 , 928 I 55! 69 5 Mandl _j__ 900,9871 447,271 I 453,716 +20401 +16051 - 1,013T~0141 197 I22S-e Hamlrpur -_ I 412,009 I 195,971 I 216.038 +1617; +11621 1_,105T 1,102 I 330 i 369 7 Una I 447,96u.__]24,299 I 223,668 +19171 +18431 1,017 I 997 i 246! 291
r-a1friaspur---- I 340,735 I 171,074 ~ 169,661 +1941 r +15351 1,002 I 992 I 253 I 292 9 Solan I 499,380 269,4?_:I I 229.929 :,"26021 +30641 ~9_L_!3~311971 258
110lSIrmaur ----=-=r 458,351 I 241,109! 217.242 +23721 +20721 897-4_ 901 134J_162 11 iShlml~_ __ - -r Z~1,74§ 4 ___ 3_80,2~rr=~~_1.§01 I _!_2Q~_:!"1~~~-l_- _j9~_~- 898 _Ir1__2op!!1-12:Kmnaur -I *83950 I 45,353 j 38.597"1 +1969. +1779": 8561 851", 11 j 13*
• On the baSIS of Projected population of Klnnaur District
21
! i !
I I
I :
, I
I
I I
i I I j!1 ! UI
I~I l~[ lEI tn, ,-, .e il "'1
I~I : en I
I~I I ~i Q.J JOJ 1Q.j I c: I !~l ,21
I~I I t'IS,
'>1' 1-It'IS
Ii, I~I I Q) 1
lEI il :~I '0..
I i I
I ' I : I
I I , I J
22
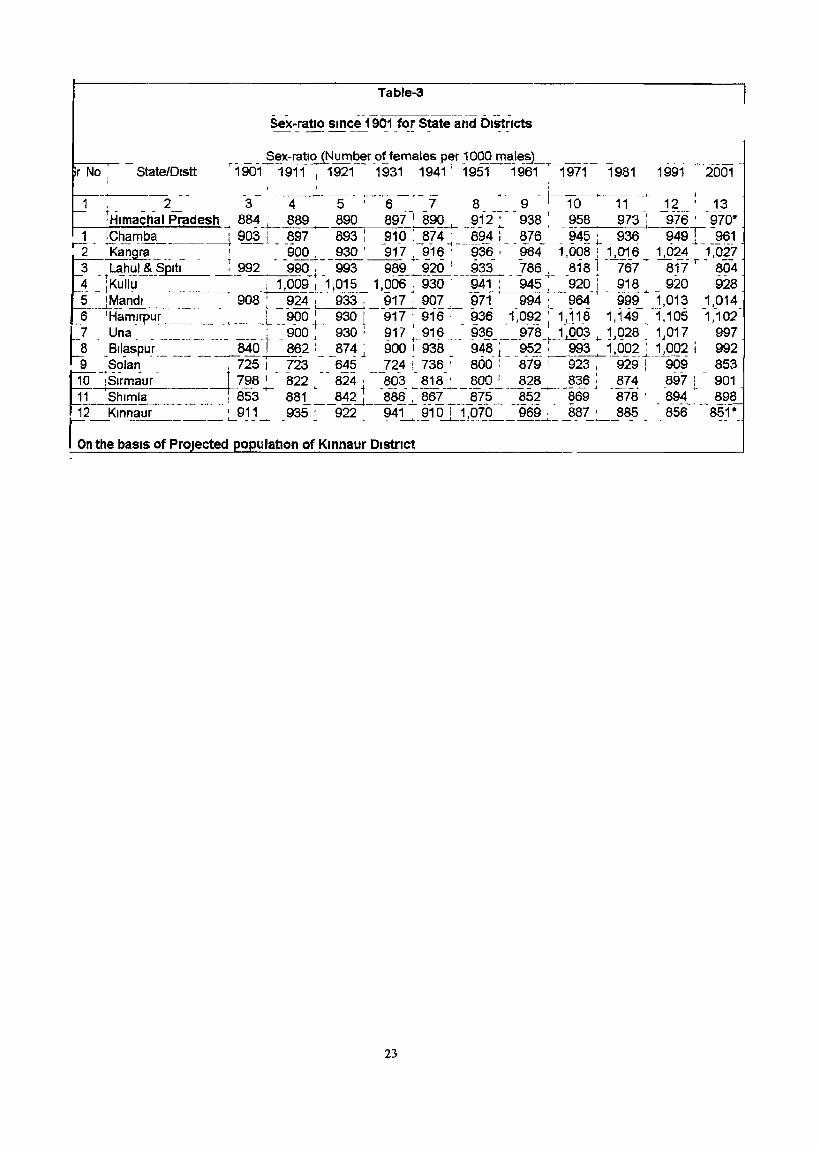
Table-3
Sex-ratio Since -1901 for State arid DiStricts
23

, >. 10 m :s ,..:::i
'-:0 , .... jQ)
ILl ,E ,:3 'Z I I
:c: ,0 I~ 'S a.
&. ':§ '0 I-
_ 0 (f)Z
to
24
iii f ::::II en u: c: o .w .!!! ::::I Q. o D.
1 0' L-a
MAPS AND CHARTS

I CENSUS OF INDIA 2001 l PROVISIONA L RE SlJL T So
33°r-
.ffi-i
d~~.' "'-1 .~
~
U.P. .. UTTAR PRADESH
I
l po.
. .
CHAMBA 17·09
"' -
v
PERCENTAGE INCREASE
ABOVE 24.00
N\ Nt. U
-). I
11 ~
16·01-24.00-STATE AVERAGE 17.53
8 ·00- 16·00
BELOW 8 00
1 76° EAST OF GREENWICH
I 1
HIMACHAL PRADESH PERCENTAGE OECAOAL GROWTH RATES
1991-2001 ( DISTRICTS)
I
f't-A --.. , .1 N D
BOUNDARIES: , \... If INTERNATIONAL _. _._
.q STATE' _. _. _
~ \ 8 DISTRICT J".. ./1" It TAHSIL/SUB-TAHSIL ------- - 33° \.. . r . . -' ./i' '1\ II? / KILOMETRES
MANDl 16.05
SOLAN 1Z!30.64
I
o
"r-J . 20 10 0 20 40
LAHUL AND SPITI
II r· ,7
KULLU 25.60
'f
(
SHIMLA 16.90
~. ~ 11 rl'l
( I
~ 1\
~ ".J~. ../! . ..",.) ", (. . Ji . .....", . ...,J I
(r,.11. 'p
-
(
KINNAUR 17.79
I'"
l . . 1
.jtt H A
--
_ 300
1 I
Based upon Survey of India Map with the permIssIon of the Surveyor General of India. (cD Government of India copyright, 2001.
27


CENSJS 01= 'NOlA 1001 PROV1S ONAl RESULTS
___ ..:...:;.70" ______ .--..,77'_' __
t.J\ M U ;-r.A N 0
18'
HIMACHAL PRADESH POPULATION DENSITY 2001
( DISTRICTS)
BOUNDARIES,
INTFRNA nONAL
SrATI: II ~ ~. 8 DISTRICT It f AHSIL I SUB-TAHSIL
~ " ". T . ··mif~' If ~ ./. ,,~), ,/I'
\ ,z, K:LOIIHRI::.S
HAM8A 71
l ell ~ T 11 LAHUL I..) L,
LI Til KANGRA
233
N
~ UNA ~;;~ 291 ~
MANDl 228
v 1\ • Etl 81LASPUR .. 't:I" • oI<hJ<bl'l,rn 292
UP,. Ui TAR I'RAOfSH
PE RSONS PE R Km2
~ ABOVE 365
• 266 - - 365
am 166-265
' ..
OIIIJJ 65 - 165 - - STATE AVERAGE 109
UTI BElOW 65
76° EAST Of GRUNWlCH
SOLAN I 258
\;I.
'"
D
~ KULLU 69
/ \ ~ ')
~o 20 '0 a
" l'c
<
40
79<J
Based ypon Survey of India Map with the permlsSIO'l of the Surveyor General of Ind:a ® Government of India copyright 20
28


CENS US OF INDIA Z001 PROVISIONAL RE SULT:5
M M U A i',Tf N
30°
l f!a.
~
ICHAMBA 961
..,.,
I K 1021
N
~ ~ II~ '"
lOW",
~ 997 ~
v ;> BILASP j ~ 1992
oJ.
u . p. .... UT TAR PRADESH -1 ~
F
~ \
EMALES PER 1000 MALES
ABOVE 1099
1000 - 1099
900 - 999- STATE AVERAGE 970
BelOW 900
76° EAST OF GREENWICH
-It
' MANDl
SOLAN
'§wl <So
-v ;p~
7~
Based upon SUNey of India Map with the permission of the Surveyor General of India.
0
HIMACHAL PRADESH C;EX RATIO 2001
( DIST~ICTS )
BOUNDARIES:
If AI
INTERNATIONAL ... _. _t 8
STATE ... ., . ... - ---It
DISTRICT ... ... ---- - -TAHSIL f SUB-TAHSIL.
4?
~.~.~~ KILOMETRES
/ 20 10 0 20 40
1 ~
[i} _/! . ../ . ....; ) AHUL AND SPITI
804 r (l
-'
~ ':t. -~~rm-II
KULLU
928 L'
~ -t
I KI NNAUR )Jp i\ i~ , . / .~5~
rn SHIMLA
898 C H ~ tl A L : ~
~ :> J....
J.... .,-, 1,a,,uR
,::,
AlI\t ~ -t~"
® Government of India copyright, 2001.
29
CE N sus OF INOI A ZOOl PROVISIONAL RESUl-:-S
u. Fl ... UTTAR PRADESH
PERCENTAGE OF LITERATES TO TOTAL POPULATION EXCLUDING AGE-GROUP 0-6 yEARS
A!'IOVE 80 .00
71, . 01 - 80.00 --STATE AVERAGE 77.13
N D
HIMACHAL PRADESH LITERACY 2001
( DISTRICTS)
/
BOUNDARIES:
INTERNATIONAL
STATE . ,
DISTRICT '" TAHSIL I SUB-TAHSIL
KILOMETRES o 20
../!
>
40
.,"Gl -I m %
KINNAUR N. A.
c
<
H
" PERCENTAGE OF FEMALE LITERATES TO TOTAL FEMALE POPULATION
.:::;, EXCLUDING AGE-GROUP 0-6 YEARS
ABOVE 74 .00
64 .01 -71, .00 -STATE AVERAGE 68 .08
3
3'
3
D 68.00-74 . 00
D BELOW 68.00
B DATA NOT AVAILABLE STATE AVERAGE EXCLUDES KINNAUR DISTRICT
ITIITIJ 54.00-64 . 00
[]I] BELOW 54 .00
8 DATA NOT AVAILABLE
76° EAST OF GREENWICH '
Based upon Survey of India Map with the permission of the Surveyor General of India . @) Government of India copyright , 2(
30
... 0 0 N
~ U 0 ..J m Z 0 -t-<C I%: W =e :::J Z W
-D. c Ii .J C Z 0 -... O z -
o " c o
'" ~ .-._ ./ ._ .............
/" .......... . . .........
:I: ...J If) .., ...
:r 0 II U « « ::>
'" OJ a: -' a: 0 :r a. N ::E :;:. « 0 a: ...J 0 :;: ..... 0 « ..:
'" ::E .. :>:: u % «
J1 :::r :;;
: : - .... -' : .:> : u « w Ii' iii • ... :r
;; oJ> >! ::;; <5 UJ w !J! UJ :r T :r ... ... l- t-
0 6 IL ... U. 0 ... z 0 0 z 0 z 0
'" UI UJ '" '" w .... :::r '" :::r ::E 0 ~ Cl ... 0 <f 0 « 0 ..: Z u z u Z U Z
31
.... ... ~ ... .... .. " ;:
0 0 .., .., M .. C;
iii z .... .... II " , iii z ... 0 II: Z r£ ....
<Zl :::r :> z r t: ~ C> z i5
: ..J ::;
0 CD
z ... :r
'" Cl u ...
0 ::> u '"
~ ;: z '" Q oJ> UJ
'T z
" z
" ... 0 IX
.:>
'" J
-' ... t-UI :x
I I~ r I
:z: ... ... a. I-o
" ...
... ... a. :x ... ~

CENSUS OF INDIA 2001 PAOVISIOHAL RE SULTS
COMPARATIVE SIZE OF POPULATION 20.01 (STATES I UNION TERRITORIES)
HIMACHAL PRADESH 6077248 UTTARANCHAL 8 '79 562
JAMMU & KASHMIR 10 069917 13782976
OTHERS:
NAGALAND 1988636 0.19'/.
GOA 1343 998 0.13".
ARUNACHAL PRADESH 1 091117 0.11",
PONDICHERRY 973829 0.10".
CHAHDIGARH 900 9\4 0.09",
MIZORAM 891058 0.09'1.
~--TRIPURA ·3191168 0.31", .----- MANIPUR 2 366 634 0.23", ,---MEGHALAVA 2306069 0.22". t~OTHERS 8525415 0.84",
SIKKIM 540493 0.05",
ANDAMAN & NICOBAR ISLANDS 356265 0.03'1.
DADRA & NAGAR HAVELI 220451 0.02",
DAMAN & DIU 158 059 0.02",
LAKSHADWEEP 60 595 0.01'1.
32


AREA IN '000 Km2
~ ~
0 ~ N W .t- U'1 en ....;j 0> 1.0 0 ..... N W .t-
LAHUL AND SPITI 13835 0 0 CHAMBA 6528 0
KINNAUR s:: C/) KANGRA » ~ ::0 -t KULLU ITI :u
SHIMLA 5131 » ~ :u MANDl 3950 -SIRMAUR [ 12825 <
(") SOLAN ! 11936 m
UNA j /1540 en
-c -BILASPUR c=J 1167
N C/) m
HAMIRPUR C=:J 1118 0 -0 - "'T1 C/J » -t a! :u 0 m -t » C/J » -
LAHUL AND SPI TI 033224 Z 0
KINNAUR 083950 0 BILASPUR "tJ
C/) KULLU 0 "'tl "tJ
HAMIRPUR -c 0 C "'tl UNA C r
:u SIRMAUR
r ~
CHAMBA ~ -(")
SOLAN 0 0 Z
-c SHIMLA Z
VI MANDl 900987 N 0
KANGRA 0 ~
0 N W J:'- U'1 en ....;j Q) <D _. ~ .....
:t: 0 ..... N w
TOTAL POPULATION IN '00000

CENSUS OF INDIA 2001
PROVISIONAL RESULTS
POPULATION AND NET DECADAL ACCRETION
1901-2001
co 70 ~
N £"'-.. t'--. 0 to
C"'--
60 £"'-..
HIMACHAL PRADESH c:o 0 ~ -
ex) L/")
0 -0 50 co 0 0 0 CD
.. 0 N ....;t ....;t M
Z ....;t - 0 z 40 M
U)
0 <.0 ....;t
t- ....;t .:( - N I.l') cD ..-...J ....;t m co ::::) <.0 M N
30 ....;t ...:r 1.0 N 0- 0') 0 - M co ...:r ..-0 N lD M Q.
N O'l m N 0 W co N
N ...J N en N 0 c( O'l co O'l N t- 20 - ...- .....-
0 t-
10
0 ~ .....- ..- ..- <r- - - - -0 N M ...:r U") lO £"'-.. co m 0
m en en en en 0') en en m m 0 ....... - - ..- - - N
.. C E NS U 5 y E A R 5
NET DECADAl ACCRETION:

CENSUS OF INOlA ZOOl PROVISIONAL RES UL TS
PERCENTAGE DECADAL POPULATION GROWTH 1901-2001
D 5
30 CHAMBA
"bi] to
10 20
0 10
-10 0 ::i ;::: E
~ '" '" 0 "i "i N ,
(5 ;;; :;; ;;; ~ ~ ~ S!!
MANDl 40 30
J
C3 30 « ~ z 20 °2 ~!:i 10 ~cr ~;! O-V<'------u ~ -10 +-r-r-r-r-r--rT""T--1 D..
;;; :;;~ :DS; ~o
"'''' ~ .. "'0 t II -N , , 0 N::i U:;:D co;; ~ ~~ ~~ ~~
0 E C A 0 E S
T R LAHUL AND SPITI
60
50
40
KANGRA 30
LO
10
0
-10 ::;: ;::: E ;;; ::;: ;::: E
'" '" ~ ~ '" 0 .. "i "i N .. , , (5 ;;; :;; ;;; ;;; u; ;;;
'" ~ !!: ~ ~ ~ ~
HAMIRPUR UNA 30
C T
KULLU 30
to
10
0
-10 :i ;::: ;;; '" ~ "i "j" ,
(5 ;;; :;; ~ ~ !!:
BILASPUR
5
0 0 N , Cii ~
ZO 20
"iZJ 3()
10 10 20 20
0 10 10 0
-10 0 0 -10 - ::;: ;::: s ;;; '" '" 0
"i t "i N , (5 0; :;; ;; ~ ~ S!! ~
SOLAN 40
30
Zo
10
0
-10
-20
-30
::;: ;::: (5
:;: '" '" 0 , ::!: "t ::; ;;;
'" ;;; S!! ~ ~ ~
SIRMAUR
30[2] 20
10
o - ::;: ;:: 6 ;;; '" '" ~ .. "i "i (; 0; :;; .!.
'" ~ ~ S!! ~
30
20
10
0
-10
::;: ;:: 8 - ::;: ;::: (5
~ ;;; '" '" ~ '" '" "i 'I t , N , ;;; ;;; .!. ;;; :;; ;; ;:;
'" ;; ~ ~ ~ ~ ~ ~ ~ ~
SHIMLA KINNAUR 30
20
10
0
-10 ::;: ;:: 6 ::;: ;:: 6
'" '" '" 0 ... '" ... 0 "i .. .. N "i t "i N , , 0 OJ ;;; Ii' 0 Pi ;;; ;;;
S!! ~ ~ ~ ~ S!! -S!! ~
CENSUS OF INOI A 2001
PROVISIONAL RESULTS
SEX RATIO 1·901-2001
1000 HIMACHAL PRADESH
950
N r--.
"" en en UJ
...:r cO co 900 cO
cO ....J 00 « ~
0 0 0
850 -a: UJ Q..
"" UJ ....J
800 « ~ UJ U.
u. 750 0
a: UJ CD ~ 700 ;:)
z
650
600 .- - - - ...- - .-- .....-0 - N M ...:r Ltl w r--. 00 (1) en en 0') en en 0') en en - - .....- - - -
" C E N 5 U 5 y E A R 5
- .--en 0 en 0 - N

CE NSUS OF INDIA 20.01 PROVISIONAL RE SULTS
TRENDS IN SEX RATIO 1901-2001
o
80.0.
70.0.
MANOI
SOLAN 10.00
900
800
700
600.
o:.::::;;;;:tr;;::or::coQ;5 ~~~~~~~~~~2
1000 II: ~::; 9CC,_ __ .._..r
~~ 80.0. <to
~~ 70.0. "-
CENSUS YEARS
s T KANGRA
1100 "'I
10.0.0.
900.
800
70.0
HAMIRPUR
:::L 600 ~I-r",-r"
SIRMAUR 10.00.
900
800
700.
600 ............... - ..... - ..... _ .......... -O-NP)04U"1lD'r--COr.:roO Q'lO"Q'lO\Q'I~r.:roQ'lQ'l<TIO .------- ..... --N
R c
LAHUL AND SPITI 10.0.0. I,
900.
80.0.
70.0
60.0.
SHIMLA
SEX RATIO FOR 1901 CENSUS IS NOT AVAILABLE IN RE SPECT OF KANGRA,KULLU,HAM,RPUR AND UNA DISTRICTS
T S KULLU
BtLASPUR 1100. ,------
1000.
900
80.0
700.

CENSUS OF INDIA 2001
PROVISIONAL RESULTS
85
80
75 V)
UJ l-e( a: 70 UJ I-~
U. 0 65 LLI to!) e( I-Z UJ 60 u a: UJ Q.
55
50 ::r: If) w 0 « a:: a.. ..J « ::r: (,.) ~ ~
::r:
LITERACY RATE 2001 ( STATE AND DISTRICTS)
CD ..-('r)
co co m CD q co 0 0
CD . co co m co ......
w ...... ..-CD co Ln ......
...... CD C"')
-: C"') ('r) ...... ......
N;A . .....___,
~ ~ t- ::J 0 a:: ~ 0:: Z a:: ~ a:: CO 0:: ..J Z :::::> z :::::> ~ ::::> ..J :::::> ~ l!) a.. ..J
~ a.. :::::> a.. ..J ~ ~ 4: If) ::> « z ~ a:: If) 0 ~ z ~
~ « til :J: ::r: 0 ~ a:: z u ::s:: z « _J U')
« m til ~ ::r: _J
::> ::I: « _J
0 5 T R C T 5 N.A . DATA NOT AVAILABLE
NOTE : DATA FOR STATE EXCLUDES KINNAUR DISTRICT
CENSUS OF INDIA 2001
PROVISIONAL RESULTS
FEMALE LITERACY RATE 2001
V) Il.I I-~ a:: Il.I .... ...J
L&J ...J
80
70
60
50
~ 40 L&J IL.
IL. o 1.&.1
" ~ Z W u a:: 1.&.1 a..
30
20
10
0
co o co CD
I (/') w 0 <t 0:: CL _J
<t I U <t :::E I
( STATE AND DISTRICTS)
.... ~ ,..... In
In (0 co ,..... M M M co ,..... ,..... It) (0
0 co 0 (0
,..... ....;r ,..... M ,..... It)
(0
....;r ....;r CD M (T) N en 0
CD 0
W CD
NA ~
<t <t I- ~ 0 a: <t a: Z a: <t a: m 0: _J Z :J Z :J <t :J _J ::> :::E <.!> CL _J <t a.. ~ 0... _J <t :::E <t « z (/') ~ 0: (/') 0 :::E z
<t 0 ~ ~ - <t (/') 0: I Z I :::E (/')
u ~ z _J ~ <t « (J)
If)
_J I
~ I <t _J
0 5 T R C T 5
N A DATA NOT AVAILABLE
NOTE DATA FOR STATE EXC LUDES KINNAUR DISTRICT

...
-< i----+--+--+-+--+--1c---t--t--1-+--+-.. -+--tc---t---t--t---I
41
,
~ .. ~ ~ j
!
j .J .. J 1 ~

43

l 1 5
i I • -
j % < ::
;i o
44.
c:/ :a = ~ .... Q
IQ.l
c: Q
';;j
'" .~ Q U
El> OJ
e;, U ~ '" 0 -< . ~ ..c .~ u
'" ~ I-
Po. ~ ..... IJ
.s:
." J:l.
::;J t\ J:l. 0
'" OJ
" :2 ...; en
I-l!l ._.
'" ...
!; B u
U <IJ e <.)
'(;l;S6 EO . . 5Q :s;
OJ '" 0:: :::-
... £ u
.~ Q
45
'" ;;: 0
t.. !:; u lE 0
OJ
e!' '" .s:
·U
OJ ·u
a.: lE_... i 0
~:g_ r;. (/) " OJ 'r rn cri ~~_'.~t3 'l+ U 1-0
... :::I ~
U ~ en ~ g ::?: rn ol.)c!:
:2 1:i ... OJ :2 Q
lB '"d
'" 0 ~ " > .,0'
;::j u
'" >< S
.. B e OJ
§ Ji
"-0
~( __.~
U • c ..
'" ~ ~ '" '" 1-' ~I ,
C
il
-

Census in snowbound areas launched with enumeration of
Prof. P.K. Dhumal CM, at Shimla.
Sh. lK. Banthia lAS RGI-Census Commissioner India visits Helpline Centre
Shimla.
Sh. A.K. Goswami lAS Chief Secy. H.P. addressing
DCs & other Officers.
of nu'u~<:&c~,_ in Shimla

Sh. K.S. Thakur Dy. Dir. Leading team to Dodrakwar
ShimIa Distt.
Enumeration of a Household at Village Behna (Ani)
Distt. Kullu.
A View of Enumerators Training at Dodra,
Shimla Distt.

Enumerators discussing with Supervisor in Shimla.
... .. . .,. - .. -I - .... ••
Enumeration of Houseles (Beggars) in Shimla
Census Helpline M.e. Shimla_