Embed Size (px)
Citation preview

SEAUPG 2010 ANNUAL CONFERENCE OKLAHOMA CITY, OK
Thursday, December 9, 2010
1
1
Building MEPDG Climate Files
Funded by Mississippi DOT
Research partnersMississippi State UniversityAuburn University, NCATIowa State University, Climate Science Initiative
2
In this presentation….Why is climate input importantBuilding historic climate filesBuilding future climate filesImpact on predicted pavement performance
3
Pavement Design Variables
Time, years
Granular Base Modulus
Subgrade Modulus
TrafficPCC ModulusCTB Modulus
Each load application
2 8640
HMA Modulus
4
Permenant Deformation: Total Rutting in Pavement Layers (inch)
0.00
0.10
0.20
0.30
0.40
0.50
0.60
0.70
0 18 36 54 72 90 108 126 144 162 180 198
Pavement age, month
Max
imum
Rut
ting
(inch
)
SubTotalACSubTotalGBSubTotalSGTotal RuttingTotalRutReliability
Ac Rutting Design Value = 0.25" Predicted
Rutting90% Reliability
Total
HMA
SubgradeAggr. Base
Design Limit
5 6
Climate Database for Mississippi
Only 12 climate files in Mississippi4 sites with 5‐6 years of climate data8 with 8‐10 years of climate dataStarting with mid 1990s
Need to expand time‐scale to 20+yearNeed to increase spatial coverage

SEAUPG 2010 ANNUAL CONFERENCE OKLAHOMA CITY, OK
Thursday, December 9, 2010
2
7
Limitations of this approach
Do 12 weather sites adequately cover variations in climate for Mississippi?Does the time period of 1996 to present adequately cover expected climate?Does this approach to creating a 20‐year (or 40 year) climate database generate a reasonable expectation of future pavement performance?
8
Ames, IA Daily Temperatures
9
August 21stTemperature Distribution
10
January 21stTemperature Distribution
11
Ames Temperature Trends
12
Iowa Averages and Extremes
Decade Avg High Avg Low 100°+ events1970s 58.9 37.4 5931980s 59.6 38.1 20731990s 58.4 38.3 235

SEAUPG 2010 ANNUAL CONFERENCE OKLAHOMA CITY, OK
Thursday, December 9, 2010
3
13
http://www.city‐data.com/city/Ames‐Iowa.html
14
Development ofClimate Data Input Files
for the MEPDG
Build complete 40‐year historic climate filesBuild 40‐year future climate files
15
create a gridded analysis(natural neighbor interpolation)
Step-2
Data from Climate Archive sources
Quality control check of data
Quality control the gridded output
Identify missing data and create values
Create __.hcd file for each CountyStep-3
Step-4 Quality Control the __.hcd file
Step-1
Building better HISTORICAL climate files
16
ASOS/AWOS COOP
Observation Interval Hourly Daily
Air Temperature Hourly functional form Daily high/low observed
Wind Speed Verbatim use N/A
Relative Humidity Verbatim use N/A
Percent Sunshine Verbatim use N/A
Precipitation Hourly functional form Daily precip observed
17
ASOS/AWOS COOP
18

SEAUPG 2010 ANNUAL CONFERENCE OKLAHOMA CITY, OK
Thursday, December 9, 2010
4
19
Analysis Grid
NeighborInterpolation
Grid Node
20
21
Complete Historic Files40‐year files (1970‐2010)For each county in the StateCritical for matching climate with pavement data used for calibration
MEPDG climate1985‐2000 pavement and 1995‐2000 climate (3x)HISTORIC climate
1985‐2000 pavement and 1985‐2000 climate
22
How should future climate files be built?
23
19702010
19802020
19902030
20002040
19702010
19802020
19902030
20002040
Option ‐ 1
Option ‐ 2 24
Monthly Climate “DELTAs” (for 50-year period)
Temperature DELTA = Future Scenario – Contemporary Scenario
Precipitation DELTA = Future Scenario / Contemporary Scenario
Future Scenario
(decade of 2040s)
GLOBAL MODEL35,000 sq-mi patternIncludes: solar radiation & green house gasses changesFrequency: 6 hours over 10 years
REGIONAL MODEL1200 sq-mi patternIncludes: regional geographic features and climate patternsFrequency: 3 minutes
Contemporary Scenario
(decade of 1990s)

SEAUPG 2010 ANNUAL CONFERENCE OKLAHOMA CITY, OK
Thursday, December 9, 2010
5
25 26
27
Temperature Distribution
28
Average Monthly Temperature
29
Average Monthly Precipitation
30
JAN FEB MAR APR MAY JUN JUL AUG SEP OCT NOV DEC
T [C] 1.3 1.5 3.2 2.4 2.7 1.9 2.8 2.0 1.7 1.9 2.0 1.4
P [%] -21 -13 40 14 39 13 -17 17 68 -20 37 -11
50-year DELTA’s
1970-2010Historic Climate
2010-2050Virtual Climate
DELTA( per month)

SEAUPG 2010 ANNUAL CONFERENCE OKLAHOMA CITY, OK
Thursday, December 9, 2010
6
31
40-year Future Climate FilesFor each climate region in the StateCritical for predicting pavement performance
MEPDG climate2010-2030 pavement design and 1995-2000 climate (4x)
HISTORIC climate2010-2030 pavement design and 2010-2030 virtual climate
Complete Future Files
32
What is the impact of more accurate climate files?
4.5‐in HMA, AC‐303.0‐in AC perm base12‐in A‐2‐4 base
8‐in lime stab subgrade
A‐6 subgrade
9.3‐in JPCP20 ft joint spacingtied PCC shoulder5.7‐in lime stab baseA‐2‐4 subgrade
12.5‐in HMAAC‐30
A‐6 subgrade
33 34
Faulting (M‐H)
‐0.01‐0.005
00.0050.01
0.0150.02
0.0250.03
0.0350.04
0.0450.05
1 2 3 4 5 6 7 8 9 10
Zones
Faul
ting
(in)
Faulting (H‐V)
‐0.01‐0.0051E‐170.0050.01
0.0150.02
0.0250.03
0.0350.04
0.0450.05
1 2 3 4 5 6 7 8 9 10
Zones
Faul
ting
(in)
9.3‐in JPCP
35
Rutting (M‐H)
‐0.05
0
0.05
0.1
0.15
0.2
0.25
1 2 3 4 5 6 7 8 9 10
Zones
Rutt
ing
(in)
Rutting (H‐V)
M‐V Zone(1‐10),
‐0.05
0
0.05
0.1
0.15
0.2
0.25
1 2 3 4 5 6 7 8 9 10
Zones
Rutt
ing
(in)
12.5‐in HMA
36
Rutting (M‐H)
‐0.05
0
0.05
0.1
0.15
0.2
0.25
1 2 3 4 5 6 7 8 9 10
Zones
Rutt
ing
(in)
Rutting (H‐V)
M‐V Zone(1‐10),
‐0.05
0
0.05
0.1
0.15
0.2
0.25
1 2 3 4 5 6 7 8 9 10
Zones
Rutt
ing
(in)
4.5‐in HMA
SEAUPG 2010 ANNUAL CONFERENCE OKLAHOMA CITY, OK
Thursday, December 9, 2010
7
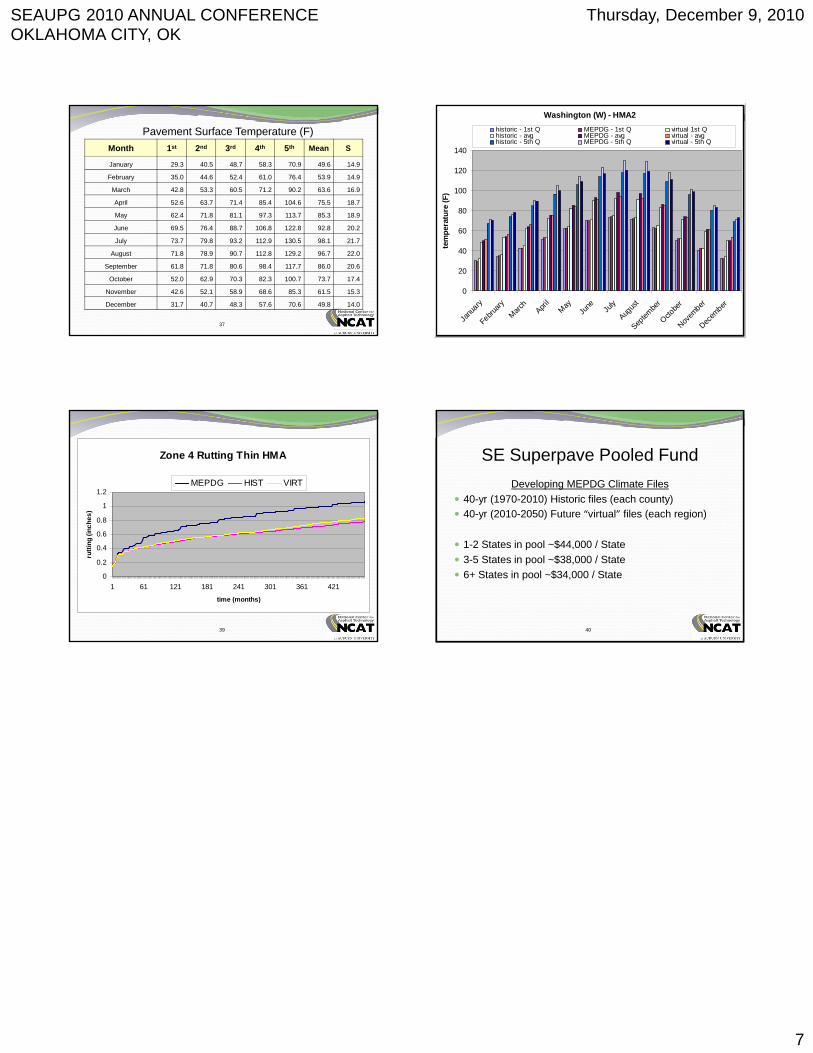
37
Month 1st 2nd 3rd 4th 5th Mean S
January 29.3 40.5 48.7 58.3 70.9 49.6 14.9
February 35.0 44.6 52.4 61.0 76.4 53.9 14.9
March 42.8 53.3 60.5 71.2 90.2 63.6 16.9
April 52.6 63.7 71.4 85.4 104.6 75.5 18.7
May 62.4 71.8 81.1 97.3 113.7 85.3 18.9
June 69.5 76.4 88.7 106.8 122.8 92.8 20.2
July 73.7 79.8 93.2 112.9 130.5 98.1 21.7
August 71.8 78.9 90.7 112.8 129.2 96.7 22.0
September 61.8 71.8 80.6 98.4 117.7 86.0 20.6
October 52.0 62.9 70.3 82.3 100.7 73.7 17.4
November 42.6 52.1 58.9 68.6 85.3 61.5 15.3
December 31.7 40.7 48.3 57.6 70.6 49.8 14.0
Pavement Surface Temperature (F)
38
Washington (W) - HMA2
0
20
40
60
80
100
120
140
Janu
ary
February
March
April
MayJu
ne July
Augus
t
Septem
ber
Octobe
r
Novem
ber
Decem
ber
tem
pera
ture
(F)
historic - 1st Q MEPDG - 1st Q virtual 1st Qhistoric - avg MEPDG - avg virtual - avghistoric - 5th Q MEPDG - 5th Q virtual - 5th Q
39
Zone 4 Rutting Thin HMA
0
0.2
0.4
0.6
0.8
1
1.2
1 61 121 181 241 301 361 421
time (months)
rutti
ng (i
nche
s)
MEPDG HIST VIRT
40
SE Superpave Pooled FundDeveloping MEPDG Climate Files
40-yr (1970-2010) Historic files (each county)40-yr (2010-2050) Future “virtual” files (each region)
1-2 States in pool ~$44,000 / State3-5 States in pool ~$38,000 / State6+ States in pool ~$34,000 / State