Embed Size (px)
Citation preview
B U I L D I N G G R O W T H B Y D E S I G N
R E A L T Y I N C O M E
2 0 2 0 A N N U A L R E P O R T

2 COMPANY PERFORMANCE
4 LETTER TO SHAREHOLDERS
10 HISTORICAL FINANCIAL PERFORMANCE
12 REAL ESTATE PORTFOLIO
16 DISCIPLINED INVESTMENT PROCESS
18 CONSERVATIVE CAPITAL STRUCTURE
20 DEPENDABLE MONTHLY DIVIDENDS
22 SELECT FINANCIAL DATA
29 COMPANY INFORMATION
TA B L E
O F
C O N T E N T S
A B O U T
R E A LT Y
I N C O M E
Realty Income, The Monthly Dividend Company®, is an S&P 500 company dedicated to providing stockholders with dependable monthly income. The company is structured as a REIT, and its monthly dividends are supported by the cash flow from over 6,500 real estate properties owned under long-term lease agreements with commercial clients.
A B O U T
T H E
C O V E R
The cubes on the cover, none of which are the same, symbolize our commitment to diversity, equality and inclusion (DE&I), a dynamic corporate culture that encourages team members to think outside the box, and a systemic approach to building company growth by design.
(1)AS OF 12/31/20
1
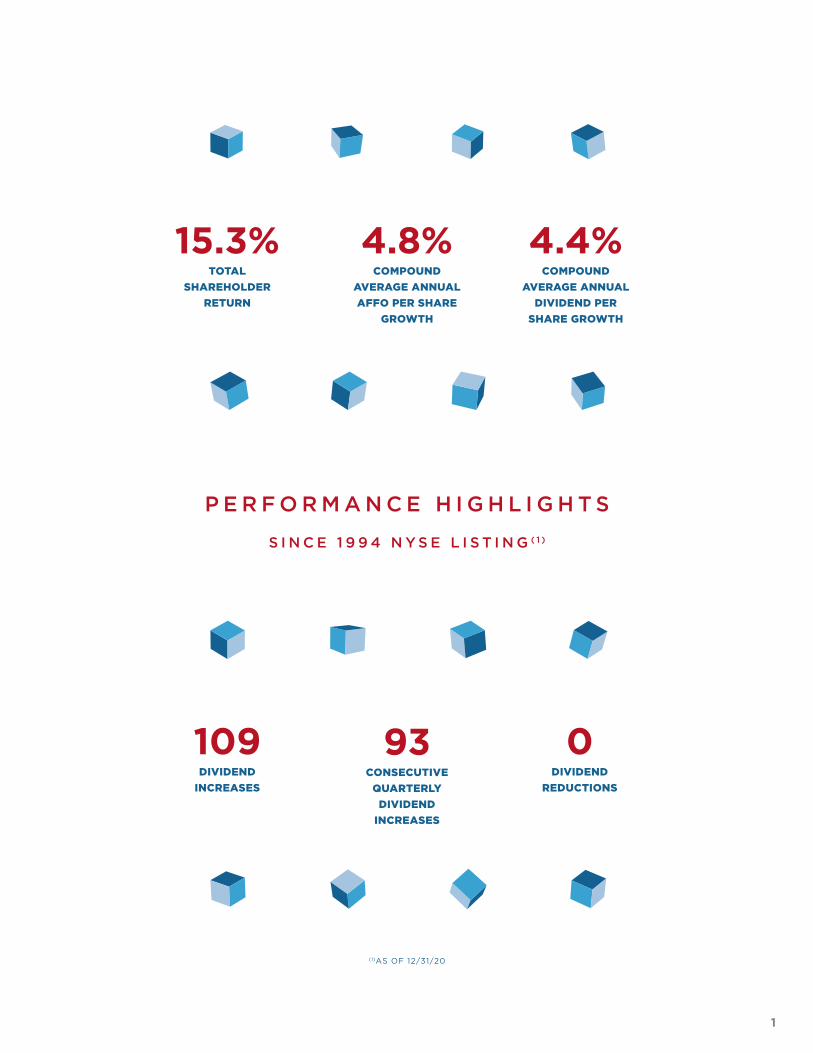
P E R F O R M A N C E H I G H L I G H T S
S I N C E 1 9 9 4 N Y S E L I S T I N G ( 1 )
15.3% TOTAL
SHAREHOLDER RETURN
4.8% COMPOUND
AVERAGE ANNUAL AFFO PER SHARE
GROWTH
4.4% COMPOUND
AVERAGE ANNUAL DIVIDEND PER
SHARE GROWTH
109 DIVIDEND
INCREASES
93 CONSECUTIVE
QUARTERLY DIVIDEND
INCREASES
0 DIVIDEND
REDUCTIONS
$2.31 BILLION
INVESTMENT VOLUME
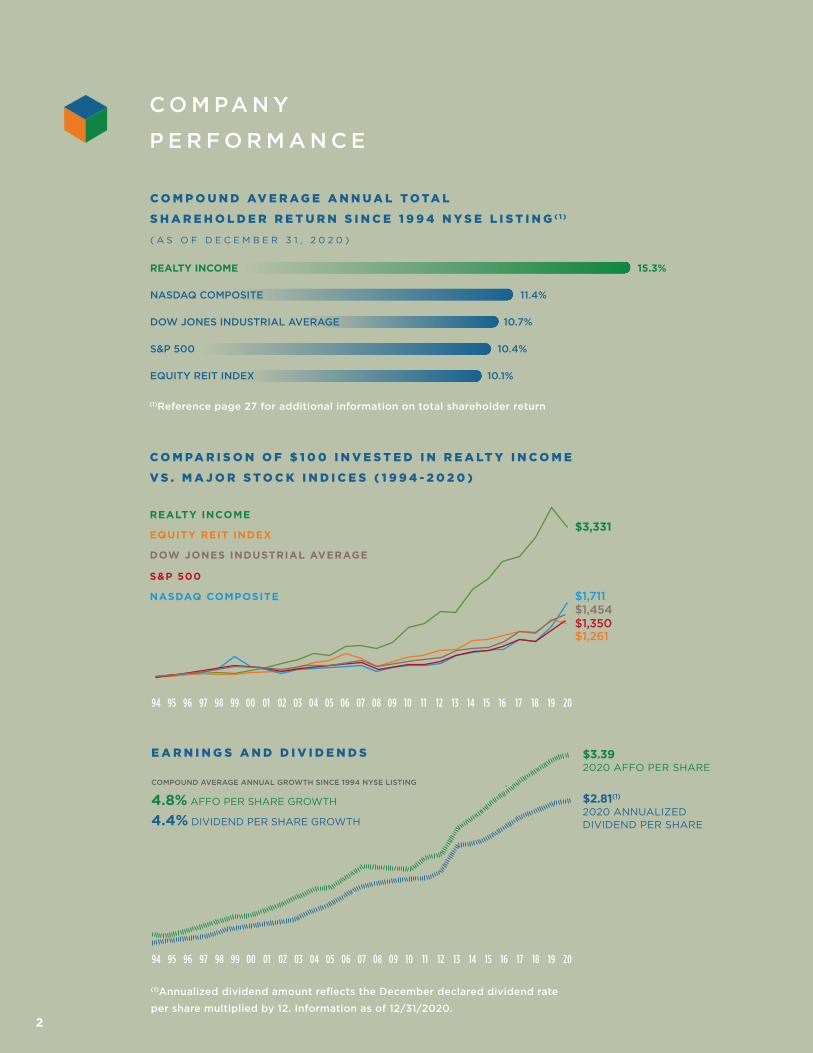
C O M P O U N D AV E R A G E A N N U A L T O TA L
S H A R E H O L D E R R E T U R N S I N C E 1 9 9 4 N Y S E L I S T I N G ( 1 )
( A S O F D E C E M B E R 3 1 , 2 0 2 0 )
REALTYINCOME 15.3%
NASDAQ COMPOSITE 11.4%
DOW JONES INDUSTRIAL AVERAGE 10.7%
S&P 500 10.4%
EQUITY REIT INDEX 10.1%
15.3%
C O M PA N Y
P E R F O R M A N C E
2
C O M PA R I S O N O F $ 1 0 0 I N V E S T E D I N R E A LT Y I N C O M E
V S . M A J O R S T O C K I N D I C E S ( 1 9 9 4 - 2 0 2 0 )
REALTYINCOME
EQUITYREITINDEX
DOWJONESINDUSTRIALAVERAGE
S&P500
NASDAQCOMPOSITE
$3,331
$1,350$1,261
$1,454$1,711
94 95 96 97 98 99 00 01 02 03 04 05 06 07 08 09 10 11 12 13 14 15 16 17 18 19 20
E A R N I N G S A N D D I V I D E N D S $3.392020 AFFO PER SHARE
$2.81(1)
2020 ANNUALIZED DIVIDEND PER SHARE
94 95 96 97 98 99 00 01 02 03 04 05 06 07 08 09 10 11 12 13 14 15 16 17 18 19
(1)Annualized dividend amount reflects the December declared dividend rate
per share multiplied by 12. Information as of 12/31/2020.
20
COMPOUND AVERAGE ANNUAL GROWTH SINCE 1994 NYSE LISTING
4.8%AFFO PER SHARE GROWTH
4.4%DIVIDEND PER SHARE GROWTH
(1)Reference page 27 for additional information on total shareholder return
$2.31 BILLION
INVESTMENT VOLUME
33
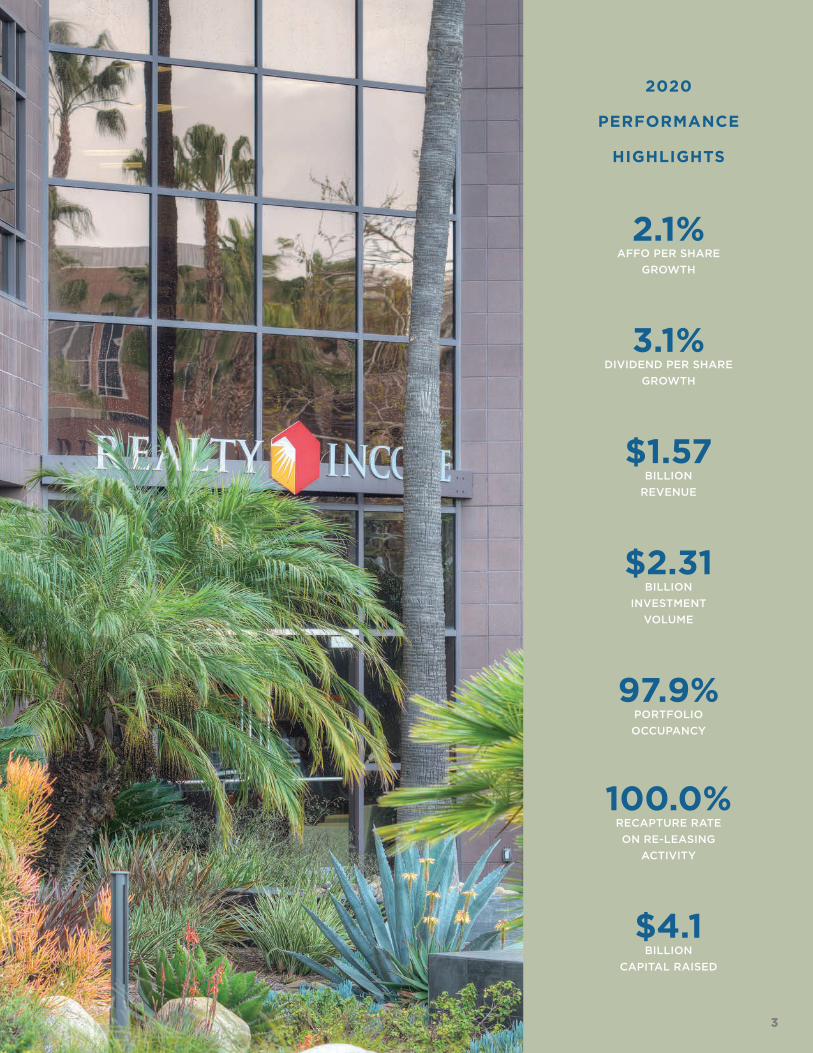
2020
PERFORMANCE
HIGHLIGHTS
2.1% AFFO PER SHARE
GROWTH
3.1% DIVIDEND PER SHARE
GROWTH
$1.57 BILLION
REVENUE
$2.31 BILLION
INVESTMENT VOLUME
97.9% PORTFOLIO OCCUPANCY
100.0% RECAPTURE RATE ON RE-LEASING
ACTIVITY
$4.1 BILLION
CAPITAL RAISED

“As I reflect on 2020,
it is clear our success
would not have been
possible without our
many partnerships.
We Are One Team.”
4
SUMITROY, PRESIDENT & CHIEF EXECUTIVE OFFICER

I want to share how deeply I appreciate our
team’s continued commitment to delivering
and advancing our company’s objectives.
My colleagues truly represent and embody
the great values that have driven our
company’s success. The depth and breadth
of our talented team members remain key
competitive advantages which were further
demonstrated during the past year. Our
company, communities, country, and world
faced a challenging and unprecedented
environment over the last year. Now, as in
the past and future, we embrace adversity
for the opportunities it presents and the
lessons we learn.
Iamproudoftheresiliencyofourteam, whose dedication to our shared purpose,
mission, vision, and values continue to drive
our business forward through the persistent
remote-work environment.
Iamcommittedtotheresiliencyofouroverallrealestateportfolio, which ended
the year with portfolio occupancy of 97.9%,
demonstrating the stability of our operations
amid macroeconomic volatility.
Iaminspiredbytheresiliencyofourbusiness, which maintained a strong financial
position and delivered AFFO per share growth
of 2.1% since last year, reflecting the strength
of our clients and partnerships.
We remain focused on addressing the
hardships faced by many and are proud,
committed and inspired by our resiliency
and determination to building growth
by design together with our people,
clients, shareholders, and the communities
we serve.
As I reflect on 2020, it is clear our success
would not have been possible without our
many partnerships. We Are One Team. We
seek to partner with our stakeholders to
create shared value through diligent execution
of our company’s strategy, constant focus
on improving our company’s risk profile,
and dedication to being a responsible
corporate citizen. We are committed to
promoting the following values:
Dotherightthing, because how we act
is as important as what we accomplish.
Takeownership, because our clients’ success
is our success.
Empowereachother, so everyone will be
inspired to give their best every day.
Celebratedifferences, because diversity,
equality, and inclusion make us stronger.
Givemorethanwetake, in our community
and the environment.
D E A R F E L L O W
S H A R E H O L D E R S ,
5

6
We remain committed to corporate
responsibility today and for our future.
During 2020, we continued to advance our
environmental, social, and governance (ESG)
initiatives. Notably, we expanded our Diversity,
Equality and Inclusion (DE&I) program to
include a formal DE&I Policy Statement,
which has been woven into the fabric of
our culture through ongoing training and
development, leader-led conversations, and
active listening. We continued our annual
financial contribution to San Diego Habitat
for Humanity, shared our organizational
statement supporting racial and social
equality, and implemented a prompt
response to COVID-19 to benefit and
protect our many stakeholders.
Our commitment to environmental
responsibility remains steadfast. Alongside
this report, we are proud to issue our
inaugural Sustainability Report which
details our team’s dedicated efforts and
progress on this important journey. Our
Sustainability Report can be found in our
website’s corporate responsibility section,
and I encourage all stakeholders to read
the Sustainability Report to understand
the significant emphasis we place on these
initiatives. While our dedicated Sustainability
Department drives many of these efforts,
we believe ESG considerations permeate
throughout the organization at every level,
including through active oversight by our
Board of Directors, and I remain focused,
dedicated and driven to continue integrating
these values throughout our One Team in
Realty Income and all those we serve.
Earlier this year, it was my pleasure to
welcome Christie Kelly to our management
team as Executive Vice President, Chief
Financial Officer and Treasurer. Christie
joined our Board of Directors in 2019, served
as a member of our Audit Committee, and
has been a valuable contributor. Christie
brings significant finance, real estate, and
international business experience, and I look
forward to continuing to partner with
Christie to advance our company’s
strategies and objectives.
Additionally, in February 2021 we welcomed
Michelle Bushore as Executive Vice President,
Chief Legal Officer, General Counsel and
Secretary. Michelle joins our leadership team
with extensive legal, corporate governance,
transactional and risk management experience.
Mike Pfeiffer will remain serving and leading
our company through June 2021 as Chief
Administrative Officer while assisting Christie
and Michelle through their transition until
his retirement.
Mike first joined Realty Income in 1990, played
a pivotal role during the company’s public
listing in 1994, and his contributions have
been instrumental to our growth and success.
As the company’s longest tenured executive,
Mike has been an invaluable leader within our
Realty Income community for all stakeholders
and a trusted partner to me. Words cannot
fully reflect on Mike’s positive impact on all
of us, as his impact on our company is part
of who we are. Please join me in wishing
Mike only the best during his well-deserved
retirement.
OUR2020RESULTS
Our disciplined approach to managing the
business continued throughout 2020. During
the year, we grew AFFO per share, or the
cash earnings available to pay dividends
to our shareholders, by 2.1% to $3.39. This
growth allowed us to increase the dividend
by 3.1% as compared to 2019. The continued
strength of our operations enabled us
to increase the dividend while achieving
an AFFO payout ratio of 82.4%, which we
believe provided a comfortable margin of
safety for our shareholders. While our total
shareholder return during 2020 was negative
11.6% assuming reinvestment of dividends,
we like to remind our shareholders that the
company’s stock price does not always move
commensurate with our operating or financial
performance, as external, macroeconomic,
and other factors can impact the company’s
stock price. We seek to deliver favorable
long-term risk-adjusted returns for our
shareholders and, as of year-end, we had
delivered a compound average annual total
shareholder return since our public listing in
1994 of 15.3%. At Realty Income, the dividend
remains our strategic and operational lodestar,
and in January of 2020, we were proud to be
added to the S&P 500 Dividend Aristocrats®
index for having increased the dividend every
year for the past 25 consecutive years. As of
this writing, we are one of only three REITs
and 65 companies in this exclusive index.
During 2020, we invested over $2.3 billion
in high-quality real estate, acquiring less
than 4% of the $63.6 billion in potential real
estate transactions sourced and reviewed.
Total investments in the U.K. during 2020
were approximately $921 million, which
continues to validate our view that the
international platform significantly expands
our addressable market for growth. Our
investment strategy continues to focus on
partnering with clients that are high-quality
operators in resilient industries, and we are
pleased that the majority of our investment
volume during 2020 included properties
leased to operators in the grocery, home
improvement, and general merchandise
industries. In addition to our high occupancy
levels of 97.9%, we achieved a 100% rent
recapture rate on re-leasing activity during
the year. Since our public listing in 1994,
year-end occupancy has never been below
96% and, since 1996, we have achieved a rent
recapture rate of over 100% on re-leasing
activity involving over 3,500 leases.
Through turbulent market conditions in
2020, we maintained a strong financial
position and remain committed to being
one of only a handful of REITs with at least
two credit ratings of A3/A- or better by the
major rating agencies. We established a $1.0
billion commercial paper program during the
year, which further strengthens our financial
position by providing additional access to
low-cost debt financing, and we completed
our debut public issuance of Sterling-
denominated unsecured notes. In 2020,
we raised approximately $1.9 billion of
equity capital and $2.2 billion of long-term
fixed-rate debt, achieving record-low coupon
rates for the respective tenors in the REIT
7

8
sector for the 5-year and 12-year unsecured
notes we issued in December 2020. We
believe we remain well-positioned for 2021
with a conservative capital structure and
strong liquidity, ending the year with Net
Debt-to-Adjusted EBITDAre of 5.3x, full
availability on our $3.0 billion multi-currency
revolving credit facility, and no outstanding
balance under our $1.0 billion commercial
paper program.
COVID-19
We have prioritized the health and safety of
our team members and community through
numerous efforts during the COVID-19
pandemic, including implementing a remote-
work environment, utilizing technology
for communication and collaboration, and
allocating resources to support the wellbeing
of our team. While our focus remains forward-
looking as we seek to leverage our position of
strength for continued growth, it is important
to reflect on and learn from challenging
circumstances like the COVID-19 pandemic.
We are pleased that our top industries of
convenience stores, grocery stores, drug
stores, and dollar stores, which comprise
over 37% of our annualized rental revenue,
sell non-discretionary essential goods and
maintained financial strength throughout
the pandemic. In fact, we are proud to
partner with many of our clients who play an
important role in addressing the public health
crisis. Our real estate portfolio is deliberately
designed to be resilient through a variety of
economic environments, and we believe the
performance of the portfolio throughout the
challenging economic environment driven by
COVID-19 validates our investment strategy of
partnering with high-quality operators
who are leaders in their respective industry.
The COVID-19 pandemic created an
unprecedented shock to consumer demand
that impacted industries across the globe.
As a result, certain industries and operators
within our portfolio have been negatively
impacted. Specifically, government-mandated
closures and social-distancing requirements
have affected the theater industry and, to a
lesser extent, the health and fitness industry.
Although these industries are experiencing
challenges, we are pleased to partner
with top operators as we face these
challenges together.
LOOKINGAHEAD
As I contemplate our company’s current
position and outlook, I am committed,
inspired and optimistic. I believe the quality
of our real estate portfolio is unparalleled in
our company’s history, our global investment
pipeline has never been more active, and a
low interest rate environment has historically
been supportive of our business.
As the largest company within the public net
lease REIT sector, we are uniquely positioned
to leverage our size and scale to pursue
growth opportunities.
Oursizeandscalecontributetoourfinancialstrengthandflexibility– our
two credit ratings of A3/A- allow us access
to low-cost debt capital, our $3.0 billion
multicurrency revolving credit facility and $1.0
billion commercial paper program provide
significant liquidity, and our conservative
capital structure, of which approximately 72%
is equity, positions us favorably to pursue
opportunities.

Oursizeandscaleaffordustheabilitytoexpandintonewmarkets – since our
international expansion in 2019, we have
acquired over $1.7 billion of high-quality
real estate in the United Kingdom, and we
continue to expand our platform as we
review new opportunities and grow our
international presence.
Oursizeandscaleallowustopursuelarge-scaleportfolioacquisitions – robust access
to capital and the ability to complete large-
scale transactions without creating client or
industry diversification issues position us for
unique opportunities.
Oursizeandscaleprovideaccesstodataandresources – leveraging both information
from within our real estate portfolio of over
6,500 properties, as well as alternative and
external data sources, allows us to make
key decisions using best-in-class, and often
proprietary, information.
We believe investments in technology
and a data-driven approach to managing
the business will be pivotal to our future
successes, and we are prioritizing these
initiatives as we look toward our next chapter.
Our investment appetite remains robust, and
we have the people, processes, and systems
in place to continue evolving and delivering
upon our strategy. We are proud of the
platform our company has built throughout
our 52-year history, and the values which have
directed our prior successes remain pillars
upon which we will build Realty Income’s
future. We will seek to continue building
growth by design through leveraging our
business platform, fostering an innovative
environment, and relying upon our proven
values of resiliency and growth.
Our purpose, which is centered around
building enduring relationships and brighter
financial futures, remains the galvanizing
principle for us. We remain focused on
ensuring the stability and growth in earnings
and dividends, and we are guided by our
mission, vision, and values that culminate in
seeking to create benefits for all stakeholders.
Across all we do, we take the long view every
day, in every relationship, to provide stability
to the clients we serve, the team we nurture,
the communities we support, and the people
who invest in us.
Thank you for your continued support, and for
joining us on our continued journey to being
a reliable partner while working together on
creating a better world.
Sincerely,
SumitRoy
President & Chief Executive Officer
9
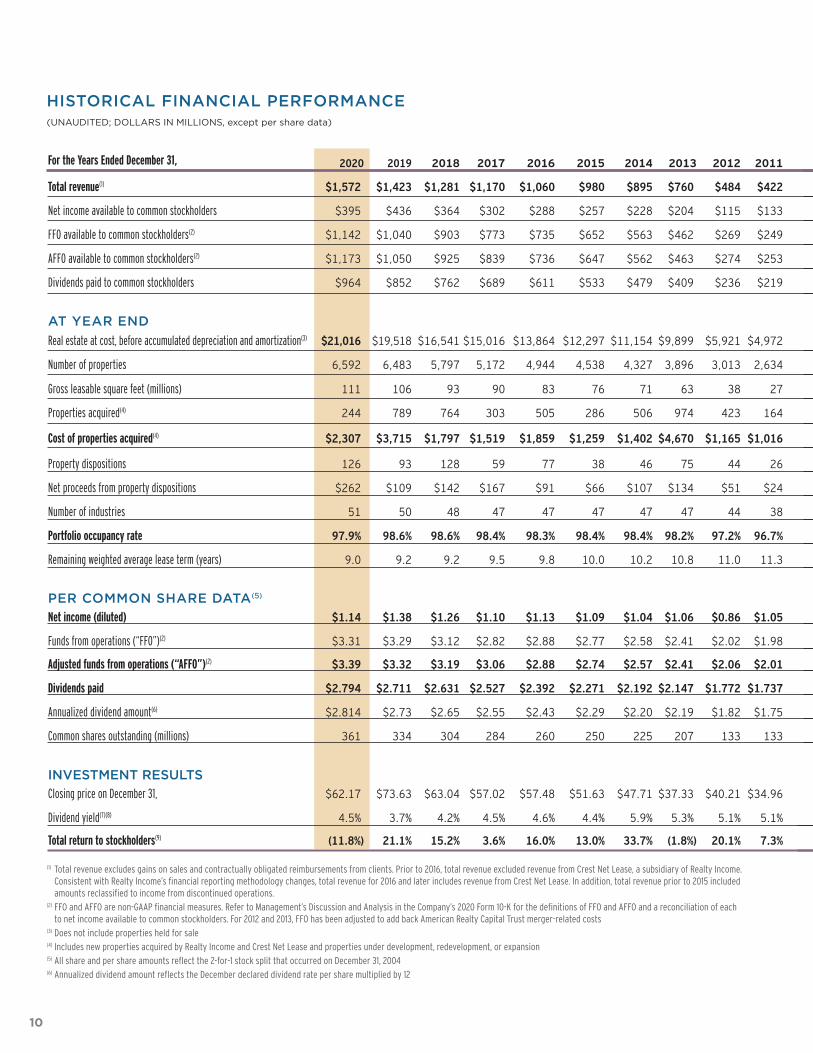
For the Years Ended December 31, 2020 2019 2018 2017 2016 2015 2014 2013 2012 2011
Total revenue(1) $1,572 $1,423 $1,281 $1,170 $1,060 $980 $895 $760 $484 $422
Net income available to common stockholders $395 $436 $364 $302 $288 $257 $228 $204 $115 $133
FFO available to common stockholders(2) $1,142 $1,040 $903 $773 $735 $652 $563 $462 $269 $249
AFFO available to common stockholders(2) $1,173 $1,050 $925 $839 $736 $647 $562 $463 $274 $253
Dividends paid to common stockholders $964 $852 $762 $689 $611 $533 $479 $409 $236 $219
AT YEAR ENDReal estate at cost, before accumulated depreciation and amortization(3) $21,016 $19,518 $16,541 $15,016 $13,864 $12,297 $11,154 $9,899 $5,921 $4,972
Number of properties 6,592 6,483 5,797 5,172 4,944 4,538 4,327 3,896 3,013 2,634
Gross leasable square feet (millions) 111 106 93 90 83 76 71 63 38 27
Properties acquired(4) 244 789 764 303 505 286 506 974 423 164
Cost of properties acquired(4) $2,307 $3,715 $1,797 $1,519 $1,859 $1,259 $1,402 $4,670 $1,165 $1,016
Property dispositions 126 93 128 59 77 38 46 75 44 26
Net proceeds from property dispositions $262 $109 $142 $167 $91 $66 $107 $134 $51 $24
Number of industries 51 50 48 47 47 47 47 47 44 38
Portfolio occupancy rate 97.9% 98.6% 98.6% 98.4% 98.3% 98.4% 98.4% 98.2% 97.2% 96.7%
Remaining weighted average lease term (years) 9.0 9.2 9.2 9.5 9.8 10.0 10.2 10.8 11.0 11.3
PER COMMON SHARE DATA(5)
Net income (diluted) $1.14 $1.38 $1.26 $1.10 $1.13 $1.09 $1.04 $1.06 $0.86 $1.05
Funds from operations (“FFO”)(2) $3.31 $3.29 $3.12 $2.82 $2.88 $2.77 $2.58 $2.41 $2.02 $1.98
Adjusted funds from operations (“AFFO”)(2) $3.39 $3.32 $3.19 $3.06 $2.88 $2.74 $2.57 $2.41 $2.06 $2.01
Dividends paid $2.794 $2.711 $2.631 $2.527 $2.392 $2.271 $2.192 $2.147 $1.772 $1.737
Annualized dividend amount(6) $2.814 $2.73 $2.65 $2.55 $2.43 $2.29 $2.20 $2.19 $1.82 $1.75
Common shares outstanding (millions) 361 334 304 284 260 250 225 207 133 133
INVESTMENT RESULTSClosing price on December 31, $62.17 $73.63 $63.04 $57.02 $57.48 $51.63 $47.71 $37.33 $40.21 $34.96
Dividend yield(7)(8) 4.5% 3.7% 4.2% 4.5% 4.6% 4.4% 5.9% 5.3% 5.1% 5.1%
Total return to stockholders(9) (11.8%) 21.1% 15.2% 3.6% 16.0% 13.0% 33.7% (1.8%) 20.1% 7.3%
HISTORICAL FINANCIAL PERFORMANCE(UNAUDITED; DOLLARS IN MILLIONS, except per share data)
(1) Totalrevenueexcludesgainsonsalesandcontractuallyobligatedreimbursementsfromclients.Priorto2016,totalrevenueexcludedrevenuefromCrestNetLease,asubsidiaryofRealtyIncome.ConsistentwithRealtyIncome’sfinancialreportingmethodologychanges,totalrevenuefor2016andlaterincludesrevenuefromCrestNetLease.Inaddition,totalrevenuepriorto2015includedamountsreclassifiedtoincomefromdiscontinuedoperations.
(2)FFOandAFFOarenon-GAAPfinancialmeasures.RefertoManagement’sDiscussionandAnalysisintheCompany’s2020Form10-KforthedefinitionsofFFOandAFFOandareconciliationofeachtonetincomeavailabletocommonstockholders.For2012and2013,FFOhasbeenadjustedtoaddbackAmericanRealtyCapitalTrustmerger-relatedcosts
(3)Doesnotincludepropertiesheldforsale(4)IncludesnewpropertiesacquiredbyRealtyIncomeandCrestNetLeaseandpropertiesunderdevelopment,redevelopment,orexpansion(5)Allshareandpershareamountsreflectthe2-for-1stocksplitthatoccurredonDecember31,2004(6)AnnualizeddividendamountreflectstheDecemberdeclareddividendratepersharemultipliedby12
10
For the Years Ended December 31, 2020 2019 2018 2017 2016 2015 2014 2013 2012 2011
Total revenue(1) $1,572 $1,423 $1,281 $1,170 $1,060 $980 $895 $760 $484 $422
Net income available to common stockholders $395 $436 $364 $302 $288 $257 $228 $204 $115 $133
FFO available to common stockholders(2) $1,142 $1,040 $903 $773 $735 $652 $563 $462 $269 $249
AFFO available to common stockholders(2) $1,173 $1,050 $925 $839 $736 $647 $562 $463 $274 $253
Dividends paid to common stockholders $964 $852 $762 $689 $611 $533 $479 $409 $236 $219
AT YEAR ENDReal estate at cost, before accumulated depreciation and amortization(3) $21,016 $19,518 $16,541 $15,016 $13,864 $12,297 $11,154 $9,899 $5,921 $4,972
Number of properties 6,592 6,483 5,797 5,172 4,944 4,538 4,327 3,896 3,013 2,634
Gross leasable square feet (millions) 111 106 93 90 83 76 71 63 38 27
Properties acquired(4) 244 789 764 303 505 286 506 974 423 164
Cost of properties acquired(4) $2,307 $3,715 $1,797 $1,519 $1,859 $1,259 $1,402 $4,670 $1,165 $1,016
Property dispositions 126 93 128 59 77 38 46 75 44 26
Net proceeds from property dispositions $262 $109 $142 $167 $91 $66 $107 $134 $51 $24
Number of industries 51 50 48 47 47 47 47 47 44 38
Portfolio occupancy rate 97.9% 98.6% 98.6% 98.4% 98.3% 98.4% 98.4% 98.2% 97.2% 96.7%
Remaining weighted average lease term (years) 9.0 9.2 9.2 9.5 9.8 10.0 10.2 10.8 11.0 11.3
PER COMMON SHARE DATA(5)
Net income (diluted) $1.14 $1.38 $1.26 $1.10 $1.13 $1.09 $1.04 $1.06 $0.86 $1.05
Funds from operations (“FFO”)(2) $3.31 $3.29 $3.12 $2.82 $2.88 $2.77 $2.58 $2.41 $2.02 $1.98
Adjusted funds from operations (“AFFO”)(2) $3.39 $3.32 $3.19 $3.06 $2.88 $2.74 $2.57 $2.41 $2.06 $2.01
Dividends paid $2.794 $2.711 $2.631 $2.527 $2.392 $2.271 $2.192 $2.147 $1.772 $1.737
Annualized dividend amount(6) $2.814 $2.73 $2.65 $2.55 $2.43 $2.29 $2.20 $2.19 $1.82 $1.75
Common shares outstanding (millions) 361 334 304 284 260 250 225 207 133 133
INVESTMENT RESULTSClosing price on December 31, $62.17 $73.63 $63.04 $57.02 $57.48 $51.63 $47.71 $37.33 $40.21 $34.96
Dividend yield(7)(8) 4.5% 3.7% 4.2% 4.5% 4.6% 4.4% 5.9% 5.3% 5.1% 5.1%
Total return to stockholders(9) (11.8%) 21.1% 15.2% 3.6% 16.0% 13.0% 33.7% (1.8%) 20.1% 7.3%
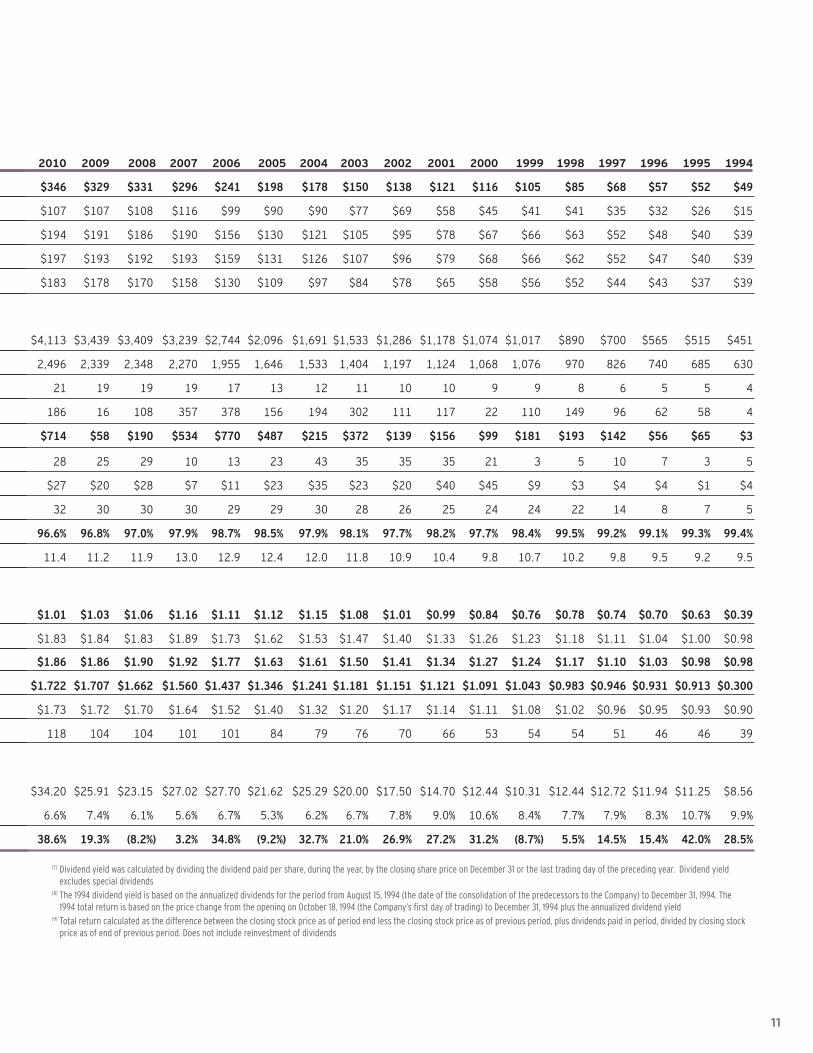
2010 2009 2008 2007 2006 2005 2004 2003 2002 2001 2000 1999 1998 1997 1996 1995 1994
$346 $329 $331 $296 $241 $198 $178 $150 $138 $121 $116 $105 $85 $68 $57 $52 $49
$107 $107 $108 $116 $99 $90 $90 $77 $69 $58 $45 $41 $41 $35 $32 $26 $15
$194 $191 $186 $190 $156 $130 $121 $105 $95 $78 $67 $66 $63 $52 $48 $40 $39
$197 $193 $192 $193 $159 $131 $126 $107 $96 $79 $68 $66 $62 $52 $47 $40 $39
$183 $178 $170 $158 $130 $109 $97 $84 $78 $65 $58 $56 $52 $44 $43 $37 $39
$4,113 $3,439 $3,409 $3,239 $2,744 $2,096 $1,691 $1,533 $1,286 $1,178 $1,074 $1,017 $890 $700 $565 $515 $451
2,496 2,339 2,348 2,270 1,955 1,646 1,533 1,404 1,197 1,124 1,068 1,076 970 826 740 685 630
21 19 19 19 17 13 12 11 10 10 9 9 8 6 5 5 4
186 16 108 357 378 156 194 302 111 117 22 110 149 96 62 58 4
$714 $58 $190 $534 $770 $487 $215 $372 $139 $156 $99 $181 $193 $142 $56 $65 $3
28 25 29 10 13 23 43 35 35 35 21 3 5 10 7 3 5
$27 $20 $28 $7 $11 $23 $35 $23 $20 $40 $45 $9 $3 $4 $4 $1 $4
32 30 30 30 29 29 30 28 26 25 24 24 22 14 8 7 5
96.6% 96.8% 97.0% 97.9% 98.7% 98.5% 97.9% 98.1% 97.7% 98.2% 97.7% 98.4% 99.5% 99.2% 99.1% 99.3% 99.4%
11.4 11.2 11.9 13.0 12.9 12.4 12.0 11.8 10.9 10.4 9.8 10.7 10.2 9.8 9.5 9.2 9.5
$1.01 $1.03 $1.06 $1.16 $1.11 $1.12 $1.15 $1.08 $1.01 $0.99 $0.84 $0.76 $0.78 $0.74 $0.70 $0.63 $0.39
$1.83 $1.84 $1.83 $1.89 $1.73 $1.62 $1.53 $1.47 $1.40 $1.33 $1.26 $1.23 $1.18 $1.11 $1.04 $1.00 $0.98
$1.86 $1.86 $1.90 $1.92 $1.77 $1.63 $1.61 $1.50 $1.41 $1.34 $1.27 $1.24 $1.17 $1.10 $1.03 $0.98 $0.98
$1.722 $1.707 $1.662 $1.560 $1.437 $1.346 $1.241 $1.181 $1.151 $1.121 $1.091 $1.043 $0.983 $0.946 $0.931 $0.913 $0.300
$1.73 $1.72 $1.70 $1.64 $1.52 $1.40 $1.32 $1.20 $1.17 $1.14 $1.11 $1.08 $1.02 $0.96 $0.95 $0.93 $0.90
118 104 104 101 101 84 79 76 70 66 53 54 54 51 46 46 39
$34.20 $25.91 $23.15 $27.02 $27.70 $21.62 $25.29 $20.00 $17.50 $14.70 $12.44 $10.31 $12.44 $12.72 $11.94 $11.25 $8.56
6.6% 7.4% 6.1% 5.6% 6.7% 5.3% 6.2% 6.7% 7.8% 9.0% 10.6% 8.4% 7.7% 7.9% 8.3% 10.7% 9.9%
38.6% 19.3% (8.2%) 3.2% 34.8% (9.2%) 32.7% 21.0% 26.9% 27.2% 31.2% (8.7%) 5.5% 14.5% 15.4% 42.0% 28.5%
(7)Dividendyieldwascalculatedbydividingthedividendpaidpershare,duringtheyear,bytheclosingsharepriceonDecember31orthelasttradingdayoftheprecedingyear.Dividendyield
excludesspecialdividends(8)The1994dividendyieldisbasedontheannualizeddividendsfortheperiodfromAugust15,1994(thedateoftheconsolidationofthepredecessorstotheCompany)toDecember31,1994.The
1994totalreturnisbasedonthepricechangefromtheopeningonOctober18,1994(theCompany’sfirstdayoftrading)toDecember31,1994plustheannualizeddividendyield(9)Totalreturncalculatedasthedifferencebetweentheclosingstockpriceasofperiodendlesstheclosingstockpriceasofpreviousperiod,plusdividendspaidinperiod,dividedbyclosingstock
priceasofendofpreviousperiod.Doesnotincludereinvestmentofdividends
11

R E A L E S TAT E
P O R T F O L I O
12

Ourconfidenceincontinuingtoprovidemonthlydividendsthatincreaseovertimestemsfromthequalityofourrealestateportfolio,whichisdesignedtoembodyfortress-likestrengthandresiliency. These characteristics were tested during
2020 as the global COVID-19 pandemic
resulted in the temporary closure of properties
with clients in certain industries. Despite
these challenges, the cash flow generating
capacity of our portfolio persevered, resulting
in another year of dividend growth. As of
December 31, 2020, our real estate portfolio
consisted of 6,592 properties, which are
primarily freestanding, net leased, single-client
commercial properties well diversified by:
• CLIENT – Approximately 600 clients
where over half of annualized contractual
rental revenue is generated from investment-
grade rated operators or their subsidiaries
• INDUSTRY – Our clients operate across
51 different industries
• GEOGRAPHY – 49 states, Puerto Rico,
and the United Kingdom
• PROPERTYTYPE– Primarily retail and
industrial
PROPERTYTYPE DIVERSIFICATION
N U M B E R % O F O F P R O P E R T I E S R E V E N U E ( 1 )
R E T A I L 6,419 84.4%
I N D U S T R I A L 115 10.9%
O F F I C E 43 3.1%
A G R I C U L T U R E 15 1.6%
( 1 ) B A S E D O N T O T A L P O R T F O L I O A N N U A L I Z E D C O N T R A C T U A L R E N T A S O F D E C E M B E R 3 1 , 2 0 2 0
TOP10INDUSTRIES
13
“We have built up our Development team which has
allowed us to expand our efforts in acquiring new assets for
construction as well as pursuing value-creation opportunities
within our existing portfolio. While remaining consistent with
its mission, vision, and values, Realty Income is broadening
its investment possibilities to drive additional
earnings growth.”
Janeen Drakulich Senior Vice President, Development
% O F R E V E N U E ( 1 )
C O N V E N I E N C E S T O R E S 11.9%
G R O C E R Y S T O R E S 9.8%
D R U G S T O R E S 8.2%
D O L L A R S T O R E S 7.6%
H E A L T H A N D F I T N E S S 6.7%
T H E A T E R S 5.6%
R E S T A U R A N T S - Q U I C K S E R V I C E 5.3%
H O M E I M P R O V E M E N T 4.3%
T R A N S P O R T A T I O N S E R V I C E S 3.9%
G E N E R A L M E R C H A N D I S E 3.4% ( 1 ) B A S E D O N T O T A L P O R T F O L I O A N N U A L I Z E D C O N T R A C T U A L R E N T A S O F D E C E M B E R 3 1 , 2 0 2 0 . T H E P R E S E N T A T I O N O F T O P 1 0 I N D U S T R I E S C O M B I N E S T O T A L P O R T F O L I O A N N U A L I Z E D C O N T R A C T U A L R E N T C O N T R I B U T I O N F R O M U . S . A N D U . K . P R O P E R T I E S .
R E A L E S TAT E
P O R T F O L I O( C O N T I N U E D )
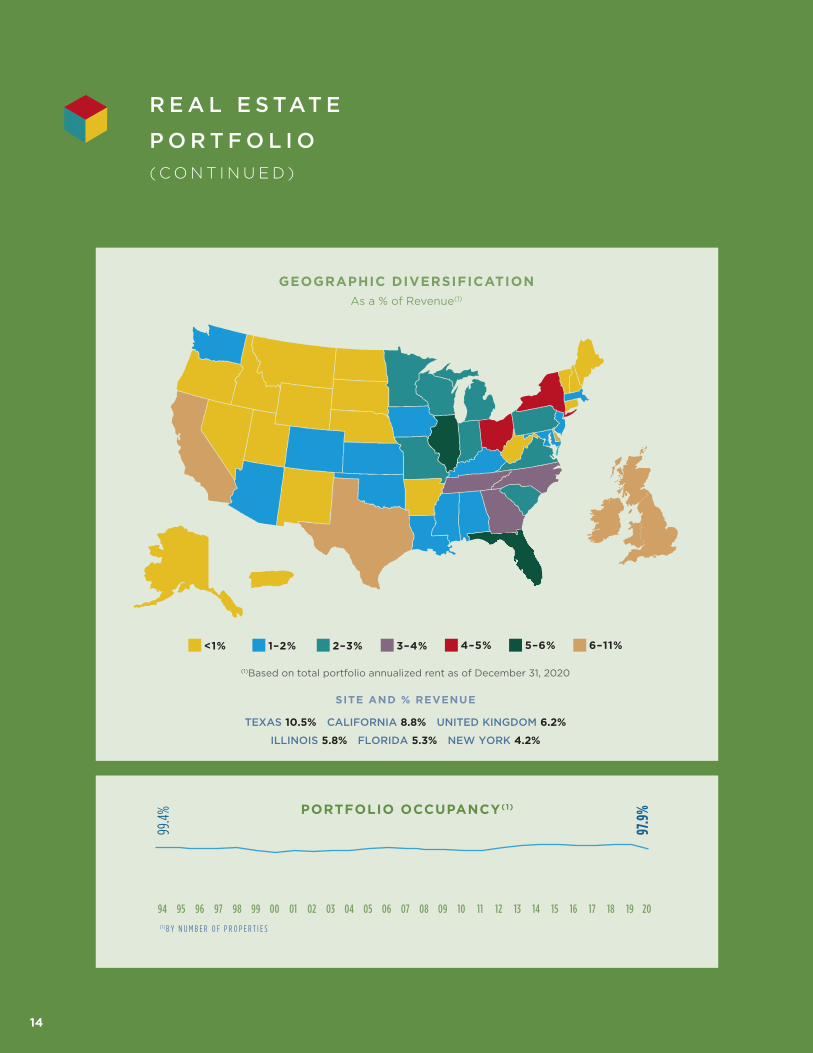
GEOGRAPHICDIVERSIFICATIONAs a % of Revenue(1)
(1)Based on total portfolio annualized rent as of December 31, 2020
TEXAS 10.5%CALIFORNIA 8.8% UNITED KINGDOM 6.2%
ILLINOIS 5.8%FLORIDA 5.3% NEW YORK 4.2%
<1% 2–3% 3–4%1–2% 4–5% 5–6% 6–11%
SITEAND%REVENUE
14
PORTFOLIOOCCUPANCY(1)
99.4%
97.9
%
( 1 ) B Y N U M B E R O F P R O P E R T I E S
94 95 96 97 98 99 00 01 02 03 04 05 06 07 08 09 10 11 12 13 14 15 16 17 18 19 20
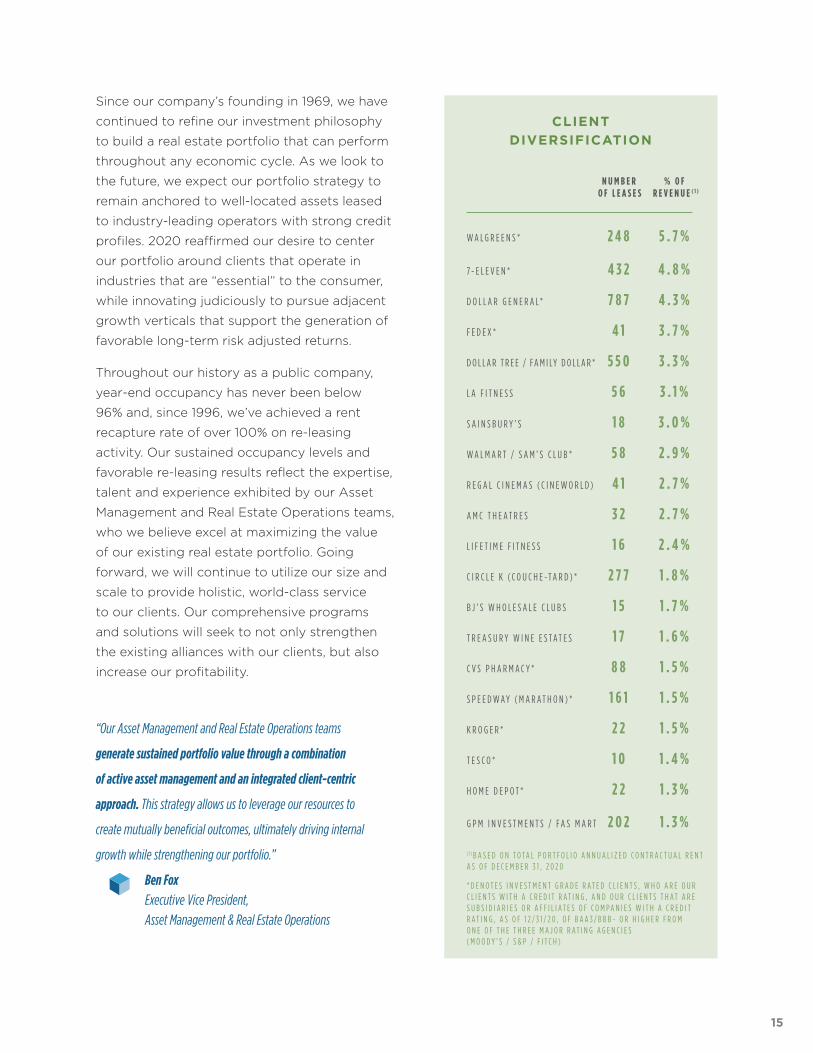
Since our company’s founding in 1969, we have
continued to refine our investment philosophy
to build a real estate portfolio that can perform
throughout any economic cycle. As we look to
the future, we expect our portfolio strategy to
remain anchored to well-located assets leased
to industry-leading operators with strong credit
profiles. 2020 reaffirmed our desire to center
our portfolio around clients that operate in
industries that are “essential” to the consumer,
while innovating judiciously to pursue adjacent
growth verticals that support the generation of
favorable long-term risk adjusted returns.
Throughout our history as a public company,
year-end occupancy has never been below
96% and, since 1996, we’ve achieved a rent
recapture rate of over 100% on re-leasing
activity. Our sustained occupancy levels and
favorable re-leasing results reflect the expertise,
talent and experience exhibited by our Asset
Management and Real Estate Operations teams,
who we believe excel at maximizing the value
of our existing real estate portfolio. Going
forward, we will continue to utilize our size and
scale to provide holistic, world-class service
to our clients. Our comprehensive programs
and solutions will seek to not only strengthen
the existing alliances with our clients, but also
increase our profitability.
N U M B E R % O F
W A L G R E E N S * 2 4 8 5 . 7 %
7 - E L E V E N * 4 3 2 4 . 8 %
D O L L A R G E N E R A L * 7 8 7 4 . 3 %
F E D E X * 4 1 3 . 7 %
D O L L A R T R E E / F A M I LY D O L L A R * 5 5 0 3 . 3 %
L A F I T N E S S 5 6 3 . 1 %
S A I N S B U R Y ’ S 1 8 3 . 0 %
W A L M A R T / S A M ’ S C L U B * 5 8 2 . 9 %
R E G A L C I N E M A S ( C I N E W O R L D ) 4 1 2 . 7 %
A M C T H E A T R E S 3 2 2 . 7 %
L I F E T I M E F I T N E S S 1 6 2 . 4 %
C I R C L E K ( C O U C H E - T A R D ) * 2 7 7 1 . 8 %
B J ’ S W H O L E S A L E C L U B S 1 5 1 . 7 %
T R E A S U R Y W I N E E S T A T E S 1 7 1 . 6 %
C V S P H A R M A C Y * 8 8 1 . 5 %
S P E E D W A Y ( M A R A T H O N ) * 1 6 1 1 . 5 %
K R O G E R * 2 2 1 . 5 %
T E S C O * 1 0 1 . 4 %
H O M E D E P O T * 2 2 1 . 3 %
G P M I N V E S T M E N T S / F A S M A R T 2 0 2 1 . 3 %
( 1 ) B A S E D O N T O T A L P O R T F O L I O A N N U A L I Z E D C O N T R A C T U A L R E N T A S O F D E C E M B E R 3 1 , 2 0 2 0
* D E N O T E S I N V E S T M E N T G R A D E R A T E D C L I E N T S , W H O A R E O U R C L I E N T S W I T H A C R E D I T R A T I N G , A N D O U R C L I E N T S T H A T A R E S U B S I D I A R I E S O R A F F I L I A T E S O F C O M P A N I E S W I T H A C R E D I T R A T I N G , A S O F 1 2 / 3 1 / 2 0 , O F B A A 3 / B B B - O R H I G H E R F R O M O N E O F T H E T H R E E M A J O R R A T I N G A G E N C I E S ( M O O D Y ’ S / S & P / F I T C H )
CLIENTDIVERSIFICATION
15
“Our Asset Management and Real Estate Operations teams
generate sustained portfolio value through a combination
of active asset management and an integrated client-centric
approach. This strategy allows us to leverage our resources to
create mutually beneficial outcomes, ultimately driving internal
growth while strengthening our portfolio.”
Ben Fox Executive Vice President, Asset Management & Real Estate Operations
O F L E A S E S R E V E N U E ( 1 )

D I S C I P L I N E D
I N V E S T M E N T
P R O C E S S
“During 2020, our business benefitted from the strength of
our partnerships, the diligence of our investment approach,
and the experience of our team as we executed on our robust
investment pipeline to complete over $2.3 billion of acquisitions
during the year. We will seek to continue leveraging our
competitive advantages of size and scale to pursue large
transactions to drive growth in earnings and dividends.”
Mark Hagan Executive Vice President, Chief Investment Officer
“Despite the tumult of the past year and our physical
separation, we worked closely together as One Team. This
was especially true in our international business, in which
we invested almost $1.0 billion in high-quality assets in the
UK during 2020. We are grateful to our clients, colleagues
and partners for their support in achieving this result.
Looking forward, we hope to extend and replicate this
success in other international markets.”
Neil Abraham Executive Vice President, Chief Strategy Officer
16
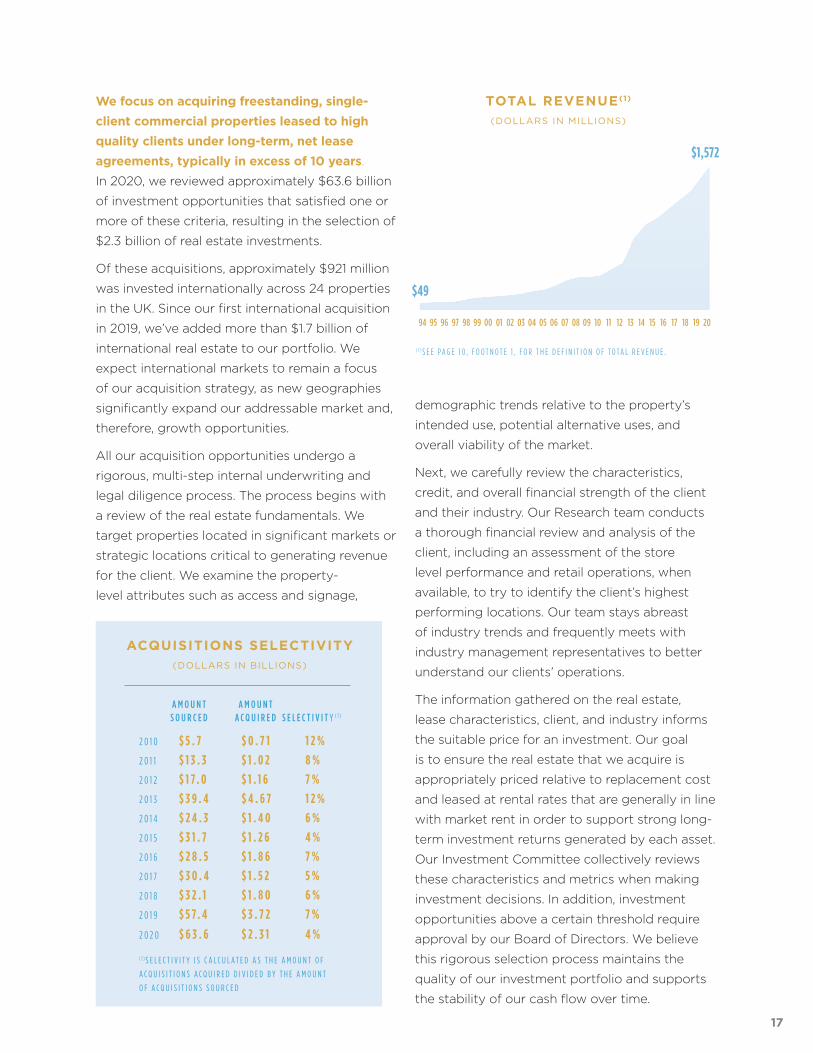
Wefocusonacquiringfreestanding,single-clientcommercialpropertiesleasedtohighqualityclientsunderlong-term,netleaseagreements,typicallyinexcessof10years.
In 2020, we reviewed approximately $63.6 billion
of investment opportunities that satisfied one or
more of these criteria, resulting in the selection of
$2.3 billion of real estate investments.
Of these acquisitions, approximately $921 million
was invested internationally across 24 properties
in the UK. Since our first international acquisition
in 2019, we’ve added more than $1.7 billion of
international real estate to our portfolio. We
expect international markets to remain a focus
of our acquisition strategy, as new geographies
significantly expand our addressable market and,
therefore, growth opportunities.
All our acquisition opportunities undergo a
rigorous, multi-step internal underwriting and
legal diligence process. The process begins with
a review of the real estate fundamentals. We
target properties located in significant markets or
strategic locations critical to generating revenue
for the client. We examine the property-
level attributes such as access and signage,
demographic trends relative to the property’s
intended use, potential alternative uses, and
overall viability of the market.
Next, we carefully review the characteristics,
credit, and overall financial strength of the client
and their industry. Our Research team conducts
a thorough financial review and analysis of the
client, including an assessment of the store
level performance and retail operations, when
available, to try to identify the client’s highest
performing locations. Our team stays abreast
of industry trends and frequently meets with
industry management representatives to better
understand our clients’ operations.
The information gathered on the real estate,
lease characteristics, client, and industry informs
the suitable price for an investment. Our goal
is to ensure the real estate that we acquire is
appropriately priced relative to replacement cost
and leased at rental rates that are generally in line
with market rent in order to support strong long-
term investment returns generated by each asset.
Our Investment Committee collectively reviews
these characteristics and metrics when making
investment decisions. In addition, investment
opportunities above a certain threshold require
approval by our Board of Directors. We believe
this rigorous selection process maintains the
quality of our investment portfolio and supports
the stability of our cash flow over time.
ACQUISITIONSSELECTIVITY(DOLLARS IN BILLIONS)
A M O U N T A M O U N T S O U R C E D A C Q U I R E D S E L E C T I V I T Y ( 1 )
2 0 1 0 $ 5 . 7 $ 0 . 7 1 1 2 %
2 0 1 1 $ 1 3 . 3 $ 1 . 0 2 8 %
2 0 1 2 $ 1 7 . 0 $ 1 . 1 6 7 %
2 0 1 3 $ 3 9 . 4 $ 4 . 6 7 1 2 %
2 0 1 4 $ 2 4 . 3 $ 1 . 4 0 6 %
2 0 1 5 $ 3 1 . 7 $ 1 . 2 6 4 %
2 0 1 6 $ 2 8 . 5 $ 1 . 8 6 7 %
2 0 1 7 $ 3 0 . 4 $ 1 . 5 2 5 %
2 0 1 8 $ 3 2 . 1 $ 1 . 8 0 6 %
2 0 1 9 $ 5 7 . 4 $ 3 . 7 2 7 %
2 0 2 0 $ 6 3 . 6 $ 2 . 3 1 4 %
( 1 ) S E L E C T I V I T Y I S C A L C U L A T E D A S T H E A M O U N T O F
A C Q U I S I T I O N S A C Q U I R E D D I V I D E D B Y T H E A M O U N T
O F A C Q U I S I T I O N S S O U R C E D
17
TOTALREVENUE(1)
(DOLLARS IN MILLIONS)
( 1 ) S E E PA G E 1 0 , F O O T N O T E 1 , F O R T H E D E F I N I T I O N O F T O T A L R E V E N U E .
$49
$1,572
94 95 96 97 98 99 00 01 02 03 04 05 06 07 08 09 10 11 12 13 14 15 16 17 18 19 20

C O N S E R VAT I V E
C A P I TA L
S T R U C T U R E
18
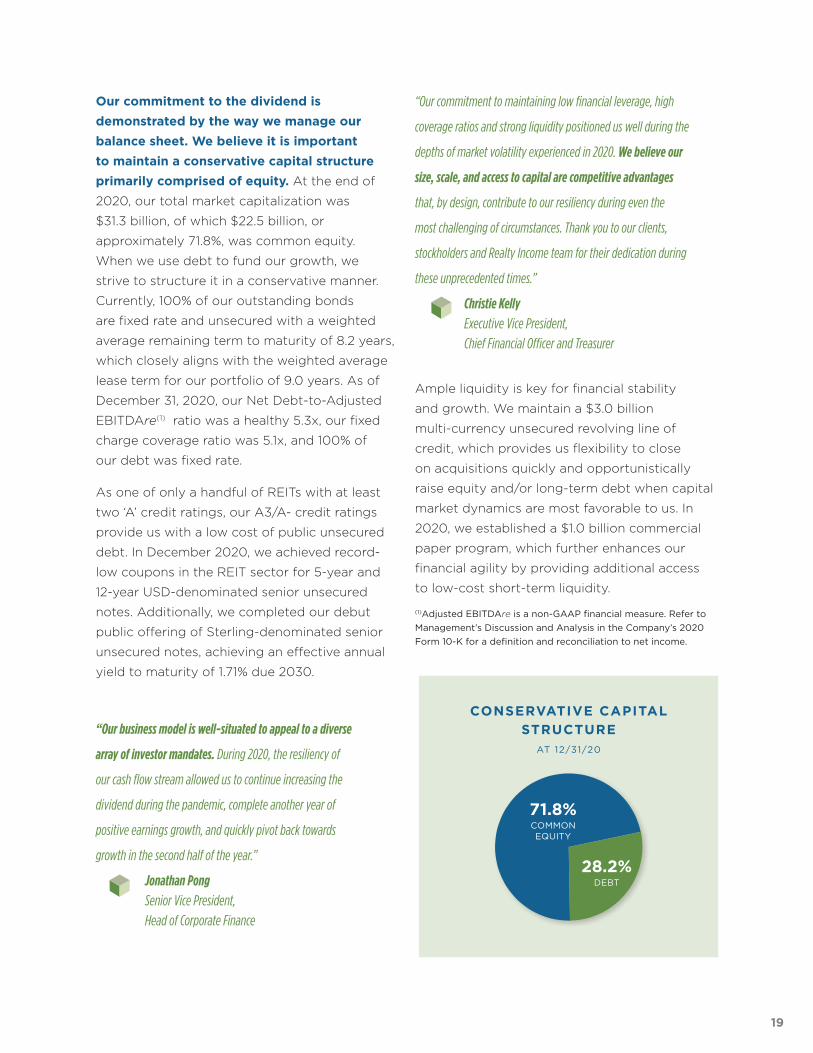
Ourcommitmenttothedividendisdemonstratedbythewaywemanageourbalancesheet.Webelieveitisimportanttomaintainaconservativecapitalstructureprimarilycomprisedofequity. At the end of
2020, our total market capitalization was
$31.3 billion, of which $22.5 billion, or
approximately 71.8%, was common equity.
When we use debt to fund our growth, we
strive to structure it in a conservative manner.
Currently, 100% of our outstanding bonds
are fixed rate and unsecured with a weighted
average remaining term to maturity of 8.2 years,
which closely aligns with the weighted average
lease term for our portfolio of 9.0 years. As of
December 31, 2020, our Net Debt-to-Adjusted
EBITDAre(1) ratio was a healthy 5.3x, our fixed
charge coverage ratio was 5.1x, and 100% of
our debt was fixed rate.
As one of only a handful of REITs with at least
two ‘A’ credit ratings, our A3/A- credit ratings
provide us with a low cost of public unsecured
debt. In December 2020, we achieved record-
low coupons in the REIT sector for 5-year and
12-year USD-denominated senior unsecured
notes. Additionally, we completed our debut
public offering of Sterling-denominated senior
unsecured notes, achieving an effective annual
yield to maturity of 1.71% due 2030.
Ample liquidity is key for financial stability
and growth. We maintain a $3.0 billion
multi-currency unsecured revolving line of
credit, which provides us flexibility to close
on acquisitions quickly and opportunistically
raise equity and/or long-term debt when capital
market dynamics are most favorable to us. In
2020, we established a $1.0 billion commercial
paper program, which further enhances our
financial agility by providing additional access
to low-cost short-term liquidity.
CONSERVATIVECAPITALSTRUCTURE
AT 12/31/20 71.8+28.2
71.8%COMMON EQUITY
28.2%DEBT
“Our commitment to maintaining low financial leverage, high
coverage ratios and strong liquidity positioned us well during the
depths of market volatility experienced in 2020. We believe our
size, scale, and access to capital are competitive advantages
that, by design, contribute to our resiliency during even the
most challenging of circumstances. Thank you to our clients,
stockholders and Realty Income team for their dedication during
these unprecedented times.”
Christie Kelly Executive Vice President, Chief Financial Officer and Treasurer
19
“Our business model is well-situated to appeal to a diverse
array of investor mandates. During 2020, the resiliency of
our cash flow stream allowed us to continue increasing the
dividend during the pandemic, complete another year of
positive earnings growth, and quickly pivot back towards
growth in the second half of the year.”
Jonathan Pong Senior Vice President, Head of Corporate Finance
(1)Adjusted EBITDAre is a non-GAAP financial measure. Refer to Management’s Discussion and Analysis in the Company’s 2020 Form 10-K for a definition and reconciliation to net income.
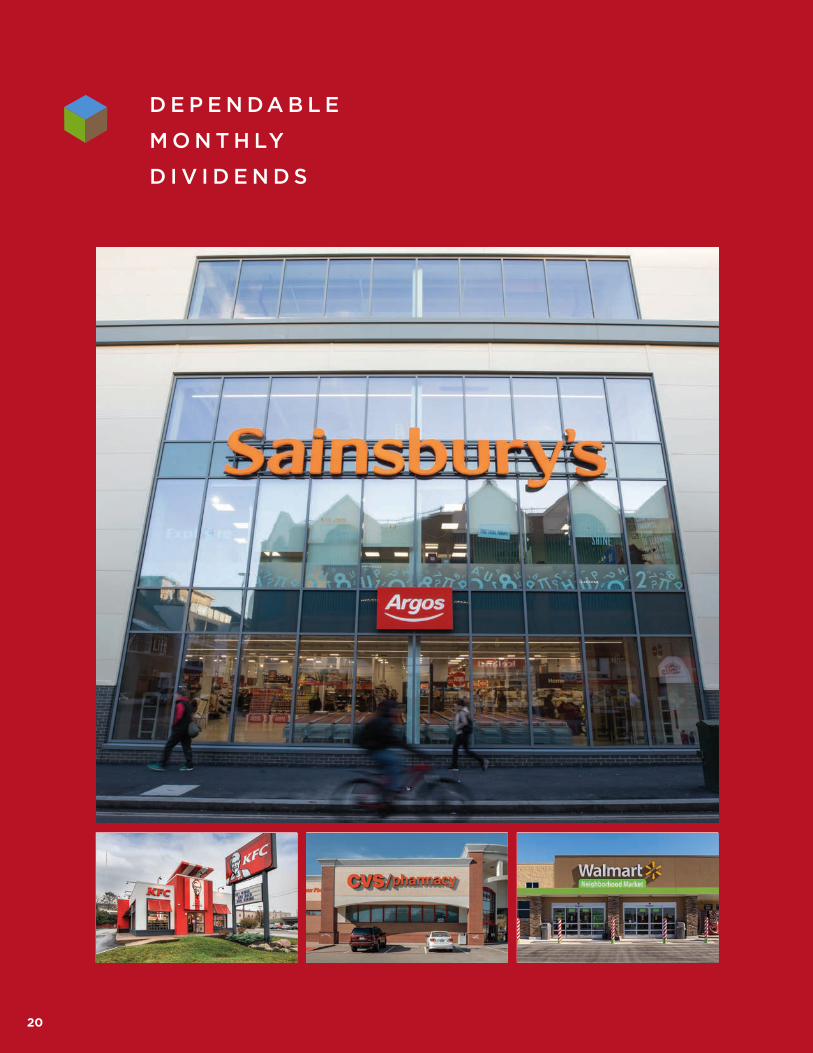
D E P E N D A B L E
M O N T H LY
D I V I D E N D S
20
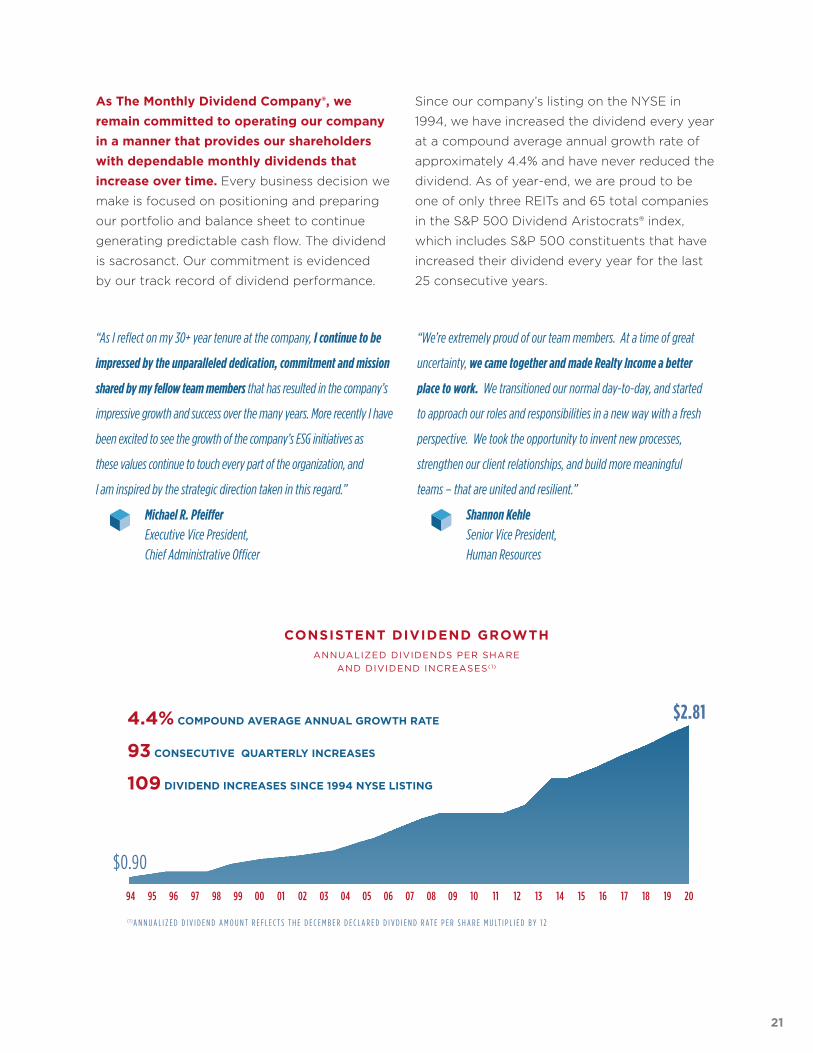
AsTheMonthlyDividendCompany®,weremaincommittedtooperatingourcompanyinamannerthatprovidesourshareholderswithdependablemonthlydividendsthatincreaseovertime.Every business decision we
make is focused on positioning and preparing
our portfolio and balance sheet to continue
generating predictable cash flow. The dividend
is sacrosanct. Our commitment is evidenced
by our track record of dividend performance.
Since our company’s listing on the NYSE in
1994, we have increased the dividend every year
at a compound average annual growth rate of
approximately 4.4% and have never reduced the
dividend. As of year-end, we are proud to be
one of only three REITs and 65 total companies
in the S&P 500 Dividend Aristocrats® index,
which includes S&P 500 constituents that have
increased their dividend every year for the last
25 consecutive years.
CONSISTENTDIVIDENDGROWTHANNUALIZED DIVIDENDS PER SHARE
AND DIVIDEND INCREASES(1)
( 1 ) A N N U A L I Z E D D I V I D E N D A M O U N T R E F L E C T S T H E D E C E M B E R D E C L A R E D D I V D I E N D R A T E P E R S H A R E M U L T I P L I E D B Y 1 2
94 95 96 97 98 99 00 01 02 03 04 05 06 07 08 09 10 11 12 13 14 15 16 17 18 19
$2.81
20
4.4%COMPOUNDAVERAGEANNUALGROWTHRATE
93CONSECUTIVEQUARTERLYINCREASES
109 DIVIDENDINCREASESSINCE1994NYSELISTING
21
“We’re extremely proud of our team members. At a time of great
uncertainty, we came together and made Realty Income a better
place to work. We transitioned our normal day-to-day, and started
to approach our roles and responsibilities in a new way with a fresh
perspective. We took the opportunity to invent new processes,
strengthen our client relationships, and build more meaningful
teams – that are united and resilient.”
Shannon Kehle Senior Vice President, Human Resources
“As I reflect on my 30+ year tenure at the company, I continue to be
impressed by the unparalleled dedication, commitment and mission
shared by my fellow team members that has resulted in the company’s
impressive growth and success over the many years. More recently I have
been excited to see the growth of the company’s ESG initiatives as
these values continue to touch every part of the organization, and
I am inspired by the strategic direction taken in this regard.”
Michael R. Pfeiffer Executive Vice President, Chief Administrative Officer
$0.90

23 CONSOLIDATED BALANCE SHEETS
24 CONSOLIDATED STATEMENTS OF INCOME AND COMPREHENSIVE INCOME
25 CONSOLIDATED STATEMENTS OF EQUITY
26 CONSOLIDATED STATEMENTS OF CASH FLOWS
27 REALTY INCOME PERFORMANCE VS. MAJOR STOCK INDICES
(1) This financial data is derived from our audited financial statements found in the company’s 2020 Form 10-K
S E L E C T
F I N A N C I A L
D ATA ( 1 )
22
Theaccompanyingnotestoconsolidatedfinancialstatementsareanintegralpartofthesestatementsandmaybefoundinthecompany’s2020Form10-K.
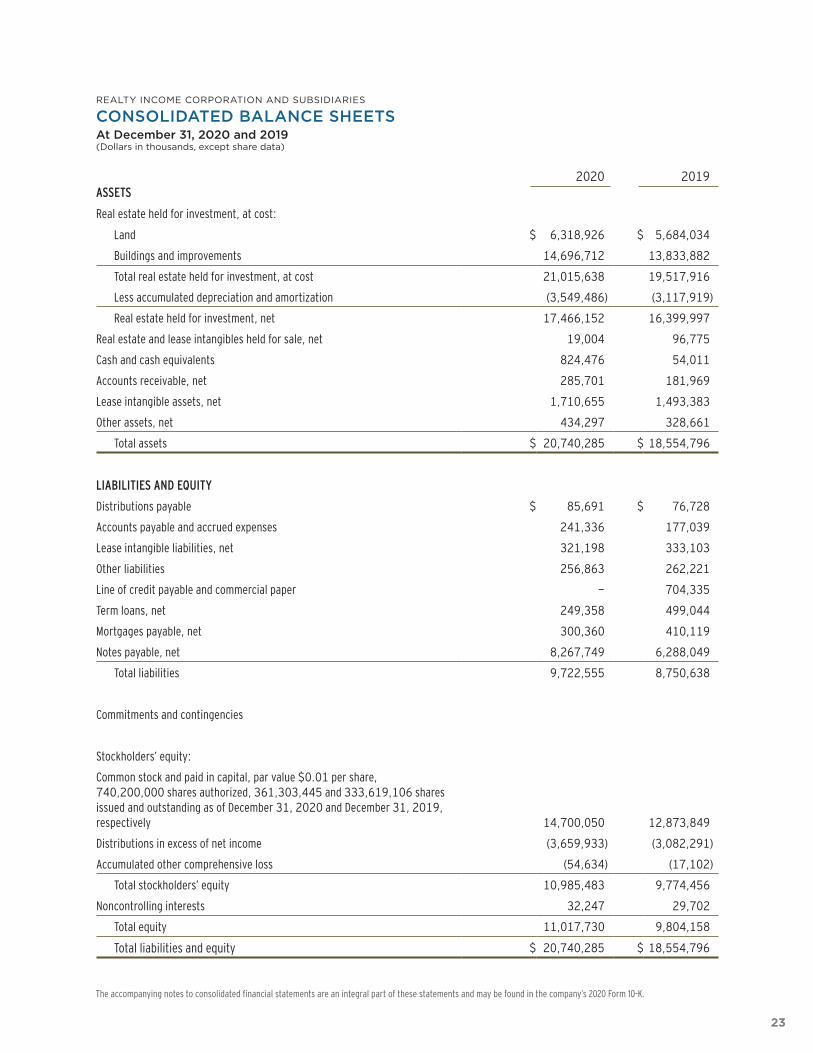
REALTY INCOME CORPORATION AND SUBSIDIARIES
CONSOLIDATED BALANCE SHEETSAt December 31, 2020 and 2019(Dollars in thousands, except share data)
2020 2019ASSETS
Real estate held for investment, at cost:
Land $ 6,318,926 $ 5,684,034
Buildings and improvements 14,696,712 13,833,882
Total real estate held for investment, at cost 21,015,638 19,517,916
Less accumulated depreciation and amortization (3,549,486) (3,117,919)
Real estate held for investment, net 17,466,152 16,399,997
Real estate and lease intangibles held for sale, net 19,004 96,775
Cash and cash equivalents 824,476 54,011
Accounts receivable, net 285,701 181,969
Lease intangible assets, net 1,710,655 1,493,383
Other assets, net 434,297 328,661
Total assets $ 20,740,285 $ 18,554,796
LIABILITIES AND EQUITY
Distributions payable $ 85,691 $ 76,728
Accounts payable and accrued expenses 241,336 177,039
Lease intangible liabilities, net 321,198 333,103
Other liabilities 256,863 262,221
Line of credit payable and commercial paper - 704,335
Term loans, net 249,358 499,044
Mortgages payable, net 300,360 410,119
Notes payable, net 8,267,749 6,288,049
Total liabilities 9,722,555 8,750,638
Commitments and contingencies
Stockholders’ equity:
Common stock and paid in capital, par value $0.01 per share, 740,200,000 shares authorized, 361,303,445 and 333,619,106 shares issued and outstanding as of December 31, 2020 and December 31, 2019, respectively 14,700,050 12,873,849
Distributions in excess of net income (3,659,933) (3,082,291)
Accumulated other comprehensive loss (54,634) (17,102)
Total stockholders’ equity 10,985,483 9,774,456
Noncontrolling interests 32,247 29,702
Total equity 11,017,730 9,804,158
Total liabilities and equity $ 20,740,285 $ 18,554,796
23
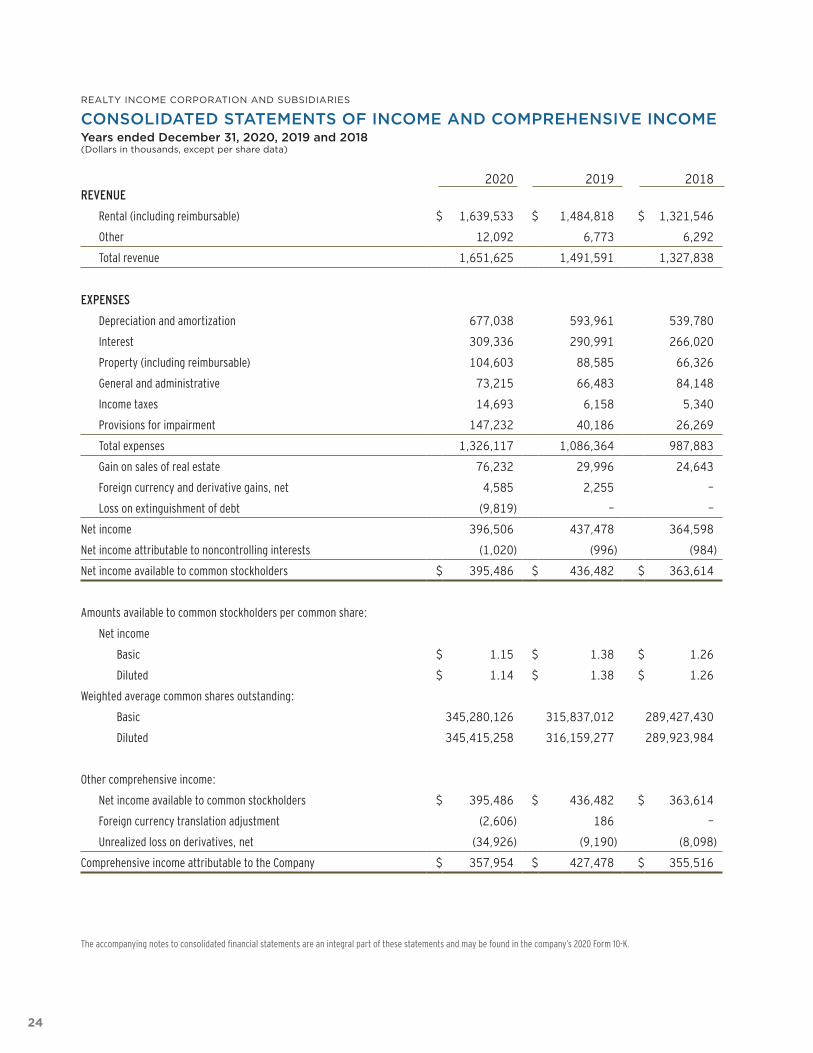
REALTY INCOME CORPORATION AND SUBSIDIARIES
CONSOLIDATED STATEMENTS OF INCOME AND COMPREHENSIVE INCOMEYears ended December 31, 2020, 2019 and 2018(Dollars in thousands, except per share data)
2020 2019 2018REVENUE
Rental (including reimbursable) $ 1,639,533 $ 1,484,818 $ 1,321,546
Other 12,092 6,773 6,292
Total revenue 1,651,625 1,491,591 1,327,838
EXPENSES
Depreciation and amortization 677,038 593,961 539,780
Interest 309,336 290,991 266,020
Property (including reimbursable) 104,603 88,585 66,326
General and administrative 73,215 66,483 84,148
Income taxes 14,693 6,158 5,340
Provisions for impairment 147,232 40,186 26,269
Total expenses 1,326,117 1,086,364 987,883
Gain on sales of real estate 76,232 29,996 24,643
Foreign currency and derivative gains, net 4,585 2,255 —
Lossonextinguishmentofdebt (9,819) — —
Net income 396,506 437,478 364,598
Net income attributable to noncontrolling interests (1,020) (996) (984)
Net income available to common stockholders $ 395,486 $ 436,482 $ 363,614
Amounts available to common stockholders per common share:
Net income
Basic $ 1.15 $ 1.38 $ 1.26
Diluted $ 1.14 $ 1.38 $ 1.26
Weighted average common shares outstanding:
Basic 345,280,126 315,837,012 289,427,430
Diluted 345,415,258 316,159,277 289,923,984
Other comprehensive income:
Net income available to common stockholders $ 395,486 $ 436,482 $ 363,614
Foreign currency translation adjustment (2,606) 186 —
Unrealized loss on derivatives, net (34,926) (9,190) (8,098)
Comprehensive income attributable to the Company $ 357,954 $ 427,478 $ 355,516
Theaccompanyingnotestoconsolidatedfinancialstatementsareanintegralpartofthesestatementsandmaybefoundinthecompany’s2020Form10-K.
24
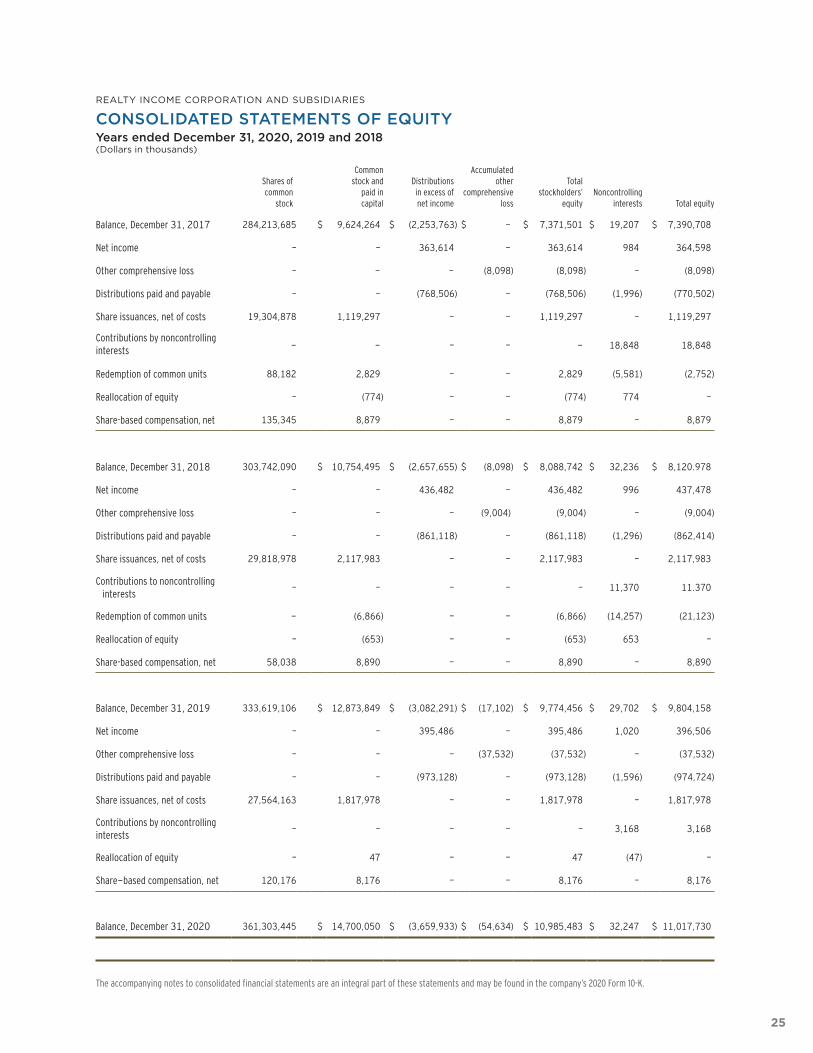
REALTY INCOME CORPORATION AND SUBSIDIARIES
CONSOLIDATED STATEMENTS OF EQUITYYears ended December 31, 2020, 2019 and 2018(Dollars in thousands)
Shares of common
stock
Common stock and
paid in capital
Distributions in excess of net income
Accumulated other
comprehensive loss
Total stockholders’
equityNoncontrolling
interests Total equity
Balance, December 31, 2017 284,213,685 $ 9,624,264 $ (2,253,763) $ — $ 7,371,501 $ 19,207 $ 7,390,708
Net income — — 363,614 — 363,614 984 364,598
Other comprehensive loss — - - (8,098) (8,098) — (8,098)
Distributions paid and payable — — (768,506) — (768,506) (1,996) (770,502)
Share issuances, net of costs 19,304,878 1,119,297 — — 1,119,297 — 1,119,297
Contributions by noncontrolling interests - - — — - 18,848 18,848
Redemption of common units 88,182 2,829 — — 2,829 (5,581) (2,752)
Reallocation of equity — (774) — — (774) 774 —
Share-basedcompensation,net 135,345 8,879 — — 8,879 — 8,879
Balance, December 31, 2018 303,742,090 $ 10,754,495 $ (2,657,655) $ (8,098) $ 8,088,742 $ 32,236 $ 8,120.978
Net income — — 436,482 — 436,482 996 437,478
Other comprehensive loss — — — (9,004)) (9,004) — (9,004)
Distributions paid and payable — — (861,118) — (861,118) (1,296) (862,414)
Share issuances, net of costs 29,818,978 2,117,983 — — 2,117,983 — 2,117,983
Contributions to noncontrolling interests
— — — — — 11,370 11.370
Redemption of common units - (6,866) — — (6,866) (14,257) (21,123)
Reallocation of equity — (653) — — (653) 653 —
Share-based compensation, net 58,038 8,890 — — 8,890 — 8,890
Balance, December 31, 2019 333,619,106 $ 12,873,849 $ (3,082,291) $ (17,102) $ 9,774,456 $ 29,702 $ 9,804,158
Net income — — 395,486 — 395,486 1,020 396,506
Other comprehensive loss — — — (37,532) (37,532) — (37,532)
Distributions paid and payable — — (973,128) — (973,128) (1,596) (974,724)
Share issuances, net of costs 27,564,163 1,817,978 — — 1,817,978 — 1,817,978
Contributions by noncontrolling interests
— — — — — 3,168 3,168
Reallocation of equity — 47 — — 47 (47) —
Share-based compensation, net 120,176 8,176 — — 8,176 — 8,176
Balance, December 31, 2020 361,303,445 $ 14,700,050 $ (3,659,933) $ (54,634) $ 10,985,483 $ 32,247 $ 11,017,730
Theaccompanyingnotestoconsolidatedfinancialstatementsareanintegralpartofthesestatementsandmaybefoundinthecompany’s2020Form10-K.
25
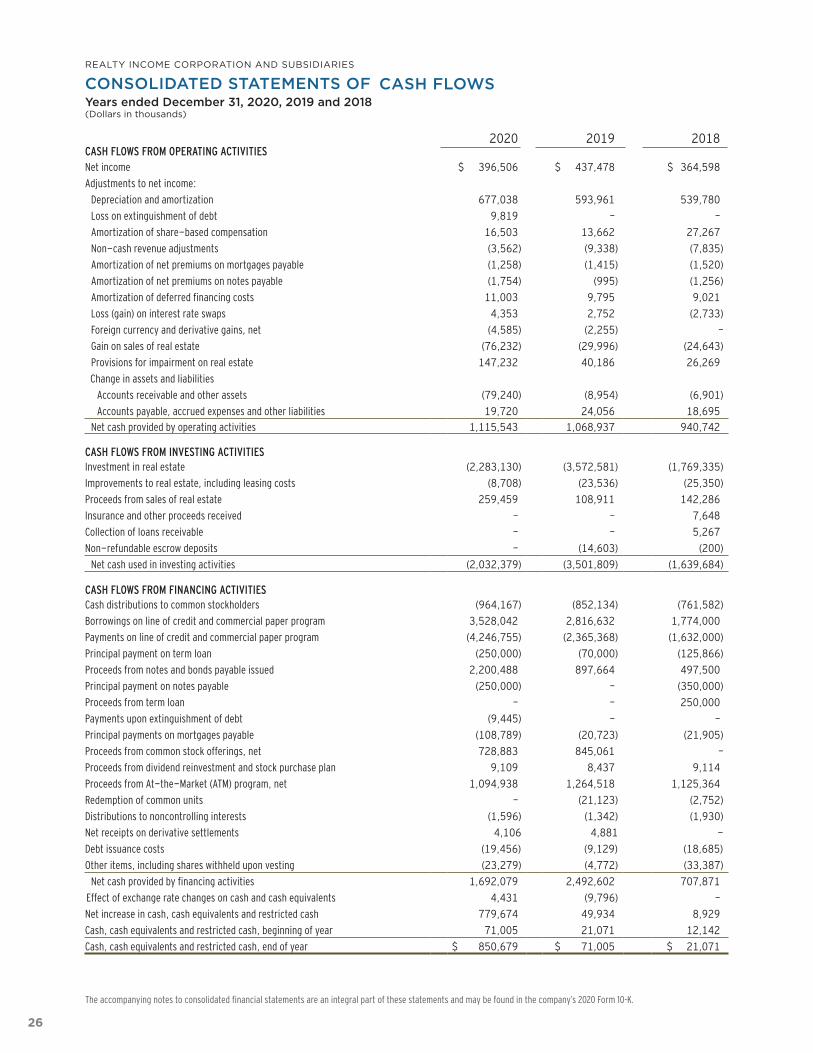
REALTY INCOME CORPORATION AND SUBSIDIARIES
CONSOLIDATED STATEMENTS OFYears ended December 31, 2020, 2019 and 2018(Dollars in thousands)
2020 2019 2018CASH FLOWS FROM OPERATING ACTIVITIESNet income $ 396,506 $ 437,478 $ 364,598
Adjustments to net income:
Depreciation and amortization 677,038 593,961 539,780
Loss on extinguishment of debt 9,819 — —
Amortization of share-based compensation 16,503 13,662 27,267
Non-cash revenue adjustments (3,562) (9,338) (7,835)
Amortization of net premiums on mortgages payable (1,258) (1,415) (1,520)
Amortization of net premiums on notes payable (1,754) (995) (1,256)
Amortization of deferred financing costs 11,003 9,795 9,021
Loss (gain) on interest rate swaps 4,353 2,752 (2,733)
Foreign currency and derivative gains, net (4,585) (2,255) —
Gain on sales of real estate (76,232) (29,996) (24,643)
Provisions for impairment on real estate 147,232 40,186 26,269
Change in assets and liabilities
Accounts receivable and other assets (79,240) (8,954) (6,901)
Accounts payable, accrued expenses and other liabilities 19,720 24,056 18,695
Net cash provided by operating activities 1,115,543 1,068,937 940,742
CASH FLOWS FROM INVESTING ACTIVITIESInvestment in real estate (2,283,130) (3,572,581) (1,769,335)
Improvements to real estate, including leasing costs (8,708) (23,536) (25,350)
Proceeds from sales of real estate 259,459 108,911 142,286
Insurance and other proceeds received — — 7,648
Collection of loans receivable — — 5,267
Non-refundable escrow deposits — (14,603) (200)
Net cash used in investing activities (2,032,379) (3,501,809) (1,639,684)
CASH FLOWS FROM FINANCING ACTIVITIESCash distributions to common stockholders (964,167) (852,134) (761,582)
Borrowings on line of credit and commercial paper program 3,528,042 2,816,632 1,774,000
Payments on line of credit and commercial paper program (4,246,755) (2,365,368) (1,632,000)
Principal payment on term loan (250,000) (70,000) (125,866)
Proceeds from notes and bonds payable issued 2,200,488 897,664 497,500
Principal payment on notes payable (250,000) — (350,000)
Proceeds from term loan — — 250,000
Payments upon extinguishment of debt (9,445) — —
Principal payments on mortgages payable (108,789) (20,723) (21,905)
Proceeds from common stock offerings, net 728,883 845,061 —
Proceeds from dividend reinvestment and stock purchase plan 9,109 8,437 9,114
Proceeds from At-the-Market (ATM) program, net 1,094,938 1,264,518 1,125,364
Redemption of common units — (21,123) (2,752)
Distributions to noncontrolling interests (1,596) (1,342) (1,930)
Net receipts on derivative settlements 4,106 4,881 -
Debt issuance costs (19,456) (9,129) (18,685)
Other items, including shares withheld upon vesting (23,279) (4,772) (33,387)
Net cash provided by financing activities 1,692,079 2,492,602 707,871
Effect of exchange rate changes on cash and cash equivalents 4,431 (9,796) —
Net increase in cash, cash equivalents and restricted cash 779,674 49,934 8,929
Cash, cash equivalents and restricted cash, beginning of year 71,005 21,071 12,142
Cash, cash equivalents and restricted cash, end of year $ 850,679 $ 71,005 $ 21,071
CASH FLOWS
Theaccompanyingnotestoconsolidatedfinancialstatementsareanintegralpartofthesestatementsandmaybefoundinthecompany’s2020Form10-K.
26
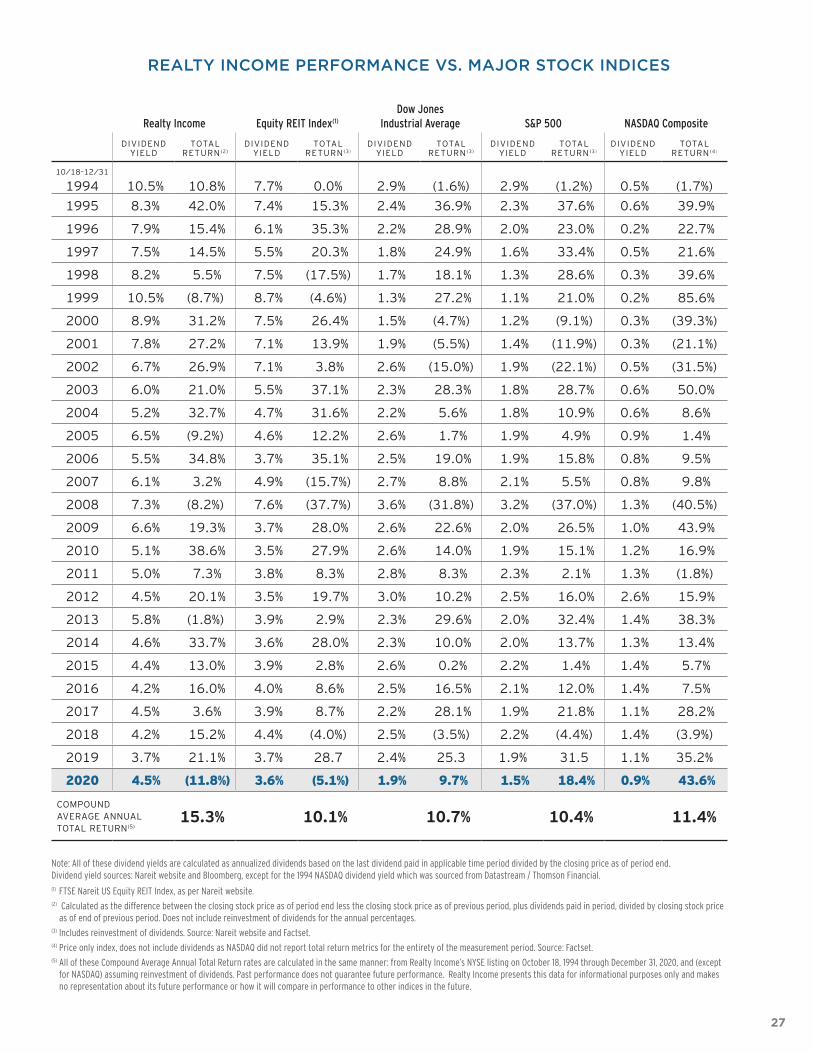
Note:Allofthesedividendyieldsarecalculatedasannualizeddividendsbasedonthelastdividendpaidinapplicabletimeperioddividedbytheclosingpriceasofperiodend.Dividendyieldsources:NareitwebsiteandBloomberg,exceptforthe1994NASDAQdividendyieldwhichwassourcedfromDatastream/ThomsonFinancial.(1) FTSENareitUSEquityREITIndex,asperNareitwebsite. (2)Calculatedasthedifferencebetweentheclosingstockpriceasofperiodendlesstheclosingstockpriceasofpreviousperiod,plusdividendspaidinperiod,dividedbyclosingstockprice
asofendofpreviousperiod.Doesnotincludereinvestmentofdividendsfortheannualpercentages. (3)Includesreinvestmentofdividends.Source:NareitwebsiteandFactset. (4)Priceonlyindex,doesnotincludedividendsasNASDAQdidnotreporttotalreturnmetricsfortheentiretyofthemeasurementperiod.Source:Factset. (5)AlloftheseCompoundAverageAnnualTotalReturnratesarecalculatedinthesamemanner:fromRealtyIncome’sNYSElistingonOctober18,1994throughDecember31,2020,and(except
forNASDAQ)assumingreinvestmentofdividends.Pastperformancedoesnotguaranteefutureperformance.RealtyIncomepresentsthisdataforinformationalpurposesonlyandmakesnorepresentationaboutitsfutureperformanceorhowitwillcompareinperformancetootherindicesinthefuture.
Realty Income Equity REIT Index(1)
Dow Jones Industrial Average S&P 500 NASDAQ Composite
DIVIDEND YIELD
TOTAL RETURN(2)
DIVIDEND YIELD
TOTAL RETURN(3)
DIVIDEND YIELD
TOTAL RETURN(3)
DIVIDEND YIELD
TOTAL RETURN(3)
DIVIDEND YIELD
TOTAL RETURN(4)
10/18–12/31 1994 10.5% 10.8% 7.7% 0.0% 2.9% (1.6%) 2.9% (1.2%) 0.5% (1.7%)
1995 8.3% 42.0% 7.4% 15.3% 2.4% 36.9% 2.3% 37.6% 0.6% 39.9%
1996 7.9% 15.4% 6.1% 35.3% 2.2% 28.9% 2.0% 23.0% 0.2% 22.7%
1997 7.5% 14.5% 5.5% 20.3% 1.8% 24.9% 1.6% 33.4% 0.5% 21.6%
1998 8.2% 5.5% 7.5% (17.5%) 1.7% 18.1% 1.3% 28.6% 0.3% 39.6%
1999 10.5% (8.7%) 8.7% (4.6%) 1.3% 27.2% 1.1% 21.0% 0.2% 85.6%
2000 8.9% 31.2% 7.5% 26.4% 1.5% (4.7%) 1.2% (9.1%) 0.3% (39.3%)
2001 7.8% 27.2% 7.1% 13.9% 1.9% (5.5%) 1.4% (11.9%) 0.3% (21.1%)
2002 6.7% 26.9% 7.1% 3.8% 2.6% (15.0%) 1.9% (22.1%) 0.5% (31.5%)
2003 6.0% 21.0% 5.5% 37.1% 2.3% 28.3% 1.8% 28.7% 0.6% 50.0%
2004 5.2% 32.7% 4.7% 31.6% 2.2% 5.6% 1.8% 10.9% 0.6% 8.6%
2005 6.5% (9.2%) 4.6% 12.2% 2.6% 1.7% 1.9% 4.9% 0.9% 1.4%
2006 5.5% 34.8% 3.7% 35.1% 2.5% 19.0% 1.9% 15.8% 0.8% 9.5%
2007 6.1% 3.2% 4.9% (15.7%) 2.7% 8.8% 2.1% 5.5% 0.8% 9.8%
2008 7.3% (8.2%) 7.6% (37.7%) 3.6% (31.8%) 3.2% (37.0%) 1.3% (40.5%)
2009 6.6% 19.3% 3.7% 28.0% 2.6% 22.6% 2.0% 26.5% 1.0% 43.9%
2010 5.1% 38.6% 3.5% 27.9% 2.6% 14.0% 1.9% 15.1% 1.2% 16.9%
2011 5.0% 7.3% 3.8% 8.3% 2.8% 8.3% 2.3% 2.1% 1.3% (1.8%)
2012 4.5% 20.1% 3.5% 19.7% 3.0% 10.2% 2.5% 16.0% 2.6% 15.9%
2013 5.8% (1.8%) 3.9% 2.9% 2.3% 29.6% 2.0% 32.4% 1.4% 38.3%
2014 4.6% 33.7% 3.6% 28.0% 2.3% 10.0% 2.0% 13.7% 1.3% 13.4%
2015 4.4% 13.0% 3.9% 2.8% 2.6% 0.2% 2.2% 1.4% 1.4% 5.7%
2016 4.2% 16.0% 4.0% 8.6% 2.5% 16.5% 2.1% 12.0% 1.4% 7.5%
2017 4.5% 3.6% 3.9% 8.7% 2.2% 28.1% 1.9% 21.8% 1.1% 28.2%
2018 4.2% 15.2% 4.4% (4.0%) 2.5% (3.5%) 2.2% (4.4%) 1.4% (3.9%)
2019 3.7% 21.1% 3.7% 28.7 2.4% 25.3 1.9% 31.5 1.1% 35.2%
2020 4.5% (11.8%) 3.6% (5.1%) 1.9% 9.7% 1.5% 18.4% 0.9% 43.6%
COMPOUND AVERAGE ANNUAL TOTAL RETURN(5)
15.3% 10.1% 10.7% 10.4% 11.4%
REALTY INCOME PERFORMANCE VS. MAJOR STOCK INDICES
27
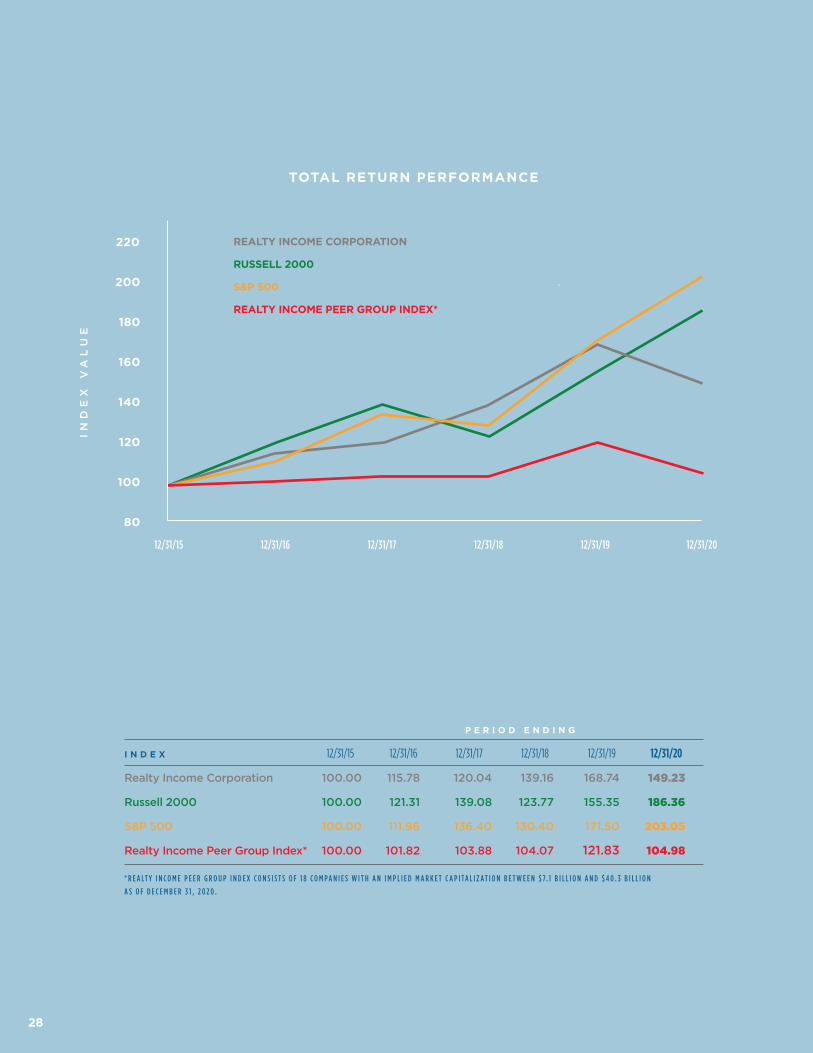
* R E A L T Y I N C O M E P E E R G R O U P I N D E X C O N S I S T S O F 1 8 C O M P A N I E S W I T H A N I M P L I E D M A R K E T C A P I T A L I Z A T I O N B E T W E E N $ 7. 1 B I L L I O N A N D $ 4 0 . 3 B I L L I O N
A S O F D E C E M B E R 3 1 , 2 0 2 0 .
P E R I O D E N D I N G
I N D E X 12/31/15 12/31/16 12/31/17 12/31/18 12/31/19 12/31/20
Realty Income Corporation 100.00 115.78 120.04 139.16 168.74 149.23
Russell 2000 100.00 121.31 139.08 123.77 155.35 186.36
S&P 500 100.00 111.96 136.40 130.40 171.50 203.05
Realty Income Peer Group Index* 100.00 101.82 103.88 104.07 121.83 104.98
TOTALRETURNPERFORMANCE
REALTYINCOMECORPORATION
RUSSELL2000
S&P500
REALTYINCOMEPEERGROUPINDEX*
IN
DE
X V
AL
UE
80
12/31/15 12/31/16 12/31/17 12/31/18 12/31/19
100
120
140
160
180
200
220
12/31/20
28

T R A N S F E R A G E N T
For shareholder administration and account
information, please visit Computershare’s
website at www.computershare.com or
call toll-free at 1-877-218-2434.
I N D E P E N D E N T R E G I S T E R E D
P U B L I C A C C O U N T I N G F I R M
KPMG LLP
San Diego, CA
F O R A D D I T I O N A L
C O R P O R AT E I N F O R M AT I O N
Visit the Realty Income corporate
website at www.realtyincome.com
Contact your financial advisor,
or Realty Income at:
877-924-6266
Copies of Realty Income’s Annual Report
are available upon written request to:
REALTY INCOME CORPORATION
Attention: Investor Relations
11995 El Camino Real
San Diego, CA 92130
C O M PA N Y I N F O R M AT I O N
B O A R D O F D I R E C T O R S
Michael R. PfeifferExecutive Vice President, Chief Administrative Officer
Neil AbrahamExecutive Vice President, Chief Strategy Officer
Scott KohnenSenior Vice President, Research
Shannon KehleSenior Vice President, Human Resources
Ed NogueraManaging Director, Head of Europe
Jonathan PongSenior Vice President, Head of Corporate Finance
Benjamin N. FoxExecutive Vice President, Asset Management & Real Estate Operations
Mark HaganExecutive Vice President, Chief Investment Officer
Shannon JensenSenior Vice President, Associate General Counsel and Assistant Secretary
Ross EdwardsSenior Vice President, Leasing & Real Estate Operations
Janeen S. DrakulichSenior Vice President, Development
TJ ChunSenior Vice President, Investments & Head of Asset Management
Lori SatterfieldSenior Vice President, Associate General Counsel, Asset Management & Real Estate Operations
E X E C U T I V E & S E N I O R O F F I C E R S
Sumit RoyPresident & Chief Executive Officer
Kristin FerrellVice President, Head of Lease Administration
Greg AzarVice President, Head of Property Management
John R. CouvillionVice President, Development
Austin DeLanaVice President, International Investments
Kyle CampbellVice President, Senior Legal Counsel, Risk Management
Elizabeth CateVice President, Asset Management
Jill CossasboomVice President, Assistant Controller, Systems
Steve BurchettVice President, Senior Legal Counsel
Goran BistricVice President, Strategy
Michael LeeVice President, Tax Director
Jonathan KresserVice President, Finance Operations
A D D I T I O N A L O F F I C E R S
Ann ZhangVice President, Assistant Controller, Property Accounting
April LittleVice President, Acquisitions
Cary WenthurSenior Vice President, Managing Director - Acquisitions
Michelle BushoreExecutive Vice President, Chief Legal Officer, General Counsel and Secretary
Christie KellyExecutive Vice President, Chief Financial Officer and Treasurer
Matt RennerVice President, Assistant Controller, Corporate Accounting
Garret PavelkoVice President, Asset Management, Office & Industrial
Joe StewartVice President, Information Technology
Kathleen R. Allen, Ph.D.Founding Director, Center for Technology Commercialization,University of Southern California
Gerardo I. LopezOperating Partner and Head of the Operating Group, SoftBank Investment Advisers
Michael D. McKeeNon-Executive ChairmanPrincipal, The Contrarian Group
Priya Cherian HuskinsSenior Vice President and Partner, Woodruff-Sawyer & Co.
Reginald H. GilyardSenior Advisor, Boston Consulting Group, Inc
A. Larry ChapmanRetired, Executive Vice President,Head of Commercial Real Estate,Wells Fargo Bank
Ronald L. MerrimanRetired Vice Chair and Partner, KPMG LLP
Sumit RoyPresident & Chief Executive Officer
Gregory T. McLaughlinChief Executive Officer, PGA TOUR First Tee Foundation
Sean P. NugentSenior Vice President, Controller

Re
1 1 9 9 5 E L C A M I N O R E A L
S A N D I E G O , C A 9 2 1 3 0
W W W . R E A L T Y I N C O M E . C O M
R E A L T Y I N C O M E