Embed Size (px)
Citation preview

Building Dynamic BrandsAnnual Report 2011


1
Contents 2 Corporate Information
3 Chairman’s Statement
4 Group Managing Director’s Report
8 QAF Subsidiaries and
Associated Companies
10 Board of Directors
Operational Review
14 Bakery
20 Primary Production
24 Trading & Logistics
26 Other Investments
28 Our Brands
29 Corporate Governance Report
38 Supplementary Information
46 Financial Contents
148 List of Major Properties
151 Statistics of Shareholdings
153 Notice of Annual General Meeting
157 Notice of Books Closure Date
Proxy Form

Corporate Information (As at 16 March 2012)
Board of DirectorsMr Didi Dawis (Chairman)Mr Andree Halim (Vice-Chairman)Mr Tan Kong King (Group Managing Director)Ms Tarn Teh ChuenMr Kelvin Chia Hoo KhunMr Tan Hin HuatMr Soh Gim TeikMr Lin KejianMr Triono J. Dawis
Audit CommitteeMr Tan Hin HuatMr Kelvin Chia Hoo KhunMr Soh Gim Teik
Nominating CommitteeMr Kelvin Chia Hoo KhunMr Tan Kong KingMr Tan Hin Huat
Remuneration CommitteeMr Kelvin Chia Hoo KhunMr Tan Hin HuatMr Didi Dawis
SecretaryMs Lee Woan Ling
Registered and Corporate Office150 South Bridge Road #09-04 Fook Hai Building Singapore 058727Tel : 6538 2866Fax : 6538 6866
Place of IncorporationSingapore
Date of Incorporation3 March 1958
Company Registration No.195800035D
RegistrarTricor Barbinder Share Registration Services (A division of Tricor Singapore Pte Ltd)80 Robinson Road #02-00Singapore 068898Tel : 6236 3333Fax : 6236 4399
AuditorsErnst & Young LLPOne Raffles QuayNorth Tower, Level 18Singapore 048583
Audit PartnerMr Daniel Soh (Since the financial year ended 31 December 2007)
Principal BankersDBS Bank LimitedRabobank InternationalStandard Chartered BankUnited Overseas Bank Limited
2

Despite a favourable start to 2011, the global economic recovery ran into the headwinds of escalating commodity prices, soaring food costs and the spectre of a contagion crisis in the eurozone.
World oil prices climbed amid heightened Middle East tensions and the Group grappled with the challenges of increasing fuel and raw material costs. I am pleased to report that our businesses remained resilient and was able to build on its momentum to record buoyant increases in sales from all its major business segments.
Our strong performance during the year enabled the company to reward shareholders with an interim dividend payment of 1 cent per share.
For the financial year ended 31 December 2011, the Board of Directors has recommended a final dividend of 4 cents per share. The total dividend payout of 5 cents is an increase of 25% over the previous year’s dividend of 4 cents.
On behalf of the Board, I would like to express my sincere appreciation to our bankers, suppliers, customers, business associates, management and staff, and shareholders for their dedication and loyal support.
DIDI DAWISChairman16 March 2012
Dear Shareholders,
Chairman’s Statement
3

Group Managing Director’s Report
“ Gardenia was voted most favourite bread in the Superbrands 2011 consumers’ survey of Malaysia’s Top Ten Favourite Brands, securing an enviable third-place ranking. ”
Growth in the global economy moderated after a strong performance in 2010, derailed by high commodity and grain prices, soaring inflation, the earthquake and tsunami in Japan and the spillover effects of the eurozone sovereign debt crisis. Turmoil in oil producing countries pushed up oil prices, and global food costs rose to a record high. The general uncertainty impacted businesses, slowing the global recovery. Singapore’s economy was not spared as exports fell in line with constrained demand in the developed markets.
Despite high fuel and raw ingredient input costs, our businesses continued to grow strongly as we were able to successfully manage our cost base whilst maintaining our competitiveness and high standards.
I am pleased to report that the Group delivered a sterling result, posting strong sales growth from all our major business segments – Bakery, Primary Production and Trading & Logistics.
Group revenue for the financial year ended 31 December 2011 (‘FY2011’) climbed 14% to $977.0 million from $856.4 million for the financial year ended 31 December 2010 (‘FY2010’). This was achieved through expansion into new markets, increased market share, development and launch of new products, increased sales of higher value-added products, and the opening of new production facilities.
Despite fierce competition from other bread brands, Gardenia continued to lead the Singapore, Malaysian and Philippine bread markets as the top-selling brand of packaged bread.
In Malaysia, sales of Gardenia bread achieved new highs as we widened our distribution to over 23,000 outlets. Our commitment to producing top quality bread garnered 2 consumer-voted awards.
Gardenia was voted most favourite bread in the Superbrands 2011 consumers’ survey of Malaysia’s Top Ten Favourite Brands, securing an enviable third-place ranking. The survey covered over 500 of Malaysian consumers’ favourite brands across 100 consumer product and services categories.
Gardenia also received a Gold for a second consecutive year in the Putra Brand Awards 2011 as Malaysian consumers’ most preferred bread brand.
Gardenia Bakeries (Philippines) Inc (‘Gardenia Philippines’) turned in a record sales growth of 25%, out-performing a market that grew by 10% and setting a new benchmark for the bakery industry. Our new plant at Cebu also completed a successful first full-year of operations, further expanding our geographical footprint in the Visayas and Mindanao markets.
During the year, Gardenia Philippines bagged all 3 awards in the Search for Model Company organized by the Philippine Department of Trade and Industry – Center for Industrial Competitiveness. Gardenia Philippines was the only company to win all 3 Pro-Active Programs Achievement Awards in the categories of Labor Management Relations, Family Welfare/Community Relations Programs, and Quality and Productivity.
4

In Singapore, Gardenia Foods (S) Pte Ltd continued to grow its market by expanding its reach into the food service industry and securing contracts to supply buns to several popular fast food chains.
In Australia, our bakery operations under Bakers Maison Australia Pty Ltd (‘Bakers Maison’) turned in pleasing results with sales growing by more than 15% over the previous year. Bakers Maison is a specialist manufacturer of authentic French-style breads, pastries and sweets in Sydney. During the year, the company streamlined and simplified its operations to focus on the production of frozen and par-baked bakery items and successfully clinched a number of new supply contracts for the food service sector.
Our fully integrated Primary Production operations in Australia under Rivalea (Australia) Pty Ltd (‘Rivalea’) achieved robust revenue growth due to increased sales of its branded and valued-added products, increased market share, entry into new supply chains and a full-year’s contribution from Coral Park Pastoral Meat Trading, our meat distribution business in Sydney. During the year, the boning rooms at Corowa and Melbourne were upgraded with increased capacity to meet the growing demand requirements of our value-added segment.
The Trading & Logistics segment under Ben Foods (S) Pte Ltd (‘Ben Foods’) also recorded healthy growth with increases in sales revenues from its trading activities in the domestic and export markets, and rental income from 4 new freezer rooms at its cold storage facility. Ben Foods’ proprietary brands of food and beverage products are Cowhead, Farmland, Haton, Spices of the Orient and Orchard Fresh.
Group profit before taxation increased by a credible 15% to $81.7 million for FY2011, compared to $70.9 million for FY2010.
Trading conditions during the year were challenging with the prices of flour, raw material food ingredients, utilities, fuel and diesel costs rising worldwide. The Group was beset by escalating raw material and fuel input costs which pushed production costs to unrealistically high levels.
The healthy sales growth from our bakery operations in Malaysia, the Philippines, and Australia, which would normally have translated into a commensurate increase in profitability, was adversely impacted by the exceptionally high raw material and fuel input costs. This resulted in a decline in margins and a lower contribution to profit.
The Malaysian bakery operations saw higher costs and expenses associated with the commissioning and initial operations of its new bread plant. To help us develop the best products for our customers, we set up a new bread plant in Malaysia to formulate and test market new food products for our bakery operations in the region.
5

Group Managing Director’s Report continued
The plant, which also supports our Singapore bakery operations, is owned by Bakers Maison (M) Sdn Bhd (‘Bakers Maison Malaysia’), a wholly owned subsidiary. During the year, Bakers Maison Malaysia developed and launched a new line of waffles into the Malaysian market that was
very well received.
Rivalea’s strategy of focusing on the sales of branded and value-added products
in order to protect its overall margins proved to be a success. The company enjoyed an improvement in profitability enabling it to make a contribution to Group profit. Rivalea’s meat products are sold under the brand names of Murray Valley, High Country, Family Chef and Riverview Farms.
Costs of materials increased by 19% to $541.8 million in FY2011 as compared to $455.6 million in FY2010. The higher costs of raw materials arose from Rivalea’s increased meat trading business activities and new production activities from the Bakers Maison Malaysia plant.
Share of profits of associates was $0.04 million for FY2011, as compared to a share of losses of $1.8 million in FY2010. This resulted from the cessation of the loss-making operations of Challenge Australian Dairy Pty Ltd, a dairy product manufacturing associate in Australia.
There was a write-back of allowance for doubtful debts that was previously provided on advances made to a former associate, Shaanxi Hengxing Fruit Juice Co Ltd. The provision is no longer required as the Group sold its interest in this associate in FY2011 and obtained repayment of the advances.
Group taxation increased by 12% to $15.7 million in FY2011, as compared to $14.1 million in FY2010, in line with the Group’s higher profitability.
Group profit after taxation rose by 16% to $65.9 million for FY2011, compared to $56.8 million for FY2010.
The higher profit after taxation saw earnings per share rise to 11.6 cents from 10 cents. The Group’s net asset value per share increased by 9.3%, from 68.5 cents to 74.9 cents.
In our pursuit for corporate and business excellence, we have not forgotten to give back to society. Our corporate social responsibility efforts extend to the communities within which we operate and we support those communities by giving to various charities and social causes.
Our Gardenia operations regularly sponsor school, welfare and community events in their respective markets. To promote healthy lifestyles and good eating habits, Gardenia also participates in community outreach and social responsibility initiatives, including collaborations with hospitals and health organizations. It also donates bread and basic food items to the underprivileged and victims of natural disasters.
The global economic outlook is fraught with uncertainty as Middle East tensions and sovereign debt problems in the euro area continue to be major factors influencing developments in the global economy.
Singapore and the major Asian economies are expected to see slower growth on weaker export demand and policy tightening, while businesses grapple with the uncertainty of a prolonged global slowdown and recession.
6

Group Managing Director’s Report continued
7
However, we believe we have built a strong market position and have the organisational ability to meet the challenges ahead and respond effectively to an ever-changing business and economic environment. Our strong market position and core portfolio of businesses have established a solid foundation for our continued growth and expansion into existing and new markets.
We will continue to streamline our operations to create a more focused, innovative and cost-effective business so as to remain competitive in a changing business environment. We will proactively manage our cost base and mitigate the impact of high raw material prices through increased operational and manufacturing efficiencies and higher sales volumes. We will enhance our product innovation and continue to create products that meet the current trends of health and wellness, and convenience.
We are cautiously optimistic for the future. There are early indications that global raw material costs may ease and this will relieve the pressure on margins. Barring unexpected shocks to the economic and business environment, we are hopeful that the Group will achieve an encouraging level of profitability in the coming year.
TAn Kong KIngGroup Managing Director16 March 2012
7

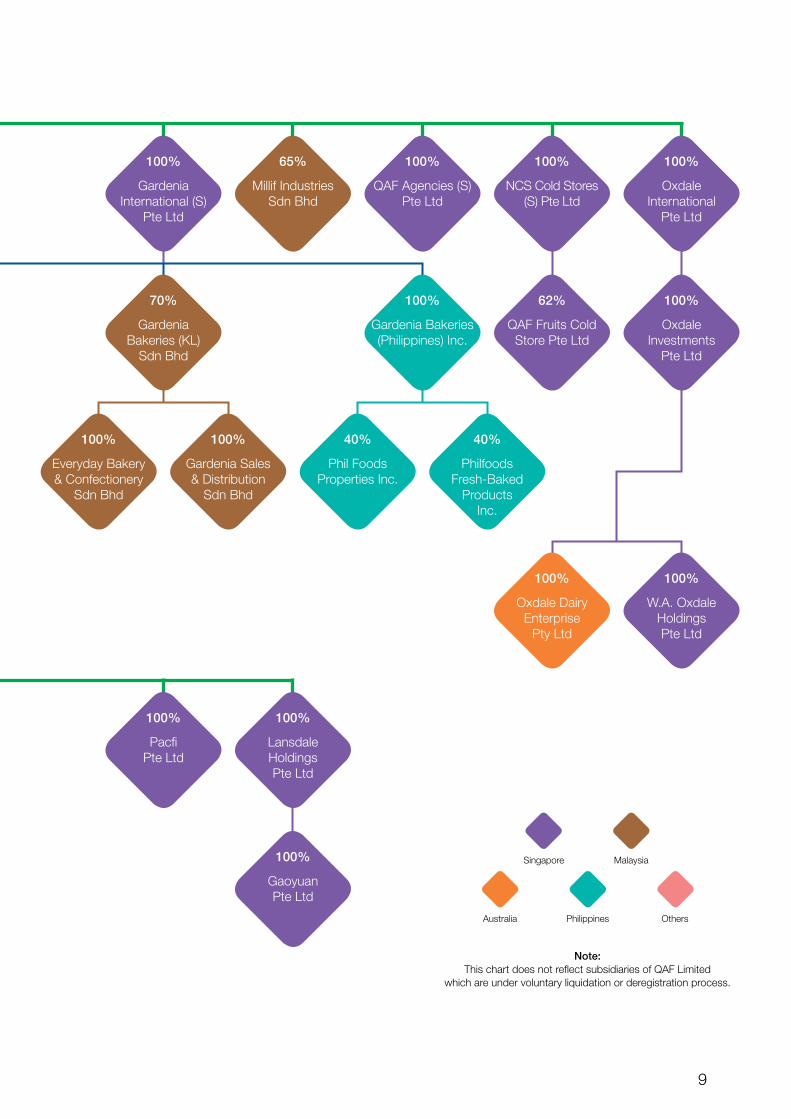
QAF Subsidiaries and Associated Companies (As at 16 March 2012)
100%
GardeniaInvestments
Pte Ltd
100%
Bakers MaisonPty Ltd
100%
Bakers Maison Australia
Pty Ltd
100%
Gardenia (China) Holdings
Pte Ltd
100%
Edenc Pte Ltd
100%
Hengxing FruitJuice (Singapore)
Pte Ltd
100%
HamsdaleAustralia Pty Ltd
100%
Bakers MaisonPte Ltd
100%
Bakers Maison (M) Sdn Bhd
100%
Delicia Sdn Bhd
100%
Bonjour BakeryPte Ltd
80%
Diamond ValleyPork Pty Ltd
100%
Rivalea (Australia)Pty Ltd
100%
EdencInternational
Pte Ltd
100%
ShinefoodsPte Ltd
100%
HamsdaleInternational
Pte Ltd
100%
Ben Foods(East Malaysia)
Sdn Bhd
100%
Auspeak HoldingsPte Ltd
100%
GardeniaHong Kong Ltd
100%
Gardenia Foods (S) Pte Ltd
100%
Ben Foods (S) Pte Ltd
100%
Farmland Central Bakery
(S) Pte Ltd
8
100%
Everyday Bakery& Confectionery
Sdn Bhd
100%
Gardenia Sales& Distribution
Sdn Bhd
40%
PhilfoodsFresh-Baked
Products Inc.
40%
Phil FoodsProperties Inc.
100%
Oxdale DairyEnterprise
Pty Ltd
100%
W.A. OxdaleHoldings Pte Ltd
100%
GaoyuanPte Ltd
Note: This chart does not reflect subsidiaries of QAF Limited
which are under voluntary liquidation or deregistration process.
Australia Philippines Others
Singapore Malaysia
100%
LansdaleHoldingsPte Ltd
100%
PacfiPte Ltd
65%
Millif IndustriesSdn Bhd
100%
OxdaleInternational
Pte Ltd
100%
NCS Cold Stores (S) Pte Ltd
100%
QAF Agencies (S) Pte Ltd
100%
GardeniaInternational (S)
Pte Ltd
70%
Gardenia Bakeries (KL)
Sdn Bhd
100%
Gardenia Bakeries(Philippines) Inc.
100%
OxdaleInvestments
Pte Ltd
62%
QAF Fruits ColdStore Pte Ltd
9

Board of Directors
10
7
2
5
1
4
9
3
8
6

1. DIDI DAwIS, 66Chairmannon-executive Director
DAte Of lASt eleCtION 29 April 2010
BOARD COmmIttee Remuneration Committee (Member)
Mr Dawis was appointed as a Director of the Company on 15 March 1988 and has been holding the position as Chairman of the Company since July 1990.
As an established entrepreneur, Mr Dawis has various business interests in Indonesia including being the sole franchise holder of Video Ezy, as well as businesses involved in the trading and distribution of building materials, real estate development (including hotel and resort). He was also the owner and joint-venture partner of a news magazine and a newspaper in Indonesia for some 8 years. Mr Didi Dawis is a member in the councils of several charitable and civic associations in Indonesia, the Permanent Honorary Chairman of Indonesia Chinese Entrepreneur Association and the chairman of the International Association of Fuqing Clansmen.
Mr Didi Dawis is a substantial shareholder of the Company and has a deemed interest of 8.83% in the total issued shares of the Company as at 16 March 2012.
2. ANDRee HAlIm, 64Vice-Chairmannon-executive Director
DAte Of lASt eleCtION30 April 2009
BOARD COmmItteeNil
Mr Halim was appointed as a Director and Vice Chairman of the Company on 11 October 2003.
Mr Halim graduated with a diploma in Business Studies from the South East London Technical College of United Kingdom. Mr Halim is an established entrepreneur and has investments in a wide range of businesses. He also sits on the board of directors of several private enterprises that he invested in.
Mr Andree Hal im is the major substant ia l shareho lder o f the Company, having a total deemed interest of 62.20% in the total issued shares of the Company as at 16 March 2012.
Past 3 years’ directorship in other listed company• Bei j ing Properties (Holdings)
Limited (formerly known as Peaktop International Holdings Limited), listed on the Hong Kong Stock Exchange
3. tAN KONg KINg, 61group Managing DirectorExecutive Director
DAte Of lASt eleCtION Not subject to annual re-election
BOARD COmmIttee Nominating Committee (Member)
Mr Tan was first appointed as a non-executive Director of the Company on 15 June 1995 and assumed the position as the Group Managing Director of the QAF Group in January 1996.
Since 1996, Mr Tan has streamlined and refocused the QAF Group in the food industry, expanding the Group’s existing bakery segment in markets where there are long term demand and prospects, disposing off the various insignificant non-food related operations and leading the QAF Group to focus on various food related sectors, which set the ground for the Group’s further growth and expansion.
In the early part of his career, Mr Tan had worked for a number of years with an international accounting firm. Subsequent to which he joined and assumed the managing directorship for the KMP Private Ltd group of companies (a Southeast Asia conglomerate) from 1981 to 2004. Mr Tan has over 31 years of experience in managing group operations and over 16 years of experience in listed group to-date.
Mr Tan holds a B.Sc. Economics degree from the London School of Economics, University of London.
11

Board of Directors continued
4. tARN teH CHueN, 52Executive Director
DAte Of lASt eleCtION 29 April 2010
BOARD COmmIttee Nil
Ms Tarn was appointed as a Director on 15 June 1995.
Ms Tarn has been an executive Director and the Head of Treasury for the QAF Group since 1998 taking charge of the planning and management of group financing matters. Prior to this appointment, Ms Tarn was an accountant in the KMP Private Ltd group of companies and she assumed the post as the conglomerate’s group financial controller from 1990 to 2004. She has over 21 years of experience in treasury matters and group financing to-date.
Ms Tarn graduated with a Bachelor of Accountancy degree from the National University of Singapore.
5. KelvIN CHIA HOO KHuN, 60non-executive/Independent Director
DAte Of lASt eleCtION 29 April 2011
BOARD COmmItteeS Audit Committee (Member)Remuneration Committee (Chairman)Nominating Committee (Chairman)
Mr Chia was appointed as an independent Director of the Company on 25 January 2000.
Mr Chia is the managing partner of Kelvin Chia Partnership, a regional law firm with offices in Singapore, Vietnam, Japan, China, Thailand, Cambodia and North Korea. His areas of specialization include international commercial and corporate transactions, cross-border dispute resolution and the foreign investment laws of various developing countries in the region. Mr Chia is also a director of Bausch & Lomb Singapore Pte Ltd, ECCO China Wholesale Holding (Singapore) Pte Ltd and many other leading private companies. Mr Chia holds a Bachelor of Law degree from the University of Singapore.
Additionally, he sits on the Singapore Business Federation’s SMEC Sub-Committee on Internationalisation and Market Access.
Current directorships in other listed companies• ScorpioEastHoldingsLtd• Unionmet(Singapore)Ltd
6. tAN HIN HuAt, 59 non-executive/Independent Director
DAte Of lASt eleCtION30 April 2009
BOARD COmmItteeSAudit Committee (Chairman)Remuneration Committee (Member)Nominating Committee (Member)
Mr Tan was appo in ted as an independent Director of the Company on 2 September 2002.
Mr Tan is a Senior Director of Credit Agricole (Suisse) SA, Singapore Branch. He has more than 31 years of working experience in regional banking business covering the area of corporate banking, trade finance and private banking. Prior to joining Credit Agricole (Suisse) SA, he was a Senior Vice President of EFG Bank Ltd, Singapore Branch for over 9 years. He had also worked for a number of other major international banks including ING Bank N.V., American Express Bank, Chemical Bank and Credit Lyonnais.
Mr Tan holds a Bachelor of Commerce degree from Nanyang University, Singapore.
12

7. SOH gIm teIK, 57non-executive/Independent Director
DAte Of lASt eleCtION29 April 2010
BOARD COmmItteeAudit Committee (Member)
Mr Soh was appointed as an independent Director of the Company on 11 May 2009.
Mr Soh graduated in 1978 with a degree in Bachelor of Accountancy. He had practised as a public accountant and also had many years of working experience with a listed entity as a finance director/chief financial officer. Mr Soh is a member of the Institute of Certified Public Accountants of Singapore (“ICPAS”) and was previously the Chairman of the CFO Committee of ICPAS. He is currently a Board and Governing Council member of the Singapore Institute of Directors and had also served as a committee member of the Professional Accountants in Business Committee of the International Federation of Accountants.
Mr Soh is also an independent director in four other companies (as named below) listed on the Singapore Stock Exchange.
Current directorships in other listed companies• AdvancedHoldingsLtd• BBRHoldings(S)Ltd• CraftPrintInternationalLimited• UMSHoldingsLimited
Past 3 years’ directorship in other listed company• Heng Long International Ltd (a
company delisted from Singapore Stock Exchange on 20 December 2011)
8. lIN KejIAN, 33 Executive Director
DAte Of lASt eleCtION29 April 2011
BOARD COmmItteeNil
Mr Lin Kejian was initially appointed as a non-executive Director of the Company on 1 December 2007. On 10 October 2010, he was re-designated as an executive Director of the Company holding the post of Operations director.
Prior to him joining the Company, Mr Lin was the business manager of Culindo Livestock (1994), a family-owned private enterprise, whose principal activity is that of importer and supplier of live pigs to Singapore. Mr Lin had previously been a director of several private enterprises which he and/or his family has an interest.
Mr Lin graduated with a degree in Business Administration (major in Finance) from California State University, Los Angeles.
Mr Lin is the son of Mr Andree Halim, a Director cum Vice Chairman of the Company. He is also a substantial shareholder of the Company, having a total deemed interest of 39.99% in the total issued shares of the Company as at 16 March 2012.
9. tRIONO j. DAwIS, 30Executive Director
DAte Of lASt eleCtION29 April 2011
BOARD COmmIttee Nil
Mr Triono Dawis was appointed as an executive Director and a Business Development director of the Company on 1 October 2010.
Mr Dawis graduated with a Bachelor of Science degree in Business Administration from the University of California, Berkeley, California.
Prior to joining the Company, Mr Dawis was involved as a business development director in the various business enterprises in Indonesia owned by his family, ranging from business in food industry, real estate development, trading to video rental franchising.
Mr Triono Dawis is the son of Mr Didi Dawis, a Director cum Chairman of the Company.
13

Operational Review
14

Operational Review Bakery
SINgAPOReGardenia FoodS (S) PTe LTd (‘Gardenia SinGaPore’)
Gardenia Singapore dominates the local bread market with a wide variety of breads, buns and rolls. Gardenia and Bonjour are Singapore’s best-selling brands of packaged bread, widely popular for their diverse range of bakery items.
Despite a challenging year in a highly competitive marketplace marked by escalating fuel, raw material and operating costs, Gardenia Singapore delivered healthy sales volumes underpinned by the launch of new innovative products, successful marketing initiatives and expanded distribution channels. During the year, Gardenia Singapore expanded its reach into the food service industry, supplying specially baked buns to several popular fast food chains. The company plans to develop and expand this new area of business to maximise production capacity and generate new revenue streams.
Gardenia Singapore is committed to the promotion of healthy eating initiatives. To encourage more consumers to eat whole grains, the company’s research team formulated an innovative white bread made with 50% wholemeal flour – the Gardenia Super Soft & Fine Enriched Wholemeal White Bread. Launched in
February 2011, the Gardenia Super Soft & Fine Enriched Wholemeal White Bread enabled consumers to enjoy the nutritional goodness of whole grains without the grainy texture.
The company keeps abreast of consumers’ fast-changing tastes when developing its products. To offer a diverse variety of bakery items, the company expanded its range of flat breads in July 2011 with 2 types of wraps, the Gardenia Wraps and Gardenia Wholemeal Wraps. The wraps provide consumers with an alternative to sandwich bread and buns, enabling them to prepare fast, tasty and convenient meals. The response has been positive and the company will be looking into the development of other types of flat breads. In August 2011, the company launched 2 buns – the Gardenia Twist Bun in Chocolate flavour and the Gardenia Twist Bun in Pandan Custard flavour. The buns are produced using a special lamination dough process that gives them an extra soft texture, making them popular with both adults and children.
During the year, Gardenia Singapore further expanded its distribution network and market coverage with the installation of 40 additional bread vending machines at various locations in Singapore. The company currently has 200 vending machines located in condominiums, corporations, hostels and premises of several Residents’ Committees. The vending machines not only provide
15

Operational Review continued
consumers with fresh bread round the clock, but are powerful marketing tools, greatly enhancing Gardenia’s brand presence and visibility. The company plans to further expand this area of retailing by installing new vending machines in strategic locations and enhancing its product mix.
To maintain its competitive edge in a difficult market environment, the company ran a major promotion campaign to increase sales and reward its customers. The ‘Health is Wealth Lucky Draw’ offered attractive cash prizes worth up to $50,000 and received an overwhelming response.
The Gardenia brand is a name synonymous with wholesome family values, healthy lifestyles and good eating habits. To reinforce its brand positioning, the company continued its participation in the Kindness campaign initiated by the Singapore Kindness Movement. Specially packaged loaves carrying an ‘Appreciate Someone this Christmas’ overband were sold at a special price to encourage consumers to spread the values of care, compassion and neighbourliness by buying them as gifts in conjunction with the campaign.
The company also participated in various community outreach and social responsibility initiatives centered on food, nutrition, health and education. To encourage good eating habits amongst children and youth, the company continued its sponsorship of both the Sandwich Making Competition and Nutrition Skit segments in various schools through the annual School Health Fair program organized by the Health Promotion Board. Other public outreach activities included healthcare events such as World Diabetics Day, World Osteoporosis Day and SingHealth’s Women’s Forum.
The company interacts with consumers through the hosting of daily bakery tours at its plant. In 2011, close to 10,000 people visited the Gardenia plant at Pandan Loop. It also organizes annual get-together events for its Homemakers Club members with activities centred on healthy eating and nutrition.
For the year ahead, Gardenia Singapore will continue to focus its resources and capabilities on product innovation and strategic brand enhancement activities. The company will continue to strive for greater operational efficiency and will seek to capitalize on business expansion opportunities in order to maintain its leadership position in the Singapore bakery market.
mAlAySIA Gardenia BakerieS (kL) Sdn BHd (‘GBkL’)
GBKL is the largest bakery operation in South-East Asia. It has 10 fully automated production lines comprising 5 bread lines and 5 bun, roll and cake lines with a total machine capacity of over 700 million units of baked products per annum. GBKL is a 70% - owned subsidiary of the QAF Group.
Turnover for FY2011 achieved a new high of RM696.6 million, growing by 13.7% over the previous year. Despite a competitive environment and increases in the costs of ingredients and raw materials, growth was driven by higher productivity and operational efficiencies, new product launches as well as growth of its existing product range.
16

Bakery
GBKL strives to develop products that meet consumers’ changing tastes and needs. In September 2011, it launched the Delicia Waffles range of tasty, ready-to-eat breakfast waffles. The waffles come in 5 variants – Fresh Egg Vanilla, Blueberry, Banana, Maple Wholemeal & Classic Cinnamon flavours. Sold in 2-piece packs for convenience, the waffles were an instant hit with consumers for their delicious, fresh-from-the-oven taste.
During the year, the company continued to expand its footprint in Peninsular Malaysia. It now has an extensive network of more than 23,000 distribution outlets in cities and major towns.
In 2011, Gardenia’s widespread popularity and market leadership won it 2 major awards.
It was voted most favourite brand, ranking in third place in the latest Superbrands 2011 consumers’ survey of Malaysia’s Top Ten Favourite Brands. The survey was conducted by The Nielsen Company and covered over 500 of Malaysian consumers’ favourite brands across 100 consumer product and services categories. Gardenia was previously ranked seventh in the last Superbrands survey in 2009.
Gardenia also won a Gold for the second consecutive year at the Putra Brand Awards 2011, having been voted Malaysian consumers’ most preferred bread brand. The Putra Brand Awards was initiated by the Association of Accredited Advertising Agents of Malaysia and is the only brand award in the country that is endorsed by the Malaysia External Trade Development Corporation. Both accolades are a testament to the company’s commitment to producing top quality, fresh, great tasting and value-for-money products, and affirm Gardenia’s dominance of the Malaysian bakery market.
Looking ahead, the business environment is expected to remain challenging with rising costs and growing competition. The company will continue to enhance long term profitability and competitiveness through enhanced productivity, further expansion of its distribution network and market share, and the development of wholesome, nutritious and delicious products that meet with consumers’ needs and expectations.
BakerS MaiSon (M) Sdn BHd(‘BakerS MaiSon MaLaySia’)
Bakers Maison Malaysia is a 100%-owned subsidiary of the QAF Group. It was set up to support the Group’s operations in Singapore and to develop and test new food products for the Group’s various markets in the region.
The company currently owns a freehold factory that can accommodate 3 production lines. In 2011, it commissioned 2 production lines, an automated bread line in April to supply bread to the Malaysian and Singapore markets, and a waffle line in September to supply waffles to the Malaysian market.
The company is committed to the development of tasty, value-for-money products that will enable consumers to choose healthier and more wholesome foods. It will continue to identify new markets and segments for its products through the test marketing of new products into the consumer market.
tHe PHIlIPPINeSGardenia BakerieS (PHiLiPPineS) inC(‘Gardenia PHiLiPPineS’)
Gardenia Philippines registered record sales growth of 25% in 2011 with revenue surpassing Php 3 billion. This was a remarkable achievement in a market that grew by 10% and affirms Gardenia’s leadership of the Philippine bakery market. This above-market growth was supported by successful marketing initiatives, addition of tasty new products, expansion into new markets and contribution from the company’s Cebu plant.
The company’s expansion into the southern Philippines was a success with the Cebu plant completing its first full-year of operations. The company made further inroads into the Visayas and Mindanao markets and the provincial Luzon countryside, establishing a strong brand presence in supermarkets, convenience stores and drug store chains.
17

Operational Review continued
To meet consumer needs and wants for affordable and convenient products, the company introduced a 2-slice snack pack of its popular flavored breads. The 2-slice snack packs of California Raisin Loaf, Double Delights Ube Cheese and Butterscotch Loaf were very well received and opened up a new market segment for these products. Gardenia Philippines is committed to making products that consumers love. It continued to delight consumers with the addition of 2 new variants to its popular Cream Roll snack line – the Coffee Cream Roll Dulce de Leche and Coffee Cream Roll Coffee Crumble. These new flavors combine the full-bodied richness of coffee with irresistible creamy fillings in a bun for a delectable snacking experience.
The company’s marketing and promotion initiatives in 2011 involved all touch points of its Integrated Marketing Communication program. Digital tools utilized included its corporate website, Facebook, Twitter and YouTube, complemented by TV, print, transit and point-of-purchase advertising, publicity, merchandising, events and promotions. The company’s effective use of multi-channel marketing ensured maximum impact on its target audience.
Marketing and branding efforts during the year included the ‘Oh I Love Gardenia’ campaign to encourage consumers from different age groups, backgrounds and psychographics to eat more bread, and the ‘Tagged Healthy’ campaign that aimed to raise consumers’ health-consciousness by encouraging them to attend a nutrition counseling session or a talk on nutrition.
As part of its corporate social responsibility, Gardenia Philippines runs a daily bread feeding program that donates about 10,000 loaves a week to various foundations, particularly those that support underprivileged children, orphans and former street kids.
The company also partnered with relief and civic organizations to donate bread and basic goods to victims of devastating typhoons and flash floods that hit the Philippines. In December 2011, the company’s Cebu plant also donated thousands of bread loaves and canned goods to victims of the flash floods in Mindanao, with many employees coming forward to donate one day’s pay to the relief efforts through the Philippine Red Cross.
In the ‘I Shared Bread’ campaign, the company donated bread to various charities, matching loaf-for-loaf the number of bread loaves purchased by customers and visitors to the bakery plant. Beneficiaries included the Nayon ng Kabataan (Kid’s Town) of the Department of Social Welfare and Development (DSWD), and the Manila Youth Reception Center.
In recognition of the company’s international quality standards, high productivity and strong corporate social responsibility initiatives, Gardenia Philippines won all 3 awards in the Search for Model Company organized by the Philippine Department of Trade and Industry - Center for Industrial Competitiveness in July 2011. Gardenia Philippines was the only company to win all the Pro-Active Programs Achievement Awards in the 3 categories of Labor Management Relations, Family Welfare/Community Relations Programs, and Quality and Productivity.
18

Bakery
Gardenia Philippines will continue to innovate new and delicious products that meet consumer expectations and develop successful marketing strategies to broaden its market reach in key market categories and segments.
AuStRAlIA BakerS MaiSon auSTraLia PTy LTd (‘BakerS MaiSon’)
Against the backdrop of rising raw ingredient and utility costs and a tough business environment, Bakers Maison turned in pleasing results, growing sales by more than 15% over the previous year and increasing its market share of the frozen bakery market. The increase in sales was achieved through greater product innovation, strong promotional initiatives and improved operational efficiencies. B a k e r s M a i s o n i s a s p e c i a l i s t manufacturer of authentic French-s ty l e b reads , pas t r i es and sweets. Bread items include batards, bread rolls and b a g u e t t e s , p a s t r i e s comprise croissants and assor ted dan ishes, and s w e e t s i n c l u d e m u f f i n s , banana loaves and friands. Frozen and par-baked bakery i tems are d i s t r i b u t e d t o t h e f o o d s e r v i c e sector throughout Australia from Bakers Maison’s plant in Revesby, Sydney. The food service sector comprises cafés, restaurants, hotels, food caterers, airlines, convenience stores and canteens.
The Austra l ian food serv ice industry saw f lat growth in 2011 due to the slowdown in tourist arrivals as a consequence of the high Australian dollar. Despite the competitive trading environment, Bakers Maison was able to increase its market share of the food service sector through expansion of its contract manufacturing activities and increased promotional activities throughout its national distributor network.
During the year, the company streamlined and simplified its operations to focus on the production of frozen and par-baked bakery items for the food service sector. As a result of improved operational efficiencies, the company was able to supply to 10 new food service distributors, increasing its market share of the frozen bakery market and extending its reach to more territories and consumers. In August 2011, Bakers Maison unveiled a new logo to reflect its new core business and to symbolize the freshly-baked quality of its products.
To cater to consumer demand for greater taste and variety, Bakers Maison launched a new range of Vienna loaves in 4 different flavours – Sour Dough, Multigrain,
White, and Balsamic Vinegar. It also introduced 2 new gluten-free loaves – White and Multigrain
– to meet the needs of the health-conscious customer. To tap into this lucrative and
growing healthy lifestyle market, the company will be adding an additional
bread line to produce a range of ‘healthy’ bakery items.
In December 2011, Bakers Maison ventured into the in-
store bakery sector by supplying frozen par-baked pastries to the
in-store bakeries of a large national retail Petrol & Convenience franchise
chain. The frozen pastries are baked on-site, providing customers with a delicious
‘freshly-baked’ product. The in-store bakery sector has shown exciting potential and is an important
growth area that Bakers Maison intends to further develop and expand.
For the year ahead, business conditions are expected to remain difficult. The cost of utilities, in particular electricity, is expected to continue to rise. Bakers Maison will seek to overcome these challenges through cost-cutting initiatives, market expansion and the development of new products.
19

Operational Review continued
20

Operational Review continued Primary Production
AuStRAlIA rivaLea (auSTraLia) PTy LTd (‘rivaLea’)
The Group’s Primary Production business segment comprises the operations of its wholly-owned subsidiary Rivalea, (formerly known as QAF Meat Industries Pty Ltd), and an 80%-owned subsidiary, Diamond Valley Pork Pty Ltd (‘Diamond Valley’).
Rivalea is a fully integrated pork production operation based in Australia. It is involved in all stages of the meat processing operations such as grain growing, stockfeed milling, breeding and farm operations, abattoir (slaughterhouse) operations, deboning, meat cutting, packaging of fresh meat products and meat distribution.
Rivalea is the largest producer of pork meat in the Australasian region and in Australia, accounting for 20% of the latter’s total meat production. The company is also the largest exporter of pork products to the major export markets of Singapore, Japan, New Zealand and other Asian countries.
In 2011, Rivalea produced and sold about 754,000 heads or 51,000 MT of meat. The company has achieved higher sales in 2011 as compared to 2010 both in terms of increased numbers sold as well as higher overall selling prices due to a higher proportion of higher value added branded products.
Rivalea has a major presence in the Australian meat market holding dominant positions in the various market segments. It is a major supplier of carcasses and meat products to wholesalers, and provides live animals to a major meat processor. It is also the largest producer of vacuum-packed meat cuts and tray-packed products for a major national supermarket chain. The company’s own unique fresh moisture-infused meat cuts are sold in butcheries, meat retail outlets, food service customers and independent supermarkets. The meat cuts are marketed under the company’s proprietary brand names – Murray Valley (for butcheries and meat retail outlets), High Country (for the food service industry), Family Chef (for independent supermarkets) and Riverview Farms (for free range meat products).
Rivalea’s breeding and farm operations are carried out within the states of New South Wales and Victoria, on 7 company-owned sites spread over a total area of about 100 square kilometres. Production is also carried out by a number of third-party contract growers who provide labour and housing facilities to grow the livestock till marketable age with Rivalea providing the feed, the animals and technical knowledge, and the meat processing and distribution. This arrangement provides the flexibility for Rivalea to quickly increase livestock numbers at any time without incurring heavy capital expenditure.
Production systems at the farm operations are environmentally clean and efficient and are based on the latest methods and technologies, including eco-shelter production systems. The use of all-in-all-out (‘AIAO’) systems ensure that the sheds are completely cleaned out between batches of animals and Segregated Weaning Systems (‘SEW’) are used to separate and isolate different herd batches as they grow. These production systems maintain the health status of the herd by reducing the incidence of disease transmission.
21

Operational Review continued
The main raw materials used in stockfeed, such as wheat grain, barley, triticale, canola, other grains and pulses, are purchased directly from growers in the surrounding grain producing areas. The company has developed a good infrastructure for grain storage which enables it to take advantage of opportunities to secure its grain requirements at the best possible prices and quantities. The Group has recently purchased a facility which is capable of increasing the storage capacity for grain raw materials by an additional 33,000 MT, bringing the company’s grain storage capacity to almost 110,000 MT.
Rivalea’s company-owned stockfeed mills produce all the company’s stockfeed requirements. This in-house feed production enables Rivalea to reduce the costs of feed production through economies of scale and ensure that its livestock receives the best quality feed at the best formulations. The company owns and operates one of the largest stockfeed mills in Australia with a capacity of more than 450,000 MT per year. The main mill is situated in Corowa, NSW, while a smaller facility is located in Balpool, NSW. Rivalea also produces a wide range of branded feedstock for sale to external customers and this business has continued to achieve encouraging levels of profitability. In 2011, the Group acquired another feedmill in Corowa which has a capacity of 70,000 MT per year. This acquisition will give Rivalea increased flexibility and the necessary efficiency to produce and supply good quality stockfeed products for its rapidly expanding customer base.
All the meat used in the production of the company’s meat products is supplied by the company’s abattoirs and this enables Rivalea to achieve the best quality carcasses and meat cuts at the highest hygiene and sanitation standards and the lowest possible cost. Rivalea’s abattoir and deboning facility at Corowa is export-registered and is the largest abattoir in Australia
that is situated on a single site. It has the capacity to slaughter 1 million heads per annum. An adjoining boning facility uses the latest technologies to efficiently and hygienically debone the meat which is then immediately vacuum packed into case/slice ready primals for the retail market, or wrapped and chilled for either the domestic or export market.
The boning facility currently processes about 365,000 carcasses a year. A moisture enhanced facility processes Rivalea’s branded moisture infused meat products. An in-house processing plant maintains quality control on the products and this is backed by
integrated risk procedures and an on-site NATA accredited laboratory. The processing plant has
also obtained ISO 9001:2000 certification, SQF 2000 certification and complies with
the guidelines issued by the AQIS Approved Meat Safety and Quality
Assurance Standard.
Diamond Valley operates another abattoir and bon ing bus iness in
Me lbou r ne , V i c to r i a . Th i s f ac i l i t y s l augh te rs
approximately 600,000 heads per annum and processes animals
from both Rivalea as well as external customers. The facility also has a minced
meat and packing line to add value to its meat products.
One of the core strengths of Rivalea lies in its established research and innovation capability. The company’s Research and Innovation Division (‘R&I’) comprises a team of scientists who support all the operational units of the company with effective and the latest state-of-the-art technical capabilities. Rivalea is one of the largest private investors in pork meat research in Australia and a significant contributor to international research. Research programs are conducted in the areas of animal welfare, genetics and animal breeding, veterinary science, reproduction, growth and nutrition, meat science and food safety, new product development and environmental sustainability.
22

Primary Production
The R&I also undertakes contract research programs for external clients such as multinational drug companies like Pfizer, Fort Dodge and Alltech. Additionally, Rivalea’s R&I is an integral research base for Australian Pork Limited and the Pork Cooperative Research Centre, and is a research partner with many government and university research groups. This extensive network of collaboration provides not only monetary benefits in the way of fees, but enables the company to apply the knowledge gained to its operations and thereby enhance the company’s technological and competitive advantage.
Rivalea’s R&I also sells technical products to external parties through its Primegro Technologies brand (‘Primegro’). Some unique Primegro products are genetics, a process to determine the future growth and efficiency potential of an animal at its birth, and insulin growth products. The R&I also provides technical consultancy work to the rapidly growing Asian pork industry and supplies vitamin products, mineral supplements and stockfeed solutions to the export markets. It also helps to develop new innovative meat products. In line with consumers’ increasing demand that farm animals be treated humanely, Rivalea practices a comprehensive animal welfare policy. Two-thirds of its sow population currently spend all or most of their pregnancies in group housing where there is freedom of movement and the company is committed to completing the removal of all pregnant sow stalls in the near future. Half of the company’s animals are reared in straw-bedded barns so as to provide social interaction. All livestock and farm workers possess National TAFE Certificates in Agriculture and are supervised by highly qualified people including veterinarians and animal behavioral scientists. Rivalea’s reputation for being in the forefront of animal welfare has resulted in increased demand for its products from supermarkets and consumers.
Rivalea has successfully positioned itself to pursue new market opportunities and continue growing its business through growth-oriented initiatives. In this regard, Rivalea’s future business strategies are to maximise its production capacity through the restocking of animals at its farms, the expansion of its boning facilities and increase in its research and development activities.
Rivalea intends to increase its output of fresh meat cuts and branded products as these products command better and more stable margins. The company proposes to open up new markets for its range of branded fresh and moisture-infused products, particularly in good growth markets such as Sydney, Melbourne, Brisbane and Adelaide. The Group’s trading arm in Sydney, Coral Park Pastoral Meat Trading, has achieved success in establishing itself as one of the leading distributors of multi-meat products including Rivalea’s Murray Valley branded products. Rivalea has also started a distribution facility in 2011 in Brisbane to serve the fast growing South East Queensland market.
As part of its strategy to focus more in producing value-added fresh products where it has the competitive advantage, Rivalea launched a new range of fresh mince and meat products to supply major retail customers and volumes have exceeded all expectations. The company will continue to grow and develop the fresh value-added product segment by formulating and introducing new product lines to new and existing customers.
The company also expects to sell more technological products such as genetics and farming consultancy services to the fast growing Asian markets. The expertise built up by Rivalea over the years, especially in the area of product development, production systems and technological know-how enables the company to successfully undertake new ventures and expand this area of its business.
23

Operational Review continued
24
Operational Review continued Trading & Logistics
SINgAPORe Ben FoodS (S) PTe LTd (‘Ben FoodS’)
2011 saw another year of strong growth by the company with increases in sales volumes and revenues. This was mainly due to improved operational efficiencies, the strengthening of the company’s proprietary branded business and high tourist numbers.
Ben Foods is the Group’s wholesale food distribution arm in Singapore. It distributes a wide range of premium food and beverage products to food manufacturers, fast-food chains and restaurants, supermarkets and independent retail outlets, hotels, wholesalers, bakeries, flight kitchens and sea vessels. Ben Foods handles third-party agency lines from international food manufacturers and distributors, as well as its own proprietary brands of food and beverage products.
The company’s proprietary food brands are Cowhead (milk, dairy products, confectionery), Farmland (meat, frozen vegetables, potato snacks), Haton (seafood products), Orchard Fresh (beverages) and Spices of the Orient (sauces, seasonings). These brands are familiar and trusted household staples, with Cowhead and Farmland both attaining Superbrand status. Cowhead products are also exported to the Philippines, Vietnam, Cambodia, Myanmar, Macau, Malaysia, Bangladesh and Brunei.
To stay ahead in an increasingly competitive marketplace, the company further strengthened its brands portfolio during the year with the addition of 6 new innovative products. These are Farmland Marble Steak, a pre-marinated steak that uses a special Japanese larding process to enhance juiciness, Farmland Potato Crisp, a healthy snack of oven-baked crisps in Cheese and Seaweed flavours, Haton Tempura Fish Nuggets, and Haton premium canned abalones from Australia, specially produced for the Lunar New Year season.
The company also expanded its range of dairy and canned juice products with Cowhead Dandelion, a fresh buttery flavoured margarine from Norway suitable for
baking and frying, and Orchard Fresh Grape Float, a 100% natural grape juice rich in Vitamin C, containing natural peeled grapes. The new products were very well received.
For the year ahead, the company will continue to focus on strengthening its operations, extending its distribution and developing a wider range of products that will enhance its brands portfolio and generate higher growth and profitability.
nCS CoLd SToreS (S) PTe LTd (‘nCS’)
The company posted higher revenue growth buoyed by improved occupancy rates and the rental income from 4 new freezer rooms.
NCS owns and operates the largest independent public cold store in Singapore in terms of land area. Sited over 27,000 sq. m. of land with a capacity for 14,000 pallets, the cold store is strategically located in the Jurong seafood industrial area, 5 minutes from Jurong Port.
NCS offers multiple temperature storage rooms and integrated services such as container plug-in, cargo clearance, delivery services, and rental of office and processing rooms. The company’s competitive edge lies in its ability to provide customers with an efficient one-stop service, enabling it to retain its customer base and maintain its leadership of the cold store industry. In 2011, the cold store completed a $1.8 million upgrading for the purposes of obtaining an extension of its leasehold term upon its expiry in 2013. JTC Corporation has given its in-principle approval for the extension of the lease for another 17 years to 2030.
NCS is HACCP Certified and a member of theInternational Association of Refrigerated Warehouses, USA, and the Seafood Industries Association, Singapore.
NCS has a 62% interest in QAF Fruits Cold Store Pte Ltd, the owner of a cold store for the storage of fresh fruits and vegetables. The cold rooms and office space are leased to third-party tenants.
25

Operational Review continued
26

Operational Review continued Other Investments
AuStRAlIA oxdaLe dairy enTerPriSe PTy LTd (‘oxdaLe dairy’)
Oxdale Dairy operates 2 freehold dairy production facilities in Cobram, Victoria. The properties have an area of more than 733 hectares and currently accommodate a herd of more than 1,600 cattle of predominantly Holstein, Holstein Jersey Cross and Brown Swiss breeds.
The production facilities are fully equipped with rotary dairies, irrigation equipment, infrastructure, laneways, barns and extensive fences. Oxdale Dairy enjoys lower feed costs as cattle are able to graze on large tracts of adjoining buffer pasture land belonging to Rivalea (Australia) Pty Ltd (‘Rivalea’), a related company. The close proximity also enables Oxdale Dairy to increase herd size without substantial investments in land, water resources or feedlots, as well as leverage on Rivalea’s expertise in the areas of feed formulation and production. These advantages have resulted in reduced production costs and higher efficiencies per cow.
Oxdale Dairy owns a large grain storage facility in Corowa, New South Wales, with a capacity of approximately 37,000 tonnes. The storage facility is leased out to Rivalea for purposes of its feedmill operations. In November 2011, the company acquired a small feedmill in Corowa that is also leased out to Rivalea.
For FY2011, dairy revenue increased by 26% over the previous year due to improved whole milk prices. Oxdale Dairy produced approximately 8.4 million litres of whole milk that was supplied under contract to Murray Goulburn Co-operative Co. Limited, the largest milk processor in Australia’s dairy industry.
During the year, the company restructured its dairy operations by integrating the operations of both Oxdale farms under a single operation located on Oxdale 2 as it possessed superior infrastructure and grazing pastures.
With the integration, the company is able to take advantage of operational efficiencies and economies of scale to significantly maximise the number of cows milked, and increase the number of milkings per day for certain genetically superior herds. The restructuring is expected to improve overall revenue growth and result in an increased milk production in 2012.
The persistent drought affecting many parts of Victoria in 2010 had led to a decline in total cow numbers. However, with the return of more normalised weather conditions and the availability of abundant irrigation water, many farmers have begun rebuilding stock numbers to maximise their milking herds in future seasons.
The outlook for the dairy industry is reasonably strong with growth forecasts by the major processors aligned with the expected resurgence of demand from Asia.
27

Our Brands
28

The Articles of Association of the Company provide for the Board to convene and conduct meetings by video conferencing or telephonic-conferencing for any Director who is otherwise unable to attend the meetings in person.
The Board is responsible generally for the broad business strategy and financial objectives of the Group, monitoring the performance of the Management, as well as providing oversight in the proper conduct of the Group’s business. Specific matters which are referred to the Board for approval include the following:-
• Approvalofperiodicfinancialresultsannouncement• ApprovalofannualauditedconsolidatedaccountsfortheGroupandtheDirectors’Reportthereto• ApprovalofannualbudgetsfortheGroup• EvaluatingtheadequacyofinternalcontrolsfortheGroup• ApprovalofmajorinvestmentordivestmentbytheGroup• Approvalofmajorfundingproposalorbankborrowings• Approvalofmajorcorporaterestructuring• Approvalofinterimdividendsandproposaloffinaldividendsforshareholders’approval• Approvalofissuesofshares,warrantsandanyotherequityordebtorconvertiblesecuritiesoftheCompany
29
Corporate Governance Report
Inaccordancewiththe listingrulesasstated in theListingManualof theSingaporeExchangeSecuritiesTradingLimited(“SGX-ST”),thisReportdescribesthecorporategovernanceprocessesandactivitiesofQAFLimited(“QAF”)and its subsidiaries (“the Group”) with reference to the Code of Corporate Governance 2005 (“Code 2005”). The Company has generally adhered to the principles and intent of the Code 2005. In areas where the Company deviated fromtheCode2005,thedeviationandreasonsforthatareasexplainedbelow.
Principle 1 : Board’s Conduct of its Affairs
The Board of Directors of QAF (“Board”) is scheduled tomeet at least four times a year and aswarranted bycircumstances.Forthefinancialyearunderreview,theattendanceofthedirectorsoftheCompany(“Directors”)atmeetings of the Board and Board committees are summarized as follows:-
Name
Board Audit CommitteeNominating Committee
Remuneration Committee
No. of Meeting
Held
No. of Meeting Attended
No. of Meeting
Held
No. of Meeting Attended
No. of Meeting
Held
No. of Meeting Attended
No. of Meeting
Held
No. of Meeting Attended
Didi Dawis 4 4 NA NA NA NA 1 1
Andree Halim 4 4 NA NA NA NA NA NA
Tan Kong King 4 4 NA NA 1 1 NA NA
Tarn Teh Chuen 4 4 NA NA NA NA NA NA
Kelvin Chia Hoo Khun 4 3 4 3 1 1 1 1
Tan Hin Huat 4 4 4 4 1 1 1 1
SohGimTeik 4 4 4 4 NA NA NA NA
Lin Kejian 4 3 NA NA NA NA NA NA
Triono J. Dawis 4 4 NA NA NA NA NA NA

30
Corporate Governance Report
Principle 1 : Board’s Conduct of its Affairs (continued)
Additionally, the Board delegates and entrusts certain of its functions and power to the Audit, Nominating and RemunerationCommittees.
TheManagement(withtheassistanceofexternalprofessionalswhennecessary)furnishestheDirectorswithinformationconcerning the changes in laws, regulations or accounting standards where they may be applicable to the Company and relevant in enabling the Directors to carry out their duties and responsibilities properly. The Group Managing Director briefs the Board at the beginning of each financial year on the general economy trend, specific industry factors and developmentsaffectingthebusinessesoftheGroupandtheGroup’sbusinessoutlookfortheyear.
A formal letter of appointment setting out a Director’s duties and obligations is given to each new Director upon appointment. To familiarize new Directors with the Group’s business activities, the Company had organized orientation programmeswhichgavethenewlyappointedDirectorstheopportunitytovisitkeyoperationsoftheGroup.
Principle 2 : Board Composition and Balance
The Board at present comprises nine Directors as follows:-
Didi Dawis (non-executive/non-independentDirector)Andree Halim (non-executive/non-independentDirector)Tan Kong King (executiveDirector)Tarn Teh Chuen (executiveDirector)Kelvin Chia (non-executive/independentDirector)Tan Hin Huat (non-executive/independentDirector)Soh Gim Teik (non-executive/independentDirector)Lin Kejian (executiveDirector)Triono J. Dawis (executiveDirector)
Based on the criterion of independence and principles set out in Guidelines 2.1 of the Code 2005, one third of the Board isconstitutedbyindependentnon-executiveDirectors,namelyMrKelvinChia,MrTanHinHuatandMrSohGimTeik.
Mr Andree Halim and Mr Lin Kejian are both regarded as non-independent Directors in view of them having controlling stakesinthesharecapitaloftheCompany.MrLinKejianisthesonofMrAndreeHalim.
Mr Didi Dawis (a substantial shareholder of the Company) and Mr Triono J. Dawis (son of Mr Didi Dawis) are both regarded as non-independent Directors of the Company.
TheBoardisoftheviewthatthecurrentboardsizeoftheCompanyisappropriateandeffectivetakingintoaccountthe nature and scope of the Group’s operations and the corporate goals and objectives the Group strives to achieve. TheBoardismadeupofmemberswithadiversebackgroundandexperience,rangingfromaccounting,financeandlegalexpertisetoentrepreneurbusinessskillsandregionalinvestmentexperiencewhichareallessentialandvaluabletothedecisionmakinganddirectionsettingoftheGroup.
Thenon-executiveDirectors,undertheleadershipoftheChairmanoftheBoard,providefeedbacktotheManagementof their views on the performance of the Company and its subsidiaries from time to time.

31
Corporate Governance Report
Principle 3 : Role of Chairman and Chief Executive Officer
ThereisacleardivisionofrolesplayedbytheindependentDirectors(whoarenon-executive)andtheexecutiveDirectors(whoareinvolvedintheday-to-daymanagementoftheCompanyand/oritssubsidiaries),whichensuresthatthereis a balance of power and authority at the top of the Group.
Toenhancethebalanceofpower,thepostsofChairmanandtheGroupManagingDirectorarekeptseparateandthese positions are held by Mr Didi Dawis and Mr Tan Kong King respectively, who are not related to each other. The Board delegates the day-to-day management of the Group to the Group Managing Director, who is assisted by the otherexecutivedirectors.
TheChairmanperformshisdutiesasanon-executiveDirectoroftheCompany,facilitatesconstructiveinteractionsanddiscussionsbetweentheboardmembersandensurestheproperworkingsoftheBoardasawhole.
Principle 4 : Board Membership
TheNominatingCommitteecomprisestwonon-executiveindependentDirectors,namelyMrKelvinChiaandMrTanHinHuatandoneexecutiveDirector,MrTanKongKing.MrKelvinChiaisthechairmanoftheNominatingCommittee.
The Nominating Committee is empowered by the Board to decide on the re-appointment of Directors who are subject toretirementbyrotation.Article104oftheCompany’sArticlesofAssociationrequiresonethirdoftheBoard(otherthan the Group Managing Director) to retire by rotation at every Annual General Meeting of the Company (“AGM”).
In deciding whether to nominate Directors to stand for re-election at each AGM, the Nominating Committee will assess and evaluate the contribution of each individual Director to the effectiveness of the Board. The review parameters for evaluating each Directorinclude,amongothers,attendanceatboard/committeemeetings,participationandinvolvementindecision-makingsinmeetingsandknowledgeandexperienceoftheDirectorswhicharerelevanttotheoperationsandconductofbusinessesofthe Group.
In reviewing whether Directors with other board representations are able to spend sufficient time and attention on theCompany’saffairs,theNominatingCommitteetakesintoconsiderationtheparametersasabovedescribedandissatisfiedthatsuchboardrepresentationshavenotcompromisedanyDirector’sabilitytocarryouthis/herdutiesadequately.
UnderitsTermsofReferenceasapprovedbytheBoard,theNominatingCommitteeisempoweredtoreviewandassesscandidatesfordirectorshipbeforemakingrecommendationtotheBoard.AnyrecommendationoftheNominatingCommittee is subject to the Board’s final approval, whose decision shall be final and binding.
The Nominating Committee also reviews annually as to whether there is a change to the independence status previously accorded to the relevant Directors following the guidelines as set out in the Code 2005.
AdditionalkeyinformationregardingtheDirectorsaresetoutintheothersectionofthisAnnualReport.
Corporate Governance Report

32
Corporate Governance Report
Principle 5 : Board Performance
TheBoardtakestheviewthatallitsmembersshouldbeinvolvedintheassessmentoftheeffectivenessoftheBoardas a whole and that Board performance is ultimately reflected in the performance of the Group.
TheBoardbelievesthatinevaluatingitseffectiveness,bothquantitativeandqualitativecriteriaofalong-termperspectiveoughttobetaken intoaccount. Inreviewing itsperformance, theBoardgivesdueconsiderationtothefinancialperformanceof theGroup(suchas its long-termrevenueorprofittrendand/orsuchotherappropriate indicatorsdepending on the nature and scope of the Group’s business from time to time); the business opportunity and growth potentials brought about by the Board in setting the strategic directions of the Group; the readiness of the Board in redefining and modifying corporate strategies in a changing business environment and its ability to lend support to the Management in steering the Group towards the objectives set, all of which should form part and parcel of the bases in assessing the effectiveness of the Board.
Principle 6 : Access to Information
In order to ensure that the Board is able to fulfil its responsibilities, the Management provides all the Board members with the Group’s monthly management accounts. Detailed Board papers are prepared for each meeting of the Board and are normally circulated at least two days in advance of each meeting to allow sufficient lead time for Directors to peruseandreviewtheitemstabledatthemeetings.TheManagementisrequiredtoensurethattheBoardpaperscontainadequateinformationpertainingtotheagenda(including,asthecasemaybe,budgets,forecast,financialresultsandexplanatorynotesonvariances)soastoenabletheDirectorstobeproperlybriefedon issuestobeconsidered at Board meetings.
The Directors have separate and independent access to the Company Secretary. The Company Secretary attends all Board and Committee meetings and her responsibility includes ensuring that board procedures are followed and that applicable rules and regulations are complied with, and that minutes of meetings are properly and fairly recorded.
TheCompanySecretaryisalsotaskedtoco-ordinatecommunicationsforthenon-executiveDirectorswiththechiefexecutiveofficers/generalmanagersoftheoperatingsubsidiaries,thefinancialcontrollersandotherseniorexecutivesasandwhenrequiredbythenon-executiveDirectors.Theyareencouragedtospeaktotheindividualofficer-in-chargetoseekadditionalinformationastheymaydeemfit.
IfDirectors,whetherasagrouporindividually,needindependentprofessionaladvice,theCompanySecretarywillseektheappropriateexternaladvice.ThecostofsuchprofessionaladvicewillbebornebytheCompany.

33
Corporate Governance Report
Principles 7 and 8 : Procedures for Developing Remuneration Policies/Level and Mix of Remuneration
TheRemunerationCommitteecomprisesthreeDirectors,namelyMrDidiDawis,MrKelvinChiaandMrTanHinHuat.AmajorityoftheRemunerationCommitteeisconstitutedbyindependentnon-executiveDirectors.MrKelvinChiaisthechairmanoftheRemunerationCommittee.
TheRemunerationCommitteeisdelegatedthetasksofreviewingtheremunerationpackagesoftheGroupManagingDirectorandtheotherexecutiveDirectorstoensurethat thepackagesarecompetitiveandsufficient toattract,retainandmotivateexecutivedirectorsoftherequiredqualitytoruntheCompanyandtheGroupsuccessfully.TheRemunerationCommitteealsoreviewstheexecutiveDirectors’compensationannuallyanddeterminesappropriateadjustments.TherecommendationsoftheRemunerationCommitteearesubjecttothefinaldecisionandendorsementbytheBoard.AnyDirectorwhomayhaveaninterestintheoutcomeoftheBoarddecisionsisrequiredtoabstainfrom participation in the approval process.
TheBoardbelievesthattheremunerationprogrammeforthekeyexecutivesoftheGroup(otherthantheexecutiveDirectors) is best set and determined by the Management. The Board noted that it is the Group’s policy to set a levelofremunerationthatisappropriatetoattract,retainandmotivateallcompetentandloyalkeyexecutives.Theirremunerationgenerallyincludesafixedaswellasavariablecomponent.Thefixedcomponentisthebasesalaryandvariablecomponentisintheformofavariablebonuslinkedtotheindividual’sortherelevantsubsidiary’sperformance.AnnualadjustmentstotheremunerationaremadetakingintoaccounttheperformanceoftheGroupand/oroftherelevantsubsidiary,theprevailingmarketpay,theseniorityandlevelofresponsibilitiesoftheindividualaswellashis/her performance.
InadditiontotheindividualperformanceandcontributionoftheexecutiveDirectorstotheperformanceoftheGroup,therevenuetrendoryear-toyearprofitperformanceof theGroup,theRemunerationCommitteealsotakes intoaccount similar policy and approach as outlined in the paragraph above when reviewing the remuneration of the executiveDirectors.ExecutiveDirectorsdonotreceivedirectors’feesotherthantheirremunerationsasemployeesof the Company.
The Group Managing Director’s remuneration is subject to the terms as provided in his service contract entered into with the Company.
MostoftheRemunerationCommitteemembershavecertaindegreeofexperienceinmanagingfirmsorcompanies.TheRemunerationCommitteeisencouragedtoseekexternalprofessionalhelpwheneveritdeemsnecessary.
Non-executivedirectorsarepaidabasic feeandanadditional fee forservingas theChairmanof theBoardorchairman/membersoftheAuditCommittee.SuchfeesaresubjecttoapprovalbytheshareholdersoftheCompanyas a lump sum payment at each AGM of the Company. The Company holds the view that the interests of maintaining theobjectivityandindependenceofthenon-executiveDirectorsisbestservedbyacash-basedfixedfeeataratebroadly in line with those that are adopted by a majority of other listed companies.
34
Corporate Governance Report
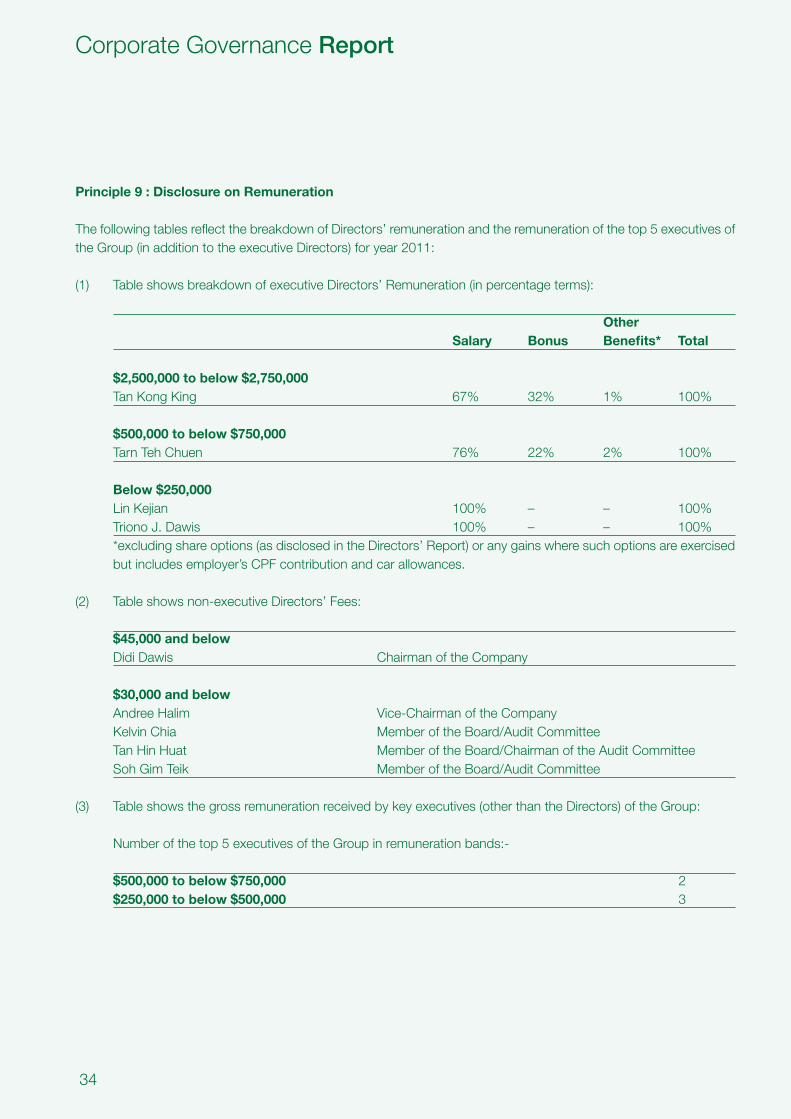
Principle 9 : Disclosure on Remuneration
ThefollowingtablesreflectthebreakdownofDirectors’remunerationandtheremunerationofthetop5executivesoftheGroup(inadditiontotheexecutiveDirectors)foryear2011:
(1) TableshowsbreakdownofexecutiveDirectors’Remuneration(inpercentageterms):
Other Salary Bonus Benefits* Total
$2,500,000 to below $2,750,000 Tan Kong King 67% 32% 1% 100% $500,000 to below $750,000 Tarn Teh Chuen 76% 22% 2% 100%
Below $250,000 Lin Kejian 100% – – 100% Triono J. Dawis 100% – – 100% *excludingshareoptions(asdisclosedintheDirectors’Report)oranygainswheresuchoptionsareexercised
butincludesemployer’sCPFcontributionandcarallowances.
(2) Tableshowsnon-executiveDirectors’Fees:
$45,000 and below Didi Dawis Chairman of the Company
$30,000 and below Andree Halim Vice-Chairman of the Company KelvinChia MemberoftheBoard/AuditCommittee TanHinHuat MemberoftheBoard/ChairmanoftheAuditCommittee SohGimTeik MemberoftheBoard/AuditCommittee (3) Tableshowsthegrossremunerationreceivedbykeyexecutives(otherthantheDirectors)oftheGroup:
Numberofthetop5executivesoftheGroupinremunerationbands:- $500,000 to below $750,000 2 $250,000 to below $500,000 3

35
Corporate Governance Report
Principle 9 : Disclosure on Remuneration (continued)
The Board is of the view that given the sensitive and confidential nature of employees’ remuneration, detailed disclosure on the topfivekeyexecutivesisnotinthebestinterestsoftheCompanyandtheGroup.SuchdisclosurewoulddisadvantagetheGroupinrelationtoitscompetitorsandmayaffectadverselythecohesionandspiritofteamworkprevailingamongtheemployeesof the Group.
The Group employs Mr Lin Kejian and Mr Triono J. Dawis respectively as the operations director and business development director of the Group. Mr Lin Kejian is the immediate family member of Mr Andree Halim (the Vice-Chairman) and Mr Triono J. Dawis is the immediate family member of Mr Didi Dawis (the Chairman).
Save as provided in paragraph above, the Group does not employ any other immediate family members of a Director or the Group Managing Director.
Principle 10 : Accountability
The Directors fully recognise the principle that the Board is accountable to the shareholders while the Management is accountable to the Board.
TheCompanyhasadoptedquarterlyreportingsince1January2003.Inpresentingtheannualfinancialstatementsandquarterlyannouncementstoshareholders,theBoardhasandwillcontinuetoprovidetheshareholderswithabalanced and understandable assessment of the Company’s and the Group’s performance, position and prospects.
Management provides the Board with appropriately detailed management accounts of the Company and the Group on a monthly basis.
Principles 11, 12 and 13 : Audit Committee/Internal Controls/Internal Audit
TheAuditCommitteeof theCompanycomprisesthreenon-executive independentDirectors,namelyMrTanHinHuat(thechairmanoftheAuditCommittee),MrKelvinChiaandMrSohGimTeik.Allitsmembersareappropriatelyqualifiedtodischargetheirresponsibilities.MrTanHinHuatholdsadegreeinBachelorofCommerceandMrKelvinChiaisaseniorpractisinglawyer.MrSohGimTeikwastrainedasapublicaccountantandhasmanyyearsofworkingexperiencewithalistedentityasafinancedirector/chieffinancialofficer.
The Audit Committee performs the functions set out in the Companies Act and the Code 2005. It has written terms of reference which sets out its authority and duties. Some of its responsibilities include:
• Toreviewtheauditplansof theCompany’sexternalauditorsandtheirevaluationof thesystemsof internalaccountingcontrolsarisingfromtheirauditexamination
• Toreviewtheexternalauditors’report (includingassistancegivenbytheCompany’sofficerstotheexternalauditors)

36
Corporate Governance Report
Principles 11, 12 and 13 : Audit Committee/Internal Controls/Internal Audit (continued)
• Toreviewthesignificantfinancialreportingissuesandjudgementssoastoensuretheintegrityofthefinancialstatements of the Company and the consolidated financial statements of the Group before their submission to the Board
• ToreviewinterestedpersontransactionspursuanttotheListingManual• Toreviewannuallytheindependenceandobjectivityoftheexternalauditors,takingintoconsiderationthenon-
auditservicesprovidedtotheCompanyandtorecommendontheappointmentorre-appointmentoftheexternalauditors
• Toreviewscopeandresultsoftheinternalauditprocedures• Toreviewtheperiodicfindingsoftheinternalauditmanagerandwiththeassistanceoftheinternalauditmanager,
conduct an annual review of the effectiveness of the Group’s material internal controls• Tosetupandreview(asmaybenecessary)awhistle-blowerprocedurefortheGroup.
The Audit Committee is empowered by its written charter to investigate any matter relating to the Group’s accounting, auditing, internal controls and financial practices brought to its attention. It has full access to and co-operation of the Management,includingtheinternalauditmanager,andhasfulldiscretiontoinviteanyDirectorandexecutiveofficerto attend its meetings.
The Group has an internal audit manager who is a member of the Institute of Certified Public Accountants of Singapore andtheInstituteof InternalAuditorsandhe isassistedbyan internalauditexecutive.The internalauditmanagerreports primarily to the chairman of the Audit Committee. The Audit Committee reviews and approves the annual internalauditplanproposedbythe internalauditmanager.The internalauditmanager, liketheexternalauditors,reports independently his findings and recommendations to the Audit Committee in each Audit Committee meeting.
Inperformingitsfunction,theAuditCommitteemetwithinternalandexternalauditors,reviewedtheauditplansofbothinternalandexternalauditorsandtheassistancegivenbyManagementtotheauditors,soastoensuresufficientcoverage in terms of the scope of audit. All audit findings and recommendations are presented to the Audit Committee fordiscussion.TheAuditCommitteemeetswiththeinternalauditorfourtimesayearandwiththeexternalauditors,without the presence of Management, at least once a year.
Since2007,theAuditCommitteehasimplementedawhistle-blowingframeworkfortheGroupwhereemployeesofthe Group may raise concerns in confidence about possible financial improprieties in the subsidiaries or the Company which might have a materially adverse effect on the subsidiary or the Company.
The review of the Group’s systems of internal control is a continuing process. The system of internal control adopted bytheGroupisdesignedtomanageratherthaneliminatetheriskoffailuretoachievebusinessobjectives.Basedontheauditreportsandmanagementcontrolsinplace,theAuditCommitteeissatisfiedthatthereareadequatematerialinternal controls in place for the Group.
TheBoardacknowledges itsresponsibilityoverall forensuringthat there isasoundsystemof internalcontrol tosafeguard the shareholders’ investments and Company’s assets, and is satisfied that there has been no significant breakdownorweaknessesinthematerialaspectoftheinternalcontrolsfortheGroup.

37
Corporate Governance Report
Principles 14 and 15 : Communication with Shareholders/Greater Participation by Shareholders
TheCompanybelieves in timelyandtransparentcorporatedisclosureasprescribed inAppendix7.1 (corporatedisclosure policy) of the Listing Manual. Shareholders are informed of all major developments that affect the Group. Wherethereisinadvertentdisclosuremadetoaselectedgroup,theCompanywillmakethesamedisclosurepubliclyto all others as soon as practicable. Communication is made through:
• annualreportsthatarepreparedandsenttoallshareholders.TheBoardensuresthattheannualreportincludeskeyrelevantinformationabouttheCompanyandtheGroup,including,inter-alia,areviewoftheGroup’smajoroperationsandtheirgeneraloutlook,disclosuresrequiredby theCompaniesAct,ListingManual,andtheAccounting Standards;
• quarterlyfinancialannouncementsonthefinancialperformanceoftheGroupforthatperiodandoperationreviews;• circularsforextraordinarygeneralmeetings;• announcementsanddisclosurestotheSGX-STviaSGXNET;and• theCompany’swebsiteathttp://www.qaf.com.sgatwhichourshareholderscanaccess informationon the Group.
The shareholders of the Company are encouraged to attend the AGMs. At AGMs, the shareholders are given the opportunitytoairtheirviewsandaskquestionsregardingtheCompanyandtheGroup.ThenoticeoftheAGMissent to our shareholders at least 14 days before the meeting. Directors and members of the respective Committees arenormallypresentandavailabletoaddressquestionsrelatingtotheworkoftheirCommitteesatgeneralmeetings.Furthermore,theexternalauditorsarepresenttoassisttheBoardinaddressinganyrelevantqueriesraisedbytheshareholders.
Eachitemofspecialbusinessinthenoticeofthemeetingisaccompanied,whereappropriate,byanexplanationforthe proposed resolution. Separate resolutions are proposed for substantially separate issues at the meeting.
To facilitate voting by shareholders, the Articles of Association of the Company allow a shareholder to appoint one or twoproxiestoattendandvoteonhis/herbehalf.
Dealings in Securities
TheCompanyhasaninternalcodeondealingsinthesharesoftheCompanybykeyexecutivesoftheGroup.TheinternalcodeisissuedtoallDirectorsoftheCompanyandtherelevantexecutivesoftheGroupbeforethestartofeachprohibitionperiodtoremindDirectorsandrelevantexecutivestorefrainfromdealinginthesharesoftheCompanytwoweekspriortoreleaseofthequarterlyandfourweekspriortothereleaseofthefullyearannouncementsoftheGroup’s financial results.

38
Supplementary InformationrequiredbytheListingManual
Rule 1207(4)(b)(iii) : Information relating to the background of key executives
Derek Cheong Kheng Beng,aged57,wasappointedastheHeadofCorporateDevelopmentfortheQAFGroupinJanuary2002,takingchargeofmattersinrelationtomergers,acquisitionsandbusinessdevelopmentoftheGroup.MrCheonghasalsobeentaskedinDecember2009totakeontheroleasthefinancedirectoroverseeingtheprimaryproduction division of the Group (namely, Hamsdale International Pte Ltd and its subsidiaries in Australia). Prior to him joiningtheQAFGroup,hewastheseniorvicepresidentofBusinessDevelopmentwiththeKMPPrivateLtdgroupofcompaniesfor7years.HehadalsoworkedasatreasurymanagerinaSingaporelistedconstructionandengineeringcompany, a corporate manager of United Industrial Corporation Limited as well as an assistant manager for Loans & SyndicationsinamerchantbankinSingaporebeforejoiningKMPPrivateLtd.MrCheonggraduatedwithaBachelorof Commerce degree from the University of Toronto, Canada and holds a Master of Business Administration from the University of British Columbia, Canada.
Siew Teck Woh,aged70,wasmadethechiefexecutiveofficerofGardeniaFoods(S)PteLtdin1998,theGardeniaBakeryoperationoftheQAFGroupinSingapore.DrSiewspentalargepartofhisearlycareerinthePrimaryProductionDepartment(“PPD”andnowcalledtheAgri-Food&VeterinaryAuthority)oftheSingaporeGovernmentincludingbeingthe Director of the PPD for 9 years. During his tenure with PPD, Dr Siew was involved in the strategic formulation andimplementationofvariousagri-businessandlivestockdevelopmentprogrammesinSingapore.AfterleavingthePPD,DrSiewworkedwiththeKMPPrivateLtdgroupofcompaniesforabout13years.HewasinchargeandwasinstrumentalinsettingupanintegratedchainoflivestockactivitiesfortheKMPGroup.DrSiewwasaColomboPlanScholarandgraduatedwithaBachelorofVeterinarySciencedegreefromtheUniversityofQueensland,Australia.HewasawardedanHonoraryDoctorateinVeterinarySciencebytheUniversityofQueenslandin1994.
Paul Pattison,aged59,isthechiefexecutiveofficerofRivalea(Australia)PtyLtd(“Rivalea”),awholly-ownedsubsidiaryoftheQAFGroup.HehastheresponsibilityofoverseeingtheentireintegratedmeatproductionbusinesscarriedoutbyRivaleagroupofcompanies(“RivaleaGroup”)inAustraliaaswellasthedairyfarmingbusinessesunderOxdaleDairyEnterprise.MrPattisonhasbeenwiththeRivaleaGroupforover38years.PriortohimassumingthepositionaschiefexecutiveofficerofRivalea,hewasinvariousseniormanagementrolesincludingsmallgoodsproductionandmeatproduction.HehascontributedmuchintransformingtheRivaleaGroupfromasmallproduceroflivestockintothe largest fully integrated meat producer in Australia and one of the largest in the world. He graduated with a Diploma ofAgriculturalSciencefromDookieAgriculturalCollege,Australia.
Rod Williams,aged56,hasheldthepositionofGeneralManager(Finance&Administration)ofRivaleasinceJanuary2000. In2009,hewasredesignatedasCorporateServicesDirectortakingchargeofcorporateservicesmattersincludingthefinanceandcorporateaffairsoftheRivaleaGroup.MrWilliamshasmorethan37yearsexperienceinthe areas of finance, production, sales, operations and general management in Australia and overseas. Prior to his postinRivalea,heworkedforabout6yearsasthechiefexecutiveofficerofaSingaporejointventurecompany,KMPBunge,afullyintegratedlivestockbusinesswithproductionfacilitiesinIndonesia,exportinglivestocktoSingapore.HeholdsaCertificateinBusinessStudiesAccountingfromtheWangarattaCollegeofTechnicalandFurtherEducation.
Yap Kim Shin,aged60,isthechiefexecutiveofficeroftheGardeniaBakerygroupofcompaniesinMalaysia(“GardeniaMalaysia Group”). Gardenia Malaysia Group is the major bread producer in Malaysia. Mr. Yap has been with the Gardenia MalaysiaGroupsince1987,contributingsignificantly inbuildingthe“Gardenia”brandandthebakerybusiness in

39
Supplementary InformationrequiredbytheListingManual
Malaysia. Gardenia has been recognized as one of the Superbrands in Malaysia since 2002 and was presented the Gold Medal in The Putra Brand Awards for 3 consecutive years from 2010. Mr Yap is a Monash Science graduate and hascompletedapostgraduateprogrammeinMarketingManagementinLondon.PriortojoiningGardeniaMalaysia,MrYaphadworkedwithIAC(M)SdnBhdandColdStorageMalaysiaBhd.
Simplicio P. Umali, Jr,aged59,assumedthepositionasthegeneralmanageroftheGardeniaBakeryoperationoftheQAFGroupinthePhilippinesinAugust1999.PriortohimtakingchargeoftheGardeniaBakeryoperationsinthePhilippines,hewasthechiefexecutiveofficerofDutchBoy(Philippines)Inc.,amajorpaintmanufacturer,andthecountrymanagerofHoechstMarionRoussel(Philippines),apharmaceuticalcompany.MrUmalihasextensiveexperienceinmarketing,havingtakenchargeofthemarketingfunctioninhispreviousemploymentforover10years.HeisagraduateofBusinessAdministration(majoredbothinFinanceandMarketing)andholdsaMasterofBusinessAdministration from the University of the Philippines. In 2011, he was awarded the prestigious Agora Award for OutstandingAchievementinMarketingManagementfromthePhilippinesMarketingAssociationandtheOutstandingAlumnus Award of the University of the Philippines College of Business Administration.
Philip Lee Tuck Wah,aged62,wasappointedthechiefexecutiveofficerforthetradinganddistributionarmoftheQAFGroup-BenFoodssince1989.AsthesubsidiaryoftheQAFGroupengaginginthetradinganddistributionofconsumerfoodproducts,BenFoodsprovidesmarketingandsourcingsupporttoothersubsidiarieswithintheQAFGroup.In1997,MrLeewastaskedtotakechargeofthewarehousinglogisticsoperationoftheQAFGroup.MrLeehascloseto36yearsofexperienceinthemarketingoffoodandbeveragesto-date.PriortojoiningBenFoods,hehadworkedwithAlliedChocolateLtd(formerlyalistedcompanyinSingapore)andSimeDarbySingapore.MrLeehas a Bachelor degree in Social Science (Hons) from the University of Singapore.
Derrick Lum Weng Piu,aged50,isthegroupfinancialcontrollerfortheQAFGroup.HehasbeenwiththeQAFGroupsince1997andwasmadethegroupfinancialcontrollerinOctober1999.MrLumhas26yearsofexperienceintheareaofaccountingandfinance.PriortojoiningQAF,hewastheregionalcontrollerforamulti-nationalandaSingapore-listed group. Mr Lum is a certified public accountant of the Institute of Certified Public Accountants of Singapore as wellasacharteredfinancialanalystoftheCFAInstitute.HealsoholdsaMasterofBusinessAdministrationfromtheUnited Kingdom.
Rule 1207(4)(b)(iv) : Information relating to risks
1. Disease Outbreak and Farm Contamination
ThePrimaryProductionDivisionoftheQAFGroupconsistsprimarilyofRivalea(Australia)PtyLtd(“Rivalea”).Rivaleaisanintegratedproducerofmeat,whichoperates7company-ownedfarmsand22ContractGrowersitesspreadoutacrosstheAustralianstatesofVictoriaandNewSouthWales.Rivaleahasmorethan54,000breeder pigs and a total population of about 405,000 pigs. In addition, the Group operates 2 dairy farms at Cobram, Victoria, Australia with about 1,700 heads of dairy cows.
Alllivestockfacepotentialhealthepidemicoutbreaks.Infectiousdiseasescanbespreadbyeitheranimalcontactorfarmcontamination.LivestockfarmingisthemainstayofRivalea.Ifahealthepidemicshoulderuptinthe

40
Supplementary InformationrequiredbytheListingManual
1. Disease Outbreak and Farm Contamination (continued)
farms,dependingonthelocalityandproximityofthecontaminatedareas,variousanimalswouldhavetobeculledandtheoperationsshutdown.Inrecentyears,therehadbeenoutbreakswhichcausedmassivecullingof pigs and closures of farms in many countries in Asia. The pig farming industries in these countries have been adversely affected.
AlthoughAustraliaisgeographicallyisolatedandhasstrictquarantinelaws,thereisnoguaranteethattheGroup’slivestockwillnotbeaffectedbydiseaseepidemics.Rivaleahastakenpreventivemeasuresofenforcingthehigheststandardsofquarantineandbygeographicallyspreadingoutitsfarmstopreventcrosscontamination.The7Rivalea-ownedfarmsandthe22ContractGrowerfarmsarewellspacedoutacrossthetwoAustralianstates. Within each farm, large tracts of buffer land are also maintained which surrounds the production units and this minimises the probability of contamination from spreading between the different herds.
2. Regulatory Sanctions
(a) Meat Industry
Rivaleaisinthefreshmeatindustry,withverticallyintegratedoperationsrangingfromthebreedingandrearing of livestock,totheslaughteringandboningprocess,tothemarketinganddeliveryoffreshproducts, andeventhepreparationofthestockfeed.Theseprocessesareregulatedbynumeroushealthandfoodsafety organisations and subject to regulatory sanctions. In Australia, the meat industry is governed by the AustralianQuarantineandInspectionServices(“AQIS”)whichisresponsiblefortheregistrationofabattoirs forboththedomesticandexportmarkets.Intermsoftheexportofmeat,Rivaleaissubjecttotheregulations offoreignregulatorybodiesintheterritoriesinwhichitmarketsitsmeatproductsincludingtheAgri-Food&Veterinary AuthorityinSingaporeandtheLivestockIndustryBureauoftheMinistryofAgriculture,Forestry&FisheriesinJapan.
Rivaleacurrentlymeetstheregulatoryrequirementsof theaboveorganisations.However,aswithall tradeandexportsinthefreshmeatindustry,regulatoryrequirementsandsanctionsmaybeimposedsuddenly duetohealth,disease,environmentalorotherreasons.Ifsuchsanctionsareimposed,Rivalea’sbusiness willbeaffectedanditmaybeforcedtoseekothermarketsforitsproducts.Failuretoseekothermarketsforits products on a timely basis or at all, will adversely affect the business, financial performance and position of the Group.
(b) Environment
RivaleaisalsoregulatedbytheVictorianandNewSouthWalesEnvironmentalProtectionAuthorities(“EPAs”).In theordinarycourseofbusiness,largeamountsofsolidandliquideffluentareproducedwhichneedtobetreated.As partoftheobligationsimposedbytheEPAs,Rivaleahasundertakenirrigationdevelopmentplanstoapplytreated abattoirand livestockeffluent toagricultural landover thenext fewyears.TheEPAscould impose furthermandatoryrequirementswhichcouldaffectRivalea’sbusinessinfutureandhaveanegativeimpact on the Group’s financial performance and position.

41
Supplementary InformationrequiredbytheListingManual
3. Cyclical, Seasonal and Varying Consumer Demand
The meat industry is firstly subject to the cyclical seasonal demand for certain types of meat. Consumer demand formeatcouldfluctuateduetoseasonality,forexample,surgesindemandforparticularcutsofmeatduringthe Christmas season or the Chinese Lunar New Year festivities.
Further,the industry isalsosubjecttovaryingconsumerdemand.Thiscouldbeattributabletofoodsafetyconsiderations,suchas thedrop inmeatsales in theaftermathofparticularepidemicoutbreaks.ThesefluctuationsindemandandsaleswouldimpactRivaleaintherelevantaffectedmarkets.
4. Competition
ThemarketsthatRivaleaoperatesinaresubjecttooccasionalperiodsofoversupply.Thelattercanarisefromanumberof sources such as overproduction from local producers in Australia or ‘dumping’ of frozen imported products in the
exportmarkets.
However,Rivalea’sstrategyistomaintainthemselvesasamongthemostefficientandcompetitiveproducersintheregionthroughitsproductionandtechnologicalexpertiseaswellasitsabilitytoachievelowerunitcostthrougheconomiesofscale.Furthermore,RivaleatargetsthefreshmeatmarketsegmentsinAustralia,SingaporeandJapanwhicharenotsubjecttocompetitionfromcheapimportedfrozenproducts.RivaleaisalsodominantinboththeAustraliandomesticandexportmarketandthisshouldenableittoadjustitsmarketingstrategiesaccordingtomarketcompetition.
TheGroup’sbreadmanufacturingbusiness issubject todirectcompetition fromsupermarketchainstoreswhomanufacturetheirownin-housebreadandbakeryproductsundertheirownbrandnamesforsaleintheirstores(“In-houseBrands”).ForexampleinSingapore,theGroup’sdirectcompetitorsinthebreadmanufacturingbusinessincludeNTUCFairpriceCo-operativeLtdandtheColdStoragechainofsupermarkets,bothofwhichhave their own In-house Brands. Although the Group’s ‘Gardenia’ and ‘Bonjour’ brands are amongst the leading brandsinthepackagedloafbreadmarketinSingapore,suchIn-houseBrandstypicallycompeteonlow-pricing.In the event that the Group is unable to compete effectively and continuously attract and retain its customers, the Group’s bread manufacturing business and operating results may be affected.
5. Employee Turnover/Union Risks
TheGroup’sbakeryoperationsrequireitsproductionemployeestoworkonshifts,whichinmostcasesare24hoursperday,anditssalesanddeliverystaff(whodeliverbakeryproductstocustomerssuchassupermarkets,conveniencestores,petrolstationsandprovisionshops)toworkwithinaverytighttimeframeandmostlyinthe very early hours of the morning.
Rivalea isalsohighlydependentonskilledstaff tooperate its feedmills,piggeriesandmeatprocessingplants.Thenatureofworkatthepiggeriesandmeatprocessingplantrequiresvocationallytrainedpersonnelandstaff toworkonshiftsystemstoensuremaximumproductivityandthat thepigsarecaredfor tothe
highest standards.

42
Supplementary InformationrequiredbytheListingManual
5. Employee Turnover/Union Risks (continued)
StaffmembersinthebakeryoperationsandRivaleaarelargelytrainedon-the-job.AnylossofstaffordisruptioninworkwouldadverselyaffecttheproductivityandbusinessofboththebakeryoperationsandRivaleauntilsuitable replacementsare foundand trained.Furthermore,occupationalhealthandsafety issues,equalopportunity issues, compensation and industrial relations issues could also result in industrial action and high employeeturnover.FailureoftheGrouptoretainitstrainedpersonneland/ortofindsuitablereplacementsona timely basis will be disruptive to its business operations.
6. Fluctuations in Raw Material Prices Rivaleaisinvolvedinlivestockfarmingandthemeatindustries.
Thepricesofrawmaterialcostsaffectthelivestockfarmingandmeatindustries.Theseindustriesaresubjecttoswings in production costs determined largely by grain prices. Grain prices fluctuate depending on the farming season’sweather,qualityandyieldofcropaswellasworldwidemarketpricesandsuchpriceswillinturnaffectthe costs of production. Grain prices affect the cost of animal feed and ultimately production cost per animal. Inparticular,Rivaleapurchasesthebulkofitsgrainrequirementsattheharvestseason.AnypricefluctuationsofrawagricultureproduceatthatpointwillaffecttheproductioncostswhichRivaleamaynotbeabletooffsetcommensurately by higher selling prices of their products. The fluctuations of raw material prices will have an impactonRivalea’soverallbusinessprofitability.
Tosomeextent,theabovefluctuationsinrawmaterialgrainpricesparticularlywheatpriceswillalsoaffectflourprices.Thelatterwillleadtoincreasesinproductioncostsofthebakeryoperationswhichmaynotbeabletoraisesellingpricesoftheirbakeryproductsadequatelytooffsetthefullimpactoftheriseinproductioncosts.
7. Fluctuations in Energy Costs
EnergycostsaresubjecttoglobaleconomicandpoliticaldevelopmentswhicharelargelyoutsideoftheGroup’scontrol.BakeryproductsaredeliveredbyafleetofCompany-owneddeliveryvehicles intheearlymorning,sevendaysaweekwithinatighttimeframetocustomerssoastoensurefreshness.Rivaleaexportsitsfreshchilled meat products by refrigerated containers on board commercial jet airliners. Distribution costs will increase significantly in the event of the escalation of crude oil prices.
The Group can only mitigate distribution cost increases through efficient logistics planning and controls to someextent.
43
Supplementary InformationrequiredbytheListingManual
8. Financial Risks (a) Credit Risk
Inthenormalcourseofbusiness,theGroupsalesdoinvolvetheextensionofcredittocustomerssuchas supermarkets,conveniencestores,petroleumcompanies,wholesalers,retailersandfoodserviceand catering operators.
Themaximumexposuretocreditriskisrepresentedbythecarryingamountofeachfinancialassetinthe balance sheet.
(b) Liquidity Risk
TheGroupmonitorsandmaintainsalevelofcashandcashequivalentswhichmanagementdeemsadequateto finance the Group’s operations and to mitigate the effects of fluctuations in cash flows.
(c) Foreign Currency Risk
TheGroupoperateswithintheAsiaPacificregionandcompanieswithintheGroupmaintaintheirbooksand records in their respective measurement currencies. The Group’s accounting policy is to translate the profits and lossesofoverseascompaniesusingtheweightedaverageexchangerates.Netassetsdenominatedinforeign currencies and held at year end are translated into Singapore dollars, the Group’s reporting currency, at year end. FluctuationsintheexchangeratebetweenthemeasurementcurrencyofthesubsidiarycompaniesandSingapore dollarswillthereforehaveanimpactontheGroup.Further,thereisnoassurancethattheGroupwillbeableto maintainitsfinancialperformanceandpositionintheeventoflongtermunfavourablemovementinexchangerates. Assuch,significantfluctuationsinforeignexchangerateswouldhaveanimpactonthefinancialperformanceand position of the Group.
Inaddition,somecompaniesintheGroupsuchasBenFoods(S)PteLtdandRivaleaexportsomeoftheirproducts in United States Dollars and other currencies, respectively. The fluctuations of these currencies do have some impact on the profits of these companies.
(d) Interest Rate Risk
TheGroup’sexposuretomarketriskforchangesininterestratesrelatesprimarilytotheGroup’sshort-termand long-termbankborrowings.Theinterestratesonsuchobligationsarefixedattheprevailingmarketratesasand whentheyfalldueforrollover.Theperiodforrolloverisbetweenonetosixmonths.Anincreaseintheprevailing interestrateswillresultinanincreaseintheinterestexpenseoftheGroupandthismayhaveanimpactonthe financial performance or position of the Group.

44
Supplementary InformationrequiredbytheListingManual
Name of Interested Person
Aggregate value of all interested person transactions during thefinancialyearunderreview(excludingtransactionsless than $100,000 and transactions conducted under Shareholders’MandatepursuanttoRule920oftheSGXListing Manual)
Aggregate value of all interested person transactions conducted under Shareholders’MandatepursuanttoRule920oftheSGXListingManual(excludingtransactions less than $100,000)
Mr Andree Halim (“AH”), a director and substantial shareholder of the Company
Pursuant to the subscription agreement entered into in July 2009 (“Subscription Agreement”), AH subscribed and was issuedazero-couponmandatorilyExchangeableBondbytheCompany for the principal sum of $10 million (“Bond”) in total. The Bond which was due for redemption by the Company on 31July2011hasbeenextendedatthemutualagreementofboth parties on 1 August 2011 for a further term of 2 years (“FurtherTerm”)subjecttothesametermsandconditionsas stated in the Subscription Agreement. The Bond is mandatorilyexchangeableintofullypaidandunencumberedordinary shares of the Company’s wholly-owned subsidiary, Hamsdale International Pte Ltd (“Hamsdale”) in the event HamsdaleislistedontheSingaporeExchangeSecuritiesTrading Limited or the Company shall redeem the Bond in full shouldtheinitialpublicofferingofHamsdalefailtotakeplacebytheexpiryoftheFurtherTerm.
Nil
Rule 907 : Interested Person Transactions for financial year 2011
Rule 1207(8) - Material contracts of the issuer and its subsidiaries
SaveasdisclosedpursuanttoRule907above,therewerenomaterialcontracts(orloans)enteredintobytheCompanyand/oritssubsidiarieswiththedirectorsorchiefexecutiveofficerorsubstantialshareholdersoftheCompanywhichwere still subsisting at the end of the financial year under review, or if not then subsisting, entered into since the end of the previous financial year.
Rule 1207(9)(e) – Minimum percentage of shares held by the public
Based on the information available to the Company, the substantial shareholders and directors of the Company and itssubsidiariesholdinaggregateapproximately72%ofthesharesintheCompanyandapproximately28%oftheshareholdingsisheldinthepublichands.TheCompanyconfirmsthatitisincompliancewithRule723oftheSGXListing Manual.

45
Supplementary InformationrequiredbytheListingManual
Rule 1207(6) – Audit and Non-Audit Services of Auditors
TheCompanyappointsErnst&YoungLLPwhichisafirmregisteredwiththeAccountingandCorporateRegulatoryAuthoritytoconductauditonitsfinancialstatements.TheCompanyalsoengagesErnst&YoungLLPforauditofitsSingapore-incorporatedsubsidiariesandmemberfirmsofErnst&YoungLLPforitssignificantforeignincorporatedsubsidiaries and associated companies.
TheauditfeespaidbytheGrouptotheauditorsfortheauditofFY2011andnon-auditservicesinFY2011amountedtoapproximately$1,082,000and$150,000respectively.
TheAuditCommitteehasundertakenareviewofsuchnon-auditservicesprovidedandintheAuditCommittee’sopinion they would not affect the independence of the auditors.
Rule 1207(10) – Board’s Opinion on the Adequacy of Internal Controls
The Board, with the concurrence of the audit committee, is of the opinion that there is a sound system of internal control to safeguard the shareholders’ investments and Company’s assets, and is satisfied that there has been no significantbreakdownorweaknessesinthematerialaspectoftheinternalcontrolsfortheGroup.

FinancialContents
47 Directors’ Report
51 Statement by Directors
52 Independent Auditors’ Report
54 Consolidated Income Statement
55 Consolidated Statement of Comprehensive Income
56 Statements of Financial Position
58 Consolidated Statement of Changes in Equity
60 Consolidated Statement of Cash Flows
63 Notes to the Financial Statements
46

47
FinancialContents Directors’ Report
ThedirectorshavepleasureinpresentingtheirreporttogetherwiththeauditedfinancialstatementsofQAFLimited(the “Company”) and its subsidiaries (the “Group”) and the statement of financial position of the Company for the financial year ended 31 December 2011.
Directors of the Company
The directors of the Company in office at the date of this report are:-
Didi Dawis (Chairman)Andree Halim (Vice-Chairman)Tan Kong King (Group Managing Director)Tarn Teh ChuenKelvin Chia Hoo KhunTan Hin HuatSohGimTeikLin KejianTriono J. Dawis
AccordingtotheregisterkeptbytheCompanyinaccordancewithSection164oftheSingaporeCompaniesAct(the“Act”), Chapter 50, particulars of interests of directors of the Company who held office at the end of the financial year in the shares and share options of the Company or its related corporations are as follows:
Direct interest Deemed interest
Names of DirectorsAt
1.1.2011At
31.12.2011At
21.1.2012At
1.1.2011At
31.12.2011At
21.1.2012
Number of shares in QAF Limited
Didi Dawis – – – 45,820,712 45,820,712 45,820,712Andree Halim – – – 306,071,547 322,428,286 322,837,286Tan Kong King 2,530,475 2,661,136 2,661,136 – – – Tarn Teh Chuen 904,993 951,722 951,722 – – – Lin Kejian – – – 190,822,770 207,179,509 207,588,509
Number of QAF Limited Share Options to subscribe for shares in the Company
Tan Kong King 2,000,000 2,000,000 2,000,000 – – – Tarn Teh Chuen 750,000 750,000 750,000 – – –

48
Directors’ Report
Directors of the Company (continued)
SavefortheMandatorilyExchangeableBond(asdisclosedinNote28tothefinancialstatement)issuedtoMrAndreeHalim and save that Messrs. Andree Halim and Lin Kejian are deemed interested, by virtue of Section 7(4) of the Act, in the shares held by the Company in its subsidiaries, no director who held office at the end of the financial year had an interest in any shares or debentures or rights or options over the shares in the related corporations of the Company.
Since the end of the previous financial year, no director of the Company has received or has become entitled to receive benefits under contracts (other than a benefit included in the aggregate amount on emoluments received or dueandreceivablebythedirectorsasshowninNote6tothefinancialstatementsattachedorthefixedsalaryofafulltimeemployeeoftheCompany)requiredtobedisclosedbySection201(8)oftheAct.
Save for the share option scheme as detailed below, neither at the end of the financial year, nor at any time during the year, did there subsist any arrangements, to which the Company is a party, being arrangements whose objects are,oroneofwhoseobjectsis,toenabledirectorsoftheCompanytoacquirebenefitsbymeansoftheacquisitionof shares in, or debentures of, the Company or any other body corporate.
Share Options to subscribe for ordinary shares
(a) ShareoptionsundertheQAFLimitedShareOptionScheme2000(the“2000Scheme”)
(i) The2000SchemewasapprovedbythemembersoftheCompanyatanExtraordinaryGeneralMeetingheld on 12 May 2000. The total number of shares in respect of which options may be offered on any offering date, when added to the number of shares issued or issuable in respect of options under this Schemeshallnotexceed15%of the issuedsharecapitalof theCompanyon thedaypreceding thatoffering date.
EachoptionshallentitletheholderoftheoptiontosubscribeforanordinaryshareintheCompanyattheprescribedexerciseprice.Theexercisepriceofeachshareinrespectofanoptiongrantedmaybe(i)theaverageofthelastdealtpricesofthesharesoftheCompany,asdeterminedbyreferencetotheFinancialNewsorotherpublicationpublishedbytheSingaporeExchangeSecuritiesTradingLimited,forthethreeconsecutivetradingdaysimmediatelyprecedingtheofferingdateofthatoption(“MarketPrice”)or(ii)atadiscountnotexceeding20%oftheMarketPrice,butinanyeventnoexercisepriceshallbelessthan$0.40per share (being the par value of an ordinary share in the Company immediately before the abolishment of par value by the Companies (Amendment) Act 2005).
An option granted is valid for 10 years (unless otherwise terminated or lapsed pursuant to the rules as stipulatedinthe2000Scheme)andisexercisable,foranoptiongrantedwithoutdiscounttotheMarketPrice,afteravestingperiodof1yearandforanoptiongrantedatadiscounttotheMarketPrice,afteravesting period of 2 years.
The2000Schemeexpiredin2010withoutrenewal.However,thediscontinuationofthe2000Schemedoesnotaffecttherightsoftheoptionholderstovalidlyexercisetheiroptionswithintherespectiverelevantexerciseperiodasstatedbelowinsub-paragraph(b).

49
Directors’ Report
Share Options to subscribe for ordinary shares (continued)
(a) ShareoptionsundertheQAFLimitedShareOptionScheme2000(the“2000Scheme”)(continued)
(ii) DisclosurespursuanttoRule852oftheListingManual:
The2000Scheme isadministeredby the2000ShareOptionCommitteewithmembersappointedbythe Board, comprising one non-executive director (namelyMr Didi Dawis) and one executive director(namelyMrTanKongKing).Non-executivedirectors,controllingownersoftheparentandtheirassociates(as defined in the Listing Manual) are not eligible to participate in the 2000 Scheme. The directors of the Company who were granted options under the 2000 Scheme are as follows:
Name of participant
Optionsgranted during
financial yearunder review
Aggregateoptions
granted sincecommencement
of the 2000Scheme to end
of financial yearunder review
Aggregateoptions
exercised sincecommencement
of the 2000Scheme to end
of financial yearunder review
Aggregateoptions
outstandingas at end of
financial yearunder review
Tan Kong King Nil 2,600,000 600,000 2,000,000Tarn Teh Chuen Nil 1,460,000 710,000 750,000
NoneoftheexecutivedirectorsandemployeesoftheGroupwhoparticipatedinthe2000Schemehasreceived 5% or more of the total number of options available under the 2000 Scheme.
(b) Duringthefinancialyear,1,122,000ordinarysharesoftheCompanywereissuedpursuanttotheexerciseofoptions by employees and directors of the Group. Unissued ordinary shares under options as at 31 December 2011 comprise:
Outstanding unexercisedoptions for ordinary shares
in the CompanyExercise price
per share Exercise period
Year 2002 1,139,000 $0.555 6 April 2003 to 5 April 2012Year 2004 1,950,000 $0.523 14 May 2005 to 13 May 2014Year 2005 1,745,000 $0.513 18 August 2006 to 17 August 2015Year 2006 2,875,000 $0.565 19 May 2007 to 18 May 2016
7,709,000
Noneoftheoptionswasgrantedatadiscounttothemarketprice.
The holders of the options under 2000 Scheme have no right to participate by virtue of these options in any share issue of any other company in the Group.

50
Audit committee
TheauditcommitteeperformedthefunctionsspecifiedintheAct.ThefunctionsperformedaredetailedintheReporton Corporate Governance.
Auditors
Ernst&YoungLLPhaveexpressedtheirwillingnesstoacceptreappointmentasauditors.
Onbehalfoftheboardofdirectors:
Tan Kong KingDirector
Tarn Teh ChuenDirector
Singapore16 March 2012
Directors’ Report

51
We,TanKongKingandTarnTehChuen,beingtwoof thedirectorsofQAFLimited,doherebystate that, in theopinion of the directors:
(i) the accompanying statements of financial position, consolidated income statement, consolidated statement of comprehensiveincome,consolidatedstatementofchangesinequity,andconsolidatedstatementofcashflowstogether with notes thereto are drawn up so as to give a true and fair view of the state of affairs of the Group and oftheCompanyasat31December2011andoftheresultsofthebusiness,changesinequityandcashflowsof the Group for the year ended on that date, and
(ii) at the date of this statement, there are reasonable grounds to believe that the Company will be able to pay its debts as and when they fall due.
Onbehalfoftheboardofdirectors:
Tan Kong KingDirector
Tarn Teh Chuen Director
Singapore16 March 2012
Statement by Directors
52
Report on the financial statements
We have audited the accompanying financial statements of QAF Limited (the “Company”) and its subsidiaries(collectively the “Group”) set out on pages 54 to 147, which comprise the statements of financial position of the GroupandtheCompanyasat31December2011,theconsolidatedstatementofchangesinequity,theconsolidatedincome statement, consolidated statement of comprehensive income and consolidated statement of cash flows of the Groupfortheyearthenended,andasummaryofsignificantaccountingpoliciesandotherexplanatoryinformation.
Management’s responsibility for the financial statements
Management is responsible for the preparation of financial statements that give a true and fair view in accordance with theprovisionsoftheSingaporeCompaniesAct,Chapter50(the“Act”)andSingaporeFinancialReportingStandards,and for devising and maintaining a system of internal accounting controls sufficient to provide a reasonable assurance that assets are safeguarded against loss from unauthorised use or disposition; and transactions are properly authorised and that they are recorded as necessary to permit the preparation of true and fair profit and loss accounts and balance sheets and to maintain accountability of assets.
Auditor’s responsibility
Our responsibility is toexpressanopinionon thesefinancial statementsbasedonouraudit.Weconductedouraudit inaccordancewithSingaporeStandardsonAuditing.Thosestandards require thatwecomplywithethicalrequirementsandplanandperformtheaudittoobtainreasonableassuranceaboutwhetherthefinancialstatementsare free from material misstatement.
An audit involves performing procedures to obtain audit evidence about the amounts and disclosures in the financial statements.Theproceduresselecteddependontheauditor’s judgment, includingtheassessmentoftherisksofmaterialmisstatementofthefinancialstatements,whetherduetofraudorerror.Inmakingthoseriskassessments,the auditor considers internal control relevant to the entity’s preparation of financial statements that give a true and fair view in order to design audit procedures that are appropriate in the circumstances, but not for the purpose ofexpressinganopinionon theeffectivenessof theentity’s internalcontrol. An audit also includes evaluating the appropriateness of accounting policies used and the reasonableness of accounting estimates made by management, as well as evaluating the overall presentation of the financial statements.
We believe that the audit evidence we have obtained is sufficient and appropriate to provide a basis for our audit opinion.
Independent Auditors’ ReportFortheyearended31December2011TotheMembersofQAFLimited
53
Opinion
In our opinion, the consolidated financial statements of the Group and the statement of financial position of the Companyareproperlydrawnup inaccordancewith theprovisionsof theActandSingaporeFinancialReportingStandards so as to give a true and fair view of the state of affairs of the Group and of the Company as at 31 December 2011andoftheresults,changesinequityandcashflowsoftheGroupfortheyearendedonthatdate.
Report on other legal and regulatory requirements
Inouropinion, theaccountingandother records requiredby theAct tobekeptby theCompanyandby thosesubsidiariesincorporatedinSingaporeofwhichwearetheauditorshavebeenproperlykeptinaccordancewiththeprovisions of the Act.
Ernst & Young LLPPublic Accountants andCertified Public Accountants
Singapore16 March 2012
Independent Auditors’ ReportFortheyearended31December2011TotheMembersofQAFLimited

54
Note 2011 2010
$’000 $’000
Revenue 3 976,981 856,410
Costs and expenses
Costs of materials 541,796 455,595
Staff costs 4 206,809 183,105
Amortisation and depreciation 5 34,791 31,139
Repairsandmaintenance 31,964 27,365
Otheroperatingexpenses 73,284 79,648
Total costs and expenses (888,644) (776,852)
Profit from operating activities 6 88,337 79,558
Financecosts 7 (6,725) (6,808)
Shareofprofits/(losses)ofassociates 42 (1,811)
Profit before taxation 81,654 70,939
Taxation 8 (15,746) (14,092)
Profit after taxation 65,908 56,847
Attributable to:
Ownersoftheparent 59,162 48,737
Non-controlling interests 6,746 8,110
65,908 56,847
Earningsperordinaryshare: 9
– Basic 11.6 cents 10.0 cents
– Diluted 11.6 cents 10.0 cents
Consolidated Income StatementFortheyearended31December2011(In Singapore dollars)
The accompanying accounting policies and explanatory notes form an integral part of the financial statements.

55
2011 2010
$’000 $’000
Profit after taxation 65,908 56,847
Other comprehensive income:
Currency translation arising on consolidation (342) 6,513
Actuarial loss on defined benefit plans (2,886) (1,297)
Realisationofreservesupondisposalofanassociate (694) –
Share of other comprehensive income of associates 4 (24)
Other comprehensive income for the year, net of tax (3,918) 5,192
Total comprehensive income for the year 61,990 62,039
Total comprehensive income attributable to:
Ownersoftheparent 55,637 53,575
Non-controlling interests 6,353 8,464
61,990 62,039
Consolidated Statement of Comprehensive IncomeFortheyearended31December2011(In Singapore dollars)
The accompanying accounting policies and explanatory notes form an integral part of the financial statements.

56
Group Company
Note 2011$’000
2010$’000
2011$’000
2010$’000
ASSETS
Current assets
Biological assets 10 62,507 60,500 – –
Inventories 11 84,609 65,637 – –
Trade receivables 12 84,467 78,824 – –
Otherreceivables 13 13,896 37,145 40,668 41,912
Taxrecoverable 384 135 – –
Short-term investments 14 456 381 – –
Cash and deposits 15 74,872 68,046 25,735 21,436
321,191 310,668 66,403 63,348
Assets classified as held for sale 16 1,673 8,810 – –
322,864 319,478 66,403 63,348
Non-current assets
Property,plantandequipment 17 311,544 261,599 2,522 2,502
Investment properties 18 18,923 19,548 – –
Subsidiaries 19 – – 98,718 98,718
Advances to subsidiaries 20 – – 123,210 111,631
Associates 21 1,942 1,896 – –
Advances to associates 22 3,019 3,009 – –
Long-term investments 23 8,886 – 6,886 –
Intangibles 24 3,058 2,726 2,449 2,638
Deferredtaxassets 25 17,769 17,749 – –
365,141 306,527 233,785 215,489
Total assets 688,005 626,005 300,188 278,837
Statements of Financial PositionAs at 31 December 2011(In Singapore dollars)
The accompanying accounting policies and explanatory notes form an integral part of the financial statements.

57
Group Company
Note 2011$’000
2010$’000
2011$’000
2010$’000
LIABILITIES
Current liabilities
Trade payables 26 87,040 73,243 55 71
Otherpayables 27 48,135 41,044 6,688 7,110
Exchangeablebond 28 – 10,000 – 10,000
Short-term borrowings 29 71,524 41,416 7,863 –
Long-term loans and finance leases – current portion 30 2,554 18,543 – 9,851
Provisionfortaxation 4,057 6,179 1,672 1,995
213,310 190,425 16,278 29,027
Non-current liabilities
Otherpayables 27 14,684 13,655 – –
Exchangeablebond 28 10,000 – 10,000 –
Pension liabilities 31 2,815 740 – –
Long-term loans and finance leases 30 23,080 43,694 – 7,469
Deferredtaxliabilities 25 11,944 10,674 450 485
62,523 68,763 10,450 7,954
Total liabilities 275,833 259,188 26,728 36,981
Net assets 412,172 366,817 273,460 241,856
CAPITAL AND RESERVES
Share capital 32 227,156 214,823 227,156 214,823
Reserves 33 161,028 125,517 46,304 27,033
Equityattributabletoownersoftheparent 388,184 340,340 273,460 241,856
Non-controlling interests 23,988 26,477 – –
Total equity 412,172 366,817 273,460 241,856
Statements of Financial PositionAs at 31 December 2011(In Singapore dollars)
The accompanying accounting policies and explanatory notes form an integral part of the financial statements.

58
Attributable to owners of the parent
NoteShare
capital$’000
Revaluation reserve
$’000
Capital reserve
$’000
Revenue reserve
$’000
Foreign currency
translation reserve
$’000Total $’000
Non-controlling
interests$’000
Totalequity$’000
Balance at 1 January 2011 214,823 2,360 19,005 96,071 8,081 340,340 26,477 366,817
Total comprehensive income for the year
Net profit for the year – – – 59,162 – 59,162 6,746 65,908
Othercomprehensiveincome for the year:
- Currency translation arising on consolidation – – – – 51 51 (393) (342)
- Transfer between reserves – (48) – 48 – – – – - Actuarial loss on defined
benefit plans – – – (2,886) – (2,886) – (2,886)- Realisation of reserves
upon disposal of an associate – – (1,064) – 370 (694) – (694)
- Share of other comprehensive income of associates – – – – 4 4 – 4
Othercomprehensiveincome for the year, netoftax – (48) (1,064) (2,838) 425 (3,525) (393) (3,918)
Total comprehensive income for the year – (48) (1,064) 56,324 425 55,637 6,353 61,990
Transactions with owners in their capacity as owners
Contributions by and distributions to owners
Issuance of ordinary shares fromexerciseofoptions 32 590 – – – – 590 – 590
Issuance of ordinary shares in lieu of cash dividends 32 11,743 – – – – 11,743 – 11,743
Dividends 34 – – – (20,126) – (20,126) (8,842) (28,968)
Total transactions with owners in their capacity as owners 12,333 – – (20,126) – (7,793) (8,842) (16,635)
Balance at 31 December 2011 227,156 2,312 17,941 132,269 8,506 388,184 23,988 412,172
Consolidated Statement of Changes in EquityFortheyearended31December2011(In Singapore dollars)
The accompanying accounting policies and explanatory notes form an integral part of the financial statements.

59
Consolidated Statement of Changes in EquityFortheyearended31December2011(In Singapore dollars)
The accompanying accounting policies and explanatory notes form an integral part of the financial statements.
Attributable to owners of the parent
NoteShare
capital$’000
Revaluation reserve
$’000
Capital reserve
$’000
Revenue reserve
$’000
Foreign currency
translation reserve
$’000Total $’000
Non-controlling
interests$’000
Total equity$’000
Balance at 1 January 2010 202,692 2,409 19,005 67,989 1,946 294,041 28,370 322,411
Total comprehensive income for the year
Net profit for the year – – – 48,737 – 48,737 8,110 56,847
Othercomprehensiveincome for the year:
- Currency translation arising on consolidation – – – – 6,159 6,159 354 6,513
- Transfer between reserves – (49) – 49 – – – – - Actuarial loss on defined
benefit plans – – – (1,297) – (1,297) – (1,297)- Share of other
comprehensive income of associates – – – – (24) (24) – (24)
Othercomprehensiveincome for the year, netoftax – (49) – (1,248) 6,135 4,838 354 5,192
Total comprehensive income for the year – (49) – 47,489 6,135 53,575 8,464 62,039
Transactions with owners in their capacity as owners
Contributions by and distributions to owners
EffectofchangesinGroupstructure – – – – – – (2,375) (2,375)
Issuance of ordinary shares fromexerciseofoptions 32 2,674 – – – – 2,674 – 2,674
Issuance of ordinary shares in lieu of cash dividends 32 9,457 – – – – 9,457 – 9,457
Dividends 34 – – – (19,407) – (19,407) (7,982) (27,389)
Total transactions with owners in their capacity as owners 12,131 – – (19,407) – (7,276) (10,357) (17,633)
Balance at 31 December 2010 214,823 2,360 19,005 96,071 8,081 340,340 26,477 366,817
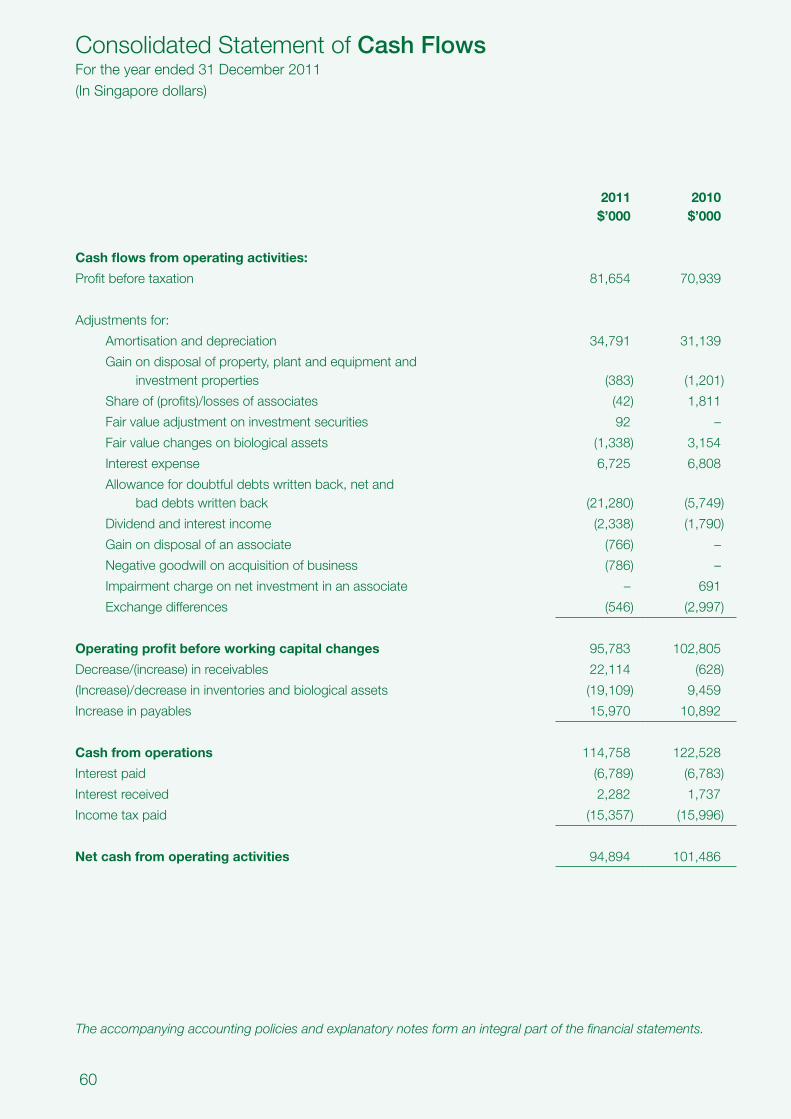
60
2011$’000
2010$’000
Cash flows from operating activities:
Profitbeforetaxation 81,654 70,939
Adjustments for:
Amortisation and depreciation 34,791 31,139
Gainondisposalofproperty,plantandequipmentand investment properties (383) (1,201)
Shareof(profits)/lossesofassociates (42) 1,811
Fairvalueadjustmentoninvestmentsecurities 92 –
Fairvaluechangesonbiologicalassets (1,338) 3,154
Interestexpense 6,725 6,808
Allowancefordoubtfuldebtswrittenback,netand baddebtswrittenback (21,280) (5,749)
Dividend and interest income (2,338) (1,790)
Gain on disposal of an associate (766) –
Negativegoodwillonacquisitionofbusiness (786) –
Impairment charge on net investment in an associate – 691
Exchangedifferences (546) (2,997)
Operating profit before working capital changes 95,783 102,805
Decrease/(increase)inreceivables 22,114 (628)
(Increase)/decreaseininventoriesandbiologicalassets (19,109) 9,459
Increase in payables 15,970 10,892
Cash from operations 114,758 122,528
Interest paid (6,789) (6,783)
Interest received 2,282 1,737
Incometaxpaid (15,357) (15,996)
Net cash from operating activities 94,894 101,486
Consolidated Statement of Cash FlowsFortheyearended31December2011(In Singapore dollars)
The accompanying accounting policies and explanatory notes form an integral part of the financial statements.

61
Note 2011$’000
2010$’000
Cash flows from investing activities:
Purchaseofproperty,plantandequipmentandinvestmentproperties (57,010) (37,714)
Progresspaymentforpurchaseofproperty,plantandequipment – (16,222)
Proceedsfromdisposalofproperty,plantandequipmentand investment properties 1,891 1,795
Purchase of investments (9,039) (55)
Dividends received from investments 56 53
(Increase)/decreaseinadvancestoassociates (10) 81
Net cash inflow on disposal of an associate A 72 –
Net cash outflow from decrease in interest in a subsidiary – (1)
Netcashoutflowonacquisitionofbusiness B (2,264) (3,944)
Net cash used in investing activities (66,304) (56,007)
Cash flows from financing activities:
Dividends paid during the year (8,383) (9,950)
Dividends paid to non-controlling interests (5,155) (10,641)
Proceeds from short-term borrowings 29,599 2,861
Repaymentoflong-termborrowings (41,208) (22,276)
Proceeds from issuance of share capital 590 2,674
Net cash used in financing activities (24,557) (37,332)
Netincreaseincashandcashequivalents 4,033 8,147
Cashandcashequivalentsatbeginningofyear 35 68,046 58,950
Effectofexchangeratechangesoncashandcashequivalents (65) 949
Cashandcashequivalentsatendofyear 35 72,014 68,046
Consolidated Statement of Cash FlowsFortheyearended31December2011(In Singapore dollars)
The accompanying accounting policies and explanatory notes form an integral part of the financial statements.

62
Note A - Analysis of disposal of an associate
2011
$’000
Net assets disposed –
Gain on disposal of an associate 766
Realisationofreservesupondisposalofanassociate (694)
Net cash inflow on disposal of an associate 72
Note B - Analysis of acquisition of business
2011
$’000
Property,plantandequipment (2,602)
Intangibles (448)
Netbusinessacquired (3,050)
Negative goodwill arising on consolidation 786
Netcashoutflowonacquisitionofbusiness (2,264)
Consolidated Statement of Cash FlowsFortheyearended31December2011(In Singapore dollars)
The accompanying accounting policies and explanatory notes form an integral part of the financial statements.

63
1. General
Corporate information
QAFLimited(the“Company”)isapubliclimitedliabilitycompanyincorporatedanddomiciledinSingapore.TheregisteredaddressandprincipalplaceofbusinessofQAFLimitedis150SouthBridgeRoad,#09-04FookHaiBuilding, Singapore 058727.
The principal activities of the Company are those of an investment holding and management company. The principalactivitiesoftheGroupconsistofthemanufactureanddistributionofbread,bakeryandconfectioneryproducts; provision for warehousing logistics for food items; trading and distribution of food and beverages; production,processingandmarketingofmeat; feedmillingandsaleofanimal feedsandrelated ingredients;production, processing and sale of dairy products and investment holding.
2. Summary of significant accounting policies
2.1 Basis of preparation
The consolidated financial statements of the Group and the statement of financial position of the Company have been prepared in accordance with the provisions of the Singapore Companies Act, Chapter 50 and Singapore FinancialReportingStandards(“FRS”).
Thefinancialstatementshavebeenpreparedonahistoricalcostbasis,exceptasdisclosedintheaccountingpolicies below.
The financial statements are presented in Singapore dollars (SGD or $) and all values in the tables are rounded to the nearest thousand ($’000) as indicated.
2.2 Changes in accounting policies
Theaccountingpoliciesadoptedareconsistentwiththoseofthepreviousfinancialyearexceptinthecurrentfinancialyear,theGrouphasadoptedallthenewandrevisedstandardsandInterpretationsofFRS(INTFRS)that are effective for annual periods beginning on or after 1 January 2011. The adoption of these standards and interpretations did not have any effect on the financial performance or position of the Group and the Company.
Notes to the Financial Statements 31 December 2011(In Singapore dollars)

64
Notes to the Financial Statements 31 December 2011(In Singapore dollars)
2. Summary of significant accounting policies (continued)
2.3 Standards issued but not yet effective
The Group has not adopted the following standards and interpretations that have been issued but are not yet effective:
Description
Effective for annual periods beginning
on or after
AmendmenttoFRS101–SevereHyperinflationandRemovalofFixedDatesforFirst-timeAdopters 1 July 2011
AmendmentstoFRS107Disclosures–TransfersofFinancialAssets 1 July 2011AmendmentstoFRS12DeferredTax:RecoveryofUnderlyingAssets 1 January 2012AmendmentstoFRS1PresentationofItemsofOtherComprehensiveIncome 1 July 2012RevisedFRS19EmployeeBenefits 1 January 2013RevisedFRS27SeparateFinancialStatements 1 January 2013RevisedFRS28InvestmentsinAssociatesandJointVentures 1 January 2013FRS110ConsolidatedFinancialStatements 1 January 2013FRS111JointArrangements 1 January 2013FRS112DisclosureofInterestsinOtherEntities 1 January 2013FRS113FairValueMeasurements 1 January 2013
ExceptfortherevisedFRS19,AmendmentstoFRS1andFRS112,thedirectorsexpectthattheadoptionofthe other standards and interpretations above will have no material impact on the financial statements in the period of initial application. The nature of the impending changes in accounting policy on adoption of the revised FRS19,AmendmentstoFRS1andFRS112aredescribedbelow.
Revised FRS 19 Employee Benefits
TherevisedFRS19EmployeeBenefitsiseffectiveforfinancialperiodsbeginningonorafter1January2013.
TherevisedFRS19removesthecorridormechanismfordefinedbenefitplansandnolongerallowsactuarialgains and losses to be recognised in profit or loss. The distinction between short-term and long-term employee benefitsisbasedonexpectedtimingofsettlementratherthanemployeeentitlement.TherevisedFRS19istobe applied retrospectively.
TheGroupdoes not expect anymaterial impact on its financial position or performance upon adoption ofthis standard.

65
Notes to the Financial Statements 31 December 2011(In Singapore dollars)
2. Summary of significant accounting policies (continued)
2.3 Standards issued but not yet effective (continued)
Amendments to FRS 1 Presentation of Items of Other Comprehensive Income
TheAmendmentstoFRS1PresentationofItemsofOtherComprehensiveIncome(OCI)iseffectiveforfinancialperiods beginning on or after 1 July 2012.
TheAmendmentstoFRS1changesthegroupingofitemspresentedinOCI.Itemsthatcouldbereclassifiedtoprofit or loss at a future point in time would be presented separately from items which will never be reclassified. AstheAmendmentsonlyaffectthepresentationsofitemsthatarealreadyrecognisedinOCI,theGroupdoesnotexpectanyimpactonitsfinancialpositionorperformanceuponadoptionofthisstandard.
FRS 112 Disclosure of Interests in Other Entities
FRS112iseffectiveforfinancialperiodsbeginningonorafter1January2013.
FRS112isanewandcomprehensivestandardondisclosurerequirementsforallformsof interestsinotherentities, including joint arrangements, associates, special purpose vehicles and other off balance sheet vehicles. FRS112requiresanentitytodiscloseinformationthathelpsusersofitsfinancialstatementstoevaluatethenatureandrisksassociatedwithitsinterestsinotherentitiesandtheeffectsofthoseinterestsonitsfinancialstatements.TheGroupiscurrentlydeterminingtheimpactofthedisclosurerequirements.Asthisisadisclosurestandard, it will have no impact to the financial position and financial performance of the Group when implemented in 2013.
2.4 Basis of consolidation
Business combinations from 1 January 2010
The consolidated financial statements comprise the financial statements of the Company and its subsidiaries as at the end of the reporting period. The financial statements of the subsidiaries used in the preparation of the consolidated financial statements are prepared for the same reporting date as the Company. Consistent accountingpoliciesareappliedtoliketransactionsandeventsinsimilarcircumstances.
All intra-group balances, income and expenses and unrealised gains and losses resulting from intra-grouptransactions are eliminated in full.
Subsidiariesareconsolidatedfromthedateofacquisition,beingthedateonwhichtheGroupobtainscontrol,and continue to be consolidated until the date that such control ceases.
Businesscombinationsareaccountedforbyapplyingtheacquisitionmethod.Identifiableassetsacquiredandliabilitiesassumedinabusinesscombinationaremeasuredinitiallyattheirfairvaluesattheacquisitiondate.Acquisition-relatedcostsarerecognisedasexpenses intheperiods inwhichthecostsare incurredandtheservices are received.

66
Notes to the Financial Statements 31 December 2011(In Singapore dollars)
2. Summary of significant accounting policies (continued)
2.4 Basis of consolidation (continued)
Business combinations from 1 January 2010 (continued)
WhentheGroupacquiresabusiness, itassessesthefinancialassetsandliabilitiesassumedforappropriateclassification and designation in accordance with the contractual terms, economic circumstances and pertinent conditionsasattheacquisitiondate.Thisincludestheseparationofembeddedderivativesinhostcontractsbytheacquiree.
Anycontingentconsiderationtobetransferredbytheacquirerwillberecognisedatfairvalueattheacquisitiondate.Subsequentchangestothefairvalueofthecontingentconsiderationwhichisdeemedtobeanassetorliability,willberecognisedinaccordancewithFRS39eitherinprofitorlossoraschangetoothercomprehensiveincome. If the contingent consideration is classified as equity, it is not remeasured until it is finally settledwithinequity.
Inbusinesscombinationsachievedinstages,previouslyheldequityinterestsintheacquireeareremeasuredtofairvalueattheacquisitiondateandanycorrespondinggainorlossisrecognisedinprofitorloss.
TheGroupelectsforeachindividualbusinesscombination,whethernon-controllinginterestintheacquiree(ifany)isrecognisedontheacquisitiondateatfairvalue,oratthenon-controllinginterest’sproportionateshareoftheacquireeidentifiablenetassets.
Anyexcessofthesumofthefairvalueoftheconsiderationtransferredinthebusinesscombination,theamountofnon-controllinginterestintheacquiree(ifany),andthefairvalueoftheGroup’spreviouslyheldequityinterestintheacquiree(ifany),overthenetfairvalueoftheacquiree’sidentifiableassetsandliabilitiesisrecordedasgoodwill.TheaccountingpolicyforgoodwillissetoutinNote2.13.Ininstanceswherethelatteramountexceedstheformer,theexcessisrecognisedasgainonbargainpurchaseinprofitorlossontheacquisitiondate.
Business combinations before 1 January 2010
Incomparisontotheabovementionedrequirements,thefollowingdifferencesapplied:
Business combinations are accounted for by applying the purchase method. Transaction costs directly attributabletotheacquisitionformedpartoftheacquisitioncosts.Thenon-controllinginterest(formerlyknownasminorityinterest)wasmeasuredattheproportionateshareoftheacquiree’sidentifiablenetassets.
Business combinations achieved in stages were accounted for as separate steps. Adjustments to those fair valuesrelatingtopreviouslyheldinterestsaretreatedasarevaluationandrecognisedinequity.
WhentheGroupacquiredabusiness,embeddedderivativesseparatedfromthehostcontractbytheacquireearenot reassessedonacquisitionunless thebusinesscombination results in a change in the termsof thecontractthatsignificantlymodifiesthecashflowsthatwouldotherwiseberequiredunderthecontract.

67
Notes to the Financial Statements 31 December 2011(In Singapore dollars)
2. Summary of significant accounting policies (continued)
2.4 Basis of consolidation (continued)
Business combinations before 1 January 2010 (continued)
Contingent consideration was recognised if, and only if, the Group had a present obligation, the economic outflowwasmorelikelythannotandareliableestimatewasdeterminable.Subsequentmeasurementstothecontingent consideration affected goodwill.
2.5 Foreign currencies
The Group’s consolidated financial statements are presented in Singapore Dollars, which is also the parent company’s functional currency. Each entity in theGroup determines its own functional currency and itemsincluded in the financial statements of each entity are measured using that functional currency.
Transactions arising in foreign currencies during the year are translated into functional currencies at rates closely approximatingthoserulingonthetransactiondates.Foreigncurrencymonetaryassetsandliabilitiesattheendofthereportingperiodaretranslatedintofunctionalcurrencyatexchangeratesrulingattheendofthereportingperiod. All exchange differences arising from such translations are included in the profit or loss. Exchangedifferences arising from long-term inter-company balances which are effectively part of the net investments are recognised initially in other comprehensive income and accumulated under foreign currency translation reserve inequity.
Forinclusionintheconsolidatedfinancialstatements,allassetsandliabilitiesofforeignentitiesaretranslatedintoSingaporedollarsattheexchangeratesrulingattheendofthereportingperiodandtheresultsofforeignentitiesaretranslatedintoSingaporedollarsattheaverageexchangeratesfortheyear.Exchangedifferencesduetosuchcurrencytranslationsareincludedinforeigncurrencytranslationreserve.Ondisposalofaforeignentity, such foreign currency translation reserve is recognised in profit or loss.
Goodwillandfairvalueadjustmentsarisingfromtheacquisitionofaforeignentityaretreatedasassetsandliabilities of the foreign entity and are translated at the closing rate.
2.6 Property, plant and equipment
Property,plantandequipmentarestatedatcostorvaluationlessaccumulateddepreciationandimpairmentloss. The cost of an asset comprises its purchase price and any directly attributable costs of bringing the asset toworkingconditionforitsintendeduse.Expenditureforadditions,improvementsandrenewalsarecapitalisedandexpenditureformaintenanceandrepairsareincludedintheprofitorloss.Whenassetsaresoldorretired,their cost and accumulated depreciation are removed from the statement of financial position and any gain or loss resulting from their disposal is included in the profit or loss.
Assets held under finance leases are depreciated over their estimated useful lives or terms of the leases, whichever is shorter.

68
Notes to the Financial Statements 31 December 2011(In Singapore dollars)
2. Summary of significant accounting policies (continued)
2.6 Property, plant and equipment (continued)
Any revaluation surplus is recognised in other comprehensive income and accumulated in equity underrevaluationreserve,excepttotheextentthat itreversesarevaluationdecreaseofthesameassetpreviouslyrecognised in profit or loss, in which case the increase is recognised in profit or loss. A revaluation deficit is recognisedinprofitorloss,excepttotheextentthatitoffsetsanexistingsurplusonthesameassetcarriedinthe revaluation reserve.
Any accumulated depreciation as at the revaluation date is eliminated against the gross carrying amount of the asset and the net amount is restated to the revalued amount of the asset. The whole of the revaluation surplus included in the revaluation reserve in respect of an asset is transferred directly to revenue reserve on retirement or disposal of the asset.
2.7 Investment properties
Investment properties are stated at cost less accumulated depreciation and impairment loss. The cost of an assetcomprisesitspurchasepriceandanydirectlyattributablecostsofbringingtheassettoworkingconditionforitsintendeduse.Expenditureforadditions,improvementsandrenewalsarecapitalisedandexpenditureformaintenance and repairs are included in the profit or loss.
Investment properties are derecognised when either they have been disposed of or when the investment propertyispermanentlywithdrawnfromuseandnofutureeconomicbenefitisexpectedfromitsdisposal.Anygains or losses on the retirement or disposal of an investment property are recognised in profit or loss in the year of retirement or disposal.
2.8 Depreciation
Depreciation is not provided for freehold land due to its unlimited useful life and for construction-in-progress until it is completed and put into use.
Depreciation iscalculatedsoastowrite-off thecostofotherproperty,plantandequipmentand investmentproperties,includingthoseheldunderfinanceleases,onastraight-linebasisovertheexpectedusefullivesofthe assets concerned. The principal annual rates used for this purpose are:
%
Investment properties – 2 - 33 1/3
Freeholdbuildings – 2 - 2 1/2 Leasehold properties – 2 - 6 Leasehold improvements – 2 - 20Plant and machinery – 5 - 33 1/3
Furniture,fittingsandofficeequipment – 7 1/2 - 40Motor vehicles – 10 - 33 1/3

69
Notes to the Financial Statements 31 December 2011(In Singapore dollars)
2. Summary of significant accounting policies (continued)
2.8 Depreciation (continued)
The useful life and depreciation method are reviewed annually to ensure that the method and period of depreciationareconsistentwiththeexpectedpatternofeconomicbenefitsfromitemsofproperty,plantandequipmentandinvestmentproperties.
Fullydepreciatedassetsareretainedinthefinancialstatementsuntiltheyarenolongerinuseandnofurthercharge for depreciation is made in respect of these assets.
2.9 Subsidiaries
A subsidiary is a company over which the Group has the power to govern the financial and operating policies so as to obtain benefits from its activities. The Group generally has such power when it, directly or indirectly, holds more than 50% of the issued share capital, or controls more than half of the voting power, or controls the composition of the board of directors.
In the Company’s separate financial statements, investments in subsidiaries are accounted for at cost less impairment losses.
2.10 Associates
TheGrouptreatsasassociatesthosecompaniesinwhichalongtermequityinterestofbetween20and50percent is held and over whose financial and operating policy decisions it has significant influence.
Associates are accounted for under theequitymethodwhereby theGroup’s shareofprofits and lossesofassociatesisincludedintheconsolidatedprofitorloss.TheGroup’sshareofthepost-acquisitionreservesisincludedintheinvestmentsintheconsolidatedstatementoffinancialposition.Theseamountsaretakenfromthe latest available financial statements of the companies concerned, made up to the end of the financial year of the Group.
Where the accounting policies of associates do not conform with those of the Group, adjustments are made if the amounts involved are considered to be significant to the Group.
Goodwill relating to an associate is included in the carrying amount of the investment.
In the Company’s separate financial statements, investments in associates are accounted for at cost less impairment losses.

70
Notes to the Financial Statements 31 December 2011(In Singapore dollars)
2. Summary of significant accounting policies (continued)
2.11 Transactions with non-controlling interests
Non-controlling interest represents theequity insubsidiariesnotattributable,directlyor indirectly, toownersof the Company, and are presented separately in the consolidated statement of comprehensive income and withinequityintheconsolidatedstatementoffinancialposition,separatelyfromequityattributabletoownersofthe Company.
Changes in the Company owners’ ownership interest in a subsidiary that do not result in a loss of control are accountedforasequitytransactions.Insuchcircumstances,thecarryingamountsofthecontrollingandnon-controlling interests are adjusted to reflect the changes in their relative interests in the subsidiary. Any difference between the amount by which the non-controlling interest is adjusted and the fair value of the consideration paid orreceivedisrecogniseddirectlyinequityandattributedtoownersoftheparent.
2.12 Financial assets
Financialassetsarerecognisedonthestatementoffinancialpositionwhen,andonlywhen,theGroupbecomesa party to the contractual provisions of the financial instrument.
When financial assets are recognised initially, they are measured at fair value, plus, in the case of financial assets not at fair value through profit or loss, directly attributable transaction costs. The Group determines the classification of its financial assets after initial recognition and, where allowed and appropriate, re-evaluates this designation at each financial year-end.
Afinancialassetisderecognisedwhenthecontractualrighttoreceivecashflowsfromtheassethasexpired.Onderecognition of a financial asset in its entirety, the difference between the carrying amount and the sum of the considerationreceivedandanycumulativegainorlossthathasbeenrecogniseddirectlyinequityisrecognisedin profit or loss.
All regular way purchases and sales of financial assets are recognised on the trade date i.e. the date that the Groupcommits topurchase theasset.Regularwaypurchasesor salesarepurchasesor salesof financialassetsthatrequiredeliveryofassetswithintheperiodgenerallyestablishedbyregulationorconventioninthemarketplaceconcerned.
(i) Financial assets at fair value through profit or loss
Financialassetsclassifiedasheld for tradingare included in thecategory ‘financialassetsat fairvaluethroughprofitorloss’.Financialassetsareclassifiedasheldfortradingiftheyareacquiredforthepurposeof selling in the near term. Derivative financial instruments are also classified as held for trading unless they are designated as effective hedging instruments. Gains or losses on investments held for trading are recognised in profit or loss.
The Group does not designate any financial assets not held for trading as financial assets at fair value through profit and loss.

71
Notes to the Financial Statements 31 December 2011(In Singapore dollars)
2. Summary of significant accounting policies (continued)
2.12 Financial assets (continued)
(ii) Loans and receivables
Non-derivativefinancialassetswithfixedordeterminablepaymentsthatarenotquotedinanactivemarketare classified as loans and receivables. Such assets are carried at amortised cost using the effective interest method. Gains and losses are recognised in profit or loss when the loans and receivables are derecognised or impaired, as well as through the amortisation process.
(iii) Held-to-maturity investments
Non-derivativefinancialassetswithfixedordeterminablepaymentsandfixedmaturityareclassifiedasheld-to-maturity when the Group has the positive intention and ability to hold the investment to maturity. Subsequenttoinitialrecognition,held-to-maturityinvestmentsaremeasuredatamortisedcostusingtheeffective interest method, less impairment. Gains and losses are recognised in profit or loss when the held-to-maturity investments are derecognised or impaired, and through the amortisation process.
(iv) Available-for-sale financial assets
Available-for-sale financial assets are those non-derivative financial assets that are designated as available-for-sale or are not classified in any of the preceding categories. After initial recognition, available-for-sale financial assets are measured at fair value with gains or losses being recognised in fair value reserve until the investment is derecognised or until the investment is determined to be impaired at which time the cumulativegainorlosspreviouslyrecognisedinfairvaluereserveisreclassifiedfromequitytotheprofitorloss as a reclassification adjustment.
The fair value of investments that are actively traded in organised financialmarkets is determined byreferencetotherelevantExchange’squotedmarketbidpricesatthecloseofbusinessontheendofthereportingperiod.Forinvestmentswherethereisnoactivemarket,fairvalueisdeterminedusingvaluationtechniques. Such techniques include using recent arm’s lengthmarket transactions; reference to thecurrentmarketvalueofanotherinstrument,whichissubstantiallythesame;discountedcashflowanalysisand option pricing models. Where the fair value cannot be reliably determined, investments will be carried at cost.
2.13 Intangibles
(i) Goodwill
Goodwillrepresentstheexcessofthefairvalueoftheconsiderationgivenoverthefairvalueoftheacquirer’sinterest in the identifiable net assets. Goodwill which is assessed as having no continuing economic value is written-off immediately to the consolidated profit or loss.
Followinginitialrecognition,goodwillismeasuredatcostlessanyaccumulatedimpairmentlosses.Goodwillisreviewedforimpairment,annuallyormorefrequentlyifeventsorchangesincircumstancesindicatethatthe carrying value may be impaired.

72
Notes to the Financial Statements 31 December 2011(In Singapore dollars)
2. Summary of significant accounting policies (continued)
2.13 Intangibles (continued)
(ii) Negative goodwill
Negativegoodwillarisingonacquisition represents theexcessof the fairvalueof the identifiablenetassetsacquiredoverthecostofacquisition.Suchnegativegoodwillwillberecognisedimmediatelyinthe profit or loss.
(iii) Trademarks
Trademarksarestatedatcost lessaccumulatedamortisationand impairment loss.Theuseful livesoftrademarks are assessed tobe either finite or indefinite. Trademarkswith finite lives are amortisedona straight-line basis over the estimated economic useful lives of 20 years and assessed for impairment whenever there isan indication that the trademarkmaybe impaired.Theamortisationperiodand theamortisationmethod for trademarkswithfiniteuseful livesare reviewedat leastateachfinancial year-end.Theamortisationexpenseontrademarkswithfinitelivesisrecognisedinprofitorlossthroughthe“amortisation and depreciation” line item.
(iv) Other intangible assets
Intangibleassetsacquiredseparatelyaremeasuredinitiallyatcost.Thecostofintangibleassetsacquiredinabusinesscombinationistheirfairvalueasatthedateofacquisition.Followinginitialacquisition,intangibleassets are measured at cost less any accumulated amortisation and any accumulated impairment losses. Internallygenerated intangibleassets,excludingcapitaliseddevelopmentcosts,arenotcapitalisedandexpenditureisreflectedinprofitorlossintheyearinwhichtheexpenditureisincurred.
The useful lives of intangible assets are assessed as either finite or indefinite.
Intangible assets with finite useful lives are amortised over the estimated useful lives and assessed for impairment whenever there is an indication that the intangible asset may be impaired. The amortisation period and the amortisation method are reviewed at least at each financial year-end. Changes in the expectedusefullifeortheexpectedpatternofconsumptionoffutureeconomicbenefitsembodiedintheasset is accounted for by changing the amortisation period or method, as appropriate, and are treated as changesinaccountingestimates.Theamortisationexpenseonintangibleassetswithfiniteusefullivesisrecognisedinprofitorlossintheexpensecategoryconsistentwiththefunctionoftheintangibleasset.
Intangible assets with indefinite useful lives or not yet available for use are tested for impairment annually, ormorefrequentlyiftheeventsandcircumstancesindicatethatthecarryingvaluemaybeimpairedeitherindividually or at the cash-generating unit level. Such intangible assets are not amortised. The useful life of an intangible asset with an indefinite useful life is reviewed annually to determine whether the useful life assessment continues to be supportable. If not, the change in useful life from indefinite to finite is made on a prospective basis.

73
Notes to the Financial Statements 31 December 2011(In Singapore dollars)
2. Summary of significant accounting policies (continued)
2.13 Intangibles (continued)
(iv) Other intangible assets (continued)
Gains or losses arising from derecognition of an intangible asset are measured as the difference between the net disposal proceeds and the carrying amount of the asset and are recognised in profit or loss when the asset is derecognised.
2.14 Inventories
Rawmaterials,consumables,finishedgoods,work-in-progressandsparepartsarestatedatthelowerofcostand net realisable value. Cost is primarily determined on a weighted average basis or first-in-first-out basis for certain subsidiaries, and includes all costs in bringing the inventories to their present location and condition. In thecaseofmanufacturedproducts,costincludesalldirectexpenditureandproductionoverheadsbasedonthe normal level of activity.
Net realisable value is the price at which the inventories can be realised in the normal course of business after allowingforthecostsofrealisationand,whereappropriate,thecostofconversionfromtheexistingstatetoafinished condition. Allowance is made, where necessary, for obsolete, slow-moving and defective inventories.
2.15 Biological assets
Livestock
Livestockarestatedattheir fairvalue lessestimatedpoint-of-salecosts,exceptwherethefairvaluecannotbemeasuredreliably,inwhichcaseitwillbestatedatcost.Thefairvalueoflivestockisdeterminedbasedonmarketpricesoflivestockofsimilarage,breedandgeneticmerit.
Netincreaseordecreaseinthefairvalueoflivestockareincludedintheprofitorloss,determinedas:
(i) thedifferencebetweenthetotalfairvalueofthelivestockrecognisedatthebeginningofthefinancialyearandthetotalfairvalueofthelivestockrecognisedattheendofthefinancialyear;and
(ii) costincurredduringthefinancialyeartoacquireandbreedlivestock.
2.16 Trade and other receivables
Trade and other receivables, which generally have 30-60 day terms, are recognised and carried at original invoiced amount less allowance for doubtful debts. An estimate for doubtful debts is made when collection of the full amount is no longer probable. Bad debts are written-off to the profit or loss as incurred.

74
Notes to the Financial Statements 31 December 2011(In Singapore dollars)
2. Summary of significant accounting policies (continued)
2.16 Trade and other receivables (continued)
TradereceivablesthatarefactoredouttobanksandotherfinancialinstitutionswithrecoursetotheGrouparenotde-recogniseduntiltherecourseperiodhasexpiredandtherisksandrewardsofthereceivableshavebeenfully transferred. The corresponding cash received from the financial institutions are recorded as borrowings. Anyfeeincurredtoeffectfactoringisnet-offagainstborrowingsandtakentotheprofitorlossovertheperiodof factoring using the effective interest method.
2.17 Assets and liabilities held for sale
The Group classifies assets and liabilities as held for sale when its carrying amount will be recovered through a sale transaction. The assets and liabilities must be available for immediate sale and the Group must be committed to selling the asset either through entering into a contractual sale agreement or the activation and commitment to a program to locate a buyer and dispose of the assets or liabilities.
Upon classification as held for sale, non-current assets are not depreciated and are measured at the lower of carrying amount and fair value less costs to sell. Any difference is recognised in profit or loss.
2.18 Impairment of non-financial assets
Goodwill
Forthepurposeofimpairmenttesting,goodwillacquiredinabusinesscombinationis,fromtheacquisitiondate,allocatedtoeachoftheGroup’scash-generatingunits,orgroupsofcash-generatingunits,thatareexpectedto benefit from the synergies of the combination, irrespective of whether other assets or liabilities of the group areassignedtothoseunitsorgroupsofunits.Eachunitorgroupofunitstowhichthegoodwillissoallocated:
• RepresentsthelowestlevelwithintheGroupatwhichthegoodwillismonitoredforinternalmanagementpurposes; and
• Isnot larger thanasegmentbasedoneither theGroup’sprimaryor theGroup’s secondary reportingformat.
A cash-generating unit (or group of cash-generating units) to which goodwill has been allocated are tested for impairment annually and whenever there is an indication that the unit may be impaired, by comparing the carrying amount of the unit, including the goodwill, with the recoverable amount of the unit. Where the recoverable amount of the cash-generating unit (or group of cash-generating units) is less than the carrying amount, an impairment loss is recognised.
Where goodwill forms part of a cash-generating unit (or group of cash-generating units) and part of the operation within that unit is disposed of, the goodwill associated with the operation disposed of is included in the carrying amount of the operation when determining the gain or loss on disposal of the operation. Goodwill disposed of in this circumstance is measured based on the relative values of the operation disposed of and the portion of the cash-generating unit retained.

75
Notes to the Financial Statements 31 December 2011(In Singapore dollars)
2. Summary of significant accounting policies (continued)
2.18 Impairment of non-financial assets (continued)
Other assets
Assets that are subject to amortisation or depreciation are reviewed for impairment whenever events or changes in circumstances indicate that the carrying amount of an asset may not be recoverable. Assets that have an indefinite useful life and are not subject to amortisation or depreciation are tested annually for impairment.
Wheneverthecarryingamountofanassetexceedsitsrecoverableamount,animpairmentlossisrecognisedinprofitorloss.Forthepurposesofassessingimpairment,assetsaregroupedatthelowestlevelforwhichthereare separately identifiable cash flows (cash-generating units).
Reversal of impairment losses recognised in prior years is recordedwhen there hasbeen a change in theestimates used to determine the recoverable amount. The reversal is recorded in the profit or loss exceptforassets thatarepreviously revaluedwheretherevaluationwastakentorevaluationreserve.However, theincreasedcarryingamountofanassetduetoareversalofanimpairmentlossisrecognisedtotheextentitdoesnotexceedthecarryingamountthatwouldhavebeendetermined(netofamortisationordepreciation)hadnoimpairment loss been recognised for that asset in prior years.
2.19 Financial liabilities
Initial recognition and measurement
Financialliabilitiesarerecognisedwhen,andonlywhen,theGroupbecomesapartytothecontractualprovisionsof the financial instrument. The Group determines the classification of its financial liabilities at initial recognition.
All financial liabilities are recognised initially at fair value plus in the case of financial liabilities not at fair value through profit or loss, directly attributable transaction costs.
Subsequent measurement
The measurement of financial liabilities depends on their classification as follows:
Financialliabilitiesatfairvaluethroughprofitorloss
Financial liabilitiesat fairvalue throughprofitor loss includesfinancial liabilitiesheld for tradingandfinancialliabilitiesdesignateduponinitialrecognitionatfairvaluethroughprofitorloss.Financialliabilitiesareclassifiedas held for trading if they are acquired for the purpose of selling in the near term. This category includesderivative financial instruments entered into by the Group that are not designated as hedging instruments in hedge relationships. Separated embedded derivatives are also classified as held for trading unless they are designated as effective hedging instruments.

76
Notes to the Financial Statements 31 December 2011(In Singapore dollars)
2. Summary of significant accounting policies (continued)
2.19 Financial liabilities (continued)
Subsequent measurement (continued)
Financialliabilitiesatfairvaluethroughprofitorloss (continued)
Subsequenttoinitialrecognition,financialliabilitiesatfairvaluethroughprofitorlossaremeasuredatfairvalue.Any gains or losses arising from changes in fair value of the financial liabilities are recognised in profit or loss.
The Group has not designated any financial liabilities upon initial recognition at fair value through profit or loss.
Otherfinancialliabilities
Afterinitialrecognition,otherfinancialliabilitiesaresubsequentlymeasuredatamortisedcostusingtheeffectiveinterest rate method. Gains and losses are recognised in profit or loss when the liabilities are derecognised, and through the amortisation process.
De-recognition
Afinancialliabilityisde-recognisedwhentheobligationundertheliabilityisdischargedorcancelledorexpires.Whenanexistingfinancialliabilityisreplacedbyanotherfromthesamelenderonsubstantiallydifferentterms,orthetermsofanexistingliabilityaresubstantiallymodified,suchanexchangeormodificationistreatedasade-recognition of the original liability and the recognition of a new liability, and the difference in the respective carrying amounts is recognised in profit or loss.
2.20 Provisions
Provisions are recognised when the Group has a present obligation (legal or constructive) as a result of a past event, it isprobablethatanoutflowofresourcesembodyingeconomicbenefitswillberequiredtosettletheobligation and a reliable estimate can be made on the amount of the obligation.
Provisions are reviewed at each end of the reporting period and adjusted to reflect the current best estimate. If itisnolongerprobablethatanoutflowofresourcesembodyingeconomicbenefitswillberequiredtosettletheobligation, the provision is reversed.
2.21 Financial guarantee
Afinancialguaranteecontractisacontractthatrequirestheissuertomakespecifiedpaymentstoreimbursetheholderforalossitincursbecauseaspecifieddebtorfailstomakepaymentwhendue.
Financialguaranteesarerecognisedinitiallyatfairvalue.Subsequenttoinitialrecognition,financialguaranteesare recognised as income in the profit or loss over the period of the guarantee. If it is probable that the liability will be higher than the amount initially recognised less amortisation, the liability is recorded at the higher amount with the difference charged to the profit or loss.

77
Notes to the Financial Statements 31 December 2011(In Singapore dollars)
2. Summary of significant accounting policies (continued)
2.22 Cash and cash equivalents
Cashandcashequivalentscomprisecashatbankandonhand,demanddeposits,andshort-term,highlyliquidinvestmentsthatarereadilyconvertibletoknownamountsofcashandwhicharesubject toan insignificantriskof changes in value.Thesealso includebankoverdrafts that forman integralpartof theGroup’scashmanagement.
2.23 Revenue recognition
RevenueisrecognisedtotheextentthatitisprobablethattheeconomicbenefitswillflowtotheGroupandtherevenue can be reliably measured. The specific recognition criteria described below must also be met before revenue is recognised.
Revenuefromthesaleofgoodsandservicesarerecogniseduponpassageoftitleandriskstothecustomerwhich generally coincides with their delivery and acceptance.
Rentalincomeisrecognisedonastraight-linebasisovertheleaseterm.
Interest income is recognised on effective interest rate method.
Dividend income is recorded gross in the profit or loss in the accounting period in which the Group’s right to receive payment is established.
2.24 Income taxes
Current tax
Currenttaxassetsandliabilitiesforthecurrentandpriorperiodsaremeasuredattheamountexpectedtoberecoveredfromorpaidtothetaxationauthorities.Thetaxratesandtaxlawsusedtocomputetheamountarethose that are enacted or substantively enacted by the end of the reporting period.
Currenttaxesarerecognisedinprofitorlossexcepttotheextentthatthetaxrelatestoitemsrecogniseddirectlyinequity.
Deferred tax
Deferredtaxisprovidedusingtheliabilitymethodontemporarydifferencesattheendofthereportingperiodbetweenthetaxbasesofassetsandliabilitiesandtheircarryingamountsforfinancialreportingpurposes.

78
Notes to the Financial Statements 31 December 2011(In Singapore dollars)
2. Summary of significant accounting policies (continued)
2.24 Income taxes (continued)
Deferred tax (continued)
Deferredtaxliabilitiesarerecognisedforalltemporarydifferences,except:
• Where thedeferred tax liabilityarises fromthe initial recognitionofgoodwillorofanassetor liability ina transaction that is not a business combination and, at the time of the transaction, affects neither the accountingprofitnortaxableprofitorloss;and
• Inrespectoftaxabletemporarydifferencesassociatedwith investments insubsidiariesandassociates,where the timing of the reversal of the temporary differences can be controlled and it is probable that the temporary differences will not reverse in the foreseeable future.
Deferredtaxassetsarerecognisedforalldeductibletemporarydifferences,carryforwardofunusedtaxlosses,to the extent that it is probable that taxableprofitwill be available againstwhich thedeductible temporarydifferences,andthecarryforwardofunusedtaxlossescanbeutilisedexcept:
• Wherethedeferredtaxassetrelatingtothedeductibletemporarydifferencearisesfromtheinitialrecognitionof an asset or liability in a transaction that is not a business combination and, at the time of the transaction, affectsneithertheaccountingprofitnortaxableprofitorloss;and
• Inrespectofdeductibletemporarydifferencesassociatedwithinvestmentsinsubsidiariesandassociates,deferred income tax assets are recognised only to the extent that it is probable that the temporarydifferenceswill reverse in the foreseeable future and taxable profit will be available against which thetemporary differences can be utilised.
Thecarryingamountofdeferredtaxassetsisreviewedattheendofeachreportingperiodandreducedtotheextentthatitisnolongerprobablethatsufficienttaxableprofitwillbeavailabletoallowallorpartofthedeferredtaxassettobeutilised.Unrecogniseddeferredtaxassetsarereassessedattheendofeachreportingperiodandarerecognisedtotheextentthatithasbecomeprobablethatfuturetaxableprofitwillallowthedeferredtaxasset to be recovered.
Deferredtaxassetsandliabilitiesaremeasuredatthetaxratesthatareexpectedtoapply intheyearwhentheasset is realisedor the liability is settled,basedon tax rates (and tax laws) that havebeenenactedorsubstantively enacted at the end of each reporting period.
Deferredtaxrelatingtoitemsrecognisedoutsideprofitorlossisrecognisedoutsideprofitorloss.Deferredtaxitems are recognised in correlation to the underlying transaction either in other comprehensive income or directly inequityanddeferredtaxarisingfromabusinesscombinationisadjustedagainstgoodwillonacquisition.
Deferredtaxassetsanddeferredtaxliabilitiesareoffset, ifa legallyenforceablerightexiststosetoffcurrentincometaxassetsagainstcurrentincometaxliabilitiesandthedeferredincometaxesrelatetothesametaxableentityandthesametaxationauthority.

79
Notes to the Financial Statements 31 December 2011(In Singapore dollars)
2. Summary of significant accounting policies (continued)
2.25 Borrowing costs
Borrowingcostsarecapitalisedaspartofthecostofaqualifyingassetiftheyaredirectlyattributabletotheacquisition,constructionorproductionofthatasset.Capitalisationofborrowingcostscommenceswhentheactivitiestopreparetheassetforitsintendeduseorsaleareinprogressandtheexpendituresandborrowingcosts are incurred. Borrowing costs are capitalised until the assets are substantially completed for their intended use or sale.
2.26 Employee benefits
(i) Executives’ Share Option Scheme
TheCompanyhasinplacetheQAFLimitedShareOptionScheme2000forthegrantingofshareoptionsto eligible employees of the Group to subscribe for ordinary shares in the Company.
The cost of such transactions with employees is measured by reference to the fair value at the date at which they are granted. The fair value is determined using the binomial model. In valuing these transactions, no accountistakenofanyperformanceconditions,otherthanconditionslinkedtothepriceofthesharesoftheCompany(“marketconditions”).
Thecostoftheseequity-settledtransactionsisrecognised,togetherwithacorrespondingincreaseinequity,overtheperiodinwhichtheperformanceconditionsarefulfilled,endingonthedateonwhichthe relevant employees become fully entitled to the award (‘vesting date’). The cumulative expenserecognisedforequity-settledtransactionsateachreportingdateuntilthevestingdatereflectstheextenttowhichthevestingperiodhasexpiredandthenumberofawardsthat,intheopinionofthedirectorsoftheCompanyatthatdate,basedonthebestavailableestimateofthenumberofequityinstrumentsthat will ultimately vest.
No expense is recognised for awards that do not ultimately vest, except for awardswhere vesting isconditionaluponamarketcondition,whicharetreatedasvestingirrespectiveofwhetherornotthemarketcondition is satisfied, provided that all other performance conditions are satisfied.
Wherethetermsofanequity-settledawardaremodified,asaminimumanexpenseisrecognisedasifthetermshadnotbeenmodified.Inaddition,anexpenseisrecognisedforanyincreaseinthevalueofthetransaction as a result of the modification, as measured at the date of modification.
Whereanequity-settledaward iscancelled, it is treatedas if ithadvestedonthedateofcancellation,andanyexpensenotyetrecognisedfortheawardisrecognisedimmediately.However,ifanewawardissubstituted for the cancelled award, and designated as a replacement award on the date that it is granted, the cancelled and new awards are treated as if they were a modification of the original award, as described in the previous paragraph.
The dilutive effect of outstanding share options is reflected as additional share dilution in the computation of earnings per share.

80
Notes to the Financial Statements 31 December 2011(In Singapore dollars)
2. Summary of significant accounting policies (continued)
2.26 Employee benefits (continued)
(ii) Defined contribution/benefit plans
Asrequiredbylaw,theGroup’scompaniesinSingaporemakecontributionstothestatepensionscheme,theCentralProvidentFund(“CPF”).CertainoftheGroup’scompaniesoutsideSingaporemakecontributionsto their respective countries’ pension scheme. Such contributions are recognised as compensation expenseinthesameperiodastheemploymentthatgivesrisetothecontribution.
Fordefinedbenefitplans,pastservicecostisrecognisedimmediatelytotheextentthatthebenefitsarealready vested, and otherwise is amortised on a straight-line basis over the average period until the benefits become vested. The defined benefit asset or liability recognised in the statement of financial position represents the present value of the defined benefit obligation, adjusted for unrecognised past service cost, net of the fair value of the plan assets. Any asset resulting from this calculation is limited to past service cost, plus the present value of available refunds and reductions in future contributions to the plan.
For retirementbenefitschemes, thecostof retirementbenefit isdeterminedusing theaccruedbenefitvaluation method. Contributions made to the scheme are included in the profit or loss. Actuarial gains and lossesarerecognisedinfullintheyeartheyarosebytakingthegains/lossesdirectlytoequity.
(iii) Employee entitlements
Liabilitiesforpaidannualleaveandsickleavearerecognisedandmeasuredastheamountunpaidattheend of the reporting period at current pay rates in respect of employees’ services up to that date.
A liability for long service leave is recognised, on the basis of an estimation of the present value of the future cash outflows to be made in respect of services provided by employees up to the end of the reportingperiod.Considerationisgiventoexpectedfuturewageandsalarylevels,experienceofemployeedepartures andperiodsof service. Expected future payments are discounted using interest rates thatmatch, as closely as possible, the estimated future cash outflows.
2.27 Leases
Finance leases
Finance leases, which effectively transfer to the Group substantially all the risks and rewards incidental toownershipoftheleaseditem,arecapitalisedatamountsequal,attheinceptionofthelease,tothefairvalueof the leased item or, if lower, at the present value of the minimum lease payments. Lease payments are apportioned between the finance charges and reduction of the lease liability so as to achieve a constant periodic rateofinterestontheremainingbalanceoftheliabilityforeachperiod.Financechargesarechargeddirectlytothe profit or loss.

81
Notes to the Financial Statements 31 December 2011(In Singapore dollars)
2. Summary of significant accounting policies (continued)
2.27 Leases (continued)
Operating leases
Leasesofassetsinwhichasignificantportionoftherisksandrewardsofownershipareretainedbythelessorare classified as operating leases. Payments made under operating leases (net of any incentives received from thelessor)aretakentotheprofitorlossonastraight-linebasisovertheperiodofthelease.Whenanoperatingleaseisterminatedbeforetheleaseperiodhasexpired,anypaymentrequiredtobemadetothelessorbywayofpenaltyisrecognisedasanexpenseintheperiodinwhichterminationtakesplace.
Rentalincomearisingonoperatingleasesisrecordedasincomeintheprofitorlossonastraight-linebasisoverthe lease terms.
2.28 Segment information
Formanagement purposes, theGroup is organised into operating segments based on their products andservices. The management of the Company regularly review the segment results in order to allocate resources to the segments and to assess the segment performance. Additional disclosures on each of these segments are shown in Note 44, including the factors used to identify the reportable segments and the measurement basis of segment information.
2.29 Impairment of financial assets
The Group assesses at each end of the reporting period whether there is any objective evidence that a financial asset or a group of financial assets is impaired.
(a) Assets carried at amortised cost
If there is objective evidence that an impairment loss on financial assets carried at amortised cost has been incurred, the amount of the loss is measured as the difference between the asset’s carrying amount and the present value of estimated future cash flows discounted at the financial asset’s original effective interest rate. The carrying amount of the asset is reduced through the use of an allowance account. The amount of the loss is recognised in profit or loss.
When the asset becomes uncollectible, the carrying amount of impaired financial assets is reduced directly or if an amount was charged to the allowance account, the amounts charged to the allowance account are written-off against the carrying value of the financial asset.
To determine whether there is objective evidence that an impairment loss on financial assets has been incurred, the Group considers factors such as the probability of insolvency or significant financial difficulties of the debtor and default or significant delay in payments.

82
Notes to the Financial Statements 31 December 2011(In Singapore dollars)
2. Summary of significant accounting policies (continued)
2.29 Impairment of financial assets (continued)
(a) Assets carried at amortised cost (continued)
If,inasubsequentperiod,theamountoftheimpairmentlossdecreasesandthedecreasecanberelatedobjectively to an event occurring after the impairment was recognised, the previously recognised impairment lossisreversed.Anysubsequentreversalofanimpairmentlossisrecognisedinprofitorloss,totheextentthatthecarryingvalueoftheassetdoesnotexceeditsamortisedcostatthereversaldate.
(b) Assets carried at cost
If there is objective evidence that an impairment loss on a financial asset carried at cost has been incurred, the amount of the loss is measured as the difference between the asset’s carrying amount and the present valueofestimatedfuturecashflowsdiscountedatthecurrentmarketrateofreturnforasimilarfinancialasset.Suchimpairmentlossesarenotreversedinsubsequentperiods.
(c) Available-for-sale financial assets
If an available-for-sale financial asset is impaired, an amount comprising the difference between its cost (net of any principal payment and amortisation) and its current fair value, less any impairment loss previously recognisedinprofitorloss,istransferredfromequitytotheprofitorloss.Reversalsofimpairmentlossinrespectofequityinstrumentsarenotrecognisedinprofitorloss.Reversalsofimpairmentlossesondebtinstruments are reversed through the profit or loss, if the increase in fair value of the instrument can be objectively related to an event occurring after the impairment loss was recognised in profit or loss.
2.30 Government grants
Government grants are recognised at their fair value where there is reasonable assurance that the grant will be received and all attaching conditions will be complied with. Where the grant relates to an asset, the fair value is recognised as deferred capital grant on the statement of financial position and is amortised to the profit or loss overtheexpectedusefullifeoftherelevantassetbyequalannualinstalments.
Whenthegrantrelatestoanexpenseitem,itisrecognisedinprofitorlossovertheperiodnecessarytomatchthem on a systematic basis to the costs that it is intended to compensate. Grants related to income may be presentedasacreditintheprofitorloss.Alternatively,theyaredeductedinreportingtherelatedexpenses.
2.31 Hedge accounting
TheGroupapplieshedgeaccountingforcertainhedgingrelationshipswhichqualifyforhedgeaccounting.
Forthepurposeofhedgeaccounting,hedgesareclassifiedascashflowhedgeswhenhedgingexposuretovariabilityincashflowsthatiseitherattributabletoaparticularriskassociatedwitharecognisedassetorliabilityorahighlyprobableforecasttransactionortheforeigncurrencyriskinanunrecognisedfirmcommitment.

83
Notes to the Financial Statements 31 December 2011(In Singapore dollars)
2. Summary of significant accounting policies (continued)
2.31 Hedge accounting (continued)
At the inception of a hedge relationship, the Group formally designates and documents the hedge relationship towhich theGroupwishes toapplyhedgeaccountingand the riskmanagementobjectiveandstrategy forundertaking thehedge.Suchhedgesare expected tobehighly effective in achievingoffsetting changes incash flows and are assessed on an ongoing basis to determine that they actually have been highly effective throughout the financial reporting periods for which they were designated.
Hedges which meet the strict criteria for hedge accounting are accounted for as follows:
Cash flow hedges
The effective portion of the gain or loss on the hedging instrument is recognised directly in other comprehensive income in hedging reserve, while any ineffective portion is recognised immediately in the profit or loss.
Amountstakentohedgingreservearetransferredtotheprofitorlosswhenthehedgedtransactionaffectstheprofitorloss,suchaswhenthehedgedfinancialincomeorfinancialexpenseisrecognisedorwhenaforecastsale occurs. Where the hedged item is the cost of a non-financial asset or non-financial liability, the amounts takentohedgingreservearetransferredtotheinitialcarryingamountofthenon-financialassetorliability.
Iftheforecasttransactionorfirmcommitmentisnolongerexpectedtooccur,amountspreviouslyrecognisedinhedgingreservearetransferredtotheprofitorloss.Ifthehedginginstrumentexpiresorissold,terminatedorexercisedwithoutreplacementorrollover,or if itsdesignationasahedge isrevoked,amountspreviouslyrecognised in hedging reserve remain in hedging reserve until the forecast transaction or firm commitment affects profit or loss.
2.32 Exchangeable bonds
Atinitialrecognitionthederivativecomponentoftheexchangeablebondsismeasuredatfairvalueandpresentedaspartofderivativefinancial instruments (seeNote2.19).Anyexcessofproceedsover theamount initiallyrecognised as the derivative component is recognised as the liability component.
ThederivativecomponentissubsequentlyremeasuredinaccordancewithNote2.19.Theliabilitycomponentis subsequently carried at amortised cost. The interest expense recognised in profit or loss on the liabilitycomponent is calculated using the effective interest method.

84
Notes to the Financial Statements 31 December 2011(In Singapore dollars)
2. Summary of significant accounting policies (continued)
2.33 Related parties
A related party is defined as follows:
(a) A person or a close member of that person’s family is related to the Group and Company if that person:
(i) Has control or joint control over the Company; (ii) Has significant influence over the Company; or (iii) Is amemberof the keymanagementpersonnel of theGrouporCompanyorof aparentof the
Company.
(b) An entity is related to the Group and the Company if any of the following conditions applies:
(i) The entity and the Company are members of the same group (which means that each parent, subsidiary and fellow subsidiary is related to the others).
(ii) Oneentity isanassociateor jointventureof theotherentity (oranassociateor jointventureofamember of a group of which the other entity is a member).
(iii) Both entities are joint ventures of the same third party.(iv) Oneentityisajointventureofathirdentityandtheotherentityisanassociateofthethirdentity.(v) The entity is a post-employment benefit plan for the benefit of employees of either the Company or
an entity related to the Company. If the Company is itself such a plan, the sponsoring employers are also related to the Company;
(vi) The entity is controlled or jointly controlled by a person identified in (a);(vii) A person identified in (a) (i) has significant influence over the entity or is a member of the key
management personnel of the entity (or of a parent of the entity).
2.34 Significant accounting estimates and judgements
Estimates, assumptionsconcerning the future and judgements aremade in thepreparationof the financialstatements. They affect the application of the Group’s accounting policies, reported amounts of assets, liabilities, incomeandexpenses, anddisclosuresmade.Theyare assessedonanon-goingbasis andarebasedonexperienceandrelevantfactors,includingexpectationsoffutureeventsthatarebelievedtobereasonableunderthe circumstances.
Key sources of estimation uncertainty
Thekeyassumptionsconcerningthefutureandotherkeysourcesofestimationuncertaintyattheendofthereportingperiod,thathaveasignificantriskofcausingamaterialadjustmenttothecarryingamountsofassetsandliabilitieswithinthenextfinancialyeararediscussedbelow.

85
Notes to the Financial Statements 31 December 2011(In Singapore dollars)
2. Summary of significant accounting policies (continued)
2.34 Significant accounting estimates and judgements (continued)
Key sources of estimation uncertainty (continued)
(i) Impairment of goodwill
TheCompanyandGroupdeterminewhethergoodwillisimpairedatleastonanannualbasis.Thisrequiresanestimationofthevalueinuseofthecash-generatingunitstowhichthegoodwillisallocated.EstimatingthevalueinuserequirestheGrouptomakeanestimateoftheexpectedfuturecashflowsfromthecash-generating unit and also to choose a suitable discount rate in order to calculate the present value of those cash flows. The carrying amount of the Group’s goodwill at 31 December 2011 was $1,801,000 (2010: $1,786,000). More details are given in Note 24.
(ii) Impairment of non-financial assets
The Company and Group assess whether there are any indicators of impairment for all non-financial assets at each reporting date. Non-financial assets, other than goodwill are tested for impairment when there are indicators that the carrying amounts may not be recoverable.
Whenvalue inusecalculationsareundertaken,managementmustestimate theexpected futurecashflows from the asset or cash-generating unit and choose a suitable discount rate in order to calculate the present value of those cash flows.
(iii) Incometaxes
TheGroupoperatesinvariouscountriesandissubjecttodifferenttaxjurisdictions.SignificantjudgementisinvolvedindeterminingtheGroup-wideprovisionforincometaxes.Therearecertaintransactionsandcomputationsforwhichtheultimatetaxdeterminationisuncertainduringtheordinarycourseofbusiness.TheGrouprecognisesliabilitiesforexpectedtaxissuesbasedonestimatesofwhetheradditionaltaxeswillbedue.Wherethefinaltaxoutcomeofthesemattersisdifferentfromtheamountsthatwereinitiallyrecognised,suchdifferenceswillimpacttheincometaxanddeferredtaxprovisionsintheperiodinwhichsuchdeterminationismade.ThecarryingamountoftheCompany’sandtheGroup’sprovisionfortaxationas at 31 December 2011 was $1,672,000 (2010: $1,995,000) and $4,057,000 (2010: $6,179,000) respectively.ThecarryingamountoftheGroup’staxrecoverableasat31December2011was$384,000(2010: $135,000). The carrying amount of the Company’s deferred tax liabilities as at 31 December2011was $450,000 (2010: $485,000). TheGroup’s deferred tax assets anddeferred tax liabilities asat 31 December 2011 was $17,769,000 (2010: $17,749,000) and $11,944,000 (2010: $10,674,000) respectively.

86
Notes to the Financial Statements 31 December 2011(In Singapore dollars)
2. Summary of significant accounting policies (continued)
2.34 Significant accounting estimates and judgements (continued)
Key sources of estimation uncertainty (continued)
(iv) Depreciationofproperty,plantandequipmentandinvestmentproperties
Thecostofproperty,plant andequipment and investmentproperties isdepreciatedona straight-linebasis over the assets’ useful lives. Management estimates the useful lives of these assets to be within 2.5to50years.ThecarryingamountoftheCompany’sandGroup’sproperty,plantandequipmentasat31 December 2011 was $2,522,000 (2010: $2,502,000) and $311,544,000 (2010: $261,599,000). The carrying amount of the Group’s investment properties as at 31 December 2011 was $18,923,000 (2010: $19,548,000).Changes intheexpected levelofusagecould impacttheeconomicuseful livesandtheresidual values of these assets, therefore future depreciation charges could be revised.
(v) Pension liabilities
Various actuarial assumptions are required when determining the Group’s pension obligations. Dueto the long-term nature of these plans, such assumptions are subject to significant uncertainty. These assumptions and the related carrying amounts are disclosed in Note 31.
Critical judgements made in applying accounting policies
In the process of applying the Group’s accounting policies, management has made certain judgements, apart from those involving estimations, which have significant effect on the amounts recognised in the financial statements.
Impairment of investments and financial assets
Thedeterminationofwhetheraninvestmentorfinancialassetisimpairedrequiressignificantjudgement.TheGroupevaluates, amongother factors, theduration and extent towhich the fair valueof an investment orfinancialassetislessthanitscost,andthefinancialhealthofandnear-termbusinessoutlookfortheinvestmentor financial asset, including factors such as industry performance, changes in technology and operational and financing cash flow.

87
Notes to the Financial Statements 31 December 2011(In Singapore dollars)
3. Revenue
RevenuefortheGroupincludestheinvoicedvalueofgoodssoldandservicesrendered,lessreturns,discountsandgoodsandservicestax,andexcludessalesbetweenGroupcompanies.
Group2011 2010$’000 $’000
Sale of goods 961,159 840,738Rentalincomefromstorageandwarehousingfacilities 5,331 5,494Interest income from:– Fixeddepositswithfinancialinstitutions 1,090 913– Advances to associates 207 401– Others 985 423Gross dividends from investments 56 53Miscellaneous 8,153 8,388
976,981 856,410
4. Staff costs
Group2011 2010$’000 $’000
Staffcosts(includingExecutiveDirectors):– salaries, wages and other related costs 192,542 170,661– CPFandcontributionstootherplans 7,017 6,641– superannuation contributions 7,250 5,803
206,809 183,105
5. Amortisation and depreciation
GroupNote 2011 2010
$’000 $’000
Amortisation of intangibles 24 142 85Depreciationofproperty,plantandequipment 17 33,553 29,635Depreciation of investment properties 18 1,096 1,419
34,791 31,139

88
Notes to the Financial Statements 31 December 2011(In Singapore dollars)
6. Profit from operating activities
GroupNote 2011 2010
$’000 $’000
Profitfromoperatingactivitiesisstatedaftercharging/(crediting):Auditors’ remuneration:– Auditor of the Company 469 501– Member firms of the auditor of the Company 613 417Professional fees paid to:– Member firms of the auditor of the Company 150 79FeesandremunerationforthedirectorsoftheCompany:– fees and remuneration 3,626 3,221– contributiontotheCentralProvidentFund 18 15Researchanddevelopmentcost 10,237 14,959Government grants – (273)(Increase)/decreaseinthefairvaluelessestimatedpoint-of-sale
costsoflivestock,net 10 (1,478) 5,371Impairment charge on net investment in an associate – 691Foreignexchangeloss/(gain),net 677 (1,345)Operatingleaserentalexpense 8,775 6,860Gainondisposalofproperty,plantandequipmentandinvestment
properties (383) (1,201)Gain on disposal of an associate (766) – Negativegoodwillonacquisitionofbusiness (786) – Allowanceforinventoryobsolescence(writtenback)/charged (67) 59Allowance for doubtful trade debts charged 12 219 558Allowancefordoubtfulotherdebtswrittenback 13 (12,201) (6,335)Baddebts(writtenback)/write-off 21 (9,298) 28Rentalincomefrominvestmentproperties (5,270) (5,429)Directoperatingexpensesarisingfrominvestmentpropertiesthat
generate rental income 5,132 4,848Provision for long service leave and retirement benefits charged 27(a) 1,354 1,606Fairvalueadjustmentoninvestmentsecurities 92 –
7. Finance costs
Group2011 2010$’000 $’000
Interestexpenseonbankloansandfinanceleases 6,725 6,808

89
Notes to the Financial Statements 31 December 2011(In Singapore dollars)
8. Taxation
GroupNote 2011 2010
$’000 $’000
Incometaxexpense/(credit)ontheprofitfortheyear:– currenttax 13,634 15,776– deferredtax 2,736 (1,613)
16,370 14,163(Over)/underprovisioninrespectofprioryears:– currenttax (624) 240– deferredtax – (311)
(624) (71)
Taxexpense 15,746 14,092
Deferredtaxexpenserelatedtoothercomprehensiveincome:
– actuarial loss on defined benefit plans 25 (1,237) (556)
TheincometaxexpenseontheresultsoftheGroupdifferfromtheamountoftaxdeterminedbyapplyingtheSingaporestatutorytaxrateof17%(2010:17%)totheprofitbeforetaxationduetothefollowingfactors:
Profitbeforetaxation 81,654 70,939
Taxexpenseatstatutorytaxrateof17%(2010:17%) 13,881 12,060Adjustments: Incomenotsubjecttotax (4,562) (2,352) Expensesnotdeductiblefortaxpurposes 998 1,831 Taxreliefs,rebatesandincentives (1,402) (2,140) Utilisationoftaxbenefitsnotrecognisedinpreviousyears – (374) Taxbenefitsnotrecognisedincurrentyear 3,892 1,055 Differenceineffectivetaxratesinothercountries 3,225 4,215 Overprovisioninrespectofprioryears (624) (71) Others 338 (132)
Taxexpense 15,746 14,092
TheGrouphasunutilisedtaxlossesandcapitalallowancesofapproximately$59,236,000(2010:$51,216,000)and$1,249,000 (2010:Nil) respectively,whichsubject to theprovisionsof relevant local tax legislationandagreementwiththerelevanttaxauthorities,canbecarriedforwardandutilisedtosetoffagainstfuturetaxableprofits.Thepotential taxbenefitarisingfromsuchunutilisedtax lossesandcapitalallowanceshasnotbeenrecognised in the financial statements due to the uncertainty of recoverability.

90
Notes to the Financial Statements 31 December 2011(In Singapore dollars)
9. Earnings per ordinary share (“EPS”)
The calculation of earnings per ordinary share is based on the following figures:
Group2011 2010$’000 $’000
Group’s earnings used for the calculation of EPS:
Earningsforthefinancialyearattributabletoownersoftheparent 59,162 48,737
2011 2010‘000 ‘000
Number of shares used for the calculation of:
(i) Basic EPS Weighted average number of ordinary shares in issue 508,246 488,077
(ii) Diluted EPS Weighted average number of ordinary shares in issue 509,185 489,249
Basic earnings per share is calculated on the Group’s earnings for the financial year attributable to owners of the parent divided by the weighted average number of ordinary shares in issue during the year.
Dilutedearningspershareiscalculatedonthesamebasisasbasicearningspershareexceptthattheweightedaverage number of ordinary shares outstanding during the year have been adjusted for the effects of all dilutive potential ordinary shares.
10. Biological assets
Group2011 2010$’000 $’000
Livestock– at fair value 35,294 32,843– at cost 27,213 27,657
62,507 60,500

91
Notes to the Financial Statements 31 December 2011(In Singapore dollars)
10. Biological assets (continued)
TheGroup’s livestockcomprisesmainlyprogenyandbreederpigsownedbysubsidiaries.Theprogenypigsare raised for slaughter and sale. The breeder pigs are held to produce further progeny pigs. The fair value was determinedbasedontheactualsellingpricesapproximatingthoseatyearend.Significantassumptionsmadeindeterminingthevalueofthelivestockare:
(i) Progenypigsagedupto17weeksarevaluedatcostasnoactiveorliquidmarketsexistforthesepigs;
(ii) Progenypigsaged18weeksandabovearevaluedatfairvaluelessestimatedpoint-of-salecosts;and
(iii) Breeder pigs are valued at fair value less estimated point-of-sale costs.
Group2011 2010
Physicalquantityofpigs:– Number of progeny 331,001 321,130– Number of breeders 52,414 53,078
383,415 374,208
Group2011 2010$’000 $’000
Reconciliationofchangesinthecarryingamount:
Balance at 1 January 60,500 64,105Currency realignment 529 1,766Gain/(loss)arisingfromchangesinfairvaluelessestimatedpoint-
of-sale costs attributable to physical changes 2,304 (130)Loss arising from changes in fair value less estimated point-of-sale
costs attributable to price changes (826) (5,241)
Balance at 31 December 62,507 60,500

92
Notes to the Financial Statements 31 December 2011(In Singapore dollars)
11. Inventories
Group2011 2010$’000 $’000
Rawmaterials 47,253 34,087Finishedgoods 19,515 15,643Spare parts and consumables 14,821 13,675Work-in-progress – 11Goods-in-transit 3,020 2,221
Total inventories at lower of cost and net realisable value 84,609 65,637
The carrying value of inventories include inventories determined by the following cost methods:
First-in-first-out 24,292 21,679Weighted average 60,317 43,958
84,609 65,637
Inventories are stated after deducting allowance for obsolescence of 1,439 1,753
RawmaterialsoftheGroupasat31December2011amountingto$24,401,000(2010:$10,673,000)havebeenpledgedtoabankinconnectionwithcreditfacilitiesgrantedtoasubsidiary.
Inventoriesrecognisedasexpenseduringtheyearapproximatesthecostofmaterialsshownintheconsolidatedincome statement.
12. Trade receivables
Group2011 2010$’000 $’000
Trade receivables 87,427 81,606Less: Allowance for doubtful debts (2,960) (2,782)
84,467 78,824
Attheendofthereportingperiod,approximately20.16%(2010:24.46%)oftheGroup’stradereceivablesaresecuredbydepositsreceived,credit insurancesand letterofcreditsorbankguarantees issuedbybanks incountries where the customers are based.

93
Notes to the Financial Statements 31 December 2011(In Singapore dollars)
12. Trade receivables (continued)
Group2011 2010$’000 $’000
An aging analysis of receivables that are past due but not impaired:Lesser than 3 months 13,231 13,2103 months to 6 months 1,124 1,0616 months to 12 months 135 273More than 12 months 86 483
14,576 15,027
Receivablesthatareimpaired:Gross amount 2,960 2,782Less: Allowance for doubtful debts (2,960) (2,782)
– –
Trade receivables that are determined to be impaired at the end of the reporting period relate to debtors that are in financial difficulties and have defaulted on payments.
Movements in the allowance for doubtful debts:At 1 January 2,782 2,309Charge for the year (Note 6) 219 558Written-off against allowance (35) (31)Currency realignment (6) (10)Decrease in interest in a subsidiary – (44)
At 31 December 2,960 2,782
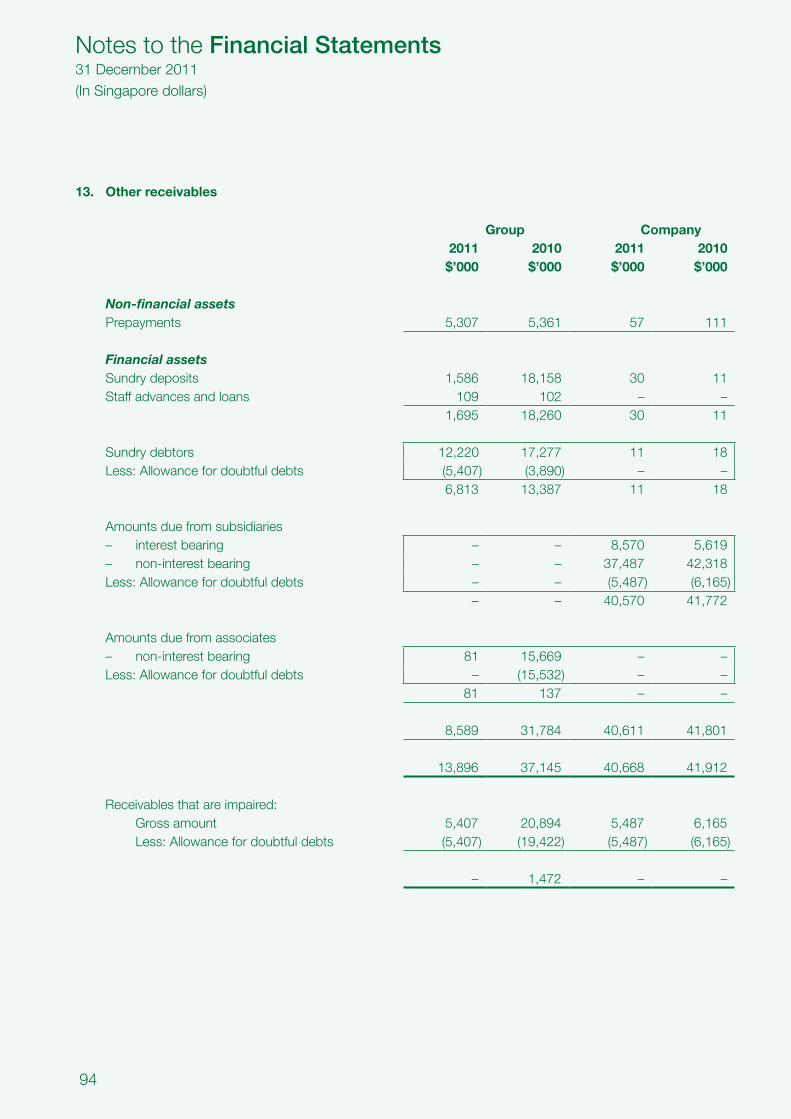
94
Notes to the Financial Statements 31 December 2011(In Singapore dollars)
13. Other receivables
Group Company2011 2010 2011 2010
$’000 $’000 $’000 $’000
Non-financial assetsPrepayments 5,307 5,361 57 111
Financial assetsSundry deposits 1,586 18,158 30 11Staff advances and loans 109 102 – –
1,695 18,260 30 11
Sundry debtors 12,220 17,277 11 18Less: Allowance for doubtful debts (5,407) (3,890) – –
6,813 13,387 11 18
Amounts due from subsidiaries– interest bearing – – 8,570 5,619– non-interest bearing – – 37,487 42,318Less: Allowance for doubtful debts – – (5,487) (6,165)
– – 40,570 41,772
Amounts due from associates– non-interest bearing 81 15,669 – – Less: Allowance for doubtful debts – (15,532) – –
81 137 – –
8,589 31,784 40,611 41,801
13,896 37,145 40,668 41,912
Receivablesthatareimpaired:Gross amount 5,407 20,894 5,487 6,165Less: Allowance for doubtful debts (5,407) (19,422) (5,487) (6,165)
– 1,472 – –

95
Notes to the Financial Statements 31 December 2011(In Singapore dollars)
13. Other receivables (continued)
Movements in the allowance for doubtful debts are as follows:
Group CompanyNote 2011 2010 2011 2010
$’000 $’000 $’000 $’000
At 1 January 19,422 28,278 6,165 11,203Writebackduringtheyear 6 (12,201) (6,335) (140) (4,957)Written-off against allowance (1,638) (16) (581) – Currency realignment (176) (2,505) 43 (81)
At 31 December 5,407 19,422 5,487 6,165
Staff loans are unsecured, interest-free and payable through monthly instalments over a period up to 5 years from the date the loan is granted.
The non-interest bearing amounts due from subsidiaries are unsecured and repayable upon demand. The interest bearing amounts due from subsidiaries are unsecured, bear interests at rates ranging from 1.88% to 5.75% (2010: 1.70% to 5.95%) per annum and are repayable upon demand.
The amounts due from associates are unsecured and repayable upon demand.
The amounts due from subsidiaries and associates are to be settled in cash.
14. Short-term investments
Group2011 2010$’000 $’000
Unquotedequitysharesincorporation,atfairvalue 456 381

96
Notes to the Financial Statements 31 December 2011(In Singapore dollars)
15. Cash and deposits
Group CompanyNote 2011 2010 2011 2010
$’000 $’000 $’000 $’000
Cashandbankbalances 35 35,933 33,175 4,235 2,341Fixeddepositswithfinancialinstitutions 35 38,939 34,871 21,500 19,095
74,872 68,046 25,735 21,436
FixeddepositsareplacedforvaryingperiodsdependingontheimmediatecashrequirementsoftheGroupandthe Company, and earn interests at the respective short-term deposit rates. The weighted average effective interest rates as at 31 December 2011 for the Group and the Company were 1.57% and 0.38% (2010: 2.65% and 2.59%) respectively.
16. Assets classified as held for sale
As at 31 December 2011, certain freehold land and buildings of a subsidiary involved in the Primary Production segment located in Australia, have been classified as “Assets classified as held for sale”. This is due to the subsidiary’s intention to sell these assets.
Group2011 2010$’000 $’000
Property,plantandequipment 1,673 8,810
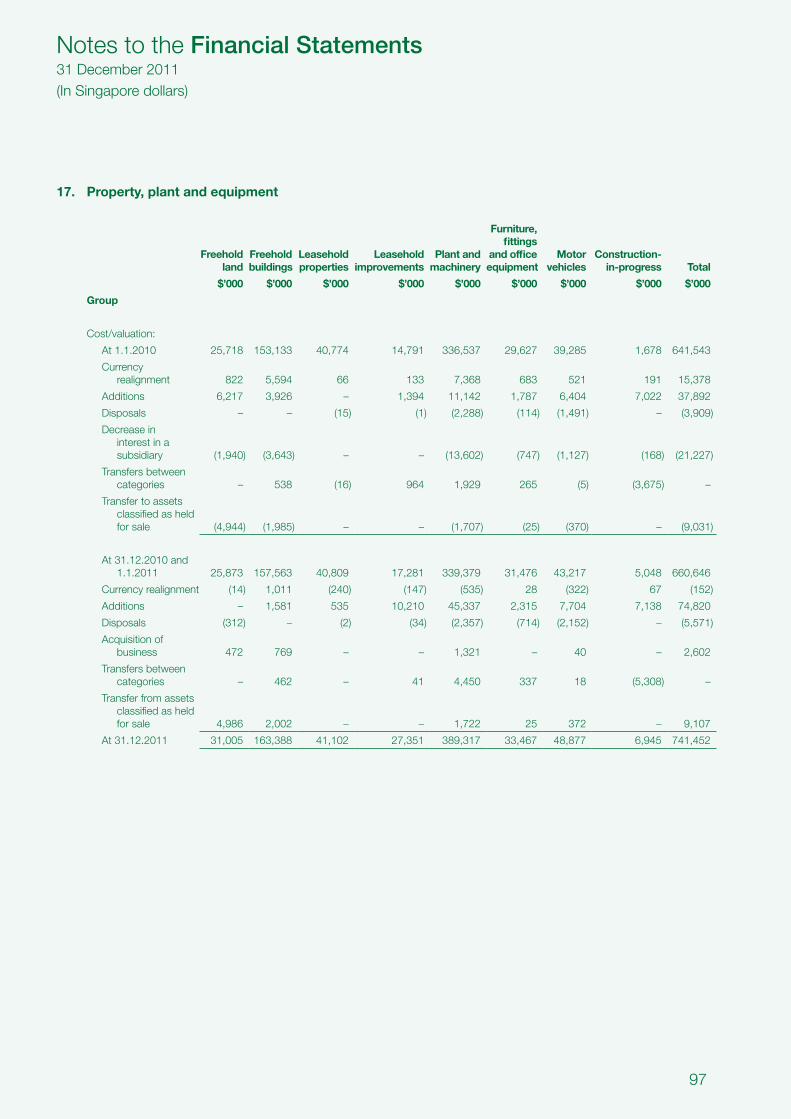
97
Notes to the Financial Statements 31 December 2011(In Singapore dollars)
17. Property, plant and equipment
Freeholdland
Freeholdbuildings
Leaseholdproperties
Leaseholdimprovements
Plant andmachinery
Furniture,fittings
and officeequipment
Motorvehicles
Construction-in-progress Total
$’000 $’000 $’000 $’000 $’000 $’000 $’000 $’000 $’000
Group
Cost/valuation:
At 1.1.2010 25,718 153,133 40,774 14,791 336,537 29,627 39,285 1,678 641,543
Currency realignment 822 5,594 66 133 7,368 683 521 191 15,378
Additions 6,217 3,926 – 1,394 11,142 1,787 6,404 7,022 37,892
Disposals – – (15) (1) (2,288) (114) (1,491) – (3,909)
Decrease in interest in a subsidiary (1,940) (3,643) – – (13,602) (747) (1,127) (168) (21,227)
Transfers between categories – 538 (16) 964 1,929 265 (5) (3,675) –
Transfer to assets classified as held for sale (4,944) (1,985) – – (1,707) (25) (370) – (9,031)
At 31.12.2010 and 1.1.2011 25,873 157,563 40,809 17,281 339,379 31,476 43,217 5,048 660,646
Currency realignment (14) 1,011 (240) (147) (535) 28 (322) 67 (152)
Additions – 1,581 535 10,210 45,337 2,315 7,704 7,138 74,820
Disposals (312) – (2) (34) (2,357) (714) (2,152) – (5,571)
Acquisitionof business 472 769 – – 1,321 – 40 – 2,602
Transfers between categories – 462 – 41 4,450 337 18 (5,308) –
Transfer from assets classified as held for sale 4,986 2,002 – – 1,722 25 372 – 9,107
At 31.12.2011 31,005 163,388 41,102 27,351 389,317 33,467 48,877 6,945 741,452

98
Notes to the Financial Statements 31 December 2011(In Singapore dollars)
17. Property, plant and equipment (continued)
Freeholdland
Freeholdbuildings
Leaseholdproperties
Leaseholdimprovements
Plant andmachinery
Furniture,fittings
and officeequipment
Motorvehicles
Construction-in-progress Total
$’000 $’000 $’000 $’000 $’000 $’000 $’000 $’000 $’000
Group
Accumulated depreciation and impairment loss:
At 1.1.2010 – 67,051 22,451 7,097 226,650 23,710 27,577 47 374,583
Currency realignment – 2,675 14 24 5,678 566 380 – 9,337
Charge for the year (Note 5) – 4,538 1,177 696 17,676 1,908 3,640 – 29,635
Disposals – – (5) (1) (2,224) (108) (1,478) – (3,816)
Decrease in interest in a subsidiary – (2,160) – – (5,513) (445) (693) (47) (8,858)
Transfers between categories – – – 8 (8) – – – –
Transfer to assets classified as held for sale – (495) – – (1,046) (15) (278) – (1,834)
At 31.12.2010 and 1.1.2011 – 71,609 23,637 7,824 241,213 25,616 29,148 – 399,047
Currency realignment – 621 (50) (44) (110) 39 (212) – 244
Charge for the year (Note 5) – 4,753 794 1,044 20,329 2,022 4,611 – 33,553
Disposals – – (1) (34) (1,983) (704) (2,063) – (4,785)
Transfer from assets classified as held for sale – 499 – – 1,054 15 281 – 1,849
At 31.12.2011 – 77,482 24,380 8,790 260,503 26,988 31,765 – 429,908
Net carrying amount:
At 31.12.2011 31,005 85,906 16,722 18,561 128,814 6,479 17,112 6,945 311,544
At 31.12.2010 25,873 85,954 17,172 9,457 98,166 5,860 14,069 5,048 261,599

99
Notes to the Financial Statements 31 December 2011(In Singapore dollars)
17. Property, plant and equipment (continued)
Analysis of cost and valuation
Cost$’000
Assets atvaluation
$’000Total$’000
At 31 December 2011Freeholdland 31,005 – 31,005Freeholdbuildings 163,388 – 163,388Leasehold properties 27,149 13,953 41,102Leasehold improvements 27,351 – 27,351Plant and machinery 389,317 – 389,317Furniture,fittingsandofficeequipment 33,467 – 33,467Motor vehicles 48,877 – 48,877Construction-in-progress 6,945 – 6,945
727,499 13,953 741,452
At 31 December 2010Freeholdland 25,873 – 25,873Freeholdbuildings 157,563 – 157,563Leasehold properties 27,874 12,935 40,809Leasehold improvements 17,281 – 17,281Plant and machinery 339,379 – 339,379Furniture,fittingsandofficeequipment 31,476 – 31,476Motor vehicles 43,217 – 43,217Construction-in-progress 5,048 – 5,048
647,711 12,935 660,646

100
Notes to the Financial Statements 31 December 2011(In Singapore dollars)
17. Property, plant and equipment (continued)
Leaseholdoffice and
improvements
Furniture,fittings
and officeequipment
Motorvehicles Total
$’000 $’000 $’000 $’000
Company
Cost: At 1.1.2010 2,841 1,148 769 4,758 Additions – 7 326 333 Disposals – – (325) (325) At 31.12.2010 and 1.1.2011 2,841 1,155 770 4,766 Additions – 14 184 198 Disposals – (480) (273) (753) At 31.12.2011 2,841 689 681 4,211
Accumulated depreciation: At 1.1.2010 748 923 726 2,397 Charge for the year 61 31 100 192 Disposals – – (325) (325) At 31.12.2010 and 1.1.2011 809 954 501 2,264 Charge for the year 53 24 99 176 Disposals – (478) (273) (751) At 31.12.2011 862 500 327 1,689
Net carrying amount: At 31.12.2011 1,979 189 354 2,522
At 31.12.2010 2,032 201 269 2,502
(a) Leaseholdpropertiesownedbyanoverseassubsidiarywasrequiredtoberevaluedbytheauthoritiesin1998. The valuation was made by the directors based on professional appraisals by Colliers Jordan Lee and Jaafar Sdn Bhd, a Chartered Valuation Surveyor, in May 1998. This one-off valuation was made on thebasisofopenmarketvalueonanexistingusebasis.Thevaluationsweredonebasedonpermittedaccounting standards at the relevant time.
(b) The net carrying amount of the Group’s leasehold properties had it been carried at cost is $13,321,000 (2010: $14,940,000).
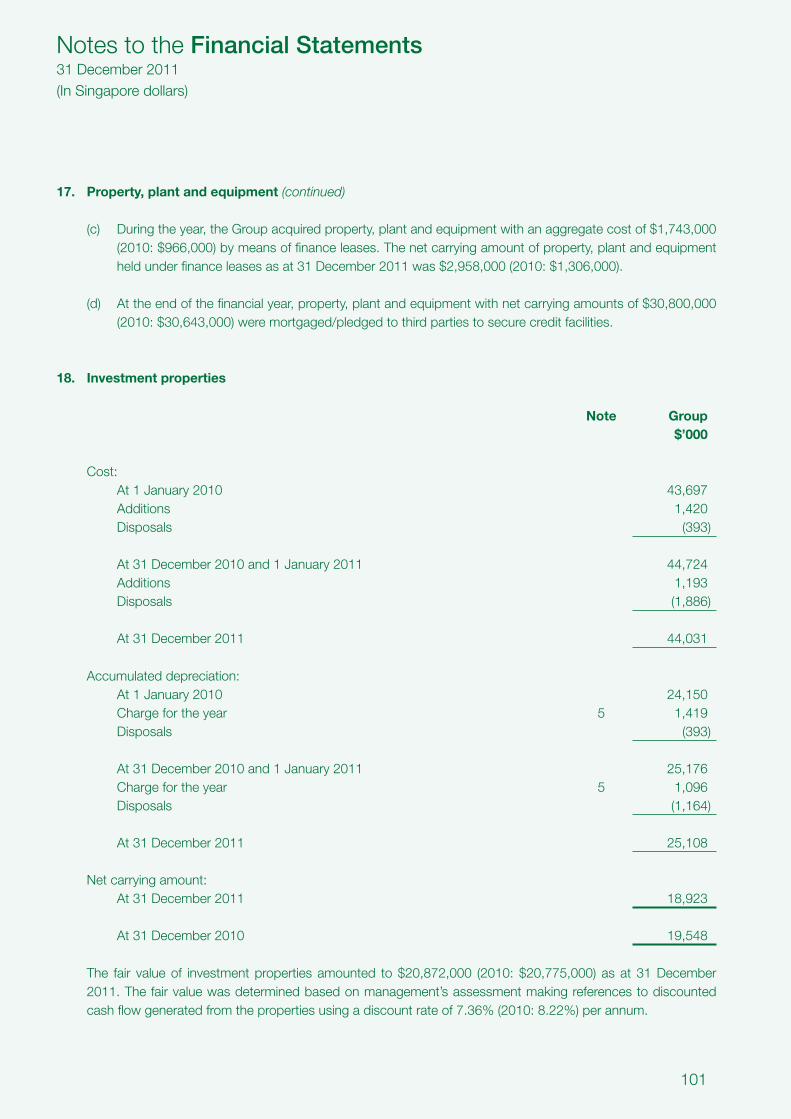
101
Notes to the Financial Statements 31 December 2011(In Singapore dollars)
17. Property, plant and equipment (continued)
(c) Duringtheyear,theGroupacquiredproperty,plantandequipmentwithanaggregatecostof$1,743,000(2010:$966,000)bymeansoffinanceleases.Thenetcarryingamountofproperty,plantandequipmentheld under finance leases as at 31 December 2011 was $2,958,000 (2010: $1,306,000).
(d) Attheendofthefinancialyear,property,plantandequipmentwithnetcarryingamountsof$30,800,000(2010:$30,643,000)weremortgaged/pledgedtothirdpartiestosecurecreditfacilities.
18. Investment properties
Note Group$’000
Cost:At 1 January 2010 43,697Additions 1,420Disposals (393)
At 31 December 2010 and 1 January 2011 44,724Additions 1,193Disposals (1,886)
At 31 December 2011 44,031
Accumulated depreciation:At 1 January 2010 24,150Charge for the year 5 1,419Disposals (393)
At 31 December 2010 and 1 January 2011 25,176Charge for the year 5 1,096Disposals (1,164)
At 31 December 2011 25,108
Net carrying amount:At 31 December 2011 18,923
At 31 December 2010 19,548
The fair value of investment properties amounted to $20,872,000 (2010: $20,775,000) as at 31 December 2011.Thefairvaluewasdeterminedbasedonmanagement’sassessmentmakingreferencestodiscountedcash flow generated from the properties using a discount rate of 7.36% (2010: 8.22%) per annum.

102
Notes to the Financial Statements 31 December 2011(In Singapore dollars)
19. Subsidiaries
Company2011 2010$’000 $’000
Cost of investment:Unquotedequityshares,atcost 102,720 104,350Less: Impairment loss (4,002) (5,632)
98,718 98,718
Movements in impairment loss are as follows:
Balance at beginning of year 5,632 5,882Charge for the year – 5,632Write-off during the year (1,630) (5,882)
Balance at end of year 4,002 5,632
During the year, the Company wrote-off the cost of investment amounting to $1,630,000 against the impairment lossprovidedinprioryearsasthesubsidiarywasstruckofftheRegister.
Details of subsidiaries are set out in Note 45(a).
20. Advances to subsidiaries
Company2011 2010$’000 $’000
Advances to subsidiaries 123,210 134,843Less: Allowance for doubtful debts – (23,212)
123,210 111,631
Movements in the allowance for doubtful debts are as follows:At 1 January 23,212 25,342Writebackduringtheyear (23,212) – Currency realignment – (2,130)
At 31 December – 23,212

103
Notes to the Financial Statements 31 December 2011(In Singapore dollars)
20. Advances to subsidiaries (continued)
Thenetadvancestosubsidiaries,whicharetobesettledincash,areunsecuredandinterest-freeexceptforan amount of $90,772,000 (2010: $71,220,000) with effective interest rates ranging from 1.48% to 5.75% (2010:4.75%to5.50%)perannum.Theseadvanceshavenofixedtermsofrepaymentandnorepaymentsareexpectedwithinthenext12months.
21. Associates
Group2011 2010$’000 $’000
Unquotedequityshares,atcost 2,128 24,266Quasi-equityloan – 9,357Group’sshareofpost-acquisitionaccumulatedprofitsandlosses 149 (32,057)Currency realignment (335) 330
1,942 1,896
TheGroup’sinvestmentinassociatesrepresentsequitysharesheldbysubsidiaries.
Duringtheyear,theGroupdisposedofits46.5%equityinterestinShaanxiHengxingFruitJuiceCo.,Ltdforcashconsiderationof$72,000. Inaddition, thequasi-equity loanof$9,298,000was recovered.Theequityinterest had been written down to nil in previous financial years. The gain on disposal amounted to $766,000.
Details of associates are set out in Note 45(b).

104
Notes to the Financial Statements 31 December 2011(In Singapore dollars)
21. Associates (continued)
The summarised financial information of the associates are as follows:
Group2011 2010$’000 $’000
Statement of financial position: Property,plantandequipment 4,718 169,812 Otherassets 1,387 84,533 Liabilities (3,829) (302,951)
2,276 (48,606)
Income statement: Revenue 12,804 340,174 Expenses (16,085) (380,107)
Lossbeforetaxation (3,281) (39,933) Taxation (45) (37)
Lossaftertaxation (3,326) (39,970)
22. Advances to associates
Theadvancestoassociates,whicharetobesettledincash,areunsecured,withnofixedtermsofrepaymentandarenotexpectedtoberepaidwithinthenexttwelvemonths.Effectiveinterestrateapproximating7.00%(2010: 7.00%) per annum is receivable on the advances.

105
Notes to the Financial Statements 31 December 2011(In Singapore dollars)
23. Long-term investments
Group Company2011 2010 2011 2010
$’000 $’000 $’000 $’000
Fair value through profit or loss
Unquoteddebtsecurities At fair value 908 – 908 –
Held-to-maturity investments
Quoteddebtsecurities At amortised cost 7,978 – 5,978 –
Available-for-sale
Unquotedinvestments At cost 691 691 – – Less: Impairment loss (691) (691) – –
– – – –
8,886 – 6,886 –
Theunquoteddebtsecuritiesdoesnotcarryinterest(2010:nil)andmatureinAugust2017.
Thequoteddebtsecuritiescarry interestratesof2.40%to4.40%(2010:nil)andmaturebetweenFebruary2013 to June 2021.
Movements in impairment loss are as follows:
Group2011 2010$’000 $’000
Unquotedinvestments:Balance at beginning of year 691 7,339Charge for the year – 691Write-off during the year – (7,339)
Balance at end of year 691 691
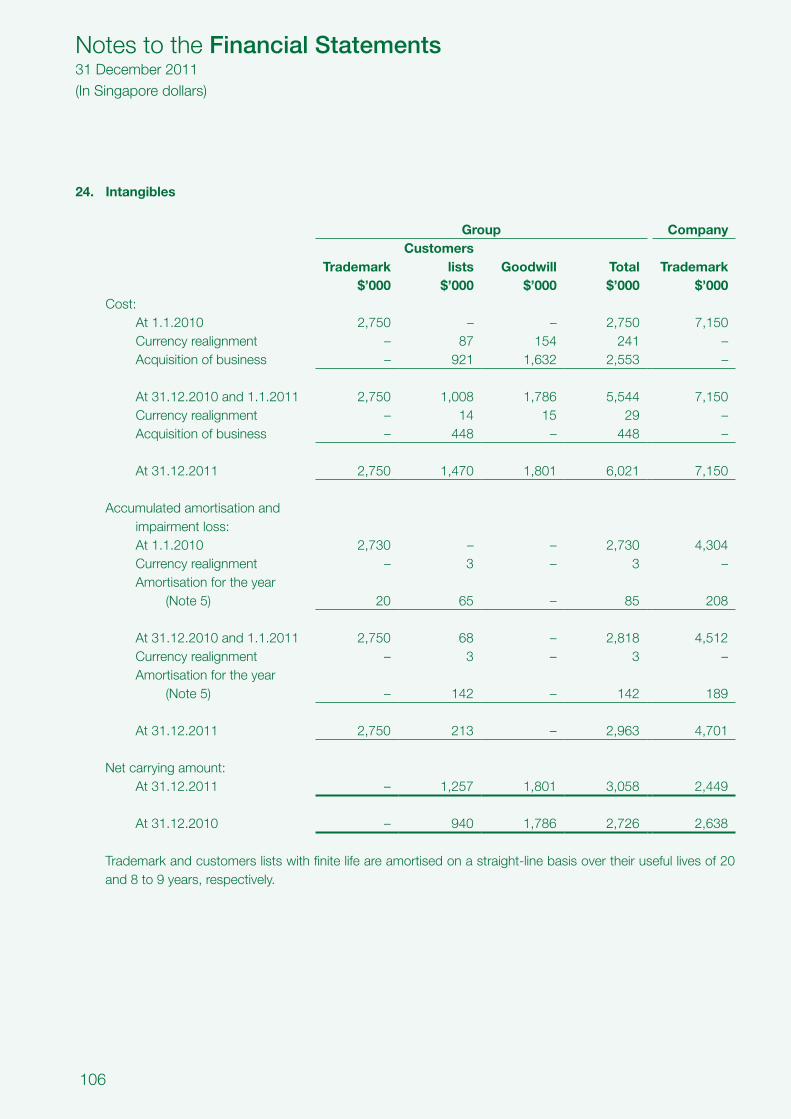
106
Notes to the Financial Statements 31 December 2011(In Singapore dollars)
24. Intangibles
Group Company
TrademarkCustomers
lists Goodwill Total Trademark$’000 $’000 $’000 $’000 $’000
Cost:At 1.1.2010 2,750 – – 2,750 7,150Currency realignment – 87 154 241 – Acquisitionofbusiness – 921 1,632 2,553 –
At 31.12.2010 and 1.1.2011 2,750 1,008 1,786 5,544 7,150Currency realignment – 14 15 29 – Acquisitionofbusiness – 448 – 448 –
At 31.12.2011 2,750 1,470 1,801 6,021 7,150
Accumulated amortisation and impairment loss:At 1.1.2010 2,730 – – 2,730 4,304Currency realignment – 3 – 3 – Amortisation for the year
(Note 5) 20 65 – 85 208
At 31.12.2010 and 1.1.2011 2,750 68 – 2,818 4,512Currency realignment – 3 – 3 – Amortisation for the year
(Note 5) – 142 – 142 189
At 31.12.2011 2,750 213 – 2,963 4,701
Net carrying amount:At 31.12.2011 – 1,257 1,801 3,058 2,449
At 31.12.2010 – 940 1,786 2,726 2,638
Trademarkandcustomerslistswithfinitelifeareamortisedonastraight-linebasisovertheirusefullivesof20and 8 to 9 years, respectively.

107
Notes to the Financial Statements 31 December 2011(In Singapore dollars)
24. Intangibles (continued)
Acquisition of business during the year
InNovember2011,asubsidiaryacquireda feedmillbusiness inCorowa,NewSouthWales.At thedateofacquisition,thesubsidiaryrecognisedthefairvalueoftheidentifiedassetsandliabilitiesofthefeedmiller.
Thefairvalueoftheidentifiableassetsandliabilitiesasatthedateofacquisitionwere:
Recognisedon acquisition
$’000
Property,plantandequipment 2,602Intangible – customers list 448
Netassetsacquired 3,050Negativegoodwillonacquisitionofbusiness (786)
Total purchase consideration - in cash 2,264
Impairment testing of indefinite life goodwill
Goodwill acquired through business combinations has been allocated to the cash generating units. Therecoverable amount has been determined based on value in use calculation.
To calculate this, cash flow projections are based on financial budgets approved by senior management covering a 5 year period. The discount rate applied to the cash flows is 12.5% (2010: 11.0%).
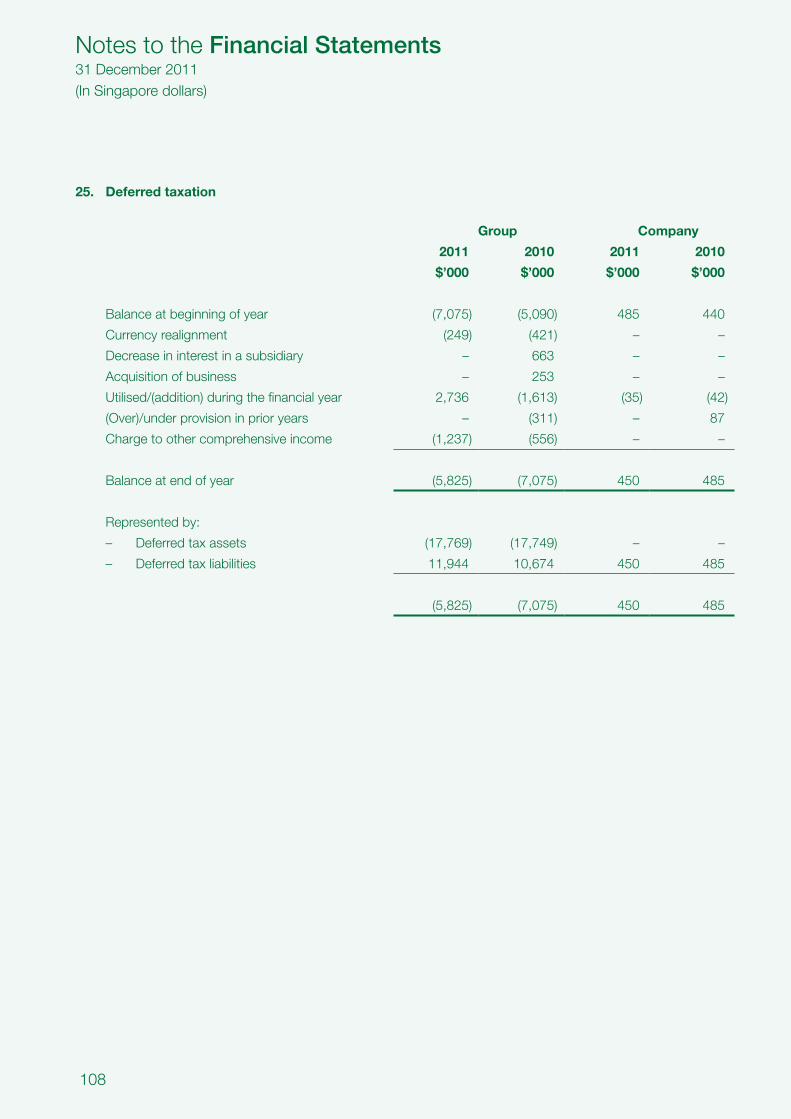
108
Notes to the Financial Statements 31 December 2011(In Singapore dollars)
25. Deferred taxation
Group Company
2011 2010 2011 2010
$’000 $’000 $’000 $’000
Balance at beginning of year (7,075) (5,090) 485 440
Currency realignment (249) (421) – –
Decrease in interest in a subsidiary – 663 – –
Acquisitionofbusiness – 253 – –
Utilised/(addition)duringthefinancialyear 2,736 (1,613) (35) (42)
(Over)/underprovisioninprioryears – (311) – 87
Charge to other comprehensive income (1,237) (556) – –
Balance at end of year (5,825) (7,075) 450 485
Representedby:
– Deferredtaxassets (17,769) (17,749) – –
– Deferredtaxliabilities 11,944 10,674 450 485
(5,825) (7,075) 450 485

109
Notes to the Financial Statements 31 December 2011(In Singapore dollars)
25. Deferred taxation (continued)
ThemovementsintheGroup’sdeferredtaxassetsandliabilitiesduringtheyearareasfollows:
Property, plant and
equipmentEmployee
benefits
Fair value adjustment
on biologicalassets Others Total
$’000 $’000 $’000 $’000 $’000
Deferred tax assetsAt 1 January 2010 4,001 5,552 5,263 223 15,039Addition/(utilised)duringtheyear 416 161 1,528 (764) 1,341Under recognition in prior years 94 – 360 26 480Taxeffectofactuariallossondefined
benefit plans charged to other comprehensive income – – – 556 556
Acquisitionofbusiness – 24 – (277) (253)Currency realignment 177 196 287 (74) 586
At 31 December 2010 and 1 January 2011 4,688 5,933 7,438 (310) 17,749(Utilised)/additionduringtheyear 553 217 (1,644) (468) (1,342)Taxeffectofactuariallossondefined
benefit plans charged to other comprehensive income – – – 1,237 1,237
Currency realignment 48 52 38 (13) 125
At 31 December 2011 5,289 6,202 5,832 446 17,769

110
Notes to the Financial Statements 31 December 2011(In Singapore dollars)
25. Deferred taxation (continued)
Property, plant and
equipment
Fair value adjustment
on biologicalassets Others Total
$’000 $’000 $’000 $’000
Deferred tax liabilitiesAt 1 January 2010 9,936 753 (740) 9,949Decrease in interest in a subsidiary (223) – 886 663Write-backtoprofitorloss (21) (46) (205) (272)Under provision in prior years 81 – 88 169Currency realignment 140 27 (2) 165
At 31 December 2010 and 1 January 2011 9,913 734 27 10,674Charge to profit or loss 1,225 97 72 1,394Currency realignment (142) 8 10 (124)
At 31 December 2011 10,996 839 109 11,944
ThemovementsintheCompany’sdeferredtaxliabilitiesduringtheyearareasfollows:
Earnings retainedoverseas
Property, plantand equipment Total
$’000 $’000 $’000
At 1 January 2010 155 285 440(Write-back)/chargetoprofitorloss (155) 113 (42)Under provision in prior years – 87 87
At 31 December 2010 and 1 January 2011 – 485 485Write-backtoprofitorloss – (35) (35)
At 31 December 2011 – 450 450

111
Notes to the Financial Statements 31 December 2011(In Singapore dollars)
26. Trade payables
Group Company2011 2010 2011 2010
$’000 $’000 $’000 $’000
Trade payables:– third parties 86,331 72,685 55 71– associate 709 558 – –
87,040 73,243 55 71
27. Other payables
(a) Other payables
Payable within one year:
Group CompanyNote 2011 2010 2011 2010
$’000 $’000 $’000 $’000
Staffrelatedexpenses 19,160 18,632 1,533 1,392Accruedoperatingexpenses 12,294 12,299 236 415Sundry creditors 16,588 10,113 2 – Amounts due to subsidiaries – – 4,917 5,303Amount due to an associate 90 – – – Derivative financial liabilities 27(b) 3 – – –
48,135 41,044 6,688 7,110 Payable after one year:
Provision for long service leave and retirement benefits 13,600 12,580 – –
Loan from non-controlling interest 1,084 1,075 – –
14,684 13,655 – –
The amounts due to subsidiaries and an associate are unsecured, interest-free, repayable upon demand and are to be settled in cash.
The loan from non-controlling interest of a subsidiary is unsecured and bears interest at 7.00% (2010: 10.00%)perannum.Theloanhasnofixedtermsofrepaymentandnorepaymentisexpectedwithinthenext12months.

112
Notes to the Financial Statements 31 December 2011(In Singapore dollars)
27. Other payables (continued)
(a) Other payables (continued)
Movements in provision for long service leave and retirement benefits are as follows:
Group CompanyNote 2011 2010 2011 2010
$’000 $’000 $’000 $’000
Balance at beginning of year 12,580 11,810 – – Currency realignment 84 357 – – Provision charged during the year 6 1,354 1,606 – – Utilised during the year (418) (983) – – Decrease in interest in a subsidiary – (210) – –
Balance at end of year 13,600 12,580 – –
(b) Derivative financial liabilities are as follows:
2011 2010Contractnotionalamount Fair value
Contractnotionalamount Fair value
$’000 $’000 $’000 $’000
GroupForeigncurrencycontracts– not designated as hedges 5,726 3 – –
At 31 December 2011, the settlement dates on open foreign currency contracts ranged between 1 to 15 months for the following notional amounts:
Group Company2011 2010 2011 2010
$’000 $’000 $’000 $’000
Contracts to deliver Singapore Dollars and receive:
United States Dollars 175 – – – Australian Dollars 232 – – – Othercurrencies 73 – – – Contracts to deliver Japanese Yen
and receive: Australian Dollars 5,246 – – –
5,726 – – –

113
Notes to the Financial Statements 31 December 2011(In Singapore dollars)
28. Exchangeable bond
Group and Company2011 2010$’000 $’000
FacevalueofexchangeablebondissuedinJuly2009 10,000 10,000Derivatives component of the bond at initial recognition (500) (500)
Liability component of the bond at initial recognition 9,500 9,500Add: Accumulated amortisation of discount – 500
Liability component of the bond at 31 December 9,500 10,000Add: Derivative component of the bond at 31 December 500 –
Carrying value of the bond at 31 December 10,000 10,000
Payable within one year – 10,000Payable after one year 10,000 –
10,000 10,000
In July2009, theCompany issueda zero-couponMandatorilyExchangeablebonddue2011 inaprincipalamountof$10million(the“Bond”)atanissuepriceequalto100%oftheprincipalamountoftheBond,toitscontrollingshareholder.TheBondshallbemandatorilyexchangeableintofullypaidandunencumberedordinaryshares (the “Hamsdale Shares”) of the Company’s wholly-owned subsidiary, Hamsdale International Pte Ltd (“Hamsdale”),onthedateHamsdaleislistedontheSingaporeExchangeSecuritiesTradingLimited(the“SGX-ST”).ThepriceatwhichaHamsdaleShareshallbeexchangedshallbe95%oftheofferpriceofaHamsdaleShareintheinitialpublicoffer.Unlessmandatorilyexchangedandcancelled,theCompanywastoredeemtheBondatitsprincipalamountonthematuritydate,31July2011.TheinitialpublicofferofHamsdaledidnottakeplaceonorbeforethematuritydateandon1August2011,thematuritydateoftheBondwasextendedforafurther term of 2 years to 31 July 2013.

114
Notes to the Financial Statements 31 December 2011(In Singapore dollars)
29. Short-term borrowings
Group Company2011 2010 2011 2010
$’000 $’000 $’000 $’000
Short-termbankloans:– unsecured 49,563 31,809 7,863 – – secured 21,961 9,607 – –
71,524 41,416 7,863 –
Theshort-termbankloansbeareffectiveinterestratesrangingfrom1.50%to5.96%(2010:4.48%to6.40%)per annum. The secured portion of the borrowings as at 31 December 2011 was charged against inventories of the Group.
30. Long-term loans and finance leases
Effectiveinterest Group Companyrate perannum Maturities 2011 2010 2011 2010
% $’000 $’000 $’000 $’000
Loansfrombanks:– Loan A 3.09 2012 – 17,320 – 17,320– Loan B 7.92 2012 – 20,873 – – – Loan C 4.14 2017 16,742 16,668 – – – Otherloans 5.58 - 9.07 2019 6,352 6,249 – – Financeleases 2,540 1,127 – –
25,634 62,237 – 17,320Less: Current portion (2,554) (18,543) – (9,851)
Non-current portion of loans 23,080 43,694 – 7,469

115
Notes to the Financial Statements 31 December 2011(In Singapore dollars)
30. Long-term loans and finance leases (continued)
Loan A, denominated in Singapore Dollar, with floating interest rate of 3.09% per annum, was unsecured, and wasrepayablein12quarterlyinstalmentscommencingfromNovember2009.Theloanwasfullyrepaidduringthe financial year.
Loan B, denominated in Australian Dollar, with floating interest rate of 7.92% per annum, was unsecured and wasrepayablein12quarterlyinstalmentscommencingfromSeptember2009.Theloanwasfullyrepaidduringthe financial year.
Loan C, denominated in Philippines Peso, with floating interest rate of 4.14% (2010: 6.14%) per annum, is securedoncertainproperty,plantandequipmentoftheGroupandofanassociate,andisrepayablein20equalquarterlyinstalmentscommencingfromOctober2012.
Otherloans,denominatedinAustralianDollar,withinterestratesrangingfrom5.58%to9.07%(2010:6.26%)perannum,aresecuredonfloatingchargeoncertainproperty,plantandequipmentandfixeddepositsoftheGroup, and is repayable in monthly instalments until May 2019.
Commitments under finance leases as at 31 December are as follows:
Minimumlease
payments
Presentvalue of
payments
Minimumlease
payments
Presentvalue of
payments2011$’000
2011$’000
2010$’000
2010$’000
Group
Within one year 673 486 357 295Between one and five years 2,360 2,054 925 832
Total minimum lease payments 3,033 2,540 1,282 1,127Less: Amount representing finance charges (493) – (155) –
Present value of minimum lease payments 2,540 2,540 1,127 1,127
Effectiveinterestratesonfinanceleasesrangefrom5.72%to11.57%(2010:5.72%to11.57%)perannum.The finance leases do not contain any escalation clauses and do not provide for contingent rents. Lease terms do not contain restrictions on the Group activities concerning dividends, additional debts or entering into other leasing agreements.

116
Notes to the Financial Statements 31 December 2011(In Singapore dollars)
31. Pension liabilities
TheGroup’scompanies inAustraliaoperateasuperannuationscheme that includeRivaleaSuperannuationFund(DefinedBenefits)(the“Fund”).TheFundismanagedbyanexternaladministratorandtheassetsoftheFundareheldinaseparatetrustee-administeredfund.TheFundguaranteesitsmembers(i.e.theemployees)a superannuation payout based on level of salary and years of service, irrespective of the investment returns whichthefundmakes.
ThesuperannuationschemealsoincludeRivaleaSuperannuationFund(Accumulation).Bydefinition,theassetvaluation of this fund is the vested benefit of members. Members are entitled to their contributions, and those of the Company, along with the return on investment the fund has achieved in their time of membership. This fund ismanagedbyanexternaladministratorandtheassetsoftheFundareinvestedwithexternalfundmanagers.
Group2011 2010
$’000 $’000
Benefit liabilityFairvalueofplanassets 20,659 19,004Present value of benefit obligation (23,474) (19,744)
Net benefit liability (2,815) (740)
Changes in the fair value of plan assets are as follows:At 1 January 19,004 22,079Expectedreturnonplanassets 1,231 1,333Actuarial losses (1,913) (691)Employercontributions 2,344 2,225Contributions by plan participants 307 271Benefits paid – (6,474)Taxes,premiumsandexpensespaid (524) (464)Currency realignment 210 725
At 31 December 20,659 19,004

117
Notes to the Financial Statements 31 December 2011(In Singapore dollars)
31. Pension liabilities (continued)
Group2011 2010
$’000 $’000
Changes in the present value of the defined benefit obligation are as follows:At 1 January 19,744 22,997Interest cost 968 1,039Current service cost 582 538Contributions by plan participants 307 271Benefits paid – (6,474)Actuarial losses on obligation 2,210 1,162Taxes,premiumsandexpensespaid (524) (464)Currency realignment 187 675
At 31 December 23,474 19,744
TheGroupexpectstocontribute$2,215,000toitsdefinedbenefitpensionplanin2012.
The major categories of plan assets as a percentage of the fair value of total plan assets are as follows:
Group2011 2010
% %
Australianequities 30 29Overseasequities 29 27Fixedinterestsecurities 19 18Property 13 10Other 9 16
100 100

118
Notes to the Financial Statements 31 December 2011(In Singapore dollars)
31. Pension liabilities (continued)
The principal actuarial assumptions used in determining pension benefit obligations for the Group’s plan are shownbelow(expressedasweightedaverages):
Group2011 2010
% %
Discount rate 3.3 5.4Salary increase rate 4.0 4.0Expectedrateofreturnonassets 6.8 6.7
Thefollowingtablesummarisesthecomponentsofnetbenefitexpenserecognisedinprofitorloss:
Group2011 2010
$’000 $’000
Netbenefitexpense(recognisedwithinstaffcosts):Service cost 582 538Interest cost 968 1,039Expectedreturnonassets (1,231) (1,333)
319 244
Actual return on plan assets (663) 700
Amounts for the current and previous four periods are as follows:
Group2011 2010 2009 2008 2007
$’000 $’000 $’000 $’000 $’000
Plan assets 20,659 19,004 22,079 16,656 30,080Defined benefit obligation (23,474) (19,744) (22,997) (20,862) (27,437)
(2,815) (740) (918) (4,206) 2,643

119
Notes to the Financial Statements 31 December 2011(In Singapore dollars)
32. Share capital
Group and Company2011 2010
No. ofshares $’000
No. of shares $’000
Issued and fully paid :
At 1 January 497,106,083 214,823 477,245,971 202,692Issued during the year 21,334,551 12,333 19,860,112 12,131
At 31 December 518,440,634 227,156 497,106,083 214,823
The holders of ordinary shares are entitled to receive dividends as and when declared by the Company. All ordinary shares carry one vote per share without restrictions and have no par value.
During the financial year,
(i) theCompanyissued20,212,551ordinarysharesat$0.581persharepursuanttotheQAFScripDividendScheme in respect of the final dividend for the financial year ended 31 December 2010; and
(ii) theCompanyissued1,122,000ordinarysharesforcashattheaverageexercisepriceof$0.526pershareupontheexerciseof1,122,000shareoptionsbyemployeespursuanttotheQAFLimitedShareOptionScheme 2000 (Note 36).
33. Reserves
Group Company2011 2010 2011 2010
$’000 $’000 $’000 $’000
Revaluationreserve 2,312 2,360 – – Capital reserve 17,941 19,005 1,705 1,705Revenuereserve 132,269 96,071 44,599 25,328Foreigncurrencytranslationreserve 8,506 8,081 – –
161,028 125,517 46,304 27,033

120
Notes to the Financial Statements 31 December 2011(In Singapore dollars)
33. Reserves (continued)
Company2011 2010
$’000 $’000
Analysis of movement in the reserves of the Company:
Capital reserveAt beginning and end of year 1,705 1,705
Revenue reserveAt beginning of year 25,328 17,808Net profit for the year 39,397 26,927Dividends (20,126) (19,407)
At end of year 44,599 25,328
Total 46,304 27,033
Revaluation reserve
Revaluationreservecompriseofthefollowing:
(a) surplusarising from the revaluationofproperty,plantandequipmentbyasubsidiary. Ineachfinancialyear, an amount is transferred from the revaluation reserve to the revenue reserve to match the additional depreciation charge on the revalued assets; and
(b) surplusarisingfromshareofasubsidiary’srevaluationofproperty,plantandequipmentonacquisitionofadditional interest in the subsidiary.
Capital reserve
Capital reserve comprise of the following:
a) cumulativevalueofservicesreceivedfromemployeesrecordedongrantofequity-settledshareoptions;
b) amounts transferred from the revenue reserve due to bonus shares issued by a subsidiary as fully paid shares through capitalisation of its revenue reserve; and
c) amountstransferredfromtherevenuereserveduetostatutoryrequirementofassociateinthePeople’sRepublicofChina(“PRC”).InaccordancewiththeForeignEnterpriseLawapplicabletothecompaniesinPRC,at least10%of thestatutoryafter taxprofitsasdetermined inaccordancewiththeapplicablePRCaccountingstandardsandregulationsmustbeallocated toa reserveuntil thecumulative totalofthereservereaches50%ofthecompany’sregisteredcapital.SubjecttoapprovalfromtherelevantPRCauthorities, such reserve may be used to offset any accumulated losses or increase the registered capital of the company. Such reserve is not available for dividend distribution to shareholders. This reserve was realised upon disposal of the associate.

121
Notes to the Financial Statements 31 December 2011(In Singapore dollars)
33. Reserves (continued)
Capital reserve (continued)
Group Company2011 2010 2011 2010
$’000 $’000 $’000 $’000
Cumulative value of services received from employees 1,705 1,705 1,705 1,705
Bonus shares issued by a subsidiary 16,236 16,236 – – StatutoryrequirementofPRCassociate – 1,064 – –
17,941 19,005 1,705 1,705
Foreign currency translation reserve
The foreign currency translation reserve comprise currency translation arising from the translation of assets and liabilities of foreign subsidiaries and associates for inclusion in the consolidated financial statements and exchangedifferencesarising fromthe long-term intercompanybalanceswhichareeffectivelypartof thenetinvestment.
34. DividendsGroup and Company
2011 2010$’000 $’000
Interimtax-exempt(one-tier)dividendof1centpershareinrespect of the financial year ended 31 December 2011 5,184 –
Finaltax-exempt(one-tier)dividendof3centspershareinrespect of the financial year ended 31 December 2010 14,942 –
Interimtax-exempt(one-tier)dividendof1centpershareinrespect of the financial year ended 31 December 2010 – 4,968
Finaltax-exempt(one-tier)dividendof3centspershareinrespect of the financial year ended 31 December 2009 – 14,439
20,126 19,407
The Company’s Scrip Dividend Scheme under which shareholders may elect to receive dividends in the form of new shares in lieu of cash had been applied in respect of the final dividend for the financial years ended 31 December 2009 and 31 December 2010.
Thedirectorshaveproposedafinaltax-exempt(one-tier)dividendof4centspershare(“ProposedFinalDividendfor FY 2011”), amounting to approximately $20,738,000 be paid in respect of the financial year ended 31December 2011. The dividend will be recorded as liability in the statement of financial position of the Company and Group upon approval of the shareholders at the Annual General Meeting of the Company.

122
Notes to the Financial Statements 31 December 2011(In Singapore dollars)
34. Dividends (continued)
The Company’s Scrip Dividend Scheme under which shareholders may elect to receive dividends in the form of newsharesinlieuofcashwillapplytotheProposedFinalDividendforFY2011.
Therearenoincometaxconsequence(2010:nil)attachedtothedividendstotheshareholdersproposedbytheCompany but not recognised as a liability in the financial statements.
35. Cash and cash equivalents
Cash and cash equivalents included in the consolidated statement of cash flows comprise the followingstatement of financial position amounts:
GroupNote 2011 2010
$’000 $’000
Cashandbankbalances 15 35,933 33,175Fixeddepositswithfinancialinstitutions 15 38,939 34,871
74,872 68,046Less:Fixeddepositspledgedassecurityforcreditfacilitiesgrantedtoasubsidiary (2,858) –
72,014 68,046
36. Employee benefits
Share options
TheGrouphasgrantedshareoptionstoeligibleemployeesunderTheQAFLimitedShareOptionScheme2000(“2000 Scheme”).
The2000SchemewasapprovedbythemembersoftheCompanyatanExtraordinaryGeneralMeetingheldon12 May 2000. The total number of shares in respect of which options may be offered on any offering date, when addedtothenumberofsharesissuedorissuableinrespectofoptionsunderthisSchemeshallnotexceed15%of the issued share capital of the Company on the day preceding that offering date.
Theexercisepriceofeachshareinrespectofanoptiongrantedmaybe(i)theaverageofthelastdealtpricesofthesharesoftheCompany,asdeterminedbyreferencetotheFinancialNewsorotherpublicationpublishedby the Singapore Exchange Securities Trading Limited, for the three consecutive trading days immediatelyprecedingthedateofgrantofthatoption(“MarketPrice”)or(ii)atadiscountnotexceeding20%oftheMarketPricebutinanyeventnoexercisepriceshallbelessthan$0.40persharebeingtheparvalueofanordinaryshare in the Company immediately before the abolishment of the par value by the Singapore Companies (Amendments) Act 2005.

123
Notes to the Financial Statements 31 December 2011(In Singapore dollars)
36. Employee benefits (continued)
An option granted is valid for 10 years (unless otherwise terminated or lapsed pursuant to the rules as stipulated in the2000Scheme)and isexercisable, foranoptiongrantedwithoutdiscount totheMarketPrice,afteravestingperiodof1yearand foranoptiongrantedatadiscount to theMarketPrice,afteravestingperiodof 2 years.
The2000Schemeexpiredin2010withoutrenewal.However,thediscontinuationofthe2000Schemedoesnotaffecttherightsoftheoptionholderstovalidlyexercisetheiroptionswithintherespectiverelevantexerciseperiod stated in the paragraph below.
The dilutive effect of outstanding options is reflected as additional share dilution in the computation of earnings per share.
Information with respect to the total number of options granted under the 2000 Scheme are as follows:
No. ofoptions in
financialyear 2011
‘000
Weightedaverageexerciseprice in
financialyear 2011
$
No. ofoptions in
financialyear 2010
‘000
Weightedaverageexerciseprice in
financialyear 2010
$
Outstandingatbeginningofyear 9,167 0.538 14,384 0.547Exercised (1,122) (0.526) (4,777) (0.560)Lapsed/forfeited (336) (0.498) (440) (0.601)
Outstandingatendofyear 7,709 0.541 9,167 0.538
Exercisableatendofyear 7,709 0.541 9,167 0.538

124
Notes to the Financial Statements 31 December 2011(In Singapore dollars)
36. Employee benefits (continued)
The following table summarises informationaboutoptionsoutstandingandexercisable asat 31December2011 to subscribe for ordinary shares in the Company:
Outstanding Exercisable
Offer dateNumber
of options
Exercise price per
share
Exercise period Numberof optionsFrom To
05.04.2002 1,139,000 $0.555 06.04.2003 05.04.2012 1,139,00013.05.2004 1,950,000 $0.523 14.05.2005 13.05.2014 1,950,00018.08.2005 1,745,000 $0.513 18.08.2006 17.08.2015 1,745,00019.05.2006 2,875,000 $0.565 19.05.2007 18.05.2016 2,875,000
7,709,000 7,709,000
Duringthefinancialyear,1,122,000ordinarysharesoftheCompanywereissuedpursuanttotheexerciseofoptions by employees and directors of the Group.
No options were granted during the financial year under review.
Thefairvalueofshareoptionsasatthedateofgrantisestimatedusingthebinomialmodel,takingintoaccountthetermsandconditionsuponwhichtheoptionsweregranted.Theexpectedlifeoftheoptionsisbasedonhistorical data and is not necessarily indicative of exercise patterns thatmay occur. The expected volatilityreflects the assumption that the historical volatility is indicative of future trends, which may also not necessarily be the actual outcome. No other features of the option grant were incorporated into the measurement of fair value.
Up to 31 December 2011, the cumulative expenses recognised in respect of share options amounted to$1,705,000 (2010: $1,705,000).

125
Notes to the Financial Statements 31 December 2011(In Singapore dollars)
37. Commitments
Group Company2011 2010 2011 2010
$’000 $’000 $’000 $’000
(i) Capital commitments not provided for in the financial statements:
Expenditurecontractedinrespectofproperty,plantandequipmentandinvestment properties 6,343 23,057 – –
Approved by the directors but not contracted for 2,147 1,691 – –
8,490 24,748 – –
(ii) Commitmentstopurchasebulksuppliesofraw materials 34,194 22,660 – –
(iii) Lease commitments payable – where a group company is a lessee
Commitments under non-cancellable operating leases. The minimum lease paymentsareleaseswhichexpire:
Within one year 5,865 5,248 91 135Between one and five years 10,464 8,003 135 227After five years 23,142 19,079 – –
39,471 32,330 226 362
The Group leases office premises, warehousing/trading facilities, retail outlets and passenger andcommercial vehicles under operating leases. The leases typically run for an initial period of 3 to 50 years, with an option to renew the lease after that date. Lease rentals are usually adjusted during the renewals to reflectmarketrentals.
(iv) Intheordinarycourseofitsbusiness,theCompany,astheholdingcompany,hasgivenundertakingstocontinue to provide financial support to certain subsidiaries.

126
Notes to the Financial Statements 31 December 2011(In Singapore dollars)
38. Contingent liabilities (unsecured)
Group Company2011 2010 2011 2010
$’000 $’000 $’000 $’000
(a) Guaranteesissuedforbankfacilities granted to subsidiaries – – 130,565 149,080
Amounts utilised by subsidiaries as at end of the reporting period – – 63,486 62,289
(b) Claims by a subsidiary’s employee via industrial court case – 42 – –
Nomateriallossesareexpectedtoarisefromtheabovecontingencies.
39. Related party transactions
(a) In addition to the related party information disclosed elsewhere in the financial statements, the following significanttransactionstookplaceduringthefinancialyearontermsagreedbythepartiesconcerned:
Group Company2011 2010 2011 2010
$’000 $’000 $’000 $’000
Purchases from an associate 4,047 3,553 – – Land rental charges paid to an associate 236 233 – – Interest income from associates 206 401 – – Officerentalpaidtoadirector 10 38 10 38Management fee income from an associate 114 108 – – Management fee income from subsidiaries – – 1,232 1,300Royaltyincomefromsubsidiaries – – 22,767 19,899Interest income from advances to
subsidiaries – – 4,765 3,815Dividend income from subsidiaries – – 399 10,543

127
Notes to the Financial Statements 31 December 2011(In Singapore dollars)
39. Related party transactions (continued)
(b) Compensationofkeymanagementpersonnel
Group2011 2010
$’000 $’000
Feesandremuneration 3,626 3,221ContributiontotheCentralProvidentFund 18 15
40. Financial risk management objectives and policies
TheGroupandtheCompanyisexposedtofinancialrisksarisingfromitsoperationsandtheuseoffinancialinstruments.Thekeyfinancialrisksincludecreditrisk,liquidityrisk,interestrateriskandforeigncurrencyrisk.
It is, and has been throughout the current and previous financial year the Group’s and the Company’s policy not to hold or issue derivative financial instruments for trading purposes.
ThefollowingsectionsprovidedetailsregardingtheGroup’sandCompany’sexposuretotheabove-mentionedfinancialrisksandtheobjectives,policiesandprocessesforthemanagementoftheserisks.
(a) Credit risk
Credit risk is the risk thatentitiesand individualswillbeunable tomeet theirobligations to theGroupresulting in financial loss to the Group. It is the Group’s policy to enter into transactions with a diversity of creditworthypartiestomitigateanysignificantconcentrationofcreditrisk.TheGroupensuresthatsalesofproducts and services are made to customers with appropriate credit history and has internal mechanisms tomonitorthegrantingofcreditandmanagementofcreditexposures.TheGrouphasmadeallowances,wherenecessary,forpotentiallossesoncreditsextended.TheGroup’smaximumexposuretocreditriskinthe event the counterparties fail to perform their obligations in relation to each class of recognised financial assets is the carrying amount of those assets as indicated in the statement of financial position. The Group hasnosignificantconcentrationofcreditrisk.
Exposure to credit risk
Attheendofthereportingperiod,theGroup’sandtheCompany’smaximumexposuretocreditriskisrepresented by:
– the carrying amount of each class of financial assets recognised in the statements of financial position; and
– a nominal amount of $130,565,000 (2010: $149,080,000) relating to corporate guarantees provided by the Company for bank facilities granted to subsidiaries, of which, the amounts utilised bysubsidiaries as at the end of the reporting period is $63,486,000 (2010: $62,289,000).
Information regarding credit enhancements for trade receivables is disclosed in Note 12.

128
Notes to the Financial Statements 31 December 2011(In Singapore dollars)
40. Financial risk management objectives and policies (continued)
(a) Credit risk (continued)
Credit risk concentration profile
TheGroupdeterminesconcentrationofcreditriskbymonitoringtheindustryandcountrysectorprofileof its tradereceivablesonanon-goingbasis.Thecredit riskconcentrationprofileof theGroup’s tradereceivables at the end of the reporting period is as follows:
Group2011 2010
$’000 % of total $’000 % of total
By industry:Bakery 46,041 55 41,086 52Primary production 20,975 25 22,786 29Trading and logistics 17,131 20 14,718 19Investments and others 320 – 234 –
84,467 100 78,824 100
By country:Singapore 30,342 36 27,831 35Australia 22,644 27 23,869 30Philippines 14,639 17 13,137 17Malaysia 16,331 19 13,604 17Othercountries 511 1 383 1
84,467 100 78,824 100
(b) Liquidity risk
LiquidityriskistheriskthattheGrouportheCompanywillencounterdifficultyinmeetingfinancialobligationsduetoshortageoffunds.TheGroup’sandtheCompany’sexposuretoliquidityriskarisesprimarilyfrommismatches of the maturities of financial assets and liabilities. The Group’s and the Company’s objective istomaintainabalancebetweencontinuityof fundingandflexibilitythroughtheuseofstand-bycreditfacilities.
TheGroup’sandtheCompany’sliquidityriskmanagementpolicyistomaintainsufficientliquidfinancialassetsandhaveanadequateamountofcommittedcreditfacilities.
The table below summarises the maturity profile of the Group’s and the Company’s financial assets and liabilities at the end of the reporting period based on contractual undiscounted repayment obligations.

129
Notes to the Financial Statements 31 December 2011(In Singapore dollars)
40. Financial risk management objectives and policies (continued)
(b) Liquidity risk (continued)
2011 20101 year
or less1 to 5years
Over5 years Total
1 yearor less
1 to 5years Total
$’000 $’000 $’000 $’000 $’000 $’000 $’000
Group
Financial assets:Trade and other receivables 93,056 – – 93,056 110,608 – 110,608Investment securities 719 6,471 3,396 10,586 381 – 381Cash and deposits 74,872 – – 74,872 68,046 – 68,046Advances to associates – 3,019 – 3,019 – 3,009 3,009
Total undiscounted financial assets 168,647 9,490 3,396 181,533 179,035 3,009 182,044
Financial liabilities:Trade and other payables 135,175 1,084 – 136,259 114,287 1,075 115,362Borrowings 76,427 23,431 2,277 102,135 65,819 60,327 126,146Exchangeablebond – 10,000 – 10,000 10,000 – 10,000
Total undiscounted financial liabilities 211,602 34,515 2,277 248,394 190,106 61,402 251,508
Total net undiscounted financial(liabilities)/assets (42,955) (25,025) 1,119 (66,861) (11,071) (58,393) (69,464)

130
Notes to the Financial Statements 31 December 2011(In Singapore dollars)
40. Financial risk management objectives and policies (continued)
(b) Liquidity risk (continued)
2011 20101 year
or less1 to 5years
Over5 years Total
1 yearor less
1 to 5years Total
$’000 $’000 $’000 $’000 $’000 $’000 $’000
Company
Financial assets:Investment securities 215 4,466 3,396 8,077 – – – Otherreceivables 40,611 – – 40,611 41,801 – 41,801Cash and deposits 25,735 – – 25,735 21,436 – 21,436Advances to subsidiaries – 123,210 – 123,210 – 111,631 111,631
Total undiscounted financial assets 66,561 127,676 3,396 197,633 63,237 111,631 174,868
Financial liabilities:Trade and other payables 6,743 – – 6,743 7,181 – 7,181Borrowings 7,872 – – 7,872 10,078 7,517 17,595Exchangeablebond – 10,000 – 10,000 10,000 – 10,000
Total undiscounted financial liabilities 14,615 10,000 – 24,615 27,259 7,517 34,776
Total net undiscounted financial assets 51,946 117,676 3,396 173,018 35,978 104,114 140,092
ThetablebelowshowsthecontractualexpirybymaturityoftheCompany’scontingentliabilities.Themaximumamount of the financial guarantee contracts are allocated to the earliest period in which the guarantee could be called.
Company
Financialguarantees 63,486 – – 63,486 62,289 – 62,289

131
Notes to the Financial Statements 31 December 2011(In Singapore dollars)
40. Financial risk management objectives and policies (continued)
(c) Interest rate risk
InterestrateriskistheriskthatthefairvalueorfuturecashflowsoftheGroup’sandtheCompany’sfinancialinstrumentswillfluctuatebecauseofchangesinmarketinterestrates.TheGroup’sandtheCompany’sexposuretointerestrateriskarisesprimarilyfromtheirloansandborrowings.
TheGroup’spolicyistomanageinterestcostusingamixoffixedandfloatingratedebts.
Sensitivity analysis for interest rate risk
The following table demonstrates the sensitivity to a reasonably possible change in the interest rates, with allothervariablesheldconstant,oftheGroup’sprofitaftertaxation.
Increase/decrease in
Effect on profit after taxation
Loans denominated in basis points 2011 2010 $’000 $’000
Australian Dollar + 50 (235) (301)Australian Dollar – 50 235 301
(d) Foreign currency risk
TheGrouphastransactionalcurrencyexposuresarisingfromsalesorpurchasesthataredenominatedinacurrency other than the respective functional currencies of Group entities, primarily Singapore Dollar (SGD), MalaysianRinggit(Ringgit),PhilippinePeso(Peso),AustralianDollar(AUD)andUnitedStatesDollar(USD).The foreign currencies in which these transactions are denominated are mainly AUD. As at the end of the reportingperiod,theGroup’snetexposuretoAUD(mainlyrelatingtoreceivables,payablesandcashandcashequivalents)amountedto$116,495,000(2010:$112,277,000).
TheGroupisalsoexposedtocurrencytranslationriskarisingfromitsnetinvestmentsinforeignoperations,including Malaysia, the Philippines and Australia. The Group’s net investments in Malaysia, the Philippines andAustraliaarenothedgedascurrencypositionsinRinggit,AUDandPesoareconsideredtobelong-term in nature.
Sensitivity analysis for foreign currency risk
Thefollowingtabledemonstratesthesensitivity toareasonablypossiblechange intheAUDexchangerates(againstSGD),withallothervariablesheldconstant,oftheGroup’sprofitaftertaxationandequity.
2011 2010Profit after
taxation EquityProfit after
taxation Equity$’000 $’000 $’000 $’000
AUD – strengthened 1% (2010: 1%) 213 927 252 959 –weakened1%(2010:1%) (213) (927) (252) (959)
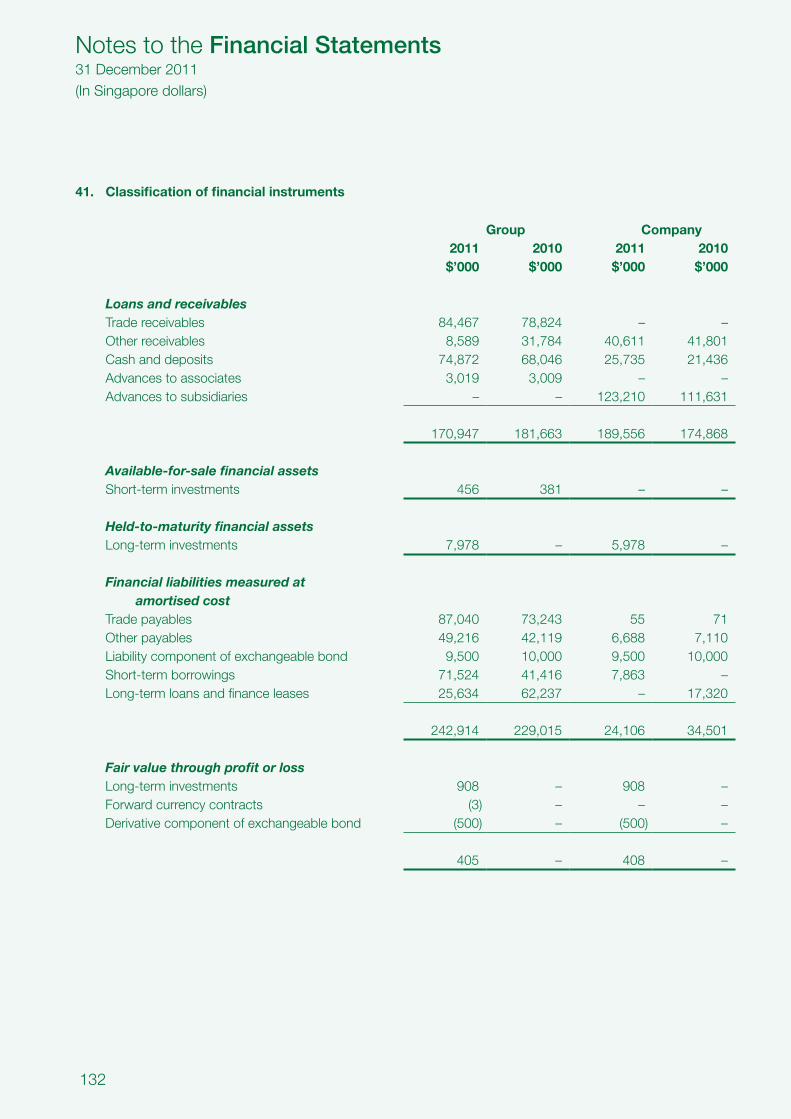
132
Notes to the Financial Statements 31 December 2011(In Singapore dollars)
41. Classification of financial instruments
Group Company2011 2010 2011 2010
$’000 $’000 $’000 $’000
Loans and receivablesTrade receivables 84,467 78,824 – – Otherreceivables 8,589 31,784 40,611 41,801Cash and deposits 74,872 68,046 25,735 21,436Advances to associates 3,019 3,009 – – Advances to subsidiaries – – 123,210 111,631
170,947 181,663 189,556 174,868
Available-for-sale financial assetsShort-term investments 456 381 – –
Held-to-maturity financial assetsLong-term investments 7,978 – 5,978 –
Financial liabilities measured at amortised cost
Trade payables 87,040 73,243 55 71Otherpayables 49,216 42,119 6,688 7,110Liabilitycomponentofexchangeablebond 9,500 10,000 9,500 10,000Short-term borrowings 71,524 41,416 7,863 – Long-term loans and finance leases 25,634 62,237 – 17,320
242,914 229,015 24,106 34,501
Fair value through profit or lossLong-term investments 908 – 908 – Forwardcurrencycontracts (3) – – – Derivativecomponentofexchangeablebond (500) – (500) –
405 – 408 –

133
Notes to the Financial Statements 31 December 2011(In Singapore dollars)
42. Fair value of financial instruments
A. Fair value of financial instruments that are carried at fair value
The following table shows an analysis of financial instruments carried at fair value by level of fair value hierarchy:
Note
Quotedprices in
activemarkets
for identicalinstruments
(Level 1)
Significant other
observable inputs
(Level 2)
Significantunobservable
inputs(Level 3)
$’000 $’000 $’000
Group
2011Financial assetsLong-term investments 23 – 908 –
Financial liabilitiesDerivativecomponentofexchangeablebond 28 – – 500
Forwardcurrencycontracts 27(b) – 3 –
Fair value hierarchy
The Group classify fair value measurement using a fair value hierarchy that reflects the significance of the inputsusedinmakingthemeasurements.Thefairvaluehierarchyhavethefollowinglevels:
• Level1 – Quotedprices(unadjusted)inactivemarketsforidenticalassetsorliabilities
• Level2 – InputsotherthanquotedpricesincludedwithinLevel1thatareobservablefortheasset or liability, either directly (i.e., as prices) or indirectly (i.e., derived from prices), and
• Level3 – Inputs for the asset or liability that are not based on observable market data(unobservable inputs)
Determination of fair value
Fairvalueofforwardcurrencycontractsisdeterminedbyreferencetocurrentforwardexchangeratesforcontracts with similar maturity profiles.

134
Notes to the Financial Statements 31 December 2011(In Singapore dollars)
42. Fair value of financial instruments (continued)
A. Fair value of financial instruments that are carried at fair value (continued)
Movement in level 3 financial instruments measured at fair value
The following table presents the reconciliation for all financial instruments measured at fair value based on significant unobservable inputs (level 3).
Group andCompanyDerivative
component ofexchangeable
bond$’000
At 1 January 2011 – Total loss in profit or loss – Recognisedduringtheyear 500
500
Impactofchangestokeyassumptionsonfairvalueoflevel3financialinstruments
Thefairvalueofthederivativecomponentofexchangeablebondhadbeendeterminedusingadiscountedcash flow model where assumptions are made to the estimated initial public offer date of Hamsdale InternationalPteLtdanddiscountratethatarenotsupportedbyobservablemarketdata.TheGrouphasassessed the impact of possible alternative assumptions on the fair value as insignificant.
B. Fair value of financial instruments by classes that are not carried at fair value and whose carrying amounts are reasonable approximation of fair value
Management has determined that the carrying amounts of cash and short term deposits, current trade andotherreceivables,currenttradeandotherpayables,currentbankloans,non-currentfloatingrateloansandnon-currentfinanceleasesbasedontheirnotionalamounts,reasonablyapproximatetheirfairvaluesbecausethesearemostlyshortterminnatureorarerepricedfrequently.
Unquotedinvestmentsstatedatcosthavenomarketpricesandthefairvaluecannotbereliablymeasuredusingvaluationtechniques.

135
Notes to the Financial Statements 31 December 2011(In Singapore dollars)
42. Fair value of financial instruments (continued)
C. Fair value of financial instruments by classes that are not carried at fair value and whose carrying amounts are not reasonable approximation of fair value
The fair value of financial assets and liabilities by classes that are not carried at fair value and whose carryingamountsarenotreasonableapproximationoffairvalueareasfollows:
2011 2010$’000 $’000
Carryingamount
Fair value
Carryingamount
Fair value
Group
Financial liabilities:Liabilitycomponentofexchangeablebond 9,500 9,618 10,000 10,000
Determination of fair value
The fairvaluesasdisclosedaboveareestimatedbydiscountingexpected futurecashflowsatmarketincremental lending rate for similar types of lending, borrowing or leasing arrangements at the end of the reporting period.
Theadvancestoassociatesandloanfromnon-controllinginteresthavenofixedtermsofrepaymentandarenotexpectedtoberepaidwithinthenexttwelvemonths.Accordingly,thefairvalueisnotdeterminableas the timing of the future cash flows cannot be estimated reliably.
43. Financial risk management strategies relating to livestock
TheGroupisexposedtofinancialrisksarisingfromthechangeincostandsupplyoffeedingredientsandthesellingpriceofporkandrelatedproducts,allofwhicharedeterminedbyconstantlychangingmarketforcesofsupply and demand, and other factors. The other factors include environmental regulations, weather conditions andlivestockdiseases.TheGrouphaslittleornocontrolovertheseconditionsandfactors.
TheGroupissubjecttorisksaffectingthefoodindustrygenerally,includingrisksposedbyfoodspoilageandcontamination. Specifically, the fresh meat industry is regulated by numerous environmental, health and food safety organisations and regulatory sanctions. The Group has put into place systems to monitor food safety risksthroughoutallstagesofmanufacturingandprocessingtomitigatetheserisks.DespitetheprecautionstakenbytheGroup,theauthoritiesmayimposeadditionalregulatoryrequirementsthatmayrequiresignificantcapital investment at short notice.

136
Notes to the Financial Statements 31 December 2011(In Singapore dollars)
43. Financial risk management strategies relating to livestock (continued)
TheGroupissubjecttorisksrelatingtoitsabilitytomaintainanimalhealthstatus.Livestockhealthproblemscouldadverselyaffectproductionandconsumerconfidence.TheGroupmonitorsthehealthofitslivestockondailybasisandhaveproceduresinplacetoreducepotentialexposuretoinfectiousdiseases.Althoughpoliciesand procedures have been put into place, there is no guarantee that the Group will not be affected by disease epidemics.
Thelivestockindustryisexposedtorisksassociatedwiththesupplyandpriceofrawmaterials,mainlygrainprices. Grain prices fluctuate depending on the harvest results. The shortage in the supply of grain will result in adverse fluctuation in the price of grain and will ultimately increase the Group’s production cost. If necessary, the Group will enter into forward contracts to secure the supply of grain at reasonable price. Details of such commitments are disclosed in Note 37(ii).
44. Segmental reporting
Formanagementpurposes,theGroupiscurrentlyorganisedintobusinessunitsbasedontheirproductsandservices, and has four reportable segments as follows:
(i) Bakery – Manufactureanddistributionofbread,confectioneryandbakeryproducts
(ii) Primary production – Production,processingandmarketingofmeat; feedmillingandsaleofanimal feeds and related ingredients
(iii) Trading and logistics – Trading and distribution of food and beverage products and provision for warehousing logistics for food items
(iv) Investments and others – Investment holding and other activities
Except as indicated above, no operating segments have been aggregated to form the above reportableoperating segments.
Managementmonitorstheoperatingresultsofitsbusinessunitsseparatelyforthepurposeofmakingdecisionsabout resource allocation and performance assessment. Segment performance is evaluated based on operating profitorlosswhichincertainrespects,asexplainedinthetablebelow,ismeasureddifferentlyfromoperatingprofit or loss in the consolidated financial statements. Group financing (including finance costs) and income taxesaremanagedonagroupbasisandarenotallocatedtooperatingsegments.
Transfer prices between operating segments are on an arm’s length basis in a manner similar to transactions with third parties.

137
Notes to the Financial Statements 31 December 2011(In Singapore dollars)
44. Segmental reporting (continued)
BakeryPrimary
productionTrading and
logisticsInvestments
and others Eliminations Consolidated$’000 $’000 $’000 $’000 $’000 $’000
2011
Revenue and expensesRevenuefromexternal
customers 470,346 399,852 89,314 4,675 – 964,187Otherrevenuefrom
externalcustomers 2,783 5,124 819 1,786 – 10,512Inter-segment revenue 14 627 62 23,999 (24,702) –
473,143 405,603 90,195 30,460 (24,702) 974,699Unallocated revenue 2,282Total revenue 976,981
Segment results 60,029 9,830 3,134 22,612 – 95,605Unallocated revenue 2,282Unallocatedexpenses (9,550)Profit from operating
activities 88,337Financecosts (6,725)Share of profits of
associates 42 – – – – 42Profitbeforetaxation 81,654Taxation (15,746)
Profitaftertaxation 65,908

138
Notes to the Financial Statements 31 December 2011(In Singapore dollars)
44. Segmental reporting (continued)
BakeryPrimary
productionTrading and
logisticsInvestments
and others Eliminations Consolidated$’000 $’000 $’000 $’000 $’000 $’000
2010
Revenue and expensesRevenuefromexternal
customers 428,444 328,007 84,119 3,571 – 844,141Otherrevenuefrom
externalcustomers 2,655 7,731 62 84 – 10,532Inter-segment revenue – 980 55 21,199 (22,234) –
431,099 336,718 84,236 24,854 (22,234) 854,673Unallocated revenue 1,737Total revenue 856,410
Segment results 66,791 9,000 3,771 6,216 – 85,778Unallocated revenue 1,737Unallocatedexpenses (7,957)Profit from operating
activities 79,558Financecosts (6,808)Shareofprofits/(losses)
of associates 33 – – (1,844) – (1,811)Profitbeforetaxation 70,939Taxation (14,092)
Profitaftertaxation 56,847

139
Notes to the Financial Statements 31 December 2011(In Singapore dollars)
44. Segmental reporting (continued)
BakeryPrimary
productionTrading and
logisticsInvestments
and others Consolidated$’000 $’000 $’000 $’000 $’000
2011
Assets and liabilitiesSegment assets 276,071 276,621 60,734 51,465 664,891Associates 4,961 – – – 4,961Total assets 281,032 276,621 60,734 51,465 669,852
Deferredtaxassets 17,769Taxrecoverable 384
Total assets per consolidated statement of financial position 688,005
Segment liabilities 80,094 59,834 12,831 2,455 155,214Provisionfortaxation 4,057Deferredtaxliabilities 11,944Exchangeablebond 10,000Bankborrowings 94,618
Total liabilities per consolidated statement of financial position 275,833
Other segment informationExpenditurefornon-currentassets 61,476 12,749 1,892 2,946 79,063Amortisation and depreciation 22,295 10,433 1,527 536 34,791Allowance for inventory obsolescence
(writtenback)/charged (77) – 10 – (67)Allowance for doubtful debts (written
back)/chargedandbaddebts(writtenback)/writtenoff 165 40 73 (21,558) (21,280)

140
Notes to the Financial Statements 31 December 2011(In Singapore dollars)
44. Segmental reporting (continued)
BakeryPrimary
productionTrading and
logisticsInvestments
and others Consolidated$’000 $’000 $’000 $’000 $’000
2010
Assets and liabilitiesSegment assets 244,262 265,341 54,652 38,961 603,216Associates 4,905 – – – 4,905Total assets 249,167 265,341 54,652 38,961 608,121
Deferredtaxassets 17,749Taxrecoverable 135
Total assets per consolidated statement of financial position 626,005
Segment liabilities 63,244 54,083 9,608 2,874 129,809Provisionfortaxation 6,179Deferredtaxliabilities 10,674Exchangeablebond 10,000Bankborrowings 102,526
Total liabilities per consolidated statement of financial position 259,188
Other segment informationExpenditurefornon-currentassets 16,498 12,097 1,941 11,329 41,865Amortisation and depreciation 19,125 9,742 1,811 461 31,139Impairment loss – – – 691 691Allowance for inventory obsolescence
charged/(writtenback) 48 (162) 173 – 59Allowance for doubtful debts (written
back)/chargedanddebtswrittenoff 470 (41) 132 (6,310) (5,749)

141
Notes to the Financial Statements 31 December 2011(In Singapore dollars)
44. Segmental reporting (continued)
Geographical information
Revenue Non-current assets2011 2010 2011 2010
$’000 $’000 $’000 $’000
Singapore 166,639 165,609 31,375 28,362Malaysia 294,082 268,712 119,252 84,006Australia 407,778 326,287 157,819 145,800Philippines 101,999 87,150 25,079 25,705Othercountries 6,483 8,652 – –
976,981 856,410 333,525 283,873
Non-currentassetsinformationpresentedaboveconsistofproperty,plantandequipment,investmentpropertiesand intangible assets as presented in the consolidated statement of financial position.
45. Subsidiaries and associates
(a) The subsidiaries as at 31 December 2011 are:-
Name of company(Country of incorporation)
Principal activities(place of business)
Percentage of equity held by the
Group2011 2010
% %
Bakery
(1) GardeniaFoods(S)PteLtd(Singapore)
Bread manufacturer(Singapore)
100 100
(2) GardeniaBakeries(KL)SdnBhd(Malaysia)
Bread manufacturer(Malaysia)
70 70
(2) Gardenia Sales & Distribution Sdn Bhd (Malaysia)
Marketinganddistributionofbakeryproducts(Malaysia)
70 70
(1) FarmlandCentralBakery(S)PteLtd(Singapore)
Purchasing agent of bread, confectionery andbakeryproducts(Singapore)
100 100

142
Notes to the Financial Statements 31 December 2011(In Singapore dollars)
45. Subsidiaries and associates (continued)
Name of company(Country of incorporation)
Principal activities(place of business)
Percentage of equity held by the
Group2011 2010
% %
Bakery (continued)
(2) Millif Industries Sdn Bhd (Malaysia)
Manufactureofkayaandrelatedproducts(Malaysia)
65 65
(4) GardeniaBakeries(Philippines)Inc(Philippines)
Manufacture and distribution of bread, confectioneryandbakeryproducts(Philippines)
100 100
(2) Delicia Sdn Bhd (Malaysia)
Manufacture of bread, confectionery and bakeryproducts(Malaysia)
100 100
(3) BakersMaisonAustraliaPtyLtd(Australia)
Manufactureofconfectioneryandbakeryproducts(Australia)
100 100
(2) BakersMaison(M)SdnBhd(Malaysia)
Manufacture of bread confectionery and bakeryproducts(Malaysia)
100 100
Primary production
@ QAFFeedsPtyLtd(Australia)
Manufacturingofstockfeedandsalesand distribution of animal feed products(Australia)
– 100
(3) Rivalea(Australia)PtyLtd(Australia) Intensive pig production and wholesaling(Australia)
100 100
@ BrooksbankPropertiesPtyLtd(Australia)
Intensive pig production and wholesaling(Australia)
– 100
(3) DiamondValleyPorkPtyLtd(Australia)
Pig meat processing and wholesale(Australia)
80 80

143
Notes to the Financial Statements 31 December 2011(In Singapore dollars)
45. Subsidiaries and associates (continued)
Name of company(Country of incorporation)
Principal activities(place of business)
Percentage of equity held by the
Group2011 2010
% %
Trading and logistics
(1) BenFoods(S)PteLtd(Singapore)
Trading and distribution of food and beverage products(Singapore)
100 100
(2) BenFoods(EastMalaysia)SdnBhd(Malaysia)
Operationofsupermarkets (Malaysia)
100 100
(1) Shinefoods Pte Ltd (Singapore)
Agency and distribution of food and beverage products(Singapore)
100 100
(1) NCS Cold Stores (S) Pte Ltd (Singapore)
Operationofwarehousinglogistics(Singapore)
100 100
(1) QAFFruitsColdStorePteLtd(Singapore)
Operationofcoldstoragewarehouse(Singapore)
62 62
Investments and others
(3) OxdaleDairyEnterprisePtyLtd(Australia)
Milkproduction(Australia)
100 100
(1) QAFAgencies(S)PteLtd(Singapore)
Share trading and investment holding(Singapore)
100 100
(1) Gardenia (China) Holdings Pte. Ltd. (Singapore)
Investment holding(Singapore)
100 100
(1) OxdaleInternationalPteLtd(Singapore)
Investment holding(Singapore)
100 100
(1) Gardenia International (S) Pte Ltd(Singapore)
Investment holding(Singapore)
100 100

144
Notes to the Financial Statements 31 December 2011(In Singapore dollars)
45. Subsidiaries and associates (continued)
Name of company(Country of incorporation)
Principal activities(place of business)
Percentage of equity held by the
Group2011 2010
% %
Investments and others (continued)
(1) Hamsdale International Pte Ltd (Singapore)
Investment holding(Singapore)
100 100
(3) Hamsdale Australia Pty Ltd (Australia)
Investment holding(Australia)
100 100
@ CamelliaBakeries(S)PteLtd(Singapore)
Investment holding(Singapore)
– 100
(1) EdencInternationalPteLtd(Singapore)
Investment holding(Singapore)
100 100
(1) Gardenia Investments Pte Ltd (Singapore)
Investment holding(Singapore)
100 100
(1) OxdaleInvestmentsPteLtd(Singapore)
Investment holding(Singapore)
100 100
(1) W.A.OxdaleHoldingsPteLtd(Singapore)
Investment holding(Singapore)
100 100
(3) BakersMaisonPtyLtd(Australia)
Investment holding(Australia)
100 100
@ Dongjia Investments Pte Ltd (Singapore)
Investment holding(Singapore)
– 100
(1) EdencPteLtd(Singapore)
Investment holding(Singapore)
100 100
(1) Pacfi Pte Ltd (Singapore)
Investment holding(Singapore)
100 100
(1) BakersMaisonPteLtd(Singapore)
Investment holding(Singapore)
100 100

145
Notes to the Financial Statements 31 December 2011(In Singapore dollars)
45. Subsidiaries and associates (continued)
Name of company(Country of incorporation)
Principal activities(place of business)
Percentage of equity held by the
Group2011 2010
% %
Dormant corporations
* AuspeakHoldingsPteLtd(Singapore)
Dormant 100 100
* Gardenia Hong Kong Limited (Hong Kong)
Dormant 100 100
(2) EverydayBakeryandConfectionerySdn Bhd (Malaysia)
Dormant 70 70
(1) BonjourBakeryPteLtd(Singapore)
Dormant 100 100
@ BonjourBakerySdnBhd(Malaysia)
Dormant – 100
@ SummitRainbowSdnBhd(Malaysia)
Dormant – 100
(1) Lansdale Holdings Pte Ltd(Singapore)
Dormant 100 100
(1) Gaoyuan Pte Ltd(Singapore)
Dormant 100 100
@ Ben Trading (Malaysia) Sdn Bhd(Malaysia)
Dormant – 100
@ QAFManagementServices(S) Pte Ltd (Singapore)
Dormant – 100
(1) HengxingFruitJuice(Singapore)Pte Ltd(Singapore)
Dormant 100 100
^ Singfood Investment Pte Ltd (Singapore)
Dormant 100 100

146
Notes to the Financial Statements 31 December 2011(In Singapore dollars)
45. Subsidiaries and associates (continued)
(b) The associates as at 31 December 2011 are:
Name of company(Country of incorporation)
Principal activities(place of business)
Percentage of equity held by the
Group2011 2010
% %
(4) PhilfoodsFresh-BakedProductsInc(Philippines)
Bread manufacturer(Philippines)
40 40
(4) PhilFoodsPropertiesInc(Philippines)
Investment holding(Philippines)
40 40
# ShaanxiHengxingFruitJuiceCoLtd(People’sRepublicofChina)
Manufacture and distribution of apple juice concentrate(People’sRepublicofChina)
– 46.5
Note
* Auditnotrequiredunderthelawsinthecountryofincorporation
@ De-registered/struckofforvoluntarywound-upduringtheyear
# Disposedduringtheyear
^ Inprocessofbeingstruckoff
Audited by:
(1) Ernst&YoungLLP,Singapore
(2) Ernst&Young,Malaysia
(3) Ernst&Young,Australia
(4) Sycip Gorres Velayo & Co, Philippines

147
Notes to the Financial Statements 31 December 2011(In Singapore dollars)
46. Capital management
The Group’s objectives when managing capital are to safeguard the Group’s ability to continue as a going concernandtomaintainanoptimalcapitalstructuresoastomaximiseshareholdervalue.Inordertomaintainor achieve an optimal capital structure, the Group may adjust the amount of dividend payment, return capital toshareholders, issuenewshares,buyback issuedshares,obtainnewborrowingsorsellassetstoreduceborrowings.
Managementmonitorscapitalbasedonagearingornetdebt-to-equityratio.Thenetdebt-to-equityratio iscalculatedasnetdebtdividedbyshareholders’funds.Netdebtiscalculatedasbankborrowings,financeleasesand liabilitycomponentofexchangeablebond lesscashanddeposits.Shareholders’ fund relates toequityattributable to owners of the parent. The Group’s strategy, which was unchanged from 2010, is also to maintain gearingratiosonnetdebt-to-equityratioofnotexceeding1.5times.
Group2011 2010
$’000 $’000
Net debt 31,786 45,607
Shareholders’ funds 388,184 340,340
Netdebt-to-equityratio 0.1 times 0.1 times
TheGroupandtheCompanyarealsorequiredbycertainbankstomaintaincertaingrossdebt-to-equityratios,operating cash flow to earnings ratios, and shareholders’ funds.
TheGroup is incompliancewithallexternally imposedcapital requirements for thefinancial yearended31December 2011.
47. Authorisation of financial statements for issue
The financial statements for the year ended 31 December 2011 were authorised for issue in accordance with a resolution of the directors on 16 March 2012.
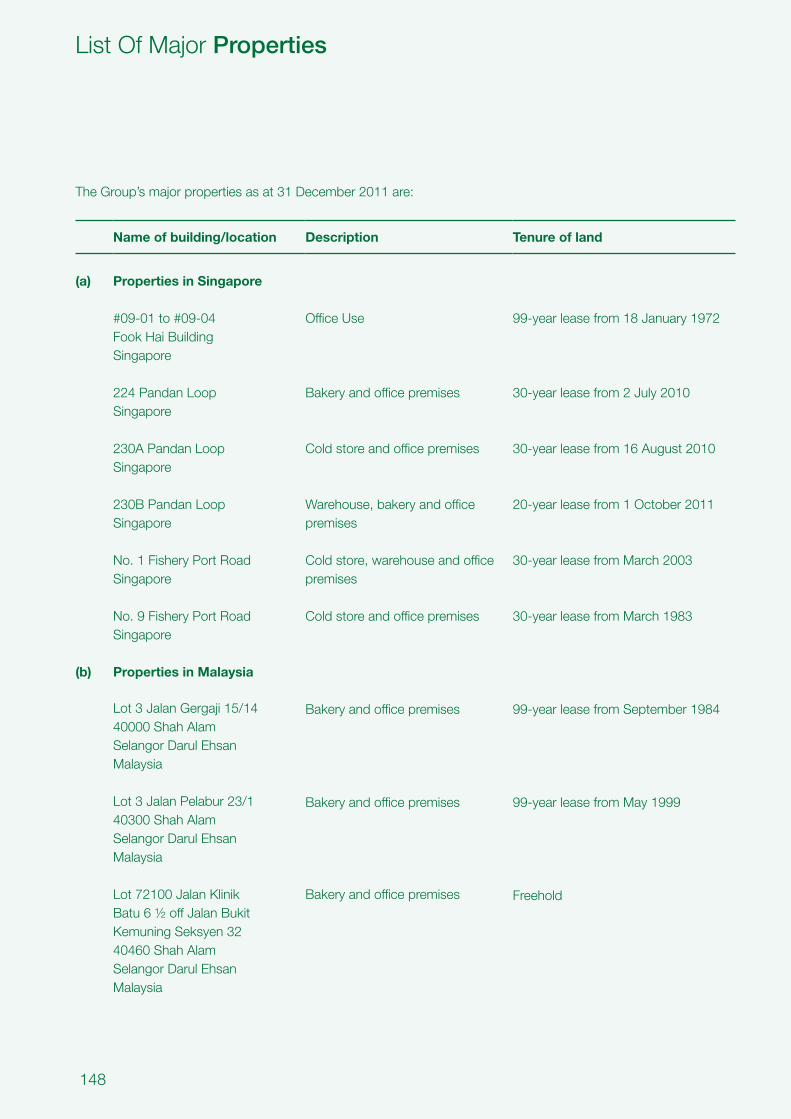
148
ListOfMajorProperties
The Group’s major properties as at 31 December 2011 are:
Name of building/location Description Tenure of land
(a) Properties in Singapore
(b)
#09-01to#09-04FookHaiBuildingSingapore
224 Pandan LoopSingapore
230A Pandan LoopSingapore
230B Pandan LoopSingapore
No.1FisheryPortRoadSingapore
No.9FisheryPortRoadSingapore
Properties in Malaysia
Lot3JalanGergaji15/1440000 Shah Alam SelangorDarulEhsanMalaysia
Lot3JalanPelabur23/140300 Shah AlamSelangorDarulEhsanMalaysia
Lot72100JalanKlinikBatu6½offJalanBukitKemuningSeksyen3240460 Shah AlamSelangorDarulEhsanMalaysia
OfficeUse
Bakeryandofficepremises
Cold store and office premises
Warehouse,bakeryandofficepremises
Cold store, warehouse and office premises
Cold store and office premises
Bakeryandofficepremises
Bakeryandofficepremises
Bakeryandofficepremises
99-year lease from 18 January 1972
30-year lease from 2 July 2010
30-year lease from 16 August 2010
20-yearleasefrom1October2011
30-year lease from March 2003
30-year lease from March 1983
99-year lease from September 1984
99-year lease from May 1999
Freehold

149
ListOfMajorProperties
The Group’s major properties as at 31 December 2011 are:
Name of building/location Description Tenure of land
(b) Properties in Malaysia (continued)
Lot2&4JalanTPP6/12Taman PerindustrianPuchongSeksyen647100 Petaling JayaMalaysia
Bakeryandofficepremises 99-yearleasefromOctober1997
No.35PersiaranSabakBernamSeksyen2640400 Shah AlamSelangorDarulEhsanMalaysia
Bakeryandofficepremises Freehold
(c) Properties in Australia
Seville PiggeryBeenakRoadSeville, Victoria 3139
Farmingrelateduse Freehold
HuntlyFarmNo.1and2Bendigo-TennysonRoadHuntly, Victoria 3351
PiggeryFarming Freehold
St. Arnaud Unit 1Sunraysia HighwaySt. Arnaud, Victoria 3478
PiggeryFarming Freehold
St Arnaud Units 2 & 3NelsonRoadSt Arnaud, Victoria 3478
PiggeryFarming Freehold
Corowa PiggeryHudsonsRoad,CorowaNew South Wales 2646
PiggeryFarming Freehold
Bungowannah PiggeryHowlongRoadBungowannahNew South Wales
PiggeryFarming Freehold

150
The Group’s major properties as at 31 December 2011 are:
Name of building/location Description Tenure of land
(c) Properties in Australia (continued)
Corowa MillAlburyRoad,CorowaNew South Wales 2646
Feedmilling Freehold
Balpool 1 & 2 PiggeryBalpool StationBalpool Lane, MoulameinNew South Wales 2733
PiggeryFarming Freehold
Bagshot Piggery429ClaysRoadBagshot, Victoria 3551
PiggeryFarming Freehold
Whitehead StreetCorowa, NSW 2646
Farmingrelateduse Freehold
DiamondValleyPork13-15 Thomas StreetLaverton, North Victoria
Abattoir Freehold
OxdaleDairyNo.1RMB2048ParnellRoadCobram, Victoria 3644
DairyFarming Freehold
OxdaleDairyNo.2Murray Valley HighwayCobram, Victoria 3644
DairyFarming Freehold
OxdaleDairyLots 11, 13 and 32Johnson StreetCorowa, NSW 2646
Grain Storage Freehold
OxdaleMill72 Whitehead StreetCorowa, New South Wales
Feedmill Freehold
96to98MilperraRoadMilperra, New South Wales
Bakeryandofficepremises Freehold
ListOfMajorProperties

151
Statistics of ShareholdingsAs at 16 March 2012
IssuedandFullypaid-upCapital : $227,483,834ClassofShares : OrdinaryShares
Analysis of Shareholders by Size of Shareholdings
Size of ShareholdingsNo. of
Shareholders %No. of
Shares %
1 - 999 437 9.58 105,340 0.02
1,000 - 10,000 3,061 67.11 12,013,797 2.31
10,001 - 1,000,000 1,035 22.69 54,793,411 10.56
1,000,001 and above 28 0.62 452,130,086 87.11
4,561 100.00 519,042,634 100.00
List of Twenty Largest Shareholders
S/No. Name of ShareholderNo. of
Shares %
1. TianWanEnterprisesCompanyLimited 112,177,124 21.61
2. TianWanEquitiesCompanyLimited 95,411,385 18.38
3. Tian Wan Holdings Group Limited 95,411,384 18.38
4. HSBC (Singapore) Nominees Pte Ltd 47,059,933 9.07
5. J&H International Limited 19,837,393 3.82
6. Goi Seng Hui 11,390,818 2.19
7. CitibankNomineesSingaporePteLtd 9,466,833 1.82
8. HLBankNominees(Singapore)PteLtd 6,403,694 1.23
9. CIMB Nominees (Singapore) Pte Ltd 6,046,833 1.16
10. DBS Nominees Pte Ltd 6,034,001 1.16
11. BankofSingaporeNomineesPteLtd 5,967,392 1.15
12. UnitedOverseasBankNominees(Private)Limited 5,621,601 1.08
13. ABN Amro Nominees Singapore Pte Ltd 4,627,735 0.89
14. Lai Choy Kuen 3,652,732 0.70
15. OCBCSecuritiesPrivateLimited 2,810,676 0.54
16. Tan Kong King 2,661,136 0.51
17. OCBCNomineesSingaporePrivateLimited 2,529,220 0.49
18. LeeFookKhuen 2,219,525 0.43
19. DBSVickersSecurities(Singapore)PteLtd 2,077,072 0.40
20. Mayban Nominees (Singapore) Pte Ltd 1,500,000 0.29
442,906,487 85.30

152
Statistics of ShareholdingsAs at 16 March 2012
Substantial Shareholders
Direct Interest Deemed Interest Total Interest
Name of Substantial Shareholder No. of Shares % No. of Shares % No. of Shares %
Andree Halim – – 322,837,286 (1) 62.20 322,837,286 62.20
Lin Kejian – – 207,588,509 (2) 39.99 207,588,509 39.99
TianWanEnterprisesCompanyLimited 112,177,124 21.61 – – 112,177,124 21.61
TianWanEquitiesCompanyLimited 95,411,385 18.38 – – 95,411,385 18.38
Tian Wan Holdings Group Limited 95,411,384 18.38 – – 95,411,384 18.38
Denonshire Group Limited 45,820,712 8.83 – – 45,820,712 8.83
Didi Dawis – – 45,820,712 (3) 8.83 45,820,712 8.83
SaimanErnawan – – 45,820,712 (3) 8.83 45,820,712 8.83
Notes:
(1) Mr Andree Halim is deemed to have an interest in the shares beneficially owned by Tian Wan Enterprises Company Limited, Tian Wan Equities Company Limited, Tian Wan Holdings Group Limited and J&H International Limited pursuant to Section 7 of the Companies Act, Cap. 50.
(2) Mr Lin Kejian is deemed to have an interest in the shares beneficially owned by Tian Wan Enterprises Company Limited and Tian Wan Equities Company Limited pursuant to Section 7 of the Companies Act, Cap. 50.
(3) Mr Didi Dawis and Mr Saiman Ernawan are deemed to have an interest in the shares beneficially owned by Denonshire Group Limited pursuant to Section 7 of the Companies Act, Cap. 50.

153
Notice of Annual General Meeting
NOTICE IS HEREBY GIVEN that the Annual General Meeting of the Company will be held at No. 224 Pandan Loop, Singapore 128411 on 26 April 2012 at 10.30 a.m. to transact the following business:-
ORDINARY BUSINESS
1. To receive and adopt the audited financial statements and the reports of the Directors and Auditors for the year ended 31 December 2011. (Resolution 1)
2. Toapproveafinaltax-exempt(one-tier)dividendof4centspershareinrespectoftheyearended 31 December 2011. (Resolution 2)
3. To re-elect the following Directors:
(a) Mr Andree Halim (retiring under Article 104 of the Articles of Association) (Resolution 3a)
(b) Mr Tan Hin Huat (retiring under Article 104 of the Articles of Association) (Resolution 3b)
(c) Ms Tarn Teh Chuen (retiring under Article 104 of the Articles of Association) (Resolution 3c)
4. To approve Directors’ fees of $145,200 for the year ended 31 December 2011 (2010: $160,050). (Resolution 4)
5. Tore-appointErnst&YoungasAuditorsoftheCompanyandtoauthorizeDirectorstofixtheir remuneration. (Resolution 5)
6. To transact any other ordinary business of the Company which may be properly brought forward. (Resolution 6)
SPECIAL BUSINESS
Toconsiderand,ifthoughtfit,topassthefollowingresolutionsasOrdinaryResolutions,withorwithout any modifications:
7. ThatpursuanttoSection161oftheCompaniesAct,Chapter50andsubjecttoRule806oftheListingManualoftheSingaporeExchangeSecuritiesTradingLimited(the“SGX-ST”), the Directors of the Company be and are hereby authorized and empowered to issue:
(i) shares in the capital of the Company (“shares”); or
(ii) convertible securities; or
(iii) additional convertible securities issued pursuant to adjustments; or
(iv) shares arising from the conversion of the securities in (ii) and (iii) above,
(whether by way of rights, bonus or otherwise or in pursuance of any offer, agreement or option made or granted by the Directors during the continuance of this authority or thereafter) at any time and upon such terms and conditions and for such purposes and to such persons as the Directors may in their absolute discretion deem fit (notwithstanding the authorityconferredbythisResolutionmayhaveceasedtobeinforce),

154
provided that:
1) theaggregatenumberofshares tobe issuedpursuant to thisResolution (includingshares to be issued in pursuance of convertible securities made or granted pursuant to thisResolution)doesnotexceedfiftypercent(50%)ofthetotalnumberofissuedshares(excludingtreasuryshares)inthecapitaloftheCompanyascalculatedinaccordancewith sub-paragraph (2) below (“Issued Shares”), provided that the aggregate number of shares to be issued other than on a pro-rata basis to shareholders of the Company (including shares to be issued in pursuance of convertible securities made or granted pursuanttothisResolution)doesnotexceedtwentypercent(20%)ofthetotalnumberof Issued Shares;
2) (subject to such manner of calculation as may be prescribed by the SGX-ST) for the purpose of determining the aggregate number of shares that may be issued under sub-paragraph (1) above, the percentage of Issued Shares shall be based on the total issuedshares(excludingtreasuryshares)inthecapitaloftheCompanyatthetimethisResolutionispassed,afteradjustingfor:
(i) newsharesarisingfromtheconversionorexerciseofanyconvertiblesecurities;
(ii) (whereapplicable)newsharesarisingfromexercisingshareoptionsorvestingof share awards outstanding or subsisting at the time of the passing of this Resolution,provided theoptionsorawardsweregranted incompliancewithPart VIII of Chapter 8 of the Listing Manual; and
(iii) anysubsequentbonusissue,consolidationorsubdivisionofshares;
3) in exercising theauthority conferredby thisResolution, theCompany shall complywith the rules, guidelines and measures issued by the SGX-ST for the time being in force (unless such compliance has been waived by the SGX-ST) and the Articles of Association for the time being of the Company;
4) (unlessrevokedorvariedbytheCompanyinGeneralMeeting),theauthorityconferredbythisResolutionshallcontinueinforceuntiltheconclusionofthenextAnnualGeneralMeetingoftheCompanyorthedatebywhichthenextAnnualGeneralMeetingoftheCompanyisrequiredbylawtobeheld,whicheverisearlier. (Resolution 7)
8. That the Directors be and are hereby authorized to allot and issue such number of shares as mayberequiredtobeissuedpursuanttotheexerciseofshareoptionsinaccordancewiththetermsandconditionsoftheQAFLimitedShareOptionScheme2000. (Resolution 8)
Notice of Annual General Meeting

155
9. That the Directors of the Company be and are hereby authorized to allot and issue from time to time such number of new ordinary shares (credited as fully paid up to the amount as may be determined and announced by the Directors from time to time) in the Company asmayberequiredtobeallottedandissuedpursuanttothescripdividendschemeoftheCompany,knownasthe“QAFLimitedScripDividendScheme”adoptedattheextraordinarygeneral meeting of the Company held on 28 April 2006 (the “Scrip Dividend Scheme”). (Resolution 9)
ByOrderoftheBoard
LEE WOAN LING (Ms)Company Secretary
Singapore, 11 April 2012
Notice of Annual General Meeting

156
Notice of Annual General Meeting
Explanatory Notes:
i) ForOrdinaryResolutions:
3(a)–Mr Andree Halim is a non-executive Director of the Company and a substantial shareholder holdingapproximately62.20%oftheordinarysharesintheCompany.
3(b)-MrTanHinHuat isanon-executive independentDirectorof theCompany.He is thechairmanof theAuditCommitteeaswellasamemberoftheNominatingCommitteeandRemunerationCommitteeof
the Company.
3(c)-MsTarnTehChuenisanexecutiveDirectoroftheCompany.
FurtherinformationontheaboveDirectorscanbefoundonpages11and12oftheAnnualReport.
ii) OrdinaryResolution7,ifpassed,willempowertheDirectorsfromthedateoftheAnnualGeneralMeetinguntilthedateofthenextAnnualGeneralMeetingoftheCompany,toissuesharesandconvertiblesecuritiesintheCompanyuptoanaggregatenumbernotexceeding50%ofthetotalnumberofissuedsharesinthecapitalofthe Company, of which the aggregate number issued other than on a pro-rata basis to all shareholders of the Companyshallnotexceed20%ofthetotalnumberofissuedsharesinthecapitaloftheCompany.
iii) OrdinaryResolution8authorizestheDirectorstoissuesharespursuanttotheexerciseofoptionsundertheQAFLimitedShareOptionScheme2000whichwasapprovedbythemembersoftheCompanyon12May2000.AuthorityunderResolution8isinadditiontothegeneralauthoritytoissuesharesand/orconvertiblesecuritiessoughtunderResolution7.
iv) OrdinaryResolution9,ifpassed,willauthorizetheDirectorstoissuesharesintheCompanypursuanttotheQAFLimitedScripDividendSchemetomemberswho,inrespectofaqualifyingdividend,electtoreceivescripin lieuofcashamountof thatqualifyingdividend.AuthorityunderResolution9 is inaddition to thegeneralauthoritytoissuesharesand/orconvertiblesecuritiessoughtunderResolution7.
Note:AmemberoftheCompanyentitledtoattendandvoteattheabovemeetingisentitledtoappointoneortwoproxiestoattendandvoteinhis/herstead.SuchproxyneednotbeamemberoftheCompany.Theinstrumentofappointingaproxyorproxies,dulyexecuted,mustbedepositedattheRegisteredOfficeoftheCompanyat150SouthBridgeRoad,#09-04FookHaiBuilding,Singapore058727,atleast48hoursbeforethetimefixedforholdingthemeeting.

157
NoticeofBooksClosure Date
NOTICE IS HEREBY GIVEN that the Transfer Books and Register of Members of the Company will be closed from 5.00 p.m. on 10 May 2012 up to and including 11 May 2012 for the purpose of determining shareholders’ entitlements to a final tax-exempt (one-tier) dividend of 4 cents per share for the financial year ended 31 December 2011 (“Dividend 2011”).
ShareholderswhosesharesoftheCompany(“QAFShares”)aredepositedwithTheCentralDepository(Pte)Limited(“CDP”)andwhosesecuritiesaccountswithCDParecreditedwithQAFSharesasat5.00p.m.on10May2012willbeentitledtotheDividend2011onthebasisoftheQAFSharesstandingtothecreditoftheirsecuritiesaccountswith CDP as at 5.00 p.m. on such date.
Duly completed registrable transfers received by the Company’s Registrar, Tricor Barbinder Share RegistrationServicesat80Robinson,#02-00,Singapore068898upto5.00p.m.on10May2012willberegisteredtodetermineshareholders’ entitlements to the Dividend 2011.
TheQAFLimitedScripDividendSchemeasapprovedbythemembersoftheCompanyon28April2006willapplyto the Dividend 2011 which will provide the entitled members with the option to elect to receive new ordinary shares in the capital of the Company in lieu of the cash amount of the Dividend 2011 declared on shares held by them.
Dividend payment date will be announced upon the despatch of the notices of election to entitled members of the Company.
ByOrderoftheBoard
LEE WOAN LING (Ms)Company Secretary
Singapore, 11 April 2012

158
Thispageisleftblankintentionally

159
ProxyFormAnnual General Meeting of QAF Limited
I/We
of
beingaMember/MembersoftheabovenamedCompany,herebyappoint:
Name Address NRIC/Passport No.Number of Shares to be
represented by proxy
*and/or(deleteasappropriate)
Name Address NRIC/Passport No.Number of Shares to be
represented by proxy
or failinghim/her theChairmanof theMeetingasmy/ourproxy to voteonmy/ourbehalf at theAnnualGeneralMeetingoftheCompanytobeheldon26April2012at10.30a.m.andatanyadjournmentthereof.I/Wedirectmy/ourproxytovote(seeNote3)fororagainsttheResolutionstobeproposedattheMeetingashereunderindicated.
NO. RESOLUTIONS For Against
1. To adopt the audited financial statements and reports thereon.
2. Toapproveafinaltax-exempt(one-tier)dividendof4centspershare.
3. To re-elect Directors:
(a) Mr Andree Halim
(b) Mr Tan Hin Huat
(c) Ms Tarn Teh Chuen
4. To approve Directors’ fees.
5. Tore-appointErnst&YoungasAuditorsoftheCompany.
6. To transact any other ordinary business of the Company.
7. GeneralAuthoritytoissuesharesand/orconvertiblesecurities.
8. AuthoritytoissuesharespursuanttotheShareOptionScheme2000.
9. Authority to issue shares pursuant to the Scrip Dividend Scheme.
Signed this day of 2012 by:
Total Number of Shares in: No. of Shares
a)CDPRegister
b)RegisterofMembersSignature of Member(s) or Common Seal
✃

160
Notes
1. AmemberoftheCompanyentitledtoattendandvoteattheabovemeetingisentitledtoappointoneortwoproxiestoattendandvoteinhis/herstead.AproxyneednotbeamemberoftheCompany.Whereamemberappointstwoproxies,theappointmentsshallbeinvalidunlesshespecifiesthenumberofsharesofhisshareholdingtoberepresentedbyeachproxy.
2. ThisProxyFormmustbesignedbytheappointororhis/herdulyauthorisedattorneyor,iftheappointorisabodycorporate,signedunderits common seal or under the hand of its attorney or a duly authorised officer.
3. Pleaseindicatewithan‘X’intheappropriateboxagainsteachResolutionhowyouwishyourproxytovote.IfthisProxyFormisreturnedwithoutanyindicationastohowtheproxyshallvote,theproxywillvoteorabstainashethinksfit.
4. Thisinstrumentappointingaproxytogetherwiththepowerofattorney(ifany)underwhichitissignedoracertifiedcopythereof,mustbedepositedattheofficeoftheCompanyat150SouthBridgeRoad,#09-04FookHaiBuilding,Singapore058727notlessthan48hoursbeforethetimefixedforholdingtheAnnualGeneralMeeting.
5. Pleaseinsertintheboxatthebottomlefthandcorneronthereverseofthisform,thetotalnumberofSharesheldbyyou.IfyouhaveSharesenteredagainstyournameintheDepositoryRegister(asdefinedinSection130AoftheCompaniesAct,Chapter50ofSingapore),youshouldinsertthatnumberofShares.IfyouhaveSharesregisteredinyournameintheRegisterofMembers,youshouldinsertthatnumberofShares.IfyouhaveSharesenteredagainstyournameintheDepositoryRegisterandSharesregisteredinyournameintheRegisterofMembers,youshouldinserttheaggregatenumberofSharesenteredagainstyournameintheDepositoryRegisterandregisteredinyournameintheRegisterofMembers.Ifnonumberisinserted,theinstrumentappointingaproxyorproxiesshallbedeemedtorelatetoalltheShares held by you.
6. TheCompanyshallbeentitledtorejectthis instrumentofproxy if it is incomplete,notproperlycompletedor illegibleorwherethetrueintentionoftheappointorarenotascertainablefromtheinstructionsoftheappointorspecifiedinthisinstrumentofproxy.Inaddition,incase of members whose Shares are deposited with The Central Depository (Pte) Limited (“CDP”), the Company may reject any instrument ofproxylodgedifsuchmemberisnotshowntohaveSharesenteredagainsthisnameintheDepositoryRegister48hoursbeforethetimefixedforholdingtheAnnualGeneralMeetingascertifiedbyCDPtotheCompany.
--------------------------------------------------------------------- Fold along this line (1) -------------------------------------------------------------------------
Please affix
postage stamp
The Company SecretaryQAF Limited
150SouthBridgeRoad#09-04FookHaiBuilding
Singapore 058727
--------------------------------------------------------------------- Fold along this line (2) -------------------------------------------------------------------------


QAF Limited150 South Bridge Road #09-04 Fook Hai Building Singapore 058727Tel: (65) 6538 2866 Fax: (65) 6538 6866 Email: [email protected] Website: www.qaf.com.sg
Company Registration No. 195800035D