Embed Size (px)
Citation preview

HELPING TO
ELIMINATE POVERTY
THROUGH PRIVATE
INVOLVEMENT IN
INFRASTRUCTURE
TRENDS AND POLICY OPTIONS • INFRASTRUCTURE
Building BridgesChina’s Growing Role as Infrastructure Financier for Africa
No. 5 • PUBLICATION FORTHCOMING
Vivien FosterWilliam ButterfieldChuan ChenNataliya Pushak
TRENDS AND POLICY OPTIONS. NO.5. PUBLICATION FORTHCOMING
BUILDING BRIDGES: CHINA’S GROWING ROLE AS
INFRASTRUCTURE FINANCIER FOR SUB-SAHARAN AFRICA
Vivien Foster William Butterfield
Chuan Chen Nataliya Pushak
HELPING TO
ELIMINATE POVERTY
THROUGH PRIVATE
INVOLVEMENT IN
INFRASTRUCTURE

© 2008 The International Bank for Reconstruction and Development / The World Bank 1818 H Street NW Washington DC 20433 Telephone: 202-473-1000 Internet: www.worldbank.org E-mail: [email protected] All rights reserved 1 2 3 4 5 11 10 09 08 This volume is a product of the staff of the International Bank for Reconstruction and Development / The World Bank. The findings, interpretations, and conclusions expressed in this volume do not necessarily reflect the views of the Executive Directors of The World Bank or the governments they represent.
The World Bank does not guarantee the accuracy of the data included in this work. The boundaries, colors, denominations, and other information shown on any map in this work do not imply any judgement on the part of The World Bank concerning the legal status of any territory or the endorsement or acceptance of such boundaries.
Rights and Permissions The material in this publication is copyrighted. Copying and/or transmitting portions or all of this work without permission may be a violation of applicable law. The International Bank for Reconstruction and Development / The World Bank encourages dissemination of its work and will normally grant permission to reproduce portions of the work promptly.
For permission to photocopy or reprint any part of this work, please send a request with complete information to the Copyright Clearance Center Inc., 222 Rosewood Drive, Danvers, MA 01923, USA; telephone: 978-750-8400; fax: 978-750-4470; Internet: www.copyright.com.
All other queries on rights and licenses, including subsidiary rights, should be addressed to the Office of the Publisher, The World Bank, 1818 H Street NW, Washington, DC 20433, USA; fax: 202-522-2422; e-mail: [email protected].

iii
TABLE OF CONTENTS
Authors iv
Acknowledgements v
Executive Summary vi
Glossary of Terms xiii
Abbreviation and Acronyms xiv
1. Introduction 1
2. China’s Growing Ties with Sub-Saharan Africa 3
3. Methodology 7
4. The Emergence of Chinese Infrastructure Finance 13
5. Economic Complementarities Between China and Sub-Saharan Africa 23
6. Financing Issues 40
7. The Changing Landscape of Infrastructure Finance 50
8. Conclusion 56 Bibliography 58
Annex 1: Methodology for Searching Factiva Database 61
Annex 2: Methodology for Creating Project Database 63
Annex 3: Summary of Chinese Funded Infrastructure Projects by Sector 65
Annex 4: Summary of Chinese Funded Infrastructure Projects by Country 73
Annex 5: Summary of Chinese Funded Natural Resource Projects by Country 77

iv
AUTHORS
The authors are respectively Vivien Foster, Lead Economist, Sustainable Development Department, Africa Region of the World Bank, William Butterfield, formerly Consultant to the
World Bank, Chuan Chen, formerly Professor at the Department of Civil Engineering, Tsinghua University, and Nataliya Pushak, Consultant to the World Bank.

v
ACKNOWLEDGMENTS
This activity was funded by a grant from the Public Private Infrastructure Advisory Facility and undertaken by the Director’s Office of the Sustainable Development Department of the Africa Region of the World Bank.
The authors would like to thank all of our World Bank colleagues whose input and advice helped us understand these issues more clearly, including Eleodoro O. Mayorga Alba, Sudeshna Ghosh Banerjee, Philippe Charles Benoit, Harry Broadman, Francisco Galrao
Carneiro, Astrid Hillers,DDouglass Hostland, Wendy Hughes, Victoria Kwakwa, Charles McPherson, Pierre Pozzo di Borgio, Prasad Tallapragada, Silvana Tordo, Mark Williams, and Whenhe Zhang. We would also like to thank the development agencies that made their procurement data available to us in order to analyze activities of Chinese contractors in projects funded by African Development Bank, Agence Française de Développement, KFW, and World Bank.
vi
EXECUTIVE SUMMARY
In recent years, a number of emerging economies have begun to play a growing role in the finance of infrastructure in Sub-Saharan Africa. Their combined resource flows are now comparable in scale to traditional official development assistance (ODA) from OECD countries or to capital from private investors. These non-OECD financiers include China, India, and the Gulf states, with China being by far the largest player. This new trend reflects a much more positive economic and political environment in Sub-Saharan Africa. Real GDP growth in the region has been sustained at 4 to 6 percent now for a number of years, and has benefited from an improved investment climate. The rise of the Chinese and Indian economies has fueled global demand for petroleum and other commodities. Africa is richly endowed with these and faces a historic opportunity to harness its natural resources and invest the proceeds to broaden its economic base for supporting economic growth and poverty reduction. In this context, south-south cooperation provides a channel through which the benefits of economic development in Asia and the Middle East can be transferred to the African continent, through a parallel deepening of trade and investment relations. Chinese finance often goes to large-scale infrastructure projects, with a particular focus on hydropower generation and railways. More than 35 African countries are engaging with China on infrastructure finance deals, with the biggest recipients being Nigeria, Angola, Sudan, and Ethiopia. The finance is channeled primarily through the China Export-Import (Ex-Im) Bank on terms that are marginally concessional, though significantly less so than
those associated with ODA. A large share has gone to countries that are not beneficiaries of recent debt relief initiatives. In some cases, infrastructure finance is packaged with natural resource development, making use of a mechanism known as the “Angola mode.” Chinese finance is on a scale large enough to make a material contribution toward meeting Africa’s vast infrastructure needs. As such, it offers an important development opportunity for the region. Despite the importance of Chinese finance for African infrastructure, relatively little is known about its value. The main purpose of this study is to quantify the magnitude of these financial flows from China by collating public information from a wide range of Chinese language sources. On this basis, it becomes possible to document the geographic distribution of resources, the types of infrastructure involved, the size and financing terms of the projects, and the modalities through which finance is being provided. The findings raise deeper questions about the economic, social, and environmental impacts of the projects concerned. These lie beyond the scope of this research, but are undoubtedly important and merit future attention. Value of Chinese Infrastructure Finance China and Africa have a long history of political and economic ties, which have greatly intensified in recent years. Both bilateral trade and Chinese foreign direct investment (FDI) in Africa grew about fourfold between 2001 and 2005, accompanied by a major influx of Chinese enterprises and workers into the region. The natural resource sector, principally petroleum and to a lesser extent minerals, has been the major focus for both Chinese FDI to Africa

vii
and African exports to China. Nevertheless, China remains a relatively small player in Africa’s petroleum sector relative to the OECD countries. The growth in commercial activity between China and Africa has been accompanied by a significant expansion of Chinese official economic assistance to the region, which is focused mainly on infrastructure and typically channeled through the China Ex-Im Bank.
To provide a clearer picture of the value and nature of this finance, a database of projects with Chinese finance was constructed, initially based on press reports and subsequently verified from public Chinese language Web sites. The database covers 2001–07. On the basis of this database, it can be estimated that Chinese financial commitments to African infrastructure projects rose from less than US$1 billion per year in 2001–03 to around US$1.5 billion per year in 2004–05, reached at least US$7 billion in 2006—China’s official “Year of Africa”—then trailed back to US$4.5 billion in 2007. About half of the confirmed projects involved Chinese commitments of less than US$50 million. However, Chinese finance has shown itself capable in about half a dozen cases of raising very large contributions of over US$1 billion in value for single projects. Overall, at least 35 countries in Sub-Saharan Africa have benefited from Chinese finance or are actively discussing funding opportunities. African leadership has typically welcomed China’s fresh approach to development assistance, which eschews any interference in domestic affairs, emphasizes partnership and solidarity among developing nations, and offers an alternative development model based on a more central role for the state. However, a number of civil society commentators have expressed concerns about the social and environmental standards applied. The China
Ex-Im Bank has its own environmental standards, and its policy is to follow the environmental regulations of the host country. Sectoral Distribution of Chinese Infrastructure Finance In terms of sectoral distribution, a large share of the Chinese finance is allocated to general, multisector infrastructure projects, within the framework of broad bilateral cooperation agreements that allow resources to be allocated in accordance with government priorities. However, it is clear that the two largest beneficiary sectors are power (mainly hydropower) and transport (mainly railroads). In the power sector, China’s activities have focused on the construction of large hydropower schemes. By the end of 2007, China was providing US$3.3 billion toward the construction of ten major hydropower projects amounting to some 6,000 megawatts (MW) of installed capacity. Once completed, these schemes will increase the total available hydropower generation capacity in Sub-Saharan Africa by around 30 percent. There have also been some activities in thermal generation and transmission, but on a much smaller scale. China has made a major comeback in the rail sector, with financing commitments on the order of US$4 billion for this sector. They include rehabilitation of more than 1,350 kilometers of existing railway lines and the construction of more than 1,600 kilometers of new railroad. To put this in perspective, the entire African railroad network amounts to around 50,000 kilometers. The largest deals have been in Nigeria, Gabon and Mauritania. In the information and communication technology (ICT) sector, China’s involvement mainly takes the form of equipment sales to national incumbents, either through normal commercial contracts or through

viii
intergovernmental financing tied to purchases of Chinese equipment by state-owned telecom incumbents. An important focus has been the development of national backbone infrastructure. In total in 2001–07, Chinese telecom firms supplied almost US$3 billion worth of ICT equipment, mainly in Ethiopia, Sudan, and Ghana. In the road and water sectors, China has been involved in financing a significant number of projects, but the sums involved are much smaller than in the other three sectors; no more than US$700 million overall has gone to the two sectors combined. Geographic Distribution of Chinese Infrastructure Finance In terms of geographic distribution, Chinese finance has been highly concentrated, with about 70 percent going to just four countries: Nigeria, Angola, Sudan, and Ethiopia. China’s involvement in Nigeria, dating back to 2004, began relatively modestly with a number of projects in the telecom and power sectors. A substantial scale-up took place in 2006, when US$5 billion of infrastructure projects were agreed, including the 2,600-MW Mambilla hydropower scheme and two major projects to upgrade and modernize the country’s railway system. However, the status of all of these projects is currently under review by Nigeria’s new administration. In Angola, Chinese involvement dates back to the peace accords in 2002. The engagement was substantially scaled up in 2004, when a very substantial line of concessional credit was agreed with the China Ex-Im Bank to allow the government to repair infrastructure damaged in the country’s 27-year civil war. So far, the government of Angola has drawn three installments totaling US$4 billion from this credit line. The first installment, for US$2
billion, is known to have been backed by 10,000 barrels per day of oil exports. In Sudan, China has financed close to US$1.3 billion of infrastructure projects, including the development of more than 2,200 MW of thermal generating capacity, the 1,250-MW Merowe hydropower scheme, and a number of other significant investments in the rail, road, and water sectors. China’s engagement in Ethiopia amounts to a total of US$1.6 billion. The main focus has been on the ICT sector, particularly the Ethiopia Millennium Project to create a fiber-optic transmission backbone across the country and roll out the expansion of the GSM network. Most of these were financed under export seller’s credit arrangements with the Chinese telecommunications operator ZTE for the supply of equipment to the Ethiopian national telecommunications incumbent. Economic Complementarities The growing ties between China and Africa, including China’s emerging role as a major financier of infrastructure in the region, can be understood in terms of the economic complementarities that exist between the two parties. On the one hand, Africa counts among its development challenges a major infrastructure deficit, with investment needs estimated to be at least US$20 billion per year and an associated funding gap on the order of US$10 billion per year. China has developed one of the world’s largest and most competitive construction industries, with particular expertise in the civil works critical for infrastructure development. On the other hand, as a result of globalization China’s fast-growing manufacturing economy is generating major demands for oil and mineral inputs that are rapidly outstripping the country’s domestic resources. Africa is already a major natural resource exporter, and with enhanced infrastructure could develop this potential
ix
even further, accelerating economic development in the region. Meeting Africa’s Infrastructure Needs Sub-Saharan Africa lags behind other developing regions on most standard indicators of infrastructure development, prompting African leaders to call for greater international support in this sphere. By far the largest gaps arise in the power sector, with generation capacity and household access in Africa at around half the levels observed in South Asia and about a third of the levels observed in East Asia and Pacific. Unreliable power supply leads to losses in industrial production valued at 6 percent of turnover. Furthermore, Africa’s limited infrastructure services tend to be much costlier than those available in other regions. For example, road freight costs in Africa are two to four times as high per kilometer as those in the United States, and travel times along key export corridors are two to three times as high as those in Asia. It is estimated that Africa’s deficient infrastructure may be costing as much as one percentage point per year of per capita GDP growth. Since 1999, China’s construction sector has seen annual growth of 20 percent, making China the largest construction market in the global economy. The competitiveness of Chinese contractors can be gauged by examining how well they fare in international tenders for projects funded by multilateral aid agencies such as the World Bank and the African Development Bank. In recent years, they have accounted for more than 30 percent by value of civil works contracts tendered by these two multilateral agencies, which makes them substantially more successful than contractors of any other nationality. Chinese contractors have been particularly successful in the road and water sectors and in countries such as Ethiopia, Tanzania, and the Democratic Republic of Congo.
Addressing China’s Natural Resource Requirements China’s natural resource imports from Sub-Saharan Africa reached US$22 billion in 2006. Petroleum alone accounts for almost 80 percent of this trade, with the balance being timber and minerals. As a result, China now depends on Africa for around 30 percent of its oil imports, 80 percent of its cobalt imports and 40 percent of its manganese imports. Overall, Angola is by far the largest trading partner, followed by Republic of Congo, Equatorial Guinea, Sudan and South Africa. Even so, it is important to remember that this expansion takes place from a very low base. China’s oil companies remain relative latecomers to petroleum exploration and production in Africa. In recent years, China’s oil companies have secured oil exploration and drilling rights in Angola, Chad, the Republic of Congo, Côte d’Ivoire, Equatorial Guinea, Ethiopia, Gabon, Kenya, Mali, Mauritania, Niger, Nigeria, São Tomé and Principe, and Sudan. However, the US$10 billion of Chinese oil sector investments recorded in this study are barely a tenth of the US$168 billion that other international oil companies have already invested in the region. Moreover, most of Africa’s oil exports continue to go to OECD countries. In 2006, 40 percent of Africa’s oil production was exported to the United States and 15 percent to Europe, compared with only 16 percent to China. Similarly, Chinese companies have secured projects for minerals (including copper, iron, and bauxite) in countries such as the Democratic Republic of Congo, Gabon, Guinea, Zambia, and Zimbabwe. The investment commitments associated with these are estimated at around US$2 billion. In some cases, official assistance has simultaneously been used to provide rail and power generation infrastructure needed to facilitate export of minerals such as bauxite in

x
Guinea or copper and manganese in the Democratic Republic of Congo. However, only 7 percent of Chinese infrastructure finance is directly linked to natural resource exploitation; most of the resources are directed to broader development projects. Financing Aspects China’s approach to financial assistance is different from that of traditional donors, and forms part of a broader phenomenon of south-south economic cooperation between developing nations. The principles underlying this support are therefore ones of mutual benefit, reciprocity, and complementarities and are grounded in bilateral agreements between states. Unlike traditional ODA, Chinese infrastructure finance is channeled not through a development agency but through the Ex-Im Bank, which has an explicit mission to promote trade. Given the export promotion rationale, the tying of financial support to the participation of contractors from the financing country is a typical feature. A similar approach is being taken by the India Ex-Im Bank and has in the past been used by export credit agencies of other countries. The vast majority of infrastructure financing arrangements discussed in this study were financed by the China Ex-Im Bank, which (like any ex-Im bank) is devoted primarily to providing export seller’s and buyer’s credits to support the trade of Chinese goods. These credits reached a total of US$20 billion in 2005, making the China Ex-Im Bank one of the largest export credit agencies worldwide. In addition, the China Ex-Im Bank is the only Chinese institution that is empowered to provide concessional loans to overseas projects. The China Ex-Im Bank is increasingly making use of a deal structure—known as the “Angola mode” or “resources for infrastructure”—whereby repayment of the loan for
infrastructure development is made in terms of natural resources (for example, oil). This approach is by no means novel or unique, and follows a long history of natural resource–based transactions in the oil industry. In the case of the China Ex-Im Bank, the arrangement is used for countries that cannot provide adequate financial guarantees to back their loan commitments and allows them to package natural resource exploitation and infrastructure development. The study documents eight resource-backed deals of this kind (including the credit line to Angola) worth more than US$3 billion and covering petroleum, mineral resources, and agricultural products. The China Ex-Im Bank’s terms and conditions are agreed on a bilateral basis, with the degree of concessionality depending on the nature of the project. The World Bank’s Debtor Reporting System offers some insight into Chinese lending to Sub-Saharan Africa, including both infrastructure and non-infrastructure loans. On average, the Chinese loans offer an interest rate of 3.6 percent, a grace period of 4 years, and a maturity of 12 years. Overall, this represents a grant element of around 36 percent, which qualifies as concessional according to official definitions. The variation around all of these parameters is considerable across countries; thus interest rates range from 1 to 6 percent, grace periods from 2 to 10 years, maturities from 5 to 25 years, and overall grant elements from 10 to 70 percent. Chinese loans compare favorably with private sector lending to Africa but are not as attractive as ODA, which tends to provide a grant element of around 66 percent to Africa. The Chinese Ministry of Commerce’s database for Chinese contractors provides some data on grant-funded projects, each of which is typically less than US$30 million in value.

xi
In the context of recent debt relief initiatives, Chinese lending to Africa has prompted a renewed discussion about debt sustainability. A comparison of recent debt relief figures with estimates of potential indebtedness to China suggests that some of the major beneficiaries of Chinese finance, accounting for more than one third of the total, were countries that did not benefit from Western debt relief initiatives, such as Angola, Sudan, and Zimbabwe. The only beneficiaries of Western debt relief that have contracted relatively large debts to China are Guinea, Mauritania, and Nigeria. It is also worth noting that China has itself provided US$780 million of debt relief to African countries in recent years. The Wider Landscape China is by no means the only major emerging financier for infrastructure projects in Africa. India has also been using its Ex-Im Bank to support the development of power projects in countries such as Nigeria and Sudan where it is developing natural resource interests. Indian infrastructure deals in Africa averaged US$0.5 billion per year in 2003–07, associated with significant natural resource investments. In addition, Arab countries provided an average annual US$0.5 billion for infrastructure finance in Africa in 2001–07. This has taken the form of relatively small projects (on the order of US$20 million) with a heavy emphasis on road investments. Overall, infrastructure resources provided to Africa by the emerging financiers jumped from around US$1 billion per year in the early 2000s to around US$8 billion in 2006 and US$5 billion in 2007. These flows are now broadly comparable in magnitude to the ODA of OECD donors (amounting to US$5.3 billion in 2006) and to the resources emanating from private participation in infrastructure, or PPI (amounting to more than US$8 billion in 2006).
Resource flows of the magnitude provided by the emerging financiers are large enough to make a material contribution toward meeting Africa’s infrastructure financing needs of US$22 billion per year. The contribution is most material in the power sector. In ICT, emerging financiers’ contribution is less significant and, moreover, comes on top of already abundant sources of finance from PPI. In transport and water, the contribution of emerging financiers remains relatively small in relation to needs. Notwithstanding some overlap, there is a significant degree of complementarities in the main areas of focus for each of the three major sources of external finance. PPI seeks the most commercially lucrative opportunities in ICT. Emerging financiers focus on productive infrastructure (primarily power generation and railroads). Traditional ODA focuses on the finance of public goods (such as roads and water supply) and plays a broader role in power system development and electrification. A similar pattern of specialization emerges with respect to geography, with different countries relying to differing degrees on the various sources of finance. Conclusion The advent of China and other emerging players as important financiers represents an encouraging trend for Africa, given the magnitude of its infrastructure deficit. The investments made by these emerging financiers are unprecedented in scale and in its focus on large-scale infrastructure projects. With new actors and new modalities, there is a learning process ahead for borrowers and financiers, both new and old alike. Salient issues are the development of national capacity to negotiate complex and innovative deals, and to enforce appropriate environmental and social standards for project development. In sum, the key challenge for African governments is how to make the best

xii
strategic use of all external sources of infrastructure funding, including those of emerging financiers, to promote growth and reduce poverty on the continent.

xiii
GLOSSARY OF TERMS
Angola mode A financing scheme in which the repayment of a loan is linked to natural resource
exports Concessional Concessional finance is defined as having terms that provide an equivalent grant
element of 25 percent or more relative to what can be secured on the commercial market
FDI Foreign direct investment captures private equity investments of foreign companies FEC Foreign economic cooperation captures overseas construction contracts, labor
exports, consulting services, and nonfinancial FDI (as such it does not correspond to either FDI or ODA)
ODA Official development assistance captures concessional financing for projects with a
clear development purpose PPI Private participation in infrastructure captures FDI in infrastructure sectors under
contractual arrangements in which the private sector assumes operational responsibilities and bears business risks
xiv
ABBREVIATIONS AND ACRONYMS China Ex-Im China Export-Import Bank
DAC Development Assistance Committee of the OECD
DRC Democratic Republic of Congo
ICT Information and communication technology
IFC International Finance Corporation
MDG Millennium Development Goal
MOU Memorandum of understanding
OECD Organisation for Economic Co-operation and Development
SSA Sub-Saharan Africa
WITS World Integrated Trade Solution

1
1.
INTRODUCTION China and Africa have a long history of political and economic ties, which have greatly intensified in recent years. Both bilateral trade and Chinese foreign direct investment (FDI) in Africa grew about fourfold between 2001 and 2005, accompanied by a major influx of Chinese enterprises and workers into the region. The natural resource sector, principally petroleum and to a lesser extent minerals, has been the major focus for both Chinese FDI to Africa and African exports to China. This growth in commercial activity between China and Africa has been accompanied by a significant expansion of Chinese official economic assistance to the region, which is focused mainly on infrastructure and typically channeled through the China Ex-Im Bank. Although this assistance is widely reported in the press, there are no official statistics on its overall value. Various attempts to estimate volumes have been speculative at best, but suggest a multi-billion-dollar scale. Given the conclusion of the Commission for Africa that there is a need to double the estimated historical (public and private) financing flows of around US$10 billion per year to Africa’s infrastructure development, there is no doubt that the opening of a major new source of infrastructure finance is of material importance for the region. Chinese official economic assistance often takes the form of loans provided by the China Export-Import (Ex-Im) Bank to specific African governments for the development of infrastructure projects. In line with the typical
practice of export-import banks, support is partly tied to participation by contractors from the financing country. The resulting infrastructure remains the property of the African governments and their parastatals, which are responsible for the subsequent operation and management of the assets. Reflecting priorities identified by the beneficiary countries, the focus of projects to date has been in the area of productive infrastructure (including power, rail, and ICT) as well as some high-profile construction projects. While it is known that the China Ex-Im Bank provides a significant volume of concessional financing to Africa for such infrastructure development, the details of the associated financing terms are not typically disclosed. There is therefore a need for the international community to improve its understanding of the new role that China is playing in the development of Africa’s infrastructure, and its implications for Africa’s development. The objective of this report is to contribute to such an understanding by providing more solid estimates of the overall volume of finance, as well as an analysis of its composition. The report focuses on Sub-Saharan Africa, which is where infrastructure financing needs are particularly critical and where the bulk of the Chinese activity has taken place. The starting point for this endeavor is the construction of a database that documents each of the projects reported to have Chinese financing, which are subsequently verified through a range of Chinese and international sources. The report is structured along the following lines. Section 2 provides an overview of the
2
growing economic ties between China and Africa, in particular the extent of our current understanding of Chinese infrastructure finance in the region. Section 3 examines the data available from official Chinese government sources and discusses the methodological challenges inherent in quantifying the extent of official assistance for infrastructure finance. Section 4 presents the headline estimates on the value of Chinese finance based on the projects database developed for this report. Section 5 details the economic complementarities that exist between China and Africa, based on Africa’s need for infrastructure and China’s natural
resource import requirements. Sections 6 and 7 present a more detailed profile of Chinese financed infrastructure projects in Africa on a sector-by-sector and country-by-country basis. Section 8 presents the available information on financing mechanisms and terms, and considers the overall impact on country indebtedness. Section 9 places the phenomenon of Chinese infrastructure finance into a broader international perspective, comparing it with flows provided by traditional OECD financiers and other emerging players such as India and the Arab countries. Finally, Section 10 draws out the main conclusions and implications.

3
2.
CHINA’S GROWING TIES WITH SUB-SAHARAN AFRICA China’s growing economic ties with Africa have attracted increasing interest from the policy community and spawned a burgeoning literature. In just the last year, a wide variety of international agencies and think tanks have published studies documenting different aspects of China’s engagement in Africa.1 The issue has also been discussed by African institutions and civil society organizations (see for example the special Pambazuka News Issue in 2006). The most extensive studies to date have focused on understanding the trade relationships between Asia and Africa, with a particular focus on China (see Broadman 2006 and Goldstein et al. 2006). According to IMF Direction of Trade Statistics, by 2005, the total value of trade between China and Africa reached US$36 billion; up from less than US$10 billion in 2001 (figure 1). Africa’s exports to China consist mainly of oil, minerals, and other natural resources such as timber, needed to fuel the dramatic growth of China’s manufacturing sector. China’s exports to Africa consist mainly of manufactured consumer goods. China’s share of Africa’s 1 These include Agence Française de Développement (Jacquet et al. 2007), Carnegie Endowment for International Peace (Kurlantzick 2006), Center for Global Development (Moss and Rose 2006), Center for Strategic and International Studies (Glosny 2006 and Bates et al. 2007), Corporate Council on Africa (Shelton 2005), Department for International Development (University of Stellenbosch 2006), East West Center (Zhang 2006), International Rivers Network (Bosshard 2006), Organisation for Economic Co-operation and Development (Goldstein et al. 2006), and the World Bank (Broadman 2006)
trade has jumped from 2 percent to 6 percent, making it the region’s third largest trading partner after the United States and France (Alden and Rothman, 2006). Complementing the growth in trade has been an expansion of Chinese FDI in Africa, particularly in the natural resource sector. According to the Ministry of Commerce, the volume of Chinese FDI to Africa increased from around US$50 million per year in the early 2000s to around US$400 million per year in 2004–05. In parallel with the deepening commercial ties described above, a number of authors comment on the substantial growth of official economic assistance provided by China to African governments (see for example Glosny 2006 and Kurlantzick 2006), and document the rapid growth of the China Ex-Im Bank to become one of the world’s largest export credit agencies, as well as its emergence as the privileged channel for Chinese overseas concessional lending (Moss and Rose, 2006). Chinese official assistance to Africa has a history dating back to the 1960s. Brautigam (1997) notes that by 1975 China had aid programs in more African countries than did the United States, and that total Chinese aid to Africa over the period 1960 to 1989 has been estimated at US$4.7 billion. During the early decades of the PRC, Chinese aid efforts in Africa focused on small-scale agricultural development projects on highly concessional terms of finance, typically accompanied by transfer of Chinese know-how. With the

4
notable exception of the 1,860-kilometer-long Tanzania-Zambia Railway (Tazara) completed in 1976, Chinese aid during this period did not typically focus on infrastructure. Following the economic reforms of the 1990s, Brautigam notes that there was a major shift in overseas
development assistance policy toward a more market-based approach with a move away from zero interest lending, and a greater focus on the economic rationale for aid projects.
Figure 1: Chinese trade with and foreign direct investment in Sub-Saharan Africa, 2001–05
0
5
10
15
20
25
30
35
40
US$
Bill
ions
2001 2002 2003 2004 2005Year
Imports from AfricaExports to Africa
2001 2002 2003 2004 2005
0
50
100
150
200
250
300
350
400
450
US$
mill
ions
(a) Trade flows (b) Foreign Direct Investment Source: IMF Direction of Trade Statistics (2006) and Ministry of Commerce (2006).
Box 1: A brief history of Sino-African engagement
China’s engagement in Africa goes far back in history and includes trade along the Silk Road (which through the Arab peninsula and Indian also reached Africa) as well as Admiral Zheng He’s travels to eastern Africa in the 15th century. China’s contemporary engagement with Africa has its roots in the mid 1950s, notably in the Bandung Conference, where Asian and African states reinforced nonalignment and sought to promote Afro-Asian economic and cultural cooperation. Chinese Premier Zhou Enlai’s tour of 10 African countries between 1963 and 1964 offered support to Africa’s people and leaders, and Chinese overseas development assistance became a feature of relations, focusing on infrastructure development as well as technical and student exchange visits (particularly in the field of medicine). The most notable example of the cooperation was construction of the Tazara railway, linking Zambia to the coastal port of Dar es Salaam in Tanzania and thus providing Zambia with an alternative route to the sea. After Deng Xiaoping’s reforms took off in 1978, Sino-Africa cooperation became less prominent for some time, but regained momentum in the 1990s. President Jiang Zemin, who toured Africa in May 1996, presented the Five Points Proposal establishing the contours of a new relationship with Africa, centering on a reliable friendship, sovereign equality, non-intervention, mutually beneficial development, and international co-operation. In October 2000, the First Forum of China-Africa Cooperation (FOCAC) was held in Beijing. The Forum reached consensus on a wide range of issues and culminated in the adoption of two policy documents – the Beijing Declaration and the Program of Cooperation on Economic and Social Development. Thereafter, the ministerial conference became a triannual event convened alternately in China and Africa.

5
In November 2004, China established the China-Africa Business Council (CABC) jointly with the UN Development Program as a public-private partnership aiming to support China’s private sector investment in Sub-Saharan Africa. The second FOCAC conference was held in October 2006 in Beijing, marking the culmination of China’s “Year of Africa,” with more than 40 African Heads of State in attendance. At this event, China pledged $3 billion in preferential loans and $2 billion in export credits to African states over the next three years, created a special fund of $5 billion to encourage Chinese investment in Africa, and established the China-Africa Joint Chamber of Commerce.
This led to a scale-up in financial assistance in the early 2000s with a particular focus on infrastructure projects. Indeed, China’s officials declared 2006 China’s “Year of Africa” marked by intensive diplomatic outreach including a series of official visits by the Chinese Premier, and culminating in the Heads of State Forum on China-Africa Cooperation held in Beijing in October 2006, where the Chinese government pledged US$5 billion dollars of aid to Africa over the next three years. China’s African Policy highlights “mutual benefit, reciprocity and common prosperity” as a guiding principle for China’s activities in the region (King, 2006). Commentators agree that China’s role in infrastructure finance in the region is substantial, though no precise figures exist. A few studies have attempted to provide first order estimates of the value of Chinese finance for African infrastructure projects. At the low end of the spectrum, Agence Française de Développement estimates Chinese financing in the range US$1.6 billion and US$2.2 billion for 2004 (Chaponniere 2006). They arrive at this conclusion by taking total foreign economic cooperation in Africa of US$2.6 billion for the same year (official Chinese numbers), and netting out both (a) the value of contracts won by Chinese contractors from multilateral agencies and (b) an estimate of private sector activity. At the high end of the spectrum, the Center for Global
Development (2006) estimates (based on international press reports) that Chinese- financed infrastructure projects in Africa amounted to at least US$7.5 billion over the period 2004–05. A recent study by Stellenbosch University (2006), while not attempting to provide an overall estimate of the value of Chinese infrastructure finance, does document the existence of a US$2 billion credit line for Angola alone. Although inconclusive, these estimates point to the substantial scale of Chinese financing. They can be compared, for example, with commitments of around US$5 billion of official assistance to infrastructure projects in Sub-Saharan Africa by OECD countries in 2006 (Infrastructure Consortium for Africa, 2007). The Chinese contribution also appears to be material when set against estimates of the overall infrastructure financing needs of Sub-Saharan Africa, which have been estimated at US$22 billion annually, and the associated funding deficit of around US$10 billion per annum. Chinese financing flows typically involve investments by Chinese contractors that are funded through bilateral loans from the China Ex-Im Bank to the government of the beneficiary country. Since the Chinese contractors involved do not risk equity capital nor gain control over any foreign affiliate, they do not qualify as FDI. While the
6
financing terms are often described as concessional exact details are not typically reported. Thus, it is not clear whether or not they would qualify as concessional based on the OECD’s official definition of official development assistance (ODA), which entails “flows to developing countries provided by official agencies which have a clear development purpose and are at least partially concessional in nature.” Comparisons with traditional ODA can be misleading. On the one hand, traditional ODA constitutes concessional finance from high-income countries to lower-income countries for development purposes, usually delivered through bilateral or multilateral aid agencies with an explicit mission to reduce poverty in the recipient country. These flows are guided by the agreements made under the OECD Development Assistance Committee, which over a number of decades have sought to reform practice in such a way as to ensure that ODA delivers the maximum benefit to the recipient country, for example, by untying contracts, developing safeguards, and harmonizing procedures. On the other hand, support from emerging players such as China (and also India) constitutes official financing between lower income countries, and is delivered not through development agencies, but rather through Ex-Im Banks with an explicit mission to promote trade and development in the originating country. Given
the lower income level of the originating country, it makes sense that this financing is designed to bring benefits to the financier as well as to the borrower. The export promotion logic of the financing provided also explains the prevalent practice of tying this to contractors from the financing country, which is standard for Ex-Im Banks. African leadership has typically welcomed China’s fresh approach to development assistance, which eschews any interference in domestic affairs and emphasizes partnership and solidarity among developing nations (King 2006; Pambazuka 2006). However, a number of civil society commentators have expressed concerns about the social and environmental standards applied in Chinese funded projects in Africa (Alden and Rothman 2006; Bosshard 2006; Glosny 2006; Kurlantzick 2006; Pambazuka 2006). These relate primarily to the import of Chinese laborers and the resettlement procedures associated with the construction of large dams. China Ex-Im Bank has its own environmental standards; its policy is to respect the environmental regulations of the host country. At the same time, the Chinese approach is seen to provide a viable alternative development model based on a much more central role for the state that often appeals to African governments (Gill et al. 2006).

7
3. METHODOLOGY Estimating the extent of Chinese financing of infrastructure project in Africa presents numerous methodological challenges. The reason is that, official Chinese data sources do not produce figures at the level of disaggregation required to document this specific issue.2
(a) Existing information sources The China Ex-Im Bank, which is the main financier of Chinese infrastructure projects in Africa, publishes data on the overall volume of its export financing. The total value of commitments for worldwide export credits and guarantees, pegged at close to US$26 billion in 2006,3 has quadrupled since the year 2000. However, data on concessional lending – the relevant financing mode for African infrastructure projects – are not typically disclosed.
The Ministry of Commerce publishes annual statistics on “foreign economic cooperation,” which is a broad concept encompassing the value of overseas contracts, labor exports, consulting services, and nonfinancial FDI. These statistics, which are broken down at the country level, indicate that new contractual commitments to projects in Sub-Saharan Africa tripled from just under US$2 billion in 2002 to just over US$6 billion in 2005 (figure
2 Statements about the value of Chinese aid are occasionally made by senior political figures but are difficult to interpret or reconcile with respect to officially determined categories 3 Includes approved US$ 17.5 billion of export seller’s credits, US$ 4.24 billion of export buyer’s credits, and US$ 4.4 billion of international guarantees (from China Ex-Im Bank annual report 2006, http://english.Ex-Imbank.gov.cn/annual/reportall.jsp, p.19-23).
2a). Around half of this cooperation went to four countries: Mauritania, Nigeria, Angola and Sudan (figure 2b). These official statistics on foreign economic cooperation merge together three distinct types of projects: those financed from official Chinese sources (which are of central interest to this study), those undertaken by Chinese contractors but financed by multilateral agencies (such as the World Bank), and those undertaken by Chinese enterprises in association with overseas private contractors (AFD, 2006). It is possible to make some crude adjustments to these figures to get closer to a true approximation of the likely value of Chinese financed projects by subtracting from these totals the known value of Chinese FDI in Sub-Saharan Africa, as well as the known value of multilateral contracts awarded to Chinese firms, over the same period (table 1). This yields estimates that increase from US$1.8 billion in 2002 to US$5.3 billion in 2005. Data for 2006 were not available at the time of writing. This figure provides a likely upper bound for Chinese government-financed infrastructure projects in the region, since in addition to network infrastructure this will include other construction projects that China has undertaken in Africa, including sports stadiums and residential housing, as well as presidential palaces and parliamentary buildings.

8
Figure 2: Chinese foreign economic cooperation in Sub-Saharan Africa, 2002-05
1,991
3,157
5,342
6,019
1,6762,076
2,950
4,540
0
1,000
2,000
3,000
4,000
5,000
6,000
7,000
2002 2003 2004 2005
MUS
$
New Contract Value Revenue
Angola13%
Nigeria14%
Mauritania18%
Rest33%
Botswana4%
Ethiopia4%
Ghana2%
Uganda1%
Sudan6%
Tanzania5%
(a) Trend (b) Destination Source: Ministry of Commerce, PRC, 2006.
Table 1: Estimated upper bound of Chinese infrastructure finance commitments in Sub-Saharan Africa, 2002–05
(US$ millions) 2002 2003 2004 2005
Foreign economic cooperation in Sub-Saharan Africa 1,869.2 3,128.6 5,283.9 5,941
.0 Less Chinese FDI in Sub-Saharan Africa 62.8 107.4 432.0 345.6 Value of multilateral contracts in Sub-Saharan Africa secured by Chinese contractors
30.2 24.0 259.9 276.2
Yields Estimated upper bound of Chinese infrastructure finance commitments in Sub-Saharan Africa 1,776.2 2,997.2 4,592.0
5,319.2
Source: Ministry of Commerce, World Bank, African Development Bank. Finally, during a six-nation tour of Africa in June of 2006, Premier Wen Jiabao said China has offered more than US$44 billion in aid over the past 50 years to finance 900 infrastructure projects.4 In 2005, he stated that the Chinese government provided
4 “Benin Offers Incentives To Chinese Cos Exploring For Oil”, Dow Jones International News, 28 August 2006.
US$950 million in aid to Africa. During 2007, China’s top leaders have visited about half of the 48 African countries with which China has diplomatic ties,5 signing debt relief and aid agreements with 28 countries.6
5 (2007) AFRICA-CHINA: Hu's Tour Africa Research Bulletin: Economic, Financial and Technical Series 44 (1) , 17243A–17245C doi:10.1111/j.1467-6346.2007.00723.x. 6 China Ministry of Commerce (http://xyf2.mofcom.gov.cn/aarticle/workaffair/200712/20071205263642.html).

9
(b) A new project database In view of these difficulties, the approach developed in this paper is to build up a project-by-project estimate of the total value of Chinese infrastructure finance triangulating from as many different sources as possible, and drawing upon both international sources and Chinese sources. In a first round of data collection, international press reports were systematically reviewed and attempts were made to verify them through World Bank channels. The starting point was international English language media. The Factiva media database was used to perform a systematic search of newspaper articles covering Chinese infrastructure projects in Africa over the period 2001–07. Factiva, a Dow Jones & Reuters Company, is a database of international newspapers, magazines, and business press releases that uses more than 10,000 different sources. Annex 1 provides a detailed discussion of search terms. The newspaper reports were used to construct project records detailing the date, country, sector, Chinese agency involvement, nature of project, type of financing, amount of financing, and current status. Annex 2 provides a detailed description of the database structure. In order to understand the linkages between infrastructure projects and natural resource development, a parallel database was created documenting natural resource projects using the same method. While this approach was effective in generating a rapid overview of projects underway, it suffers from a number of shortcomings. To the extent that the media may cover the initial announcement of a financing commitment, but fail to indicate whether or not the commitment follows
through over time, the newspaper reports may be overstating the real extent of Chinese finance. To the extent that the media may focus on larger (more newsworthy) projects, the newspaper reports may be underestimating the extent of Chinese finance by overlooking smaller projects. In some cases, media reports are incomplete, documenting the existence of a project but not providing details on the value of financial commitments. Subsequently, interviews were undertaken with World Bank operational staff who had direct engagement in the countries and sectors where the projects had been identified through the media search. Through these interviews it was usually possible to establish whether or not the announced projects were actually going ahead, and in some cases the project’s overall value. This provides a first screening of the newspaper material that serves to increase the level of confidence in the reports. In addition, the project list was also checked against the World Bank’s Debtor Reporting System (DRS) up to 2005, which is based on information provided by borrowing countries on their bilateral debts. In a second round, Chinese press reports were systematically reviewed and all projects identified from both Chinese and international sources were subjected to a validation process using the official Web sites of the relevant Chinese government institutions and state-owned enterprises (Chen 2007a). The Chinese press search was conducted using a powerful Chinese search engine (www.baidu.com), as well as a commercial database, Chinese Journal Web, which consists of different databases such as Chinese Journal Full Article Database (including 7300 types of Chinese journals from 1994) and Important Chinese Newspaper Full Article

10
Database (including 430 types of Chinese newspapers from 2000). Newspapers proved to be more valuable than journals in providing useful and up-to-date information for this study. Chinese newspapers can be divided into two categories: national newspapers, including some industry specific/professional newspapers; and provincial/municipal/ private newspapers with a more local or regional focus.
The next stage was to validate press reports by matching them up against information provided through the Web sites of relevant government institutions and state-owned enterprises. In all cases, the information provided from these sources is official in nature and can be regarded as the most reliable and accurate Chinese source of information. However, in some cases, the data are limited in terms of project coverage and level of detail. First, MOFCOM publishes all foreign aid projects (i.e., grant-funded projects) for bidding among Chinese contractors online. The announcement includes the description of the project and the short list of prequalified bidders. The release of the information is required by law. Second, MOFCOM also has local Economic and Commercial Counselor’s Offices (ECCO) housed within the network of Chinese embassies across Africa. The ECCO normally have well-maintained Web sites reporting local projects with Chinese involvement, and are in close contact with events on the ground. Third, the Ministry of Foreign Affairs as well as the State-Owned Assets Supervision and Administration Commission of the State Council also report project specific information from time to time on their Web sites, especially relating to large projects.
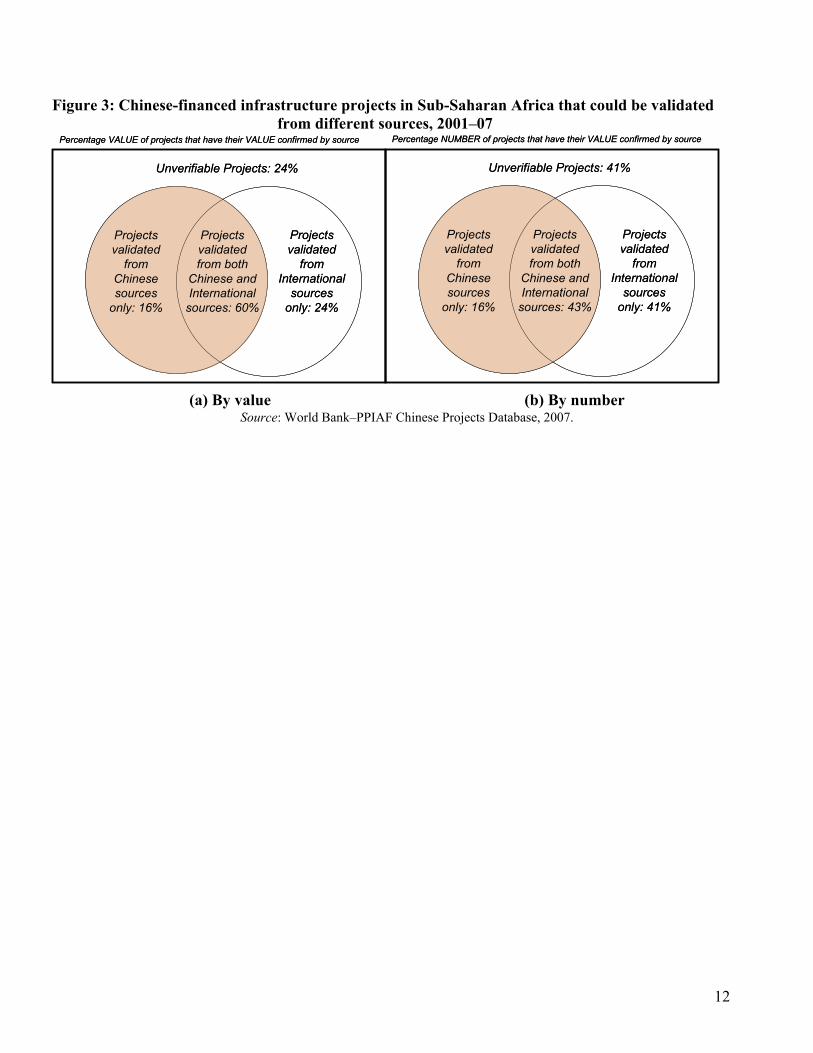
Fourth, as a state policy bank, China Ex-Im Bank reports significant infrastructure projects with concessional loan or export credit backed projects in their annual reports. The final stage was to look at the Web sites of those Chinese contractors that were identified as being active in Africa through the English language media search. Because only a few of these contractors are listed on stock markets, annual reports are normally unavailable. However, some information can be found from material posted on their corporate Web sites. Although this type of information is the least official among the three, it is considered to be usually reliable. Nevertheless, in many cases, none of the sources alone provides the whole picture on a specific project, but instead they can be complementary. For example, the contractor may report the cost of a project, but this can be less than what the African government receives from China; hence the importance of conducting cross-checks between the different Chinese sources cited. To summarize, the different methods of data collection and validation described above can be grouped into two categories. The first is the press reports (both Chinese and international), which provide a general picture of what is happening, but which on their own are of questionable accuracy. The second are the official sources, whether World Bank or Chinese government, which are used to cross-check the accuracy of the project details identified through the press. Figure 3 illustrates the percentage of the full set of investment commitments identified by the Chinese and international press that could be confirmed from different sources. In value terms, it proved possible to verify 76 percent of the financing commitments reported in the press through the various official sources. In

11
numerical terms, however, the percentage of finance commitments cases that could be confirmed is substantially lower, representing only 59 percent of the total number in the original press reports. This finding is not entirely surprising, and simply indicates that it proved harder to verify data on the large tail of small commitments than on the more limited number of large commitments. Given the uncertainty that exists, the study will take a conservative approach and report only on projects reported by the Chinese press, whose values could subsequently be confirmed from official Chinese sources. In value terms, 76 percent of the projects identified could be confirmed by Chinese sources, and the remaining 24 percent by international sources only (see figure 3). About 60 percent of the project overall value identified could be confirmed both by Chinese and international sources.
However, it is important to note that even the signature of an intergovernmental agreement does not guarantee that the project will eventually go ahead, and there have been some important cases of such projects subsequently being questioned or halted. Moreover, the status of projects under agreement but not yet commenced is often subject to frequent changes so that it is difficult to reach a final verdict on the status of these projects. Unfortunately, it is often some of the larger projects that have the greatest uncertainty associated with them, and this can substantially affect the overall totals. The approach taken here, therefore, is to count all projects that have been confirmed as signed in the totals, but to comment in the text
on those projects whose implementation remains in question at the time of writing.
It is important to clarify that all the infrastructure projects captured in the database are projects with official financial assistance and do not constitute FDI.
That is to say that the projects are entirely debt financed typically by the China Ex-Im Bank. There are also some grant projects funded by the Ministry of Commerce. In none of these cases do the enterprises involved put in any of their own equity, which is a key element of the definition of FDI. The only possible area of ambiguity relates to the projects (a) equity-financed by the China Africa Development Fund, established by the China Development Bank as a commercial financing institution (Davies et a., 2008); and (b) financed directly by Chinese state-owned companies, without recourse to official financing sources (although oftentimes availability of such a recourse is plausible but cannot be confirmed). However, these account for only about 5 percent of the values under consideration (see figure 15).
In later sections, the paper also presents some estimates of Chinese funding for natural resource development in Sub-Saharan Africa. These constitute equity flows by Chinese (private and state-owned) corporations and can therefore properly be considered FDI. Finally, all the values reported throughout this paper relate to financing commitments rather than actual disbursements. This is common practice in the reporting of ODA financing.
12
Figure 3: Chinese-financed infrastructure projects in Sub-Saharan Africa that could be validated from different sources, 2001–07
(a) By value (b) By number Source: World Bank–PPIAF Chinese Projects Database, 2007.
Unverifiable Projects: 24%
Projects validated
from Chinese sources
only: 16%
Projects validated
from International
sources only: 24%
Projects validated from both
Chinese and International
sources: 60%
Percentage VALUE of projects that have their VALUE confirmed by source
Unverifiable Projects: 24%
Projects validated
from Chinese sources
only: 16%
Projects validated
from International
sources only: 24%
Projects validated from both
Chinese and International
sources: 60%
Percentage VALUE of projects that have their VALUE confirmed by source
Unverifiable Projects: 41%
Projects validated
from Chinese sources
only: 16%
Projects validated
from International
sources only: 41%
Projects validated from both
Chinese and International
sources: 43%
Percentage NUMBER of projects that have their VALUE confirmed by source
Unverifiable Projects: 41%
Projects validated
from Chinese sources
only: 16%
Projects validated
from International
sources only: 41%
Projects validated from both
Chinese and International
sources: 43%
Percentage NUMBER of projects that have their VALUE confirmed by source

13
4.
THE EMERGENCE OF CHINESE INFRASTRUCTURE FINANCE Based on the methodology described above, this section presents estimates of the total envelope of Chinese official financing commitments for infrastructure projects in Sub-Saharan Africa. More detail is then provided concerning the sectoral and geographic composition of the projects identified.
(a) Headline numbers Applying the methodology described above, it is possible to provide estimates for the total volume of Chinese finance for infrastructure projects in Africa. It is relevant to note that the estimates presented here are well within the upper bound determined through the official statistics on Foreign Economic Cooperation presented above (see table 1).
The findings are that new commitments of Chinese infrastructure finance, which had oscillated around US$500 million per year in the early 2000s, grew substantially after 2003, stepping up to around US$1.3—1.7 billion per year in 2004 and 2005, topping US$7 billion in 2006 (which was the Chinese “Year of Africa”), and tailing back to around US$4.5 billion in 2007 (figure 4). It is interesting to compare these confirmed financing figures with the total envelope reported in the press. This evidently cannot be regarded as an estimate of actual finance, but provides a good barometer of the intensity of deal-making activity. The correspondence between press reports and confirmed estimates is relatively close except for the year 2006,
Figure 4: Estimated value of Chinese infrastructure finance commitments in
Sub-Saharan Africa, 2001–07
0.47
4.50
7.05
0.27 0.62
1.721.34
0
1
2
3
4
5
6
7
8
9
10
2001 2002 2003 2004 2005 2006 2007
Com
mitm
ents
(US
$ bi
llion
s) Chinesesources
Totalpressreports
Source: World Bank–PPIAF Chinese Projects Database, 2007.

14
when a divergence on the order of US$2.3 billion (or 25 percent) opens up between the two (see figure 4). This no doubt reflects the intense coverage of Chinese activities in Africa prompted by high level intergovernmental meetings as part of the Chinese “Year of Africa.” The number of projects has been close to 30 per year in the last few years compared to less than 10 per year in the early 2000s (figure 5a). The number of projects reported in the press has tended to be about 50 percent higher on average. This reflects the existence of a large tail of small projects that could not be readily verified through official sources. The size distribution of the identified infrastructure projects with Chinese finance is skewed toward a large number of relatively small projects of less than US$50 million in value (figure 5b). Nevertheless, there are some half a dozen megaprojects of more than US$1 billion in value, demonstrating the ability of Chinese financing sources to raise very large contributions to individual projects. Overall, at least 35 countries in Sub-Saharan Africa
have benefited from Chinese finance or are actively discussing funding opportunities. The financing values reported above relate only to projects on which some formal agreement has been reached or that are further along in the project pipeline. Status is classified according to one of the following mutually-exclusive categories: “agreed,” “under construction,” “completed” or “under reconsideration.” The “agreed” projects are those for which some kind of formal intergovernmental Memorandum of Understanding has been signed. The projects “under construction” are those for which implementation has already commenced, and the “completed” projects are those that have already been finished. Finally, the “under reconsideration” category refers to projects that have been agreed but are for some reason paralyzed in implementation. Table 2 shows the Chinese finance commitments for all confirmed projects by the year the commitment was made and the status of the project at the end of 2007.
Figure 5: Number and size distribution of Chinese-financed infrastructure projects in Sub-Saharan Africa, 2001-2007
28
7
19
24
12
5
29
0
5
10
15
20
25
30
35
40
45
50
2001 2002 2003 2004 2005 2006 2007
No.
of p
roje
cts
Chinesesources
Totalpressreports
0
5
10
15
20
25
30
35
40
<50 50-100 100-250 250-500 500-1,000 1,000+
US$ millions
Num
ber o
f Pro
ject
s
(a) Estimated number of new projects (b) Project size distribution
Source: World Bank–PPIAF Chinese Projects Database, 2007.

15
Overall, about 35 percent of the projects by value are either completed or under construction, a further 37 percent have been agreed but not yet initiated, and the remaining 28 percent are classified as “under reconsideration”. The latter category relates primarily to some major power and rail projects in Nigeria that are currently being reassessed by that country’s authorities. The projects documented in this report have been largely implemented by Chinese
contractors. Table 3 identifies the 10 largest Chinese project contractors for the official finance projects included in this study, detailing the estimated volume and distribution of their activity. In the power sector, there are numerous significant players including Sinohydro, Gezhouba Group, Shandong, and CATIC. In the transport sector, CCECC, China Guangdong Xinguang and Transtech are the two largest players. In the ICT sector, the key player is the state-owned ZTE.
Table 2: Chinese financing commitments into infrastructure projects in Sub-Saharan Africa,
by year of commitment and status at end of 2007 (US$ millions)
Status at end of 2007 2001 2002 2003 2004 2005 2006 2007 Cumulative
Total 2001-07
Agreed 500 780 1,858 2,787 5,926 Under construction 280 250 400 180 733 487 1,709 4,039 Completed 194 19 224 660 206 200 1,503 Under reconsideration 4,500 4,500 Total 474 269 624 1,340 1,720 7,045 4,496 15,968
Source: World Bank–PPIAF Chinese Projects Database, 2007.
Table 3: Top 10 Chinese infrastructure project contractors active in Sub-Saharan Africa, 2001-07
Total value (US$m) Sectors Major Countries
China Civil Engineering Construction Company (CCECC) 2,500 Transport Nigeria
China Hydraulic and Hydroelectric Construction Group Corp. (Sinohydro Corp.) 2,242 Electricity
DRC, Congo, Rep.; Ghana; Guinea; Sudan;
Togo
Zhong Xing Telecommunication Equipment Company Limited (ZTE) 2,101 Telecom
Angola; CAR; DRC; Cote d'Ivoire; Ethiopia; Ghana; Kenya; Lesotho; Mali; Mauritania; Niger;
Nigeria; Sudan China Geo-Engineering Corporation (CGC) 1,024 Electricity,Water Cameroon; Nigeria
China Guangdong Xinguang International Group 1,000 Transport Nigeria China Gezhouba Group Corporation (CGGC) 1,000 Electricity Nigeria
China National Machinery & Equipment Import & Export Corp. (CMEC) 721
Electricity, Transport, Telecom
Angola; Congo, Rep.; Ethiopia; Nigeria; Sudan; Senegal;
Zimbabwe Transtech Engineering Corporation 620 Transport Mauritania
Shandong Electric Power Constr. Corp. 512 Electricity Sudan China National Aero-Technology Import & Export Co. (CATIC) 500 Electricity Zimbabwe
Note: Total value is the sum of the project total Chinese financing commitments for all the projects the contractor is involved with.
Source: World Bank–PPIAF China Projects Database, 2007.

16
(b) Sector by sector view
Regarding the sectoral distribution of confirmed financing commitments, the share of about 14 percent went to “general” infrastructure projects without any clearly identified sectoral allocation, including the US$2 billion line of credit earmarked for multiple infrastructure projects in 2007. Of the remaining financing commitments, about 33 percent went to electricity, 33 percent to transport, and 17 percent to telecom. Therefore, it appears safe to say that most of China’s activities were divided fairly evenly among two main sectors: power (especially hydropower), and transport (especially railroads), followed by ICT sector (mainly equipment supply). Water projects attracted the least amount of activity. A more extensive profile of Chinese funded projects in each of the major infrastructure sectors is provided below. In addition, the sectoral tables in Annex 3 provide details of the individual projects recorded in each sector.
Power The sector attracting the largest amount of Chinese financing has been the power sector with more than US$5.3 billion in cumulative commitments at present. Much of this effort has been concentrated in hydroelectric schemes. As of the end of 2007, the Chinese were involved in financing 10 major dams in 9 different African countries. The total cost of these projects is estimated to be more than US$5 billion, of which the Chinese were financing over US$3.3 billion. The combined generating capacity of these plants amounts to more than 6,000 MW of electricity, a significant fraction of the 17,000 MW of hydropower generating capacity that exists today in Africa. Indeed, four of these
projects will more than double the total electricity generating capacity within the host countries where they are located. The largest hydropower project on this list is the 2,600-MW Mambilla scheme in Nigeria, implementation of which is now uncertain. The second largest is the 1,250-MW Merowe dam in Sudan, already at an advanced stage of construction. In Zambia, too, more than 1,000 MW of hydro-power capacity is being developed between the Kafue Lower Gorge and Kariba North projects. In 2006 the China Ex-Im Bank expressed an interest in financing Mphanda Nkuwa dam on the Zambezi river in Mozambique. In September 2007, the six-year 1,200 MW project with estimated cost of US$2.3–3.2 billion was awarded to the Brazilian operator Camargo Correa and partners who have yet to choose the project’s financiers. Natural resources are being used to secure some of the financing. The Congo River Dam in the Republic of Congo and Bui Dam in Ghana, which are currently under construction, are being financed by the China Ex-Im Bank loans backed by guarantees of crude oil in case of the Congo River Dam, and cocoa, in case of Bui Dam. The loan for the Souapiti Dam in Guinea will be linked to mining (Bauxite) revenues. Finally, the Poubara hydropower dam in Gabon is to be built by Sinohydro as part of the US$ 3 billion Belinga Iron Ore project; however, the amount of Chinese financing committed into the project is not known.

17
Figure 6: Confirmed Chinese infrastructure finance commitments in Sub-Saharan Africa by sector, 2001–07
33.4%
33.2%
14.0%
17.4%
2.0%
Electricity
Transport
ICT
General
Water
Source: World Bank–PPIAF Chinese Projects Database, 2007. Outside of hydropower, China has also been active in building thermal power stations, the most significant of which have been in Sudan and Nigeria. In 2005, the Shandong Electric Power Construction Corp. agreed to build three separate thermal power stations in Sudan: a 500 MW coal fired power plant in Port Sudan, a 300 MW gas fired power plant in Al-Fūlah and a 320 MW gas fired power plant in Rabak. Earlier, the Harbin Power Equipment Company had agreed to build the E1-Gaili Combined Cycle Power Plant. In Nigeria, the federal government is constructing, with the help of credit line from China Ex-Im Bank, three gas-fired power stations: Papalanto (335 MW) in Ogun state developed by Chinese group Sepco, Omotosho (335 MW) in Ondo, developed by China National Machinery & Equipment Import & Export Corp. (CMEC), and Geregu (138 MW) in Kogi state developed by Siemens. Other than electricity generation, Chinese companies CMEC and China Machine-Building International Corporation (CMIC)
have occasionally gotten involved in electricity transmission through major projects in Tanzania and Luanda (Angola), respectively. Thus, at present, China’s central focus is on the construction of large hydropower projects. Given the current power supply crisis in Africa, and the fact that the region has barely developed 5 percent of its identified hydro potential, these schemes are critical for Africa’s economic development. In that sense, the emergence of China as a major financier of hydro schemes is a trend of great strategic importance for the African power sector.
Rail As stated above (see box 1), China began its foray into Africa in large part through the construction of the Tanzania-Zambia railway in the 1970s. In 2001, China pledged continued financial support for the railway, however, it was not possible to confirm whether this lead to any definitive agreements.

18
In recent years, China has made a major comeback in the African rail sector, with financing commitments on the order of US$4 billion for this sector. They include rehabilitation of more than 1,350 kilometers of existing railway lines and the construction of more than 1,600 kilometers of new railroad. To put this in perspective, the entire African railroad network amounts to around 50,000 kilometers. The largest deals have been in Nigeria, Gabon, and Mauritania. In Nigeria, the Chinese have committed to financing a construction of the Abuja Rail Mass Transit System; and to rehabilitation of 1315 kilometers of the Lagos-Kano line under the first phase of Nigeria railway modernization program. The total cost of the Lagos-Kano rail project is estimated to be US$8.3 billion, of which the Chinese were to cover US$2.5 billion through a line of credit part of which would be also be allocated for supporting power projects. However, these rail projects agreed under an earlier administration are currently under review by the Nigerian authorities and their final status is therefore unclear. China Ex-Im Bank is also preparing to finance the 560-km Belinga-Santa Clara railway in Gabon, which, together with Poubara hydropower dam, and deepwater port at Santa Clara, is part of the already mentioned Belinga Iron Ore project. The China Ex-Im Bank’s loan for the project is to be repaid via sales of iron ore to China. The most recent railways project was the commitment to finance a 430-km railroad linking Nouakchott to phosphate-rich Bofal in Mauritania, which was agreed upon in 2007. The project is financed by a US$ 620 million China Ex-Im Bank loan and will be implemented by Chinese Transtech Engineering Corporation
Roads The Chinese have been active in building roads across Africa. The database has recorded more than 18 projects involving Chinese commitments for construction and rehabilitation of more than 1,400 kilometers of road. However the aggregate value of finance for confirmed projects at around US$550 million is substantially below that reported for the other sectors. The road projects that Chinese firms have undertaken have been relatively small compared to average project sizes in other sectors, and many of them are financed by grants from the Ministry of Commerce. Indeed, the database recorded only two road projects financed by Chinese sources were larger than US$100 million in size, both of which were in Angola and part of the Ex-Im Bank line of credit provided in 2004. Road building has been an especially important activity in Ethiopia and Botswana. By far the most active Chinese road construction firm was the China Road and Bridge Corporation (CRBC). Information and Communication Technology The ICT sector attracted a cumulative total of almost US$3 billion of finance in 2001-07.. China’s involvement in the ICT sector in Africa mainly takes the form of equipment sales. In some cases, this involves normal commercial contacts between Chinese manufacturers and public and private operators in Africa. However, in some cases, it entails inter-governmental financing tied to purchases of Chinese equipment by state-owned telecom incumbents. While international attention has tended to focus on Africa’s new private operators such as Vodacom, MTN and Celtel, Chinese firms are emerging as key players in the supply of technology and equipment for networks typically to national telecom incumbents. By far the largest ICT project has been in Ethiopia (US$1.5 billion), which involved the

19
rollout of national communication backbones and associated rollout of mobile coverage in rural areas. The four-year project, which was initially agreed upon in 2006, was to be undertaken by ZTE, Huawei, and Chinese International Telecommunication Construction Corporation (CITCC). It was expected that if completed, the project will more than double the country’s optical fiber deployment, more than triple mobile network expansion capacity, double rural telecom coverage, and quadruple the length of the fixed telephone network. In 2007, ZTE commenced construction of the fist two phases of the project. The three most active Chinese telecom equipment supply firms were state-owned ZTE Corp, privately held Huawei, and the mixed private-public 50-50 French-Chinese joint venture Alcatel Shanghai Bell. In most of the cases recorded by the database the state-owned Chinese banks directly provided the funds for the equipment to the host government. In some cases, ZTE was able to finance its deals through standing line of credit with China Ex-Im Bank of US$500 million, issued in 2004. Similarly, Huawei was granted US$600 million export seller’s credit from China Ex-Im bank, as well as US$10 billion in credit financing from the China Development Bank, both in 2004. It is important to stress that these lines of credit were given to the contractor firms for their worldwide operations. A salient example of China’s ICT projects is the National Communication Backbone Infrastructural Project in Ghana, agreed to in June of 2006, whereby the China Ex-Im Bank is financing US$31 million of a US$70 million project initiated by the Ministry of Communications through a concessional loan. The project is aimed at rehabilitating and
expanding fixed line communications technology in the country.
Water and sanitation Water and sanitation account for a relatively small share of China’s total financial commitments to African infrastructure development. Participation in confirmed projects was about US$120 million, and another estimated US$200 million went into Angola’s water sector as part of the China Ex-Im Bank credit line of 2004. Most of these projects were smaller scale in nature and more focused on meeting immediate social needs. China’s water supply projects include a number of smaller dams that are not related to hydropower but directly to water supply, in Cape Verde and Mozambique.
(c) Country by country view The projects database records cases of Chinese infrastructure finance in more than 35 countries across Sub-Saharan Africa. Nevertheless, despite this broad reach in practice there is a heavy geographic concentration of finance. Four countries—Nigeria, Angola, Ethiopia, and Sudan—together account for about 70 percent of Chinese financing commitments, and Nigeria alone for nearly 30 percent (figure 7). Three other countries—Guinea, Ghana, and Mauritania,—have received sizable volumes, on the order of US$0.8—1.0 billion each.
A more extensive profile of the Chinese portfolio of infrastructure projects in each of the four largest recipient countries is provided below. In addition, the country tables in Annex 4 provide details of the individual projects recorded in each country.

20
Figure 7: Confirmed Chinese infrastructure finance commitments in
Sub-Saharan Africa by country, 2001–07
34%
20%10%
8%
28% Nigeria
Angola
Ethiopia
Sudan
Others
Source: World Bank–PPIAF Chinese Projects Database, 2007.
Nigeria China’s engagement in Nigeria amounts to total financing commitments of US$5.4 billion. The initiation of activities dates back to 2002 with the agreement on the first phase of the National Rural Telephony Project (NRPT), when China’s two telecom giants ZTE and Huawei began actively pursuing equipment supply and network rollout projects for both fixed and wireless services in the country. Nigeria’s first loan from the China Ex-Im Bank came in 2005 to support construction of power stations at Papalanto (335 MW), Omotosho (335 MW), and Geregu (138 MW) in Ogun, Ondo,and Kogi states. The construction of Papalanto plant, financing commitments to which we were able to confirm via Chinese sources, was undertaken by Sepco of China while the China Ex-Im Bank agreed to finance US$300 million of the estimated US$400 million construction costs. The deal was oil-backed such that in return CNPC (or PetroChina, which is CNPC’s listed arm) secured a deal to purchase 30,000 barrels of crude oil a day from the Nigerian National
Petroleum Corporation (NNPC) for a period of one year, renewable. In 2006, there was a substantial scale-up in China Ex-Im Bank financing with almost US$5 billion of projects agreed. These included contributions of US$2.5 billion to a major Lagos-Kano railway upgrading project, contribution of US$1 billion to Abuja Rail Mass Transit project, which involves the construction of a high speed rail link between Lagos and Abuja, as well as a light railway system connecting Murtala Mohammed International Airport and Nmandi Azikwe International Airport with the Lagos and Abuja city centers respectively, and a contribution of US$1 billion to the 2,600-MW Mambilla Hydropower project. Following the change of administration in Nigeria, the major rail and power projects are under review by the authorities, and it is not yet clear whether they will go forward.
Angola China’s involvement in infrastructure finance in Angola began in 2002 – following the conclusion of the civil war – with a series of
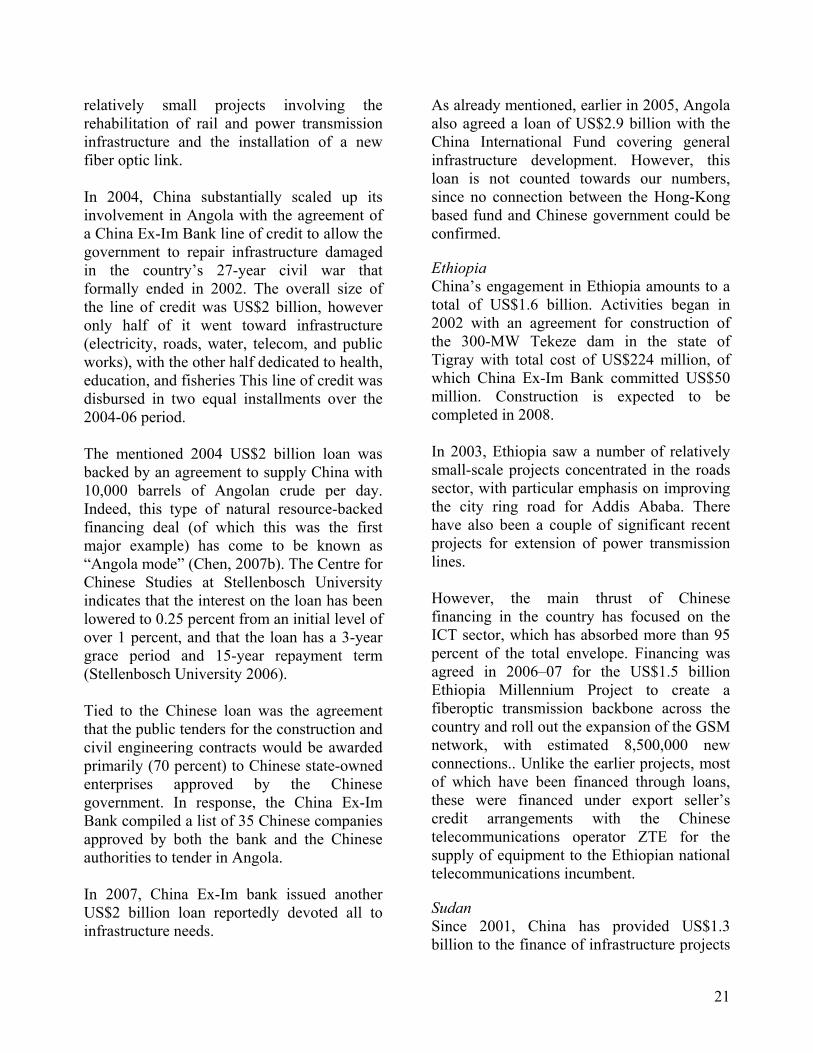
21
relatively small projects involving the rehabilitation of rail and power transmission infrastructure and the installation of a new fiber optic link. In 2004, China substantially scaled up its involvement in Angola with the agreement of a China Ex-Im Bank line of credit to allow the government to repair infrastructure damaged in the country’s 27-year civil war that formally ended in 2002. The overall size of the line of credit was US$2 billion, however only half of it went toward infrastructure (electricity, roads, water, telecom, and public works), with the other half dedicated to health, education, and fisheries This line of credit was disbursed in two equal installments over the 2004-06 period. The mentioned 2004 US$2 billion loan was backed by an agreement to supply China with 10,000 barrels of Angolan crude per day. Indeed, this type of natural resource-backed financing deal (of which this was the first major example) has come to be known as “Angola mode” (Chen, 2007b). The Centre for Chinese Studies at Stellenbosch University indicates that the interest on the loan has been lowered to 0.25 percent from an initial level of over 1 percent, and that the loan has a 3-year grace period and 15-year repayment term (Stellenbosch University 2006). Tied to the Chinese loan was the agreement that the public tenders for the construction and civil engineering contracts would be awarded primarily (70 percent) to Chinese state-owned enterprises approved by the Chinese government. In response, the China Ex-Im Bank compiled a list of 35 Chinese companies approved by both the bank and the Chinese authorities to tender in Angola. In 2007, China Ex-Im bank issued another US$2 billion loan reportedly devoted all to infrastructure needs.
As already mentioned, earlier in 2005, Angola also agreed a loan of US$2.9 billion with the China International Fund covering general infrastructure development. However, this loan is not counted towards our numbers, since no connection between the Hong-Kong based fund and Chinese government could be confirmed.
Ethiopia China’s engagement in Ethiopia amounts to a total of US$1.6 billion. Activities began in 2002 with an agreement for construction of the 300-MW Tekeze dam in the state of Tigray with total cost of US$224 million, of which China Ex-Im Bank committed US$50 million. Construction is expected to be completed in 2008. In 2003, Ethiopia saw a number of relatively small-scale projects concentrated in the roads sector, with particular emphasis on improving the city ring road for Addis Ababa. There have also been a couple of significant recent projects for extension of power transmission lines. However, the main thrust of Chinese financing in the country has focused on the ICT sector, which has absorbed more than 95 percent of the total envelope. Financing was agreed in 2006–07 for the US$1.5 billion Ethiopia Millennium Project to create a fiberoptic transmission backbone across the country and roll out the expansion of the GSM network, with estimated 8,500,000 new connections.. Unlike the earlier projects, most of which have been financed through loans, these were financed under export seller’s credit arrangements with the Chinese telecommunications operator ZTE for the supply of equipment to the Ethiopian national telecommunications incumbent.
Sudan Since 2001, China has provided US$1.3 billion to the finance of infrastructure projects

22
in Sudan. The early infrastructure projects were all related to the power sector, beginning with construction of the El Gaili Combined Cycle Power Plant in 2001, and the Qarre I thermal station in 2002 (financing for which however was not confirmed by Chinese sources). China later financed three substantial thermal generation projects for coal-fired and gas-fired station in Port Sudan, Al-Fulah, and Rabak. Thus, a total of more than 2,200 MW of new thermal generating capacity are being added with Chinese support.
By far the highest-profile power sector project is the ongoing construction of the 1,250 MW Merowe dam that began in early 2004. This massive US$1.2 billion hydropower project was the largest international project that China had ever participated in at the time the contracts were signed (although it has now been superseded by the Mambilla hydropower project in Nigeria, which will be more than
twice the size). Financers of the project included the China Ex-Im Bank (US$400 million), the Saudi Fund (US$150 million), BADEA (US$100 million), the Kuwait Fund for Arab Economic Development (US$100 million), and the Abu Dhabi Fund (US$100 million). Chinese company Sinohydro was involved in the construction of the plant, while, Harbin Power Engineering Company and Jilin Province Transmission and Substation Project Company took over the construction of the 1,776 kilometers of transmission lines within the same project. The government in Khartoum announced that part of the benefits of this dam would be a major increase in the country's electrification rate following much needed investments in distribution. The project has entailed the resettlement of 55,000 to 70,000 residents away from the fertile agricultural areas surrounding the River Nile.

23
5.
ECONOMIC COMPLEMENTARITIES BETWEEN CHINA AND SUB-SAHARAN AFRICA The growing economic ties between China and Africa, including China’s emerging role as a major financier of infrastructure in the region, can be understood in terms of the evident economic complementarities that exist between the two parties (table 4). On the one hand, Africa counts among its development challenges a major infrastructure deficit, with investment needs estimated to be on the order of US$22 billion per annum and an associated financing gap on the order of US$10 billion per annum. China has developed one of the world’s largest and most competitive construction industries, with particular expertise in the civil works critical for infrastructure development. On the other hand, China’s fast-growing manufacturing economy is generating major demands for oil and mineral inputs that have rapidly outstripped the country’s own domestic resources. Even before China’s entry into the market, Africa was a major natural resource exporter, with substantial unrealized potential that is attributable (at least in part) to
infrastructure bottlenecks that constrain the development of those resources.
(a) The infrastructure side Sub-Saharan Africa currently lags behind other developing regions on most standard indicators of infrastructure development (table 5). This finding holds across a wide range of indicators including road density, paved road density, electricity generation capacity per capita, and household access to electricity, water, and sanitation. By far the largest gaps arise in the power sector, with generation capacity and household access in Africa at around half the levels observed in South Asia, and about a third of the levels observed in East Asia and Pacific. The story is somewhat different for the ICT sector, where Africa significantly outperforms South Asia in both mobile and internet density and comes relatively close in terms of fixed-line density, although the deficit relative to other regions remains large.
Table 4: Economic complementarities between China and Sub-Saharan Africa Infrastructure Resources
Africa Africa has a major infrastructure deficit,
with unmet investment needs ≈US$10 billion per year
Africa is a major exporter of natural resources, with infrastructure bottlenecks preventing full realization
of its potential
China China has a large, globally competitive construction industry.
China’s manufacturing-based economy creates high demand for natural resource inputs, beyond those
domestically available

24
Table 5: Indicators of infrastructure development in Sub-Saharan Africa and other developing regions
Indicator Sub-Saharan
Africa South Asia
East Asia and
Pacific
Europe and
Central Asia
Latin America
and Caribbean
Middle East and North
Africa Transport • Paved road density
49 149 59 335 418 482
• Total road density
152 306 237 576 740 599
ICT • Mainline teledensity
33 39 90 261 197 100
• Mobile teledensity
101 86 208 489 350 224
• Internet density
3 2 7 16 14 10
Power • Generation capacity
70 154 231 970 464 496
• Electricity access
18 44 57 — 79 88
Water and Sanitation
• Improved water
63 72 75 87 90 85
• Improved sanitation
35 48 60 78 77 77
Source: Yepes et al., 2007. Note: Data corresponds to the most recent year available for the quinquennium 2000/05. Road densities measured in kilometers per thousand square kilometers; teledensities measured in subscribers per thousand population; generation capacity measured in megawatts per million population; access to electricity and to improved water and sanitation measured in percentage of households. — = not available.
Furthermore, Africa’s limited infrastructure services tend to be much more costly than those available in other regions. Road freight tariffs in Africa are two-four times as high per kilometer as those in the United States, and travel times along key export corridors are two-three times as high as those found in Asia. The average effective cost of electricity to manufacturing enterprises in Africa is close to US$0.20 per kilowatt-hour, or around four times as high as industrial rates elsewhere in the world. This reflects both high cost utility power (costing around US$0.10 per kilowatt-hour), and heavy reliance on emergency back-up generation during frequent power outages
(costing around US$0.40 per kilowatt-hour). Telecommunications costs have been falling substantially in recent years, but are still high relative to other developing regions. Mobile and internet telephone charges in Africa are about four times as high as those found in South Asia, and international call prices are more than twice as high. Inadequate infrastructure stocks are contributing to Africa’s poor performance in terms of economic growth. A recent study by Esfahani and Ramirez (2003) estimates that if Africa had shared East Asia’s growth rate in terms of telephones per capita (10 percent

25
versus 5 percent) and electricity generation (6 percent versus 2 percent), its economic growth rate would have been 0.9 percent higher than it was. These results are confirmed although with a very different methodology by Calderon and Serven (2004) for a large sample that includes 20 African countries. Using the methodology developed by Calderon and Serven, Estache (2005) finds
that, on average, if Africa had enjoyed Korea’s quantity and quality of infrastructure, it would have grown by 1.04 percent per capita more. Many similar estimates are available in the literature, all of which confirm the strong growth payoff from investing in infrastructure.
Deficient infrastructure inflates indirect production costs reducing the competitiveness of exports. In spite of low labor costs, Sub-Saharan firms have very low participation in export markets. One of the reasons for this lies in high indirect costs. In the case of strong export performers, indirect costs tend to absorb no more than 10-12 percent of total production costs. By contrast, in Sub-Saharan Africa, indirect costs can be as high as 20-30 percent of total production costs. Analysis shows that more than half of these indirect costs are infrastructure related, with 31 percent relating to transport and 19 percent relating to power alone. Surveys indicate that deficient infrastructure is one of the key obstacles to doing business, and a key impediment to Foreign Direct Investment. Emerging evidence from Investment Climate Assessments indicates that a high percentage of businesses in Sub-Saharan Africa identify deficient infrastructure as one of the major obstacles to the operation and growth of their enterprises. The specific figures are 48 percent for electricity, 25 percent for transportation and 22 percent for telecommunication; this can be compared with 40 percent that considered
corruption to be a major obstacle to doing business. In Nigeria, for example, as many as 97 percent of firms listed infrastructure as one of the top three constraints to their operations. Recent studies also show that countries with larger infrastructure stocks tend to be more successful at attracting FDI. A particular problem is the unreliability of power supply, which has major economic consequences for firms. Reliability of infrastructure services in Sub-Saharan Africa is substantially worse than elsewhere in the developing world, particularly in the case of power supply (table 6). Firms in Sub-Saharan Africa face delays two to three times as long as their peers in obtaining connections to electricity or telephony services, and suffer two to three times as many days per year of outages. Indeed, power cuts occur on one in every four days of the year, leading to economic losses on the order of 6 percent of turnover, and prompting around half of all firms to invest in their own high-cost independent generating facilities. As a result, the typical weighted average cost of power faced by manufacturing firms (considering both own generation and grid purchases) amounts to around US$0.17 per kilowatt-hour.

26
Table 6: Impact of unreliable infrastructure services on the productive sector Sub-Saharan Africa Other developing
regions Electricity
• Delay in obtaining electricity connection (days) 79.9 27.5 • Electrical outages (days/year) 90.9 28.7 • Value of lost output due to electrical outages (% of turnover) 6.1 4.4 • Firms maintaining own generation equipment (% of total) 47.5 31.8
Telecom • Delay in obtaining telephone line (days) 96.6 43.0 • Telephone outages (days/year) 28.1 9.1
Source: World Bank Investment Climate Assessments from the period 2000/05. Note: Data for Sub-Saharan Africa are based on evidence from 6 countries and those for other developing regions from 55 countries.
Table 7: Estimated annual infrastructure investment and maintenance needs to meet Millennium Development Goals in Sub-Saharan Africa, 2005–15
(US$ millions) Electricity Telecom Transport WSS Total Investment 5,200 3,000 9,500 4,300 22,000 Operation and maintenance 3,100 2,200 8,300 3,500 17,000 Total 8,200 5,200 17,800 7,800 39,000
Source: Estache, 2005. Closing Africa’s infrastructure deficit will require substantial levels of sustained finance for infrastructure in the region. Infrastructure investment needs for Sub-Saharan Africa have been estimated as at least 5 percent of the region’s GDP, plus a further 4 percent of regional GDP to cover operation and maintenance. In absolute terms, this amounts to a total of US$22 billion per year of investment needs, and a further US$17 billion for maintenance (table 7). The largest investment needs are in the transport sector (US$9.5 billion or 43 percent of the total), followed by electricity (US$5.2 billion or 23 percent of the total), and water and sanitation (US$4.3 billion or 20 percent of the total). These estimates of investment needs are based on research by World Bank staff, which also provided the underlying basis for similar estimates presented in the 2005 Report of the Commission for Africa. The corresponding absolute annual investment requirement of US$22 billion implies a virtual doubling of current investment levels. In
addition, a further US$17 billion would be needed for operation and maintenance of infrastructure, amounting to an overall expenditure requirement of US$40 billion per year.7 Comparing estimated needs of US$22 billion with estimated historical levels in infrastructure of around US$10-12 billion, suggests a financing gap of at least US$10 billion. Whereas Africa shows a particularly strong unmet demand for infrastructure and for infrastructure finance, China has accumulated very substantial financial reserves and has become a leading global supplier of construction services, with particular expertise in the civil works critical for infrastructure development (Chen et al. 2007). Since 1999, China’s construction sector has seen annual growth of 20 percent, making China the largest construction market in the global economy (Stellenbosch University, 2006). By the end of 2004, the total value of China’s
7 Estache, A., 2005 op. cit.
27
overseas engineering projects totaled US$156.3 billion, with a sizable share of this value stemming from infrastructure projects. This has been the outcome of China’s “Going Global” strategy initiated in the 1990s with the aim of increasing the international experience of Chinese firms. One way of gauging the international competitiveness of the Chinese construction industry is to look at the performance of Chinese firms under open tenders. Multilateral agencies, such as the African Development Bank and the World Bank, require unrestricted International Competitive Bidding to take place on all significant contracts that they finance. The procurement data from these agencies is publicly available and can be used to calculate the share of contract value going to Chinese firms bidding for projects in different segments of the market. This in turn provides an objective indication of the competitiveness of Chinese construction firms. In the case of the World Bank, it was possible to establish that since 1999 Chinese contractors have been winning a significant share (10-20 percent) of African infrastructure contracts awarded by the International Development Association. The accumulated contract value won by Chinese contractors was US$738 million over the period 2001–06. While substantial, this figure is much lower than the value of Chinese commitments to infrastructure finance over the same period, which are estimated at more than US$12 billion. Looking at more recent data from both the World Bank and the African Development Bank, it is evident that the success of Chinese firms has been largely confined to the area of civil works. The presence of Chinese firms is almost nonexistent in the area of consulting services, and minimal in the area of equipment supply where they capture a mere 3 percent of
the market. However, in the area of civil works Chinese firms accounted for 31 percent of total contract value over the period of 2004–06.8 With the exception of France, which has been winning around 12 percent of World Bank civil works contracts, no other country has won more than a 5 percent share (figure 8). These figures illustrate the competitiveness of Chinese contractors in this market. The World Bank procurement data also provides (partial) information on the nationality of the second most highly ranked bidder for each contract. This shows that in as many as 20 percent of the total number of contracts won by Chinese firms, the second most highly ranked bidder is also a Chinese firm. Chinese firms have tended to capture the larger civil works contracts. The average size of a civil works contract awarded to a Chinese contractor was US$6 million in the case of the African Development Fund window of the African Development Bank and US$11 million in the case of the International Development Association arm of the World Bank, compared to more typical contract values of US$3–4 million.
8 The limited procurement data available from bilateral agencies suggest that the share of contracts going to Chinese firms is substantially lower than for multilaterals. In the case of Germany’s KfW, for example, Chinese contractors account for only 5 percent of civil works contract values for infrastructure in Sub-Saharan Africa over the last five years. Similarly, France’s AFD reports less than US$10 million of Chinese contracts over the last three years.

28
Figure 8: Percentage value of multilateral civil works contracts in Sub-Saharan Africa captured by foreign contractors’ according
to their country of origin, 2004–06
-5
101520253035
China
France
India
Spain
Malays
ia
United Stat
es
Belgium
Tanza
nia
German
yIta
ly
Per
cent
age
of to
tal v
alue
WBAfDB
Source: African Development Bank and World Bank procurement data, 2004–06.
Within the civil works field, Chinese contractors have been particularly successful winning contracts in the transport (mainly roads) and water sectors – where they captured respectively 38 percent and 32 percent of tenders awarded – compared to only 7 percent in power and none at all in ICT (figure 9a). Again, the sector shares are highly consistent across the African Development Bank and the World Bank. It is striking that the sectoral composition of Chinese funded civil works contracts is completely different; water and roads account for only a small share of this activity, whereas hydro-power, rail and ICT are much more substantial. One explanation for this is that OECD donors have not devoted significant resources to either
hydropower or rail development in recent years. Overall, about 70 percent of the value of contracts won by Chinese firms under multilateral projects was accounted for by just four countries: Ethiopia, Mozambique, Tanzania, and the Democratic Republic of Congo. Once again, this is quite different from the geographic spread under Chinese funded projects, where more than 55 percent of the contract value is accounted for by Angola, Sudan, and Nigeria. This indicates that Chinese contractors have significant presence and experience in a number of countries that have not yet featured prominently in Chinese financing deals.

29
Figure 9: Sectoral and geographic distribution of multilateral civil works contracts in Sub-Saharan Africa awarded to Chinese contractors, 2005–06
85%
13%
2%0%
Transportation
Water & Sanitation
Energy & Mining
Information &Communication
31%
16%
13%
12%
7%
5%
16%
EthiopiaMozambiqueTanzaniaCongo, DRCZambiaUgandaOthers
Source: African Development Bank and World Bank Procurement Data 2005–06. (a) Sectoral distribution (b) Geographic distribution
In summary, the overall picture that emerges is one of a highly successful Chinese contracting sector developing a pre-eminent position in internationally competitive civil works contracts for transport and water projects tendered by multilateral agencies in Sub-Saharan Africa. The emergence of Chinese contractors long predates the expansion of Chinese finance for African infrastructure, and may have served as a training ground for the Chinese construction sector in Africa. Nevertheless, the total value of multilateral contracts secured by Chinese firms over this period remains much lower that more recent deals based on Chinese finance. What is particularly striking is the contrasting nature of the Chinese contract portfolio based on multilateral finance, versus that based on Chinese finance. Activity funded by multilaterals is focused on roads and water projects in Eastern and Southern Africa. Activity funded by China is focused on hydropower and railways in countries such as Angola, Nigeria, and Sudan.
(b) The natural resource side Sub-Saharan Africa’s natural resource exports to China have grown exponentially from just over US$3 billion in 2001 to US$22 billion in 2006. Petroleum accounts for 80 percent of total exports by value over 2002-06 period. The next most important commodities are iron ore and timber (each of which represents 5 percent of total exports), followed by manganese, cobalt, copper, and chromium (each of which represents around 0.5-1 percent of total exports over the same period). Nevertheless, the bulk of Africa’s oil exports continue to go to OECD countries. Over 2001-06 period, 40 percent of Africa’s oil production was exported to the United States, a further 17 percent to Europe and a further 14 percent to China (figure 10a). China has greater weight as a minerals trading partner, accounting for around 60 percent of Africa’s exports of cobalt, 40 percent of its exports of iron, and between 25-30 percent of its exports

30
of chromium, copper, and manganese. China also accounts for 30 percent of the region’s timber exports (figure 10b). With exception of iron, the Chinese share in Sub-Saharan Africa
exports was increasing at a faster rate for minerals and timber than for oil, over 2001-06 period (figure 10c).
Figure 10: Trends in Sub-Saharan African share exports of selected natural resources
going to China and other major trading partner, 2001-2006 % of total
0
10
20
30
40
50
60
70
80
2001 2002 2003 2004 2005 2006
Shar
e in
SSA
Clo
bal E
xpor
ts
UnitedStates
EuropeanUnion
China
% of total
0
25
50
75
100
Cobalt ore Iron ore Chromiumore
Copper ore Timber Manganeseore
Shar
e in
SSA
Exp
orts
UnitedStates
EuropeanUnion
China
(a) Crude oil and petroleum exports (b) Timber and mineral exports
Oil
Cobalt
Manganese IronCopper
Chromium
Timber
0
10
20
30
40
50
60
70
80
2001 2002 2003 2004 2005 2006 (c) Dynamics of the Chinese share in total SSA exports
Source: COMTRADE database by the UNSD, data obtained using WITS software

31
As Sub-Saharan Africa’s natural resource exports to China have grown, China’s relative dependence on Sub-Saharan Africa as a supplier of natural resources has also increased (though at a much slower pace). This trend is best illustrated by statistics from the petroleum sector. China currently imports around one half of its oil requirements. Africa’s share of China’s total oil imports has been rising steadily from less than 23 percent in 2001 to 29 percent in 2006 (figure 11a). As a result, Sub-Saharan Africa is second only to the Middle East and North Africa in terms of its importance as a supplier of oil imports to China (figure 12a). Within Sub-Saharan Africa, Angola is by far the largest supplier, accounting for 50 percent of Sub-Saharan Africa’s oil exports to China over 2001-2006 period (figure 12b). The next most important players are Sudan (18 percent), Republic of Congo (13 percent) and Equatorial Guinea (11 percent). From the perspective of the Sub-Saharan African oil producers, China is also a
very important client whose imports account for 53 percent of the oil exports of Sudan, and 30 percent of the oil exports of Angola, over 2001-2006 period. It is interesting that Nigeria does not feature prominently in Sino-African petroleum trade, although this may be set to change given the volume of recent petroleum deals reported below. In the case of minerals, China is almost exclusively reliant on Sub-Saharan Africa for its cobalt imports, and significantly reliant for manganese (the latter primarily from Gabon, South Africa and Ghana). Sub-Saharan Africa is also an important supplier of timber (mainly from Gabon, Republic of Congo, and Cameroon) and chromium (mainly from South Africa, Madagascar, and Sudan), accounting for around one-seventh of China’s global imports each. However, with respect to China’s imports of iron and copper, Sub-Saharan Africa is still a relatively small (but growing) contributor (figure 11b).
Figure 11: Sub-Saharan African share of China’s imports of selected natural resources, 2001-2006
% of total
0
5
10
15
20
25
30
2001 2002 2003 2004 2005 2006
SSA
Sha
re in
Chi
na's
Impo
rts
% of total
0
20
40
60
80
100
Cobalt ore Manganeseore
Timber Chromiumore
Iron ore Copper ore
SSA
shar
e in
Chi
na's
Impo
rts
(a) Crude oil and petroleum imports (b) Timber and mineral imports
Source: COMTRADE database by the UNSD, data obtained using WITS software.
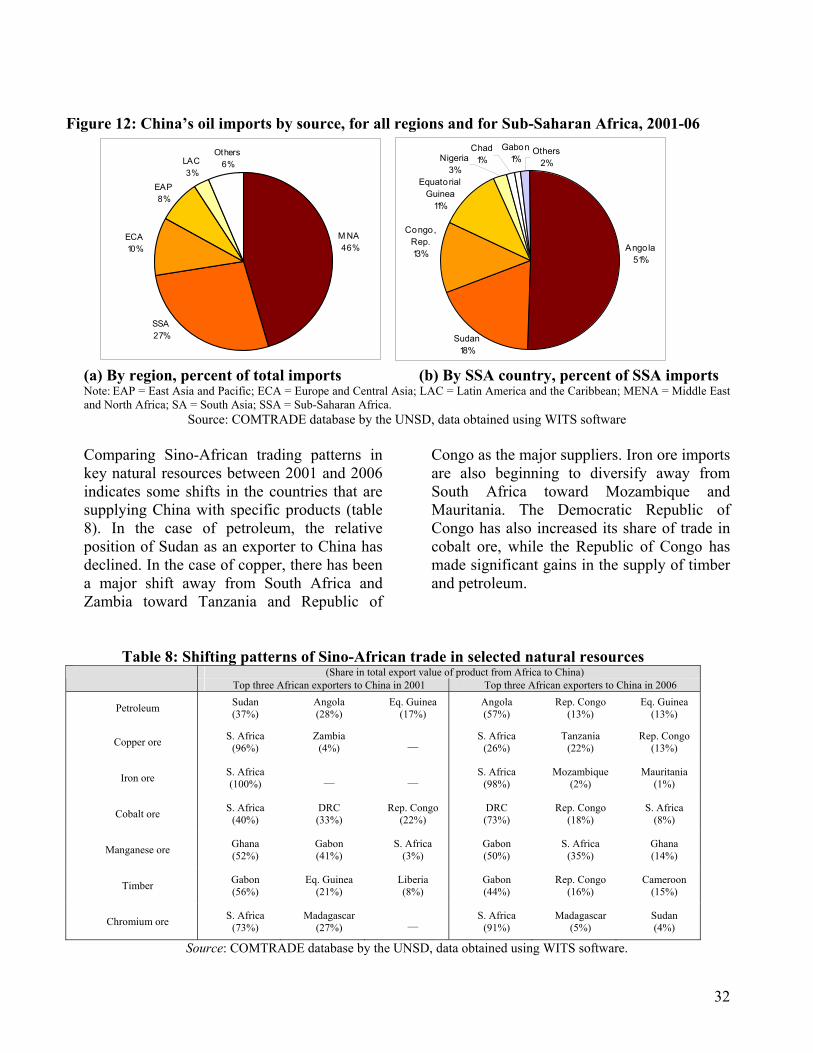
32
Figure 12: China’s oil imports by source, for all regions and for Sub-Saharan Africa, 2001-06
M NA46%
ECA10%
Others6%LAC
3%EAP8%
SSA27%
Gabon1%
Others2%
Sudan18%
Equatorial Guinea
11%
Nigeria3%
Chad1%
Congo, Rep.13%
Angola51%
(a) By region, percent of total imports (b) By SSA country, percent of SSA imports Note: EAP = East Asia and Pacific; ECA = Europe and Central Asia; LAC = Latin America and the Caribbean; MENA = Middle East and North Africa; SA = South Asia; SSA = Sub-Saharan Africa.
Source: COMTRADE database by the UNSD, data obtained using WITS software Comparing Sino-African trading patterns in key natural resources between 2001 and 2006 indicates some shifts in the countries that are supplying China with specific products (table 8). In the case of petroleum, the relative position of Sudan as an exporter to China has declined. In the case of copper, there has been a major shift away from South Africa and Zambia toward Tanzania and Republic of
Congo as the major suppliers. Iron ore imports are also beginning to diversify away from South Africa toward Mozambique and Mauritania. The Democratic Republic of Congo has also increased its share of trade in cobalt ore, while the Republic of Congo has made significant gains in the supply of timber and petroleum.
Table 8: Shifting patterns of Sino-African trade in selected natural resources (Share in total export value of product from Africa to China)
Top three African exporters to China in 2001 Top three African exporters to China in 2006
Petroleum Sudan (37%)
Angola (28%)
Eq. Guinea (17%)
Angola (57%)
Rep. Congo (13%)
Eq. Guinea (13%)
Copper ore S. Africa (96%)
Zambia (4%) __ S. Africa
(26%) Tanzania
(22%) Rep. Congo
(13%)
Iron ore S. Africa (100%) __ __ S. Africa
(98%) Mozambique
(2%) Mauritania
(1%)
Cobalt ore S. Africa (40%)
DRC (33%)
Rep. Congo (22%)
DRC (73%)
Rep. Congo (18%)
S. Africa (8%)
Manganese ore Ghana (52%)
Gabon (41%)
S. Africa (3%)
Gabon (50%)
S. Africa (35%)
Ghana (14%)
Timber Gabon (56%)
Eq. Guinea (21%)
Liberia (8%)
Gabon (44%)
Rep. Congo (16%)
Cameroon (15%)
Chromium ore S. Africa (73%)
Madagascar (27%) __ S. Africa
(91%) Madagascar
(5%) Sudan (4%)
Source: COMTRADE database by the UNSD, data obtained using WITS software.

33
Figure 13: Natural resource exports to China by selected Sub-Saharan
African countries, 2001 and 2006
0
2
4
6
8
10
Angola
Congo,
Rep.
Equato
rial G
uinea
Sudan
South Afri
caGabo
n
Maurita
nia
Congo,
Dem. R
ep.
Nigeria
Chad
Others
Exp
orts
to C
hina
US$
bln
2001
2006
Source: COMTRADE database by the UNSD, data obtained using WITS software.
The pattern of African exports to China has changed substantially over the last few years (figure 13). In 2001, Sudan, Angola, and Equatorial Guinea were the three leading exporters of natural resources to China with about US$0.5-1 billion of exports each, while South Africa, Gabon and Republic of Congo where substantially further behind with US$170-300 million each. By 2006, Angola’s exports to China had grown to over US$10 billion. The Republic of Congo has also experienced exponential growth in exports to China, and together with Equatorial Guinea, Sudan, and South Africa, is now in the second tier of countries with exports in the range US$1.5-2.5 billion. In addition, countries such as Mauritania, Democratic Republic of Congo, and Chad are also becoming established as Chinese suppliers. China’s oil companies have just recently began to bid for oil blocks in Sub-Saharan Africa, outbidding other international oil companies in a number of recent cases. As a result, they have secured oil exploration and drilling rights in Angola, Chad, Republic of
Congo, Côte d’Ivoire, Equatorial Guinea, Ethiopia, Gabon, Kenya, Mali, Mauritania, Niger, Nigeria, São Tomé and Principe, and Sudan. The main players are the major state-owned oil firms: China National Petroleum Corp. (CNPC), Sinopec, and China National Offshore Oil Corp (CNOOC). In addition to exploration and production, Chinese firms are making major investments in pipeline development, refineries and terminal capacity, particularly in Nigeria and Sudan. In countries such as the DRC, Guinea, Gabon, Zambia, and Zimbabwe, Chinese companies have secured projects for minerals including copper, iron ore, and bauxite. A wide range of companies have been active in minerals development, including both State-Owned Enterprises9 and private business interests.10 A
9 Such as China National Overseas Engineering Corporation (COVEC), China Non-Ferrous Metals Mining and Construction Group (NFC), China National Machinery and Equipment Import and Export Corporation (CEMEC), and China Northern Industries Corporation (NORINCO).

34
typical arrangement is for the Chinese investor (whether private or state-owned) to form a joint venture with the local African state-owned mining enterprise, as has taken place for example in Congo, DRC, Gabon and Zambia.11 In order to understand this trend better, a parallel projects database was prepared based on the Factiva data tool using international press sources, to identify natural resource projects in Africa where China had secured some kind of equity stake. The database records around 100 natural resource projects with Chinese involvement. As with the infrastructure projects reported above, project information was taken from international press reports and subsequently validated from official Chinese Web sites using the same methodology already described. The data presented below include only projects that could be validated from Chinese sources. Unfortunately, the value of the associated investment commitments is not given for all of the reported projects. If we were able to confirm existence of 80 natural resources projects, the investment commitments were available and confirmed only in 27 cases. Therefore the figures given below are a likely lower bound on the total value. A detailed tabulation of Chinese funded natural resource projects by country can be found in annex 5. The database documents a rapidly rising trend in Chinese commitments to African natural resource development, with deals in excess of US$9 billion reported in 2006, compared with a value of around US$194 million in the year
10 Such as Collum Coal Mining, Wambao Resources, Yunnan Copper Group, Xuzhou Huayan, Ningbo Huaneng Kuangyu,, and Feza Mining.
11 The respective African counterparts being MKM in Congo, DRC, Industrial and Commercial Mines Company of Gabon (CICMG), and Zambia Consolidated Copper Mine (ZCCM).
2005, no investment commitments was possible to confirm in earlier years. The 2007 deals for which financing information was available amounted to US$1.3 billion. About 65 percent of the total commitments were directed at natural resource development and hence could be considered FDI. The remaining 35 percent was paid directly to governments largely in the form of one-time royalties or “signature bonuses” required to secure oil exploration and production licenses. These figures are high in relation to historical levels of Chinese FDI reported for Africa, with the most recent figures indicating annual flows of US$400 million for 2004–05, although recent research highlights significant limitation in capturing oil sector FDI in official statistics (Aukut and Goldstein 2007). Given that the projects database reports commitments, while FDI relates to actual disbursements, a significant lag could be expected. Nevertheless, based on these reports a substantial increase in Chinese FDI to Africa can be predicted for the coming years.

35
Table 9: Chinese investment commitments in natural resource sector in
Sub-Saharan Africa, 2001-07 (US$ millions)
Oil Chromium Copper Iron Bauxite Coal Manganese Multiple Other Minerals Total
Angola 2,400 0 0 0 0 0 0 0 0 2,400 Central African Republic — 0 0 0 0 0 0 0 0 —
Chad >203 0 0 0 0 0 0 0 0 >203 Congo, DRC — 0 — 0 0 0 0 >3701 — >370 Congo, Rep — 0 0 0 0 0 0 0 0 — Cote d'Ivoire — 0 0 0 0 0 — 0 0 —
Equatorial Guinea — 0 0 0 0 0 0 0 0 — Eritrea 0 0 — 0 0 0 0 602 — >60 Gabon — 0 0 — 0 0 2 0 — >2 Guinea 0 0 0 0 63 0 0 0 — >63 Kenya — 0 0 0 0 0 0 0 24 >24 Liberia — 0 0 0 0 0 0 0 0 —
Madagascar 103 0 0 0 0 0 0 0 0 103 Mali — 0 0 0 0 0 0 0 0 —
Mauritania >9 0 0 0 0 0 0 0 0 >9 Mozambique — 0 0 0 0 0 0 0 — —
Multiple countries 0 0 0 0 0 0 0 7833 0 783 Namibia 0 0 — 0 0 0 0 0 — —
Niger — 0 0 0 0 0 0 0 — — Nigeria >4,762 0 0 0 0 0 0 3004 19 >5,081
Sao Tome and Principe — 0 0 0 0 0 0 0 0 — Somalia — 0 0 0 0 0 0 0 0 —
South Africa 0 537 0 — 0 0 0 5105 — >1,047 Sudan — 0 0 — 0 0 0 0 4 >4
Tanzania 0 0 0 0 0 — 0 0 0 — Zambia 0 0 220 0 0 — — 0 25 >245
Zimbabwe 0 200 — 0 0 — 0 0 0 >200 Total >7,476 >737 >220 — 63 — >2 >2,023 >71 >10,591
Notes: 1Copper and cobalt; 2Copper and gold; 3purchase of shareholding in Anglo American group with operations in Platinum, Diamonds, Coal, Base Metals, and Ferrous Metals in Botswana, Namibia, South Africa, and Tanzania; 4Oil and solid minerals; 5Iron and chromium, cobalt and nickel. “—” = project was reported but that the value of the commitment was not given.
Source: World Bank–PPIAF Chinese Projects Database, 2007.
Some 71 percent of at least US$10.6 billion Chinese commitments to the natural resources sector relate to the petroleum, with the balance going to minerals mainly copper and chromium, but also cobalt, iron, bauxite, manganese, coal, nickel, titanium, and uranium (table 9). Although at least 26 countries have received some investment in natural resource development, Nigeria and
Angola stand out as by far the largest recipients of natural resource investment, predominantly into petroleum. Despite the inability to confirm putative US$1.3 billion of commitments into exploration and transportation of Sudanese oil, the quantity of the recorded natural resources projects in Sudan points to its strategic importance for China. Box 2 below provides further details of

36
the nature of Chinese involvement in the oil sectors of each of these three oil-rich countries. China has also been taking an interest in countries that are just beginning to identify and exploit new hydrocarbon resources. For example, in 2006, the Chinese National Offshore Oil Corporation (CNOOC) purchased 50 percent interest in oil block covering seven sedimentary basins in Chad, from Canadian producer EnCana. Subsequently, CNOOC made its first commercial discovery of oil in Chad in the mid 2007. In addition, Chinese petroleum companies has exploration activities underway in a number of countries not yet considered to be oil producers, such as Central African Republic, Ethiopia, Liberia, Madagascar, and Somalia. Nevertheless, this vigorous growth of natural resource trade between China and Africa, takes place from a very low base. The fact remains that China’s oil companies are relative latecomers to petroleum exploration and production in Africa. Thus, the US$10.6 billion of Chinese oil sector investments recorded above are barely a tenth of the US$168 billion that other international oil companies have already invested in the region (Downs, 2007). South Africa is currently in the first place as a recipient of natural resource finance due to major investments related to solid minerals, mainly chromium, cobalt, iron, gold and nickel. However, China has also shown a growing interest in the mining belt of central-southern Africa, comprising Zambia, Tanzania, and Mozambique. This area is well-endowed with copper, iron, gold, manganese, and other base metals. Of these three countries, Zambia has the most advanced level of Chinese engagement. In Zambia, China has secured direct equity interests in copper, coal, and manganese. The purchase of an 85 percent stake of Chambishi copper mine for about
US$ 20 million in 1998 was one of China’s earliest overseas mining investments. After its reopening in 2003, the mine has seen continuous inflow of more than US$200 million of new investment, including construction of the smelter plants. The mine’s production capacity is expected to reach 150,000 tons of copper per year in 2008. In coal, Chinese Collum Mine at the old Nkandabbwe mine in Sinazongwe district started production in 2003 and recorded an output of 20,000 tons in 2004. In 2005, a private Chinese firm purchased a manganese mine with proven deposit of 4 million tons in Zambia's old industrial town of Kabwe. The processing of manganese started in 2007. In 2006, around 27 percent of Zambia’s exports of copper were destined for China, compared to 100 percent of manganese12. Comparing table 9 on the pattern of current Chinese natural resource investments, with the earlier table 8 indicating the current pattern of Chinese natural resource imports from Africa, provides some pointers as to the future direction of trade flows. Whereas table 8 above indicated that Nigeria was not currently a major supplier of oil to China, the new Chinese commitments to petroleum sector development in Nigeria reported in this section, suggest that Nigeria’s volume of oil exports to China is set to increase. The same could be said of Gabon, which today does not feature as an exporter of iron ore to China, but which is receiving a substantial investment in the mining sector, particularly into the Belinga iron ore reserve, capable of producing 15 million tons per year. In many cases, the exact value of the investment could not be ascertained. Thus, for example, Chinese oil sector investment of unknown magnitude have
12 COMTRADE database by the UNSD, data obtained using WITS software
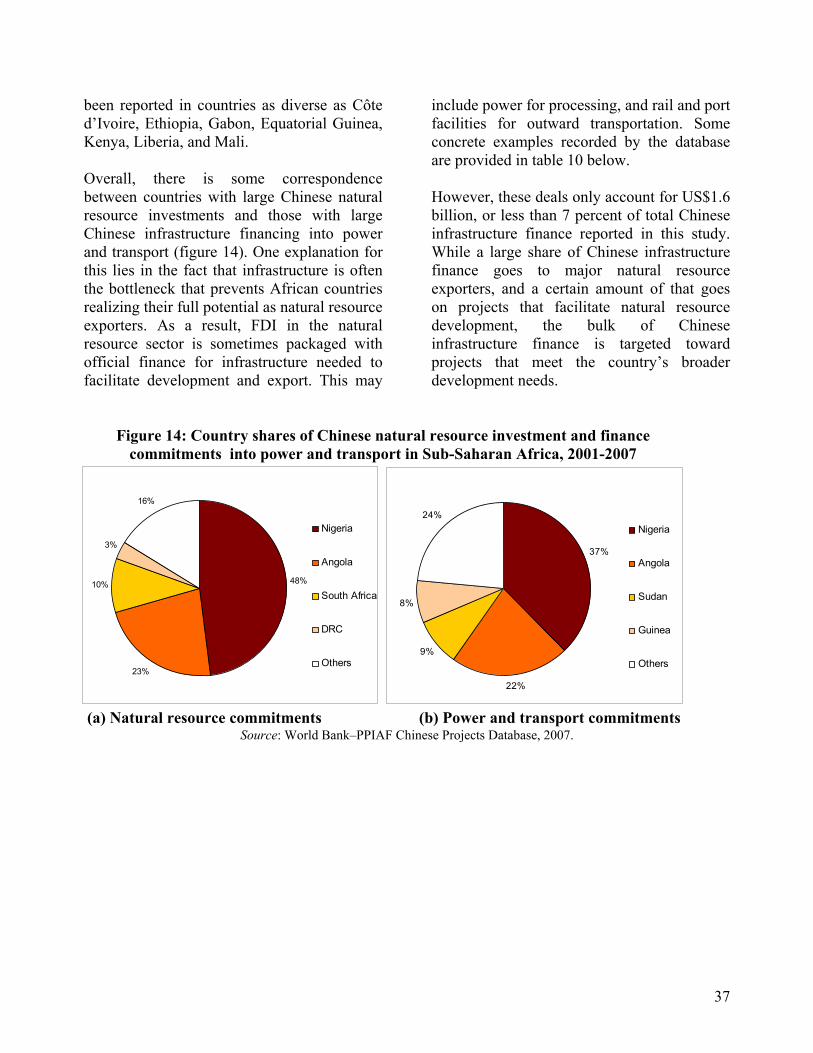
37
been reported in countries as diverse as Côte d’Ivoire, Ethiopia, Gabon, Equatorial Guinea, Kenya, Liberia, and Mali.
Overall, there is some correspondence between countries with large Chinese natural resource investments and those with large Chinese infrastructure financing into power and transport (figure 14). One explanation for this lies in the fact that infrastructure is often the bottleneck that prevents African countries realizing their full potential as natural resource exporters. As a result, FDI in the natural resource sector is sometimes packaged with official finance for infrastructure needed to facilitate development and export. This may
include power for processing, and rail and port facilities for outward transportation. Some concrete examples recorded by the database are provided in table 10 below. However, these deals only account for US$1.6 billion, or less than 7 percent of total Chinese infrastructure finance reported in this study. While a large share of Chinese infrastructure finance goes to major natural resource exporters, and a certain amount of that goes on projects that facilitate natural resource development, the bulk of Chinese infrastructure finance is targeted toward projects that meet the country’s broader development needs.
Figure 14: Country shares of Chinese natural resource investment and finance commitments into power and transport in Sub-Saharan Africa, 2001-2007
48%
23%
10%
3%
16%
Nigeria
Angola
South Africa
DRC
Others
37%
22%
9%
8%
24%Nigeria
Angola
Sudan
Guinea
Others
(a) Natural resource commitments (b) Power and transport commitments
Source: World Bank–PPIAF Chinese Projects Database, 2007.

38
Table 10: Chinese-financed infrastructure projects linked to Chinese natural resource development projects
Country Year of commitment
Status at end of 2007
Link to Natural Resource Development Project Description
Chinese Financing Commitments (US$ millions)
Botswana 2006 Proposed To provide means of transportation of
coal to China from landlocked Botswana via Namibian ports
Construction of the Trans-Kgalagadi railway that would link
Botswana with Namibia not available
Gabon 2006 Agreement Provides means of transportation for the iron ore output from the Belinga
mine
Belinga iron ore project. Includes
construction of Poubara hydro power dam, Belinga-Santa Clara railway, and deep water port at
Santa Clara, with total projects cost of US$ 3 bln.
not available
Guinea 2006 Agreement Power needed to process bauxite associated with China’s mining
interests
Construction of Souapiti Dam hydropower 515 MW project
1000
Mauritania 2007 Agreement Facilitates phosphate mining from the reserves near the town of Bofal, close
to Senegal's border
Construction of 430km railway
from Nouakchott to Bofal 620
Total 1,620 Source: World Bank–PPIAF Chinese Projects Database, 2007.
Box 2: Chinese involvement in petroleum sector development in Nigeria, Angola and Sudan
Nigeria: A rapidly growing engagement Since 2004, Chinese petroleum companies acquired various interests in Nigerian oil production. This began when Sinopec won an initial oil exploration contract for Blocks 64 and 66 of the Chad Basin. In 2006, both CNOOC and CNPC won substantial interests in Nigerian oil exploration.
China National Offshore Oil Corp. (CNOOC) purchased 45 percent of Block ML130 in the Niger Delta, with reserve estimates of 600 million barrels covering about 500 square miles of Akpo Oilfield and other discoveries. The total deal offered by CNOCC was worth US$2.7 billion.
Just several months later, CNPC completed the acquisition of a 51 percent stake in the Kaduna refinery for a total consideration of US$2 billion. The refinery was designed to refine 110,000 barrels of oil a day, yet due to lack of maintenance, its actual refinery capacity was only 70 percent of that capacity. Together with this deal, CNPC received the license for four oil blocks—OPL 471, 721, 732 and 298. As a result of these deals, Chinese state-owned oil companies committed to invest around US$5 billion in the country’s petroleum industry.
Angola: A Joint Venture between SOEs The China Petroleum and Chemical Corporation (SINOPEC) and Angola National Oil Corporation (Sonangol) signed a contract for the establishment of a joint venture Sonangol Sinopec International (SSI), to exploit crude oil in Angola's three offshore oil fields in 2006. Sinopec held a 75% share, while Sonangol of Angola had the remaining 25%. SINOPEC, China's biggest oil refinement corporation, was to contribute about 2.4 billion USD, including government signature bonuses of $2.2 billion and $200 million investment in social projects. SSI won a 27.5 percent stake in block 17, a 40 percent stake in block 18 and a 20 percent working interest in block 15. With block 15 holding approximately 1.5 billion barrels of oil reserves, block 17 1 billion barrels, and block 18 700 million barrels, it was estimated that the three blocks would bring Sinopec around 100,000 barrels of oil output per day. SSI also announced plans to develop a US$ 3 billion refinery in Lobito with maximum capacity of 240,000 barrels per day, under the project known as Sonaref. However, the negotiations around Sonaref had collapsed and the project was canceled in 2007. Angola current oil refinery capacity is around 39,000 barrels per day.

39
Sudan: First major African oil experience From 2001-2007, the database recorded 6 confirmed oil-related projects in Sudan. However, none of the total recorded commitments for Sudan amounting to some US$645 million was confirmed by Chinese sources. The database also has information on another 6 unconfirmed oil projects, amounting to additional US$ 789 millions of possible finance commitments. Project sponsorship in Sudan has taken the form of complex multinational consortia with other emerging financiers. In most cases, the leading minority stake goes to CNPC, which has formed a joint venture with the Sudanese government to bid for blocks. Other members of the consortium typically include Petronas of Malaysia, and the Al Thani Corporation of the United Arab Emirates, with Sinopec of China sometimes participating with a small stake. Moreover, in 2005, Indian and Chinese companies collaborated on an African oil project for the first time through the Greater Nile Petroleum Operating Company (GNPOC) – a Joint Venture of CNPC (40 percent) and ONGC Vindesh (25 percent) – which won the rights to the Heglig and Unity fields (Blocks 1,2 and 4 ). Oil exploration deals in Sudan have not entailed the payment of major royalty payments to the government, but rather the entire investment commitments in the industry to date has gone directly into exploration and construction of supporting pipeline and refinery infrastructure. Furthermore, China has provided an additional official finance to support development of oil-related infrastructure, including the development of pipelines, pumping facilities and export terminals all related to the exploitation of the Melut Basin oilfield. Similarly, pipelines and oil terminals are being constructed to facilitate the export of oil from Blocks 3, 6 and 7. There have also been significant investments in expanding the capacity of the Khartoum oil refinery. Exploration and production activities are so far taking place in Blocks 1, 2, 3, 4, 7, and 15.

40
6.
THE FINANCING PERSPECTIVE Loans from the China Ex-Im Bank account for the vast majority—92 percent—of the recorded Chinese infrastructure finance commitments in Sub-Saharan Africa in 2001–07 (figure 15a). Another category is “Chinese government unspecified” financing, which accounts for 3 percent of the total, and may indicate funding directly from the Executive Branch of government, likely to be the Ministry of Commerce. More recently, a number of projects have been funded by the China Africa Development Fund established by the China Development Bank (CDB). This follows public announcements of CDB’s intention to rapidly expand its overseas portfolio.13 CDB is China’s major domestic development bank and the world’s largest development bank as measured by assets. Fifty percent of the recorded commitments are loans, and a further 44 percent take the form of export credits (figure 15b). Given the pre-eminence of the China Ex-Im Bank this section analyzes the bank’s practices in greater detail, and brings together the limited information available on loan financing terms. It also considers the financial impact of Chinese loans on the overall indebtedness of the African countries involved.
(a) The Role of China China Ex-Im Bank
As a state policy bank founded in 1994, China Ex-Im’s official mission is to carry out state industrial policies, foreign economic and trade policies and diplomatic policies. While state 13 Reported in the Financial Times of London (December 6, 2006).
banks such as the China Development Bank specialize in domestic development, the Ex-Im Bank was set up to focus on overseas projects. The Ex-Im Bank offers several products, the most important of which are export buyer’s and seller’s credits, international guarantees, on-loaned funds extended by foreign governments and financial institutions, as well as concessional and nonconcessional loans for overseas construction and investment projects. The Ex-Im Bank is the only Chinese institution that is empowered to provide concessional lending to overseas projects.
Concessional loans require a sovereign guarantee, and where the government’s creditworthiness may be an issue, the loans are sometimes backed by natural resources. In the case of export buyer’s credits, sovereign guarantees are also needed in most cases; however, local banks with a good record of creditworthiness or local branches of internationally recognized banks may also be able to provide acceptable guarantees under some circumstances. As a state policy bank handling bilateral aid, details on much of the lending activities of the Ex-Im are not made public. While the annual reports of the Bank do disclose the total amounts of export-buyers and seller’s credits per year, it is not broken down by specific agreements. The section on concessional lending activities does not reveal the level of disbursements.

41
Figure 15: Chinese infrastructure finance commitments in Sub-Saharan Africa by source and type, 2001–07
(a) By source (b) By type Source: World Bank–PPIAF Chinese Projects Database, 2007.(a) The Role of China Ex-Im Bank
However, according to the report, “During the ‘Tenth Five-Year Plan’ period (2001-2005), the Bank signed in total 78 concessional loan projects for foreign countries, with the approved loans increasing by 35 percent on an annual basis; the outstanding loans by 28 percent; the accumulated disbursements by 22 percent. The prioritization for concessional loans typically goes to sectors closely related to the economic development of the recipient countries, such as electric power, transportation and telecommunication.”
The available information provided by the China Ex-Im Bank makes clear that the scale of its operations is increasing (figure 16). According to Moss and Rose (2006), the China Ex-Im Bank may now be one of the largest export credit agencies in the world, with primary commercial operations in 2005 greater than OECD Ex-Im Banks such as the United States, Japan, and the UK. Since China is not an OECD member, it has no obligation
to follow OECD reporting requirements. Since China does not have a separate bilateral donor institution, the China Ex-Im Bank has largely assumed this role, further differentiating it from OECD ex-im banks. By providing preferred lines of credit to Chinese state-owned enterprises and foreign governments wishing to purchase Chinese-made goods, the China Ex-Im Bank supports the overseas expansion of Chinese firms in line with the country’s “Go Global” strategy, whose long-run goal is to increase the productivity and competitiveness of these enterprises. In the case of concessional loans, there is a requirement that a Chinese enterprise be selected as the contractor or exporter. Moreover, no less than 50 percent of the equipment, materials, services, or technology needed to implement the project should be secured from China.
92%
0.3%5%3%
China EximBank
Chinesegovernmentunspecified
SOE
China AfricaDevelopmentFund (CADF)
44%
5%1%
50% Loan
Exportcredit
FDI
Grant

42
Figure 16: Commitments and disbursements by China Ex-Im Bank, 2001–06
6 .20 6 .32
9 .52
13 .35
2 0 .2 2
2 6 .0 8
5.41 6 .178 .87
10 .75
19 .80
15.54
0
5
10
15
20
25
30
2001 2002 2003 2004 2005 2006
Billi
on (U
S$)
Commitments Disbursements
6.14 5.257.83 9.40
12.1317.48
3.72
4.37
4.37
4.24
1.800.650.620.02
1.042.15
0.450.05
0
5
10
15
20
25
30
2001 2002 2003 2004 2005 2006
Billi
on (U
S$)
Expo rt Se lle r's Credit Expo rt Buyer's Credit Inte rna tio na l Guarantees
Source: China Ex-Im Bank, 2007. Concessional loans are founded on two legal agreements. The first is an Intergovernmental Framework Agreement signed by both governments indicating the purpose, amount, maturity and interest rate of the facility. The second is a Loan Agreement signed by the China Ex-Im Bank and the Borrower within that framework. Relatively little is known about the terms of the China Ex-Im Bank’s concessional loans. However, the range of interest rates offered by the Bank across all its products is 2 percent to 7 percent, in addition to some direct grants. Interest rates for specific deals are determined on the basis of a matrix that takes both the economic situation and the commercial viability of the project into account. The China Ex-Im Bank was originally created with a mandate to cover costs, without necessarily making a profit, as a result in the past it has done little more than to break even.
In recent years there is a growing interest in more commercially-oriented lending. Initially, the China Ex-Im Bank only provided loans to State Owned Enterprises. However, more recently it has broadened its range of clients to include private Chinese enterprises, and foreign enterprises active in China. The China Ex-Im Bank is making increasing use of a deal structure – known as “Angola mode” or “resources for infrastructure” – whereby repayment of the loan for infrastructure development is made in terms of natural resources (e.g. oil). This approach is by no means novel or unique, but follows a long history of natural resource-based transactions in the oil industry (Johnston, 1994). Indeed, its use in Angola by Western corporations in the earlier years of this century has also been widely documented (HRW, 2001).

43
Figure 17: Structure of “Angola mode” arrangement The Angola mode is increasingly being used by the China Ex-Im Bank for countries that cannot provide adequate financial guarantees to back their loan commitments. Under this arrangement, the money is never directly transferred to the government (as illustrated in figure 17). Instead, a framework agreement is signed with the government covering a certain program of infrastructure investments. These are contracted to a Chinese construction firm. At the same time, a Chinese petroleum company is awarded rights to begin production. The government of the beneficiary country instructs the Chinese contractor to undertake infrastructure works, supported by a credit from China Ex-Im Bank. Repayment is in the form of oil produced directly by the Chinese petroleum company. The organization of the deal is relatively complex owing to the need to coordinate with the two Chinese firms involved, each of which must carry out its own due diligence. The arrangement allows countries with abundant resources but limited creditworthiness to package the exploitation of natural resources with the development of infrastructure assets.
The financial terms of Angola mode are particularly difficult to pinpoint, given that they depend to a significant extent on the implicit price agreed for the commodity traded, and its relation to current and future market prices, so that any discount provided with respect to the future price of oil effectively contributes to a hardening of lending terms (or vice versa). Using the Angola mode method of finance, China is able to gain physical security over oil resources, normally at a slightly discounted price (Chen, 2007b). Although, the detailed terms of these Chinese oil-backed loans are not known, according to oil industry specialists at the World Bank, the wider experience with deals of this kind suggests that they do not typically entail fixing the price of oil over the term of the loan. In fact, as oil prices rise and fall over the period, the term of the loan is usually adjusted accordingly; for example, a shortening of the repayment period as the price of oil rises. In this sense, credit deals tied to repayment in oil are not really a hedge against the future price of oil, but rather provide a way of securing a steady supply into the medium term.
CHINESE INFRASTRUCTURE
CONTRACTOR
CHINESE PETROLEUM
COMPANY
CHINA EXIM BANK
BENEFICIARY GOVERNMENT
instructs company to construct priority
infrastructure projects
provides payment in
kind for financial loan
provides financial loan for
project construction
BENEFICIARY COUNTRY CHINA
awards company license to extract natural resources

44
Table 11: Chinese-financed infrastructure projects backed by natural resources, 2001–07
Country Year of commitment
Status at the end of 2007
Natural resource to be received in
payment Project Description
Total Chinese Financing
(US$ millions)
Congo, Rep. 2001 Under
construction Oil Congo River Dam. Backed by crude oil guarantees. 280
Sudan 2001 Completed Oil Construction of the El-Gaili (Al Jaily) Power Plant, first two phases with Sudan’s oil serving as collateral for the loans.
128
Angola 2004 Completed Oil
Oil-backed loan to repair damaged infrastructure bombed in the country's civil war (power, transport, ICT, and water portion). China to receive 10,000 barrels of oil per day.
1,020
Nigeria 2005 Under construction Oil
Construction of gas turbine power plant at Papalanto. PetroChina secured by a deal to purchase 30,000 barrels of crude oil a day from the Nigerian National Petroleum Corporation (NNPC) for a period of one year, renewable.
298
Guinea 2006 Agreement Bauxite Souapiti Dam project. Reportedly linked to mining (Bauxite) revenues. 1000
Gabon 2006 Agreement Iron Bélinga iron ore reserve. Loan is to be repaid via sales of iron ore to China. not available
Zimbabwe 2006 Agreement, possibly not materialized
Chromium
Construction of new coal mines and three thermal power stations in Dande, the Zambezi valley on the Zambian border. In exchange, Zimbabwe was to provide China with chromium.
not available
Ghana 2007 Under construction Cocoa Bui Dam hydro-power project. Part of the loan will be
repaid in cocoa exports to China. 562
Total 3,287
Source: World Bank–PPIAF Chinese Projects Database, 2007. A growing number of such resource-backed financing schemes were identified in the infrastructure projects database created for this paper. Table 11 documents eight deals totaling more than US$3 billion. The first reported example of the arrangement was a relatively small deal in the Republic of Congo in 2001. However, since the landmark oil-backed deal with Angola in 2004, the mechanism has become more popular, and the resources used to back deals have diversified to include bauxite, chromium, iron ore, and even cocoa. The common state ownership of most of the major oil and infrastructure corporations makes it easier to coordinate this kind of bundled multisectoral deal.
(b) Financing terms As noted above, there is no public information available as to the financial terms offered by the China Ex-Im Bank on its concessional financing deals. It was however possible to identify some of the projects that were financed by grants from the Ministry of Commerce, since these are published on an official Web site for the benefit of prospective contractors (table 12). Although the exact financial value of each project was not always available, in general these appear to have been small projects, of little more than US$10 million on average. Many of them take place in smaller countries, such as Burundi, Cape Verde, Comoros, and Rwanda. Moreover, the projects themselves relate either to rehabilitation of power plants, or construction of prestige transport infrastructure projects (airports, bridges, bypasses).

45
Table 12: Chinese grant-financed infrastructure projects in Sub-Saharan Africa, 2004–07
Country Year of commitment Sector Project Description
Chinese Finance (US$m)
Cape Verde 2004 Power Reconstruction of Palião Dam —
Comoros 2004 Transport Renovation of Prince Said Ibraim International Airport 7
Guinea 2004 Power Rehabilitation of Ginkang & Tinkisso Hydro-Power Plants 2
Nigeria 2004 Water Construction of 598 water schemes for 19 states — Rwanda 2004 Transport Construction of a 2.6km road as part of Kigali ring road — Burundi 2005 Power Rehabilitation of Gikonge & Ruvyironza hydro-plants — Ethiopia 2006 Transport Construction of Gotera intersection bridge in Addis 13
Kenya 2006 Transport Rehabilitation of link road to Kenyatta International Airport 28
Chad 2007 Transport Rehabilitation of six roads in N’Djamena — Gabon 2007 Transport Rehabilitation of 17 roads in Gabon (10 kilometers total) — Kenya 2007 Transport Construction of roads in Nairobi 23
Lesotho 2007 ICT Establishment of television systems in 5 cities — Mali 2007 Transport Construction of the “Third” bridge in Bamako — Niger 2007 Transport Construction of bridge over River Niger in Niamey 30
Tanzania 2007 Water Rehabilitation/extension of water system in Chalinze — Togo 2007 Power Construction of generating unit for Tomegbe —
Source: PRC, Ministry oSource: PRC, Ministry of Commerce, 2007. All members of the World Bank who borrow from the International Development Association (IDA) or the International Bank for Reconstruction and Development (IBRD) are required to report the value and financial terms of their external debt (including public, publicly guaranteed, and private non-guaranteed debt) to the World Bank’s Debtors’ Reporting System (DRS), so that their overall creditworthiness can be assessed. From the DRS it is difficult to trace specific projects, since only very general descriptions of loan purpose are typically included. Nevertheless, it is possible to obtain an overall indication of the average financial terms on Chinese loans to specific countries. These may or may not correspond to the specific infrastructure projects recorded in the project database developed for this report. However, given that infrastructure is a central focus of Chinese lending to Sub-Saharan Africa, the overlap is likely to be quite large.
Unfortunately, only very partial DRS data for 2006 (the year with the highest volumes of Chinese finance to date) were available at the time of writing. IDA applies a grant element calculation to permit standardized comparison of financial terms across deals and to establish whether or not the financial terms can be deemed concessional. For any particular set of financial terms (including interest rate, grace period, and repayment period) the calculator determines the equivalent percentage grant component that would have to be applied to a standard loan at market terms in order to achieve the same financial profile as that offered by the loan in question. It is important to recall that in the specific case of the Angola mode deals cited in table 11 above, these financial terms do not give the full picture since they fail to quantify the impact of any discount offered on the future price of natural resources.

46
Table 13: Average terms of all Chinese official loans to various Sub-Saharan African
countries, 2002–06 Year
Country
Chinese Finance (US$ m)
Interest Rate (%)
Grace Period (yrs)
Financing Term (yrs)
Grant Element
(%) 2002 Cape Verde 1.2 3.0 10.1 14.1 47.7
Gabon 7.6 1.0 2.0 8.5 34.3 Gambia, The 25.5 4.0 8.4 24.4 45.4 Mauritius 12.1 4.0 4.8 12.3 32.1 Nigeria 377.0 4.8 3.9 10.9 25.6 Sudan 57.7 4.3 3.5 11.1 28.4 Zimbabwe 27.0 6.4 1.3 5.8 9.5
2003 Botswana 29.7 3.2 5.1 14.9 40.8 Sudan 33.8 5.1 1.2 6.1 13.2 Swaziland 10.0 3.3 3.1 19.6 41.5 Zimbabwe 69.0 6.1 0.4 5.3 9.6
2004 Angola 2,000.0 1.2 3.5 15.5 50.3 Benin 2.4 1.0 10.1 20.1 67.5 Ethiopia 13.0 1.0 11.2 20.2 69.0 Sudan 74.7 3.7 2.7 8.8 24.9
2005 Mauritania 136.0 3.0 3.4 18.9 43.0 Seychelles 1.0 2.0 4.2 9.7 37.8 Sudan 9.0 4.0 2.8 6.8 21.2 Zimbabwe 6.6 6.4 0.7 4.7 7.5
2006 Botswana 28.7 3.0 5.4 15.3 40.6 Ghana 30.0 2.0 5.0 20.0 53.1 Nigeria 200.0 3.0 2.2 8.7 27.2 Sudan 3.5 4.0 1.6 4.6 14.8 Zimbabwe 200.0 6.1 0.4 1.9 4.0
Source: World Bank’s Debtor Reporting System, 2006. Note: In calculating grant element, the following assumptions are made: (a) the commitment is fully disbursed; bi) the number of repayments per annum is twice; (c) repayment is on an equal principal repayment basis; (d) interest rates are fixed; (e) LIBOR is 5.5 percent; (f) the discount rate is 6.53 percent (an average CIRR for the U.S. dollar from 02/15/2006-08/14/2006, plus a margin 0.75 percent), which is consistent with the IMF PRGF Performance Criteria (i.e. with IDA’s nonconcessional borrowing policy); (g) where the information on maturity is not available, 10-year maturity is assumed; and (h) there are no fees entering in the calculation. According to the OECD definition, any loan with an implicit grant element of at least 25 percent can be regarded as official development assistance (ODA). On the other hand, the OECD Export Credit Agency agreement defines a loan as concessional when it has a grant element of more than 35 percent or more using a currency-specific commercial interest reference point. This definition has been adopted both by the IMF
and the World Bank. As a point of reference, IDA credit incorporate a grant element of 60 percent, and are based on zero interest (but a 0.75 percent service charge), a 10- year grace period and a 40-year repayment term.14 Table 13 presents the average terms on all Chinese lending to various African countries 14 IDA homepage.
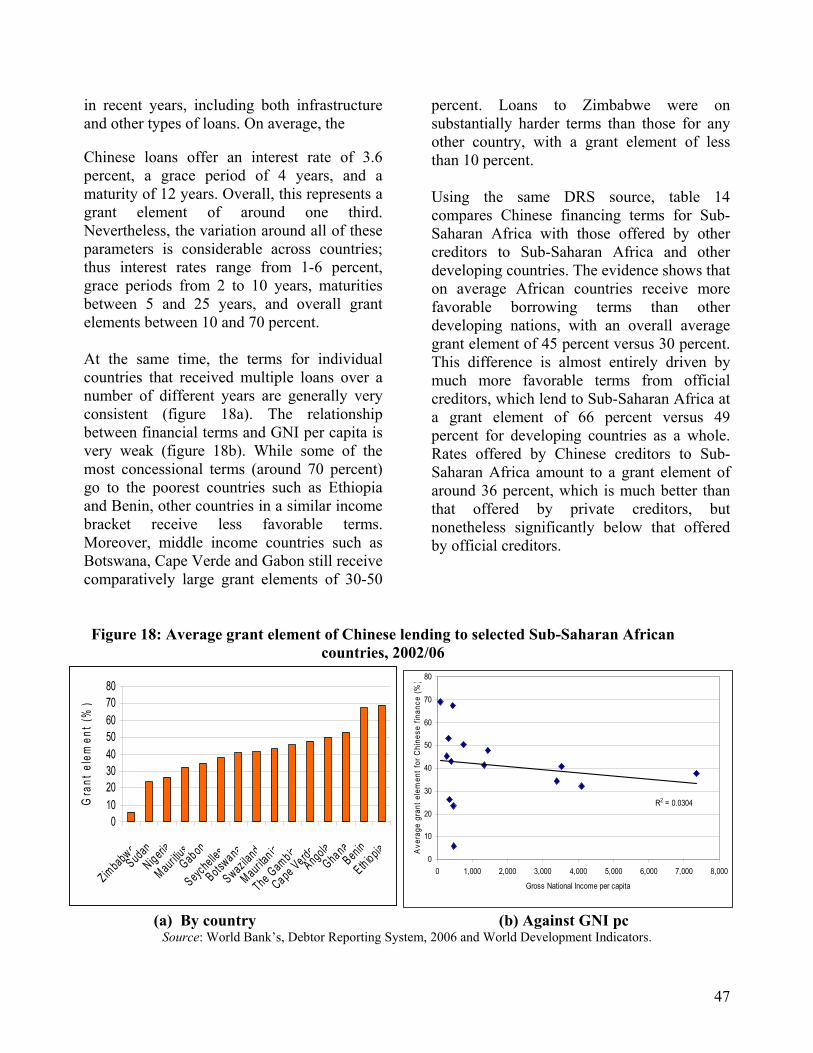
47
in recent years, including both infrastructure and other types of loans. On average, the Chinese loans offer an interest rate of 3.6 percent, a grace period of 4 years, and a maturity of 12 years. Overall, this represents a grant element of around one third. Nevertheless, the variation around all of these parameters is considerable across countries; thus interest rates range from 1-6 percent, grace periods from 2 to 10 years, maturities between 5 and 25 years, and overall grant elements between 10 and 70 percent. At the same time, the terms for individual countries that received multiple loans over a number of different years are generally very consistent (figure 18a). The relationship between financial terms and GNI per capita is very weak (figure 18b). While some of the most concessional terms (around 70 percent) go to the poorest countries such as Ethiopia and Benin, other countries in a similar income bracket receive less favorable terms. Moreover, middle income countries such as Botswana, Cape Verde and Gabon still receive comparatively large grant elements of 30-50
percent. Loans to Zimbabwe were on substantially harder terms than those for any other country, with a grant element of less than 10 percent. Using the same DRS source, table 14 compares Chinese financing terms for Sub-Saharan Africa with those offered by other creditors to Sub-Saharan Africa and other developing countries. The evidence shows that on average African countries receive more favorable borrowing terms than other developing nations, with an overall average grant element of 45 percent versus 30 percent. This difference is almost entirely driven by much more favorable terms from official creditors, which lend to Sub-Saharan Africa at a grant element of 66 percent versus 49 percent for developing countries as a whole. Rates offered by Chinese creditors to Sub-Saharan Africa amount to a grant element of around 36 percent, which is much better than that offered by private creditors, but nonetheless significantly below that offered by official creditors.
Figure 18: Average grant element of Chinese lending to selected Sub-Saharan African
countries, 2002/06
01020304050607080
ZimbabweSudan
Nigeria
Maur itiusGabon
Seychelles
Botswana
Swaz iland
Maur itan ia
The Gamb ia
Cape Ve rdeAngola
GhanaBenin
E th io pia
Gra
nt e
lem
ent (
%)
R2 = 0.0304
0
10
20
30
40
50
60
70
80
0 1,000 2,000 3,000 4,000 5,000 6,000 7,000 8,000
Gross National Income per capita
Ave
rage
gra
nt e
lem
ent f
or C
hine
se fi
nanc
e (%
)
(a) By country (b) Against GNI pc Source: World Bank’s, Debtor Reporting System, 2006 and World Development Indicators.

48
Table 14: Financing terms offered by China and other creditors to Sub-Saharan Africa and all developing countries, 2002/06
Type of Creditor
Interest Rates (%)
Grace Period (yrs)
Financing Term (yrs)
Grant Element (%)
All creditors 4.8 7.4 15.2 30.1 Official creditors only 2.8 5.9 22.2 48.8 All developing
countries Private creditors 6.0 8.3 10.9 18.7
All creditors 2.9 5.9 22.3 45.4 Sub-Saharan Africa Official creditors only 1.7 7.7 32.9 65.6 Private creditors 4.7 3.4 7.2 17.0 Chinese creditors only 3.1 3.6 13.2 36.3
Source: World Bank, Debtor Reporting System, 2006. Note: For methodology underlying grant element calculation see previous table.
(c) Country indebtedness The growing volume of Chinese debt finance being made available to African countries comes in the form of increased grant provision and major debt relief efforts. As a result of bilateral (Paris Club) and multilateral (HIPC and MDRI) initiatives, the Sub-Saharan African countries covered in this study were forgiven a total of US$89 billion of bilateral and multilateral debt up to 2007 , much of it concessional in nature. China itself has also provided a significant amount of debt relief to African countries totaling at least US$780 million since the year 2000.. The major beneficiaries have been Zambia, Ethiopia, Angola, Tanzania, Republic of Congo, Uganda, Ghana and Guinea. The reduced indebtedness of African countries that benefited from this debt relief has created significant fiscal space allowing these countries to borrow again to finance much needed investments. Debt relief was granted on the understanding that future indebtedness would be carefully monitored to ensure its macro-economic sustainability. In order to provide a very approximate sense of the materiality of potential African indebtedness to China under the recent agreements documented above, table 15 provides a country-by-country comparison of
the face value of recent OECD debt relief, against new financial commitments to China.15 The ratio of Chinese financing commitments (according to Chinese plus international sources) to the total value of Western debt relief is computed to provide a rough indication of the extent to which the space afforded by debt relief is being used up by contracting new debts to China. The table confirms that some of the largest beneficiaries of Chinese finance (such as Angola, Sudan, and Zimbabwe) have not been beneficiaries of recent debt relief initiatives. These three countries together received over one-third of all China’s financing commitments. There are only a handful of countries where the value of recent loans contracted to China represents a high share of the value of recent OECD debt relief. Guinea is the only country to have contracted Chinese debt in excess of the value of OECD debt relief. Mauritania has contracted loans equivalent to 40 percent of its OECD debt relief, and Nigeria, loans equivalent to 55 percent.
15 Given widespread default, the market value of the debt that was forgiven would have been substantially below the face value reported here.
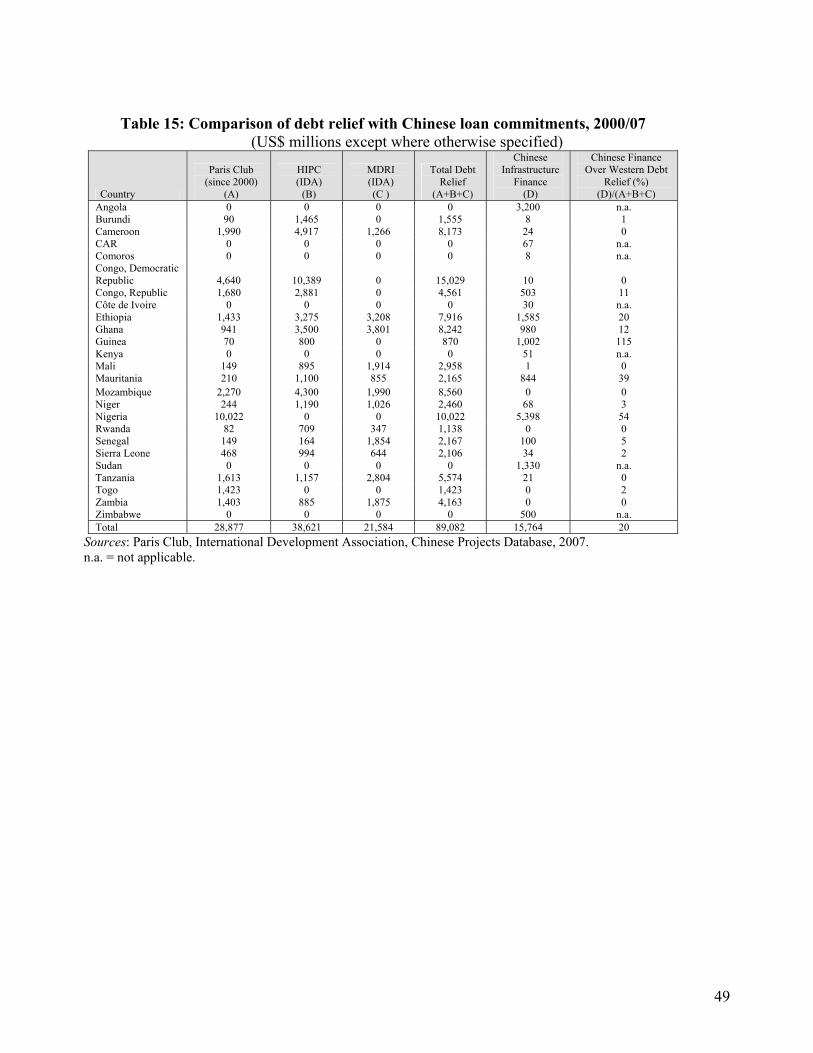
49
Table 15: Comparison of debt relief with Chinese loan commitments, 2000/07
(US$ millions except where otherwise specified)
Country
Paris Club (since 2000)
(A)
HIPC (IDA)
(B)
MDRI (IDA) (C )
Total Debt Relief
(A+B+C)
Chinese Infrastructure
Finance (D)
Chinese Finance Over Western Debt
Relief (%) (D)/(A+B+C)
Angola 0 0 0 0 3,200 n.a. Burundi 90 1,465 0 1,555 8 1 Cameroon 1,990 4,917 1,266 8,173 24 0 CAR 0 0 0 0 67 n.a. Comoros 0 0 0 0 8 n.a. Congo, Democratic Republic 4,640 10,389 0 15,029 10 0 Congo, Republic 1,680 2,881 0 4,561 503 11 Côte de Ivoire 0 0 0 0 30 n.a. Ethiopia 1,433 3,275 3,208 7,916 1,585 20 Ghana 941 3,500 3,801 8,242 980 12 Guinea 70 800 0 870 1,002 115 Kenya 0 0 0 0 51 n.a. Mali 149 895 1,914 2,958 1 0 Mauritania 210 1,100 855 2,165 844 39 Mozambique 2,270 4,300 1,990 8,560 0 0 Niger 244 1,190 1,026 2,460 68 3 Nigeria 10,022 0 0 10,022 5,398 54 Rwanda 82 709 347 1,138 0 0 Senegal 149 164 1,854 2,167 100 5 Sierra Leone 468 994 644 2,106 34 2 Sudan 0 0 0 0 1,330 n.a. Tanzania 1,613 1,157 2,804 5,574 21 0 Togo 1,423 0 0 1,423 0 2 Zambia 1,403 885 1,875 4,163 0 0 Zimbabwe 0 0 0 0 500 n.a. Total 28,877 38,621 21,584 89,082 15,764 20
Sources: Paris Club, International Development Association, Chinese Projects Database, 2007. n.a. = not applicable.

50
7.
THE CHANGING LANDSCAPE OF INFRASTRUCTURE FINANCE The preceding sections analyzed the phenomenon of Chinese finance for African infrastructure projects in Africa in some detail and from a variety of perspectives. In order to reach a better understanding of the significance and implications of this trend, it is equally important to take a wider angle view, and place the Chinese contribution in the broader perspective of infrastructure finance in Africa. In order to do this, it is necessary to compare China both to traditional sources of infrastructure finance, such as official development assistance (ODA) and Private Participation in Infrastructure (PPI), as well as to other non-OECD financiers such as India and the Arab donors. It is important to clarify that all the figures reported in this section are in terms of financing commitments rather than actual disbursements; this is equally true for Chinese finance, traditional ODA, and PPI.
(a) Other non-OECD financiers China is not the only non-OECD player taking a substantial interest in African infrastructure finance. Arab donors have been providing concessional financing for infrastructure projects for some time, and India (primarily through its own Ex-Im Bank) has begun to play a significant role in the last couple of years. Finance from Arab donors is channeled through a number of special funds or development agencies. Of these the most significant ones in terms of the support they provide to African infrastructure projects are the Islamic Development Bank (27 percent),
the Arab Bank for Economic Development in Africa (16 percent), the Kuwait Fund for Arab Economic Development (16 percent), the OPEC Fund (12 percent), and the Saudi Fund (10 percent). Most of the projects are co-financed with at least one other Arab donor, the most notable example being the 1,250-MW Merowe Dam in Sudan. Four Arab donors, as well as China Ex-Im Bank, jointly committed US$ 850 million of financing for the construction of the US$1.2 billion dam. Concessional financing is typically provided with interest rates of 1–2 percent and a 20- to 30-year repayment period. The activities of all these institutions are publicly reported hence it is straightforward to build up a picture of their project portfolio in Africa. Total commitments by this group of Arab donors were an estimated US$3.6 billion in 2001–07, but there was no discernible year on year trend with commitment levels averaging just over US$500 million per year. Project size is relatively small, with an average value of US$22 million. Activities are broadly spread across 36 countries in Sub-Saharan Africa, but with evidence of greater concentration in countries with relatively large Muslim populations. Around half of the resources are associated with transportation (mainly roads) projects, a further 30 percent with power and 15 percent with water and sanitation. India is also beginning to emerge as a significant new player in African infrastructure finance. A detailed survey of international press reports, similar to that conducted for China, reveals a total of 20

51
Indian-official or SOE funded infrastructure projects worth a total of US$2.6 billion over the period 2003–07, averaging US$0.5 billion per year. Once again no clear trend is apparent, with flows being highly volatile. Similar to the case of China, India’s activities in infrastructure finance are closely linked to interests in natural resource development, where a further US$7.3 billion of investments were identified over the same period. As with China, the India Ex-Im Bank is the primary conduit for infrastructure finance, with terms varying according to the nature of the project. For example, in the case of a 2006 Kosti Power Plant in Sudan India Ex-Im Bank provided a 4 percent interest rate was announced over a nine-year term with four years of grace. As with China, Indian financing has been heavily concentrated in oil exporting countries, most notably Nigeria and to a lesser extent Sudan. The bulk of India’s financing activity is concentrated in a single Nigerian deal struck in November 2005. At that time, ONGC Mittal (a 50-48 Joint Venture between state-owned Oil and Natural Gas Corporation (ONGC) and the private Mittal Steel) made a commitment of US$6 billion in Nigeria to
build a 9 million ton per year oil refinery, 2000 MW power plant and 1,000 KM cross-nation railway. It has not been made public how much the refinery and infrastructure will cost, respectively, but it was estimated that (roughly) US$3 billion will go to each. In Sudan, India has financed some US$600 million of energy infrastructure, including a 741-kilometer oil product pipeline linking Khartoum refinery to Port Sudan, and four 125-MW Kosti Combined Cycle Power Plants and associated transmission system. In parallel, India purchased a 25 percent stake in the Greater Nile Petroleum Operating Company from the Canadian firm Talisman Energy, including exploration rights for Blocks 1, 2, and 4, which are currently producing 280,000 barrels per day. In addition, India has acquired 25 percent stakes in Blocks 5A and 5B of the Thar Jath field. India also became active in Angola’s rail sector, committing to a US$40 million project to rehabilitate the Namibe-Matala (Huila) railroad in August of 2004. The project was funded by the India Ex-Im Bank on a concessional basis, with repayment to be made over 50 years. Other than Angola, the
Figure 19: Non-OECD infrastructure finance in Sub-Saharan Africa, 2001–07
01
234
567
89
2001 2002 2003 2004 2005 2006 2007
US$
billi
ons
ArabFinanciers
IndianFinanciers
Chinesefinanciers
Note: Figures for China include only projects that could be confirmed from Chinese sources. Only financing from official or SOE sources is reported
Source: World Bank–PPIAF Chinese Projects Database, 2007.
52
Indian consortium Rites and Ircon International (RII) secured a concession contract in December 2004 for the restoration and management of the Beira rail system in Central Mozambique. RII promised to invest US$55 million in the system, while the World Bank provided a loan of US$110 million. India’s largest rail deal, however, was part of the US$6 billion oil and infrastructure package agreement reached in Nigeria in November 2005, involving the construction of an east-west, 1,000-km railway. Aggregating across these three emerging financiers gives an overall indication of the importance of these new players (figure 19). Through 2003, the combined activities of the emerging financiers amounted to no more than US$0.6-1.4 billion, with the Arab funds being the most important category. Volumes jumped to US$2 billion in 2004 with the emergence of China, topped US$4 billion in 2005 due to major investments by India, peaked at around
US$8 billion in 2006 as a result of the Chinese “Year of Africa,” and tailed back to around US$5 billion in 2007.
(b) Comparison of OECD and non-OECD finance To put the activities of non-OECD financiers in perspective, it is relevant to compare them to ODA from the OECD countries as well as other conventional sources of infrastructure finance such as PPI (which is essentially a sub-category of FDI). The comparison indicates substantial growth from PPI and non-OECD commitments in recent years.. In 2006, the totals provided by PPI and non-OECD financiers were broadly similar, amounting to just over US$8 billion each, followed by ODA total commitments of more than US$5 billion (figure 20).
Figure 20: External infrastructure finance in Sub-Saharan Africa, 2001–2006
0
5
10
15
20
2001 2002 2003 2004 2005 2006
US$
billi
ons
ODA PPI Non-OECD
Source: World Bank–PPIAF Chinese Projects Database; World Bank–PPIAF PPI database (ppi.worldbank.org); OECD database (http://stats.oecd.org/), as of 2008.

53
Another important question is the extent to which the emergence of new sources of finance has helped to bridge the infrastructure financing gap in Africa. Disaggregating by sector, a very different picture emerges in each case (figure 21). In ICT, the contribution of non-OECD financiers is also relatively small, but comes on top of already abundant resources from the private sector. The contribution of the non-OECD financiers is particularly important in the power sector, where it constitutes a substantial addition to existing flows. In transport, the contribution is more modest, but still significant. In water, the contribution of non-OECD financiers is small in relation to needs. With the exception of ICT, a significant funding gap remains even after taking the contributions of the non-OECD financiers into account. The foregoing analysis already points to certain sectoral patterns of specialization across the different financiers. Whereas ODA is relatively evenly spread across transport, power and water, PPI is heavily skewed toward ICT and non-OECD finance is heavily skewed toward the power and transport
sectors (figure 22a). The result of this specialization is that the sources of finance vary substantially for each sector. Thus ICT is almost entirely funded by PPI. Almost one-third of the resources for the power sector come from the non-OECD financiers (focused primarily on generation and hydropower), with ODA making the most substantial contribution (that also encompasses transmission and distribution). About 50 percent of resources for the transport sector comes from ODA (focused on roads), with emerging financiers (focused on rail) also making a significant contribution. Finally, the water and sanitation sector is almost exclusively financed by ODA. To some extent, and without any particular orchestration, the interests of the different financiers appear to be largely complementary. Thus, ODA focuses on social concerns and finance of public goods, PPI seeks the most commercially lucrative opportunities in ICT, and emerging financiers are motivated by the desire to create productive infrastructures.
Figure 21: External infrastructure finance by sector in Sub-Saharan Africa, 2001-06
0
2
4
6
8
10
12
14
16
18
20
ICT Power Transport WSS
Inve
stm
ent c
omm
itmen
ts (U
S$m
)
Non-OECDPPIODA
Source: World Bank–PPIAF Chinese Projects Database; World Bank–PPIAF PPI database (ppi.worldbank.org); OECD
database (http://stats.oecd.org/), as of 2008.

54
Figure 22: Sectoral specialization of external sources of infrastructure finance in Sub-Saharan Africa, 2001–2006
0
20
40
60
80
100
ODA PPI Non-OECD
Perc
ent o
f tot
al WSSTransportPowerICT
0
20
40
60
80
100
ICT Power Transport WSS
Per
cent
of t
otal
Non-OECDPPIODA
(a) By donor (b) By sector Source: World Bank–PPIAF Chinese Projects Database; World Bank–PPIAF PPI database (ppi.worldbank.org); OECD
database (http://stats.oecd.org/), as of 2008. A similar pattern of specialization emerges with respect to geography, with different countries benefiting disproportionately from different sources of finance. Figure 23 presents the amount of external infrastructure financing flows for the 17 countries that capture more than 2 percent of their GDP in such assistance. Looking across these countries, it is evident that they rely predominantly on different sources of external finance for infrastructure.
The countries that rely predominantly on non-OECD financiers are Guinea, Mauritania, Zimbabwe, Ethiopia, CAR and Gambaia. These countries also tend to be among the largest recipients of external finance. In the case of Guinea, Mauritania, and Zimbabwe, non-OECD finance amounts to more than 10 percent of GDP. The countries most heavily reliant on PPI are Burkina Faso, Liberia, Mozambique, Uganda, and Kenya. The countries most heaviliy reliant on ODA are Benin, Burundi, and Cape Verde.

55
Figure 23: Geographic specialization of external sources of infrastructure finance in Sub-Saharan Africa
-
3
6
9
12
15
18
Guinea
Maurita
nia
Zimbab
we
Burkina
Faso
Nigeria
Cape V
erde
Ethiopia
CAR
Gambia
Mozam
bique
Liberi
a
Sierra
Leone
Ugand
a
Comoro
s
Burund
i
Kenya
Benin
Per
cent
age
of G
DP
ODA PPI Non-OECD
Source: Three-year average of financing data reported by World Bank–PPIAF Chinese Projects Database, World Bank PPI Database, and OECD International Development Statistics; divided by GDP taken from World Bank World
Development Indicators, 2007

56
8.
CONCLUSION This study documents the emergence of China as a major new financier of infrastructure in Sub-Saharan Africa. Chinese financing commitments rose from less than US$1 billion per year in the early 2000s to exceed US$7 billion in 2006, which was China’s official “Year of Africa.” Such indirect evidence as exists on the financing terms of these loans suggests that they are more favorable than the private capital markets, though not as soft as ODA. Thus, Chinese loans were found to have an average grant element of 36 percent compared with 66 percent for ODA. China is not the only non-OECD financier to be playing a major role in Africa. Indian finance for African infrastructure projects is not far behind, with commitments averaging US$2 billion per year over the period 2005 to 2006. Chinese and Indian finance share many common characteristics; including their channeling through the respective countries’ ex-im banks and their focus on countries that are becoming major petroleum trading partners, such as Nigeria and Sudan. In addition to China and India, the Arab donors are also playing a significant role in African infrastructure finance, with their resources being channeled primarily in the form of soft loans through development funds focusing on roads and other social infrastructure projects. China’s approach to its intergovernmental financial cooperation forms part of a broader phenomenon of south-south economic cooperation between developing nations. The principles underlying this support are therefore ones of mutual benefit, reciprocity and complementarity. Unlike traditional ODA, financing is not channeled through a development agency, but rather through the
Ex-Im Bank with its explicit mission to promote trade. Given the export promotion rationale, the tying of financial support to the participation of contractors from the financing country is a typical feature. A similar approach is currently being taken by the India Ex-Im Bank, and has in the past been used by export credit agencies of other countries. Even compared to other developing regions, Sub-Saharan Africa faces a serious infrastructure deficit that is currently prejudicing growth and competitiveness. The estimated infrastructure financing needs are on the order of US$22 billion per year with an associated funding gap of over US$10 billion per year. Against this context, the growth of Chinese (and other emerging) finance presents itself as an encouraging trend for the region, and can potentially make a material contribution to closing the deficit. In the power sector, for example, the six hydropower plants currently under construction amount to 6,000 MW of capacity and when completed would represent a 30 percent increase over and above existing hydro capacity in the region. To put these findings in perspective, the combined contribution of China and the other emerging financiers at more than US$8 billion for 2006 is broadly comparable to PPI and exceeds the combined official development assistance of the OECD countries that topped US$5 billion in the same year. The analysis shows a significant degree of complementarity in the sectoral and geographic focus of traditional and emerging finance. Non-OECD donors tend to focus on productive infrastructures, mainly power (in particular hydroelectric schemes) and railways, and
57
direct their resources primarily to major petroleum trading partners. Traditional donors tend to focus on public goods such as roads, water, sanitation, and electrification and spread their support more evenly, reaching non-resource-exporting countries to a greater extent. The advent of China and other non-OECD players as major financiers presents itself as a hopeful trend for Africa, given the magnitude
of its infrastructure deficit. The aid provided by these emerging financiers is unprecedented in scale and in its focus on large scale infrastructure projects. With new actors and new modalities, there is a learning process ahead for borrowers and financiers alike. The key challenge for African governments will be how to make the best strategic use of all external sources of infrastructure funding, including those of emerging financiers.
58
Bibliography Akyut, Dilek and Goldstein, A.. December 2006. “Developing Country Multinationals: South-South Investment Comes of Age.” Working Paper no. 257, OECD Development Centre, Paris. Akyut, Dilek and Andrea Goldstein (forthcoming). “Foreign Direct Investment in the Oil Sector.” Mimeo, OECD Development Centre, Paris. Alden, C. and Rothman, A. September 2006. China and Africa Special Report: Terms of Endearment from Marxism to Material., CLSA Asia-Pacific Markets, Shanghai. Brautigam, D. 1997 Chinese Aid and African Development: Exporting Green Revolution. Palgrave Macmillan Broadman, Harry. 2006. Africa’s Silk Road: China and India’s New Economic Frontier. The World Bank. Burnside, C. and Dollar, D. 2000. “Aid, Policies, and Growth.” American Economic Review 90(4), pp. 847-68 Burnside, C. and Dollar, D. 2004 Aid, Policies, and Growth: Revisiting the Evidence. Policy Research Working Paper No. 3251. World Bank, Washington D.C. Calderon and Serven. 2004. The Effects of Infrastructure Development on Growth and Income
Distributino., Policy Research Working Paper No. WPS 3400. The World Bank, Washington D.C.
Campos, I. and Vines A. 2008. Angola and China A Pragmatic Partnership, Working Paper, CSIS. Chen, Chuan. 2007. Overview of Chinese Finance of Infrastructure Projects in Sub-Saharan Africa Based on Public Chinese Sources. Mimeo. Chen, C., P. Chiu, R. Orr, and A. Goldstein. 2007. An Empirical Analysis of Chinese Construction Firms’ Entry into Africa. Conference Paper, CRIOCM2007. International Symposium on Advancement of Construction Management and Real Estate. Sydney, Australia. Corkin, L. China’s Interest and Activity in Angola’s Construction and Infrastructure Sectors. Centre for Chinese Studies, University of Stellenbosch. Corkin, L. 2007. The Strategic Entry of China's Emerging Multinationals into Africa. China Report
2007: 43; 309. SAGE Publications. Davies, M., with H. Edinger, N. Tay, and S. Naidu. 2008. How China delivers development assistance to Africa. Centre for Chinese Studies, University of Stellenbosch.
59
Downs, E. 2007. The Fact and Fiction of Sino-African Energy Relation., China Security, Vol. 3(3), pp. 42-68. Esfahani, H.S. and M.T. Ramirez. 2003. “Institutions, infrastructure and economic growth.
Journal of Development Economics, 70, 443-77. Estache, A. 2005. What Do We Know About Sub-Saharan Africa’s Infrastructure and the Impact of
the 1990s Reforms? Mimeo. World Bank, Washington, D.C. Evans, P.C. and Downs, E. S. May 2006. Untangling China’s Quest for Oil through State-Backed Financial Deals. Brief No. 154. The Brookings Institution, Washington, D.C. Gill, B., Huang, C., and Morrison, J.S. January 2007. China’s Expanding Role in Africa:
Implications for the United States. Center for Strategic and International Studies, Washington, D.C.
Glosny, M. A. December 2006. China’s Foreign Aid Policy: Lifting States Out of Poverty or Leaving Them to the Dictators? CSIS Freeman Report, Center for Strategic and International
Studies, Washington, D.C. Goldstein, A., Pinaud, N., Reisen, H., and Chen, X. 2006. The Rise of China and India: What’s In It for Africa? Organisation for Economic Co-operation and Development, Paris. HRW. 2001. Human Rights Watch World Report 200., Human Rights Watch (www.hrw.org). IMF and World Bank. November 2006., Applying the Debt Sustainability Framework for Low-
Income Countries Post Debt Relief.. IMF. June 2006. “IDA Countries and Non-concessional Debt: Dealing with the ‘Free Rider’ in
IDA14 Grant-Recipient and Post-MDRI Countries. Resource Mobilization Dept. IMF Direction of Trade Statistics Yearbook, 2006. Infrastructure Consortium for Africa. 2007. ICA Annual Report 2006, Infrastructure Consortium for Africa Secretariat, Tunis. Jacquet, P., Chaponnière, J. R., Delefosse, O., and Jacquelain, V. January 2007. La Chine, Moteur
du Développement. La Lettre des Economistes de l’AFD No. 15, Agence Française de Développement, Paris.
Johnston, D. 1994 International Petroleum Fiscal Systems and Production-Sharing Contracts, Pennwel.l King, Kenneth. 2006. China’s Partnership Discourse with Africa, NEPAD Conference Paper.
60
Kurlantzick, Joshua. November 2006. “Beijing’s Safari: China’s Move into Africa and Its Implications for Aid, Development and Governance.” Carnegie Endowment for International Peace Policy Outlook. Ministry of Foreign Affairs. 2006. China’s African Policy. Web site of the Ministry of Foreign Affairs of the People’s Republic of China: http://www.fmprc.gov.cn/eng/zxxx/t230615.htm. Moss, Todd and Sarah Rose,. November 2006. “China Ex-Im Bank and Africa: New Lending, New Challenges.” Center for Global Development Notes (November 2006). Muneku, A. and Koyi G. 2007. The Social Impact of Asian FDI in Zambia. A Case of Chinese and Indian Investments in the Extractive Industry in Zambia (1997-2007). Mwase, N. 1983. The Tanzania-Zambia Railway: The Chinese Loan and the Pre-Investment Analysis Revisited. The Journal of Modern African Studies, Vol. 21, No. 3, (Sep., 1983), pp. 535-43. Ndulu, B. 2004. Infrastructure, Regional Integration and Growth in Sub-Saharan Africa: Dealing
with the Disadvantage of Geography and Sovereign fragmentation. Background Paper for the Commission for Africa.
Nellis, J. 2006. Back to the Future for African Infrastructure: Why State Ownership is No More Promising the Second Time Around?,Working Paper No. 84, Center for Global Development, Washington, D.C. Nielson, D.L. and Tierney, M.J. 2003. “Delegation to International Organizations: Agency Theory and World Bank Environmental Reform.” International Organization 57, pp. 241-76. Pambazuka. 2006. African Perspectives on China in Africa. Pambazuka News 282, Ghana. Shelton, C. 2005. China and Africa: Understanding the Growing Trade and Investment Relationship. The Corporate Council on Africa. Stellenbosch University Centre for Chinese Studies. December 2006. China’s Interest and Activity in Africa’s Construction and Infrastructure Sector., Stellenbosh University. Yepes, T., Pierce, J. and Foster, V. 2007. Making Sense of Sub-Saharan Africa’s Infrastructure Endowment: A Benchmarking Approach. Mimeo. Sustainable Development Department, Africa Region, World Bank, Washington, D.C. Zhang, Z. X. September 2006. China’s Hunt for Oil in Perspectiv., East-West Center, Honolulu.

61
Annex 1: Methodology for Searching Factiva Database Factiva is a news database that covers 10,000 different media from 159 countries. Using the Factiva search engine it is possible to do very precise targeted searches for news coverage of specific topics. This annex documents the search terms that were used to generate the database of Chinese infrastructure and natural resource projects in Africa. Factiva uses simple logical statements as search parameters. For example, to find articles containing two specific words used in the same article, such as “China” and “Africa,” the operator “and” is used. To find articles using either of two words, such as “China” or “Africa,” the operator “or” is used. The * parameter controls for different endings of words. For example, Chin* would pick up the use of “China” or “Chinese” or “China’s” in an article. The parameter w/7, for example, finds two words within 7 words of each other, for example, China w/7 Africa, would find articles with the word “China” within 7 words of “Africa.” The construction of the project database began with a broad, general search that was then followed-up by specific searches for each country in Africa. The same approach was adapted to obtain information on infrastructure and natural resource projects, as well as debt relief, for both China and India.
(a) Broad, general search A number of combinations of search terms were used to do the first order searches. The initial searches took the following forms. ((china or Chinese) w/10 Africa*) and (invest* or loan or grant or finance or Ex-Im or ex-im or export-import or aid) and (infrastructure or energy or electricity or water or wastewater or sewage or road* or rail* or *port or telecom* or mobile) ((china or Chinese) w/10 Africa*) and (chin* w/5 Ex-Im or ex-im or export-import) These types of searches generated a very large number of results. In order to analyze the results, it was necessary to control for either dates or specific countries using “Select Sources: Factiva Intelligent Indexing” located below the search field. The search terms are bolded in the text of the articles that are identified by the Factiva database. All the articles were initially scanned to identify which were the most informative on project details. Once a specific project was identified, a follow-up search was conducted using the name of the project or project sponsors in order to get additional information. For example, if the search revealed an article containing information on the Merowe dam, and reported financing by the China Ex-Im Bank, the follow-up search would be as follows: (China or Chinese) and Merowe and Sudan and (Ex-Im or ex-im or export-import)

62
(b) Specific country searches Thereafter, the search process was narrowed to specific countries. Two different approaches were used to do this. The first approach, which proved to yield quite efficient results, was the following. ((China or Chinese) w/10 (Angola or Benin or Botswana or Burkina or Burundi)) and (infrastructure or energy or electricity or water or wastewater or sewage or road* or rail* or *port or telecom* or mobile) and (invest* or loan or grant or finance or Ex-Im or ex-im or export-import or aid) Alternatively, Factiva also allows the user to specifically control for country by clicking “region” under “Select Sources: Factiva Intelligent Indexing” then selecting “Developing Economies” selecting a specific country and then just running a basic search such as the following. (China or Chinese) and (infrastructure or energy or electricity or water or wastewater or sewage or road* or rail* or *port or telecom* or mobile) and (invest* or loan or grant or finance or Ex-Im or ex-im or export-import or aid) In order to find information on China’s debt relief activities, the following terms were used. ((china or Chinese) w/10 (Rwanda or São Tomé or Senegal or Seychelles or Sierra Leone or Somalia or Sudan or Swaziland or Tanzania or Togo or Uganda or Zambia or Zimbabwe)) and ((debt*) w/7 (relief or forg?ve or cancel* or reduc* or waive or writ* off)) In order to find information about natural resource development projects supported by China or India, the following terms were used. ((China or Chinese) w/10 (insert countries here)) and (CNOCC or Sinopec or CNPC or PetroChina or mineral*) ((India* w/10 (insert countries here)) and (ONGC or OVL or GAIL or Oil India or Indian Oil or mineral*) Similar searches were also conducted inserting names of specific minerals such as copper, bauxite, ore, manganese, coal, and so forth.

63
Annex 2: Methodology for Creating Project Database In order to systematically record the information that was found in the newspaper articles generated by the Factiva database, a database structure was predesigned. The articles generated by Factiva were then read with a view to filling the specific data fields described below, which were entered into the database to create consistent project records. Only 2001-07 projects were targeted.
(a) Infrastructure projects
The database records Chinese-financed projects in Sub-Saharan Africa that involve the infrastructure sectors (power, transport, ICT, water and sanitation). It also allows collecting similar information for projects financed by Indian and Arab financiers. The key pieces of information collected are described below: • Agreement date. Recorded when an official announcement in the press is made concerning a government or Arab donor funded commitment or when a Chinese or Indian company formally agrees to undertake a project. In the case where the exact date is uncertain, the earliest recorded date when the project financing was announced is used. It must be clear that a formal commitment has been made (for example, formal documents were signed) in order to qualify as a project. • Status. The main categories are: Proposed, Agreement, Construction, and Completed. • Sector. (for example, Transport) and subsector (for example, Road, Railway, Airport). Sometimes, commitments of funds will be for “general infrastructure purposes” or involve commitments for more than one sector. In those cases where it is unclear as to how a given commitment will be divided up among specific infrastructure sectors and subsectors, the sector is recorded as “General.” The database does not count commitments given for unspecified purposes or for “projects to be determined at a later date,” since it is unclear in those cases that the resources will be directed toward traditional infrastructure. • Chinese Financier. Most of the projects were funded by the China Ex-Im Bank, the Indian Ex-Im Bank, Arab donors, or state-owned or private enterprises. Sometimes, it is unclear which specific institution is committing resources as reports in the press refer simply to, for example, “the Chinese government” as the source of the funds. Such cases are recorded as “Chinese government – Unspecified” in the database. • Type of financing. The database records commitments as either a loan, concessional loan, grant, or equity financed. The type of financing is recorded as it is most commonly referred to in public media. That is, there is no objective interest rate below which the database records loans as “concessional.” However, if the loan has a grant element of 25 percent or greater, then it is typically defined as concessional. Often times, the terms of financing are confidential; in those cases the project is simply recorded as a “loan.” For the Arab donors, it seemed clear that most of the project financing should be deemed “concessional” since interest rates were generally 1–2 percent over 20–30 years. If detailed financing terms are available, they are recorded as well. • Amount of financing. Only that portion of the total project cost that is attributable to Chinese funding sources is recorded, not the total value of the contract. For example, if a hydroelectric dam
64
cost US$700 million, and the China Ex-Im Bank financed US$500 of that while the government of the country in question financed the remainder, only the US$500 is recorded as the Chinese commitment, while the US$700 million would be recorded as the Total Project Cost. Likewise, in the case of a sponsor financed project, only the amount(s) attributable to the sponsor(s) are recorded. In a project in which a sponsor has a share of the equity, and only the total value of the project is known, the equity stake is multiplied by the total project value to get the sponsor commitment. • Contractor. Sometimes the specific names of these firms are not made public, yet it is clear that the project agreement requires, for example, Chinese-owned entities to be contracted for the work. Such cases are recorded as “Chinese contractors – Unspecified.” For the projects finances by Arab donors, there was little information available on the winners of the construction contracts. • Whether or not there was a natural resource or political consideration involved in the project- either directly or indirectly. Most Chinese government funded projects in Sub-Saharan Africa are ultimately aimed at securing a flow of Sub-Saharan Africa’s natural resources for export to China. Often times, commitments of funds to infrastructure projects either precede or follow an agreement for a Chinese firm to exploit oil, mineral, or other natural resources in the project country. Other times, Chinese loans for projects will be backed by guarantees of natural resource exports. The database attempts to record this trend by linking projects to natural resource deals when such links are readily apparent or deemed appropriate. Other times, it is determined that projects are for purely commercial reasons and recorded as such. Again, however, there is no rigorous methodology used in this classification. • Other project details. A brief “project description” is included in every entry that attempts to capture the capacity (size) of the project, location, duration, and other details deemed interesting.
(b) Natural resource project database The natural resource databases record projects with Chinese, Indian, or Arab involvement in Sub-Saharan Africa’s natural resource sector (i.e. oil and minerals) and sub-sector (oil exploration, oil refining, chrome, copper, etc.) and capture the same project information as the infrastructure database.

65
Annex 3: Summary of Chinese-Funded Infrastructure Projects by Sector
Table A3. 1 Overview of Chinese Financing Commitments in confirmed Power Projects in Sub-Saharan Africa, 2001-07
Country Year Status Project Chinese
financier Contractors Added capacity
Project Cost
(US$m)
Chinese Commitments
(US$m)
Angola 2002 Completed Rehabilitation and Extension
of the Electrical System in Luanda, Phase 1
Ex-Im Bank, China
China Machine-Building International Corporation
(CMIC) — 15 15
Angola 2004 Completed
Rehabilitation and extension of the Lubango power
transmission project in Huila Province
unconfirmed China National
Electronics Import and Export Corp. (CEIEC)
— 15 unconfirmed
Angola 2004 Completed Electricity portion of the first phase of 2004 two bln loan from Ex-Im Bank of China
Ex-Im Bank, China Multiple — — 200
Angola 2005 Completed Rehabilitation and Extension
of the Electrical System in Luanda, Phase 2
Ex-Im Bank, China
China Machine-Building International Corporation
(CMIC) — 46 46
Angola 2006 Completed Capanda-Ndalatando and
Cambambe-Luanda electricity transmission lines
Ex-Im Bank, China
China Railway Construction
Corporation (CRCC) — — —
Benin 2004 Construction Adjarala Dam on the Mono River between Benin and Togo
Ex-Im Bank, China Unknown 96 MW 162 unconfirmed
Burundi 2005 Construction Rehabilitation of Gikonge and Ruvyironza hydraulic power
plants
Government, China
Xing Jiang Bei Xin Construction
Engineering (group) Co.,Ltd
2500 KW — —
Congo, Rep. 2001 Construction Construction of Congo River Dam at Imboulou
Ex-Im Bank, China
China National Machinery & Equipment Import & Export Corp.
(CMEC); Sinohydro
120 MW 280 280
Ethiopia 2002 Construction Construction of the Tekeze
dam, in the state of Tigray in Ethiopia
Ex-Im Bank, China
Northern International Group; China National Water Resources and
Hydropower Engineering Corp.(CWHEC)
300 MW 224 50
Gabon 2006 Agreement Poubara hydro power dam
(part of US$ 3bln Belinga iron ore project)
Ex-Im Bank, China Sinohydro — — —
Ghana 2006 Construction The electrization of rural areas in Ghana
Ex-Im Bank, China
China International Water & Electric Corp.
(CWE) — 90 81
Ghana 2007 Agreement
Construction of gas-stream combined cycle power
generation plant at Krone, near Tema
CADF; Shenzhen
Shenzhen Energy Investment Co., Ltd;
China Africa Development Fund
(CADF)
200 MW 143 137
Ghana 2007 Construction Bui Dam Complex Ex-Im Bank, China Sinohydro 400 MW 622 562
Guinea 2004 Completed Rehabilitation of Ginkang
Hydropower Plant and Tinkisso Hydropower Plant
Government, China
Hunan Construction Engineering Group Corp. — 2 2
Guinea 2006 Agreement Souapiti Dam project on the Konkouri River
Ex-Im Bank, China Sinohydro 515 MW 1,000 1,000
Mozambique 2006 Agreement Mphanda Nkuwa dam, and transmission line to Maputo
Ex-Im Bank, China Camargo Correa 1300 MW 2,300 —
Nigeria 2005 Construction Construction of Papalanto Power Gas Turbine Power
Plant, in Ogun
Ex-Im Bank, China Sepco 670 MW 360 298
Nigeria 2005 Construction Construction of Okitipupa (Omotosho) Power Gas
Ex-Im Bank, China CMEC 355 MW 361 —
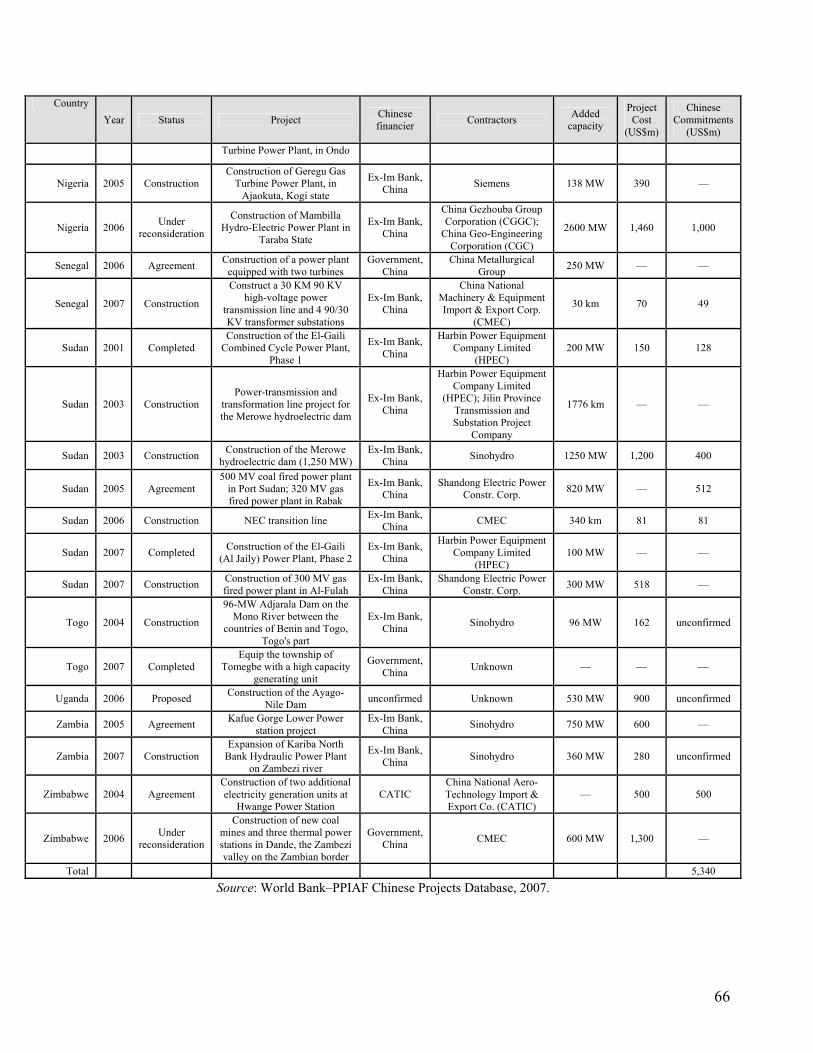
66
Country Year Status Project Chinese
financier Contractors Added capacity
Project Cost
(US$m)
Chinese Commitments
(US$m)
Turbine Power Plant, in Ondo
Nigeria 2005 Construction Construction of Geregu Gas
Turbine Power Plant, in Ajaokuta, Kogi state
Ex-Im Bank, China Siemens 138 MW 390 —
Nigeria 2006 Under reconsideration
Construction of Mambilla Hydro-Electric Power Plant in
Taraba State
Ex-Im Bank, China
China Gezhouba Group Corporation (CGGC);
China Geo-Engineering Corporation (CGC)
2600 MW 1,460 1,000
Senegal 2006 Agreement Construction of a power plant equipped with two turbines
Government, China
China Metallurgical Group 250 MW — —
Senegal 2007 Construction
Construct a 30 KM 90 KV high-voltage power
transmission line and 4 90/30 KV transformer substations
Ex-Im Bank, China
China National Machinery & Equipment Import & Export Corp.
(CMEC)
30 km 70 49
Sudan 2001 Completed Construction of the El-Gaili
Combined Cycle Power Plant, Phase 1
Ex-Im Bank, China
Harbin Power Equipment Company Limited
(HPEC) 200 MW 150 128
Sudan 2003 Construction Power-transmission and
transformation line project for the Merowe hydroelectric dam
Ex-Im Bank, China
Harbin Power Equipment Company Limited
(HPEC); Jilin Province Transmission and Substation Project
Company
1776 km — —
Sudan 2003 Construction Construction of the Merowe hydroelectric dam (1,250 MW)
Ex-Im Bank, China Sinohydro 1250 MW 1,200 400
Sudan 2005 Agreement 500 MV coal fired power plant
in Port Sudan; 320 MV gas fired power plant in Rabak
Ex-Im Bank, China
Shandong Electric Power Constr. Corp. 820 MW — 512
Sudan 2006 Construction NEC transition line Ex-Im Bank, China CMEC 340 km 81 81
Sudan 2007 Completed Construction of the El-Gaili (Al Jaily) Power Plant, Phase 2
Ex-Im Bank, China
Harbin Power Equipment Company Limited
(HPEC) 100 MW — —
Sudan 2007 Construction Construction of 300 MV gas fired power plant in Al-Fulah
Ex-Im Bank, China
Shandong Electric Power Constr. Corp. 300 MW 518 —
Togo 2004 Construction
96-MW Adjarala Dam on the Mono River between the
countries of Benin and Togo, Togo's part
Ex-Im Bank, China Sinohydro 96 MW 162 unconfirmed
Togo 2007 Completed Equip the township of
Tomegbe with a high capacity generating unit
Government, China Unknown — — —
Uganda 2006 Proposed Construction of the Ayago-Nile Dam unconfirmed Unknown 530 MW 900 unconfirmed
Zambia 2005 Agreement Kafue Gorge Lower Power station project
Ex-Im Bank, China Sinohydro 750 MW 600 —
Zambia 2007 Construction Expansion of Kariba North
Bank Hydraulic Power Plant on Zambezi river
Ex-Im Bank, China Sinohydro 360 MW 280 unconfirmed
Zimbabwe 2004 Agreement Construction of two additional electricity generation units at
Hwange Power Station CATIC
China National Aero-Technology Import & Export Co. (CATIC)
— 500 500
Zimbabwe 2006 Under reconsideration
Construction of new coal mines and three thermal power stations in Dande, the Zambezi valley on the Zambian border
Government, China CMEC 600 MW 1,300 —
Total 5,340
Source: World Bank–PPIAF Chinese Projects Database, 2007.

67
Table A3. 2: Overview of Chinese Financing Commitments in confirmed Transport Projects in Sub-Saharan Africa, 2001-07
Country Year Status Project Chinese financier Contractors
Added capacity
(km)
Project Cost
(US$m)
Chinese Commitments
(US$m) Airport
Comoros 2004 Completed Rehabilitation of Prince
Said Ibrahim international airport in Moroni
Ex-Im Bank, China
China Airport Construction Group
Corporation of CAAC — — 8
Congo, Rep. 2007 Construction Construction of terminals, tower and power control
center at Ollombo Airport
Ex-Im Bank, China
China Jiangsu International Economic-Technical Cooperation
Corporation
— 56 56
Congo, Rep. 2007 Construction Rehabilitate Brazaville Airport project (Maya-
Maya international airport)
Ex-Im Bank, China
Weihai International Economic&Technical Cooperative Co., Ltd
(WIETC)
— 160 160
Mauritania 2005 Construction Construction of a new international airport at
Nouakchott
Government, China Unknown — 280 224
Airport total 448 Bridge
Ethiopia 2006 Construction Construction of the Gotera
Intersection Bridge in Addis Ababa
Ex-Im Bank, China
Shanghai Construction Group — 13 13
Mali 2007 Agreement Grant to construct the Third Bridge for Mali in Bamako
Ministry of Commerce,
China Unknown — — —
Niger 2007 Construction Construction of the bridge over river Niger in Niamey
Ministry of Commerce,
China
No.14 China Railway Group Co., Ltd. 2.15 40 40
Sudan 2004 Construction Construction of the bridge between Khartoum and the Sudanese-Egyptian border
China National Petroleum
Corporation (CNPC)
Jilin Province International Economy &
Trade Development Corporation (JIETDC)
0.44 20 10
Sudan 2006 Construction Construction of Ruffa Bridge
China Poly Group
Corporation
China Poly Group Corporation; China
Railway 18th Bureau Group Co. Ltd.
0.394 23 —
Bridge total 62 Railway
Angola 2003 Completed Rehabilitation of Luanda Railway, Phase 1
Government, China
China National Machinery & Equipment Import & Export Corp.
(CMEC)
43 90 90
Botswana 2006 Proposed
Construct the Trans-Kgalagadi railway that
would link Botswana with Namibia
Ex-Im Bank, China Unknown — — —
Gabon 2006 Agreement Belinga-Santa Clara railway (part of US$ 3bln Belinga
iron ore project)
Ex-Im Bank, China
China Railway Engineering Group Co.
Ltd. (CREGC) — — —
Mauritania 2007 Agreement Build 430km railway from Nouakchott to Bofal
Ex-Im Bank, China
Transtech Engineering Corporation 430 620 620
Namibia 2005 Completed Railway Equipment Purchase
Ex-Im Bank, China
China Railway Material Group — 200 31
Nigeria 2006 Distressed Modernization of the
Nigeria railway, Phase 1: Lagos-Kano railway
Ex-Im Bank, China
China Civil Engineering Construction Company
(CCECC) 1315 8,300 2,500
Nigeria 2006 Distressed Abuja Rail Mass Transit Project
Ex-Im Bank, China
China Guangdong Xinguang International
Group — 2,000 1,000

68
Country Year Status Project Chinese financier Contractors
Added capacity
(km)
Project Cost
(US$m)
Chinese Commitments
(US$m)
Sudan 2004 Completed Interest free loan for railway development unconfirmed China National Petroleum
Corporation (CNPC) — — unconfirmed
Sudan 2007 Agreement Construction of railway from Khartoum to Port
Sudan unconfirmed
China Railway Engineering Group Co.
Ltd. (CREGC) 762 1,154 —
Railway total 4,241 Road
Angola 2004 Construction The No. 1 and 2 ring roads of the Angola City
Ex-Im Bank, China CMEC 51.25 170 170
Angola 2005 Construction Rehabilitation of the
Kifangondo-Caxito-Uige-Negage road
Ex-Im Bank, China
China Road And Bridge Corporation (CRBC) 371 211 211
Botswana 2003 Completed Letlhakeng-Kang road, Phase 1
Ex-Im Bank, China CSCEC 561 29 23
Botswana 2006 Construction Letlhakeng-Kang road, Phase 2
Ex-Im Bank, China CSCEC 85 40 19
Botswana 2006 Construction Dutlwe-Morwamosu Road Ex-Im Bank, China CSCEC — — 17
Chad 2007 Construction Rehabilitate 6 roads in N'Djamena
Ministry of Commerce,
China
Guangdong Provincial Construction Engineering
Group Co 9.7 — —
Congo, Rep. 2007 Construction Road linking Brazaville and Pointe-Noire
Ex-Im Bank, China CSCEC 178 — —
Equatorial Guinea 2001 Completed Niefang-Nkue Road Government,
China CRBC 33.2 11 11
Equatorial Guinea 2003 Completed Bata-Niefang section road
rehabilitation Government,
China China Wuyi Co., Ltd. 30 — 6
Ethiopia 2003 Completed Gottera-Wolo Sefer Road Government, China CRBC 2.6 5 3
Ethiopia 2004 Completed Addis Ababa city ring road phase 2
Government, China CRBC 33.4 77 13
Ethiopia 2006 Agreement Road and two bridges construction in Addis
Ababa
Government, China CRBC 5.8 17 6
Gabon 2007 Construction Grant to rehabilitate 17 roads in Gabon
Ministry of Commerce,
China
China Geo-Engineering Corporation (CGC) 9.96 — —
Ghana 2003 Completed Accra-Kumasi trunk road rehabilitation
Ex-Im Bank, China CREGC 17.4 23 23
Kenya 2006 Construction
Rehabilitation of the roads in Nairobi from Kenyatta
International Airport to UN Environment Programme
Government, China
China Road And Bridge Corporation (CRBC) 26 — 28
Kenya 2007 Construction Grant to construct roads in Nairobi
Ministry of Commerce,
China
Shengli Engineering Construction(Group)
Corporation Ltd 22.5 23 23
Madagascar 2003 Completed Rehabilitation of roads in the North of the capital
Ex-Im Bank, China
Anhui Foreign Economic & Trade Development Co. — — —
Rwanda 2003 Completed Construction of a 2.6 km road in Kigali City
Ex-Im Bank, China
China Road And Bridge Corporation (CRBC) — — —
Road total 553 Transport Total 5,304
Source: World Bank–PPIAF Chinese Projects Database, 2007.
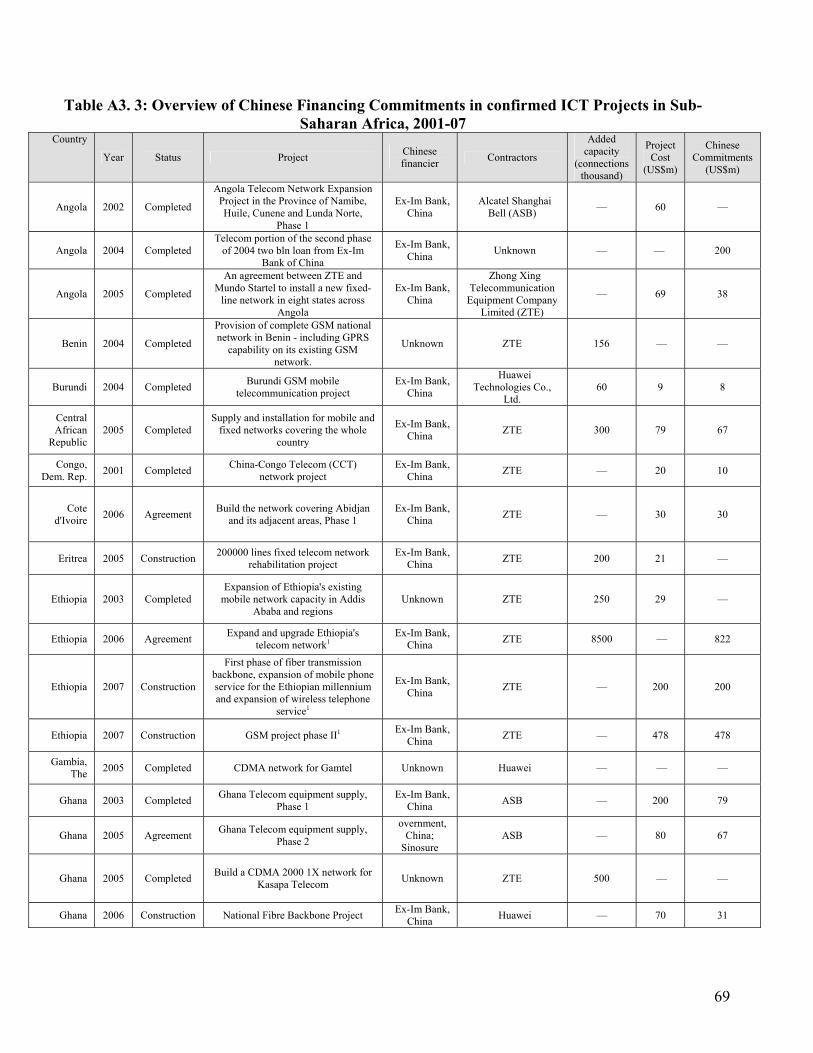
69
Table A3. 3: Overview of Chinese Financing Commitments in confirmed ICT Projects in Sub-Saharan Africa, 2001-07
Country
Year Status Project Chinese financier Contractors
Added capacity
(connections thousand)
Project Cost
(US$m)
Chinese Commitments
(US$m)
Angola 2002 Completed
Angola Telecom Network Expansion Project in the Province of Namibe, Huile, Cunene and Lunda Norte,
Phase 1
Ex-Im Bank, China
Alcatel Shanghai Bell (ASB) — 60 —
Angola 2004 Completed Telecom portion of the second phase
of 2004 two bln loan from Ex-Im Bank of China
Ex-Im Bank, China Unknown — — 200
Angola 2005 Completed
An agreement between ZTE and Mundo Startel to install a new fixed-
line network in eight states across Angola
Ex-Im Bank, China
Zhong Xing Telecommunication
Equipment Company Limited (ZTE)
— 69 38
Benin 2004 Completed
Provision of complete GSM national network in Benin - including GPRS
capability on its existing GSM network.
Unknown ZTE 156 — —
Burundi 2004 Completed Burundi GSM mobile telecommunication project
Ex-Im Bank, China
Huawei Technologies Co.,
Ltd. 60 9 8
Central African
Republic 2005 Completed
Supply and installation for mobile and fixed networks covering the whole
country
Ex-Im Bank, China ZTE 300 79 67
Congo, Dem. Rep. 2001 Completed China-Congo Telecom (CCT)
network project Ex-Im Bank,
China ZTE — 20 10
Cote d'Ivoire 2006 Agreement Build the network covering Abidjan
and its adjacent areas, Phase 1 Ex-Im Bank,
China ZTE — 30 30
Eritrea 2005 Construction 200000 lines fixed telecom network rehabilitation project
Ex-Im Bank, China ZTE 200 21 —
Ethiopia 2003 Completed Expansion of Ethiopia's existing
mobile network capacity in Addis Ababa and regions
Unknown ZTE 250 29 —
Ethiopia 2006 Agreement Expand and upgrade Ethiopia's telecom network1
Ex-Im Bank, China ZTE 8500 — 822
Ethiopia 2007 Construction
First phase of fiber transmission backbone, expansion of mobile phone service for the Ethiopian millennium and expansion of wireless telephone
service1
Ex-Im Bank, China ZTE — 200 200
Ethiopia 2007 Construction GSM project phase II1 Ex-Im Bank, China ZTE — 478 478
Gambia, The 2005 Completed CDMA network for Gamtel Unknown Huawei — — —
Ghana 2003 Completed Ghana Telecom equipment supply, Phase 1
Ex-Im Bank, China ASB — 200 79
Ghana 2005 Agreement Ghana Telecom equipment supply, Phase 2
overnment, China;
Sinosure ASB — 80 67
Ghana 2005 Completed Build a CDMA 2000 1X network for Kasapa Telecom Unknown ZTE 500 — —
Ghana 2006 Construction National Fibre Backbone Project Ex-Im Bank, China Huawei — 70 31

70
Country
Year Status Project Chinese financier Contractors
Added capacity
(connections thousand)
Project Cost
(US$m)
Chinese Commitments
(US$m)
Ghana 2007 Construction Communication system for security agencies project
Ex-Im Bank, China ZTE — — unconfirmed
Lesotho 2007 Agreement Rehabilitate the Telecom Agricultural Network
Ex-Im Bank, China ZTE — — 30
Lesotho 2007 Construction Grant to establish television systems in several cities
Ministry of Commerce,
China Unknown — — 3
Mali 2005 Agreement Rehabilitate CDMA2000 1X WLL network in Bamako ZTE ZTE — 2 1
Mauritius 2006 Construction Milcom purchase by China Mobile Unknown China Mobile 250 — —
Niger 2001 Completed
Equip Niger Telecommunications Company (SONITEL) with GSM mobile system covering the city of
Niamey
Unknown ZTE — 8 unconfirmed
Niger 2001 Completed Tender for 51% ownership of Sonitel, Niger's state telecoms company, and
its mobile arm, Sahel Com ZTE ZTE — — 24
Nigeria 2002 Construction National Rural Telephony Project (NRPT), Phase 1
Ex-Im Bank, China Huawei; ZTE; ASB 150 200 200
Nigeria 2006 Completed Nigeria First Communication Sattelite NigComSat-1
Ex-Im Bank, China
China Great Wall Industry Corp. — — 200
Senegal 2007 Construction Build the e-government network Ex-Im Bank, China Huawei; CMEC — 51 51
Sierra Leone 2005 Completed
Provision of CDMA fixed wireless network to government-owned
Sierratel
Ex-Im Bank, China Huawei 100 17 17
Sierra Leone 2006 Construction Upgrade the rural telecom network Ex-Im Bank,
China Huawei — — 18
Sudan 2005 Agreement Sudan Telecom purchasing equipment from ZTE
Ex-Im Bank, China ZTE — — 200
Togo 2005 Completed Expansion and upgrade the GSM network of Togo Cellulaire
Ex-Im Bank, China ASB 100 17 unconfirmed
Zambia 2006 Construction Deploy fibre-optic lines over ZESCO power transmission network Unknown ZTE — 11 —
Zimbabwe 2004 Construction
Two contracts for telecom equipment supply with Zimbabwe 's state-owned fixed line operator TelOne and mobile
operator NetOne.
Ex-Im Bank, China Huawei — 332 unconfirmed
Telecom total 2,774 Notes: 1Part of US$ 1.5bln Ethiopia Millennium Project.
Source: World Bank–PPIAF Chinese Projects Database, 2007.
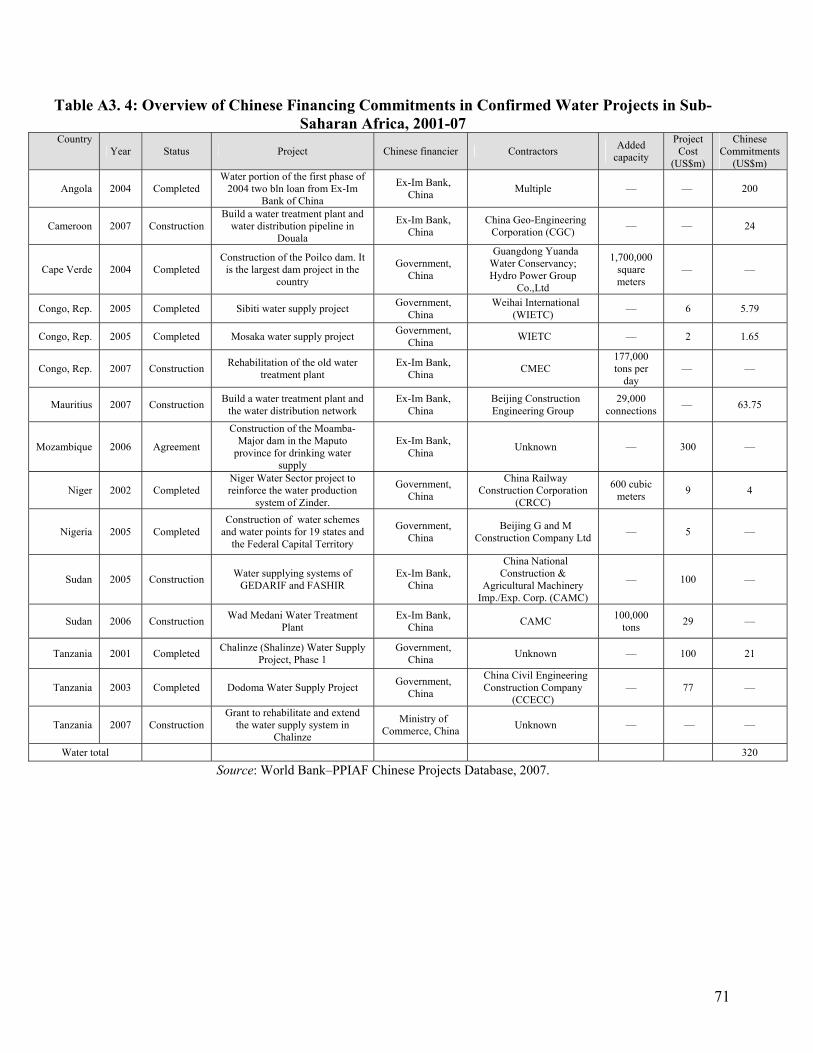
71
Table A3. 4: Overview of Chinese Financing Commitments in Confirmed Water Projects in Sub-Saharan Africa, 2001-07
Country Year Status Project Chinese financier Contractors Added
capacity
Project Cost
(US$m)
Chinese Commitments
(US$m)
Angola 2004 Completed Water portion of the first phase of
2004 two bln loan from Ex-Im Bank of China
Ex-Im Bank, China Multiple — — 200
Cameroon 2007 Construction Build a water treatment plant and
water distribution pipeline in Douala
Ex-Im Bank, China
China Geo-Engineering Corporation (CGC) — — 24
Cape Verde 2004 Completed Construction of the Poilco dam. It
is the largest dam project in the country
Government, China
Guangdong Yuanda Water Conservancy; Hydro Power Group
Co.,Ltd
1,700,000 square meters
— —
Congo, Rep. 2005 Completed Sibiti water supply project Government, China
Weihai International (WIETC) — 6 5.79
Congo, Rep. 2005 Completed Mosaka water supply project Government, China WIETC — 2 1.65
Congo, Rep. 2007 Construction Rehabilitation of the old water treatment plant
Ex-Im Bank, China CMEC
177,000 tons per
day — —
Mauritius 2007 Construction Build a water treatment plant and the water distribution network
Ex-Im Bank, China
Beijing Construction Engineering Group
29,000 connections — 63.75
Mozambique 2006 Agreement
Construction of the Moamba-Major dam in the Maputo
province for drinking water supply
Ex-Im Bank, China Unknown — 300 —
Niger 2002 Completed Niger Water Sector project to reinforce the water production
system of Zinder.
Government, China
China Railway Construction Corporation
(CRCC)
600 cubic meters 9 4
Nigeria 2005 Completed Construction of water schemes
and water points for 19 states and the Federal Capital Territory
Government, China
Beijing G and M Construction Company Ltd — 5 —
Sudan 2005 Construction Water supplying systems of GEDARIF and FASHIR
Ex-Im Bank, China
China National Construction &
Agricultural Machinery Imp./Exp. Corp. (CAMC)
— 100 —
Sudan 2006 Construction Wad Medani Water Treatment Plant
Ex-Im Bank, China CAMC 100,000
tons 29 —
Tanzania 2001 Completed Chalinze (Shalinze) Water Supply Project, Phase 1
Government, China Unknown — 100 21
Tanzania 2003 Completed Dodoma Water Supply Project Government, China
China Civil Engineering Construction Company
(CCECC) — 77 —
Tanzania 2007 Construction Grant to rehabilitate and extend
the water supply system in Chalinze
Ministry of Commerce, China Unknown — — —
Water total 320
Source: World Bank–PPIAF Chinese Projects Database, 2007.

72
Table A3. 5: Overview of Chinese Financing Commitments in Confirmed Multisector Projects in Sub-Saharan Africa, 2001-07
Source: World Bank–PPIAF Chinese Projects Database, 2007.
Country Year Status Project Chinese financier Contractors Added
capacity
Project Cost
(US$m)
Chinese Commitments
(US$m)
Nigeria 2006 Construction Lekki Free Trade Zone in Lagos,
Phase 1 (power plants, road network, manufacturing facilities)
CCECC-Beyond International Investment &
Development Co.
CCECC-Beyond International Investment &
Development Co., Lekki Global
Investment Co.
— 300 200
Angola 2004 Completed Remaining public works portion of the first phase of 2004 two bln loan
from Ex-Im Bank of China
Ex-im Bank, China Unknown — — 30
Angola 2007 Agreement Unallocated 2bln China Ex-Im Bank Loan of 2007 (for infrastructure)
Ex-im Bank, China Unknown — — 2,000
Total 2,230
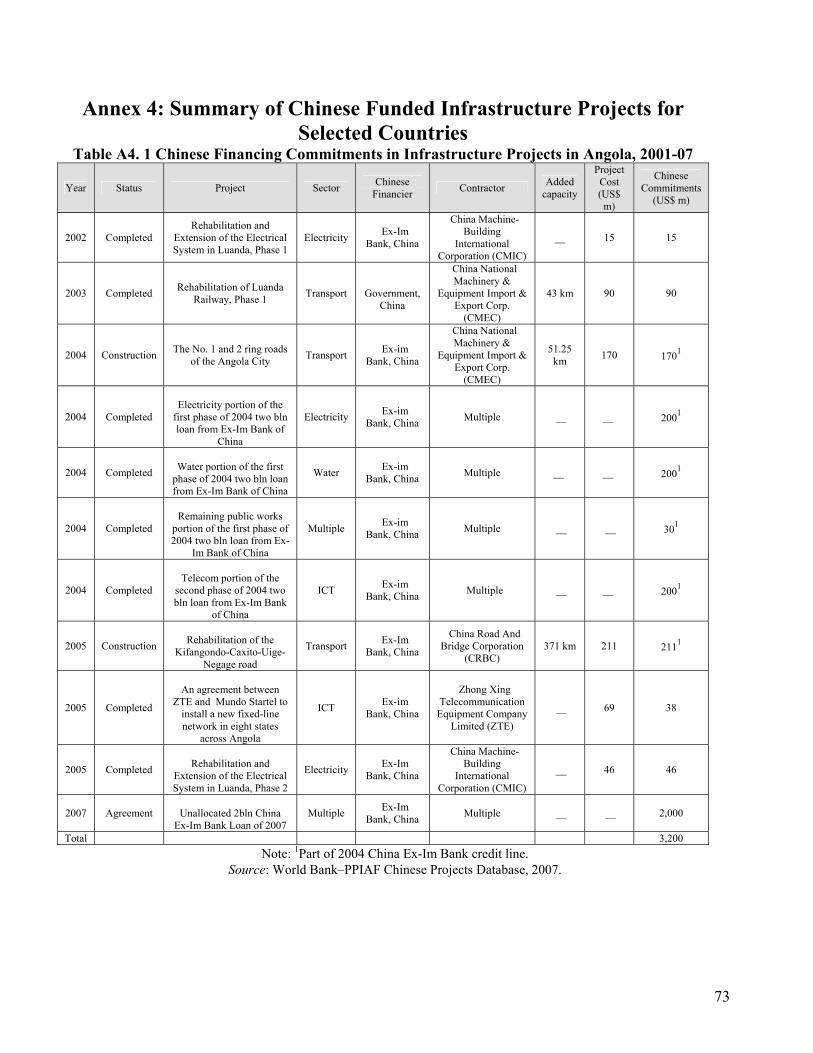
73
Annex 4: Summary of Chinese Funded Infrastructure Projects for Selected Countries
Table A4. 1 Chinese Financing Commitments in Infrastructure Projects in Angola, 2001-07
Year Status Project Sector Chinese Financier Contractor Added
capacity
Project Cost (US$
m)
Chinese Commitments
(US$ m)
2002 Completed Rehabilitation and
Extension of the Electrical System in Luanda, Phase 1
Electricity Ex-Im Bank, China
China Machine-Building
International Corporation (CMIC)
__ 15 15
2003 Completed Rehabilitation of Luanda Railway, Phase 1 Transport
Government,
China
China National Machinery &
Equipment Import & Export Corp.
(CMEC)
43 km 90 90
2004 Construction The No. 1 and 2 ring roads of the Angola City Transport Ex-im
Bank, China
China National Machinery &
Equipment Import & Export Corp.
(CMEC)
51.25 km 170 1701
2004 Completed
Electricity portion of the
first phase of 2004 two bln loan from Ex-Im Bank of
China
Electricity Ex-im Bank, China Multiple __ __ 2001
2004 Completed
Water portion of the first
phase of 2004 two bln loan from Ex-Im Bank of China
Water Ex-im Bank, China Multiple __ __ 2001
2004 Completed
Remaining public works
portion of the first phase of 2004 two bln loan from Ex-
Im Bank of China
Multiple Ex-im Bank, China Multiple __ __ 301
2004 Completed
Telecom portion of the
second phase of 2004 two bln loan from Ex-Im Bank
of China
ICT Ex-im Bank, China Multiple __ __ 2001
2005 Construction
Rehabilitation of the
Kifangondo-Caxito-Uige-Negage road
Transport Ex-Im Bank, China
China Road And Bridge Corporation
(CRBC) 371 km 211 2111
2005 Completed
An agreement between
ZTE and Mundo Startel to install a new fixed-line network in eight states
across Angola
ICT Ex-im Bank, China
Zhong Xing Telecommunication
Equipment Company Limited (ZTE)
__ 69 38
2005 Completed
Rehabilitation and
Extension of the Electrical System in Luanda, Phase 2
Electricity Ex-Im Bank, China
China Machine-Building
International Corporation (CMIC)
__ 46 46
2007 Agreement
Unallocated 2bln China Ex-Im Bank Loan of 2007
Multiple Ex-Im Bank, China Multiple __ __ 2,000
Total 3,200 Note: 1Part of 2004 China Ex-Im Bank credit line.
Source: World Bank–PPIAF Chinese Projects Database, 2007.

74
Table A4. 2: Chinese Financing Commitments in Infrastructure Projects in Nigeria, 2001-07 Year Status Project Sector Chinese Financier Contractor Added
capacity
Project Cost
(US$m)
Chinese Commitments
(US$m)
2002 Construction National Rural Telephony Project (NRPT), Phase 1 ICT Ex-Im Bank, China
Huawei; ZTE; Alcatel Shanghai
Bell (ASB)
150,226 conn. 200 200
2005 Construction
Construction of Papalanto Power Gas Turbine Power
Plant, in Ogun
Electricity Ex-im Bank, China Sepco 670 MW 360 298*
2006 Construction
Lekki Free Trade Zone in Lagos, Phase 1. The funds
will be used on power plants, road networks, and manufacturing facilities
Multiple
CCECC-Beyond International Investment & Development
CCECC-Beyond International Investment & Development
__ 300 200
2006 Distressed Modernization of the
Nigeria railway, Phase 1: Lagos-Kano railway
Transport Ex-Im Bank, China
China Civil Engineering Construction
Company (CCECC)
1315 km 8,300 2,500
2006 Completed Nigeria First
Communication Sattelite NigComSat-1
ICT Ex-im Bank, China China Great Wall Industry Corp. __ __ 200
2006 Construction Abuja Rail Mass Transit Project Transport Ex-Im Bank, China
China Guangdong Xinguang
International Group __ 2,000 1,000
2006 Distressed Construction of Mambilla
Hydro-Electric Power Plant in Taraba State
Electricity Ex-im Bank, China
China Gezhouba Group Corporation
(CGGC);China Geo-Engineering
Corporation (CGC)
2600 MW 1,460 1,000
Total 5,398
Note: Chinese financing commitments for the other two plants Omotosho and Geregu are not confirmed (see table A3.1). Source: World Bank–PPIAF Chinese Projects Database, 2007.
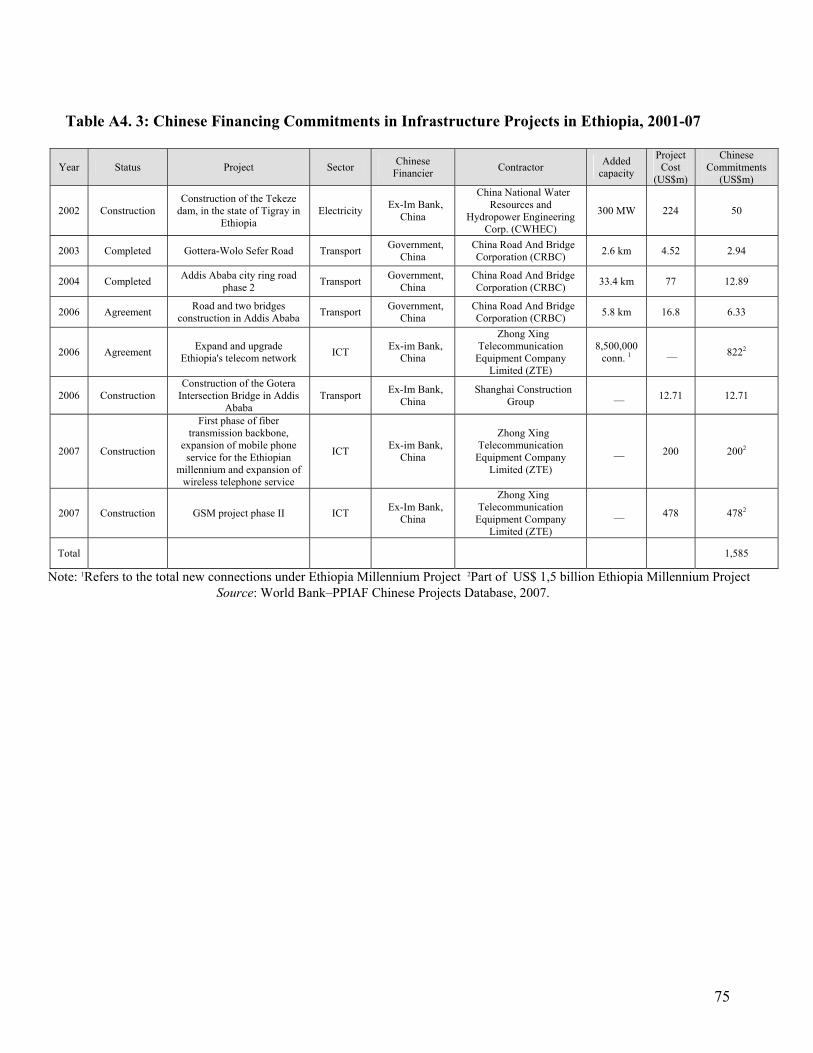
75
Table A4. 3: Chinese Financing Commitments in Infrastructure Projects in Ethiopia, 2001-07
Year Status Project Sector Chinese Financier Contractor Added
capacity
Project Cost
(US$m)
Chinese Commitments
(US$m)
2002 Construction Construction of the Tekeze
dam, in the state of Tigray in Ethiopia
Electricity Ex-Im Bank, China
China National Water Resources and
Hydropower Engineering Corp. (CWHEC)
300 MW 224 50
2003 Completed Gottera-Wolo Sefer Road Transport Government, China
China Road And Bridge Corporation (CRBC) 2.6 km 4.52 2.94
2004 Completed Addis Ababa city ring road phase 2 Transport Government,
China China Road And Bridge
Corporation (CRBC) 33.4 km 77 12.89
2006 Agreement Road and two bridges construction in Addis Ababa Transport Government,
China China Road And Bridge
Corporation (CRBC) 5.8 km 16.8 6.33
2006 Agreement Expand and upgrade Ethiopia's telecom network ICT Ex-im Bank,
China
Zhong Xing Telecommunication
Equipment Company Limited (ZTE)
8,500,000 conn. 1 __ 8222
2006 Construction Construction of the Gotera
Intersection Bridge in Addis Ababa
Transport Ex-Im Bank, China
Shanghai Construction Group __ 12.71 12.71
2007 Construction
First phase of fiber transmission backbone,
expansion of mobile phone service for the Ethiopian
millennium and expansion of wireless telephone service
ICT Ex-im Bank, China
Zhong Xing Telecommunication
Equipment Company Limited (ZTE)
__ 200 2002
2007 Construction GSM project phase II ICT Ex-Im Bank, China
Zhong Xing Telecommunication
Equipment Company Limited (ZTE)
__ 478 4782
Total 1,585
Note: 1Refers to the total new connections under Ethiopia Millennium Project 2Part of US$ 1,5 billion Ethiopia Millennium Project Source: World Bank–PPIAF Chinese Projects Database, 2007.
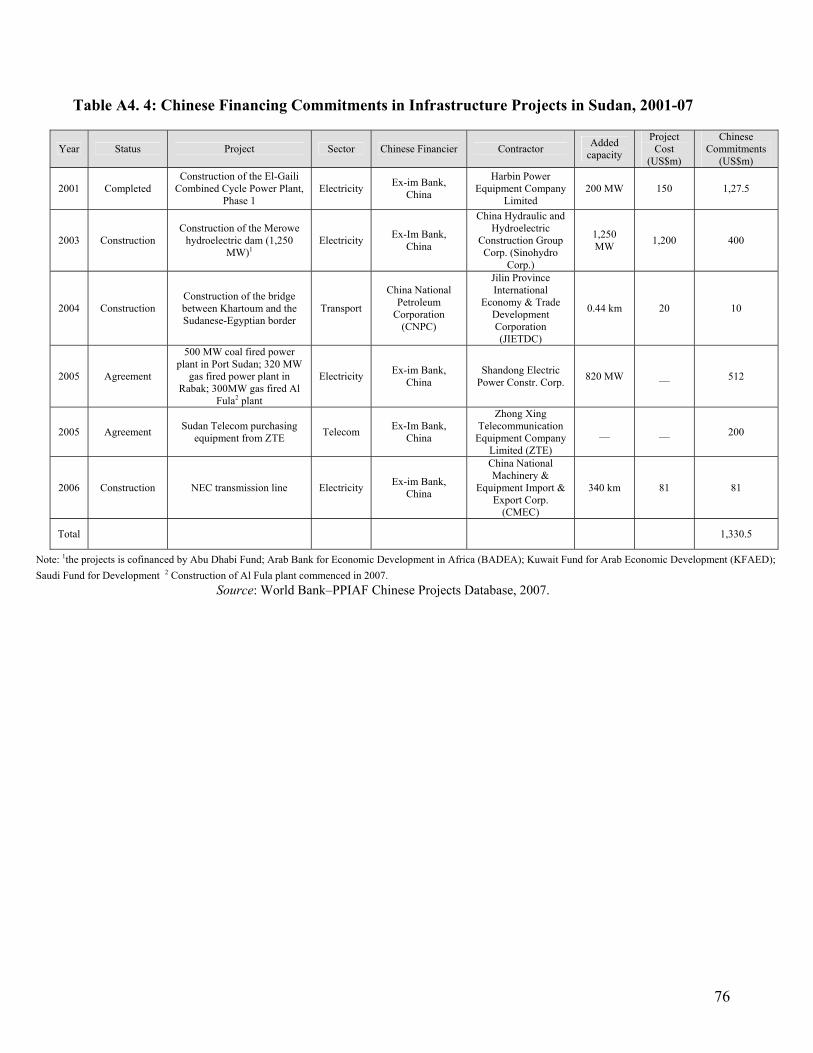
76
Table A4. 4: Chinese Financing Commitments in Infrastructure Projects in Sudan, 2001-07
Year Status Project Sector Chinese Financier Contractor Added capacity
Project Cost
(US$m)
Chinese Commitments
(US$m)
2001 Completed Construction of the El-Gaili
Combined Cycle Power Plant, Phase 1
Electricity Ex-im Bank, China
Harbin Power Equipment Company
Limited 200 MW 150 1,27.5
2003 Construction Construction of the Merowe
hydroelectric dam (1,250 MW)1
Electricity Ex-Im Bank, China
China Hydraulic and Hydroelectric
Construction Group Corp. (Sinohydro
Corp.)
1,250 MW 1,200 400
2004 Construction Construction of the bridge between Khartoum and the Sudanese-Egyptian border
Transport
China National Petroleum
Corporation (CNPC)
Jilin Province International
Economy & Trade Development Corporation (JIETDC)
0.44 km 20 10
2005 Agreement
500 MW coal fired power plant in Port Sudan; 320 MW
gas fired power plant in Rabak; 300MW gas fired Al
Fula2 plant
Electricity Ex-im Bank, China
Shandong Electric Power Constr. Corp. 820 MW __ 512
2005 Agreement Sudan Telecom purchasing equipment from ZTE Telecom Ex-Im Bank,
China
Zhong Xing Telecommunication
Equipment Company Limited (ZTE)
__ __ 200
2006 Construction NEC transmission line Electricity Ex-im Bank, China
China National Machinery &
Equipment Import & Export Corp.
(CMEC)
340 km 81 81
Total 1,330.5
Note: 1the projects is cofinanced by Abu Dhabi Fund; Arab Bank for Economic Development in Africa (BADEA); Kuwait Fund for Arab Economic Development (KFAED); Saudi Fund for Development 2 Construction of Al Fula plant commenced in 2007.
Source: World Bank–PPIAF Chinese Projects Database, 2007.

77
Annex 5 Summary of Chinese Funded Natural Resource Projects
Table A5. 1: Chinese Financing Interests in Confirmed Natural Resource Projects
Country Year Name Sector Subsector Financiers or Sponsors Project cost
Chinese financing
commitments
Angola 2003 In 2003, Sinopec acquired Block 3 in Angola Oil Exploration China Petroleum and Chemical
Corporation (SINOPEC) — —
Angola 2006 Sonaref: development of the
refinery in Lobito by SSI, cancelled
Oil Refinery Sonangol-Sinopec International (SSI) 3,000 cancelled
Angola 2006 Explore crude oil in Angola's
three offshore oil fields (blocks 15, 17, 18 )
Oil Exploration China Petroleum and Chemical Corporation (SINOPEC) 2,400 2,400
CAR 2007 Concession for oil block B in north-east near borders with
Chad and Sudan Oil Exploration China Poly Group Corporation;
IAS International Holding Co. —
—
Chad 2003
Purchase of a 50% stake in oil Block H from Cliveden
Petroleum of the UK by Citic and CNPC
Oil Exploration
China National Petroleum Corporation (CNPC); China
International Trust and Investment Corporation (CITIC)
45 —
Chad 2006 Purchase of 50 percent stake in oil block from Canadian
EnCana (Permit H) Oil Exploration China National Petroleum
Corporation (CNPC) 203 203
Chad 2007 Build first oil refinery in Chad to the north of N'Djamena Oil Refinery China National Petroleum
Corporation (CNPC) —
Congo, Dem. Rep. 2003 New copper alloy and cobalt
plant in Katanga Minerals Copper Wambao Resources — —
Congo, Dem. Rep. 2004 Rent three copper mines and
collect cobalt Minerals Copper, cobalt Xinglong Bicycle Co. Ltd. — —
Congo, Dem. Rep. 2005 Development of Musonoi
copper and cobalt mine Minerals Copper, cobalt
China National Overseas Engineering Corporation
(COVEC) — 100
Congo, Dem. Rep. 2005 Establish a JV, Huaxin Mines
Co. Ltd. Minerals Copper Shanghai Industrial Investment (Holdings) Co. Ltd. — —
Congo, Dem. Rep. 2006 Develop the Kalumbwe-
Myunga copper-cobalt mine Minerals Copper, cobalt
China Railway Engineering Group Co. Ltd. (CREGC); Ex-
Im Bank, China 270 270
Congo, Dem. Rep. 2007
Purchase of the prospecting and mining rights to a cobalt
mine in Lubumbashi Minerals Cobalt Dalian Xinyang High-Tech
Development (DLX) 2 unconfirmed
Congo, Rep. 2005 Two oil field concessions: Marine XII and Haute Mer B. Oil Exploration China Petroleum and Chemical
Corporation (SINOPEC) — —
Cote d'Ivoire 2005 Manganese ore project Minerals Manganese China National Geological and Mining Corporation — —
Equatorial Guinea 2006 Exploration of oil block S Oil Exploration China National Offshore Oil
Corporation (CNOOC) — —
Eritrea 2006 Exploration rights for copper mine Minerals Copper China National Geological and
Mining Corporation — —
Eritrea 2006 Jointly develop a gold mine Minerals Gold China National Geological and Mining Corporation — —
Eritrea 2007 Explore gold and copper in Kenatib and Defere Minerals Copper, gold Beijing Southeast Resources
Company Limited — —
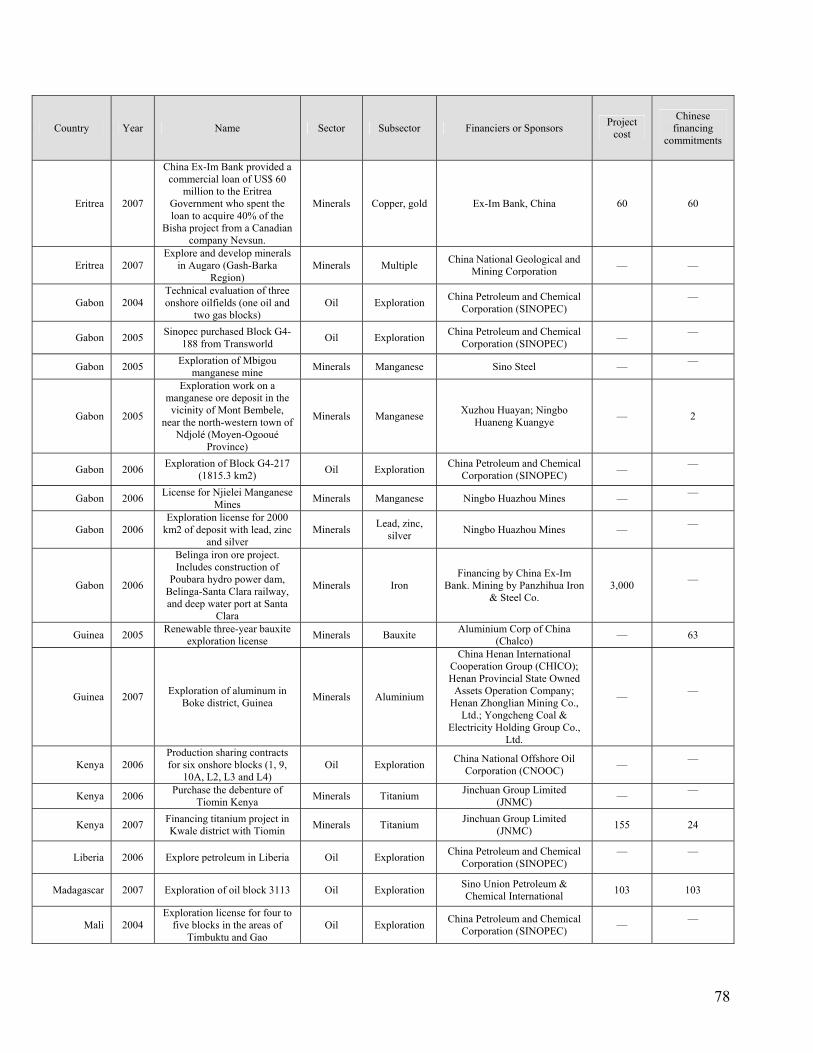
78
Country Year Name Sector Subsector Financiers or Sponsors Project cost
Chinese financing
commitments
Eritrea 2007
China Ex-Im Bank provided a commercial loan of US$ 60
million to the Eritrea Government who spent the loan to acquire 40% of the
Bisha project from a Canadian company Nevsun.
Minerals Copper, gold Ex-Im Bank, China 60 60
Eritrea 2007 Explore and develop minerals
in Augaro (Gash-Barka Region)
Minerals Multiple China National Geological and Mining Corporation — —
Gabon 2004 Technical evaluation of three onshore oilfields (one oil and
two gas blocks) Oil Exploration China Petroleum and Chemical
Corporation (SINOPEC) —
Gabon 2005 Sinopec purchased Block G4-188 from Transworld Oil Exploration China Petroleum and Chemical
Corporation (SINOPEC) — —
Gabon 2005 Exploration of Mbigou manganese mine Minerals Manganese Sino Steel — —
Gabon 2005
Exploration work on a manganese ore deposit in the
vicinity of Mont Bembele, near the north-western town of
Ndjolé (Moyen-Ogooué Province)
Minerals Manganese Xuzhou Huayan; Ningbo Huaneng Kuangye — 2
Gabon 2006 Exploration of Block G4-217 (1815.3 km2) Oil Exploration China Petroleum and Chemical
Corporation (SINOPEC) — —
Gabon 2006 License for Njielei Manganese Mines Minerals Manganese Ningbo Huazhou Mines — —
Gabon 2006 Exploration license for 2000
km2 of deposit with lead, zinc and silver
Minerals Lead, zinc, silver Ningbo Huazhou Mines — —
Gabon 2006
Belinga iron ore project. Includes construction of
Poubara hydro power dam, Belinga-Santa Clara railway, and deep water port at Santa
Clara
Minerals Iron Financing by China Ex-Im
Bank. Mining by Panzhihua Iron & Steel Co.
3,000 —
Guinea 2005 Renewable three-year bauxite exploration license Minerals Bauxite Aluminium Corp of China
(Chalco) — 63
Guinea 2007 Exploration of aluminum in Boke district, Guinea Minerals Aluminium
China Henan International Cooperation Group (CHICO); Henan Provincial State Owned
Assets Operation Company; Henan Zhonglian Mining Co.,
Ltd.; Yongcheng Coal & Electricity Holding Group Co.,
Ltd.
— —
Kenya 2006 Production sharing contracts for six onshore blocks (1, 9,
10A, L2, L3 and L4) Oil Exploration China National Offshore Oil
Corporation (CNOOC) — —
Kenya 2006 Purchase the debenture of Tiomin Kenya Minerals Titanium Jinchuan Group Limited
(JNMC) — —
Kenya 2007 Financing titanium project in Kwale district with Tiomin Minerals Titanium Jinchuan Group Limited
(JNMC) 155 24
Liberia 2006 Explore petroleum in Liberia Oil Exploration China Petroleum and Chemical Corporation (SINOPEC)
—
—
Madagascar 2007 Exploration of oil block 3113 Oil Exploration Sino Union Petroleum & Chemical International 103 103
Mali 2004 Exploration license for four to
five blocks in the areas of Timbuktu and Gao
Oil Exploration China Petroleum and Chemical Corporation (SINOPEC) — —

79
Country Year Name Sector Subsector Financiers or Sponsors Project cost
Chinese financing
commitments
Mauritania 2004 Exploration of Block 12 and two areas in Block 13 Oil Exploration China National Petroleum
Corporation (CNPC) — —
Mauritania 2005 65% stake in oil and gas exploration block 20 Oil Exploration China National Petroleum
Corporation (CNPC) — 9
Mozambique 2003 Exploration licenses for Manica and other Minerals Gold Jiangsu Geology & Mineral
Resources Bureau — —
Mozambique 2004 Sub-contract to build nine oil product storage tanks Oil Other China National Petroleum
Corporation (CNPC) 220 —
Multiple countries 2006
The state-owned bank funded a purchase of 1.1 percent of
Anglo by China Vision Resources Ltd, the investment vehicle of Chinese billionaire
Larry Yung
Minerals Multiple China Vision Resources with
financing from China Development Bank (CDB)
— 783
Namibia 2005
Permits for 4 prospecting licenses for deposits of
copper, lead, zinc, silver, gold, uranium, and stone
Minerals
Copper, lead, zinc, silver,
gold, uranium,
stone
Namibia (China) Mining Resources Investment and
Development Co. Ltd. — —
Niger 2003 License for the exploration of Block BILMA Oil Exploration China National Petroleum
Corporation (CNPC) —
Niger 2006 Drill exploration wells in Tenere Oil Block Oil Exploration China National Petroleum
Corporation (CNPC) 44 unconfirmed
Niger 2006 Explore Teguidda and
Madaouela uranium mineral deposits
Minerals Uranium China Nuclear International
Uranium Corporation (Sino U); ZXJOY Invest
—
—
Niger 2007 Develop Azelik uranium
mineral deposit, in Agadez region
Minerals Uranium China Nuclear International Uranium Corporation (Sino U) 335 —
Nigeria 2004 Oil exploration contract for Blocs 64 and 66 in the Chad
Basin Oil Exploration China Petroleum and Chemical
Corporation (SINOPEC) 2,270 unconfirmed
Nigeria 2006
45% of interest in an offshore oil exploitation license
OML130 which comprises Akpo Oilfield and 3 other
discoveries
Oil Exploration China National Offshore Oil Corporation (CNOOC) 2268 2,692
Nigeria 2006 35% working interest in the Nigeria OPL 229 Oil Exploration China National Offshore Oil
Corporation (CNOOC) — 60
Nigeria 2006 Acquisition of a 51% stake in
the Kaduna refinery and rehabilitation
Oil Refinery China National Petroleum Corporation (CNPC) — 2,000
Nigeria 2006 License for four oil blocks OPL 471, 721, 732 and 298 Oil Exploration China National Petroleum
Corporation (CNPC) 16 unconfirmed
Nigeria 2006 Provide seismic exploration service Oil Exploration China Petroleum and Chemical
Corporation (SINOPEC) — 10
Nigeria 2006 Negotiating with Nigeria on
the priority rights to purchase offshore blocks
Oil Exploration China National Offshore Oil Corporation (CNOOC) — —
Nigeria 2006 Asphalite mine Minerals Asphalite China Petroleum and Chemical Corporation (SINOPEC) — 19
Nigeria 2007 CNOOC was granted 4 oil districts Oil Exploration China National Offshore Oil
Corporation (CNOOC) — —

80
Country Year Name Sector Subsector Financiers or Sponsors Project cost
Chinese financing
commitments
Nigeria 2007 Three development projects for sugar, hydro power, and
solid minerals in Zamfara state Multiple
Hydro power, minerals, and
sugar Reofield Industries Ltd 300 —
Nigeria 2007
Exploration of solid minerals in Zamfara and oil in the North Western Nigerian
Sokoto Basin
Multiple Oil and solid minerals
Zhognho Overseas Construction Engineering Company Limited 300 300
Sao Tome and Principe 2006
License for Block 2 in the Gulf of Guinea Joint
Development Zone (JDZ) Oil Exploration China Petroleum and Chemical
Corporation (SINOPEC) 17.75 unconfirmed
South Africa 2006 Chromium development
project, which includes 1 mine and a concentration factory
Minerals Chromium Jiuquan Iron&Steel company (JISCO) — 330
South Africa 2006 Purchase the 50% share in
chromium and smelteries from Samancor Chrome
Minerals Chromium Sino Steel — 200
South Africa 2007 Exploration of chromium in Naboom in South Africa Minerals Chromium Minmetals Development Co.,
Ltd. — 7
South Africa 2007 South African ferro-chrome project, Phase 2 Minerals Iron,
chromium Jiuquan Iron&Steel company
(JISCO) 510 510
Sudan 2001 Heglig and Unity oil fields (Blocks 1, 2 and 4) Oil Exploration China National Petroleum
Corporation (CNPC) 144 unconfirmed
Sudan 2002 Petrodar Operating Company, developing Block 3 and 7 Oil Exploration China National Petroleum
Corporation (CNPC) —
—
Sudan 2003 Expand the capacity of Khartoum refinery Oil Refinery China National Petroleum
Corporation (CNPC) 150 unconfirmed
Sudan 2003 Exploration of the Tiki-1 Test Well in 3/7 Oil Area Oil Exploration Zhongyuan Petroleum
Exploration Bureau (ZPEB) 1 unconfirmed
Sudan 2003
Construction of a 750 km 200,000 b/d pipeline to move
oil from Block 6 in the southern Kordofan field to the Khartoum refinery and north
to Port Sudan
Oil Distribution China National Petroleum Corporation (CNPC) 350 unconfirmed
Sudan 2005 Exploration of offshore gas Block 15 within the Red Sea
Basin
Natural gas Exploration China National Petroleum
Corporation (CNPC) 20 —
Sudan 2006 Explore gold in a 6000 km2 field Minerals Gold North China Geological
Exploration Bureau —
4
Sudan 2007 40% stake in Block 13, off the coast of the Red Sea Oil Exploration China National Petroleum
Corporation (CNPC) —
—
Tanzania 2006 Technical support service to
expand the production capacity of a coal mine
Minerals Coal Shanxi Fenwei Energy Consulting Co., Ltd.
—
—
Zambia 2003 Coal mine at the old Nkandabbwe mine in Sinazongwe district
Minerals Coal Collum Coal Mining Industries Limited 25 unconfirmed
Zambia 2004 Develop manganese mine near industrial town Kabwe Minerals Manganese Chiman Manufacturing Ltd. 10 unconfirmed
Zambia 2005
Construction of wet-process smelting plant and sulfur-to-
acid plant at Chambishi copper mine
Minerals Copper smelter plant
China Nonferrous Metal Mining (Group) Co. Ltd. (CNMC) 20 20
Zambia 2006 Construction of the Chambishi Copper Smelter (CCS) Minerals Copper
smelter plant
China Nonferrous Metal Mining (Group) Co. Ltd.
(CNMC);Yunnan Copper Industry (Group) Co. Ltd
200 100

81
Country Year Name Sector Subsector Financiers or Sponsors Project cost
Chinese financing
commitments
(YNCIG)
Zambia 2006 Munali Nickel Project Minerals Nickel Jinchuan Group Limited (JNMC); Jinchuan Group
Limited (JNMC)
— 25
Zambia 2007 Chambishi West Ore Body Project Minerals Copper China Nonferrous Metal Mining
(Group) Co. Ltd. (CNMC) 100 100
Zimbabwe 2007
Acquisition of 92% in Mauritius based company
ZCE, the owner of the Zimbabwe's largest chromium
producer Zimasco, by Sino Steel
Minerals Chromium Sino Steel; Sino-Africa Fund — 200
Zimbabwe 2007 Develop coal in Zimbabwe Minerals Coal Sanxing Coal —
—
Zimbabwe 2007
A joint venture with Zimbabwe National Power Company to develop and
operate the Sinamatella Coal Field and coal fields in
Western Zimbabwe
Minerals Coal
China National Aero-Technology Import & Export Co. (CATIC); Pingdingshan
Coal (Group) Co., Ltd.
—
—
Total 10,591
Source: World Bank–PPIAF Chinese Projects Database, 2007.