Embed Size (px)
Citation preview

BUILDING BLOCKS FOR SUCCESS

Copyright Tech Strategy Partners and SSPA; Written permission required for reproduction
Defending and Enhancing the Value of Support & Maintenance
SSPA and
Tech Strategy Partners
April 27, 2005

3
Maturation phase
Support Challenge Varies by Stage of Software Company
Slowing growth phase
• Nominal growth, flat or declining license revenues
• Saturated installed base
• License revenues still growing, but slowly
• Large installed base
• Rapid license growth • Small installed base
• Increased penetration of installed base
• New customer acquisition
• Increased penetration of installed base
• New customer acquisition is top priority
Growth profile
Growth lever
• Sustain revenue growth • Maintain profitability
• Increase share of overall revenue
• Improve profitability
• Quality support and low TCO to enable product adoption
Key Support challenge
Source: Tech Strategy Partner Analysis
Focus of today’s discussion
Accelerating growth phase
4
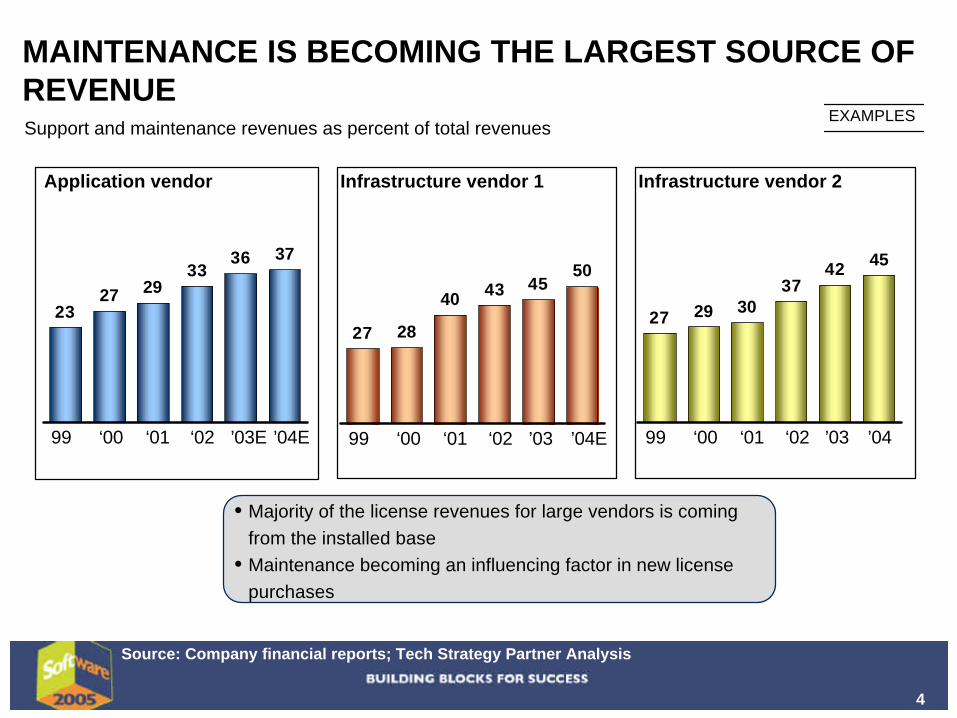
MAINTENANCE IS BECOMING THE LARGEST SOURCE OF REVENUE
Source: Company financial reports; Tech Strategy Partner Analysis
2327 29
3336 37
99 ’04E ’03E ‘00 ‘01 ‘02
Infrastructure vendor 1
27 28
40 43 4550
99 ’04E ’03 ‘00 ‘01 ‘02
27 29 3037
42 45
99 ’04 ’03 ‘00 ‘01 ‘02
Application vendor Infrastructure vendor 2
Support and maintenance revenues as percent of total revenuesEXAMPLES
• Majority of the license revenues for large vendors is coming from the installed base
• Maintenance becoming an influencing factor in new license purchases

5
Mainte-nance
New license
Services
MAINTENANCE IS THE MAIN PROFIT ENGINE FOR LARGE ISVs
Revenue mix and cost allocation% share of the three revenue streams6
1 – COGS for support is cost reported in financial statements for software license updates & technical support2 – Assumed that 75% of R&D for mature products is for updates, bug fixing, and non-revenue generating enhancements 3 – Assumed that 80% of S&M is towards new license sales4 – Assumed in the ratio of the revenues 5 - Ignored non operating income, Number of shares outstanding 5.3billion, Tax @ 32%6 - Numbers do not add to 100 because of rounding offSource: Financial reports; interviews; Tech Strategy Partners Analysis
35
45
21
Share of Revenues
35
45
80
20
25
75
24
76
Share of COGS1
Share of R&D2
21
Share of S&M3
Share of G&A4
34
61
5
Share of EPS5
EPS share%
FY 2004, ESTIMATESINFRATRUCTURE VENDOR

6
3 Key Drivers of Profitability of Support & Maintenance
Profits
Expenses
Revenues
Cost per call
Number of calls per maint. $
• Pricing and packaging • Attach rates• Renewal rates
• Mix of electronic vs. phone support• Duration of calls: type of call,
automation, self-diagnostics and knowledge management
• Offshore vs. onshore resources
• Case avoidance: product supportability/ quality, self service, proactive support
• Support policy • Dependency with/on other systems
Key contributors
Source: Tech Strategy Partner Analysis

7
-(5%)
Risk of Profitability Erosion
Current operating margin
Reduction due to 10% drop in maintenance revenue
Reduction due to 10% increase in cost to serve
Potential future operating margin
• Pricing pressure • Shift from premium to basic
packages• Cancellation of contracts
Operating marginPercent
• Increased R&D (more frequent upgrade cycle)
• Increased support costs (local language support, on-site support, etc.)
Company context • $300-500M in revenues
• Maintenance share of revenues 40-50%
• Maintenance operating at gross margin of 80% and operating margin of 25%
• Maintenance accounts for more than 100% of operating profits
5%
-(3%) -(3%)
Source: Tech Strategy Partner Analysis

8
11
12
14
18
28
64
Reducing contract length
Increase service level
Increase contract length
Reduce service level
Make no changes
Negotiate lower price for same level of service
Objective of maintenance contract renegotiation
Typically linked to price reduction
• Customers getting increasingly sophisticated with pricing renegotiations
• Customers have greater leverage than before (buyers market) in pricing
• Cancellations still relatively rare, as yet
% of responses, multiple responses allowed, n = 193
Main Cause for Profitability Erosion: CIO Vigil on Support and Maintenance Pricing
Source: SSPA and Tech Strategy Partner Research – Enterprise Support Demand 2005
9
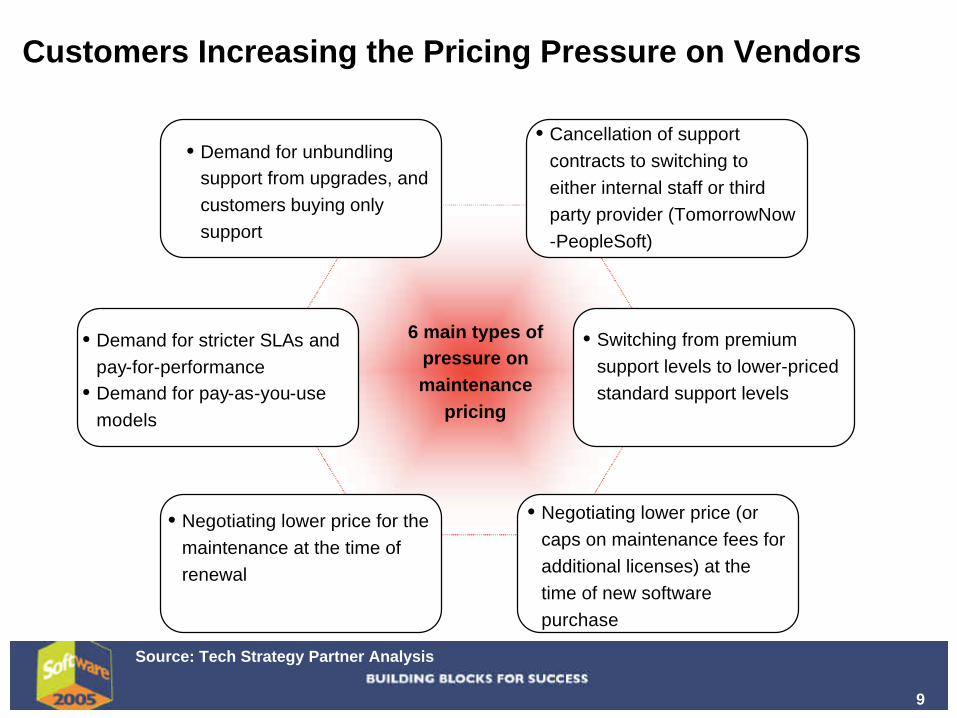
Customers Increasing the Pricing Pressure on Vendors
• Demand for unbundling support from upgrades, and customers buying only support
• Switching from premium support levels to lower-priced standard support levels
• Negotiating lower price for the maintenance at the time of renewal
• Demand for stricter SLAs and pay-for-performance
• Demand for pay-as-you-use models
• Cancellation of support contracts to switching to either internal staff or third party provider (TomorrowNow-PeopleSoft)
6 main types of pressure on maintenance
pricing
Source: Tech Strategy Partner Analysis
• Negotiating lower price (or caps on maintenance fees for additional licenses) at the time of new software purchase

10
SSPA ROI COMMITTEE SURVEY QUESTIONSSPA ROI COMMITTEE SURVEY QUESTION::
What % of Your Maintenance and Support Renewals Are Processed From Quote to Invoice Without Any Concessions to Your Renewal Policies or Prices?
27%<50%
9%50-70%
18%70-80%
18%80-90%
27%90-100%
Vendors Forced to Offer Concessions
Source: Survey of 20 technology companies, SSPA ROI committee

11
Support and Maintenance Has a 4-Pronged Value Proposition
Source: Tech Strategy Partner Analysis and SSPA ROI Committee
Total value from support and maintenance
Provide new functionality & features
Ensure quick recovery from
outages
Lower cost of operations
• Upgrades• Updates and service packs • Ability to influence future product roadmap
• Help-desk (level 1, 2 and 3 support) • Local language support • Multi-vendor diagnostics and support • On-site support • Priority access to support resources• Support for old/sun-set products
• Best practices for deployment and management • Upgrade management tools and services • Custom application support • Patch management
Contain or prevent IT
risks
• Performance monitoring, optimization and tuning • Security monitoring • Availability monitoring, provisioning and resource
management
Examples of features

12
Vendors Need to Stress the Main Source of Value
Source: Tech Strategy Partner Analysis
Total value from support and maintenance
Provide new functionality & features
Ensure quick recovery from
outages
Lower cost of operations
• New IT functionality (e.g., support for open-source)
• Lower help-desk labor cost
• Lower hardware, software and operations labor cost
Contain or prevent IT
risks
• Lower operations labor cost and reduced need to buy specialized software
IT Value
• New business functionality (e.g., tax update)
• Downtime loss prevention
• None
• Business-value-at-risk protection
Business Value
Most compelling source of value

13
For Example: Business Value of Quick Recovery Far Exceeds the IT Value
Source: SSPA ROI Committee; Tech Strategy Partner Analysis
Value of “ensuring quick recovery from
outages”$13M
Savings per event
$75.2K
Avg. no. of events per
year175
Labor cost savings per
event: $225
Time saved due to
expertise: 1.5 hours
Labor rate: $150/hour
Downtime loss prevention per event: $75K
Time saved due to
expertise: 1.5 hours
Downtime loss rate : $1M/hour
Probability of downtime:
5%
Value to IT organization
Value to business users
X
+
X
X

14
Challenges Vendor Face in Communicating a Compelling Value Proposition
Source: Tech Strategy Partner Analysis
• Value of staying current on functionality and releases is diminishing for a large category of software products
• Cost of patches and upgrades makes the ROI even weaker
• Value of quick recovery communicated in IT-value terms as opposed to business-value
• Vendors rarely offer SLA guarantees, only offer response time as opposed to resolution times
• Customer satisfaction with vendor performance, e.g., hold times, first-time fix, etc. is generally low
• Few vendors have offerings that really address cost of operations (with the exception for vendors who offer hosted solutions)
• Vendors rarely articulate the value of lowering TCO
Total value from support and maintenance
Provide new functionality & features
Ensure quick recovery from
outages
Lower cost of operations
Contain or prevent IT
risks
Issues with the vendor value proposition
• Few vendors have the expertise and technology to do real-time monitoring of IT systems, e.g., generate alerts, apply proactive fixes, etc. (with the exception of h/w systems and security vendors)

15
Structuring a Program to Defending Value of Maintenance
Sales & marketing initiatives
Support initiatives
Short-term Medium-term Long-term
• Streamline sales tactics • Articulate real support
value
Product initiatives
• Improve quality to reduce downtime occurrences• Enhance supportability to accelerate recovery • Enhance manageability to lower cost of operations
• Modify support programs
• Reduce cost: offshore, automate, etc.
• Offer proactive support • Provide manage care programs to address IT risks
and lower cost of operations
Structural changes in product and support to drive new growth
Tactical defense & cost containment
Overall focus
Source: Tech Strategy Partner Analysis and SSPA ROI Committee

16
Back up slides

17
Potential to Increase Profitability of a “Growing Product”
2x
1x
2x
5x
Increaserevenues 2x• Improve
renewals• Change pricing
Reduce calls by 50%
• Self-service• Product
enhancements
Reduce callcost by 25%• Move offshore • Better self-
diagnostics • Improved
productivity
Improved profitability
Client context • $300-500M revenues• Single digit growth • Maintenance less than
20% of overall revenues • Large installed base
1x
Initial profitability
Source: Tech Strategy Partner Analysis

18
Baseline: (Commonly done by companies regardless of (Commonly done by companies regardless of effectiveness level)effectiveness level)• Multi-channel service• Web self service• Customer satisfaction surveys• Enhancement request process• Product related webinars• Published escalation process• Support of customized environment
Differentiators: (Done by companies that have high degree of (Done by companies that have high degree of success at preserving maintenance revenue)success at preserving maintenance revenue)• Customer specific reports• Published product lifecycles• Customer user groups• Support certifications and awards• Automated license tracking and renewals• User friendly/environment specific release notes
Support Offering Practices For Protecting the Maintenance Revenue Stream
Source: Survey of 20 technology companies, SSPA ROI committee

19
•Requiring maintenance and support at the time of purchase •Pricing based on net licenses fees:
– Price based on list price invites discount negotiations• Entitlement Enforcement
– Key to demonstrating value•No discounting:
– only discounting occurs for multi-year deals – VP or above approval
• Maintenance and support increase caps•Keep support offerings simple / bundled:
– Fewer, clearly-defined offerings– If the range of your offerings is too broad and/or unbundled, it
invites negotiation for higher level support elements to be included for lower level price
Maintenance Policies/Practices Best Practices
Source: Survey of 20 technology companies, SSPA ROI committee

20
•Trained on support level offerings and benefits•Solid, repeatable renewal process•Current and accurate Entitlement reports•Fact sheets and support collateral for customers•Templates for: initial notice email, cancellation notices, shelf-ware, multi-year •Proof or Evidence of Value•Customer references, testimonials•Satisfaction results at the event and executive levels•Employee satisfaction, education, certification levels•Industry certifications and awards•Presentations on the value of the support organization
Sales Tools Best Practices
The Armed Sales Force
Source: Survey of 20 technology companies, SSPA ROI committee

21
Vendors Fail to Articulate the “Hidden Value” of Support
100% 23% Downtime Insurance
100% 33% Priority access to dedicated support resource
20% 38% Access to Design & Development team
57% 54% Support for customer’s customization
29% 58% Multi-Vendor support
17% 92%Defect Protection
15% 100%Access to trouble-shooting expertise
9% 85% Support for old/sunsetted versions
Premium offering
Standard offering
Support features
46%
46%
54%
54%
85%
Optimization and Tuning services
Manage upgrade process (project management)
Access to Best Practices and Benchmarks
Local Language support
Access to Software Release Updates
67%
33%
57%
0%
27%
Source: Survey of 20 technology companies, SSPA ROI committee


![[XLS] · Web viewIncome Statement Summary Non-operating income Total Airport Revenues Operating aeronautical revenues Ground handling revenues Operating non-aeronautical revenues](https://img.pdfslide.us/doc/110x75/5acac1f37f8b9a7d548e1826/xls-viewincome-statement-summary-non-operating-income-total-airport-revenues-operating.jpg)