Embed Size (px)
Citation preview

ANNUAL REPORT 2016
BUILDING A HEALTHY FUTURE.

APOLLO HEALTH AND WELLNESS CENTRE, AUCKLAND.
LINGARD PRIVATE HOSPITAL, MEREWETHER, NSW.

VALUE OF PORTFOLIO
$951.9MOCCUPANCY
99.6%AVERAGE ANNUAL LEASE EXPIRY (BY INCOME) OVER THE NEXT TEN YEARS
1.8%WEIGHTED AVERAGE LEASE TERM TO EXPIRY (WALE)
18.4YEARS
VITAL’S GREAT VITAL’S GREAT PORTFOLIO AND PORTFOLIO AND CAPITAL POSITION CAPITAL POSITION PROVIDES THE PROVIDES THE PLATFORM FOR PLATFORM FOR BUILDING A HEALTHY FUTURE.

Acute hospital 69%
Rehabilitation hospital 2%
Mental health hospital 12%
Medical office building 10%
Aged care 5%
Strategic 2%
Asset type by value
AGED CARETenant and asset diversificationVital settled the acquisition of four aged care properties, two in New South Wales and two in Western Australia. The properties are leased to Hall & Prior, one of Australia’s leading private aged care operators, on 20-year leases. At 5% by value, they bring additional tenant and asset diversification to the portfolio.
CAPITAL RAISINGSupporting delivery of strategyPost-balance date Vital completed the $160m capital raise. These funds will be used to reduce Vital’s bank debt and to pursue development, acquisition and growth opportunities.
$160M
STRATEGIC ACQUISITIONSSecuring long-term value, strengthening relationshipsVital’s strategy of acquiring land and properties surrounding existing assets will facilitate growth to meet demand. Six properties are currently held for development, all part of our long-term planning for building a healthy future.
REVALUATIONSReflecting larger, more modern, better performing assetsThe annual portfolio revaluation resulted in an increase of $101.9m on carrying book value, a 12.2% increase. The strong uplift demonstrates that the brownfield development programme continues to create long-term value. Investment properties are now valued at $951.9m.
$101.9M
BUILDING A HEALTHY
FUTURE

NEW ZEALAND ACQUISITIONReaffirms commitment to New ZealandIn 2016 we announced the $30.7m conditional acquisition* of the 38-bed Boulcott Private Hospital in Lower Hutt. The hospital is leased to ASX-listed Pulse Health Group on a 22-year lease and is Vital’s first asset co-located with a major public hospital in New Zealand.
* Settled on 1 July 2016
“ With the business in great shape, we’ll continue to focus on delivering sustainable distributions to investors”.DAVID CARR, CHIEF EXECUTIVE OFFICER
PEOPLEAdditional resourcing, experience and expertiseAs opportunities across the market continue to grow, Vital’s manager has expanded its team. In April Cameron Ramsay was appointed as National Acquisitions Manager in Australia to help deliver on the Board’s scale and diversification strategy.
PORTFOLIO METRICSIncome certainty and stabilityProactive portfolio management has resulted in Vital’s average annual lease expiry over the next decade reduced to just 1.8% p.a. The portfolio WALE has also increased to 18.4 years, over three times the NZ listed property sector average and the longest in Australasia.

LIFT IN ANNUALISED CASH DISTRIBUTION PER UNIT
FROM 2016 Q3 TO
8.5CENTS
PAYOUT RATIO
71%
CONTINUED INVESTOR SUPPORT FOR STRATEGY DELIVERS
13.9%10-YEAR COMPOUND ANNUAL
GROWTH RATE
CONTENTS
5 FINANCIAL SUMMARY6 INDEPENDENT CHAIRMAN’S REPORT8 CHIEF EXECUTIVE OFFICER’S REPORT10 PROPERTY PORTFOLIO18 BOARD OF DIRECTORS OF THE MANAGER20 THE MANAGEMENT TEAM
22 CORPORATE GOVERNANCE26 FINANCIAL STATEMENTS54 INDEPENDENT AUDITOR’S REPORT55 UNITHOLDER STATISTICS57 DIRECTORY
HIGHLIGHTS FOR 2016
DEVELOPMENT PROGRAMME SUPPORTS REVALUATION UPLIFT
ON 30 JUNE 2016 BOOK VALUE
$101.9MUP 12.2%
12-MONTH TOTAL RETURN
43%
NET DISTRIBUTABLE INCOME
$40.2MUP 10.9%
GROSS RENTAL INCOME
$70.4MUP 15.7%
NET TANGIBLE ASSET INCREASE TO
$1.51UP 18.9%
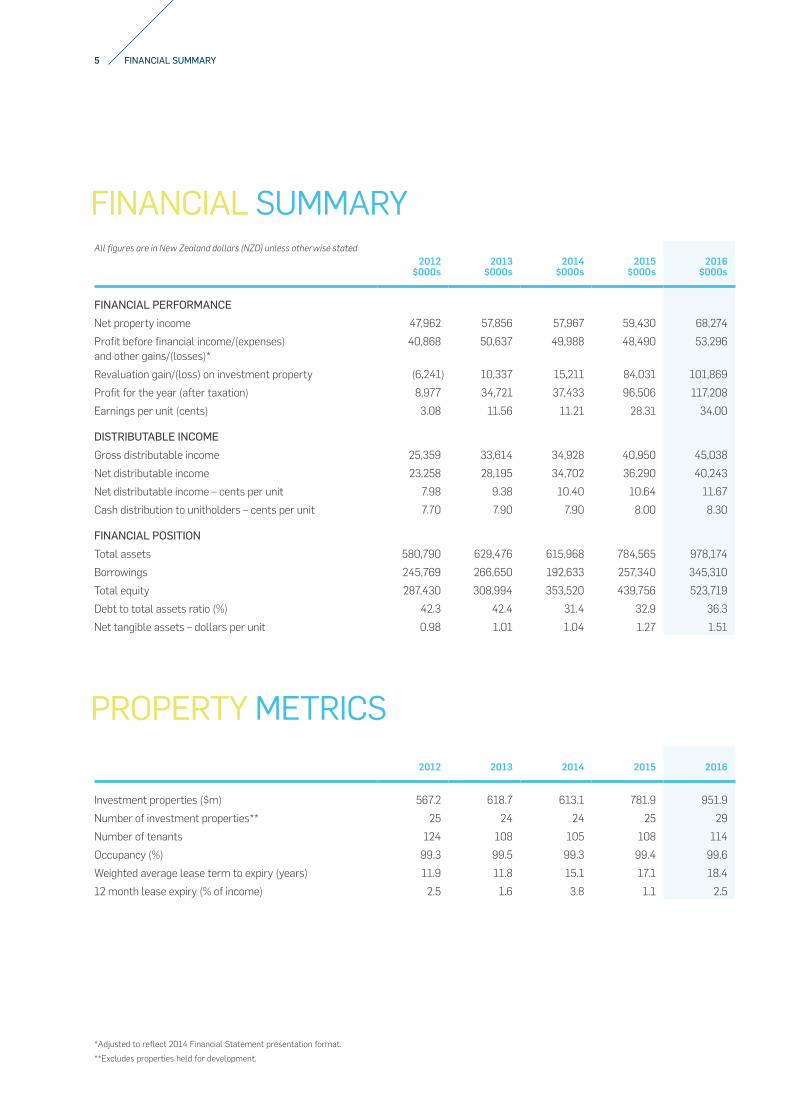
All figures are in New Zealand dollars (NZD) unless otherwise stated 2012
$000s
2013
$000s
2014
$000s
2015
$000s
2016
$000s
FINANCIAL PERFORMANCE
Net property income 47,962 57,856 57,967 59,430 68,274
Profit before financial income/(expenses) and other gains/(losses)*
40,868 50,637 49,988 48,490 53,296
Revaluation gain/(loss) on investment property (6,241) 10,337 15,211 84,031 101,869
Profit for the year (after taxation) 8,977 34,721 37,433 96,506 117,208
Earnings per unit (cents) 3.08 11.56 11.21 28.31 34.00
DISTRIBUTABLE INCOME
Gross distributable income 25,359 33,614 34,928 40,950 45,038
Net distributable income 23,258 28,195 34,702 36,290 40,243
Net distributable income – cents per unit 7.98 9.38 10.40 10.64 11.67
Cash distribution to unitholders – cents per unit 7.70 7.90 7.90 8.00 8.30
FINANCIAL POSITION
Total assets 580,790 629,476 615,968 784,565 978,174
Borrowings 245,769 266,650 192,633 257,340 345,310
Total equity 287,430 308,994 353,520 439,756 523,719
Debt to total assets ratio (%) 42.3 42.4 31.4 32.9 36.3
Net tangible assets – dollars per unit 0.98 1.01 1.04 1.27 1.51
2012
2013
2014
2015
2016
Investment properties ($m) 567.2 618.7 613.1 781.9 951.9
Number of investment properties** 25 24 24 25 29
Number of tenants 124 108 105 108 114
Occupancy (%) 99.3 99.5 99.3 99.4 99.6
Weighted average lease term to expiry (years) 11.9 11.8 15.1 17.1 18.4
12 month lease expiry (% of income) 2.5 1.6 3.8 1.1 2.5
FINANCIALFINANCIAL SUMMARY
PROPERTYPROPERTY METRICS
*Adjusted to reflect 2014 Financial Statement presentation format.
**Excludes properties held for development.
5 FINANCIAL SUMMARY
INDEPENDENT CHAIRMAN’S REPORT
Now in my ninth year as a Director it’s again my pleasure to present my fifth Annual Report as Independent Chairman of Vital’s Manager. Vital had an audited net profit after tax for the full year to 30 June 2016 of $117.2m, up 21.4% from the prior year. NTA increased 18.9% to $1.51 and the portfolio WALE1 is now 18.4 years. Vital will pay investors a final quarter cash distribution of 2.125 cpu and confirmed its 2017 cash distribution guidance at 8.5 cpu.
2016 HIGHLIGHTS INCLUDE:
• 12 month total return of 43%, outperforming the S&P / NZX All Real Estate Index return of 17.4%
• Annualised cash distribution increased to 8.5 cpu (+5%) from FY16 third quarter, 71% payout ratio
• Gross rental income of $70.4m, up 15.7%
• Operating profit before tax of $53.3m, up 9.9%
• Net distributable income of $40.2m, up 10.9%
• Revaluation gain of $101.9m, a 12.2% increase on carrying book value
• Portfolio WACR2 firmed 80 basis points to 7.2%
• Announced A$83.1m of brownfield development projects and A$20m of targeted strategic acquisitions
• Acquisition of four Australian residential aged care properties for A$41m on an 8.0% initial yield
• Post balance date, successful $160m capital raising and settlement of Boulcott Private Hospital for $31.7m
STRONG PERFORMANCE Brownfield development activity over the last few years has been transformational in delivering significant financial and portfolio outcomes for investors. The long-term characteristics of the healthcare sector and strong real estate fundamentals continue to be drivers of the portfolio revaluation gains achieved in 2016. These gains have directly strengthened the balance sheet and underpinned solid net tangible asset growth for investors. Vital’s ever improving asset quality and operator performance adds to a great platform for the continued delivery of our strategy. All of these factors support the Board’s guidance around the sustainability of the current annual distribution of 8.5 cents per unit.
NTA GROWTH DELIVERED As at 30 June 2016, Vital’s NTA per unit was $1.51 or 18.9% higher compared to the prior period (2015: $1.27). The NTA change was driven by a range of factors but predominantly driven by the value add development programme, giving rise to strong portfolio revaluation gains over the year.
ACQUISITION AND DEVELOPMENT ACTIVITYOver the financial year Vital undertook acquisitions and development activities to support delivery of its strategy.
In March Vital settled its first acquisition of residential aged care assets for A$41.0m on an 8.0% initial yield. Hall & Prior are one of Australia’s leading private aged care providers and our partnership adds diversification to Vital’s healthcare real estate assets and underpins the long-term sustainability of earnings to investors.
Post year-end, Vital also settled the acquisition of Boulcott Private Hospital in Lower Hutt, adjacent to the public Hutt Hospital, delivering further tenant and geographic diversification benefits. An adjacent property was also purchased, future proofing the long-term strategic value of Boulcott.
Strategic acquisitions, included Hopkins Street (adjacent to Lingard Private Hospital, Merewether, New South Wales) for A$7.8m and A$5.2m for two parcels of land adjacent to Sportsmed Private Hospital in Adelaide, South Australia. These and other targeted strategic acquisitions as previously announced of A$20m will provide long-term incremental benefits to Vital as we expand existing facilities or collaborate with new operator partners.
Vital has a strong pipeline of brownfield development projects to deliver over the next 18 months with A$83.1m of projects committed or underway across six hospitals. This follows the completion of A$69.5m of developments during the year at Hurstville Private (A$34.5m), Belmont Private (A$9.5m), Maitland Private (A$13.0m) and Marian Centre (A$12.5m). Vital expects to see a continuation of the development pipeline due to rising demand for healthcare services, underpinned by a growing and ageing population.
FOURTH QUARTER 2016 DISTRIBUTIONFor the fourth quarter of the 2016 financial year the Board has confirmed that investors will receive a distribution of 2.125 cpu with 0.2831 cpu of imputation credits attached.
6
VITAL HEALTHCARE PROPERTY TRUST ANNUAL REPORT 2016
BUILDING A HEALTHY
FUTURE
Vital’s Distribution Reinvestment Plan will remain available to investors for this distribution with a 1.0% discount being applied when determining the strike price.
All new units issued under the renounceable rights offer that closed in July will participate in the fourth quarter distribution.
STRATEGY & OUTLOOK2016 has been another excellent year of delivering results across all parts of the business. All operational, financial and portfolio elements are in great shape providing a sound platform for the year ahead. The successfully completed $160m capital raise post year-end with strong investor support was especially pleasing. Looking ahead, the team will ensure the continued delivery of strategy. This means a healthcare real estate focus to leverage the sector’s attractive fundamentals of a growing and ageing population.
Enhancing our relationships to support the growth of our partners – both existing and new, remains a focus in 2017. With a replenished balance sheet we will execute on acquisition opportunities as they arise and deliver our brownfield development programme to create long-term value for investors. Combined with a proactive treasury management approach and an experienced and stable management team, we aim to keep delivering sustainable distributions to investors through 2017 and beyond.
2017 CASH DISTRIBUTION GUIDANCE Having finished the 2016 financial year in a strong position and with a good measure of stability across the business, the Board remains comfortable guiding to a 2017 cash distribution of 8.5 cpu, and views this as a sustainable distribution.
Vital’s Annual Meeting will be held on 10 November 2016 in Auckland and I look forward to updating you further at this time.
I would also like to thank all investors for their continued strong support in 2016 and look forward to another great year in 2017.
Graeme Horsley MNZM Independent Chairman Vital Healthcare Management Limited
1. Weighted average lease term to expiry2. Weighted average capitalisation rate
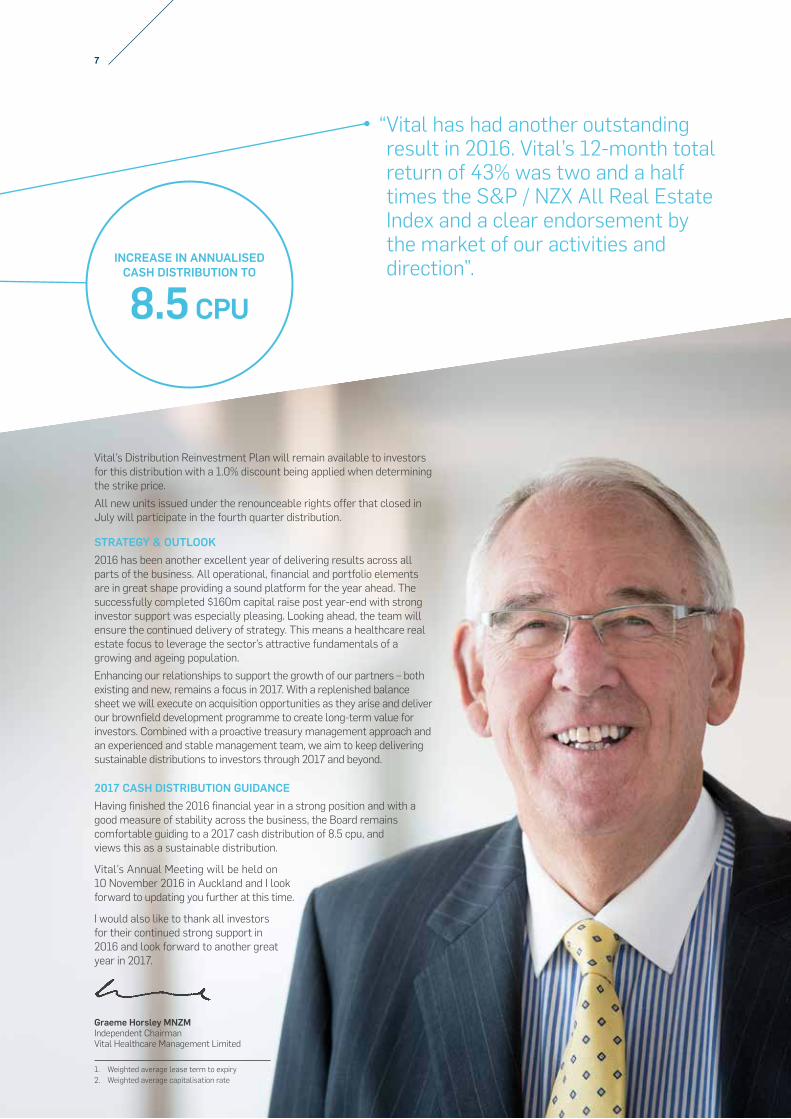
“ Vital has had another outstanding result in 2016. Vital’s 12-month total return of 43% was two and a half times the S&P / NZX All Real Estate Index and a clear endorsement by the market of our activities and direction”.
7
INCREASE IN ANNUALISED CASH DISTRIBUTION TO
8.5 CPU
CHIEF EXECUTIVE OFFICER’S REPORT
STRONG OPERATING, FINANCIAL AND PORTFOLIO RESULTSThe Trust continues to perform very well, with the portfolio in the best shape ever. This has been driven by events like the new 30-year lease at Kensington Hospital in Whangarei, and the 10-year lease extension, back to a 20-year term at Epworth Eastern Hospital in Melbourne. As a result Vital’s WALE has further eclipsed recent highs and remains market leading at 18.4 years, with the team’s ability to proactively execute on portfolio management matters key to this performance. The incremental brownfield development programme continues to deliver excellent outcomes, providing our established operating partners with new, high quality facilities to deliver exceptional patient care.
Following the success of the recent capital raising we see another busy year ahead. We remain focused on maintaining the quality portfolio characteristics we have worked hard to attain and execute on further acquisitions and developments as part of the Board’s scale and diversification strategy.
MARKET LEADING PORTFOLIO METRICSVital’s core portfolio metrics remain market leading, with occupancy at 99.6% and a portfolio WALE of 18.4 years.
Approximately 88% of the 2016 financial year lease expiries were renewed. With 2.5% of total income forecast to expire in 2017, we envisage a continuation of Vital’s high tenant retention rate.
A long dated WALE remains a clear point of difference for Vital’s investors. While Vital has achieved strong leasing outcomes through the year including at Kensington (30-year lease) and Epworth Eastern (10 years, extending lease term back to 20 years) we continue to proactively review future lease expiries to retain a market leading WALE. Vital’s average lease expiry now sits at approximately 1.8% per annum over the next ten years, providing investors with a long-term low risk income expiry profile. Over the next ten years, the single largest tenant expiry accounts for only 2.2% of total income.
Over the year Vital achieved an average rental increase of 1.9% across total rent subject to review. For 2017 83% of total income is subject to structured, fixed or CPI related reviews.
REVALUATIONSThe independently assessed annual portfolio revaluation resulted in an increase of $101.9m, with the investment properties now valued at $951.9m.
The Australian portfolio delivered approximately 90% of the increase. Of this, approximately 55% was attributable to assets which have been redeveloped, with the balance of the gains achieved from stabilised assets. These gains can be attributed to structured rent growth, continued high occupancy levels, long WALEs and a sector-wide firming of capitalisation rates. Firming capitalisation rates have been driven by several factors including lower interest rates, strong transactional evidence, increased investor appetite and strong capital inflows.
The Australian WACR as at 30 June was 7.2%, firming 90 basis points on last year. The New Zealand portfolio delivered a total revaluation gain of $10.9m above the 30 June carrying book value and has a WACR of 6.9%, firming 60 basis points over the 12 month period. Vital’s portfolio WACR firmed by 80 basis points to 7.2% as at 30 June.
All things being equal we envisage a continuation of the sector-wide firming of capitalisation rates, backed by a lower for longer interest rate outlook and some recent healthcare real estate transaction evidence further supporting this view. There remains a favourable differential between healthcare real estate capitalisation rates and those in the wider commercial property sector for quality assets. This highlights the ongoing relative attraction of healthcare real estate as a long term investment, particularly when supported by strong underlying demand characteristics including a growing and ageing population.
FINANCIAL PERFORMANCE Gross rental income increased 15.7% on the prior year driven principally by development rents which commenced during the period. After property expenses, net property income rose 14.9% for the year.
Finance expenses of $15.2m were 25.3% higher than last year reflecting higher overall debt levels over the year compared to the prior period.
8
VITAL HEALTHCARE PROPERTY TRUST ANNUAL REPORT 2016
PORTFOLIO IN GREAT
SHAPE

Vital renewed its bank facility in December 2015 and will continue to benefit from the revised terms over the respective tranche durations.
Other expenses of $15.0m were up $4.0m and include management and incentive fees of $12.5m. The incentive fee of $6.3m is calculated in accordance with the Trust Deed and based on the average growth in the value of the Trust’s assets over the past three years, and is payable by the Trust issuing units to the Manager.
TREASURY & CAPITAL MANAGEMENTVital’s loan-to-value ratio (LVR) as at 30 June 2016 was 36.3% (2015: 32.9%) well below bank and Trust Deed covenants of 50%. Although Vital had a higher drawn debt position at year-end, LVR remained relatively stable due to the strong portfolio revaluation gains achieved during the period.
Vital’s LVR post year-end is now approximately 21% with the acquisition of Boulcott Private Hospital and the successful completion of the $160m capital raising the main factors contributing to this change. This provides approximately $300m of balance sheet capacity at a 40% LVR.
The interest rate environment continues to be described as lower for longer. This environment has seen Vital’s weighted average interest rate reduce to 4.38% inclusive of bank line and margin fees (2015: 5.32%). The continued improvement in funding position also reflects the continued low Australian interest rates where Vital’s debt is sourced and a hedged position of 62% compared to the prior year-end of 84%.
I would like to thank all investors for their ongoing support. Also, thank you to my team for their fantastic efforts over the year. I look forward to updating investors on activities through 2017.
David CarrChief Executive Officer Vital Healthcare Management Limited
“ It’s great to have again delivered on our strategy and achieved some fantastic results in 2016”.
9
LONGEST WALE IN AUSTRALASIA
18.4 YEARS

PROPERTY PORTFOLIO – AUSTRALIA
MARKET VALUE A$83,800,000
MARKET CAPITALISATION RATE 7.3%
WALE 24.7 years
OCCUPANCY 100%
MAJOR TENANT Healthe Care
MARKET VALUE A$18,400,000
MARKET CAPITALISATION RATE 7.5%
WALE 1.4 years
OCCUPANCY 96%
MAJOR TENANT Healthscope
MARKET VALUE A$10,600,000
MARKET CAPITALISATION RATE 8.0%
WALE 19.7 years
OCCUPANCY 100%
MAJOR TENANT Hall & Prior
MARKET VALUE A$69,871,000
MARKET CAPITALISATION RATE 7.5%
WALE 25.8 years
OCCUPANCY 100%
MAJOR TENANT Healthe Care
MARKET VALUE A$3,430,000
MARKET CAPITALISATION RATE 7.0%
WALE 19.6 years
OCCUPANCY 100%
MAJOR TENANT Sportsmed SA
MARKET VALUE A$1,710,000
MARKET CAPITALISATION RATE 7.0%
WALE 19.6 years
OCCUPANCY 100%
MAJOR TENANT Sportsmed SA
MARKET VALUE A$38,997,000
MARKET CAPITALISATION RATE 7.3%
WALE 24.7 years
OCCUPANCY 100%
MAJOR TENANT Healthe Care
MARKET VALUE A$5,600,000
MARKET CAPITALISATION RATE 8.0%
WALE 19.7 years
OCCUPANCY 100%
MAJOR TENANT Hall & Prior
AUSTRALIAN PORTFOLIO
MARKET VALUE A$43,100,000
MARKET CAPITALISATION RATE 6.5%
WALE 21.6 years
OCCUPANCY 100%
MAJOR TENANT Healthscope
ALLAMANDA PRIVATE HOSPITALSouthport / Queensland
GOLD COAST SURGERY CENTRESouthport / Queensland
ROCKINGHAM AGED CARERockingham / Western Australia
BELMONT PRIVATE HOSPITALCarina Heights / Queensland
HAMERSLEY AGED CARESubiaco / Western Australia
SOUTH EASTERN PRIVATE HOSPITALNoble Park / Victoria
CLOVER LEA AGED CAREBurwood Heights / New South Wales
HURSTVILLE PRIVATE HOSPITALSydney / New South Wales
SPORTSMED CONSULTINGAdelaide / South Australia
DUBBO PRIVATE HOSPITALDubbo / New South Wales
LINGARD PRIVATE HOSPITALMerewether / New South Wales
SPORTSMED OFFICEAdelaide / South Australia
MARKET VALUE A$47,900,000
MARKET CAPITALISATION RATE 7.3%
WALE 19.6 years
OCCUPANCY 100%
MAJOR TENANT Healthe Care
MARKET VALUE A$10,700,000
MARKET CAPITALISATION RATE 8.0%
WALE 19.7 years
OCCUPANCY 100%
MAJOR TENANT Hall & Prior
MARKET VALUE A$9,539,000
MARKET CAPITALISATION RATE 8.5%
WALE 15.6 years
OCCUPANCY 100%
MAJOR TENANT Healthe Care
10
VITAL HEALTHCARE PROPERTY TRUST ANNUAL REPORT 2016

MARKET VALUE A$14,800,000
MARKET CAPITALISATION RATE 8.5%
WALE 15.6 years
OCCUPANCY 100%
MAJOR TENANT Healthe Care
MARKET VALUE A$28,000,000
MARKET CAPITALISATION RATE 8.0%
WALE 15.5 years
OCCUPANCY 100%
MAJOR TENANT Healthe Care
MARKET VALUE A$60,500,000
MARKET CAPITALISATION RATE 7.3%
WALE 21.5 years
OCCUPANCY 100%
MAJOR TENANT Healthe Care
MARKET VALUE A$30,600,000
MARKET CAPITALISATION RATE 7.3%
WALE 15.6 years
OCCUPANCY 100%
MAJOR TENANT Healthe Care
MARKET VALUE A$18,900,000
MARKET CAPITALISATION RATE 7.8%
WALE 26.5 years
OCCUPANCY 100%
MAJOR TENANT Healthe Care
A FURTHER FIVE PROPERTIES IN AUSTRALIA ARE HELD FOR DEVELOPMENT WITH
A TOTAL VALUE OF
A$15,743,000
MARKET VALUE A$99,191,000
MARKET CAPITALISATION RATE 6.8%
WALE 17.5 years
OCCUPANCY 100%
MAJOR TENANT Epworth Foundation
MAITLAND PRIVATE HOSPITALEast Maitland / New South Wales
EPWORTH EASTERN HOSPITALBox Hill / Victoria
MAYO PRIVATE HOSPITALTaree / New South Wales
EPWORTH EASTERN MEDICAL CENTREBox Hill / Victoria
NORTH WEST PRIVATE HOSPITALBurnie / Tasmania
EPWORTH REHABILITATIONBrighton / Victoria
TORONTO PRIVATE HOSPITALToronto / New South Wales
PALM BEACH CURRUMBIN CLINICCurrumbin / Queensland
FAIRFIELD AGED CAREFairfield / New South Wales
MARKET VALUE A$14,100,000
MARKET CAPITALISATION RATE 8.0%
WALE 19.7 years
OCCUPANCY 100%
MAJOR TENANT Hall & Prior
MARKET VALUE A$27,600,000
MARKET CAPITALISATION RATE 6.8%
WALE 10.9 years
OCCUPANCY 100%
MAJOR TENANT Peter MacCallum Cancer Institute
MARKET VALUE A$19,400,000
MARKET CAPITALISATION RATE 7.0%
WALE 2.6 years
OCCUPANCY 100%
MAJOR TENANT Epworth Foundation
11

Marian CentrePerth / Western Australia
MARKET VALUE A$31,624,000
MARKET CAPITALISATION RATE 7.8%
WALE 18.1 years
OCCUPANCY 100%
MAJOR TENANT Healthe Care
The Marian Centre is a 66-bed stand-alone private psychiatric hospital in the established medical precinct of Subiaco, approximately six kilometres north-west from the Perth central business district. The Marian Centre provides both inpatient and outpatient services along with a range of therapy programs.
The facility forms part of the larger Subiaco medical precinct. The precinct includes a mixture of for-profit and not-for-profit operators offering a diverse range of medical services including pathology, neurology, oral & dental, orthopaedics, sports medicine, fertility and oncology.
Vital recently completed a A$12.9m redevelopment at Marian to meet growing demand for services in the area. As a result, bed numbers have increased from 31 to 66, existing wards have been refurbished and additional consulting suites have been provided.
Marian has most recently been valued at A$31.6m, an uplift of A$4.5m (or 16.5%) on 30 June book value.
PROPERTY PORTFOLIO – AUSTRALIA
MARIAN WAS MOST RECENTLY VALUED AT
A$31.6MAN UPLIFT OF A$4.5M (OR 16.5%)
ON 30 JUNE BOOK VALUE.
12
VITAL HEALTHCARE PROPERTY TRUST ANNUAL REPORT 2016

13

Sportsmed SA incorporates a state of the art dedicated orthopaedic facility and is the largest of its type in Australia. It is located in the suburb of Stepney, approximately four kilometres north-east of Adelaide’s CBD, in South Australia.
With 13 dedicated orthopaedic surgeons Sportsmed SA employs over 300 staff treating approximately 130,000 patients each year. The hospital has five operating theatres, 45 individual private rooms and a four-bed High Dependency Unit. Associated with the hospital is a two-level clinic comprising 29 consulting rooms, treatment rooms and a small procedure room.
The Trust recently acquired two adjacent properties, Sportsmed consulting and Sportsmed office, which complement the activities of the hospital. The consulting building will be integral to an upcoming development.
Sportsmed SA was recently valued at A$38.2m, an uplift of A$1.5m (or 4.2%) on 30 June book value.
MARKET VALUE A$38,190,000
MARKET CAPITALISATION RATE 7.6%
WALE 18.9 years
OCCUPANCY 100%
MAJOR TENANT Sportsmed SA
PROPERTY PORTFOLIO – AUSTRALIA
Sportsmed SAAdelaide / South Australia
SPORTSMED SA WAS RECENTLY VALUED AT
A$38.2MAN UPLIFT OF A$1.5M (OR 4.2%)
ON 30 JUNE BOOK VALUE.
14
VITAL HEALTHCARE PROPERTY TRUST ANNUAL REPORT 2016

15

Kensington Hospital is a two-level property comprising three theatres and 19 beds, along with an adjoining primary care, general practice facility.
The hospital undertakes both inpatient and day-stay surgery and is centrally located in the Whangarei suburb of Kensington, approximately 2.5 kilometres from the Whangarei CBD.
As part of management’s proactive approach to mitigating future lease expiries, Vital negotiated a new 30-year lease with the hospital operators, Kensington Hospital Limited, effective 1 July 2016.
Kensington hospital was most recently valued at $15.3m, an uplift of $1.8m (or 12.9%) on 30 June book value.
PROPERTY PORTFOLIO – NEW ZEALAND
NEW ZEALAND PORTFOLIO
MARKET VALUE $22,600,000
MARKET CAPITALISATION RATE 7.5%
WALE 3.9 years
OCCUPANCY 91.4%
MAJOR TENANT Apollo Health Limited
MARKET VALUE $1,600,000
MARKET CAPITALISATION RATE 10.4%
WALE 3.5 years
OCCUPANCY 100%
MAJOR TENANT Fertility Associates Limited
MARKET VALUE $90,000,000
MARKET CAPITALISATION RATE 6.4%
WALE 19.1 years
OCCUPANCY 99.5%
MAJOR TENANT Ascot Hospital & Clinics Limited
MARKET VALUE $26,600,000
MARKET CAPITALISATION RATE 6.8%
WALE 3.8 years
OCCUPANCY 100%
MAJOR TENANT Fertility Associates Limited
APOLLO HEALTH AND WELLNESS CENTREAlbany / Auckland
ASCOT CENTRAL, AUCKLAND Greenlane / Auckland
ASCOT CENTRAL CAR PARK (GROUND LEASE)Greenlane / Auckland
ASCOT HOSPITAL Greenlane / Auckland
16
VITAL HEALTHCARE PROPERTY TRUST ANNUAL REPORT 2016
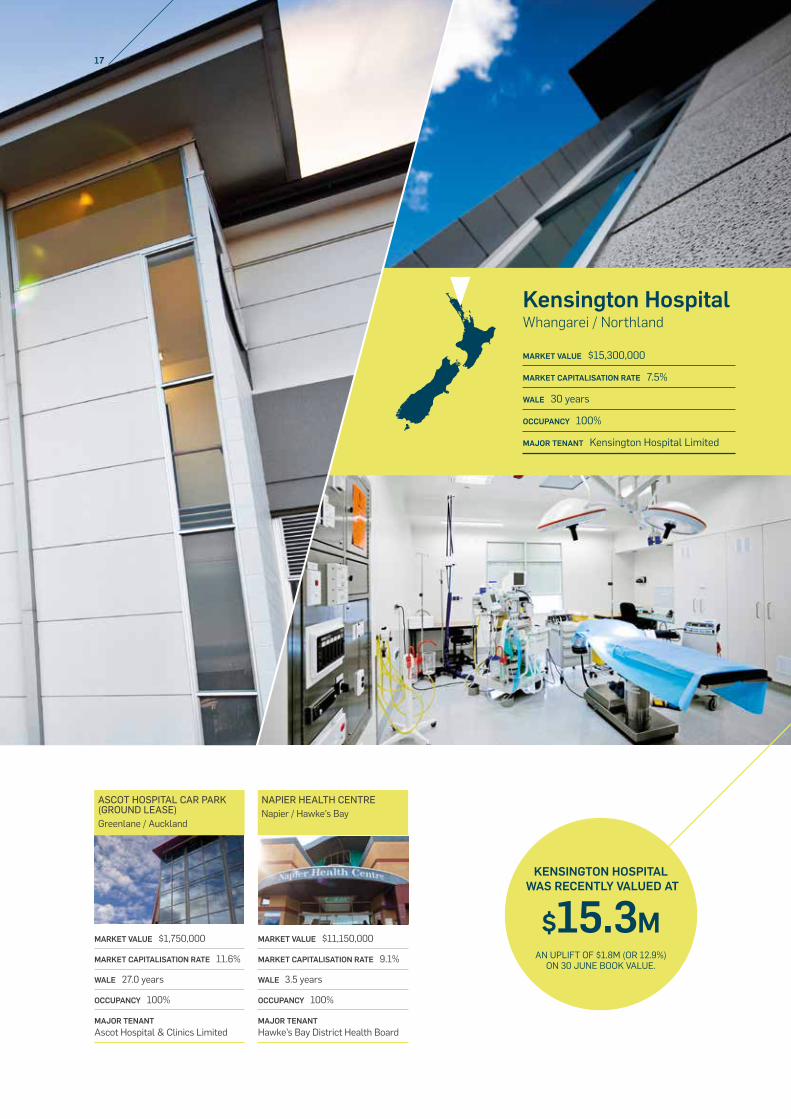
MARKET VALUE $1,750,000
MARKET CAPITALISATION RATE 11.6%
WALE 27.0 years
OCCUPANCY 100%
MAJOR TENANT Ascot Hospital & Clinics Limited
MARKET VALUE $11,150,000
MARKET CAPITALISATION RATE 9.1%
WALE 3.5 years
OCCUPANCY 100%
MAJOR TENANT Hawke’s Bay District Health Board
KENSINGTON HOSPITAL WAS RECENTLY VALUED AT
$15.3MAN UPLIFT OF $1.8M (OR 12.9%)
ON 30 JUNE BOOK VALUE.
ASCOT HOSPITAL CAR PARK (GROUND LEASE)Greenlane / Auckland
NAPIER HEALTH CENTRENapier / Hawke’s Bay
Kensington HospitalWhangarei / Northland
MARKET VALUE $15,300,000
MARKET CAPITALISATION RATE 7.5%
WALE 30 years
OCCUPANCY 100%
MAJOR TENANT Kensington Hospital Limited
17

GRAEME HORSLEY MNZMChairman and Independent Director
Graeme Horsley has over 40 years’ property valuation and consultancy experience, including 14 years with Ernst & Young New Zealand, where he was Partner and National Director of the Real Estate Group.
A professional Director, Graeme is an Independent Director of Willis Bond Capital Partners and Accessible Properties Limited. He was the deputy chair of the Bay of Plenty DHB for nine years. He is a Member of the New Zealand Order of Merit, a Life Fellow of the Property Institute of New Zealand, an Eminent Fellow of the Royal Institution of Chartered Surveyors and a Chartered Fellow of the Institute of Directors.
Our Board has overall responsibility for setting the strategic direction and managing the Trust. It is made up of three Independent Directors and two non-Independent Directors. Directors are chosen for their complementary skills and knowledge.
OUROUR BOARD
CLAIRE HIGGINSIndependent Director
Claire Higgins is an Australian based professional Director. She is the Chair of REI Superannuation Fund Pty Ltd. Claire is also a Director of Ryman Healthcare Limited, RT Health Fund Ltd, Pancare Foundation Inc and the Victorian State Emergency Service Authority. Formerly the Chair of Barwon Health and the County Fire Authority in Victoria, Claire has also had extensive executive experience with BHP and OneSteel Limited.
Claire’s areas of expertise are in governance, accounting, finance, economics and healthcare. Claire has a Bachelor of Commerce (Accounting, Economics and Commercial Law) from The University of Melbourne and is a present Fellow at the Australian Institute of Company Directors, the Australian Society of Certified Practising Accountants and the Institute of Public Administration Australia.
ANDREW EVANSIndependent Director
Andrew Evans has over 25 years’ experience in commercial real estate and asset management, previously holding executive positions in listed and unlisted real estate investment businesses. Andrew is a Director of Argosy Property Limited, Holmes Group Limited, Holmes GP Fire Limited, Trust Investments Management Limited and Hughes and Cossar Group Holdings Limited. In addition, Andrew is a past National President of the Property Council of New Zealand, a fellow of the New Zealand Property Institute, a government appointee to the Land Valuation Tribunal (Waikato No.1) and a Trustee of the Marist Brothers Old Boys Rugby Charitable Trust. He is a Chartered Fellow of the Institute of Directors and is on the Auckland Branch Committee.
Andrew has a Bachelor of Business Studies and MBA (with distinctions) from Massey University and a Diploma in Finance from Auckland University.
BOARD OF DIRECTORS OF THE MANAGER18
VITAL HEALTHCARE PROPERTY TRUST ANNUAL REPORT 2016

Committed to maintaining the highest ethical standards and accountability.
PAUL DALLA LANADirector
Paul Dalla Lana is the founder and CEO of NorthWest Healthcare Properties REIT – the 100% owner of Vital Healthcare Management Limited, the Manager of Vital Healthcare Property Trust. Over the past 24 years, Paul has led NorthWest in the acquisition and development of over $3.0 billion worth of real estate transactions, with a significant focus on healthcare properties.
Prior to founding NorthWest, Paul was a professional in the Real Estate Capital Markets Group of Citibank, N.A. and an economist with B.C. Central Credit Union. Paul received his BA (Economics) and his MBA (Finance and Real Estate) from The University of British Columbia.
Paul serves as Chairman of the Board of NorthWest Healthcare Properties REIT. Additionally, he is actively involved in addressing public health and education issues in Canada and around the world. He is an Advisory Board member of the Dalla Lana School of Public Health and on the President’s Advisory Council at the University of Toronto.
BERNARD CROTTYDirector
Bernard Crotty is a Trustee of NorthWest Healthcare Properties REIT and a Director of Vital Healthcare Management Ltd.
Bernard is a Principal of Silver and White Management, Inc., a private investment firm and from October 2013 until June 2015 was President of NorthWest International Healthcare Properties REIT.
From September 2001 to February 2008, Bernard acted as Chairman and/or Chief Executive Officer of Certicom Corp, a provider of cryptographic software and services that was acquired by Research in Motion Ltd. From January 2004 to February 2007, Bernard acted as Chairman and/or Chief Executive Officer of Comnetix Inc., a provider of biometric identification and authorisation solutions that was acquired by L-1 Identity Solutions, Inc.
In addition, Bernard has served on a variety of public company boards and was counsel to the law firm Gibson, Dunn & Crutcher LLP in Los Angeles from April 1998 to March 2000. Prior to April 1998, Bernard was a partner at the law firm McCarthy Tétrault, LLP in Toronto and London, England.
Bernard received his B.A. from the University of Alberta, LL.B. from the University of Toronto, LL.M from the London School of Economics, his M.B.A. from Duke University and is also a graduate of the Toronto ICD-Rotman Directors Education Program.
19

01 // DAVID CARR Chief Executive Officer
David has over 21 years’ experience in property and capital markets including as the Chief Executive of Vital since October 2006.David has overall accountability for implementing and delivering the Trust’s strategy and for its overall performance. He leads a team of passionate healthcare real estate professionals in New Zealand and Australia. Vital remains Australasia’s largest listed healthcare real estate investment vehicle with assets of approximately $1.0bn and a market capitalisation of over $950m.During David’s tenure Vital has delivered a ten-year compound annual total return of 13.9%, outperforming both the S&P/NZX All RE Gross Index and the S&P NZX50 Index.
02 // STUART HARRISON Chief Financial Officer and Company Secretary
Stuart has nearly three decades of financial reporting and management experience within the Chartered Accountancy, utilities and hospitality/property industries and joined the team in September 2008. As Chief Financial Officer, he has been responsible for overseeing the financial and management reporting, treasury management and tax compliance within both New Zealand and Australia.
The efficient implementation of these functions have been supportive of the Trust’s operating performances in recent years – including equity raising, debt facility renewals and strategic acquisitions.In his capacity as Company Secretary, Stuart has been responsible for the on-going compliance requirements of the Trust and its underlying subsidiary entities and for the corporate functions of the Trust.Stuart holds a Bachelor of Commerce and Chartered Accountants Australia and NZ qualifications. He is also a member of the New Zealand Institute of Directors.
03 // RICHARD ROOS Managing Director – Australia
Richard moved to Melbourne with his family to join Vital three years ago after spending the previous six years in a senior executive role with NorthWest Healthcare Properties REIT, a Canadian healthcare property trust. He has over 20 years of career experience in commercial real estate financing, acquisitions and property management. In his role as Managing Director, Richard is responsible along with his Melbourne based team for the asset management of the Australian portfolio, including acquisitions, development, leasing and tenant relationships.
04 // MARK NORMAN National Development Manager
Mark has more than 20 years’ experience in the healthcare property industry. He has delivered over 40 development projects for the Trust with a total value in excess of $350 million. This includes the development of several key greenfield hospitals along with numerous projects, in partnership with our operators, to enhance Vital’s existing facilities. Based in Melbourne, Mark has also been involved in the majority of Vital’s acquisitions over the last six years and also plays a significant role in the asset management of our Australian properties.
05 // CAMERON RAMSAY National Acquisitions Manager
Cameron joined Vital in April 2016 as National Acquisitions Manager. He has over ten years’ experience in the property industry having formerly worked with Ernst & Young’s Real Estate Advisory team in Melbourne.Cameron’s previous role as Associate Director involved primarily managing freehold and going concern private hospital and medical centre valuations, acquisition due diligence and transaction management engagements for institutions, REIT’s, syndicates, not for profit organisations, governments and high net worth individuals.
OUROUR PEOPLEOur small, successful management team come from a diverse range of property investment, development and finance backgrounds. They understand the importance of partnering with operators to deliver long-term real estate solutions to them and sustainable distributions to investors.
THE MANAGEMENT TEAM
01
04
02
05
03
06
20
VITAL HEALTHCARE PROPERTY TRUST ANNUAL REPORT 2016

He has also worked on a wide range of asset classes including aged care, major commercial office buildings, retail, industrial, residential development sites and subdivisions, car parks and retirement villages. Cameron has a Graduate Diploma in Valuations and Masters of Business (Property) from RMIT University. He is a Certified Practicing Valuer, member of the Australian Property Institute and is an Agents Representative.Based in Vital’s Melbourne office, Cameron has significant knowledge of the healthcare sector and will play a key role in the continued growth of the Australian portfolio.
06 // DRUGH WOODS New Zealand Asset Manager
Drugh has been with Vital for over eight years and is responsible for managing the financial performance of the New Zealand portfolio including asset acquisitions and disposals. Drugh has over 13 years of experience following the completion of a Bachelor of Property degree at Auckland University and was involved in a diverse range of property projects in Auckland and Christchurch prior to joining Vital.
07
10
08
11
09
12
1307 // ALESHA PATTEN Operations and Risk Manager
08 // JADE MURPHY Financial Controller
09 // KATIE MURPHY Marketing Co-ordinator and Executive Assistant
10 // LISA PARNELL Group Accountant
11 // MARGARET KNELL Property Administrator
12 // RACHEL KNEZ Property Manager
13 // STEPHEN FREUNDLICH Fund Analyst and Investor Relations Manager
21

CORPORATE GOVERNANCE
INTRODUCTIONCorporate governance is the systems under which an organisation is guided, managed and measured. Good corporate governance is important to promote market and investor confidence. Ultimate responsibility for corporate governance of Vital resides with the Board of Directors of the Manager. The Board acknowledges strong corporate governance and stewardship as fundamental to the strong performance of Vital and, accordingly, their commitment is to the highest standards of business behaviour and accountability. It is with these objectives in mind that the Board has adopted its current framework, which, in the Board’s opinion materially comply with the NZX Corporate Governance Best Practice Code (NZX Code) and the Financial Markets Authority corporate governance principles and guidelines, unless otherwise stated.
THE TRUST AND TRUSTEEVital Healthcare Property Trust (Vital) is a unit trust established under the Unit Trust Act 1960 by a Trust Deed dated 11 February 1994 as subsequently amended and replaced. Before 1 December 2016 Vital expects to become a registered managed investment scheme under the Financial Markets Conduct Act 2013. Vital units are listed on the New Zealand Stock Exchange (NZX code: VHP).
The Trustee of Vital is Trustees Executors Limited. The Trustee is required to be licensed by the FMA under the Financial Markets Supervisors Act 2011 to act as a trustee of a unit trust.
The Trustee’s role is to supervise the administration and management of Vital in accordance with the Trust Deed, and to ensure that the Manager complies with its duties and responsibilities under the Trust Deed.
The Trustee holds title to the assets of Vital in trust for the unitholders, subject to the terms and conditions of the Trust Deed. The Trustee also has certain discretions and powers to approve investment and divestment proposals recommended to it by the Manager and reviews and authorises all payments made by Vital.
THE MANAGERThe Manager of Vital is Vital Healthcare Management Limited, a wholly owned subsidiary of NWI Healthcare Properties LP. The Manager has responsibility for the management of Vital in accordance with the Trust Deed.
The Manager’s responsibilities include the day-to-day management of Vital’s portfolio of properties and assets, negotiating the acquisition and disposal of assets, development and construction planning and management, treasury and funding
management, ensuring Vital meets its financial, reporting and other statutory and regulatory obligations and communicating with unitholders and the market.
Vital does not engage or employ any Directors or employees of its own. The Manager provides a highly experienced and diverse range of professionals with expertise across a range of areas.
CORPORATE GOVERNANCE POLICIES, PRACTICES AND PROCEDURES
The Board of Directors
The role of the Board of Directors is to set the strategic direction of Vital and to support management in monitoring the delivery of this against specific performance objectives.
The Board also ensures that all business risks are appropriately identified and managed and that all regulatory, statutory, financial, health and safety and social responsibilities of the Manager are complied with.
Chairman and Chief Executive Officer
The role of Chairman and Chief Executive Officer (CEO) are separated to increase accountability and facilitate more effective monitoring and oversight of management. At the financial year-end and at the date of this report, Graeme Horsley is Chairman and David Carr is CEO of the Manager. Graeme’s role as Chairman is to provide leadership to the Board of Directors and is accountable to the Board. David’s primary role is to ensure management’s delivery on the strategy approved by the Board.
Board Composition
The Manager is committed to having an effective Board providing a balance of independent skills, knowledge, experience and perspectives. The Constitution of the Manager provides for there to be not more than seven Directors, nor less than three Directors. All the members of the Board are Non-Executive Directors. All bring a significant breadth and depth of expertise and have the composite skills to optimise the financial and portfolio performance of Vital and returns to unitholders. Their resumés are included in the Board of Directors section on pages 18-19.
Attendance of Directors Date of appointment
Graeme Horsley (Chair) 7 of 7 20 August 2007
Andrew Evans 7 of 7 20 August 2007
Claire Higgins 7 of 7 16 January 2012
Paul Dalla Lana 7 of 7 16 January 2012
Bernard Crotty 7 of 7 16 January 2012
CORPORATECORPORATE GOVERNANCE
22
VITAL HEALTHCARE PROPERTY TRUST ANNUAL REPORT 2016

The Board does not impose a restriction on the tenure of any Director as it considers that such a restriction may lead to the loss of experience and expertise from the Board.
Appointment
Unitholders have the opportunity to nominate two of the Independent Directors of the Manager required by the NZX Listing Rule 3.3.1.(c). Unitholders are able to nominate and vote on one Independent Director of the Manager each year. The nominee receiving the most votes will be approved as a Director of the Manager by the Manager’s shareholders, and will hold the position for a two-year term.
Independent Directors
The Manager recognises that Independent Directors are important in assuring unitholders that the Board is properly fulfilling its role and is diligent in holding management accountable for its performance. The procedures in place for determining independence is whether the Director is independent of management and free of any business or other relationship that could materially interfere with, or could reasonably be perceived to materially interfere with, the exercise of their unfettered and independent judgement.
As defined in the NZX Listing Rules, the Board has determined that three of its members: Graeme Horsley (Chairman), Claire Higgins and Andrew Evans are Independent Directors. Paul Dalla Lana and Bernard Crotty are considered not to be independent.
Diversity
A key feature of the external management structure that Vital operates under is that all employee costs are the responsibility of the Manager, not Vital. The Manager is committed to providing a positive working environment where diversity in all its forms is respected and embraced. As at 30 June 2016, the Manager has one female Director out of the five currently appointed Directors and both of the Officers of the Manager are male.
Board and Director Performance
Assessment of the Board and individual Directors’ performance is a process determined by the Chairman. This takes into account the overall attendance, contribution and experience of each individual member concerned.
BOARD COMMITTEESConsistent with NZX guidelines, the Board uses a number of committees to assist in the delivery of its duties and responsibilities. Board committees assist with the execution of the Board’s responsibilities to unitholders. Each committee operates under a charter agreed by the Board, setting out its role, responsibilities, authority, relationship with the Board, reporting requirements, composition, structure and membership.
Audit Committee
The Board has established an Audit Committee, which is responsible for overseeing the financial and accounting responsibilities of Vital. The minimum number of members on the Audit Committee is three. All members must be Directors, the majority must be Independent Directors and at least one member must have an accounting or financial background.
The members of the Audit Committee are Claire Higgins (Chair), Andrew Evans and Bernard Crotty.
The Audit Committee assists the Board in fulfilling its corporate governance and disclosure responsibilities with particular reference to financial matters, and internal and external audit, and is specifically responsible for:
• Recommending to the Board the appointment/removal of Vital’s external auditor
• Supervising and monitoring external audit requirements
• Reviewing annual and interim financial statements prior to submission for Board approvals
• Reviewing and approving quarterly distributions with recommendation of the same for Board approvals
• Reviewing the performance and independence of the external auditor
• Monitoring compliance with the Unit Trusts Act 1960, Financial Reporting Act 2013, Companies Act 1993 and the NZX Listing Rules
Attendance at Audit Committee Date of appointment
Claire Higgins (Chair) 4 of 4 16 January 2012
Andrew Evans 4 of 4 14 November 2011
Bernard Crotty 4 of 4 16 January 2012
23

Due Diligence Committee
From time to time the Board establishes Due Diligence Committees (DDC) to report on the due diligence process in relation to any potential transaction for Vital of material size or complexity. An example would be a material portfolio acquisition or equity capital raising. A DDC will normally include all Directors, relevant management staff and external consultants appropriate for the transaction.
Remuneration Committee
The NZX Code recommends that a Remuneration Committee be established to benchmark remuneration packages for Directors and senior employees and that the information be disclosed to investors. A key feature of the external management structure that Vital operates under is that all employment expenses are the responsibility of the Manager, not Vital. Consequently, a Remuneration Committee is not considered necessary by the Board at this time.
POLICIES AND PROCEDURESThe Board considers it particularly important to manage all real or perceived conflicts of interest that may arise during the ordinary course of business. From a corporate governance perspective managing conflicts of interest, perceived or otherwise, typically attracts some of the greatest levels of scrutiny.
The Manager has established internal policies and procedures that govern behaviour of its Directors and employees. The aim of these policies is to support good corporate governance and promote investor and market confidence.
Code of Conduct
All Directors and employees of the Manager must abide by its Code of Conduct policy. The Manager recognises the importance of a work environment which actively promotes best practice and does not compromise business ethics or principles. The purpose of the Code of Conduct is to uphold the highest ethical standards, acting in good faith and in the best interests of unitholders at all times. The Code of Conduct outlines the Manager’s policies in respect of conflicts of interest, fair dealing, compliance with applicable laws and regulations, maintaining confidentiality of information, dealing with Vital’s assets and use of Vital’s information.
The policy provides a practical set of guiding principles and operates in conjunction with other policies relating to minimum standards of behaviour and conduct. Compliance with this policy is a condition of employment with the Manager.
Risk Management
The Board of Directors maintains a sound understanding of key risks faced by Vital. Effective management of all financial and non-financial risks is fundamental to the delivery of the Board’s strategy.
As part of its framework, the Board and Audit Committee work closely with management and external auditors to support the identification, management and reporting of certain financial and non-financial risks to Vital. In addition, the Manager will engage other external advisers as appropriate to deal with specific risks.
Continuous Disclosure
It is important that the market and investors feel confident in the timing or manner of any buying or selling of Vital Units. As a NZX issuer, the Manager is acutely aware of the need to ensure the market, investors and regulators remain fully informed of any and all material or price sensitive information relevant to Vital. The Board and all management employees are aware of the NZX Continuous Disclosure requirements and Vital has internal procedures in place to ensure compliance with them.
Insider Trading and Restricted Persons Trading
The Manager’s Directors, officers and employees, their families and related parties must comply with the Insider Trading policy and the Restricted Persons Trading policy. The Manager is committed to ensuring compliance with legal and regulatory requirements with respect to insider trading and restricted persons trading.
To assist with such compliance, the Manager’s Insider Trading and Restricted Persons Trading policies identify circumstances where Directors, officers and other restricted persons are permitted to trade, or are prohibited from trading, units in Vital. Compliance with these policies is monitored by the Board. In addition, all trading by Directors and officers of the Manager is required to be reported to NZX in accordance with the Financial Markets Conduct Act 2013. The holdings of Directors of the Manager is disclosed on page 25.
Manager’s Remuneration
Stipulated within the Trust Deed is the basis on which the Manager is entitled to receive management fees and incentive fees.
Management fees are charged, in respect of each month, a base fee equal to 0.75% per annum of the monthly average of the Gross Value of the assets of Vital for the quarter ended on the last day of that month. The incentive fee is an amount equal to 10% per annum of the average annual increase in the Gross Value of Vital over the relevant financial year and two preceding financial years.
CORPORATE GOVERNANCE24
VITAL HEALTHCARE PROPERTY TRUST ANNUAL REPORT 2016

The Manager is required to apply the incentive fee in subscribing for new Units in Vital issued at the weighted average price. The remuneration of the Manager is subject to an overall limit of 1.75% per annum of the Gross Value of Vital and includes the remuneration of the CEO and management team.
The Manager and the Trustee are each entitled to be reimbursed out of the Trust Fund for all expenses, costs or liabilities incurred by them respectively in acting as Manager or Trustee.
Trustee’s Remuneration
The Trustee is entitled to receive fees in respect of its services based on the average gross value of the assets of Vital as follows: 0.10% per annum on the first $100m, then 0.08% per annum on the next $25m, then 0.05% per annum on the next $25m and 0.03% per annum on any amount over $150m. The Trustee is also entitled to reasonable reimbursement for special attendances.
EXTERNAL AUDITORSIn addition to the formal charter under which the Audit Committee operates, the Audit Committee has also developed a Charter of Audit Independence, which sets out the procedures that need to be followed to ensure the independence of the Trust’s external auditor.
The Audit Committee is responsible for recommending the appointment of the external auditor and maintaining procedures for the rotation of the external audit engagement partner. Under the Audit Charter, the external audit engagement partner must be rotated every five years.
The charter covers provision of non-audit services with the general principle being applied that the external auditor should not have any involvement in the production of financial information or preparation of financial statements such that they might be perceived as auditing their own work. It is however appropriate for the external auditor to provide services of due diligence on proposed transactions and accounting policy advice.
External audit for Vital – following careful consideration and recommendation from the Audit Committee, the Board appointed the firm of Deloitte as the Trust’s statutory auditor. External audit of the Manager – the firm of KPMG has been appointed as the auditor of the Manager.
INVESTOR RELATIONSA key focus of investor relations is to ensure the market and investors are informed of all details necessary to assess their investment and Vital’s performance. The Board aims to foster constructive communications and encourages all stakeholders to engage with Vital. The Manager actively encourages engagement through a communication strategy which includes:
• The Annual Meeting for the unitholders to meet with and ask questions of the Board, the Trustee, management and external auditors
• Any other meetings called to obtain approval for the Managers action as appropriate
• Results webcasting providing all investors with the ability to listen and ask questions of management
• Various investor communications including Annual and Interim Reports
• Newsletters and periodic investor roadshows
• Vital’s website www.vhpt.co.nz
• Periodic and continuous disclosure to NZX
• Notices and explanatory memoranda for Annual and Special Meetings
Vital also has a toll-free contact number (0800 225 264) and general service and enquiry email address ([email protected]) for the Manager to receive any market or investor enquiries.
Holdings of Directors of the Manager as at 31 August 2016Holdings
(number of units) non-beneficial
Holdings (number of units)
beneficial
Graeme Horsley 48,972 284,304Andrew Evans 284,304 418,433Claire Higgins 73,676Paul Dalla Lana* 105,977,178Bernard Crotty*
* Paul Dalla Lana (Chairman, CEO and trustee) and Bernard Crotty (trustee) are Officers and/or shareholders of NorthWest Healthcare Properties Real Estate Investment Trust (an Ontario, Canada, corporation). NorthWest Healthcare Properties Real Estate Investment Trust directly or indirectly holds approximately 106.0 million units in Vital Healthcare Property Trust.
25

Consolidated Statement of Comprehensive Income FIN-1
Consolidated Statement of Financial Position FIN-2
Consolidated Statement of Changes in Equity FIN-3
Consolidated Statements of Cash Flows FIN-4
Notes to the Consolidated Financial Statements FIN-5
Independent Auditor’s Report 54
FINANCIAL STATEMENTS
BUILDING A HEALTHY FUTURE 2016

Note2016
$000s2015
$000s
Gross property income from rentals 70,351 60,786 Gross property income from expense recoveries 6,768 6,925 Property expenses (8,845) (8,281)
Net property income 4 68,274 59,430
Other expenses 5 14,978 10,940
Profit before finance income/(expense) and other gains/(losses) 53,296 48,490
Finance income/(expense)Finance income 110 103 Finance expense 6 (15,153) (12,095)Fair value gain/(loss) on interest rate derivatives (6,180) (5,345)
(21,223) (17,337)
Other gains/(losses)Revaluation gain/(loss) on investment property 10 101,869 84,031 Receipts/(payments) under transaction hedging foreign exchange derivatives 468 679 Fair value gain/(loss) on foreign exchange derivatives 1,741 (1,167)Unrealised gain/(loss) on foreign exchange 2,104 (1,792)
106,182 81,751
Profit/(Loss) before income tax 138,255 112,904 Taxation expense 7 (21,047) (16,398)
Profit/(Loss) for the year attributable to unitholders of the Trust 117,208 96,506
Other comprehensive incomeItems that may be reclassified subsequently to profit and loss:Movement in foreign currency translation reserve (33,848) 17,249 Realised foreign exchange gains/(losses) on hedges 7,462 (772)– Current taxation (expense)/credit (2,089) 216
Unrealised foreign exchange gains/(losses) on hedges 12,572 (5,197)– Deferred taxation (expense)/credit (3,520) 1,455
Fair value gain/(loss) on net investment hedges 7,587 (4,036)– Deferred taxation (expense)/credit (2,124) 904– Current taxation (expense)/credit – 227
Total other comprehensive income/(loss) after tax (13,960) 10,046
Total comprehensive income after tax 103,248 106,552
All amounts are from continuing operations
Earnings per unit
Basic and diluted earnings per unit (cents) 8 34.00 28.31
The notes on pages Fin-5 to Fin-27 form part of and are to be read in conjunction with these financial statements.
FIN-1
Consolidated Statement of Comprehensive IncomeFor the year ended 30 June 2016
Note2016
$000s2015
$000s
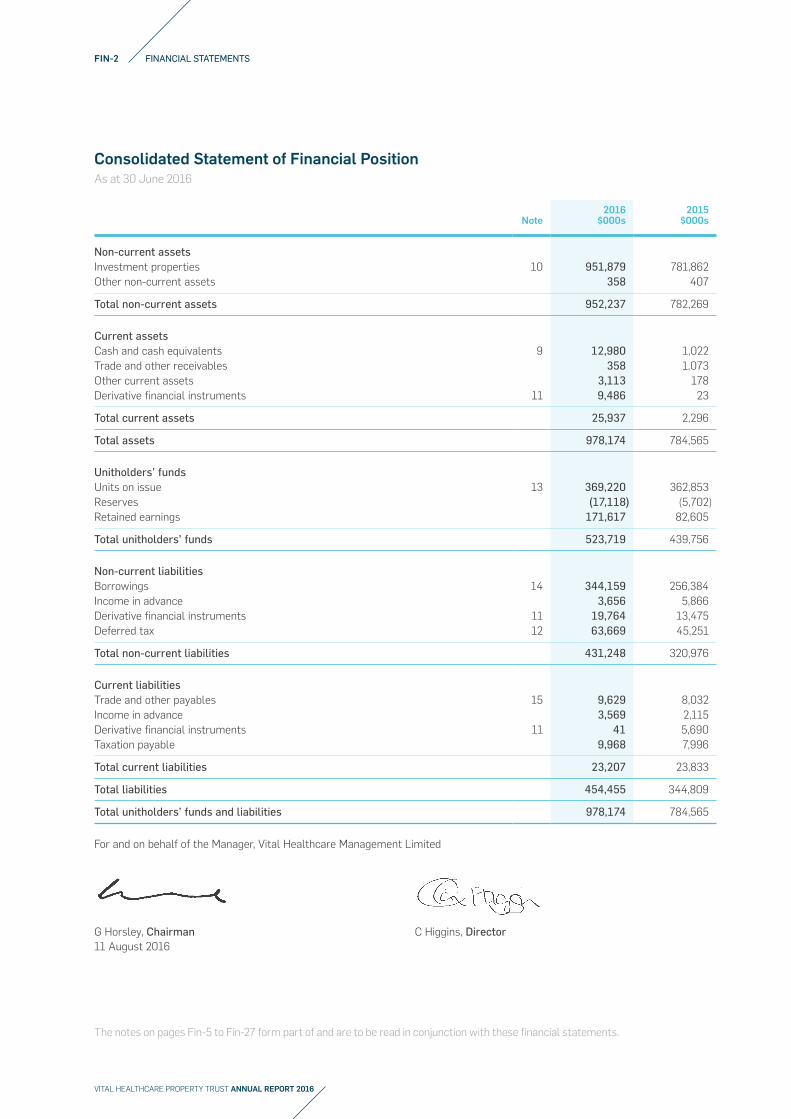
Non-current assetsInvestment properties 10 951,879 781,862 Other non-current assets 358 407
Total non-current assets 952,237 782,269
Current assetsCash and cash equivalents 9 12,980 1,022 Trade and other receivables 358 1,073 Other current assets 3,113 178 Derivative financial instruments 11 9,486 23
Total current assets 25,937 2,296
Total assets 978,174 784,565
Unitholders’ fundsUnits on issue 13 369,220 362,853 Reserves (17,118) (5,702)Retained earnings 171,617 82,605
Total unitholders’ funds 523,719 439,756
Non-current liabilitiesBorrowings 14 344,159 256,384 Income in advance 3,656 5,866 Derivative financial instruments 11 19,764 13,475 Deferred tax 12 63,669 45,251
Total non-current liabilities 431,248 320,976
Current liabilitiesTrade and other payables 15 9,629 8,032 Income in advance 3,569 2,115 Derivative financial instruments 11 41 5,690 Taxation payable 9,968 7,996
Total current liabilities 23,207 23,833
Total liabilities 454,455 344,809
Total unitholders’ funds and liabilities 978,174 784,565
For and on behalf of the Manager, Vital Healthcare Management Limited
G Horsley, Chairman C Higgins, Director11 August 2016
The notes on pages Fin-5 to Fin-27 form part of and are to be read in conjunction with these financial statements.
FIN-2 FINANCIAL STATEMENTS
VITAL HEALTHCARE PROPERTY TRUST ANNUAL REPORT 2016
Consolidated Statement of Financial PositionAs at 30 June 2016
Units on issue
$000s
Retained earnings
$000s
Translation of foreign
operations $000s
Foreign exchange
hedges $000s
Share based
payments $000s
Total unitholders’
funds $000s
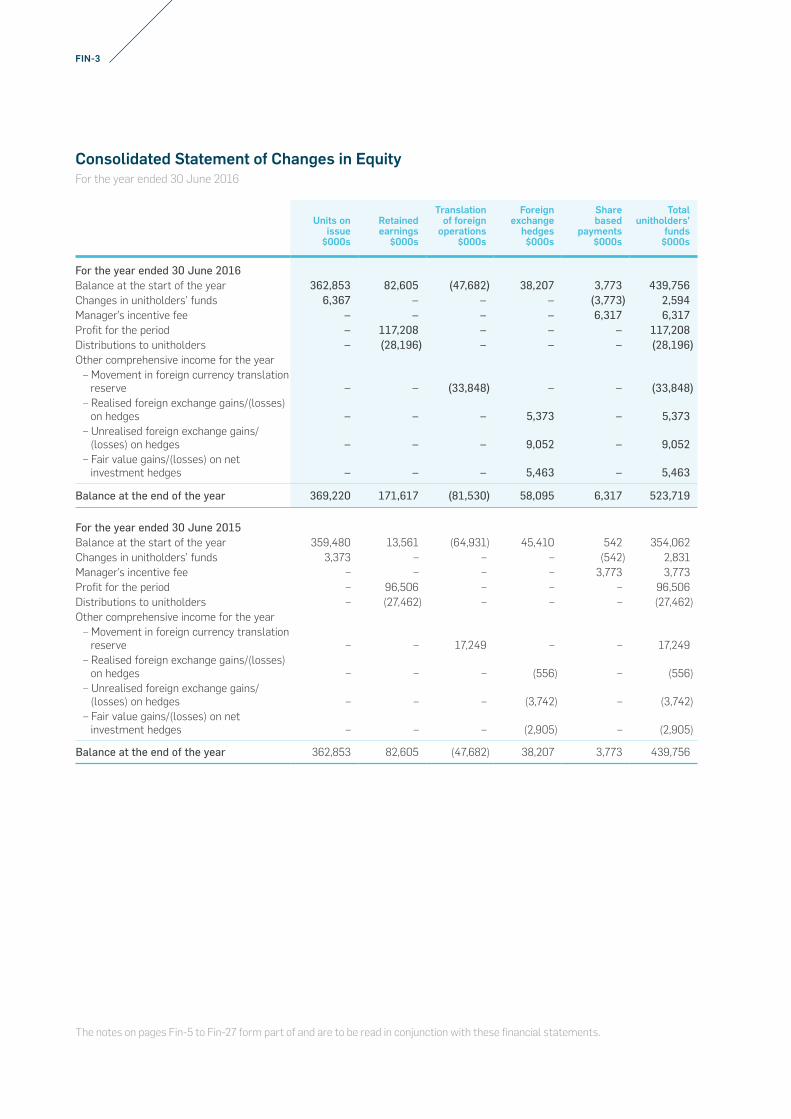
For the year ended 30 June 2016Balance at the start of the year 362,853 82,605 (47,682) 38,207 3,773 439,756 Changes in unitholders’ funds 6,367 – – – (3,773) 2,594 Manager’s incentive fee – – – – 6,317 6,317Profit for the period – 117,208 – – – 117,208Distributions to unitholders – (28,196) – – – (28,196)Other comprehensive income for the year
– Movement in foreign currency translation reserve – – (33,848) – – (33,848)
– Realised foreign exchange gains/(losses) on hedges – – – 5,373 – 5,373
– Unrealised foreign exchange gains/(losses) on hedges – – – 9,052 – 9,052
– Fair value gains/(losses) on net investment hedges – – – 5,463 – 5,463
Balance at the end of the year 369,220 171,617 (81,530) 58,095 6,317 523,719
For the year ended 30 June 2015Balance at the start of the year 359,480 13,561 (64,931) 45,410 542 354,062 Changes in unitholders’ funds 3,373 – – – (542) 2,831 Manager’s incentive fee – – – – 3,773 3,773Profit for the period – 96,506 – – – 96,506Distributions to unitholders – (27,462) – – – (27,462)Other comprehensive income for the year
– Movement in foreign currency translation reserve – – 17,249 – – 17,249
– Realised foreign exchange gains/(losses) on hedges – – – (556) – (556)
– Unrealised foreign exchange gains/(losses) on hedges – – – (3,742) – (3,742)
– Fair value gains/(losses) on net investment hedges – – – (2,905) – (2,905)
Balance at the end of the year 362,853 82,605 (47,682) 38,207 3,773 439,756
The notes on pages Fin-5 to Fin-27 form part of and are to be read in conjunction with these financial statements.
FIN-3
Consolidated Statement of Changes in EquityFor the year ended 30 June 2016

Note
30 June 2016
$000s
30 June 2015
$000s
Cash flows from operating activitiesCash was provided from:Property income 70,146 58,380 Recovery of property expenses 6,712 6,711 Interest received 97 103
Cash was applied to:Property expenses (8,628) (8,043)Management and trustee fees (6,870) (5,117)Interest paid (15,255) (13,269)Tax paid (4,552) (7,834)Other trust expenses (1,378) (5,822)
Net cash from/(used in) operating activities 9 40,272 25,109
Cash flows from investing activitiesCash was provided from:Sale of investment properties – 4,139 Receipts from foreign exchange derivatives 11,826 –
Cash was applied to:Capital additions on investment properties (48,483) (37,516)Purchase of properties (69,958) (20,027)Tenant incentives (576) –Property deposits (2,173) – Payments for foreign exchange derivatives (3,896) (93)Other (37) –
Net cash from/(used in) investing activities (113,297) (53,497)
Cash flows from financing activitiesCash was provided from:Debt drawdown 143,635 85,901
Cash was applied to:Repayment of debt (33,019) (32,696)Loan issue costs (568) – Costs associated with Distribution Reinvestment Plan (29) (16)Distributions paid to unitholders (25,045) (24,616)
Net cash from/(used in) financing activities 84,974 28,573
Net increase/(decrease) in cash and cash equivalents 11,949 185 Effect of exchange rate changes on cash and cash equivalents 9 (2)Cash and cash equivalents at the beginning of the year 1,022 839
Cash and cash equivalents at the end of the year 12,980 1,022
The notes on pages Fin-5 to Fin-27 form part of and are to be read in conjunction with these financial statements.
FIN-4 FINANCIAL STATEMENTS
VITAL HEALTHCARE PROPERTY TRUST ANNUAL REPORT 2016
Consolidated Statement of Cash FlowsFor the year ended 30 June 2016

1 REPORTING ENTITY
The reporting entity is Vital Healthcare Property Trust (“VHP” or the “Trust”), a unit trust established under the Unit Trusts Act 1960 by a Trust Deed dated 11 February 1994 as subsequently amended and replaced, domiciled in New Zealand. The Trust is managed by Vital Healthcare Management Limited (the “Manager”) and the address of its registered office is Level 16, AIG Building, 41 Shortland Street, Auckland.
The consolidated financial statements of VHP for the year ended 30 June 2016 comprise VHP and its subsidiaries (together referred to as the “Group”). VHP is listed on the New Zealand Stock Exchange (“NZX”) and is a FMC reporting entity for the purpose of the Financial Markets Conduct Act 2013. The Manager is an issuer for the purposes of the Financial Reporting Act 2013. The Trust’s principal activity is the investment in high quality health sector related properties.
These consolidated financial statements were approved by the Board of Directors of the Manager on 11 August 2016.
2 BASIS OF PREPARATION
(a) Statement of compliance
These financial statements have been prepared in accordance with Generally Accepted Accounting Practice in New Zealand (“NZ GAAP”). The financial statements comply with New Zealand equivalents to International Financial Reporting Standards (“NZ IFRS”) and other applicable Financial Reporting Standards, as appropriate for profit-oriented entities. The consolidated financial statements comply with International Financial Reporting Standards (“IFRS”). The accounting policies have been consistently applied, when compared to those used in the 2015 Annual Report except for the accounting policy on the incentive fee. The incentive fee is now recognised as a component of equity as management have determined this better reflects that the fee is settled in units. The comparative incentive fee amount of $3,773,000 for the period ended 30 June 2015, has been reclassified from a current liability to a component in equity.
(b) Basis of measurement
These financial statements have been prepared on the historical cost basis except for derivative financial instruments and investment properties which are measured at fair value.
(c) Functional and presentation currency
These financial statements are presented in New Zealand Dollars (“$”), which is the Trust’s functional and presentation currency. All information has been rounded to the nearest thousand dollars ($000), unless stated otherwise.
(d) Critical accounting estimates and judgements
In the application of NZ IFRS, the Board and management are required to make judgements, estimates and assumptions about carrying values of assets and liabilities that are not readily apparent from other sources. The estimates and associated assumptions are based on experience and other factors that are believed to be reasonable under the circumstances, the results of which form the basis of making the judgements. Actual results may differ from the estimates, judgements and assumptions made by the Board and management.
The estimates and underlying assumptions are reviewed on an ongoing basis. Revisions to accounting estimates are recognised in the period in which the estimate is revised and in any future periods affected. Judgements made by management in the application of NZ IFRS that have significant effects on the financial statements and estimates with a significant risk of a material adjustment in the next financial year are disclosed where applicable in the relevant notes to the financial statements. The areas involving a higher degree of judgement or complexity, or areas where assumptions and estimates are significant to the financial statements are as follows:
Note 10 – valuation of investment properties Note 11 – valuation of derivative financial instruments Note 12 – deferred tax (and taxation in Note 7).
3 SIGNIFICANT ACCOUNTING POLICIES
(a) Basis of consolidation
The Group’s financial statements incorporate the financial statements of the Trust and entities controlled by the Trust (its subsidiaries) as set out in Note 17. Control is achieved where the Trust has the power over the investees; is exposed, or has rights, to variable returns from it’s involvement with the investees; and has the ability to use its power to affect its returns. The results of subsidiaries are included in the consolidated financial statements from the effective date of acquisition or up to the effective date of disposal, as appropriate. All significant intra-group transactions, balances, income and expenses are eliminated on consolidation.
(b) Foreign currency transactions
The individual financial statements of each group entity are presented in the currency of the primary economic environment in which the entity operates (its functional currency). For the purpose of the Group financial statements, the results and financial position of each group entity are expressed in New Zealand Dollars.
In preparing the financial statements of the individual entities, transactions in currencies other than the entity’s functional currency (foreign currencies) are recorded at the rates of
FIN-5
Notes to the Consolidated Financial Statements

exchange prevailing at the dates of the transactions. At the end of each reporting period monetary assets and liabilities denominated in foreign currencies are retranslated at the rate of exchange prevailing at the end of the reporting period.
Exchange differences are recognised in profit or loss in the period in which they arise except for exchange differences on transactions entered into in order to hedge certain foreign currency risks (see below for hedge accounting policies).
(c) Foreign operations
For the purposes of presenting the Group financial statements, the assets and liabilities of the Group’s foreign operations are expressed in New Zealand Dollars using exchange rates prevailing at the end of the reporting period. Income and expense items are translated at the average exchange rates for the period. Exchange differences arising, if any, are recognised in other comprehensive income and accumulated as a separate component of equity in the Group’s foreign currency translation reserve.
(d) Goods and service tax
The statement of comprehensive income and statement of cash flows have been prepared so that all components are stated exclusive of goods and services tax (GST) to the extent that GST is recoverable. All items in the statement of financial position are stated exclusive of GST with the exception of receivables and payables, which include GST invoiced. Cash flows are included in the statement of cash flows on a net basis. The GST component of cash flows arising from investing and financing, which is recoverable from, or payable to, the taxation authority, is classified as part of operating cash flows.
(e) Investment properties
Investment property is property held either to earn rental income or for capital appreciation or both. Investment properties are initially stated at cost, including any related transaction costs. Subsequent expenditure is charged to the asset’s carrying amount only when it is probable that future economic benefits associated with the item will flow to the Trust and the cost of the item can be measured reliably. All other repairs and maintenance costs are charged to the statement of comprehensive income during the financial period in which they are incurred. Initial direct costs incurred in negotiating and arranging operating leases and lease incentives granted are added to the carrying amount of the leased asset.
After initial recognition, investment properties are stated at fair value as determined every year by independent valuers, with any change therein recognised in the statement of
comprehensive income. In accordance with the valuation policy of the Trust, complete property valuations are carried out by independent registered valuers having appropriately recognised professional qualifications and experience in the location and category of property being valued. The valuation policy stipulates that the same valuer may not value a building for more than two consecutive valuations. The fair values are based on market values being the estimated amount for which a property could be exchanged on the date of the valuation between a willing buyer and a willing seller in an arm’s length transaction after proper marketing wherein the parties had each acted knowledgeably, prudently and without compulsion. In the absence of current prices in an active market, the valuations are prepared using a discounted cash flow methodology based on the estimated rental cash flows expected to be received from the property adjusted by a discount rate that appropriately reflects the risks inherent in the expected cash flows.
Investment properties are derecognised when they have been disposed of and any gains or losses incurred on disposal, being the difference between the carrying amount of the investment property at the time of disposal and the proceeds on disposal, are recognised in the statement of comprehensive income in the year in which the disposal occurred.
(f) Development of investment properties
Investment property that is being redeveloped for continuing use is measured at fair value and subsequent expenditure is capitalised to the asset’s carrying amount only when it is probable that future economic benefits associated with the item will flow to the Group and the cost of the item can be measured reliably. Borrowing costs are capitalised if they are directly attributable to the development of a qualifying property. Capitalisation of borrowing costs commences when the activities to prepare the property are in progress and expenditure and borrowing costs are being incurred. The amount capitalised is the actual rate payable on borrowings for development purposes. Capitalisation of borrowing costs may continue until the assets are substantially ready for their intended use.
(g) Financial instruments
(g.1) Non-derivative financial instruments
Non-derivative financial instruments comprise investments, trade and other receivables, cash and cash equivalents, borrowings and trade and other payables.
(g.2) Cash and cash equivalents
Cash and cash equivalents comprise cash at bank and call deposits.
(g.3) Trade and other receivables
3 SIGNIFICANT ACCOUNTING POLICIES (continued)
(b) Foreign currency transactions (continued)
FIN-6 FINANCIAL STATEMENTS
VITAL HEALTHCARE PROPERTY TRUST ANNUAL REPORT 2016
Notes to the Consolidated Financial Statements

Trade and other receivables are recognised initially at fair value. A provision for impairment of trade receivables is established when there is objective evidence that the Group will not be able to collect all amounts due according to the original terms of the receivables. The amount of the provision is the difference between the asset’s carrying amount and the present value of estimated future cash flows, discounted at the original effective interest rate.
(g.4) Trade and other payables
Trade and other payables are recognised initially at fair value and subsequently measured at amortised cost using the effective interest method.
(g.5) Bank borrowings
Interest-bearing bank loans are initially measured at fair value net of transaction costs. Subsequent to initial recognition, borrowings are measured at amortised cost with any difference being recognised in the statement of comprehensive income over the period of the borrowing using the effective interest rate method. Accrued interest is classified separately under trade and other payables.
(g.6.1) Derivative financial instruments
The Group uses derivative financial instruments such as interest rate swaps and forward exchange contracts to reduce its exposure to interest rate risk and foreign exchange risk. Derivative financial instruments are initially recognised, and subsequently measured at fair value. Gains and losses arising from changes in fair value of a derivative are recognised as they arise in the profit and loss in the statement of comprehensive income unless the derivative is a hedging instrument in a qualifying hedge relationship, in which case the gains and losses are recognised in other comprehensive income. Derivatives are recognised on the date the contract is entered into.
(g.6.2) Hedge accounting
The Group has entered into hedge relationships for hedges of net investments in foreign operations. Hedge relationships are formally documented at the inception of the hedge and this documentation identifies the hedged item, hedging instrument, risks that are being hedged, strategies for undertaking the hedge, and the way effectiveness will be assessed.
In the hedge of a net investment in a foreign operation, the portion of foreign exchange differences arising on the hedging instrument determined to be an effective hedge is recognised directly in other comprehensive income. Any ineffective portion is recognised directly in the profit and loss in the statement of comprehensive income. The Group uses derivative financial instruments and non-derivative financial instruments as hedging instruments of a net investment in a foreign operation. On disposal of the foreign operation, the cumulative value of such gains or losses recognised in other comprehensive income
is reclassified to the profit and loss in the statement of comprehensive income.
(h) Recognition of income
Rental income from the investment properties held by the Group is recognised in the statement of comprehensive income on a straight line basis over the term of the lease. Lease incentives provided in relation to letting the investment property are amortised on a straight line basis over the non-cancellable portion of the lease to which they relate, as a reduction of rental income. Operating expenses attributable to tenants are offset by recoveries from tenants. Operating expenses not attributable to tenants are offset by rental income.
Dividend income from investments is recognised when the Group’s right to receive payment has been established.
(i) Finance expense
Finance expense comprises interest payable on borrowings and realised gains and losses on the interest rate hedging instruments that are recognised in profit or loss. All borrowing costs (other than borrowing costs attributable to property under development) are recognised in the statement of comprehensive income using the effective interest method.
(j) Taxation
(j.1) Income tax expense
Income tax expense represents the sum of the tax currently payable and deferred tax. Income tax expense is recognised in profit or loss in the statement of comprehensive income except to the extent that it relates to items recognised directly in other comprehensive income or equity, in which case the tax is recognised in other comprehensive income or equity.
(j.2) Current tax
The tax currently payable is based on taxable profit for the reporting period, using tax rates enacted or substantively enacted at the reporting date in the countries where the Group operates. Management periodically evaluates positions taken in tax returns with respect to situations in which applicable tax regulation is subject to interpretation, and establishes provisions where appropriate on the basis of amounts expected to be paid to the tax authorities. Taxable profit differs from profit reported in the statement of comprehensive income because it excludes items that are never taxable or deductible.
(j.3) Deferred tax
Deferred tax is recognised on differences between the carrying amounts of assets and liabilities in the financial statements and the corresponding tax bases used in the computation of taxable profit, and is accounted for using the balance sheet liability method. Deferred tax liabilities are generally recognised for all taxable temporary differences, and deferred tax assets are generally recognised for all deductible temporary differences to the extent that it is probable that taxable profits will be available against which those deductible temporary differences can be utilised.
3 SIGNIFICANT ACCOUNTING POLICIES (continued)
(g) Financial instruments (continued)
FIN-7

(j) Taxation (continued)
Deferred tax is calculated at the tax rates that are expected to apply in the period in which the liability is settled or the asset realised, based on tax rates (and tax rules) that have been enacted or substantively enacted by the end of the reporting period.
(k) Items carried at fair value
The items which are carried at fair value include investment property and financial instruments. These items are classified into the following levels in the fair value measurement hierarchy:
Level 1 – quoted prices (unadjusted) in active markets for identical assets or liabilities;
Level 2 – inputs other than quoted prices included within Level 1 that are observable for the asset or liability, either directly (i.e. as prices) or indirectly (i.e. derived from prices); and
Level 3 – inputs for the asset or liability that are not based on observable market data (unobservable inputs).
(l) Operating lease commitments
The Group has entered into commercial property leases on its investment properties. The Group has determined that it retains all significant risks and rewards of ownership of these properties and has thus classified the leases as operating leases.
(m) Capital
(m.1) Units
Units are classified as equity. External costs, net of tax, directly attributable to the issue of new units are deducted from unitholders’ funds as permitted by the Trust Deed.
(m.2) Distributions
Distributions to the Group’s unit holders are recognised as a liability in the Group’s financial statements in the period in which the distributions are approved.
(m.3) Share based payments
The Trust receives management services from the Manager and pays the Manager an asset management fee and an incentive fee. The management fee is recorded in the statement of comprehensive income and is settled in cash. The incentive fee, as set out in the Trust Deed, is settled in newly issued units. The incentive fee arrangements are considered a share based payment. The Trust recognises the incentive fee as the services are provided. The incentive fee not yet settled as newly issued units is reflected within the share based payment reserve until such time as it has been settled.
(n) Statement of cash flows
The statement of cash flows is prepared on a GST exclusive basis, which is consistent with the statement of comprehensive income.
The following terms are used in the statement of cash flows:
Operating activities are the principal revenue producing activities of the Group and other activities that are not investing or financing activities.
Investing activities are the acquisition and disposal of long term assets and other investments not included in cash equivalents.
Financing activities are activities that result in changes in the size and composition of the contributed equity and borrowings of the entity.
(o) Standards, interpretations and amendments to published standards that are not yet effective
At the date of authorisation of these financial statements the following new standards, amendments and interpretations to existing standards have been published but are not yet effective, which have not been analysed but may affect presentation, measurement and disclosure:
NZ IFRS 9 Financial Instruments (effective for accounting periods beginning on or after 1 January 2018) introduces a new classification and measurement regime for financial assets and liabilities.
NZ IFRS 15 Revenue from contract with customers is effective for annual reporting periods beginning on or after 1 January 2018. It is not practical to provide a reasonable estimate of the effect until a detailed review has been completed.
NZ IFRS 16 Leases eliminates the distinction between the operating and finance leases for lessees and will result in lessees bringing most leases onto their balance sheets. The accounting by lessors will remain largely unchanged. This standard is effective for periods beginning on or after 1 January 2019, although early adoption is permitted.
Other new standards, amendments and interpretations issued by the International Accounting Standards Board and the New Zealand Accounting Standards Board that are not yet effective and have not been early adopted by the Trust are not expected to materially impact the Trust’s financial statements in the period of initial application.
3 SIGNIFICANT ACCOUNTING POLICIES (continued)
FIN-8 FINANCIAL STATEMENTS
VITAL HEALTHCARE PROPERTY TRUST ANNUAL REPORT 2016
Notes to the Consolidated Financial Statements

3 SIGNIFICANT ACCOUNTING POLICIES (continued)
(p) Standards, interpretations and amendments adopted by Vital Healthcare Property Trust
There were no new standards, amendments or interpretations adopted in the current year that impacted the Group.
(q) Changes in accounting policy and presentation
There have been no significant changes in accounting policies during the current financial year, except as disclosed in note 2(a). All accounting policies have been applied on a basis consistent with the prior years financial statements.
4 SEGMENT INFORMATION
The principal business activity of the Trust and its subsidiaries is to invest in Health Sector related properties. NZ IFRS 8 requires operating segments to be identified on the basis of internal reports about components of the Group that are regularly reviewed by the chief operating decision maker in order to allocate resources to the segments and to assess their performance.
The information reported to the Group’s chief operating decision maker is based on primarily one industry sector, investing in Health Sector related properties. The Group operates in both Australia and New Zealand.
The following is an analysis of the Group’s revenue and results from continuing operations by reportable segment.
Australia$000s
New Zealand$000s
Total$000s
Segment profit/(loss) for the year ended 30 June 2016:Net property income 55,053 13,221 68,274 Other (expense) (6,016) (8,962) (14,978)Finance income 4 106 110 Finance (expense) (6,681) (8,472) (15,153)
42,360 (4,107) 38,253 Fair value gain/(loss) on interest rate derivatives 9 (6,189) (6,180)Revaluation gain/(loss) on investment properties 90,950 10,919 101,869 Receipts/(payments) under transaction hedging foreign exchange derivatives – 468 468Fair value gain/(loss) on foreign exchange derivatives – 1,741 1,741 Unrealised gain/(loss) on foreign exchange (8) 2,112 2,104
Total segment profit/(loss) before income tax 133,311 4,944 138,255 Taxation (expense) (21,047)
Profit for the year 117,208
Segment profit/(loss) for the year ended 30 June 2015:Net property income 45,986 13,444 59,430 Other (expense) (4,673) (6,267) (10,940)Finance income 10 93 103 Finance (expense) (4,515) (7,580) (12,095)
36,808 (310) 36,498 Fair value gain/(loss) on interest rate derivatives 90 (5,435) (5,345)Revaluation gain/(loss) on investment properties 77,896 6,135 84,031 Receipts/(payments) under transaction hedging foreign exchange derivatives – 679 679 Fair value gain/(loss) on foreign exchange derivatives – (1,167) (1,167)Unrealised gain/(loss) on foreign exchange (3) (1,789) (1,792)
Total segment profit/(loss) before income tax 114,791 (1,887) 112,904 Taxation (expense) (16,398)
Profit for the year 96,506
FIN-9

Net property income consists of revenue generated from external tenants less property operating expenditure. The Group has three tenants with over 10% of gross property income from rentals totalling $54.8m, all in Australia (2015: four tenants totalling $46.8m).
There were no inter-segment sales during the year (2015: nil).
Segment profit represents the profit earned by each segment including allocation of identifiable administration costs, finance costs, revaluation gains/(losses) on investment properties, and gains/(losses) on disposal of investment properties. This is the measure reported to the Board of Directors, who are the chief operating decision makers for the purposes of resource allocation and assessment of segment performance.
Australia$000s
New Zealand$000s
Total$000s
Segment assets as at 30 June 2016Investment properties 777,109 174,770 951,879 Other non-current assets 296 62 358Current assets 3,027 22,910 25,937
Consolidated assets 780,432 197,742 978,174
Segment assets as at 30 June 2015Investment properties 618,174 163,688 781,862 Other non-current assets 320 87 407 Current assets 912 1,384 2,296
Consolidated assets 619,406 165,159 784,565
Segment liabilities as at 30 June 2016Borrowings 213,679 130,480 344,159 Other liabilities 69,553 40,743 110,296
Consolidated liabilities 283,232 171,223 454,455
Segment liabilities as at 30 June 2015Borrowings 139,309 117,075 256,384 Other liabilities 54,285 34,140 88,425
Consolidated liabilities 193,594 151,215 344,809
For the purposes of monitoring segment performance and allocating resources between segments:
– all assets are allocated to reportable segments, and
– all liabilities are allocated to reportable segments.
4 SEGMENT INFORMATION (continued)
FIN-10 FINANCIAL STATEMENTS
VITAL HEALTHCARE PROPERTY TRUST ANNUAL REPORT 2016
Notes to the Consolidated Financial Statements

5 OTHER EXPENSES
2016$000s
2015$000s
ExpensesAuditors’ remuneration:Audit and review of financial statements 135 120
Manager’s fees 6,200 4,863 Manager’s incentive fee 6,317 3,773 Other operating expenses 2,326 2,184
Total other expenses 14,978 10,940
6 FINANCE EXPENSES
2016$000s
2015$000s
ExpensesInterest expense 15,581 13,066 Borrowing costs capitalised (428) (971)
Total finance expenses 15,153 12,095
FIN-11
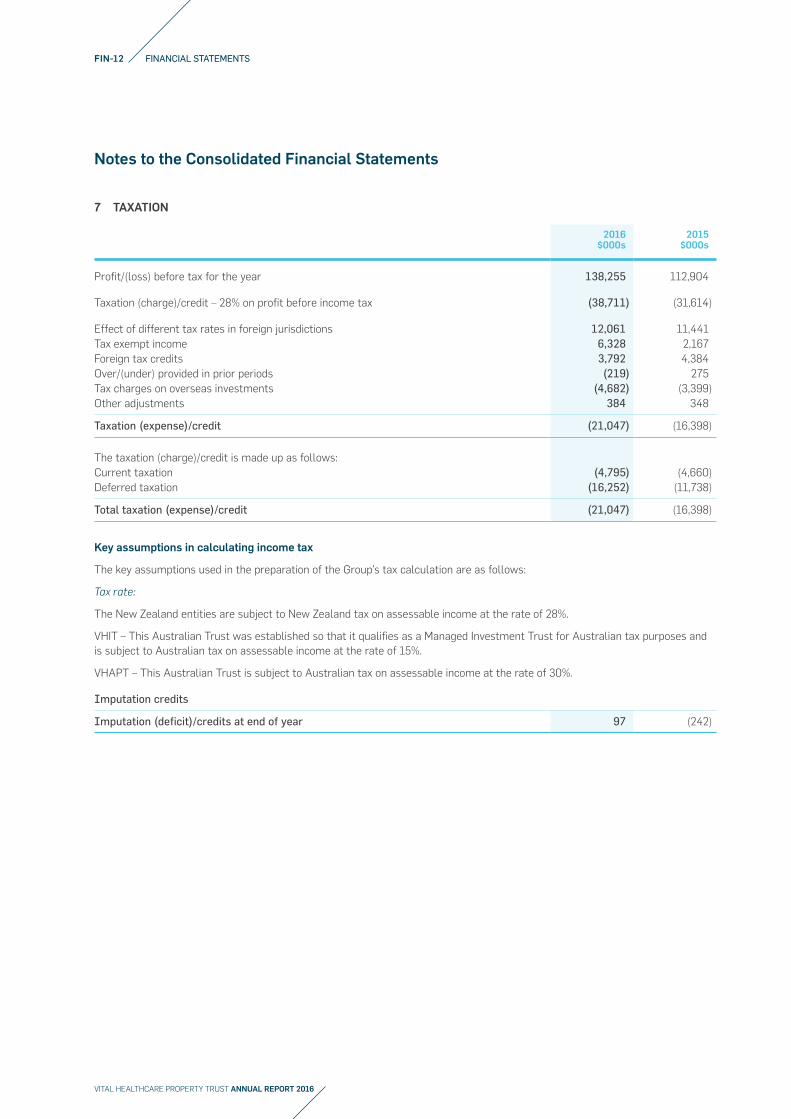
7 TAXATION
2016$000s
2015$000s
Profit/(loss) before tax for the year 138,255 112,904
Taxation (charge)/credit – 28% on profit before income tax (38,711) (31,614)
Effect of different tax rates in foreign jurisdictions 12,061 11,441 Tax exempt income 6,328 2,167 Foreign tax credits 3,792 4,384 Over/(under) provided in prior periods (219) 275 Tax charges on overseas investments (4,682) (3,399)Other adjustments 384 348
Taxation (expense)/credit (21,047) (16,398)
The taxation (charge)/credit is made up as follows:Current taxation (4,795) (4,660)Deferred taxation (16,252) (11,738)
Total taxation (expense)/credit (21,047) (16,398)
Key assumptions in calculating income tax
The key assumptions used in the preparation of the Group’s tax calculation are as follows:
Tax rate:
The New Zealand entities are subject to New Zealand tax on assessable income at the rate of 28%.
VHIT – This Australian Trust was established so that it qualifies as a Managed Investment Trust for Australian tax purposes and is subject to Australian tax on assessable income at the rate of 15%.
VHAPT – This Australian Trust is subject to Australian tax on assessable income at the rate of 30%.
Imputation credits
Imputation (deficit)/credits at end of year 97 (242)
FIN-12 FINANCIAL STATEMENTS
VITAL HEALTHCARE PROPERTY TRUST ANNUAL REPORT 2016
Notes to the Consolidated Financial Statements

8 EARNINGS PER UNIT
Basic and diluted earnings per unit is calculated by dividing the profit attributable to unitholders of the Trust by the weighted average number of ordinary units on issue during the year.
2016 2015
Profit attributable to unitholders of the Trust ($000s) 117,208 96,506 Weighted average number of units on issue (000’s of units) 344,721 340,940 Basic and diluted earnings per unit (cents) 34.00 28.31
$000s $000s
DISTRIBUTABLE INCOMEProfit before income tax 138,255 112,904 Revaluation (gains)/losses (101,869) (84,031)Unrealised foreign (gain)/loss (2,104) 1,792 Unrealised foreign (gain)/loss derivatives (1,741) 1,167 Unrealised interest rate (gain)/loss derivatives 6,180 5,345 Managers incentive fee 6,317 3,773
Profit used in calculating gross distributable income 45,038 40,950
Current tax charge 4,795 4,660
Profit used in calculating net distributable income 40,243 36,290
Gross distributable income (cpu) * 13.07 12.01 Net distributable income (cpu) * 11.67 10.64
* Based on weighted average number of units on issue.
Distributions paid in the financial year were 8.20 cents per unit (2015: 7.975).
FIN-13

9 STATEMENT OF CASH FLOWS RECONCILIATION FROM OPERATING ACTIVITIES
2016 $000s
2015 $000s
Cash and cash equivalentsAustralian financial institutions 1,845 98 New Zealand financial institutions 11,135 924
Cash at bank 12,980 1,022
Reconciliation of profit after income tax to net cash flows from operating activitiesProfit after tax for the year 117,208 96,506 Adjustments for non-cash itemsChange in fair value of investment properties (101,869) (84,031)Fair value (gain)/loss on derivative financial instruments 4,439 6,512 Unrealised foreign exchange (gain)/loss (2,104) 1,792 Deferred taxation 16,252 11,738 Income in advance (2,210) (2,019)Manager’s incentive fee 6,317 3,773Other (443) (1,121)Effect of exchange rate changes on cash balances 9 (2)
Operating cash flow before changes in working capital 37,599 33,148
Change in trade and other payables 1,597 (3,492) Change in taxation payable 1,972 (2,847)Change in trade and other receivables (2,220) (118)Items classified as investing activities 1,324 (1,582)
Net cash from operating activities 40,272 25,109
During the 2016 year, distributions of $3,150,679 (2015: $2,847,433) have been reinvested under the Distribution Reinvestment Plan (‘DRP’), which is excluded from investing and financing activities.
FIN-14 FINANCIAL STATEMENTS
VITAL HEALTHCARE PROPERTY TRUST ANNUAL REPORT 2016
Notes to the Consolidated Financial Statements

10 INVESTMENT PROPERTIES
2016$000s
2015$000s
Carrying value of investment properties at the beginning of the year 781,862 613,136 Acquisition of properties 71,225 20,027 Capitalised costs 47,667 42,007 Capitalised interest costs 428 971 Net capitalised incentives (191) 904 Disposals – (4,200)Foreign exchange translation difference (50,981) 24,986 Change in fair value 101,869 84,031
Carrying value of investment properties at the end of the year 951,879 781,862
Carrying value of investment properties includes:Fair value of investment properties 946,109 773,881 Income in advance 5,770 7,981
Carrying value of investment properties at the end of the year 951,879 781,862
The capitalised costs consist of $47.4m relating to Australian investment properties and $0.3m relating to New Zealand investment properties. The foreign exchange translation difference relates to Australian investment properties. Interest was capitalised at an average of 3.6%.
The Group holds the freehold title to all properties except the car parks at the rear of Ascot Hospital and Ascot Central. The total value of leasehold property at 30 June 2016 was $3.4m (2015: $3.3m) representing 0.4% of the total investment properties portfolio (2015: 0.4%). The weighted average lease length of leasehold property at 30 June 2015 was 2.8 years (2015: 3.8 years). The Group has an option to extend the ground lease, with two further rights of renewal of 20 years each. This will extend the final expiry to 2059.
Income in advance relates to a termination payment received of $10.0m, and will be amortised over a five year period to March 2019.
Investment properties are classified as Level 3 under the fair value hierarchy as adjustments need to be made to observable data on similar properties to derive fair value.
Investment properties are stated at fair value by independent valuers supported by market evidence of property sale transactions and leasing activity. These valuations are reviewed by the Manager. The methods used for assessing the current market value are the Direct Comparison, Discounted Cash Flow, Capitalisation of Contract and Market Income approaches and are unchanged from the prior year. The principal assumptions in establishing the valuation include the capitalisation rate, occupancy and the weighted average lease term to expiry (“WALE”) with the following table identifying the respective levels adopted by the Valuers within the Group’s segment.
Generally as occupancy and weighted average lease terms increase, yields firm, resulting in increased fair values for investment properties.
FIN-15

Fair value Market capitalisation rate Occupancy WALE
Properties Location30 June 2016 Valuer
$000s2016
$000s2015
%2016
%2015
%2016
%2015
Years2016
Years2015
AustraliaAllamanda Private Hospital Southport, Queensland Knight Frank 45,121 46,605 6.5 7.3 100.0 100.0 21.6 22.7Belmont Private Hospital Carina Heights, Queensland Knight Frank 50,147 45,057 7.3 8.0 100.0 100.0 19.6 20.6Clover Lea Aged Care Burwood Heights, New South Wales M3 11,202 – 8.0 – 100.0 – 19.7 –Dubbo Private Hospital Dubbo, New South Wales Jones Lang LaSalle Australia 9,986 8,484 8.5 9.3 100.0 100.0 15.6 16.6Epworth Eastern Hospital Box Hill, Victoria Ernst & Young 103,843 91,288 6.8 7.5 100.0 100.0 17.5 9.8Epworth Eastern Medical Centre Box Hill, Victoria Ernst & Young 28,894 16,176 6.8 8.3 100.0 98.6 10.9 6.1Epworth Rehabilitation Brighton, Victoria M3 20,310 19,344 7.0 8.0 100.0 100.0 2.6 3.6Fairfield Aged Care Fairfield, New South Wales M3 14,761 – 8.0 – 100.0 – 19.7 –Gold Coast Surgery Centre Southport, Queensland Knight Frank 19,263 15,837 7.5 10.0 96.0 92.2 1.4 9.3Hamersley Aged Care Subiaco, Western Australia M3 11,097 – 8.0 – 100.0 – 19.7 –Hurstville Private Hospital Sydney, New South Wales M3 73,148 65,881 7.5 8.3 100.0 100.0 25.8 26.8Lingard Private Hospital Merewether, New South Wales Ernst & Young 87,731 79,750 7.3 8.0 100.0 100.0 24.7 25.7Maitland Private Hospital East Maitland, New South Wales Ernst & Young 63,339 50,027 7.3 8.0 100.0 100.0 21.5 17.5Marian Centre Perth, Western Australia Jones Lang LaSalle Australia 33,107 19,840 7.8 9.0 100.0 100.0 18.1 19.1Mayo Private Hospital Taree, New South Wales Jones Lang LaSalle Australia 29,313 29,128 8.0 8.5 100.0 100.0 15.5 16.5Melbourne Pathology Building* Noble Park, Victoria – 792 – 8.3 – 100.0 – 25.7North West Private Hospital Burnie, Tasmania Knight Frank 15,494 15,271 8.5 9.3 100.0 100.0 15.6 16.6Palm Beach Currumbin Clinic Currumbin, Queensland Knight Frank 32,035 31,617 7.3 8.0 100.0 100.0 15.6 16.6Rockingham Aged Care Rockingham, Western Australia M3 5,863 – 8.0 – 100.0 – 19.7 –South Eastern Private Hospital* Noble Park, Victoria M3 40,826 23,820 7.3 8.3 100.0 100.0 24.7 25.7Sportsmed Consulting Adelaide, South Australia Knight Frank 1,790 – 7.0 – 100.0 – 19.6 –Sportsmed Hospital & Clinic Adelaide, South Australia Ernst & Young 39,981 36,821 7.6 8.7 100.0 100.0 18.9 17.4Sportsmed Office Adelaide, South Australia Knight Frank 3,591 – 7.0 – 100.0 – 19.6 –Toronto Private Hospital Toronto, New South Wales Jones Lang LaSalle Australia 19,786 18,325 7.8 9.0 100.0 100.0 26.5 27.5
760,628 614,063 New ZealandApollo Health and Wellness Centre Albany, Auckland Colliers International New Zealand Limited 22,600 21,403 7.5 7.9 91.4 90.6 3.9 4.6Ascot Central Greenlane, Auckland Jones Lang LaSalle New Zealand 26,600 25,600 6.8 6.9 100.0 100.0 3.8 4.6Ascot Central Carpark (ground lease) Greenlane, Auckland Jones Lang LaSalle New Zealand 1,600 1,550 10.4 10.8 100.0 100.0 3.5 4.1Ascot Hospital & Clinics Greenlane, Auckland Absolute Value 90,000 81,505 6.4 7.0 99.5 99.5 19.1 20.3Ascot Hospital Carpark (ground lease) Greenlane, Auckland Absolute Value 1,750 1,700 11.6 9.8 100.0 100.0 27.0 28.0Kensington Hospital Whangarei, Northland Colliers International New Zealand Limited 15,300 13,550 7.5 8.5 100.0 100.0 30.0 5.7Napier Health Centre Napier, Hawkes Bay Absolute Value 11,150 10,400 9.1 10.3 100.0 100.0 3.5 4.5
169,000 155,708
Properties held for development – Australia 16,481 4,110
TOTAL FAIR VALUE OF INVESTMENT PROPERTIES 946,109 773,881 7.2 8.0 99.6 99.4 18.4 17.1
Income in advance 5,770 7,981 TOTAL CARRYING VALUE 951,879 781,862
10 INVESTMENT PROPERTIES (continued)
* On 1 April 2016, Melbourne Pathology Building was consolidated with South Eastern Private Hospital, as a result of development activities.
FIN-16 FINANCIAL STATEMENTS
VITAL HEALTHCARE PROPERTY TRUST ANNUAL REPORT 2016
Notes to the Consolidated Financial Statements
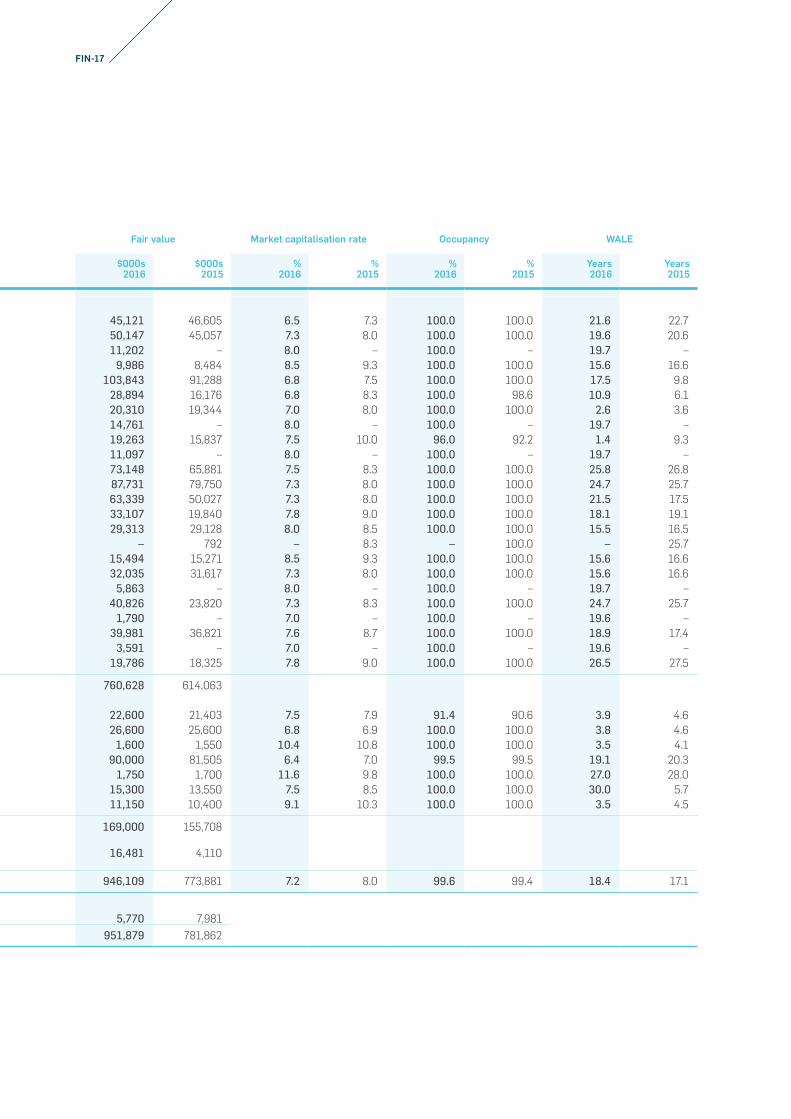
Fair value Market capitalisation rate Occupancy WALE
Properties Location30 June 2016 Valuer
$000s2016
$000s2015
%2016
%2015
%2016
%2015
Years2016
Years2015
AustraliaAllamanda Private Hospital Southport, Queensland Knight Frank 45,121 46,605 6.5 7.3 100.0 100.0 21.6 22.7Belmont Private Hospital Carina Heights, Queensland Knight Frank 50,147 45,057 7.3 8.0 100.0 100.0 19.6 20.6Clover Lea Aged Care Burwood Heights, New South Wales M3 11,202 – 8.0 – 100.0 – 19.7 –Dubbo Private Hospital Dubbo, New South Wales Jones Lang LaSalle Australia 9,986 8,484 8.5 9.3 100.0 100.0 15.6 16.6Epworth Eastern Hospital Box Hill, Victoria Ernst & Young 103,843 91,288 6.8 7.5 100.0 100.0 17.5 9.8Epworth Eastern Medical Centre Box Hill, Victoria Ernst & Young 28,894 16,176 6.8 8.3 100.0 98.6 10.9 6.1Epworth Rehabilitation Brighton, Victoria M3 20,310 19,344 7.0 8.0 100.0 100.0 2.6 3.6Fairfield Aged Care Fairfield, New South Wales M3 14,761 – 8.0 – 100.0 – 19.7 –Gold Coast Surgery Centre Southport, Queensland Knight Frank 19,263 15,837 7.5 10.0 96.0 92.2 1.4 9.3Hamersley Aged Care Subiaco, Western Australia M3 11,097 – 8.0 – 100.0 – 19.7 –Hurstville Private Hospital Sydney, New South Wales M3 73,148 65,881 7.5 8.3 100.0 100.0 25.8 26.8Lingard Private Hospital Merewether, New South Wales Ernst & Young 87,731 79,750 7.3 8.0 100.0 100.0 24.7 25.7Maitland Private Hospital East Maitland, New South Wales Ernst & Young 63,339 50,027 7.3 8.0 100.0 100.0 21.5 17.5Marian Centre Perth, Western Australia Jones Lang LaSalle Australia 33,107 19,840 7.8 9.0 100.0 100.0 18.1 19.1Mayo Private Hospital Taree, New South Wales Jones Lang LaSalle Australia 29,313 29,128 8.0 8.5 100.0 100.0 15.5 16.5Melbourne Pathology Building* Noble Park, Victoria – 792 – 8.3 – 100.0 – 25.7North West Private Hospital Burnie, Tasmania Knight Frank 15,494 15,271 8.5 9.3 100.0 100.0 15.6 16.6Palm Beach Currumbin Clinic Currumbin, Queensland Knight Frank 32,035 31,617 7.3 8.0 100.0 100.0 15.6 16.6Rockingham Aged Care Rockingham, Western Australia M3 5,863 – 8.0 – 100.0 – 19.7 –South Eastern Private Hospital* Noble Park, Victoria M3 40,826 23,820 7.3 8.3 100.0 100.0 24.7 25.7Sportsmed Consulting Adelaide, South Australia Knight Frank 1,790 – 7.0 – 100.0 – 19.6 –Sportsmed Hospital & Clinic Adelaide, South Australia Ernst & Young 39,981 36,821 7.6 8.7 100.0 100.0 18.9 17.4Sportsmed Office Adelaide, South Australia Knight Frank 3,591 – 7.0 – 100.0 – 19.6 –Toronto Private Hospital Toronto, New South Wales Jones Lang LaSalle Australia 19,786 18,325 7.8 9.0 100.0 100.0 26.5 27.5
760,628 614,063 New ZealandApollo Health and Wellness Centre Albany, Auckland Colliers International New Zealand Limited 22,600 21,403 7.5 7.9 91.4 90.6 3.9 4.6Ascot Central Greenlane, Auckland Jones Lang LaSalle New Zealand 26,600 25,600 6.8 6.9 100.0 100.0 3.8 4.6Ascot Central Carpark (ground lease) Greenlane, Auckland Jones Lang LaSalle New Zealand 1,600 1,550 10.4 10.8 100.0 100.0 3.5 4.1Ascot Hospital & Clinics Greenlane, Auckland Absolute Value 90,000 81,505 6.4 7.0 99.5 99.5 19.1 20.3Ascot Hospital Carpark (ground lease) Greenlane, Auckland Absolute Value 1,750 1,700 11.6 9.8 100.0 100.0 27.0 28.0Kensington Hospital Whangarei, Northland Colliers International New Zealand Limited 15,300 13,550 7.5 8.5 100.0 100.0 30.0 5.7Napier Health Centre Napier, Hawkes Bay Absolute Value 11,150 10,400 9.1 10.3 100.0 100.0 3.5 4.5
169,000 155,708
Properties held for development – Australia 16,481 4,110
TOTAL FAIR VALUE OF INVESTMENT PROPERTIES 946,109 773,881 7.2 8.0 99.6 99.4 18.4 17.1
Income in advance 5,770 7,981 TOTAL CARRYING VALUE 951,879 781,862
FIN-17

11 DERIVATIVE FINANCIAL INSTRUMENTS
2016 $000s
2015 $000s
Current assetsForeign exchange derivative assets 9,486 23 Current liabilitiesInterest rate derivative liabilities – (800)Foreign exchange derivative liabilities (41) (4,890)Non-current liabilitiesInterest rate derivative liabilities (19,764) (13,475)
Balance (10,319) (19,142)
Interest rate swaps
Interest rate swaps are measured using a valuation model based on the present value of estimated future cash flows and discounted based on the applicable yield curves derived from observable market interest rates. The Group has determined the interest rate swaps are Level 2 fair value measurements (refer to Note 3.(k)). There have been no reclassifications between levels in the years ended 30 June 2016 and 2015.
Interest rate derivatives mature over the next nine years and have fixed interest rates ranging from 2.64% to 4.99% (2015: from 2.69% to 5.72%)
Nominal value of interest rate swaps – AUD 205,000 190,000 Average fixed interest rate 3.76% 4.24%Floating rates based on AUD BBSW 2.04% 2.20%
Foreign exchange derivatives
Foreign exchange derivatives are measured using a valuation model based on the applicable forward price curves derived from observable forward prices. The Group has determined the foreign exchange derivatives are Level 2 fair value measurements (refer to Note 3.(k)). There have been no reclassifications between levels in the years ended 30 June 2016 and 2015.
Nominal value of foreign exchange contracts – AUD 130,000 153,000 Nominal value of foreign exchange options – AUD – 80,000 Average foreign exchange rate 0.8974 0.9004
Nominal value of foreign exchange contracts – NZD 100,000 –Average foreign exchange rate 0.9538 –
FIN-18 FINANCIAL STATEMENTS
VITAL HEALTHCARE PROPERTY TRUST ANNUAL REPORT 2016
Notes to the Consolidated Financial Statements

12 DEFERRED TAX
The following are the major deferred tax liabilities and (assets) recognised by the Group, and the movements thereon during the current and prior reporting years:
Interest rate swaps$000s
Revaluation of investment
properties$000s
Borrowings$000s
Other$000s
Total$000s
At 1 July 2015 (4,011) 47,218 5,087 (3,043) 45,251 Charge to profit and loss for the year (1,536) 16,895 – 893 16,252 Change in exchange rate 13 (3,495) – 4 (3,478)Charge to other comprehensive income – – 2,124 3,520 5,644
At 30 June 2016 (5,534) 60,618 7,211 1,374 63,669
At 1 July 2014 (2,506) 29,496 5,991 1,119 34,100 Charge to profit and loss for the year (1,494) 15,935 – (2,702) 11,739 Change in exchange rate (11) 1,787 – (5) 1,771 Charge to other comprehensive income – – (904) (1,455) (2,359)
At 30 June 2015 (4,011) 47,218 5,087 (3,043) 45,251
Significant estimates and judgements made in the determination of deferred tax (with an impact on current tax) include:
Deferred tax on depreciation – deferred tax is provided in respect of depreciation expected to be recovered on the sale of investment property at fair value.
Deferred tax on changes in fair value of investment properties – deferred tax is provided on New Zealand-based properties for depreciation recovery on the building components, being the taxable temporary difference. Deferred tax for Australian-based properties is provided on the capital gains tax expected to be assessable on the land and building component from the sale of investment properties at fair value. Investment properties are valued each year by independent valuers (as outlined in Note 10). These values include an allocation of the valuation between the land and building components. The calculation of deferred tax on depreciation recovered and capital gains tax is based on the split provided by the valuers.
Deferred tax on fixtures and fittings – it is assumed that all fixtures and fittings will be sold at their tax book value.
FIN-19

13 UNITS ON ISSUE
2016 $000s
2015 $000s
Balance at the beginning of the year 362,853 359,480
Issue of units under Distribution Reinvestment Plan 3,150 2,847 Issue of units to satisfy Manager’s incentive fee 3,773 542 Issue costs of units (556) (16)
6,367 3,373
Balance at the end of the year 369,220 362,853
2016 000s
2015 000s
Reconciliation of number of unitsBalance at the beginning of the year 342,080 339,851 Units issued to satisfy Manager’s incentive fee 2,289 405 Issue of units under the Distribution Reinvestment Plan 1,629 1,824
Balance at the end of the year 345,998 342,080
The number of units on issue at 30 June 2016 was 345,997,825 (2015: 342,080,378). The units have no par value and are fully paid. Fully paid ordinary units carry one vote per unit and carry the right to distributions.
On 19 August 2015, 2,289,196 units were issued against the 2015 Manager’s incentive fee of $3,773,053 (2015: 405,036 were issued against the 2014 Manager’s incentive fee).
Capital risk management
The Group is subject to imposed capital requirements arising from the Trust Deed, which requires, that the total borrowings do not exceed 50% of the gross value of the Trust Fund.
The Group’s banking covenants require that the aggregate principal amount of the loan outstanding does not exceed 50% (2015: 50%) of the fair market value of property at all times calculated to the New Zealand dollar equivalent. All banking covenants have been met during the year.
The Group manages its capital to ensure that entities in the Group will be able to continue as a going concern while maximising the return to stakeholders through the optimisation of the debt and equity balance. The Group’s policies in respect of capital management and allocation are reviewed regularly by the Board of Directors. There have been no material changes in the Group’s overall capital risk management strategy during the year.
FIN-20 FINANCIAL STATEMENTS
VITAL HEALTHCARE PROPERTY TRUST ANNUAL REPORT 2016
Notes to the Consolidated Financial Statements
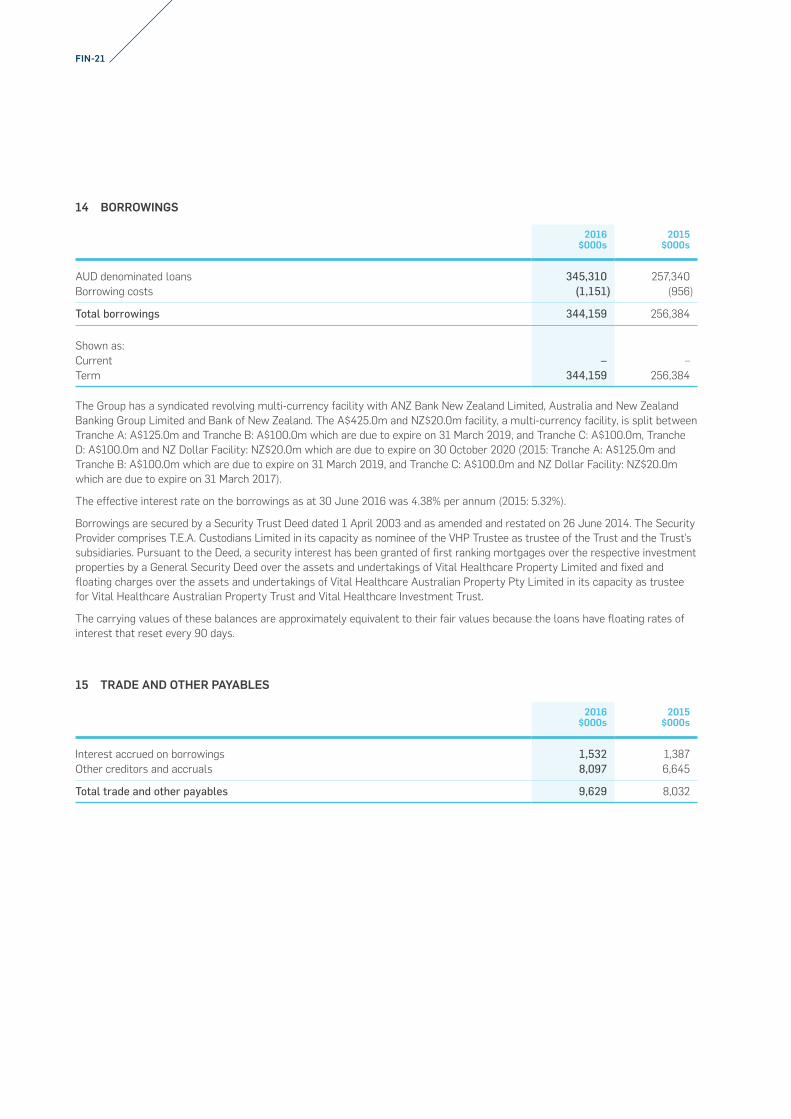
14 BORROWINGS
2016 $000s
2015 $000s
AUD denominated loans 345,310 257,340 Borrowing costs (1,151) (956)
Total borrowings 344,159 256,384
Shown as:Current – – Term 344,159 256,384
The Group has a syndicated revolving multi-currency facility with ANZ Bank New Zealand Limited, Australia and New Zealand Banking Group Limited and Bank of New Zealand. The A$425.0m and NZ$20.0m facility, a multi-currency facility, is split between Tranche A: A$125.0m and Tranche B: A$100.0m which are due to expire on 31 March 2019, and Tranche C: A$100.0m, Tranche D: A$100.0m and NZ Dollar Facility: NZ$20.0m which are due to expire on 30 October 2020 (2015: Tranche A: A$125.0m and Tranche B: A$100.0m which are due to expire on 31 March 2019, and Tranche C: A$100.0m and NZ Dollar Facility: NZ$20.0m which are due to expire on 31 March 2017).
The effective interest rate on the borrowings as at 30 June 2016 was 4.38% per annum (2015: 5.32%).
Borrowings are secured by a Security Trust Deed dated 1 April 2003 and as amended and restated on 26 June 2014. The Security Provider comprises T.E.A. Custodians Limited in its capacity as nominee of the VHP Trustee as trustee of the Trust and the Trust’s subsidiaries. Pursuant to the Deed, a security interest has been granted of first ranking mortgages over the respective investment properties by a General Security Deed over the assets and undertakings of Vital Healthcare Property Limited and fixed and floating charges over the assets and undertakings of Vital Healthcare Australian Property Pty Limited in its capacity as trustee for Vital Healthcare Australian Property Trust and Vital Healthcare Investment Trust.
The carrying values of these balances are approximately equivalent to their fair values because the loans have floating rates of interest that reset every 90 days.
15 TRADE AND OTHER PAYABLES
2016 $000s
2015 $000s
Interest accrued on borrowings 1,532 1,387 Other creditors and accruals 8,097 6,645
Total trade and other payables 9,629 8,032
FIN-21

16 FINANCIAL RISK MANAGEMENT
Financial risk management
The Group’s activities expose it primarily to credit risk, market risk (interest rate risk and foreign exchange risk) and liquidity risk. The Group’s overall risk management programme focuses on the unpredictability of financial markets and seeks to minimise potential adverse effects on the Group’s financial performance. The Group uses financial derivatives to manage market risks. The use of financial derivatives is governed by the Group’s policies approved by the board of directors, which provide written principles that are consistent with the Group’s risk management strategy. The Group does not use derivative financial instruments for speculative purposes.
Credit risk
In the normal course of business the Group incurs credit risk from trade receivables and transactions with financial institutions. The risk associated with trade receivables is managed with a credit policy which includes performing credit evaluations on customers requiring credit. Generally collateral is not required. The risk from financial institutions is managed by only entering into derivative transactions and placing cash and deposits with high credit quality financial institutions. The Group places its cash deposits with ANZ Bank New Zealand Limited and Australia and New Zealand Banking Group Limited.
The carrying amount of financial assets best represents the maximum exposure to credit risk at year end.
Interest rate risk
Interest rate risk arises from the variability in cash flows arising from floating rate bank loans. The Group’s policy is to convert a portion of its floating rate debt to fixed rates using interest rate swaps to maintain 70% to 100% of its borrowings in fixed rate instruments. At 30 June 2016, 62.2% of borrowings were at fixed rates as approved by the Board of Directors (2015: 83.5%). The Group does not apply hedge accounting to interest rate swaps. Any gains or losses arising on revaluation are recognised immediately in the statement of comprehensive income.
Interest rate repricing analysis
The following table indicates the effective interest rates and the earliest period in which financial instruments reprice. Fixed rate balances are presented with the effect of hedging derivatives:
Weighted effective
interest rate%
Less than 1 year$000s
1–2 years$000s
2–3 years$000s
3+ years$000s
Total$000s
30 June 2016Cash and cash equivalents (floating rates) 1.75% 12,980 – – – 12,980 Borrowings (floating rates) 2.55% (130,695) – – – (130,695)Borrowings (fixed rates) 4.27% – (15,704) (10,469) (188,442) (214,615)
(117,715) (15,704) (10,469) (188,442) (332,330)
30 June 2015Cash and cash equivalents (floating rates) 2.20% 1,022 – – – 1,022 Borrowings (floating rates) 2.76% (42,412) – – – (42,412)Borrowings (fixed rates) 4.81% (24,321) – (22,624) (167,983) (214,928)
(65,711) – (22,624) (167,983) (256,318)
FIN-22 FINANCIAL STATEMENTS
VITAL HEALTHCARE PROPERTY TRUST ANNUAL REPORT 2016
Notes to the Consolidated Financial Statements

16 FINANCIAL RISK MANAGEMENT (continued)
Interest rate sensitivity
The Group’s sensitivity to interest rate risk can be expressed in two ways:
Fair value sensitivity
A change in interest rates impacts the fair value of the Group’s fixed rate assets and liabilities, and its interest rate swaps. Fair value changes impact profit or loss or equity only where the instruments are carried at fair value. Accordingly, the fair value sensitivity to a 100 bps movement in interest rates (based on the assets and liabilities held at year end) is:
Impact on profit/(loss)
Impact on unitholders’
fundsImpact on
profit/(loss)
Impact on unitholders’
funds
2016$000s
2016$000s
2015$000s
2015$000s
If interest rates had been 100 bps higher: 9,397 9,397 8,965 8,965 If interest rates had been 100 bps lower: (10,215) (10,215) (9,548) (9,548)
Cash flow sensitivity analysis
A change in interest rates would also impact on interest payments and receipts on the Group’s floating rate assets and liabilities. Accordingly, the one-year cash flow sensitivity to a 100 bps movement in interest rates (based on assets and liabilities held at year end) is:
If interest rates had been 100 bps higher: (1,412) (1,412) (424) (424)If interest rates had been 100 bps lower: 1,412 1,412 424 424
Foreign exchange risk
Foreign exchange risk arises due to the exposure of Australian denominated assets and liabilities to movements in foreign exchange rates. The Group minimises foreign exchange risk by matching as far as possible, its foreign denominated assets and associated borrowings in the same currency and entering into foreign exchange derivatives where necessary.
Foreign exchange exposure
The exposure to Australian dollars arising from foreign currency denominated assets and liabilities is:
2016 $000s
2015 $000s
Non-financial instrument assets and liabilities denominated in Australian dollarsInvestment properties 777,109 618,174 Other assets 4,690 3,185 Deferred tax (56,981) (43,468)
Total non-financial instrument assets and liabilities 724,818 577,891
Non-derivative financial instrumentsCash and cash equivalents 1,845 98 Trade and other receivables 234 734 Trade and other payables (12,572) (10,023)Borrowings (345,310) (257,340)
Total exposure from non-derivative financial instruments (355,803) (266,531)
Derivative financial instrumentsForeign exchange derivatives 9,445 (4,867)Interest rate swaps (19,764) (14,274)
Total exposure from derivative instruments (10,319) (19,141)
Net exposure to currency risk 358,696 292,219
FIN-23

Foreign currency sensitivity
The following table illustrates the sensitivity of the profit after tax for the year and equity in regard to the exchange rates for the Australian Dollar. It assumes a 10% change in exchange rate (2015: 10%) based on year end exposures:
2016 $000s
2015 $000s
If the New Zealand Dollar versus the Australian Dollar was 10% higher for the year:Profit and loss (1,794) 2,708 Other comprehensive income (30,411) (3,631)
Unitholders’ funds (32,205) (923)
If the New Zealand Dollar versus the Australian Dollar was 10% lower for the year:Profit and loss 2,192 (3,309)Other comprehensive income 37,169 4,438
Unitholders’ funds 39,361 1,129
Liquidity risk
Liquidity risk represents the Group’s ability to meet its contractual obligations as they fall due. The Group’s policy is to maintain unutilised credit facilities to meet contractual obligations when they fall due. The Group monitors its liquidity requirements on an ongoing basis.
The Group has a multi-currency facility with ANZ Bank New Zealand Limited, Australia and New Zealand Banking Group Limited and Bank of New Zealand of A$425.0m and NZ$20.0m (2015: A$325.0m and NZ$20.0m). As at 30 June 2016, after translation to NZD $345.3m (2015: NZD $257.3m) had been drawn-down. The effective interest rate was 4.38% (2015: 5.32%).
Liquidity risk exposure
The following table details the Group’s exposure to liquidity risk based on the contractual undiscounted cash flows relating to financial liabilities and foreign exchange contracts:
Carrying value
$000s
Contractual cash flows
$000s
Less than 1 year$000s
1–2 years$000s
2–3 years$000s
3+ years$000s
30 June 2016Non-derivative financial instrumentsBorrowings (excluding borrowing costs) (345,310) (364,874) (6,363) (5,844) (240,287) (112,380)Trade and other payables (9,629) (9,629) (9,629) – – –
(354,939) (374,503) (15,992) (5,844) (240,287) (112,380)
Derivative financial instrumentsInterest rate swaps (19,764) (21,368) (4,069) (4,307) (4,026) (8,966)
(19,764) (21,368) (4,069) (4,307) (4,026) (8,966)
30 June 2015Non-derivative financial instrumentsBorrowings (excluding borrowing costs) (257,340) (277,205) (5,493) (119,223) (3,772) (148,717)Trade and other payables (8,032) (8,032) (8,032) – – –
(265,372) (285,237) (13,525) (119,223) (3,772) (148,717)
Derivative financial instrumentsInterest rate swaps (14,274) (15,131) (4,651) (3,536) (2,832) (4,112)Foreign exchange derivatives (4,867) (4,867) (4,867) – – –
(19,141) (19,998) (9,518) (3,536) (2,832) (4,112)
16 FINANCIAL RISK MANAGEMENT (continued)
FIN-24 FINANCIAL STATEMENTS
VITAL HEALTHCARE PROPERTY TRUST ANNUAL REPORT 2016
Notes to the Consolidated Financial Statements
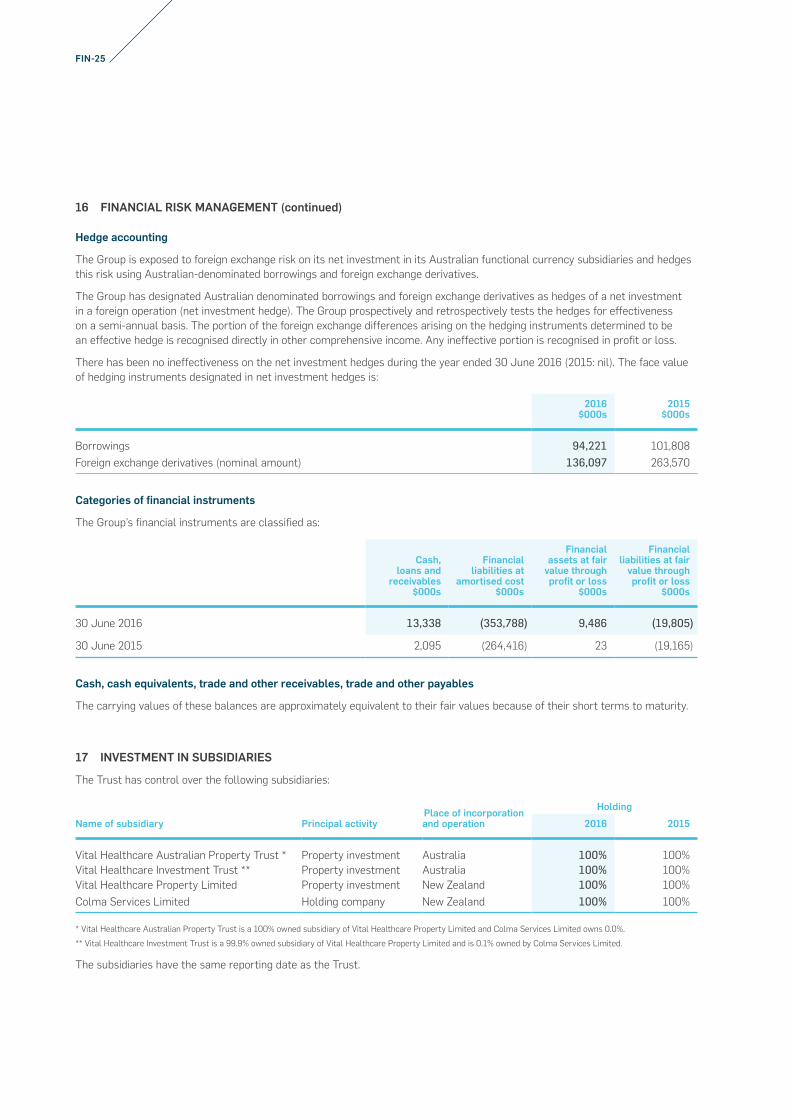
16 FINANCIAL RISK MANAGEMENT (continued)
Hedge accounting
The Group is exposed to foreign exchange risk on its net investment in its Australian functional currency subsidiaries and hedges this risk using Australian-denominated borrowings and foreign exchange derivatives.
The Group has designated Australian denominated borrowings and foreign exchange derivatives as hedges of a net investment in a foreign operation (net investment hedge). The Group prospectively and retrospectively tests the hedges for effectiveness on a semi-annual basis. The portion of the foreign exchange differences arising on the hedging instruments determined to be an effective hedge is recognised directly in other comprehensive income. Any ineffective portion is recognised in profit or loss.
There has been no ineffectiveness on the net investment hedges during the year ended 30 June 2016 (2015: nil). The face value of hedging instruments designated in net investment hedges is:
2016 $000s
2015 $000s
Borrowings 94,221 101,808 Foreign exchange derivatives (nominal amount) 136,097 263,570
Categories of financial instruments
The Group’s financial instruments are classified as:
Cash, loans and
receivables$000s
Financial liabilities at
amortised cost$000s
Financial assets at fair
value through profit or loss
$000s
Financial liabilities at fair
value through profit or loss
$000s
30 June 2016 13,338 (353,788) 9,486 (19,805)
30 June 2015 2,095 (264,416) 23 (19,165)
Cash, cash equivalents, trade and other receivables, trade and other payables
The carrying values of these balances are approximately equivalent to their fair values because of their short terms to maturity.
17 INVESTMENT IN SUBSIDIARIES
The Trust has control over the following subsidiaries:
Name of subsidiary Principal activityPlace of incorporationand operation
Holding
2016 2015
Vital Healthcare Australian Property Trust * Property investment Australia 100% 100%Vital Healthcare Investment Trust ** Property investment Australia 100% 100%Vital Healthcare Property Limited Property investment New Zealand 100% 100%Colma Services Limited Holding company New Zealand 100% 100%
* Vital Healthcare Australian Property Trust is a 100% owned subsidiary of Vital Healthcare Property Limited and Colma Services Limited owns 0.0%.
** Vital Healthcare Investment Trust is a 99.9% owned subsidiary of Vital Healthcare Property Limited and is 0.1% owned by Colma Services Limited.
The subsidiaries have the same reporting date as the Trust.
FIN-25

18 COMMITMENTS
2016 $000s
2015 $000s
Capital commitments
The Group was party to contracts to purchase or construct property for the following amounts: 45,221 44,051
The property rental income to be earned by the Group from its investment property, all of which is leased out under operating leases, is set out in the table below:
Not later than one year 81,256 64,867 Later than one year and not later than five years 242,059 238,938 Later than five years 902,882 790,236
1,226,197 1,094,041
As a condition of listing on the New Zealand Stock Exchange (NZSX), NZSX requires all issuers to provide a bank bond to NZSX under NZSX/DX Listing Rule 2.6.2. The bank bond required by the Trust for listing on the NZSX is $50,000.
19 CONTINGENCIES
There were no contingencies as at 30 June 2016 (2015: nil).
20 SUBSEQUENT EVENTS
On 28 June an Offer Document was issued for a 2 for 9 renounceable rights offer of units in the Trust, seeking to raise $160 million. The rights offer was underwritten and made to Eligible Unitholders based on the Record Date of 29 June 2016. The offer closed on 19 July 2016 at 5.00pm and allotment of New Units under the rights offer took place on 25 July 2016 when 76,890,712 units were issued at $2.08.
On 1 July 2016 Vital acquired the Boulcott Hospital in Lower Hutt, Wellington for $30,660,000 and an adjacent residential property for $1,000,000 for future development.
On 11 August 2016 a final cash distribution of 2.125 cents per unit was announced by the Trust. The Record Date for the final distribution is 9 September 2016 and a payment is scheduled to unitholders on 23 September 2016. There will be 0.2831 cents per unit of imputation credits attached to the distribution.
FIN-26 FINANCIAL STATEMENTS
VITAL HEALTHCARE PROPERTY TRUST ANNUAL REPORT 2016
Notes to the Consolidated Financial Statements
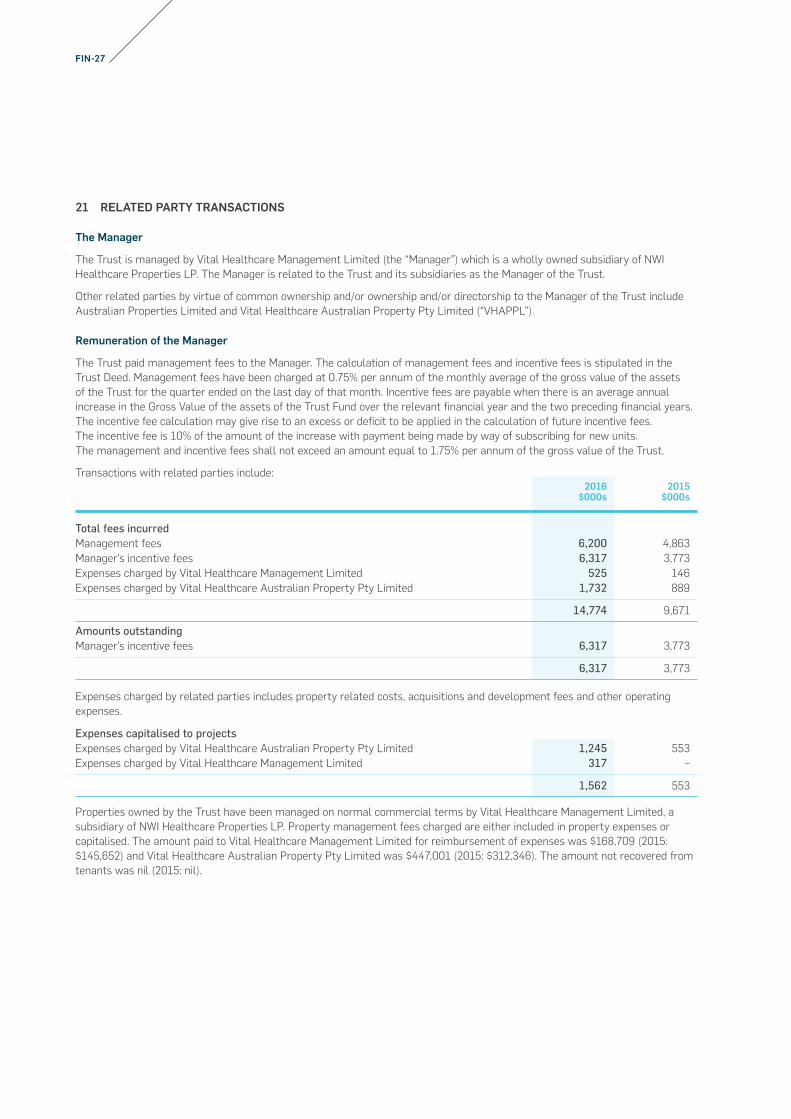
21 RELATED PARTY TRANSACTIONS
The Manager
The Trust is managed by Vital Healthcare Management Limited (the “Manager”) which is a wholly owned subsidiary of NWI Healthcare Properties LP. The Manager is related to the Trust and its subsidiaries as the Manager of the Trust.
Other related parties by virtue of common ownership and/or ownership and/or directorship to the Manager of the Trust include Australian Properties Limited and Vital Healthcare Australian Property Pty Limited (“VHAPPL”).
Remuneration of the Manager
The Trust paid management fees to the Manager. The calculation of management fees and incentive fees is stipulated in the Trust Deed. Management fees have been charged at 0.75% per annum of the monthly average of the gross value of the assets of the Trust for the quarter ended on the last day of that month. Incentive fees are payable when there is an average annual increase in the Gross Value of the assets of the Trust Fund over the relevant financial year and the two preceding financial years. The incentive fee calculation may give rise to an excess or deficit to be applied in the calculation of future incentive fees. The incentive fee is 10% of the amount of the increase with payment being made by way of subscribing for new units. The management and incentive fees shall not exceed an amount equal to 1.75% per annum of the gross value of the Trust.
Transactions with related parties include:2016
$000s2015
$000s
Total fees incurredManagement fees 6,200 4,863 Manager’s incentive fees 6,317 3,773 Expenses charged by Vital Healthcare Management Limited 525 146 Expenses charged by Vital Healthcare Australian Property Pty Limited 1,732 889
14,774 9,671
Amounts outstanding Manager’s incentive fees 6,317 3,773
6,317 3,773
Expenses charged by related parties includes property related costs, acquisitions and development fees and other operating expenses.
Expenses capitalised to projectsExpenses charged by Vital Healthcare Australian Property Pty Limited 1,245 553 Expenses charged by Vital Healthcare Management Limited 317 –
1,562 553
Properties owned by the Trust have been managed on normal commercial terms by Vital Healthcare Management Limited, a subsidiary of NWI Healthcare Properties LP. Property management fees charged are either included in property expenses or capitalised. The amount paid to Vital Healthcare Management Limited for reimbursement of expenses was $168,709 (2015: $145,652) and Vital Healthcare Australian Property Pty Limited was $447,001 (2015: $312,346). The amount not recovered from tenants was nil (2015: nil).
FIN-27

VITAL HEALTHCARE PROPERTY TRUST ANNUAL REPORT 2016
54 INDEPENDENT AUDITOR’S REPORT
TO THE UNIT HOLDERS OF VITAL HEALTHCARE PROPERTY TRUST
Report on the Consolidated Financial Statements
We have audited the accompanying consolidated financial statements of Vital Healthcare Property Trust and its controlled entities (together referred to as the ’Trust’) on pages FIN-1 to FIN-27, which comprise the consolidated statement of financial position as at 30 June 2016, and the consolidated statement of comprehensive income, statement of changes in equity and statement of cash flows for the year then ended, and a summary of significant accounting policies and other explanatory information.
This report is made solely to the Trust’s unit holders, as a body. Our audit has been undertaken so that we might state to the Trust’s unit holders those matters we are required to state to them in an auditor’s report and for no other purpose. To the fullest extent permitted by law, we do not accept or assume responsibility to anyone other than the Trust’s unit holders as a body, for our audit work, for this report, or for the opinions we have formed.
Manager’s Responsibility for the Consolidated Financial Statements
The Board of Directors of Vital Healthcare Management Limited (the ‘Manager’) is responsible on behalf of the Manager for the preparation and fair presentation of these consolidated financial statements, in accordance with New Zealand Equivalents to International Financial Reporting Standards and International Financial Reporting Standards, and for such internal control as the Board of Directors of the Manager determines is necessary to enable the preparation of consolidated financial statements that are free from material misstatement, whether due to fraud or error.
Auditor’s Responsibilities
Our responsibility is to express an opinion on these consolidated financial statements based on our audit. We conducted our audit in accordance with International Standards on Auditing and International Standards on Auditing (New Zealand). Those standards require that we comply with ethical requirements and plan and perform the audit to obtain reasonable assurance about whether the consolidated financial statements are free from material misstatement.
An audit involves performing procedures to obtain audit evidence about the amounts and disclosures in the consolidated financial statements. The procedures selected depend on the auditor’s judgement, including the assessment of the risks of material misstatement of the consolidated financial statements, whether due to fraud or error. In making those risk assessments, the auditor considers internal control relevant to the entity’s preparation and fair presentation of the consolidated financial statements in order to design audit procedures that are appropriate in the circumstances, but not for the purpose of expressing an opinion on the effectiveness of the entity’s internal control. An audit also includes evaluating the appropriateness of the accounting policies used and the reasonableness of accounting estimates, as well as the overall presentation of the consolidated financial statements.
We believe that the audit evidence we have obtained is sufficient and appropriate to provide a basis for our audit opinion.
Other than in our capacity as auditor, we have no relationship with or interests in Vital Healthcare Property Trust or the Manager.
Opinion
In our opinion, the consolidated financial statements on pages FIN-1 to FIN-27 present fairly, in all material respects, the financial position of Vital Healthcare Property Trust and its controlled entities as at 30 June 2016, and their financial performance and cash flows for the year then ended in accordance with New Zealand Equivalents to International Financial Reporting Standards and International Financial Reporting Standards.
Chartered Accountants 11 August 2016 Auckland, New Zealand
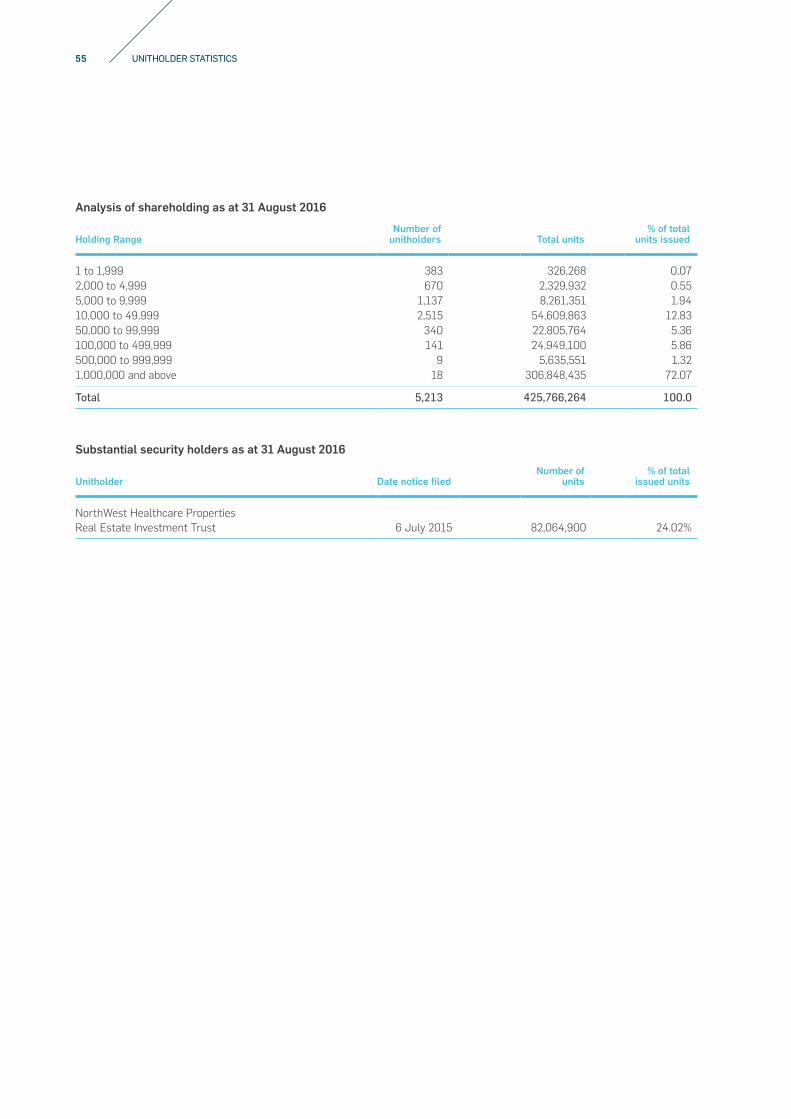
Analysis of shareholding as at 31 August 2016
Holding RangeNumber of
unitholders Total units% of total
units issued
1 to 1,999 383 326,268 0.07 2,000 to 4,999 670 2,329,932 0.555,000 to 9,999 1,137 8,261,351 1.9410,000 to 49,999 2,515 54,609,863 12.8350,000 to 99,999 340 22,805,764 5.36100,000 to 499,999 141 24,949,100 5.86500,000 to 999,999 9 5,635,551 1.321,000,000 and above 18 306,848,435 72.07
Total 5,213 425,766,264 100.0
Substantial security holders as at 31 August 2016
Unitholder Date notice filedNumber of
units% of total
issued units
NorthWest Healthcare Properties Real Estate Investment Trust 6 July 2015 82,064,900 24.02%
55 UNITHOLDER STATISTICS

Twenty largest security holders as at 31 August 2016
Unitholder Total% total issued
units
Baincor Nominees Pty Ltd 99,806,501 23.44New Zealand Central Securities Depository Limited 77,096,673 18.10Forsyth Barr Custodians Limited 27,744,449 6.51Custodial Services Limited 22,046,834 5.17FNZ Custodians Limited 20,610,738 4.84Investment Custodial Services Limited 16,092,190 3.77Custodial Services Limited 10,402,938 2.44Custodial Services Limited 6,625,770 1.55Custodial Services Limited 5,962,901 1.40FNZ Custodians Limited 3,785,316 0.88Custodial Services Limited 3,754,819 0.88Deutsche Securities New Zealand Limited 3,292,950 0.77NZPT Custodians (Grosvenor) Limited 2,498,393 0.58Custodial Services Limited 1,917,239 0.45New Zealand Depository Nominee Limited 1,579,219 0.37James Harvey Mansell & Christine Anne Mansell & Douglas Tony Brown 1,527,778 0.35FNZ Custodians Limited 1,080,695 0.25Forsyth Barr Custodians Limited 1,023,032 0.24Jarden Custodians Limited 910,000 0.21Christopher Cornelius Fitzgerald 740,000 0.17
Totals 308,498,435 72.37
Total units on issue 425,766,264
Breakdown of security holders within the New Zealand Central Securities Depository Limited
Unitholder Number of units
Accident Compensation Corporation 15,753,298 BNP Paribas Nominees (NZ) Ltd 10,494,304 Citibank Nominees (NZ) Ltd 9,954,710 HSBC nominees (NZ) Ltd 9,805,674 JPMorgan Chase Bank NA NZ Branch 7,481,550 Guardian Nominees No 2 A/C 4,769,999 BNP Paribas Nominees (NZ) Ltd 2,629,010 National Nominees (NZ) Ltd 2,591,732 Tea Custodians Ltd 2,373,211 HSBC Noms (NZ) Ltd State Street 2,278,206 ANZ Wholesale Property Securities 2,203,413 Mint Nominees Ltd 1,880,583 MFL Mutual Fund Ltd 1,648,694 BNP Paribas Nominees (NZ) Ltd 1,336,442 Public Trust Class 30 Nominees Ltd 576,118 ANZ Wholesale Trans-Tasman Property 458,419 Sovereign Services Ltd 361,475 Public Trust Class 10 Nominees Ltd 282,276 ANZ Custodial Services NZ Ltd 201,257 Public Trust RIF Nominees Ltd 16,302
Total 77,096,673
VITAL HEALTHCARE PROPERTY TRUST ANNUAL REPORT 2016
56 UNITHOLDER STATISTICS
57 DIRECTORY
Manager
Vital Healthcare Management LimitedLevel 16, AIG Building41 Shortland StreetAuckland 1010PO Box 6945, Wellesley StreetAuckland 1141Telephone: 0800 225 264Facsimile: +64 9 377 2776
Directors of the Manager
Graeme Horsley – ChairmanAndrew EvansClaire HigginsPaul Dalla LanaBernard Crotty
Auditor
Deloitte Deloitte Centre80 Queen StreetAuckland 1010Private Bag 115-033Auckland 1140Telephone: +64 9 303 0700Facsimile: +64 9 303 0701
Legal advisers to the Trust and the Manager
Harmos Horton LuskVero Centre48 Shortland StreetPO Box 28Auckland 1140Telephone: +64 9 921 4300Facsimile: +64 9 921 4319
Bell GullyVero Centre48 Shortland StreetPO Box 4199Auckland 1140Telephone: +64 9 916 8800Facsimile: +64 9 916 8801
Ashurst AustraliaLevel 26181 William StreetGPO Box 4958Melbourne, Victoria 3001AustraliaTelephone: +61 3 9679 3000Facsimile: +61 3 9679 3111
Trustee
Trustees Executors LimitedLevel 12, 45 Queen StreetAuckland 1010PO Box 4197Auckland 1140Telephone: +64 9 308 7100Facsimile: +64 9 308 7101
Bankers to the Trust
ANZ Bank New Zealand LimitedANZ Centre23–29 Albert StreetAuckland 1010
Australia and New Zealand Banking Group Limited27/100 Queen StreetMelbourne, Victoria 3000Australia
Bank of New ZealandDeloitte Centre80 Queen StreetAuckland 1010
Unit Registrar
Computershare Investor Services Limited159 Hurstmere RoadTakapuna, Auckland 0622Private Bag 92119Auckland 1142New Zealand
[email protected]: +64 9 488 8777Facsimile: +64 9 488 8787
insightcreative.co.nz
VI
T128

VITALHEALTHCAREPROPERTY.CO.NZ