Embed Size (px)
Citation preview
Building a Culture of High Expectations:Creating a culture of success that provides each student with support, mentoring and
encouragement to get below-grade-level students to meet or exceed grade-level standards and expectations
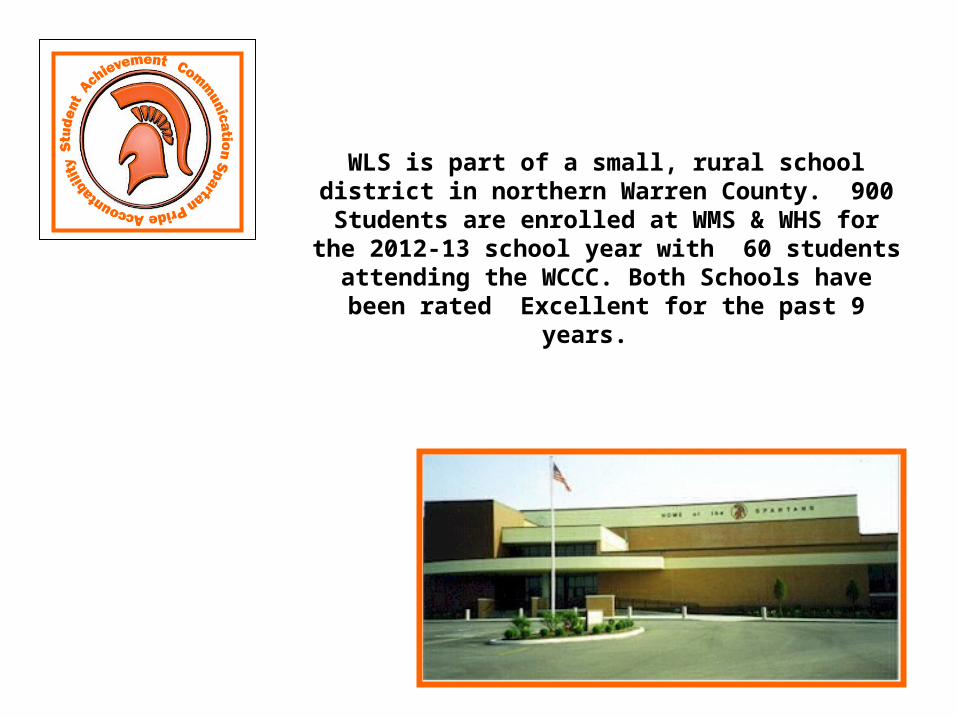
WLS is part of a small, rural school district in northern Warren County. 900 Students are enrolled at WMS & WHS for the 2012-13 school year with 60 students attending the WCCC. Both Schools have
been rated Excellent for the past 9 years.

The definition of INSANITY is doing the same thing over and overagain and hoping for different results.
Essential Questions:
Who is the customer?
What will you do this year to ensure ALL students experience success?????
How will you measure success?
Are you focused on Proficiency or Growth?
What will you do if students are not successful?
How do you determine success in your classroom/grade level/school????
Who is responsible for professional development?

Who is the customer?
Building a Culture of High Expectations

“What does a Waynesville High School Graduate
look like???”

Average credits earned = 24.7
35.2% have taken an AP course – 81% will score a
3 or higher on the AP Test
ACT Ave. scoreAll Students - 21.8 (78% of the class took the act)
Four Year College – 22.5Two Year – 18.3
51% will attend a four year college/university (5% out of state)24% will attend a two year college/university3% will attend a technical school
3% will go into the military
19% will go into the workforce
98% will have graduated in 4 years (78% state ave.)
Each will earn $11,185.00 in scholarships
26% will have earned College Credit through: AP, PSEO or Dual Credit
90% passed the OGT on the First Attempt
Senior Year58% participate in Athletics97% participate in Fine Arts
11.6% will earn a Honors Diploma
Top 4 Majors1. Bio/medical2. Nursing3. Education4. Engineering
Average GPA - 3.173
WHS Graduation Rate Ranked 24th in Ohio – Top 4 %
WHS- Grades 9-12 A's B's C's D's F's Total with a A or B Failure % with a D or F2012-13 1482 1067 534 175 58 3316 76.87% 1.75% 7.03%
WHS High Expectations SUCCESS
Performance Index Score – WHS is Ranked #173 out of 3,457 schools in Ohio - Top 5% in OHIO Ranked #4 in the Dayton Region for SAT Scores
Class of 2013

The WHS curriculum has three levels:
College-Preparatory Honors
Advanced Placement (AP)
All low-level courses have been eliminated from the curriculum.Increased expectations placed on the Middle School
All students complete, at the minimum, college-preparatory classes as freshmen and sophomores.
Currently we offer Advanced Algebra, Geometry & Spanish at the middle school level for HS Credit
Beginning in the junior year, students may go to the Warren County Career Center
21% Senior Class - WCCC Students22% Junior Class - WCCC Students
Evaluating Current Programs

Honors Courses Offered in 2001-02 Honors Courses Offered in 2012-13Honors English 9 Honors English 9Honors English 10 Honors English 10Honors English 11 Honors English 11AP Eng 12 AP Eng 12
AP Calculus Honors GeometryHonors Algebra II
Honors Biology I Honors Pre-CalculusHonors Biology II Honors Calculus
AP Calculus AB and BCAP American History
Honors Biology IHonors Biology IIHonors ChemistryAP ChemistryAP BiologyHonors History 9AP US HistoryAP European History
AP Art
Dual Credit Courses Offered in 2001-02 Dual Credit Courses Offered in 2011-12None English Composition
Pre- CalculusCalculus
WHS 12 Years Later ……..
What will you do this year to ensure ALL students experience success?????
Building a Culture of High Expectations

The Teacher starts with the end in mind – You have the power to do whatever it takes to ensure success!
State Standards/ACT/Grade 13Scout Opponents
Look at data from past performancesCollaborate with prior teacher or MSLook at teachers/schools who are successful
Set Learning Objectives
Look at current talent and put those students in thebest possible situations for success
Develop Lesson Plans
Break Standards/Indicators down into: IndividualGroupClassTeach Students how to handle adversityHigh-Stakes Situations
DIFFERENTIATE Make Adjustments
Formative Assessment
Look at current talent and put those students in thebest possible situations for success
DIFFERENTIATE Make Adjustments
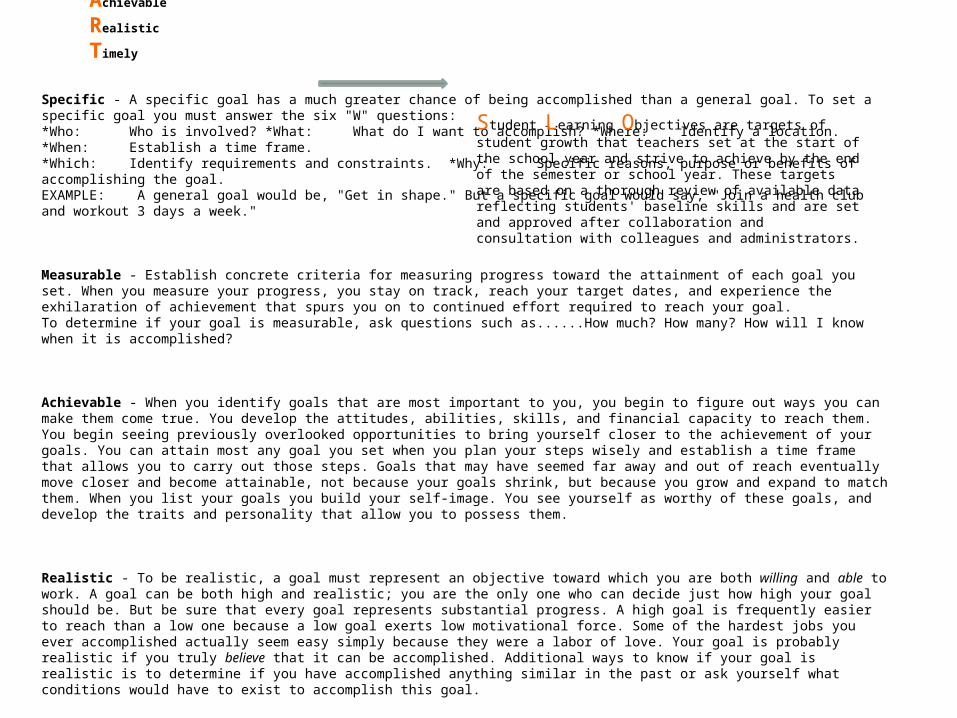
S.M.A.R.T. Goals SLOs – Student Learning ObjectivesSpecific
Measurable
Achievable
Realistic
Timely
Specific - A specific goal has a much greater chance of being accomplished than a general goal. To set a specific goal you must answer the six "W" questions: *Who: Who is involved? *What: What do I want to accomplish? *Where: Identify a location. *When: Establish a time frame. *Which: Identify requirements and constraints. *Why: Specific reasons, purpose or benefits of accomplishing the goal. EXAMPLE: A general goal would be, "Get in shape." But a specific goal would say, "Join a health club and workout 3 days a week." Measurable - Establish concrete criteria for measuring progress toward the attainment of each goal you set. When you measure your progress, you stay on track, reach your target dates, and experience the exhilaration of achievement that spurs you on to continued effort required to reach your goal. To determine if your goal is measurable, ask questions such as......How much? How many? How will I know when it is accomplished? Achievable - When you identify goals that are most important to you, you begin to figure out ways you can make them come true. You develop the attitudes, abilities, skills, and financial capacity to reach them. You begin seeing previously overlooked opportunities to bring yourself closer to the achievement of your goals. You can attain most any goal you set when you plan your steps wisely and establish a time frame that allows you to carry out those steps. Goals that may have seemed far away and out of reach eventually move closer and become attainable, not because your goals shrink, but because you grow and expand to match them. When you list your goals you build your self-image. You see yourself as worthy of these goals, and develop the traits and personality that allow you to possess them. Realistic - To be realistic, a goal must represent an objective toward which you are both willing and able to work. A goal can be both high and realistic; you are the only one who can decide just how high your goal should be. But be sure that every goal represents substantial progress. A high goal is frequently easier to reach than a low one because a low goal exerts low motivational force. Some of the hardest jobs you ever accomplished actually seem easy simply because they were a labor of love. Your goal is probably realistic if you truly believe that it can be accomplished. Additional ways to know if your goal is realistic is to determine if you have accomplished anything similar in the past or ask yourself what conditions would have to exist to accomplish this goal. Timely - A goal should be grounded within a time frame. With no time frame tied to it there's no sense of urgency. If you want to lose 10 lbs, when do you want to lose it by? "Someday" won't work. But if you anchor it within a timeframe, "by May 1st", then you've set your unconscious mind into motion to begin working on the goal. T can also stand for Tangible - A goal is tangible when you can experience it with one of the senses, that is, taste, touch, smell, sight or hearing. When your goal is tangible you have a better chance of making it specific and measurable and thus attainable.
Student Learning Objectives are targets of student growth that teachers set at the start of the school year and strive to achieve by the end of the semester or school year. These targets are based on a thorough review of available data reflecting students' baseline skills and are set and approved after collaboration and consultation with colleagues and administrators.

Teacher Goals
Student Goals
#1 – Improve Reading Performance #2 - Improve Math Performance
District Goals and Measures
Specific -stated, Measurable –meaningful, Achievable-aligned, Realistic –relevant, Time based GOALS
Superintendent’s BOE Goals
Principal’s Goal
Developed through the Ohio Improvement Process
#3 Climate/PD
Revised Standards
Roll-out
Safe Harbor – 84%
Quality Core Results
D3A2
Provide Lexile Information
“The Plan” for all grade 9
RediStep for all 10th grade students
ACT Practice test for 11th/12th
Collins Writing
Research based best practices in ELA standards
ACT - 22
Analyze Data
Revised Standards
Roll-out
Math facts across the curriculum
Safe Harbor – 51%
Quality Core Results
The Plan” for all grade 9
RediStep for all 10th grade students
ACT Practice test for 11th/12th
Collins Writing
Explore best practices in the
area of Mathematics
ACT – 22
Analyze Data
RevisedStandardsRoll-out
Monthly staffDevelopment
topics thatfocus on goalsand measures,
rigor/relevance,student
engagement,formative
assessmentsand
Collins Writing.
Integration ofTechnology
Quarterly6-12 Department
Meetings
PeerObservations
Quarterly
SMART Goals
IPAD WalkThrough
Analyze Data
Building Level
Instructionfocused on
rigor/relevanceand student
engagement inevery classroom.
Developstrategies that
reach allstudents withlesson plansfocused on
DifferentiatedInstruction.
SMART Goals
ACT/OGTAlignment
ET/EH80-100% ofall studentsinvolved in
ActiveIntervention and
Enrichment
All studentsActively engaged
in Reading
Spartan Pride

Teacher Goals
Teacher Template for Developing Goals for Individual Meetings
Specific -stated, Measurable –meaningful, Achievable-aligned, Realistic –relevant, Time based GOALS
Principal’s Goals
Developed supporting the Ohio Improvement Process/District Goals
Individual #1 – Improve Reading Performance #2 - Improve Math Performance #3 Climate/PD

How will you measure success?
Building a Culture of High Expectations

Grade Distribution 2010-11 Final Grades % of Students % of Students
ENGLISH A's B's C's D's F's Total with a A or B Failure % with a D or F
31 60 18 10 2 121 75.21% 1.65% 9.92%
72 33 12 6 0 123 85.37% 0.00% 4.88%
11 28 30 9 0 78 50.00% 0.00% 11.54%
24 61 23 8 0 116 73.28% 0.00% 6.90%
10/11 Department Tot. 138 182 83 33 2 438 70.96% 0.41% 8.31%
09/10 Department Tot. 149 155 83 47 4 439 66.38% 1.03% 13.37%
08/09 Department Tot. 160 162 87 35 1 445 69.90% 0.26% 9.21%
07/08 Department Tot. 114 157 99 51 8 429 62.20% 1.70% 14.12%
06/07 Department Tot. 151 149 95 31 10 436 68.45% 2.23% 9.36%
05/06 Department Tot. 145 150 69 37 11 412 71.92% 2.62% 11.27%
04/05 Department Tot. 123 164 102 28 10 427 67.87% 2.11% 8.50%
03/04 Department Tot. 119 151 113 49 12 444 61.18% 2.78% 13.55%
MATH A's B's C's D's F's Total with a A or B Failure % with a D or F
39 41 21 11 2 114 70.18% 1.75% 11.40%
27 42 30 14 2 115 60.00% 1.74% 13.91%
30 41 19 9 10 109 65.14% 9.17% 17.43%
24 38 20 7 2 91 68.13% 2.20% 9.89%
10/11 Department Tot. 120 162 90 41 16 429 65.86% 3.72% 13.16%
09/10 Department Tot. 118 172 91 18 11 410 70.32% 3.08% 7.64%
08/09 Department Tot. 84 156 139 51 13 443 52.71% 3.22% 15.11%
07/08 Department Tot. 100 126 101 67 35 429 53.14% 7.98% 23.47%
06/07 Department Tot. 81 120 100 61 18 380 49.41% 5.34% 22.89%
05/06 Department Tot. 97 98 100 64 21 382 50.65% 6.04% 23.17%
04/05 Department Tot. 104 116 80 67 5 372 57.16% 1.38% 21.23%
03/04 Department Tot. 59 104 129 78 32 402 41.31% 7.89% 26.29%
SCIENCE A's B's C's D's F's Total with a A or B Failure % with a D or F
27 51 20 2 2 102 76.47% 1.96% 3.92%
10 48 32 7 2 99 58.59% 2.02% 9.09%
8 35 36 21 14 114 37.72% 12.28% 30.70%
29 49 32 4 0 114 68.42% 0.00% 3.51%
10/11 Department Tot. 74 183 120 34 18 429 60.30% 4.07% 11.81%
09/10 Department Tot. 87 175 122 62 22 468 56.01% 4.70% 17.90%
08/09 Department Tot. 80 131 140 54 30 435 49.09% 6.85% 19.11%
07/08 Department Tot. 85 119 120 86 24 434 67.86% 5.36% 16.07%
06/07 Department Tot. 79 85 83 57 27 331 32.16% 7.21% 21.83%
05/06 Department Tot. 68 120 104 56 9 357 40.50% 1.75% 12.92%
04/05 Department Tot. 61 132 114 49 17 373 48.73% 4.08% 17.08%
03/04 Department Tot. 59 109 114 50 22 354 43.18% 5.71% 23.57%

Waynesville High School
Ohio
Global
Five-Year School Score Summary (2012)

Waynesville High School Ranked 24th in the State of Ohio!!!!WHS is ranked 24th on the list of high schools released by the Ohio Department of Education. This places WHS in the top 3-4% of the high schools in OHIO (753). WHS is also ranked 54th on the list of ALL schools (K-12) and places WHS in the
top 1.5% of ALL schools in OHIO (3440).
Performance Index The Performance Index (PI) is a calculation that measures achievement/OGT test performance at the 3rd, 4th, 5th, 6th, 7th, 8th, and 10th (OGT) grade levels based upon the number of students at each performance level. The PI is calculated by assigning a weighted score to each performance level in the following manner: • Untested students - 0 points • Below Basic/Limited - 0.3 points • Basic - 0.6 points • Proficient - 1.0 points • Accelerated – 1.1 points • Advanced - 1.2 The percentage of students at each performance level is then multiplied by their respective weight, and the totals for each performance level are summed to get the building’s overall Performance Index score.
Building Name District NamePerformance Index Score
2010-11Solon High School Solon City 114.6Oakwood High School Oakwood City 114.1
Dublin Jerome High School Dublin City 114
Minster High School Minster Local 113.5Turpin High School Forest Hills Local 113.4Hudson High School Hudson City 112.7
Toledo Early College High School Toledo City 112.5
Rocky River High School Rocky River City 112.4
John Hay Early College High School Cleveland Municipal 112.2
Aurora High School Aurora City 112.2
Olentangy Liberty High School Olentangy Local 112
Indian Hill High School Indian Hill Exempted Village 112
Reynoldsburg High School eSTEM Reynoldsburg City 111.9
Madeira High School Madeira City 111.9
William Mason High School Mason City School District 111.9
New Albany High School New Albany-Plain Local 111.8Walnut Hills High School Cincinnati City 111.8Mariemont High School Mariemont City 111.7
Chagrin Falls High School Chagrin Falls Exempted Village 111.7
Wyoming High School Wyoming City 111.4
Springboro High School Springboro Community City 111.1
Upper Arlington High School Upper Arlington City 111
Ottawa Hills High School Ottawa Hills Local 111
Waynesville High School Wayne Local 110.8
Versailles High School Versailles Exempted Village 110.7
What will you do this year to ensure ALL students experience success and growth?
District Objective – Student Achievement
2004
-05
2005
-06
2006
-07
2007
-08
2008
-09
2009
-10
2010
-11
2011
-12
2012
-13
98
100
102
104
106
108
110
112
WHS Performance Index
WHS Performance Index
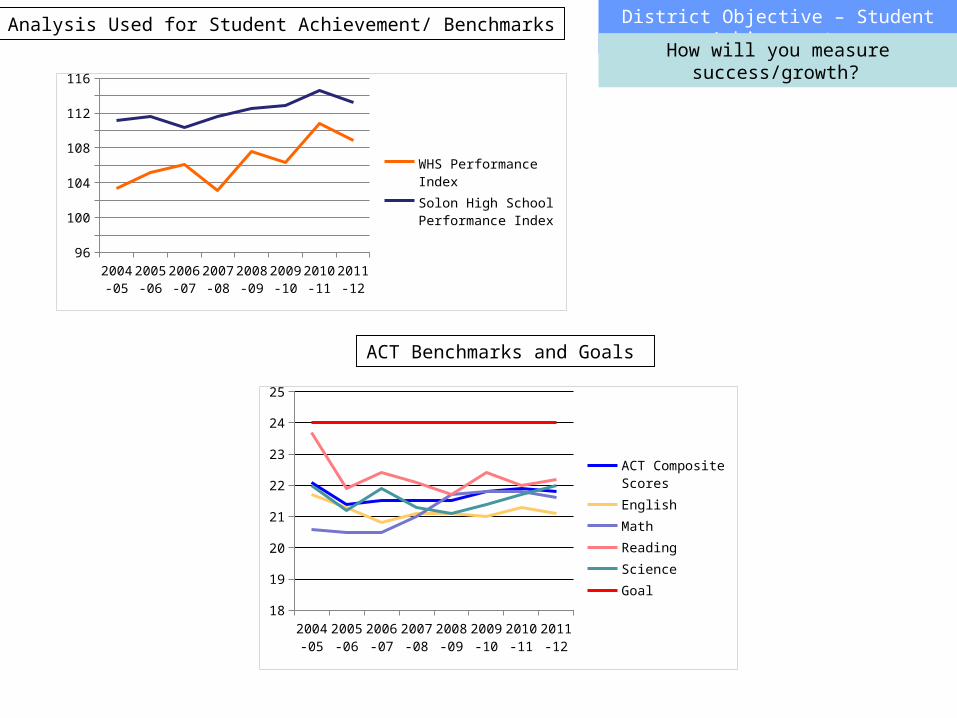
Gap Analysis Used for Student Achievement/ Benchmarks District Objective – Student Achievement
ACT Benchmarks and Goals
How will you measure success/growth?
2004-05
2005-06
2006-07
2007-08
2008-09
2009-10
2010-11
2011-12
9698
100102104106108110112114116
WHS Performance Index
Solon High School Per-formance Index
2004-05
2005-06
2006-07
2007-08
2008-09
2009-10
2010-11
2011-12
18
19
20
21
22
23
24
25
ACT Composite Scores
English
Math
Reading
Science
Goal

Wayne Local Schools College and Career Readiness Model
6th GradeCareer Day OAA (Reading and Math)
7th GradeKuder/OCIS OAA (Reading and Math)
Practice Explore (scored by ACT) October Assessment DayIowa Testing
8th GradeKuder/OCIS OAA (Reading, Science and Math)Real World Real Money MMGW Assessment (survey only)
Mock Interviews Explore (scored by ACT) October Assessment Day
9th GradeKuder/OCIS Plan (scored by ACT) October Assessment DayCareer Day PSAT (not mandatory – moved to Saturday for 2012)
10th GradeKuder/OCIS Plan (scored by ACT) October Assessment DayCareer Day OGT (Reading, Math, Science, Writing, Social Studies)
PSAT (not mandatory)11th GradeKuder/OCIS ACT Practice Test (retired version scored internally)- October Assessment DayCareer Day ACT TestCollege Day PSAT (not mandatory)
12th GradeCareer Passport ACT Practice Test (retired version scored internally)- October Assessment DayCollege Day ACT Test
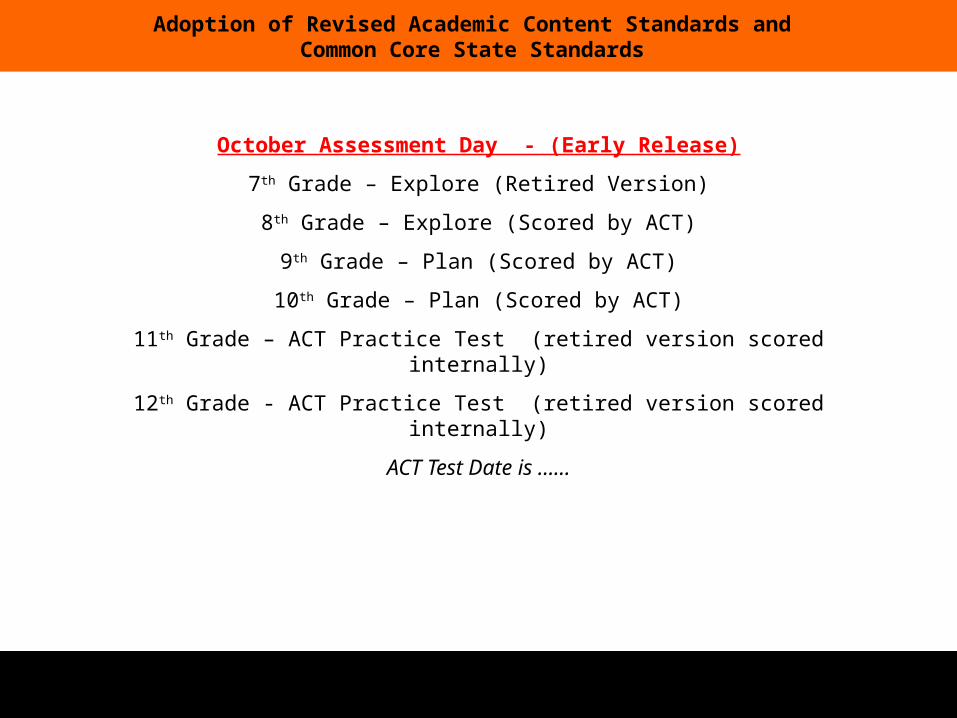
October Assessment Day - (Early Release)
7th Grade – Explore (Retired Version)
8th Grade – Explore (Scored by ACT)
9th Grade – Plan (Scored by ACT)
10th Grade – Plan (Scored by ACT)
11th Grade – ACT Practice Test (retired version scored internally)
12th Grade - ACT Practice Test (retired version scored internally)
ACT Test Date is ……
Adoption of Revised Academic Content Standards and Common Core State Standards

Gender Grade Comp (Iowa 2009) Composite (Plan 2011) Projected ACT Goal - Comp Score of 24 (20 and above)
M 9 98 25 26-30 On TargetM 9 21 22-26 On TargetF 9 92 20 21-25 On TargetM 9 20 21-25 On TargetM 9 21 22-26 On Target
Gender Grade Comp (Iowa 2009) Composite (Plan 2011) Projected ACT Goal - Comp Score of 24 (18 or 19)
F 9 76 18 19-23 Nearly on TargetF 9 76 18 19-23 Nearly on TargetM 9 70 18 19-23 Nearly on TargetM 9 79 18 19-23 Nearly on TargetF 9 68 18 19-23 Nearly on Target
Gender Grade Comp (Iowa 2009) Composite (Plan 2011) Projected ACT Goal - Comp Score of 24 (17 and below)
M 9 68 16 16-20 Not on TargetF 9 13 13-17 Not on TargetF 9 50 17 17-21 Not on TargetF 9 65 15 15-19 Not on TargetF 9 90 17 17-21 Not on Target
Individual Benchmarks those who are ON TARGET (Plan score of 20 or above)those who are NEARLY ON TARGET (Plan score of 18-19)those who were OFF TARGET (Plan score of 17 or below)
Class of 2014 Plan Results (2011)
72%
38%
58%
27%
15%
21%17%
22%
13%
41%
25%
51%
0%
10%
20%
30%
40%
50%
60%
70%
80%
English Math Reading Science
On Target
Nearly on Target
Not on Target
District Objective – Student Achievement/ Accountability (SLOs)
Growth
Achievement

Test EXPLORE PLAN ACTEnglish 13 15 18Mathematics 17 19 22Reading 15 17 21Science 20 21 24
ACT’s College Readiness Benchmarks
Class of 2015 at or above benchmark (2010-11 Explore Results)
84%
62%66%
27%
61%
36% 36%
10%
0%
10%
20%
30%
40%
50%
60%
70%
80%
90%
English Math Reading Science
WMS
National
Class of 2014 at or above benchmark (2011 Plan Results)
77%
42%
62%
29%
68%
34%
50%
22%
0%
10%
20%
30%
40%
50%
60%
70%
80%
90%
English Math Reading Science
WHS
National
We will divide our students into three groups: those who are ON TARGET (met or exceeded the College Readiness Benchmarks)
those who are NEARLY ON TARGET (within 2 or fewer score points of meeting each Benchmark)those who were OFF TARGET (more than 2 score points from meeting each Benchmark).
Growth
Achievement

New Framework Approved at the November, 2011 State Board of
Education Meeting
Professional Practice
Framework

Are you focused on Proficiency or Growth?
Building a Culture of High Expectations
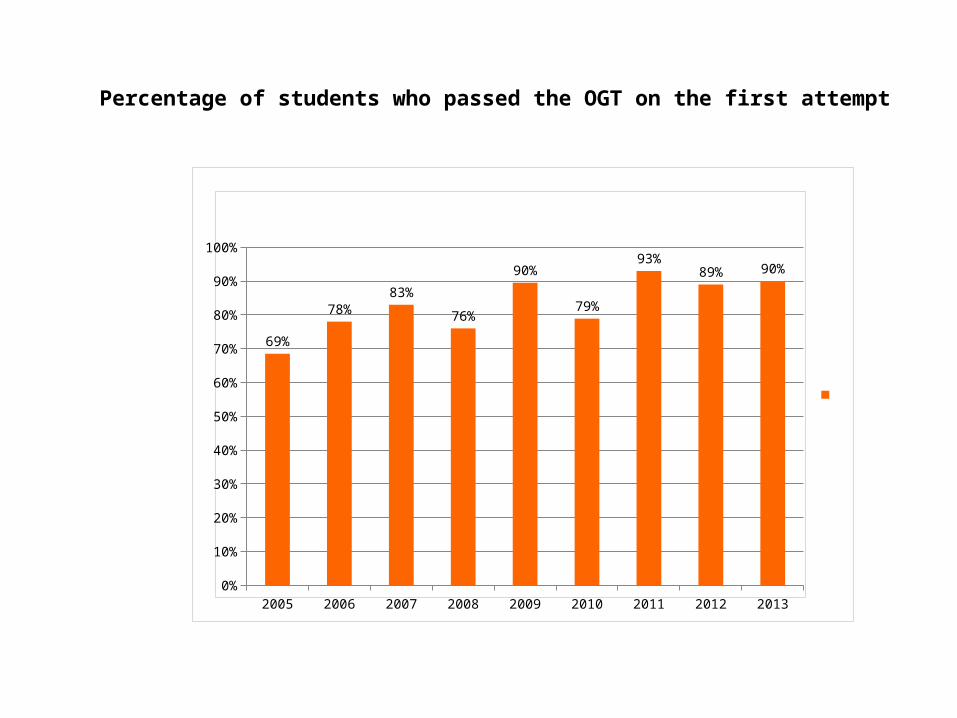
2005 2006 2007 2008 2009 2010 2011 2012 20130%
10%
20%
30%
40%
50%
60%
70%
80%
90%
100%
69%
78%83%
76%
90%
79%
93%89% 90%
Percentage of students who passed the OGT on the first attempt

COUNTY SUBJECTNUMBER TESTED
PCT. PROF. OR ABOVE
PERCENT ADV.
PERCENT ACCEL.
Adv+AcclPERCENT
PROF.PERCENT
BASICPERCENT LIMITED
1st Mason Mathematics 810 99 82.3 10.4 92.7 6.3 0.6 0.4
2nd Wayne Mathematics 129 98.4 67.4 20.2 87.6 10.9 0.8 0.8
3rd Kings Mathematics 316 96.2 71.2 13.3 84.5 11.7 2.5 1.3
4th Springboro Mathematics 433 96.1 69.1 15.2 84.3 11.8 1.6 2.3
5th Lebanon Mathematics 400 95.8 62.5 19.3 81.8 14 1.3 3
6th Carlisle Mathematics 114 89.5 38.6 22.8 61.4 28.1 7 3.5
7th Frankin Mathematics 187 89.3 43.9 25.7 69.6 19.8 6.4 4.3
8th Little Miami Mathematics 234 88.9 44.9 24.8 69.7 19.2 5.1 6
COUNTY SUBJECTNUMBER TESTED
PCT. PROF. OR ABOVE
PERCENT ADV.
PERCENT ACCEL.
Adv+AcclPERCENT
PROF.PERCENT
BASICPERCENT LIMITED
1st Mason Reading 811 98.5 40.4 44 84.4 14.1 1.1 0.4
2nd Wayne Reading 130 97.7 24.6 43.1 67.7 30 1.5 0.8
3rd Kings Reading 316 95.9 30.1 44.9 75 20.9 3.5 0.6
4th Lebanon Reading 400 95.8 26 46.3 72.3 23.5 3.3 1
5th Springboro Reading 433 95.4 37.9 41.3 79.2 16.2 3.2 1.4
6th Little Miami Reading 233 90.6 26.2 36.1 62.3 28.3 6.9 2.6
7th Carlisle Reading 114 90.4 16.7 39.5 56.2 34.2 6.1 3.5
8th Frankin Reading 185 89.7 12.4 38.4 50.8 38.9 8.1 2.2
COUNTY SUBJECTNUMBER TESTED
PCT. PROF. OR ABOVE
PERCENT ADV.
PERCENT ACCEL.
Adv+AcclPERCENT
PROF.PERCENT
BASICPERCENT LIMITED
1st Mason Science 810 95.3 54.2 26 80.2 15.1 4.2 0.5
2nd Springboro Science 433 93.5 56.6 22.6 79.2 14.3 5.5 0.9
3rd Wayne Science 129 92.2 52.7 23.3 76 16.3 7.8 0
4th Lebanon Science 400 90.8 36 27 63 27.8 8.3 1
5th Kings Science 316 87.7 39.6 27.8 67.4 20.3 11.1 1.3
6th Little Miami Science 234 86.3 29.9 23.1 53 33.3 11.5 2.1
7th Frankin Science 186 86 23.7 27.4 51.1 34.9 11.3 2.7
8th Carlisle Science 114 76.3 21.9 18.4 40.3 36 19.3 4.4
COUNTY SUBJECTNUMBER TESTED
PCT. PROF. OR ABOVE
PERCENT ADV.
PERCENT ACCEL.
Adv+AcclPERCENT
PROF.PERCENT
BASICPERCENT LIMITED
1st Mason Social Studies 810 98.8 81.1 10.5 91.6 7.2 0.9 0.4
2nd Wayne Social Studies 130 96.9 66.9 15.4 82.3 14.6 2.3 0.8
3rd Springboro Social Studies 433 94.2 66.7 13.4 80.1 14.1 2.8 3
4th Kings Social Studies 316 91.8 56.6 20.6 77.2 14.6 5.1 3.2
5th Frankin Social Studies 185 90.8 49.2 17.8 67 23.8 4.3 4.9
6th Lebanon Social Studies 399 88.2 54.1 15.3 69.4 18.8 8 3.8
7th Little Miami Social Studies 233 85.4 41.2 22.7 63.9 21.5 6.9 7.7
8th Carlisle Social Studies 113 84.1 38.1 21.2 59.3 24.8 9.7 6.2
COUNTY SUBJECTNUMBER TESTED
PCT. PROF. OR ABOVE
PERCENT ADV.
PERCENT ACCEL.
Adv+AcclPERCENT
PROF.PERCENT
BASICPERCENT LIMITED
1st Mason Writing 811 96.8 2.1 67 69.1 27.7 2.8 0.4
2nd Wayne Writing 130 96.2 0 62.3 62.3 33.8 3.8 0
3rd Kings Writing 316 94.3 2.5 62.3 64.8 29.4 4.7 0.9
4th Springboro Writing 432 94.2 2.5 65.7 68.2 25.9 3.7 2.1
5th Little Miami Writing 234 92.3 0.9 48.3 49.2 43.2 5.6 2.1
6th Lebanon Writing 400 92 1 52 53 39 6.5 1.5
7th Carlisle Writing 114 90.4 0 41.2 41.2 49.1 7.9 1.8
8th Frankin Writing 186 86.6 0 29.6 29.6 57 11.3 2.2
COUNTY SUBJECTNUMBER TESTED
PCT. PROF. OR ABOVE
PERCENT ADV.
PERCENT ACCEL.
Adv+AcclPERCENT
PROF.PERCENT
BASICPERCENT LIMITED
1st Mason All Five 809 93
2nd Springboro All Five 432 90.3
3rd Wayne All Five 129 89.1
4th Kings All Five 316 84.8
5th Lebanon All Five 399 82.5
6th Little Miami All Five 232 78
7th Frankin All Five 185 74.1
8th Carlisle All Five 113 70.8
2013 Results

COUNTY SUBJECT NUMBER TESTED
PCT. PROF. OR ABOVE
PERCENT ADV.
PERCENT ACCEL. Adv+Accl PERCENT
PROF.PERCENT
BASICPERCENT LIMITED
1st Mason Mathematics 810 99 82.3 10.4 92.7 6.3 0.6 0.42nd Wayne Mathematics 129 98.4 67.4 20.2 87.6 10.9 0.8 0.83rd Kings Mathematics 316 96.2 71.2 13.3 84.5 11.7 2.5 1.34th Springboro Mathematics 433 96.1 69.1 15.2 84.3 11.8 1.6 2.35th Lebanon Mathematics 400 95.8 62.5 19.3 81.8 14 1.3 36th Little Miami Mathematics 234 88.9 44.9 24.8 69.7 19.2 5.1 67th Frankin Mathematics 187 89.3 43.9 25.7 69.6 19.8 6.4 4.38th Carlisle Mathematics 114 89.5 38.6 22.8 61.4 28.1 7 3.5
COUNTY SUBJECT NUMBER TESTED
PCT. PROF. OR ABOVE
PERCENT ADV.
PERCENT ACCEL. Adv+Accl PERCENT
PROF.PERCENT
BASICPERCENT LIMITED
1st Mason Reading 811 98.5 40.4 44 84.4 14.1 1.1 0.42nd Springboro Reading 433 95.4 37.9 41.3 79.2 16.2 3.2 1.43rd Kings Reading 316 95.9 30.1 44.9 75 20.9 3.5 0.64th Lebanon Reading 400 95.8 26 46.3 72.3 23.5 3.3 15th Wayne Reading 130 97.7 24.6 43.1 67.7 30 1.5 0.86th Little Miami Reading 233 90.6 26.2 36.1 62.3 28.3 6.9 2.67th Carlisle Reading 114 90.4 16.7 39.5 56.2 34.2 6.1 3.58th Frankin Reading 185 89.7 12.4 38.4 50.8 38.9 8.1 2.2
COUNTY SUBJECT NUMBER TESTED
PCT. PROF. OR ABOVE
PERCENT ADV.
PERCENT ACCEL. Adv+Accl PERCENT
PROF.PERCENT
BASICPERCENT LIMITED
1st Mason Science 810 95.3 54.2 26 80.2 15.1 4.2 0.52nd Springboro Science 433 93.5 56.6 22.6 79.2 14.3 5.5 0.93rd Wayne Science 129 92.2 52.7 23.3 76 16.3 7.8 04th Kings Science 316 87.7 39.6 27.8 67.4 20.3 11.1 1.35th Lebanon Science 400 90.8 36 27 63 27.8 8.3 16th Little Miami Science 234 86.3 29.9 23.1 53 33.3 11.5 2.17th Frankin Science 186 86 23.7 27.4 51.1 34.9 11.3 2.78th Carlisle Science 114 76.3 21.9 18.4 40.3 36 19.3 4.4
COUNTY SUBJECT NUMBER TESTED
PCT. PROF. OR ABOVE
PERCENT ADV.
PERCENT ACCEL. Adv+Accl PERCENT
PROF.PERCENT
BASICPERCENT LIMITED
1st Mason Social Studies 810 98.8 81.1 10.5 91.6 7.2 0.9 0.42nd Wayne Social Studies 130 96.9 66.9 15.4 82.3 14.6 2.3 0.83rd Springboro Social Studies 433 94.2 66.7 13.4 80.1 14.1 2.8 34th Kings Social Studies 316 91.8 56.6 20.6 77.2 14.6 5.1 3.25th Lebanon Social Studies 399 88.2 54.1 15.3 69.4 18.8 8 3.86th Frankin Social Studies 185 90.8 49.2 17.8 67 23.8 4.3 4.97th Little Miami Social Studies 233 85.4 41.2 22.7 63.9 21.5 6.9 7.78th Carlisle Social Studies 113 84.1 38.1 21.2 59.3 24.8 9.7 6.2
COUNTY SUBJECT NUMBER TESTED
PCT. PROF. OR ABOVE
PERCENT ADV.
PERCENT ACCEL. Adv+Accl PERCENT
PROF.PERCENT
BASICPERCENT LIMITED
1st Mason Writing 811 96.8 2.1 67 69.1 27.7 2.8 0.42nd Springboro Writing 432 94.2 2.5 65.7 68.2 25.9 3.7 2.13rd Kings Writing 316 94.3 2.5 62.3 64.8 29.4 4.7 0.94th Wayne Writing 130 96.2 0 62.3 62.3 33.8 3.8 05th Lebanon Writing 400 92 1 52 53 39 6.5 1.56th Little Miami Writing 234 92.3 0.9 48.3 49.2 43.2 5.6 2.17th Carlisle Writing 114 90.4 0 41.2 41.2 49.1 7.9 1.88th Frankin Writing 186 86.6 0 29.6 29.6 57 11.3 2.2
COUNTY SUBJECT NUMBER TESTED
PCT. PROF. OR ABOVE
PERCENT ADV.
PERCENT ACCEL. Adv+Accl PERCENT
PROF.PERCENT
BASICPERCENT LIMITED
1st Mason All Five 809 93 2nd Springboro All Five 432 90.3 3rd Wayne All Five 129 89.1 4th Kings All Five 316 84.8 5th Lebanon All Five 399 82.5 6th Little Miami All Five 232 78 7th Frankin All Five 185 74.1 8th Carlisle All Five 113 70.8
2013 Results
What will you do if students are not successful?
Building a Culture of High Expectations

Warning Bell 7:301st Period 7:35-8:222nd Period 8:25-9:123rd Period 9:15 - 10:024th Period 10:02 - 12:02
A Lunch - 10:02 - 10:32 Class - 10:35 - 11:32C Lunch - 11:02 - 11:32 Class - 10:05 - 11:02
ET/EH 11:35 - 12:02
5th Period 12:05 - 12:526th Period 12:55 - 1:427th Period 1:45 - 2:32Buses Depart 2:37
WHS Schedule
Providing Intervention Opportunities During the School Day

Academic Intervention
Band
Honors Biology II
Supportive Peers
Commons/Gym
Data
Communication
High Expectations
TeacherSupport
Intervention at WHS
ACT/PSAT Intervention
Support Groups offered by Guidance
OGT Intervention
Parent Support
Writing Center Peers
AP Intervention

ET/EH - Intervention
MondayStudent’s Report to their Homeroom*Band/Supportive Peers/Hon. Biology II report to class
Homeroom Teacher post student list for ET/EH.
Student Council, SADD and NHS Alternate Mondays for meetings
* All Students are available for ET/EH
Tuesday-FridayStudent’s Report to their ET/EH AssignmentorGym/Commons Areaor Computer Lab/Media Center
*Band/*Supportive Peers/Hon. Biology II
*Are available for ET/EH
FRIDAYTEACHER EMAILS ET/EH NAMES FOR NEXT WEEK BY 2:32
Supportive Peers- application and approval required by Supportive Peer Teacher This class is available to juniors and seniors who are interested in working in an inclusive environment with students who have exceptional needs. Students will be required to participate in training prior to beginning of the school year (Friday, August , 2012) and will receive instruction during the homeroom period. Supportive peers will be responsible for monitoring student work in the class and assist the peer in adjusting to being in the mainstream school population. Peers are expected to be positive role models and advocates for the student(s) with whom they are working. This class is offered for credit and those enrolled will not be responsible for any course work in the peer's class, but rather for the curriculum established for the Supportive Peer Program.Supportive peers can be taken for either 1/2 credit (semester) or for 1 credit (year).
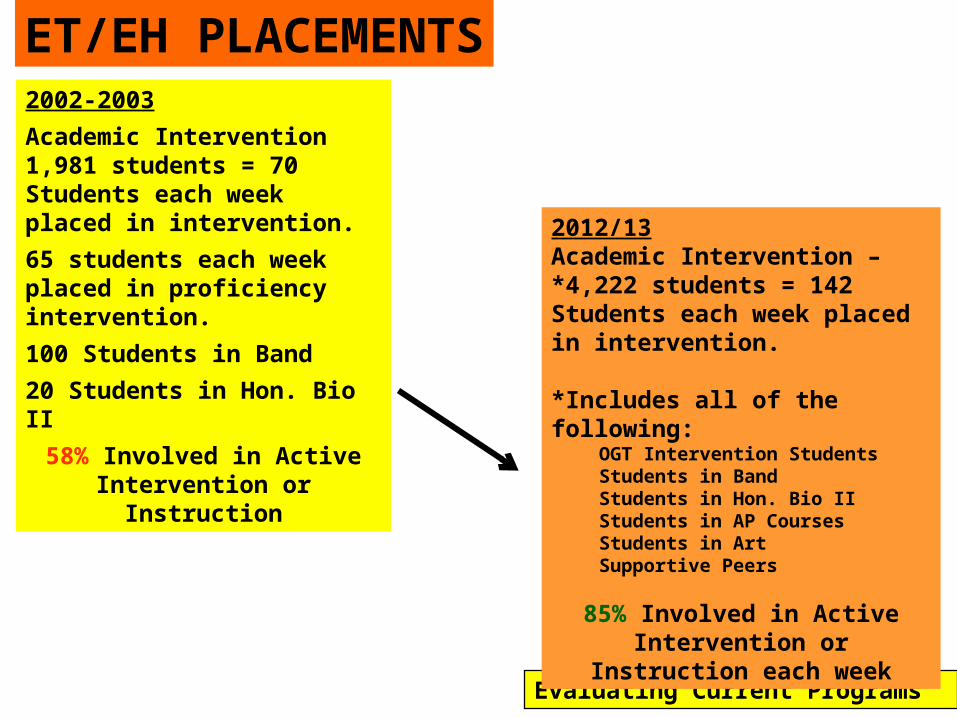
ET/EH PLACEMENTS2002-2003
Academic Intervention 1,981 students = 70 Students each week placed in intervention.
65 students each week placed in proficiency intervention.
100 Students in Band
20 Students in Hon. Bio II
58% Involved in Active Intervention or Instruction
Evaluating Current Programs
2012/13Academic Intervention – *4,222 students = 142 Students each week placed in intervention.
*Includes all of the following:OGT Intervention StudentsStudents in BandStudents in Hon. Bio IIStudents in AP CoursesStudents in ArtSupportive Peers
85% Involved in Active Intervention or Instruction each
week

How do you determine success in your classroom/grade level/school????
Building a Culture of High Expectations
Teacher-Based Teams

5 Step Process• Collect Evidence of Student Learning• Analyze Assessment Results• Plan for Instruction• Implement with Fidelity• Re-assess and Evaluate Effectiveness
Using Teacher-Based Teams to “Connect the Dots”
• Ohio has many programs and initiatives to prepare students for a 21st Century global economy.
• It is important to create connections.– “Connect the Dots” between the plethora of programs and
initiatives that currently exist

The Big Picture
What Teachers Teach
How Teachers Deliver Instruction
Measures of Student Learning
Measures of Educator Effectiveness

In order to understand The Big Picture, these programs and initiatives can be arranged into four organizational clusters:
• What Teachers Teach (1)– Ohio’s New Learning Standards– Common Core State Standards
• How Teachers Deliver Instruction (2)– FIP Your School– Diamond of Success
The Big Picture
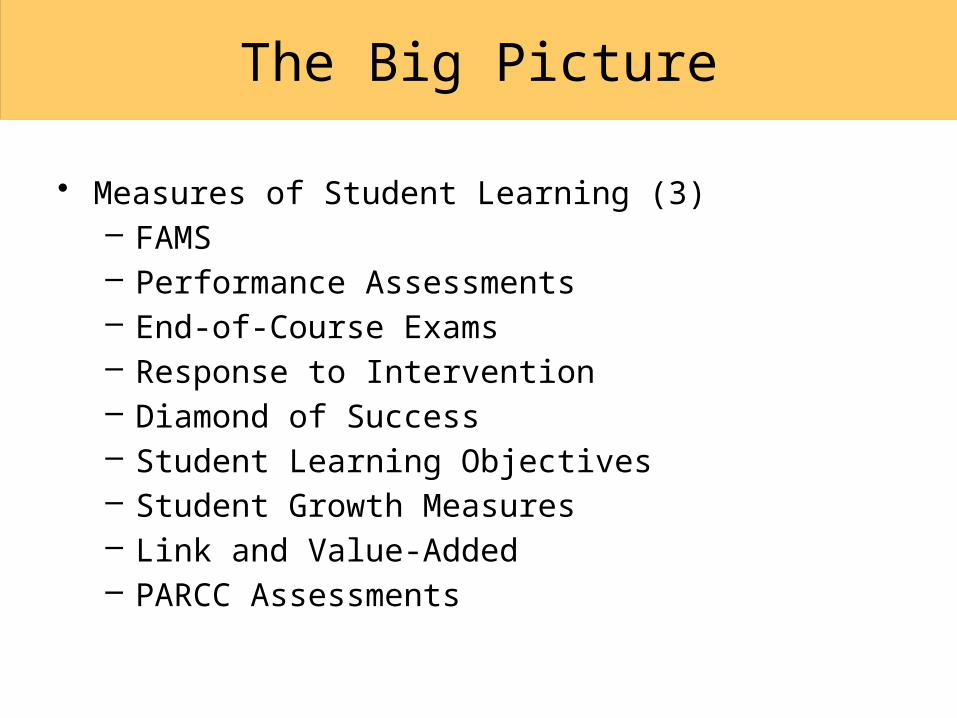
• Measures of Student Learning (3)– FAMS– Performance Assessments– End-of-Course Exams– Response to Intervention– Diamond of Success– Student Learning Objectives– Student Growth Measures– Link and Value-Added– PARCC Assessments
The Big Picture

• Measures of Educator Effectiveness (4)– Student Growth Measures– Student Learning Objectives– Performance Based Compensation– Link and Value-Added Analysis– Ohio Principal Evaluation System– Ohio Teacher Evaluation System
The Big Picture
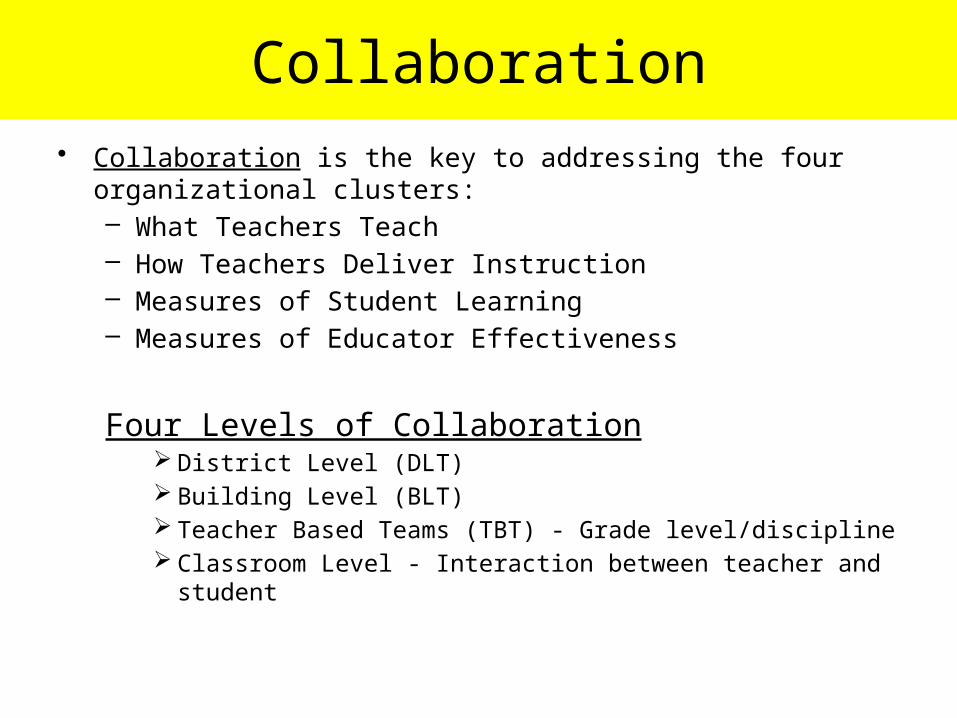
Collaboration• Collaboration is the key to addressing the four organizational clusters:
– What Teachers Teach– How Teachers Deliver Instruction– Measures of Student Learning– Measures of Educator Effectiveness
Four Levels of Collaboration District Level (DLT) Building Level (BLT) Teacher Based Teams (TBT) - Grade level/discipline Classroom Level - Interaction between teacher and student
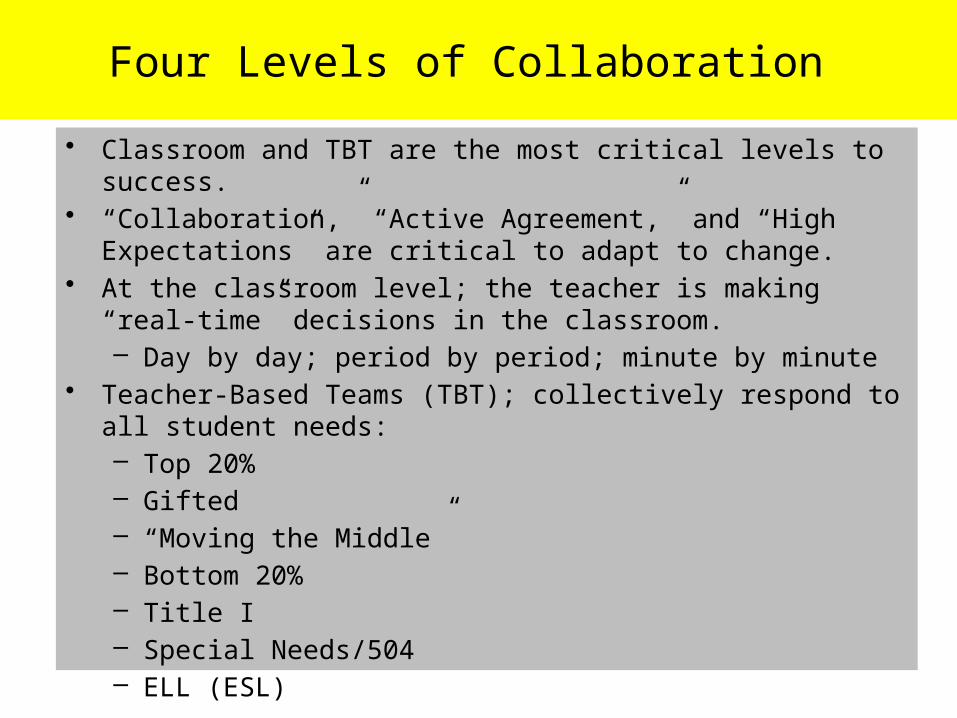
Four Levels of Collaboration
• Classroom and TBT are the most critical levels to success.• “Collaboration,” “Active Agreement,” and “High Expectations” are critical
to adapt to change.• At the classroom level; the teacher is making “real-time” decisions in the
classroom. – Day by day; period by period; minute by minute
• Teacher-Based Teams (TBT); collectively respond to all student needs:– Top 20%– Gifted– “Moving the Middle”– Bottom 20%– Title I– Special Needs/504– ELL (ESL)

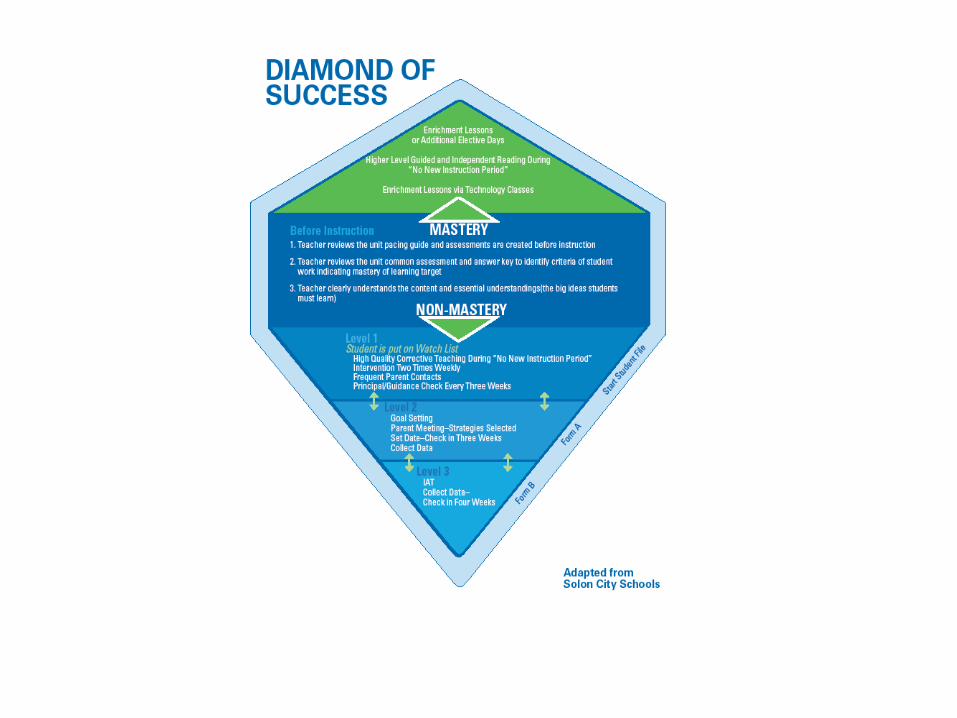
Mastery
Non-Mastery
Before Instruction 1. Teacher reviews the unit pacing guide and assessments are created before instruction 2. Teacher reviews the unit common assessment and answer key to identify criteria of student work indicating mastery of learning target each and every day3. Teacher clearly understands the content and essential understandings (the big ideas students must learn)
Enrichment Lessons or Additional Elective Days
Higher Level Guided and Independent Reading During “No New Instruction Period” Enrichment Lessons via Technology Classes/Resources
Level 1Student is placed into ET/EH “No New Instruction Period”
High Quality Corrective Teaching During Intervention Four Times WeeklyFrequent Parent Contacts- Email/Phone CallsPrincipal/Guidance Check Every Three Week
Response to Intervention (RTI) Model
80%
Level 2 (in addition to level 1) Goal Setting- SLOs/SMART
Parent Meeting–Strategies Selected Set Date–Check in Three Weeks
Collect Data
Level 3IAT
Collect Data Check in Four Weeks

Who is responsible for professional development?
Building a Culture of High Expectations
Professional Development – Old School
Professional Development – The Future
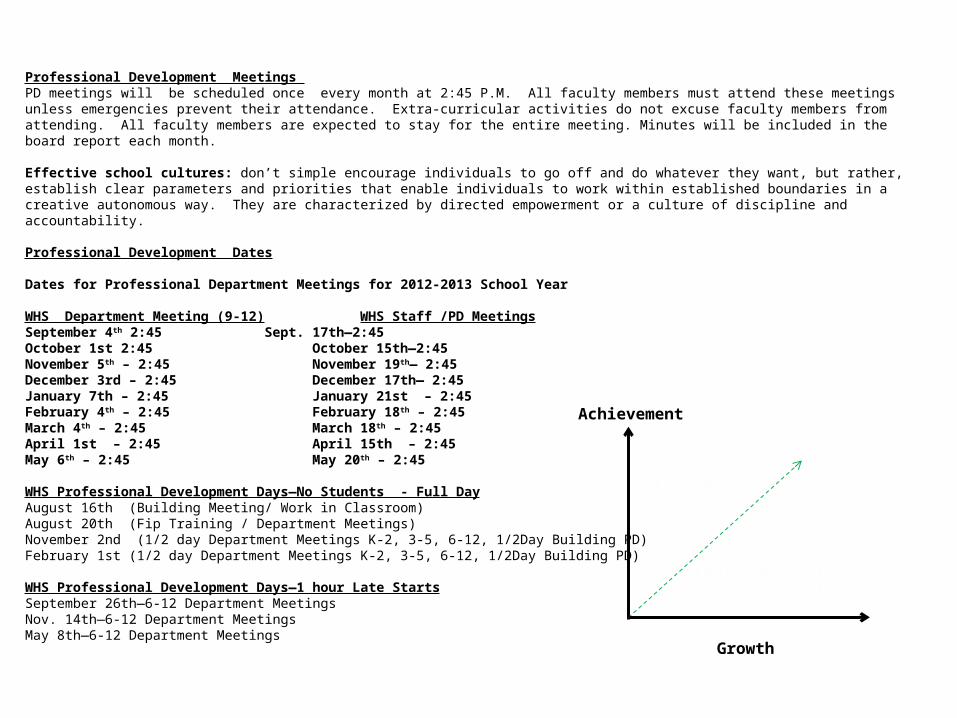
Professional Development Meetings PD meetings will be scheduled once every month at 2:45 P.M. All faculty members must attend these meetings unless emergencies prevent their attendance. Extra-curricular activities do not excuse faculty members from attending. All faculty members are expected to stay for the entire meeting. Minutes will be included in the board report each month. Effective school cultures: don’t simple encourage individuals to go off and do whatever they want, but rather, establish clear parameters and priorities that enable individuals to work within established boundaries in a creative autonomous way. They are characterized by directed empowerment or a culture of discipline and accountability. Professional Development Dates Dates for Professional Department Meetings for 2012-2013 School Year WHS Department Meeting (9-12) WHS Staff /PD MeetingsSeptember 4th 2:45 Sept. 17th—2:45October 1st 2:45 October 15th—2:45 November 5th – 2:45 November 19th— 2:45December 3rd – 2:45 December 17th— 2:45January 7th – 2:45 January 21st – 2:45February 4th – 2:45 February 18th – 2:45March 4th – 2:45 March 18th – 2:45April 1st – 2:45 April 15th – 2:45May 6th – 2:45 May 20th – 2:45 WHS Professional Development Days—No Students - Full DayAugust 16th (Building Meeting/ Work in Classroom)August 20th (Fip Training / Department Meetings) November 2nd (1/2 day Department Meetings K-2, 3-5, 6-12, 1/2Day Building PD) February 1st (1/2 day Department Meetings K-2, 3-5, 6-12, 1/2Day Building PD) WHS Professional Development Days—1 hour Late StartsSeptember 26th—6-12 Department MeetingsNov. 14th—6-12 Department MeetingsMay 8th—6-12 Department Meetings
Growth
Achievement
PI =110
Individual StudentAccountability

ACT has established progressive Lexile Ranges aligned to College and Career Readiness Expectations for all students:Grades 2-3 450 – 790 L
4-5 770 – 980 L6-8 955 – 1155 L9-10 1080 – 1305 L11-CCR 1215 – 1355 L
Find A Book
“Typical” Reader – Lexile measures by Grade:Grade 1 Up to 300 L
2 140 - 500 L3 330 - 700 L4 445 - 810 L5 565 - 910 L6 665 - 1000 L7 735 - 1065 L8 805 - 1100 L9 855 - 1165 L10 905 - 1195 L11&12 940 - 1210 L
Lexile.com The Lexile Framework for ReadingMatching readers with texts
http://www.thereadingwarehouse.com/DEV/search.php?Lexile=1290
http://www.lexile.com/about-lexile/lexile-overview/
http://www.lexile.com/analyzer/
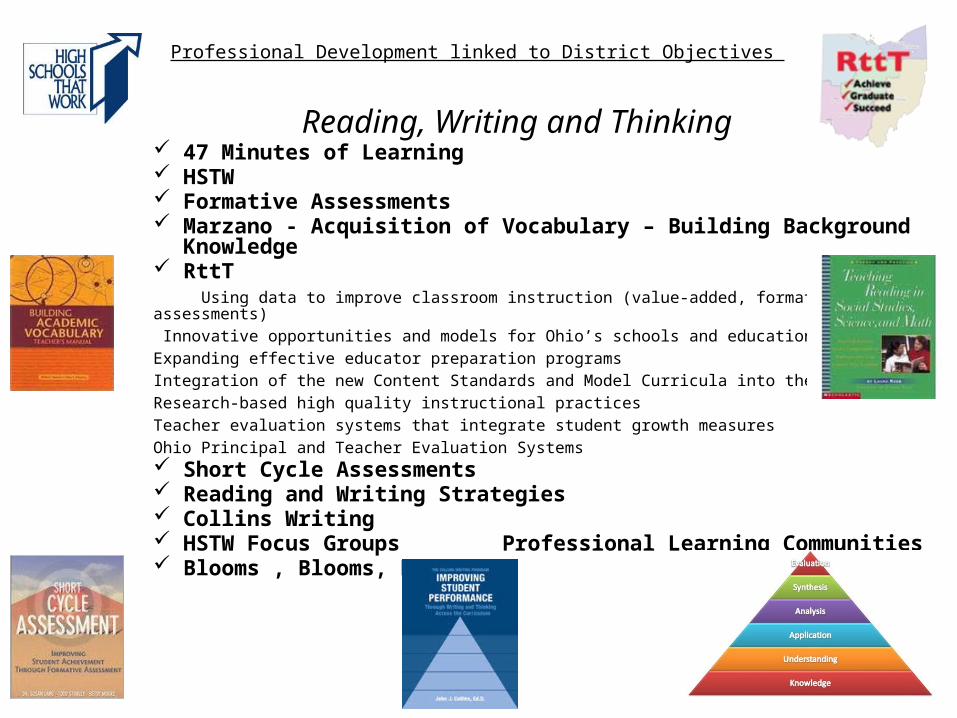
Professional Development linked to District Objectives
Reading, Writing and Thinking 47 Minutes of Learning HSTW Formative Assessments Marzano - Acquisition of Vocabulary – Building Background Knowledge RttT
Using data to improve classroom instruction (value-added, formative assessments)
Innovative opportunities and models for Ohio’s schools and education leaders
Expanding effective educator preparation programs
Integration of the new Content Standards and Model Curricula into the classroom
Research-based high quality instructional practices
Teacher evaluation systems that integrate student growth measures
Ohio Principal and Teacher Evaluation Systems Short Cycle Assessments Reading and Writing Strategies Collins Writing HSTW Focus Groups Professional Learning Communities Blooms , Blooms, Blooms……