Embed Size (px)
Citation preview
1
BUDGETING FOR FISCAL SPACE AND GOVERNMENT PERFORMANCE BEYOND THE GREAT RECESSION1
Mario Marcel2
Draft, December 2012
Abstract
In the course of the prolonged economic crisis that started in 2008 fiscal space has become a scarce commodity in OECD countries. This has not only broadened the appeal of a concept originally raised by emerging countries in the early 2000s, but also has also extended its meaning to recognize its inter-temporal nature and to highlight its endogenous features. Current projections indicate that fiscal consolidation needs and the effect of demographic transition on social security may shrink non-pension fiscal space in OECD countries by some 18% between 2011 and 2030, exceeding current consolidation plans in many countries. The response to these needs should take place increasingly through budgets rather than ad-hoc consolidation packages. To this end, the quest for fiscal space needs to be mainstreamed into budgeting by developing appropriate tools and procedures; the effort needs to extend beyond the annual budget process both in timeframe and scope, and many actors need to contribute to this effort in addition to ministries of finance and budget offices. In other words, generating fiscal space at the required scale needs not only a substantial revamping of budget practices, but also revisiting the temporal and institutional framework within which budgeting takes place.
1 The author wishes to thank Jorge Vásquez and Natalia Nolan-Flecha for their statistical and editorial assistance, and Ian Hawkesworth and Lisa Von Trapp from the OECD Budget Division for rich complementary information on actual budget practices in OECD countries that is quoted throughout the paper. The author also wishes to thank colleagues from the OECD Economics Directorate Jérôme Brezillon, Lukasz Rawdanowics and Paul Van Den Noord for valuable data, suggestions and comments. Valuable feedback and comments on a first draft of the paper were provided by Rolf Alter and Jon Blondal. 2 Deputy Director, Public Governance and Territorial Development, OECD and former Budget Director of Chile 2000-2006.
2
BUDGETING FOR FISCAL SPACE AND GOVERNMENT PERFORMANCE BEYOND THE GREAT RECESSION
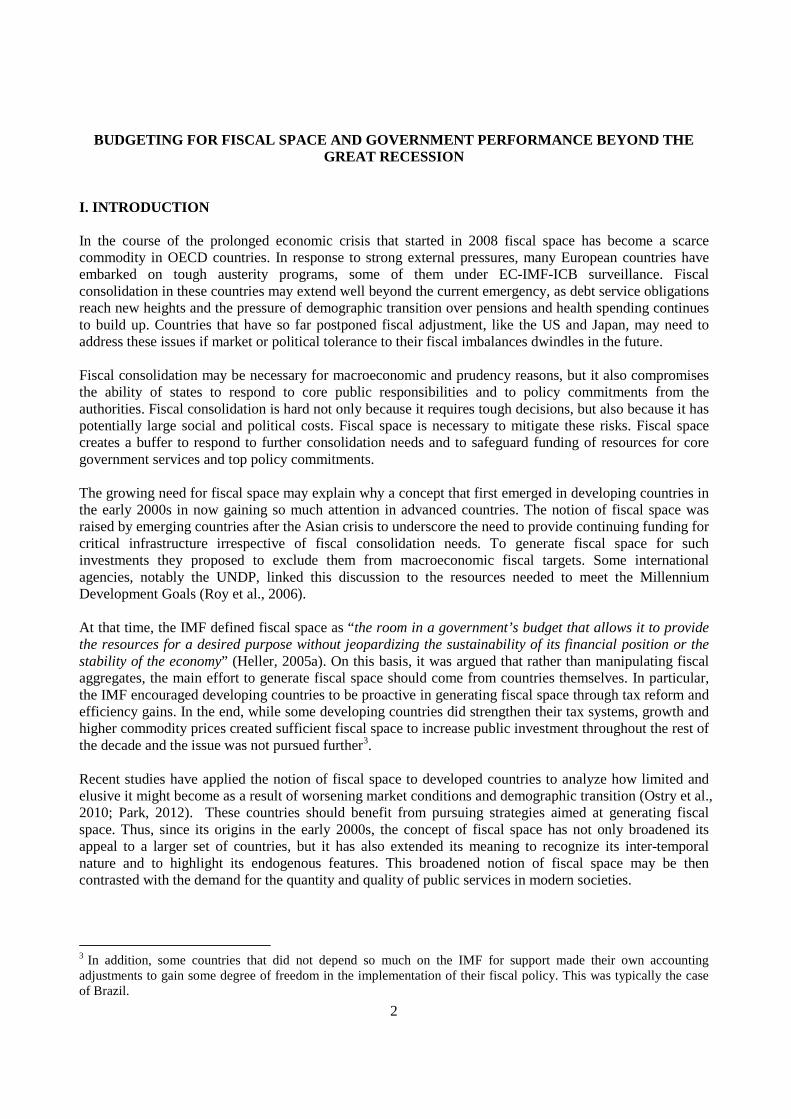
I. INTRODUCTION In the course of the prolonged economic crisis that started in 2008 fiscal space has become a scarce commodity in OECD countries. In response to strong external pressures, many European countries have embarked on tough austerity programs, some of them under EC-IMF-ICB surveillance. Fiscal consolidation in these countries may extend well beyond the current emergency, as debt service obligations reach new heights and the pressure of demographic transition over pensions and health spending continues to build up. Countries that have so far postponed fiscal adjustment, like the US and Japan, may need to address these issues if market or political tolerance to their fiscal imbalances dwindles in the future. Fiscal consolidation may be necessary for macroeconomic and prudency reasons, but it also compromises the ability of states to respond to core public responsibilities and to policy commitments from the authorities. Fiscal consolidation is hard not only because it requires tough decisions, but also because it has potentially large social and political costs. Fiscal space is necessary to mitigate these risks. Fiscal space creates a buffer to respond to further consolidation needs and to safeguard funding of resources for core government services and top policy commitments. The growing need for fiscal space may explain why a concept that first emerged in developing countries in the early 2000s in now gaining so much attention in advanced countries. The notion of fiscal space was raised by emerging countries after the Asian crisis to underscore the need to provide continuing funding for critical infrastructure irrespective of fiscal consolidation needs. To generate fiscal space for such investments they proposed to exclude them from macroeconomic fiscal targets. Some international agencies, notably the UNDP, linked this discussion to the resources needed to meet the Millennium Development Goals (Roy et al., 2006). At that time, the IMF defined fiscal space as “the room in a government’s budget that allows it to provide the resources for a desired purpose without jeopardizing the sustainability of its financial position or the stability of the economy” (Heller, 2005a). On this basis, it was argued that rather than manipulating fiscal aggregates, the main effort to generate fiscal space should come from countries themselves. In particular, the IMF encouraged developing countries to be proactive in generating fiscal space through tax reform and efficiency gains. In the end, while some developing countries did strengthen their tax systems, growth and higher commodity prices created sufficient fiscal space to increase public investment throughout the rest of the decade and the issue was not pursued further3
.
Recent studies have applied the notion of fiscal space to developed countries to analyze how limited and elusive it might become as a result of worsening market conditions and demographic transition (Ostry et al., 2010; Park, 2012). These countries should benefit from pursuing strategies aimed at generating fiscal space. Thus, since its origins in the early 2000s, the concept of fiscal space has not only broadened its appeal to a larger set of countries, but it has also extended its meaning to recognize its inter-temporal nature and to highlight its endogenous features. This broadened notion of fiscal space may be then contrasted with the demand for the quantity and quality of public services in modern societies.
3 In addition, some countries that did not depend so much on the IMF for support made their own accounting adjustments to gain some degree of freedom in the implementation of their fiscal policy. This was typically the case of Brazil.
3
The notion that fiscal space is necessary to support priority programs and respond to people’s needs is, of course, not new to fiscal management. Fiscal space is an intuitive concept that is in the background of many dimensions of fiscal management. Fiscal space is a concern of fiscal authorities all over the world as they dedicate a substantial part of their time to assess how much room they have available for new spending. Whenever budget officials revise cost estimates they are undoubtedly trying to generate fiscal space. However, these efforts usually take place on a rather incrementalist fashion and are integrated with spending decisions under the notion of “reallocation”. The time constraints on these processes and the asymmetries of information that characterize them, however, may limit their ability to create fiscal space at the scale needed to deliver on policy commitments, especially when the latter is shrinking fast as it may be happening in many OECD countries today. Thus, what seems to be missing is a more systematic effort at assessing fiscal space and a set of tools to step up the efforts at generating it. As fiscal space becomes scarcer, it becomes more necessary to discuss the strategies and procedures to create it. The fact that creating fiscal space requires some special effort in the budget process was the key message from a paper presented by Allen Schick to the SBO network in the early stages of the great recession (Schick, 2009). While noting how the concern with fiscal space was bringing advanced and developing countries together, Schick argued that to address such concern fiscal space should be enlarged incrementally and cumulatively over time. To this end, the protection and creation of fiscal space could be built into budgeting routines through a number of tests and tools. These included preventing backloaded spending decisions, approving new spending on a pay-as-you-go basis, reviewing tax subsidies, imposing cross-cutting efficiency dividends, adding sunset clauses to spending programs, and performing across-the-board cuts, among others. However, even these mechanisms may fall short of the magnitude of the fiscal challenges that have emerged lately. This was recognized by Schick himself in a presentation to the OECD SBO meeting in 2012 (Schick, 2012), arguing on the need to move beyond business-as-usual in the annual budget. This paper is aimed at discussing how to generate more fiscal space in OECD countries while preserving a focus on results in public management. This connection between fiscal space and results seems necessary as the economic functions of the budget still need to be reconciled with its institutional and managerial functions. In fact, the inability to find the right balance between these functions in the current environment may be stressing budget practices in some countries as governments continue applying performance budgeting tools while at the same time they implement ad-hoc spending cuts. The paper argues that budgeting is still the main field where these functions can be reconciled, but that in order to do so, (a) the quest for fiscal space needs to be mainstreamed into budgeting by developing appropriate tools and procedures; (b) the effort needs to extend beyond the annual budget process both in timeframe and scope, and (c) many actors need to contribute to this effort in addition to ministries of finance and budget offices. In other words, generating fiscal space at the required scale needs not only a substantial revamping of budget practices, but also revisiting the temporal and institutional framework within which budgeting takes place. To this end, section II elaborates on the factors and figures behind the quest for fiscal space in OECD countries, followed by a discussion of the tools and strategies to generate and allocate fiscal space outlined above in sections III and IV. Section V explores the analytical and institutional challenges of mainstreaming the generation of fiscal space into budgeting, followed by some general conclusions.

4
II. DESPERATELY SEEKING FISCAL SPACE II.1. Fiscal trends in OECD countries 2007-2013 The economic crisis that started in late 2007 has imposed continuing and rather contradictory demands on fiscal policy in OECD countries. At the beginning of the crisis, when economic stability was under serious threat from the dislocation of financial markets, governments were called upon to implement expansionary fiscal responses. Many analysts, leaders and international organisations advocated for fiscal stimulus to cushion the impact of the financial crisis of 2007-2009 on demand, output and employment. Many governments followed such directions, not only allowing automatic stabilisers to operate, but adding substantial stimulus measures. Overall, the underlying fiscal balances of OECD countries shifted from -2.6% of GDP in 2007 to -6.6% of GDP in 2009 (Figure 1). The resulting fiscal impulse of four percentage points of GDP over two years was unprecedented in its depth and simultaneity, as 25 out of 30 OECD countries reduced their underlying balances by more than 0.5% of GDP at the same time. Most of this change took place through spending increases, as a result of which the OECD average public spending/GDP ratio jumped more than 5% of GDP in the same period.
Figure 1. Financial balances, underlying balances and debt as shares of GDP (2007-2009)
Source: OECD Economic Outlook No. 91
While many observers recommended a gradual unwinding of fiscal stimulus as the economy stabilised, markets started to react far earlier to fiscal imbalances and growing public debt levels. By 2010, confidence on the sustainability of public debt began to erode, hitting eurozone countries particularly hard. Governments responded to these pressures with a turnaround in fiscal policy, reflected in fiscal consolidation plans. Pre-crisis profligacy, the stickiness of some stimulus measures, underlying fiscal pressures from demographic transition, the fiscal cost of financial rescues and the mounting financial costs from the loss of confidence in the euro, have made consolidation plans aim beyond the withdrawal of previous fiscal stimuli. Between 2009 and 2013, underlying primary balances are expected to improve from -5.1% of GDP to -1.5% of GDP.
-100
-50
0
50
100
-10
-5
0
5
10
2007 2008 2009
Financial balanceUnderlying balanceGross financial liabilities (secondary axis)
% of GDP % of GDP

5
Thus, in a matter of only five years, fiscal policy has moved from a mild expansionary stance to a strong stimulus and then to tough fiscal consolidation, with primary public spending being the main tool for adjustment. In terms of fiscal space, many OECD countries used all their available fiscal space (and some, beyond it) in pursuing a countercyclical fiscal policy in 2007-2009, to then shrink it under pressure of markets. As a result, fiscal policy became persistently procyclical. II.2. The changing notion of fiscal space Two observations are relevant to understand these overall trends; first, that not all OECD countries have behaved in the same fashion in the course of the great recession and, second, that the most important fiscal policy developments have taken place outside the regular budgetary process. Differences in the trajectory of fiscal policy can be best traced by pooling countries on the basis of some fiscal features. To illustrate this we consider four groups of countries4
:
• Group 1: Countries that experienced fiscal crises in the past, which may have led them to follow more conservative fiscal policies in the years prior to the financial crisis. This group includes Australia, Canada, Korea, New Zealand, Sweden and Finland.
• Group 2: Countries that have been under greatest pressure from financial markets during the current crisis on the grounds of fiscal sustainability. This includes the countries that have been under IMF-EC-ECB programmes (Greece, Iceland, Ireland and Portugal) and those that are considered as candidates for support from the ESF in Europe (Italy and Spain).
• Group 3: includes other euro area countries (Austria, Belgium, Estonia, France, Germany, Luxembourg, the Netherlands and Slovenia).
• Group 4: includes countries whose governments have been more isolated from sovereign debt markets on the basis of unorthodox monetary policies or by being able to tap into very long term funding sources. This group includes Japan, Switzerland, the United Kingdom and the United States.
Table 1 shows that these countries differ not only in their standing prior to the financial crisis, but also in their behaviour throughout. In particular, we note that Group 1 (past crisis) countries, started from a sounder financial position, with low levels of indebtness and a positive fiscal stance that allowed them to pursue a countercyclical fiscal policy not only at the beginning of the crisis but all the way to the end of the period. This took place mostly through an increase in primary spending in 2007-2009 that will only be completely withdrawn by 2012-2013. Group 2 countries also pursued an expansionary fiscal policy in 2007-2009 –the strongest of all groups—but were unable to sustain it in the face of rocketing net debt levels. These governments have thus been forced to undertake the strongest and fastest spending cuts and to raise taxes without still managing to stabilise debt by 2013, even after cutting spending below its levels of 2007. The rest of the eurozone countries (Group 3), adopted more cautious expansionary policies at the beginning of the crisis but have turned into a mildly procyclical policy after 2009. This may be explained
4 Some OECD members --Chile, the Czech Republic, Denmark, Hungary, Israel, Mexico, Norway, Poland, the Slovak Republic and Turkey—are not included in these groups due mostly to the lack of comparable fiscal data in the period under analysis.

6
by concerns on their exposure to market pressures, given gross debt levels that exceeded the European target of 60% of GDP in all the five largest economies of the group.
Table 1. Past and expected fiscal behaviour of OECD countries 2007-2013
by country groupings (% of GDP) (a)
Source: OECD Economic Outlook No. 91. (a) Group averages are weighted and refer to general government. (b) Underlying balances are adjusted for the cycle and for one-offs. (c) Primary spending refers to total disbursements, excluding net interest payments. (d) Gross debt data are not always comparable across countries due to different definitions or treatment of debt components. For more details, see OECD Economic Outlook Sources and Methods (http://www.oecd.org/eco/sources-and-methods). Group 1 countries include: Australia, Canada, Finland, Korea, New Zealand and Sweden. Group 2 countries include: Greece, Hungary, Iceland, Ireland, Italy, Portugal and Spain. Group 3 countries include: Austria, Belgium, Estonia, France, Germany, Luxembourg, the Netherlands, the Slovak Republic, and Slovenia. Group 4 countries include: Japan, Switzerland, the United Kingdom and the United States.
Exposure to market pressures differentiates the former from Group 4 countries. The latter started the crisis with relatively high levels of indebtedness (extremely high in the case of Japan) and increased it even further to execute a strong expansionary policy in 2007-2009, especially in the US. Fiscal consolidation in these countries was quite moderate to 2011 with some plans to intensify later, but without facing an increase in interest payments. In fact, the latter are expected to remain very close to their 2007 level even in 2013. The difference between these countries and those in Group 3 is illustrated by the fact that interest payments at the end of the period will be lower to the former despite a considerably higher debt/GDP ratio. The differences in the fiscal trajectory of countries since 2007 may help understand how the notion of fiscal space has been adopted and shifted in OECD countries from its origins in developing countries in the early 2000s. While the concept of fiscal space had a rather structural and microeconomic nature when it was first proposed by emerging countries at the turn of the century, as explained in Section I, OECD countries revived it with a more macroeconomic and long-term meaning in the course of the great recession. In particular, fiscal space has been recently defined for developed countries as “the difference between the current level of public debt and the debt limit implied by the country’s historical record of fiscal adjustment” (Ostry et.al., 2010). This definition suggests some dimensions and determinants of fiscal space that were not evident in its origins. In particular, it stresses an intertemporal, medium-term perspective of fiscal space, and the notion that it may be affected by a number of factors beyond fiscal policy, including changes in current debt levels that do not respond to conventional fiscal policy, and tolerance to public debt that may change from one country to another as well as over time.
Change in underlying balance (b)
Change in primary
spending (c)
Change in gross debt (d)
Change in underlying balance (b)
Change in primary
spending (c)
Change in gross debt (d)
Group 1 -4.08 4.17 7.78 2.37 -3.52 1.71
Group 2 -4.55 5.60 19.07 7.95 -5.14 13.41
Group 3 -1.91 5.05 14.21 2.85 -2.29 12.16
Group 4 -5.22 6.07 22.7 2.75 -2.87 24.21Total -4.35 5.64 18.70 3.32 -3.16 17.66
Country groups
2007-2009 2009-2013e

7
This concept may suit much better the analysis of fiscal conditions in OECD countries in the last few years. In particular, it suggests that some countries undertook expansionary fiscal policies at the outset of the crisis by drawing on fiscal space that turned out to be smaller and more elusive than expected. Fiscal space was lost not only to expansionary fiscal policies, but also to governments’ absorption of private liabilities through bailouts and the triggering of contingent liabilities as well as to changes in the willingness of markets to take further public debt on. II.3. Managing fiscal space during the great recession This brings us to the second feature of fiscal policy noted above, that is, that since 2008 fiscal space has not been managed through the conventional mechanisms of budgeting but through the design and implementation of fiscal “packages”. The latter were first conceived to stimulate the economy and later to consolidate public finances. A good example of the first is the stimulus package implemented at the beginning of the Obama Administration in the US (the American Recovery and Reinvestment Act, better known as ARRA) that channelled nearly $500 billion5
to a number of programs selected on the basis of their ability to generate economic activity and jobs over the next 2 years. Fiscal consolidation packages, on the other hand, have been frequent in countries that have sought to reassure markets through fiscal austerity. In the case of Spain, for example, three rounds of fiscal measures have been announced since the inception of the current Rajoy administration.
This is well reflected in the shape that fiscal consolidation has taken in many OECD countries. According to a recent OECD study6
, no less than 26 OECD countries have endorsed fiscal consolidation plans aiming at improving their underlying primary balance by 3.9% of potential GDP to stabilize debt by 2030. Of this, about 50% of total fiscal consolidation volume (2.8% of GDP) has been already implemented between 2009 and 2011, with the remainder expected to be completed the next three years. The average consolidation of the OECD area is calculated at 2.1% of GDP in 2012-13 and 0.7% in 2014-15. Most of the details of such plans have been already spelled out, with substantial pending definitions in only four out of 32 countries. According to these plans, three quarters of expected fiscal consolidation will take place through spending cuts.
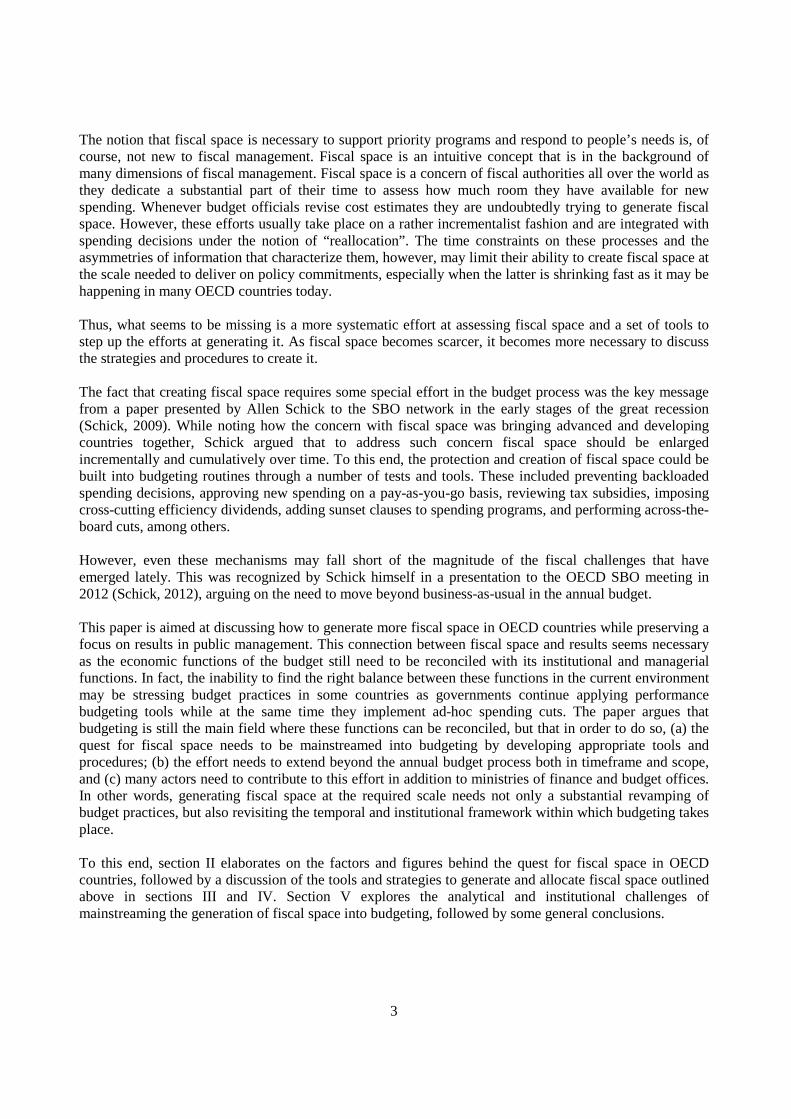
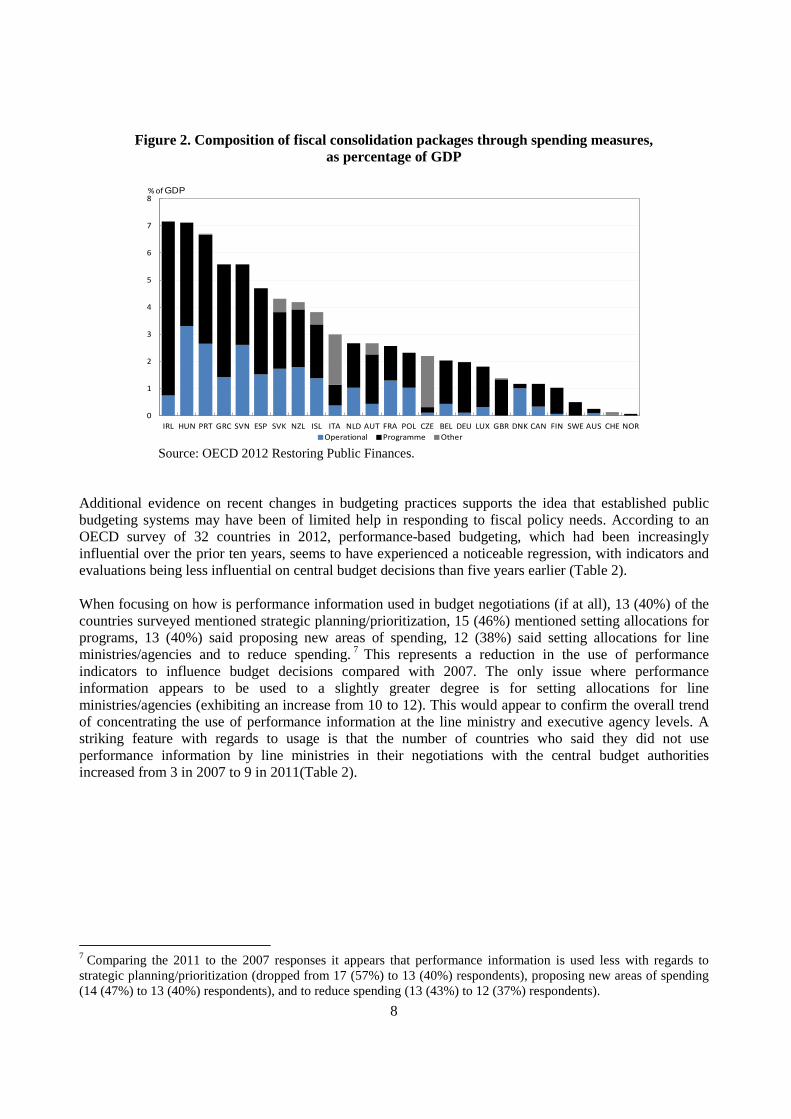
About two thirds of fiscal consolidation plans involve spending cuts, with the remaining 1/3 aimed at revenue increases. Figure 2 summarizes the composition of spending measures. According to these figures, programme expenditure measures and operational measures contribute to fiscal consolidation in similar proportions. In particular, most consolidation plans contemplate nominal pay freezes and reduction in staffing levels through partial replacement of departing public employees. As for programme spending, the areas most affected include welfare, health, pensions and infrastructure. This suggests that fiscal consolidation has been driven from the centre of government on the basis of across-the-board measures based on considerations of speed and effectiveness, rather than by a collegiate effort at rationalising spending. This may not differ substantially from the way in which stimulus packages were put together earlier on. As a result of this approach, the true impact of fiscal consolidation on public service delivery will depend on the capacity of public organisations to adapt to a more constrained environment.
5 The whole stimulus package was worth $787 billion over two years, of which $501 billion was channelled as increased spending and $285 billion through tax cuts. 6 OECD 2012 Restoring Public Finances.
8
Figure 2. Composition of fiscal consolidation packages through spending measures, as percentage of GDP
Source: OECD 2012 Restoring Public Finances.
Additional evidence on recent changes in budgeting practices supports the idea that established public budgeting systems may have been of limited help in responding to fiscal policy needs. According to an OECD survey of 32 countries in 2012, performance-based budgeting, which had been increasingly influential over the prior ten years, seems to have experienced a noticeable regression, with indicators and evaluations being less influential on central budget decisions than five years earlier (Table 2). When focusing on how is performance information used in budget negotiations (if at all), 13 (40%) of the countries surveyed mentioned strategic planning/prioritization, 15 (46%) mentioned setting allocations for programs, 13 (40%) said proposing new areas of spending, 12 (38%) said setting allocations for line ministries/agencies and to reduce spending. 7
This represents a reduction in the use of performance indicators to influence budget decisions compared with 2007. The only issue where performance information appears to be used to a slightly greater degree is for setting allocations for line ministries/agencies (exhibiting an increase from 10 to 12). This would appear to confirm the overall trend of concentrating the use of performance information at the line ministry and executive agency levels. A striking feature with regards to usage is that the number of countries who said they did not use performance information by line ministries in their negotiations with the central budget authorities increased from 3 in 2007 to 9 in 2011(Table 2).
7 Comparing the 2011 to the 2007 responses it appears that performance information is used less with regards to strategic planning/prioritization (dropped from 17 (57%) to 13 (40%) respondents), proposing new areas of spending (14 (47%) to 13 (40%) respondents), and to reduce spending (13 (43%) to 12 (37%) respondents).
0
1
2
3
4
5
6
7
8
IRL HUN PRT GRC SVN ESP SVK NZL ISL ITA NLD AUT FRA POL CZE BEL DEU LUX GBR DNK CAN FIN SWE AUS CHE NOROperational Programme Other
% of GDP

9
Table 2. How is performance information generally used by line ministries in their negotiations with CBAs?
Source: OECD 2012 Performance Budgeting Survey
While performance information remained relevant for management at the level of government agencies, central budget offices increasingly focused on spending reviews, presumably as guidance to savings and spending cuts. According to the same survey, 16 out of 32 countries use spending review in various forms (Table 3). Such reviews seem to be more widely used in Northern Europe and Anglo-Saxon countries than elsewhere. Of the 16 cases, in 12 countries spending reviews cover both the purely budgetary appropriations as well as the funds appropriated in separate legislation, often in the form of social transfers. In four countries only budgetary appropriations are examined. In 10 countries the spending reviews cover the central government only, in 6 countries the reviews covers the central as well as the sub-national.
Table 3. Countries that conduct spending reviews
Source: OECD 2012 Performance Budgeting Survey.
These developments suggest two additional features of fiscal space in the recent experience of OECD countries. First, that fiscal space is no longer sought as headroom to spend, but rather as a buffer to reduce the pain from fiscal consolidation. In this perspective, generating fiscal space may either increase the resources that could be available for emerging needs once the current constraints start to ease, or it may allow limiting the damage of further cuts on priority programs if austerity remains dominant. Secondly, the response of countries to fiscal consolidation needs suggests that the conventional tools of budgeting have been incapable of supporting the type of swift fiscal decisions that have been needed in the
For strategic planning/prioritization 17 (57%) 13 (40%)For setting allocations for programmes .. .. 15 (46%)For proposing new areas of spending 14 (47%) 13 (40%)For setting allocations for Line Ministries/Agencies 10 (33%) 12 (38%)To reduce spending 13 (43%) 12 (37%)Not used 3 (10%) 10 (30%)Number of respondents 30 32
2007 2011
Countries Number
Responded: Yes 16 (50%)
Responded: No 16 (50%)
Lacking response: 2
Iceland, United States
* Partner country
Australia, Canada, Denmark, Finland, France, Ireland, Italy, Korea, Mexico, Netherlands, New Zealand, Russian Federation*, Spain, Sweden, Switzerland, United Kingdom.
Austria, Belgium, Chile, Czech Republic, Estonia, Germany, Greece, Hungary, Japan, Luxembourg, Norway, Poland, Portugal, Slovak Republic, Slovenia, Turkey.
10
last five years, either to expand or to contract public spending. This may be due to the continuing dominance of an incrementalist rationale, the procedural complexity of the regular budgeting process, the concentration of performance-based budgeting on indicators and monitoring rather than evaluation of efficiency and effectiveness, or to the fact that the fiscal year may have become too long to articulate fast policy responses. The relevance of these features largely depends on the extent to which the current fiscal environment is expected to last. While anyone can understand that emergency situations may require exceptional responses in fiscal policy as well as in other fields, it is quite different to see the current turmoil as indicative of a more structural and lasting change in the framework to fiscal policy. If so, tools and techniques that thrived during the long economic expansion that preceded the financial crisis may need to be reformulated. III. EMERGING CHALLENGES FOR FISCAL POLICY AND BUDGETING III.1. The continuing scarcity of fiscal space Fiscal constraints in OECD countries may not go away easily, even if consolidation plans are fully executed to 2015. In the case of the Eurozone, the new treaty agreed in the March 2012 summit establishes a new institutional framework to enhance discipline and coordination of fiscal policy in member states, also called “fiscal compact” 8 . Under this framework it is required that the budget position shall be “balanced or in surplus in structural terms”, be included in national law and be of “binding force and permanent character, preferably constitutional” (European Commission, 2011a, 2011b). Balance would be achieved if the annual structural government deficit does not exceed 0.5% of nominal GDP. If a member state deviates from this rule, an automatic correction mechanism will be triggered. This target does not replace the Maastricht criteria that established a debt ceiling of 60% of GDP and a nominal deficit ceiling of 3% of GDP, that in the course of the crisis have been enhanced by establishing correction procedures9
.
In the case of non-eurozone countries, further action is expected from the US and Japan, at least to move towards the stabilisation of debt ratios. In the case of the former some agreement to reduce the Federal Deficit should replace legislation mandating an across-the-board adjustment in spending in 2013 that together with the ending of transitory tax reductions amount to some 4% of GDP (the so called “fiscal cliff”). In Japan, the government has already enacted a VAT increase that will be introduced gradually over the next three years, from the current 5% to 8% in April 2014, and to 10% in October 2015, but this is still insufficient to stabilize the debt/GDP ratio. Figure 3 compares the size of further consolidation needs with those that have been already committed by OECD countries. Consolidation is here estimated as the improvement in primary balances needed to deliver on two alternative benchmarks: (i) stabilising debt, and (ii) reducing debt to the eurozone target of 60% of GDP. 8 The fiscal compact (formally, the Treaty on Stability, Coordination and Governance in the Economic and Monetary Union) was signed on March 2, 2012 by 25 members of the European Council as an intergovernmental treaty aimed to ensure fiscal sustainability in the region. 9 Five new EU regulations and one EU directive (the so-called “six-pack”) took effect in December 2011 as legislative measures that upgrades the Stability and Growth Pact. Also, a number of additional changes have been undertaken for the euro area: the draft Regulation for enhanced monitoring of budgetary policies and the draft Regulation for enhanced surveillance for Member States with financial difficulties (the “two-pack”), which introduce detailed procedures for persuading Member States to amend their national budgets in line with Commission recommendations.

11
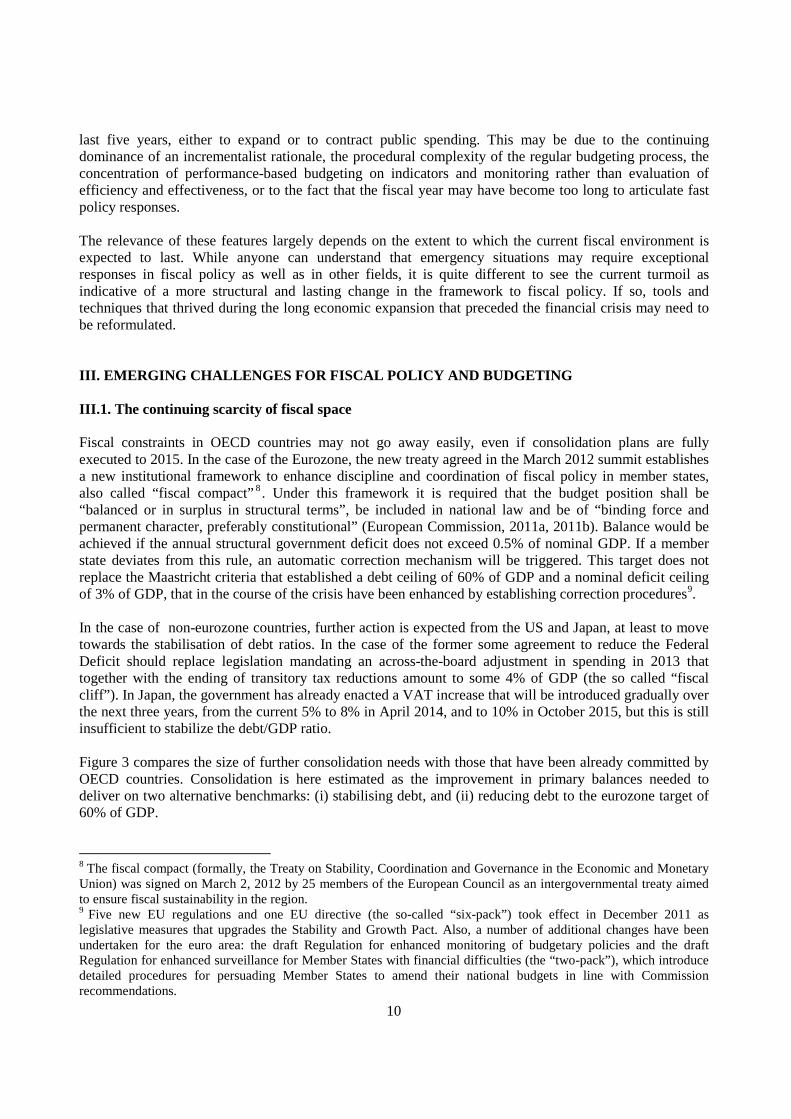
Figure 3. Committed consolidation needed to stabilize debt, and to attain 60% debt/GDP ratio.
Source: OECD Economic Outlook No. 91
As can be seen, consolidation needs to stabilise debt remain very large for most of the countries under IMF-EC-ECB programmes, but also for Japan, the US, the UK and Spain. In addition, there is a rather large group of countries (Poland, Slovenia, Slovak Republic, New Zealand, Australia, Czech Republic, Hungary) for which consolidation needs to stabilise debt are in the vicinity of 5% of GDP. In many of these cases (with the notable exception of New Zealand), current consolidation plans to 2015 fall short of consolidation needs. Reducing debt to GDP ratios further to 60% would involve additional consolidation efforts that are especially large (up to 5% of GDP) in the programme countries and in Japan, and between 2% and 5% of GDP in the US and the UK, France, Canada, Italy, Iceland and Belgium. According to these figures, then, many countries may be expected to pursue total fiscal consolidation, both to stabilise and to lower debt, of 5-15% of GDP over the years to come. However, over the next few years not only fiscal consolidation will reduce fiscal space. On the one hand, the previous consolidation needs that are estimated in terms of changes in primary balances take into account the higher interest payments associated with growing debt but not further increases in interest rates due to broader sovereign spreads.10 The impact of higher rates may be higher and faster depending on the maturity profile of government debt.11
On the other hand, fiscal space may also be absorbed by growing expenditure on pensions due to demographic transition. According to OECD projections, public spending on pensions is expected to grow on average from 8.4% of GDP in 2010 to 10% of GDP until 2030 (OECD, 2011). This means that non-
10 Policy rates are estimated on the basis of the Central Banks’ stated policy objectives. Concretely, a Taylor rule consistent with the Central Bank’s policy directives is used. Regarding sovereign spreads, for some countries in the euro area projections are made assuming that countries pursue their stated fiscal and structural policy objectives. For other countries the term premium, inflation risk, sovereign risk and safe haven effects, if any, are taken into account. 11 In this regard, it should be noted that primary balances are projected based on the budget (if available) or other announcements or medium term fiscal plans. Next, projection is made for the 10 years bond yields and 3-months interest rates, consistent with the monetary policy assumptions, inflation expectations and the term premium, among other considerations. Then, based on the maturity structure of the government debt, the effective bond yield and the interest expenditure on government debt is computed.
0
2
4
6
8
10
12
14Ja
pan
Gre
ece
Port
ugal
Irel
and
Uni
ted
Stat
esU
nite
d Ki
ngdo
mO
ECD
Spai
nFr
ance
Icel
and
Slov
enia
Pola
ndH
unga
ryN
ethe
rlan
dsN
ew Z
eala
ndSl
ovak
Rep
ublic
Euro
Are
aCa
nada
Aust
ralia
Italy
Finl
and
Czec
h Re
publ
icBe
lgiu
mAu
stri
aIs
rael
Luxe
mbo
urg
Swed
enEs
toni
aKo
rea
Ger
man
yD
enm
ark
Switz
erla
nd
Average consolidation to stabilise debt Additional consolidation to lower debt
% of GDP
12
pension primary spending would need to be reduced even further to the constraints claimed by fiscal consolidation12
.
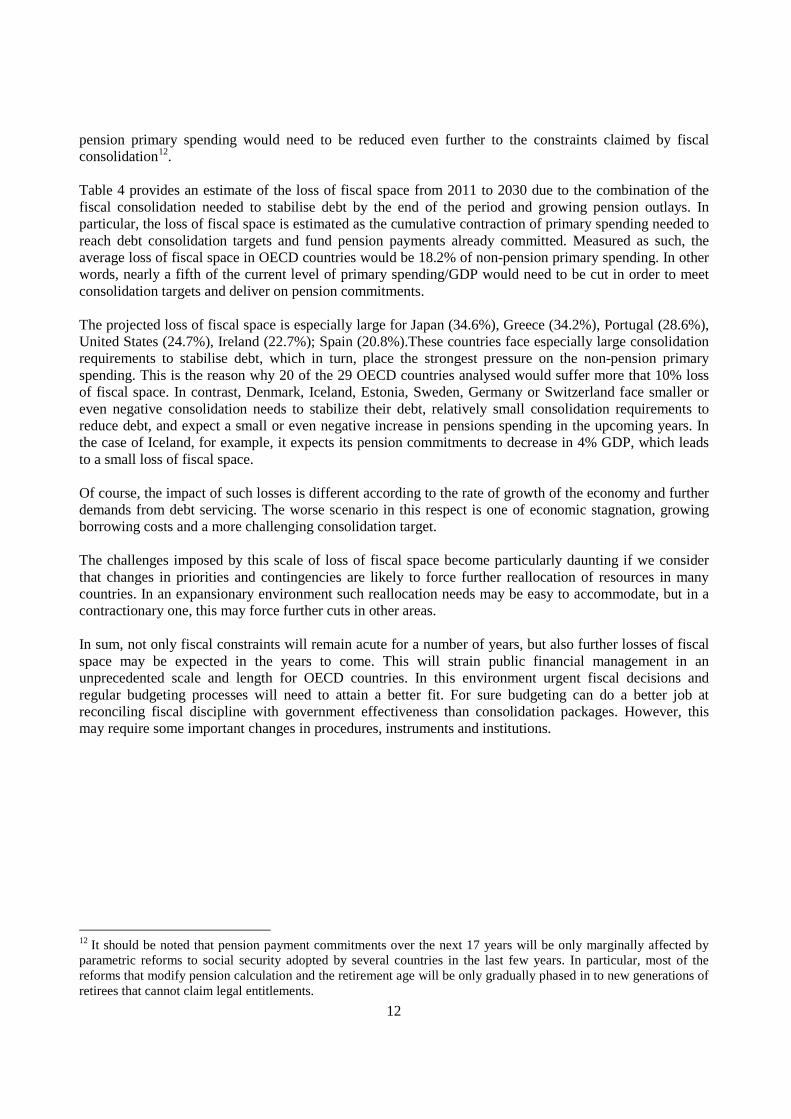
Table 4 provides an estimate of the loss of fiscal space from 2011 to 2030 due to the combination of the fiscal consolidation needed to stabilise debt by the end of the period and growing pension outlays. In particular, the loss of fiscal space is estimated as the cumulative contraction of primary spending needed to reach debt consolidation targets and fund pension payments already committed. Measured as such, the average loss of fiscal space in OECD countries would be 18.2% of non-pension primary spending. In other words, nearly a fifth of the current level of primary spending/GDP would need to be cut in order to meet consolidation targets and deliver on pension commitments. The projected loss of fiscal space is especially large for Japan (34.6%), Greece (34.2%), Portugal (28.6%), United States (24.7%), Ireland (22.7%); Spain (20.8%).These countries face especially large consolidation requirements to stabilise debt, which in turn, place the strongest pressure on the non-pension primary spending. This is the reason why 20 of the 29 OECD countries analysed would suffer more that 10% loss of fiscal space. In contrast, Denmark, Iceland, Estonia, Sweden, Germany or Switzerland face smaller or even negative consolidation needs to stabilize their debt, relatively small consolidation requirements to reduce debt, and expect a small or even negative increase in pensions spending in the upcoming years. In the case of Iceland, for example, it expects its pension commitments to decrease in 4% GDP, which leads to a small loss of fiscal space. Of course, the impact of such losses is different according to the rate of growth of the economy and further demands from debt servicing. The worse scenario in this respect is one of economic stagnation, growing borrowing costs and a more challenging consolidation target. The challenges imposed by this scale of loss of fiscal space become particularly daunting if we consider that changes in priorities and contingencies are likely to force further reallocation of resources in many countries. In an expansionary environment such reallocation needs may be easy to accommodate, but in a contractionary one, this may force further cuts in other areas. In sum, not only fiscal constraints will remain acute for a number of years, but also further losses of fiscal space may be expected in the years to come. This will strain public financial management in an unprecedented scale and length for OECD countries. In this environment urgent fiscal decisions and regular budgeting processes will need to attain a better fit. For sure budgeting can do a better job at reconciling fiscal discipline with government effectiveness than consolidation packages. However, this may require some important changes in procedures, instruments and institutions.
12 It should be noted that pension payment commitments over the next 17 years will be only marginally affected by parametric reforms to social security adopted by several countries in the last few years. In particular, most of the reforms that modify pension calculation and the retirement age will be only gradually phased in to new generations of retirees that cannot claim legal entitlements.

13
Table 4. Loss of fiscal space as percentage of non-pension primary spending.
Non-pension primary
spending (1)
Consolidation to stabilise debt (3)
Additional consolidation to reduce debt (4)
Expected increase in pensions spending (2)
Loss of fiscal space as % of non-pension primary
spending (5)
Denmark 49.8 -0.2 0.4 0.6 1.6%Iceland 39.7 1.6 3.1 -4.0 1.9%Estonia 29.8 1.3 0.0 -0.7 1.9%Sweden 41.9 0.9 0.4 0.5 4.3%Germany 31.9 -0.3 1.3 1.2 7.0%Switzerland 26.8 -0.1 0.2 1.8 7.1%Italy 29.6 1.9 1.8 -0.8 9.5%Czech Republic 34.0 3.2 0.2 -0.2 9.6%Hungary 34.3 3.2 1.1 -0.8 9.9%Korea 25.9 0.9 0.3 1.6 10.8%Poland 29.7 4.3 0.2 -0.9 12.2%France 39.6 2.7 2.2 0.3 13.2%Austria 34.5 0.9 1.2 2.6 13.6%Australia 30.8 3.7 0.0 0.7 14.1%Netherlands 42.9 3.0 1.2 2.3 15.1%New Zealand 40.5 3.8 0.3 2.0 15.1%Canada 34.5 2.4 1.3 1.6 15.3%Finland 42.3 2.7 0.8 3.5 16.6%Slovenia 37.9 4.2 0.3 2.1 17.4%United Kingdom 39.7 4.6 2.5 0.1 17.9%Luxembourg 33.8 1.1 0.2 4.8 18.0%Belgium 39.6 1.3 1.9 4.5 19.4%Slovak Republic 28.9 4.0 0.1 1.5 19.5%Spain 31.7 5.0 1.1 0.5 20.8%Ireland 40.2 4.5 3.2 1.5 22.7%United States 32.0 5.1 2.5 0.3 24.7%Portugal 32.5 6.0 2.6 0.7 28.6%Greece 30.0 7.1 2.6 0.5 34.2%Japan (6) 40.8 8.9 5.2 34.6%Average (7) 31.1 3.8 2.0 0.5 18.2%
1) Current primary spending is the 2011 general government expenditure minus the 2011 debt interest payments and 2011 public expenditure on pensions.2) Based on the projections of public expenditure on pensions, 2007-2060.3) Consolidation to stabilise debt is the average improvement in the underlying primary balance to 2030 (or 2040 for Japan) required to stabilise the gross government debt-to-GDP ratio, assuming consolidation in 2012-13 is consistent with the short-term projections described in Chapters 1 and 2 of the OECD Economic Outlook No. 91, and thereafter amounts to ½ percentage point of GDP per annum (1 percentage point of GDP in Japan). Fiscal consolidation projections are the consequence of applying a stylised fiscal consolidation path and should not be interpreted as a forecast.4) Additionalconsolidation to reduce debt is the average improvement in the underlying primary balance to 2030 (2040 for Japan) required to reach a target gross debt-to-GDP ratio of 60%, assuming consolidation in 2012-13 is consistent with the short-term projections described in Chapters 1 and 2 and thereafter amounts to 1 percentage point of GDP per annum (1.5 percentage points in the case of Greece, Ireland, Italy, Portugal, United States, United Kingdon and Japan). Some countries have not quite achieved the 60% debt target by 2030, but with the exception of Japan, it is close enough that it is achieved within a few yearsafter 2030 with little further consolidation. Countries with a projected debt ratio lower than 60% in 2013 are assumed to targettheir 2013 debt ratio. Fiscal consolidation projections are the consequence of applying a stylised fiscal consolidation path and should not be interpreted as a forecast.5) Loss of fiscal space is expressed as the percentage of the 2011 public primary spending for each country which includes three future financial obligations: the expected increase in pensions expenditure from 2010 to 2030, the consolidation measures required to stabilise debt to 2030, and the consolidation measures required to reach a target gross debt-to-GDP ratio of 60% until 2030. Note that loss of fiscal space for Japan includes only consolidation measures but not its pubic expenditure on pensions nor its projections.7) Weighted average considers all OECD countries, including those not analised in this table.
Source:- Economic Outlook No 91 - June 2012 - OECD Annual Projections.- Economic Outlook No 91 - Series levels.- OECD Social Expenditure Database (SOCX, www.oecd.org/els/social/expenditure). Note: Social spending aggregates based on detailed data for 1980-2009; aggregate spending projections for 20010-2012. Pension refer to old age and survivors cash benefits.- OECD Pensions Outlook 2012.- OECD Economic Outlook, Volume 2012 Issue 1 - No. 91.

14
III.2. Can current practices on budgeting deliver? Budgeting has traditionally been the main tool of fiscal policy in developed countries. Despite so, for many years budgeting was not an extremely sophisticated process, focusing on changes in the margins of spending rather than at the core of it. In the 1970s, Wildavsky defined this practice as “incrementalist budgeting” and explained it as a rational way of making hundreds of actors agree on thousands of budget lines in a very short period of time (Wildavsky, 1975). This gave budgets stability and political sustainability over time. In fact, continuous modification of budgets in the course of the fiscal year was more associated with developing, volatile countries.13
Incrementalist budgeting however does not guarantee efficiency in the allocation of resources and generates much inertia. For this reason, since the early 1960s policymakers have been trying to develop budget techniques that could sharpen the analysis of budget appropriations and link budget decisions with government performance. This led to the development of “Program Budgeting” (PPBS) in the 1960s (Schick, 1966; West, 2011) and “Zero-Based Budgeting” (ZBB) in the 1970s (Sarant, 1978; Lynch, 1990). As both methods disappointed practitioners on the grounds of their complexity and time requirements, these techniques gave ground to the so called “Performance Budgeting” or “Budgeting for Results” approach in the 1990s (Schick, 1995). The OECD has defined Performance Budgeting (PB) as “the use of performance information in the budget process”, where performance information includes indicators, targets, evaluations and benchmarks, among others (OECD, 2007). The OECD has provided a typology of PB modalities on the basis of the practical experience of countries, including: (i) a presentational modality, where performance information is only provided to legislators and the public for information and accountability purposes, with no linkage to funding decisions; (ii) a direct formula modality, whereby resource allocations are directly linked to performance results through an algorithm, and (iii) a performance-informed modality, whereby performance information is expected to be considered in a rather loose or indirect way in making budget decisions. While no country has applied any of these models in a pure state, it is fair to say that progress has been slow and with mixed results. This was already noted in an OECD assessment in 2005 that concluded that while countries had made improvements in the quantity of performance data over the previous decade, they were still struggling with issues like the quality and relevance of data, issues of attribution and in using performance information for budget decisions (Curristine, 2005). In this last regard, the study acknowledged that countries had not completely shifted away from inputs in preparing budgets, that performance measures were rarely used to eliminate programmes or to cut expenditure, and that recommendations from evaluations were only partially followed up by the sector and central authorities. It is thus no wonder that performance budgeting tools were of little use for budget adjustments when the crisis hit in 2008. In fact, progress in solving some of the problems encountered by performance management system was not only slow, but that it may have eroded support from ministries of finance usually pressed by urgent issues. It is not difficult to understand the reasons for this. While indicators have been the most used source of performance information, few funding decisions can be made on the basis of them, as they cannot respond to questions on the effectiveness and value for money of public programs; program evaluations, as opposed to spending reviews, were focused on fine tuning the programs rather than finding fiscal space and led in many countries by line ministries and agencies, and the interface with political prioritisation has been very weak.
13 Caiden and Wildavsky (1974) coined the term “repetitive budgeting” to refer to this practice.

15
The inability of indicators, monitoring, program evaluations and presentational schemes to contribute to fiscal consolidation measures, in the context of a more fundamental revision of the functions of states, is already taking a toll on PB. In the UK the comprehensive Public Service Agreements were largely abandoned as the basic steering tool and instead a more pragmatic and tailored approach is being put in place. Indeed, the major spending reductions in the UK were initiated on the basis of a comprehensive spending review that combined a technical value for money approach with a political prioritization process. In the US the Program Assessment Rating Tool was replaced by a new system that focuses on the role of the heads of central agencies in delivering particular goals in the short and medium term. Recently the Netherlands Ministry of Finance have changed their budget work by shifting from using performance indicators towards emphasising evaluations and spending reviews. These movements mirror the OECD survey in the direct linkage between performance indicators and budget appropriations being weakened and replaced by in-depth spending reviews as a major tool for overcoming information asymmetry and obtain knowledge about the efficiency and effectiveness of programs. But surely performance should be still relevant for public resource allocation and management. In a way, a focus on results is now more needed than before, as governments are expected to do more (or at least the same) with fewer resources. In fact, many innovations in public management and budgeting –most notably in New Zealand-- emerged from fiscal crises in the past, as governments devolved managerial authority to government agencies in exchange for better results. So it would be important not to throw out the baby with the bathwater. If past PB instrumentalization became inadequate in the current context, there may be a type of performance information and forms of using it that respond better to the challenges from continuingly shrinking fiscal space. III.3. Incrementalist responses The first to identify these emerging challenges and see their implications for public budgeting was Allen Schick. In a paper submitted to the OECD SBO network at the outset of the economic crisis Schick argued that the shrinkage of fiscal space called for budget officers to concentrate their efforts in expanding it and guarding it from backloaded spending commitments (Schick, 2008). To this end, he advocated an incrementalist approach so as to minimize conflict, political deadlock and frustration. In particular, he argued that,
“Budgeting is incremental because major reallocations are rare. At the margins, however, there are frequent shifts of resources, as new opportunities emerge and old ones recede. The shifts generally are not explicit –they do not overly pit programmes against one another in a competition for scarce funds. Nor do these shifts take money away from spending units. Instead, they are implicit, and savings are retained by the affected agency”14
.
Through this statement, Schick made evident that generating and allocating fiscal space is a substantial part of what budget officers regularly do across the world. Budget work routinely integrates generating and allocating fiscal space in a simultaneous exercise. This is reflected in the revision of cost estimates and standards, and in the challenging of sector assumptions. Instead of running against this culture, deeply rooted in budgeting procedures, surely ministries of finance and budget offices could intensify their scrutiny and make it more systematic in order to generate further fiscal space. This would devolve fiscal and budget specialists the responsibility for enlarging fiscal space instead of appealing to gain more flexibility or blaming others (line ministries, executives, members of parliament) for shrinking it. This was summarized by Schick by arguing that “the primary role of the central budget office should be as guardian and allocator of fiscal space”
14 OECD (2009), p. 444.

16
A number of alternatives are available to generate fiscal space in an incrementalist way in the regular budget process. This includes:
a) Deindexation. Almost all government budgets are formulated on a nominal basis. This means that base spending levels need are in many case expanded according to some price inflator. Even though some spending items are subject to automatic price adjustments (indexed pensions, etc.) the decision of applying price adjustments and the size of them is usually discretionary. In contrast, revenues tend to adjust according to inflation and their bases expand according to earnings, market prices, etc. Of course, inflation-adjusting below nominal price rises would mean a deterioration in the purchasing power of government resources, transfers and scaling down real activity, and this would eventually be noted by beneficiaries of public services, but in the short run it may be a less painful way of generating fiscal space.
b) Efficiency dividend. Some countries regularly impose across-the board marginal cuts in operational spending that increase the pressure across the public sector to increase efficiency while generating fiscal savings. This sometimes referred as a “tax” or “haircut”. Some sectors may be spared these on the grounds of necessity, priority or dependency on manpower. Partial replacement of personnel or no replacement at all can be seen as a particular modality of this. Of course, not all sectors may be equally efficient and the alternative cost in terms of volume and quality of services may substantially change from one sector to another. This is especially so in the case of partial staff replacement, as the reduction in staffing levels will not be equitable, hitting harder those sectors with workers that are older (replacement of retiring staff) or that have better market alternatives (voluntary retirement schemes).
c) Sunset clauses. A way of reducing the stickiness of public spending is to set a time limit to programs and/or legislation mandating them. Even if programs are judged as a priority and necessary, such limit –or sunset—gives an opportunity to revisit their justification, rationale and performance against expected results. The results of such assessment may lead to termination of the program, redesign or extension, depending on the findings and recommendations. The important feature of this approach is that it brings the assessment of the performance of a program back to those that introduced it, making it easier to judge it on the basis of the reasons that justified its creation in the first place. Of course this could generate some degree of uncertainty among administrators and beneficiaries, but this can be reduced by carrying out evaluations sufficiently ahead of the sunset date.
d) Pay-as-you go rules. The advocates of government programs are usually not confronted with their
opportunity costs. Pay-as-you-go rules try to correct this by conditioning the allocation of resources to new programs to the termination or reduction of others by a similar amount. In theory, this would not only keep a sector portfolio reasonably stable but should also ensure productivity gains, as to be justified, new programs should deliver more value for money than those that are being phased out. The main risk of this approach is political arbitrage, since government programs are not always valued for their contribution to social well-being but by their political impact. Thus, oftentimes, ministries propose cutting a program in the knowledge that they will be reinstated under political or legal pressure.
e) Evaluations. The main advantage of evaluations over performance indicators is that the former can lead to some clearer judgements on the justification, effectiveness and impact of government programs. Such judgements may provide a sounder basis for funding decisions, either to change the resources allocated to them or to condition such resources to program adjustments. The experience of OECD countries, however, is that this connection is far from automatic. Evaluations take time and they may not be able to capture the full impact of programs that operate under a

17
long-term horizon; conclusions and recommendations may be too general or vague to sustain budget decisions, and the political support to take action may be limited. These problems can be minimized by better synchronizing evaluations and budget decisions, by demanding from evaluators concrete recommendations on resource allocation, and by making evaluations public.
f) Spending reviews. Creating an effective spending review process requires a clear political mandate at level of the chief executive. Spending reviews must be seen as a solution to a political problem, rather than a technical bureaucratic exercise. The mandate should be to identify options for reductions to baseline spending, to reallocate spending and, if relevant, to enhance revenue in order to create fiscal space for new priority spending (Table 5). With regards to revenue measures it should be noted that, in general, spending reviews should not veer into tax policy. There may be cases, however, where non-tax revenue plays an important role in financing the effort or creating incentives for particular behaviour from citizens or institutions. The options proposed should be generated on the basis of sound research but ultimately decided upon by the Chief Executive/Cabinet or another politically delegated entity (e.g. a ministerial committee) during the budget process.
Table 5. A typology of spending reviews and performance evaluation
Source: I. Hawkesworth and K. Klepsvik ‘Budget tools to foster strategic agility: performance budgeting, spending reviews and productivity cuts’ Paper delivered at the annual OECD Meeting on Performance and Results 26-27 November 2012, Paris.
While many of the above mechanisms can be –and, indeed, have been-- used by countries to generate fiscal space on an ad-hoc basis, this would not add up to a strategy to expand fiscal space in the scenario described above. Instead, what would be needed is to incorporate such mechanisms into a planned, structured and continuing process involving the key actors in the budget process. In other words, the creation of fiscal space through mechanisms like the above should be mainstreamed into the regular budget process with a full involvement of budget officials. This would give this approach the cumulative force underlying Schick’s advocacy for incrementalist fiscal spacing. This approach would mean, for instance applying partial indexation and an efficiency tax on a regular, yet realistic, fashion as is done in a number of Nordic countries, Australia, New Zealand (see Appendix 1 of
Spending Review 1: Spending Review 2:Efficiency reviews Strategic review
Objective Create better programs broadly within the existing financial parameters
Create fiscal space: reallocate and/or reduce government expenditure for programmes or organisations
Create fiscal space: reallocate and/or reduce government expenditure for programmes or organisations
Focus Analysis - analyse management, structures and/or policy to improve efficiency and effectiveness
Efficiency - Identify how the existing policies can be conducted with less resource
Efficiency & prioritisation - Identify what the government should or should not do
Finland “Productivity Programme”(2005-15)
Australia “Comprehensive expenditure reviews”; “Strategic review” (2007)
Korea “Self-Assessment of the Budgetary Programme” (2005-)
Canada “Programme Review”(1994); “Strategic Review” (2009)
Netherland “Interdepartmental Policy review” (1982; 2009-present)
UK “Spending Review”(1998-present)
Fiscal Impact Usually none Limited except when applied widelyacross the public sector – e.g. theintroduction of shared service centers
Large, but dependent on political backingand will often encounter line ministerialand special interest group opposition.
Name Performance evaluations (programme, policy or organisational evaluation)
Examples

18
this document), This may also involve applying sunset clauses and/or pay-as-you-go to all new programs as the US did. The now-expired US ex ante spending rule used dollar denominated caps on annually appropriated spending, with pay-as-you-go (PAYGO) restrictions on the aggregation of spending mandated by permanent appropriations (mostly for programs with important automatic stabilization implications) and taxes.15
.
Similarly, evaluations should be organized in an annual evaluation program, analyzing a portfolio of programs every year with a battery of evaluation methods appropriately coordinated, very much like Mexico and Chile have been doing for the past 6 and 12 years, respectively. An evaluation program like this can aim at covering all government programs in a number of years –conveying a message of fairness—and can adapt evaluations to the features and needs under each program. Table 6 summarizes the main features, implementation mechanisms and potential effects on fiscal space of the six mechanisms outlined above if structured as part of the budget process. This includes also an indication of key actors that each mechanism needs to engage and how they can be linked to the different stages of the budget process.
Table 6. Mechanisms to create budget space in the budget framework
Source: Author’s estimates
As can be seen in the table, the actual operation of these mechanisms should indeed involve the Central Budget Office, but in many cases it would need the cooperation or support of other actors. Particularly in the case of an efficiency dividend, sunset clauses, PAYG and evaluations and reviews, cooperation or outright initiative of line ministries is essential for the effectiveness of such mechanisms. This makes
15 It was in effect an ex ante rule, rather than ex post rule as law makers had to keep within the caps as they were legislating. The enforcement of the spending caps constrained appropriations as they were enacted, and the enforcement of the PAYGO rule constrained the estimated future effects of changes in tax policy and in mandatory spending programs. The US system used across-the-board spending cuts (“sequesters”) to remedy policy overages shortly after they were enacted. The US expenditure rule was enacted at the start of fiscal year 1991, to replace the prior deficit-based rule. It continued in force, having been re-enacted twice, through to the end of fiscal 2002, when it expired. It was, however, overridden by statute numerous times in the last three years of its life, after helping the budget to leave fiscal deficit and enter surplus in the late 1990s (Anderson and Minarik, 2006).
Link to budget process
Deindexation Spending not automatically indexed by legislation or contract
CBO, MOF Formulation (nominalization of budget)
Limited and declining
Efficiency dividend Overhead, general services, operational spending
CBO, line ministries, executive agencies
Formulation (budget envelopes, ceilings)
Limited
Sunset clauses New programs CBO, CoG, line ministries
Programming, formulation (budget bidding)
Depends on pipeline of innovations
Pay-as-you-go rule New programs or expansion of existing ones
CBO, line ministries Programming Depends on pipeline of innovation and size of sector portfolio
Program spending
Sector portfolio
Mechanism Focus Key actors FS potential
Evaluations and reviews
CBO, evaluation office, line ministries
Evaluation, programming
Larger and medium-term

19
necessary to address the issue of incentives, since pure reallocation from the CBO is likely to be strongly resisted. One way of aligning incentives could be to link fiscal space generation with its allocation. In particular, fiscal space mechanisms should be seen not as a threat to the integrity of sector budgets, but as an opportunity to regain or even increase funding when the effectiveness of traditional programs is eroding. In other words, line ministries and program stakeholders should be given the opportunity to tap from the gained fiscal space. As for the connection to the budget process, Table 6 identifies concrete stages of the budget process where the proposed mechanisms could provide inputs to budget decision-making. These include the conventional five stages of budgeting (programming, formulation, approval, execution and evaluation) with some further distinction of specific operations performed in the formulation stage (setting budget enveloped, bidding for additional resources, integration and indexation). But even a structured and continuing programme like this may not provide an effective response to current and prospective fiscal spacing needs in many OECD countries. By acting upon public budgets, in the limited timeframe of the annual budget discussion the basis for efficiency gains, savings and reallocation may be too limited. This is largely due to the fact that most budget decisions that can be taken in this framework relate to a fraction of public resources, namely, that that is not mandated by permanent legislation or pre-existing contractual agreements. This fraction may change from one country to another depending on definitions and the structure of public spending. In the US for instance, “discretionary spending” is in fact the only subject of annual budget discussions, covering only 37% of total federal outlays in 2011, or 9% of GDP. The US definition, however, includes a number of programs and items that can only be adjusted at the margin, like the salaries of federal employees. This suggests that incremental adjustments to discretionary spending may cover only a fraction of fiscal spacing needs, even if they accumulate over time as suggested by Schick. For instance, if through the different mechanisms outlined above governments could generate a 5% annual saving on discretionary spending amounting to 20% of total government spending, after 10 years the average OECD government would have accumulated 4.5% of GDP.16
This is less than half the fiscal consolidation needed over the period 2009-2030 for countries like Japan, Greece, Portugal, United States, Spain, United Kingdom, and Ireland. If we assume that some of these tools may be exposed to declining returns as the search for savings start to cut into the bone of public administration, and that line ministries may learn how to game the system, such estimate may be even judged too optimistic.
IV. FISCAL SPACE BEYOND CONVENTIONAL EXPENDITURE MANAGEMENT IV.1. Expanding the scope of fiscal space generation The examples given in the previous section suggest that to rise up to the current fiscal challenges, countries may need to go beyond conventional budgeting in their search for fiscal space. This means not only regularly repeating the use of the proposed tools over several years (with the chance of declining returns suggested), but to go beyond it.
16 Considering an average in spending/GDP ratio of 45%.

20
Fiscal space can indeed be sought in a number of ways that involve expanding beyond the scope and the timeframe of annual budgets. Among others, this may include applying regular expenditure management frameworks to tax expenditures; to better scrutinize public-private partnerships to limit fiscal commitments and contingent liabilities; to apply zero-based budgeting techniques to programs in whole areas of government action in a time span exceeding the annual budget; implementing medium-term cost containment programs in key areas, and structuring a rigorous and open fiscal scrutiny of permanent legislation committing public resources in the future. Tax expenditures Tax expenditures are defined as exceptions to general tax rules that benefit certain taxpayers, transactions or revenues. 17
Such exceptions –commonly referred as tax breaks or tax exemptions— are usually established with some microeconomic purpose, expecting to promote some merit goods or to modify the behaviour of taxpayers in some economically or socially beneficial way. Of course, such objectives are very similar to those of many spending programs, however, unlike outright public spending, that is normally packed into programs (sometimes even with time limits) and scrutinized in the budget process, tax expenditures are usually adopted through permanent legislation written into tax codes, deducted from tax revenues, and rarely assessed against their intended benefits.
Tax expenditures have been created for a long list of purposes including promoting private investment; investing in clean technologies and research and development; fostering social responsibility and donations to charities; incentivizing education and a healthy lifestyle; taking businesses to lagging and remote regions, reading more books and newspapers, and so on. The list gets especially long in countries that are more supportive of private initiative and those that have enjoyed revenue windfalls from natural resources or other events. In many countries tax expenditures have accumulated over time and it is sometimes difficult to recall the objective that led to introduce them in the first place. Still, they are difficult to remove as they create influential interest groups that take them as an entitlement. The evident asymmetry in the transparency and scrutiny of tax expenditures has led fiscal experts and international bodies to advocate for some changes aimed at levelling the playing field with conventional spending. In particular, the IMF Code of Fiscal Transparency has proposed that “statements describing the nature and fiscal significance of central government tax expenditures (…) should be part of the budget documentation” (IMF, 2007). In turn, the OECD Best Practices for Budget Transparency proposes to that “tax expenditures should be disclosed as supplementary information in the budget” (OECD, 2002). Some countries have partly followed this advice. Austria, Belgium, France, Germany, US and the Netherlands include information on the expenditures as annexes to the annual budget, while Australia, Canada, Italy and UK include some information and analysis in reports and documents separated from the budget. Still, many countries do not report on tax expenditures in a regular and rigorous way. And even in the most advanced countries the use of such information in fiscal decisions still depends largely on political will, well behind the discipline and statutory procedures of annual budgets. So, time may be ripe to make tax expenditures subject to the same approval and review mechanisms than conventional spending. This would mean separating them as line items or programs in the budget; spelling out or reconstructing the logical framework supporting them; applying sunset clauses and pay-as-you-go rules; identifying measures to monitor their performance over time, and evaluating their impact, among others. These mechanisms should be applied on a regular basis, perhaps aiming at approving them
17 Tax expenditures are “provisions of tax law, regulation or practices that reduce or postpone revenue for a comparatively narrow population of taxpayers relative to a benchmark tax” (Anderson, 2008). For government, tax expenditure is a loss in revenue; for a taxpayer, it is a reduction in tax liability. Tax expenditures are better known in many OECD countries as tax reliefs, tax subsidies and tax aids (Schick, 2007a).

21
separately in the budget from regular revenue which, following also the advice of international organisations, should be reported on a gross rather than net basis. Potential gains from a more rigorous scrutiny of tax expenditures may have a non-negligible impact on fiscal space, as tax expenditures represent more than 4% of GDP18
in countries like Canada, Spain, the UK, the US (OECD 2010a, 2010b).
Public-private partnerships (PPPs) Since their beginnings in the early 1990s, PPPs have become increasingly popular as a way to mobilize private resources and expertise to provide public infrastructure to the community. In particular, PPPs have been defined as ways of delivering and funding public services using a capital asset, where project risks are shared over the long term between the public and private sector (OECD, 2008).19
OECD countries like the UK, Australia, Korea, Spain, Portugal, Mexico and Chile have made a very intensive use of PPPs in the last 15 years, utilizing this scheme to fund infrastructure investment and service provision in transportation (roads and railways), utilities (energy, water), social services (health, education and prisons), and even in ITC services. PPPs have been especially popular with developing countries, and both the World Bank and the UN have created special units to provide technical advice in setting up the institutional and operational bases of PPP programs.
PPPs have been promoted by governments for a number of reasons, some wrong, some right. In economic terms, PPPs should be used when they deliver higher value for money for the government than conventional public provision. This happens if the private provider can operate infrastructure at a lower cost and higher efficiency than the public sector, if it can absorb costs from the government and/or if it can recover costs better through tolls, tariffs or user charges. However, many countries have used PPPs as a way to sidestep spending controls. Such accounting and/or regulatory benefits, however, may take place at the expense of fiscal prudence. This is so because governments sometimes commit payments and fees or guarantees to make a PPP project viable that may escape the usual scrutiny of budgets. The latter are particularly serious, as they become contingent liabilities for the government that may be correlated with economic activity and government revenue. This is, for instance, the case when the government issues minimum traffic or revenue guarantees for roads on the basis of traffic estimates that may become unrealistic in an economic recession. To minimize these risks, and to promote an institutional structure that promotes affordability, value for money and safeguards the public interest, the OECD has issued a recommendation on the public governance of Public Private Partnerships. The OECD PPP recommendation provides a good basis for generating fiscal space with PPPs. In particular, PPP spending commitments and contingent liabilities should be publicized, and where they get to the point of significantly eroding value for money they should
18 Tax expenditure estimates are significantly limited for several reasons: tax expenditure definitions differ across countries due to differences in the definition of their benchmark tax systems, as many tax provisions are formulated as deductions, the value of tax expenditures typically depends on the level of the marginal tax rates, while some countries report estimates for all levels of governments, others only report those related to central government, countries vary in the coverage and detail of estimates that were reported to the OECD. 19 According to the OECD (2012a), PPPs are “long term contractual arrangements between the government and a private partner whereby the latter delivers and funds public services using a capital asset, sharing the associated risks”. According to the IMF (2006, 2004), PPPs “refer to arrangements where the private sector supplies infrastructure assets and services that traditionally have been provided by the government” while, according to the European Investment Bank (European Investment Bank, 2004), PPPs are “relationships formed between the private sector and public bodies often with the aim of introducing private sector resources and/or expertise in order to help provide and deliver public sector assets and services.”
22
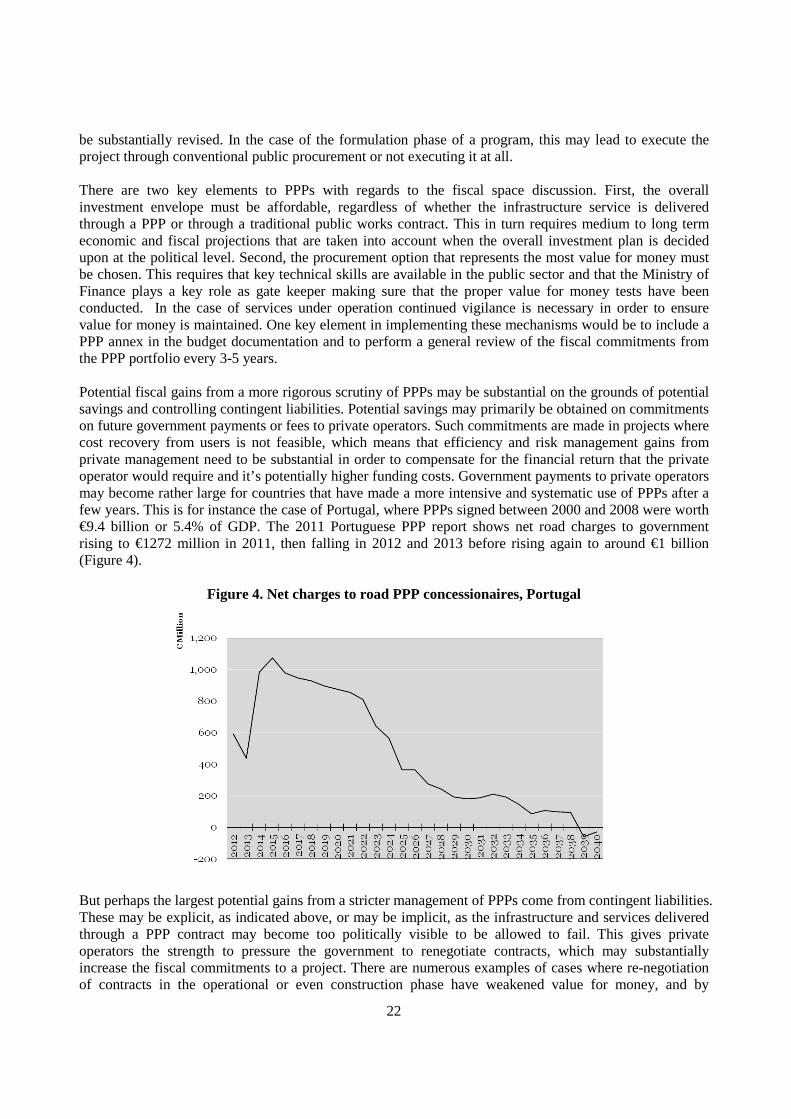
be substantially revised. In the case of the formulation phase of a program, this may lead to execute the project through conventional public procurement or not executing it at all. There are two key elements to PPPs with regards to the fiscal space discussion. First, the overall investment envelope must be affordable, regardless of whether the infrastructure service is delivered through a PPP or through a traditional public works contract. This in turn requires medium to long term economic and fiscal projections that are taken into account when the overall investment plan is decided upon at the political level. Second, the procurement option that represents the most value for money must be chosen. This requires that key technical skills are available in the public sector and that the Ministry of Finance plays a key role as gate keeper making sure that the proper value for money tests have been conducted. In the case of services under operation continued vigilance is necessary in order to ensure value for money is maintained. One key element in implementing these mechanisms would be to include a PPP annex in the budget documentation and to perform a general review of the fiscal commitments from the PPP portfolio every 3-5 years. Potential fiscal gains from a more rigorous scrutiny of PPPs may be substantial on the grounds of potential savings and controlling contingent liabilities. Potential savings may primarily be obtained on commitments on future government payments or fees to private operators. Such commitments are made in projects where cost recovery from users is not feasible, which means that efficiency and risk management gains from private management need to be substantial in order to compensate for the financial return that the private operator would require and it’s potentially higher funding costs. Government payments to private operators may become rather large for countries that have made a more intensive and systematic use of PPPs after a few years. This is for instance the case of Portugal, where PPPs signed between 2000 and 2008 were worth €9.4 billion or 5.4% of GDP. The 2011 Portuguese PPP report shows net road charges to government rising to €1272 million in 2011, then falling in 2012 and 2013 before rising again to around €1 billion (Figure 4).
Figure 4. Net charges to road PPP concessionaires, Portugal
But perhaps the largest potential gains from a stricter management of PPPs come from contingent liabilities. These may be explicit, as indicated above, or may be implicit, as the infrastructure and services delivered through a PPP contract may become too politically visible to be allowed to fail. This gives private operators the strength to pressure the government to renegotiate contracts, which may substantially increase the fiscal commitments to a project. There are numerous examples of cases where re-negotiation of contracts in the operational or even construction phase have weakened value for money, and by
23
implication affordability of PPPs. Guasch (2004) found that out of more than 1000 concessions granted in Latin America and the Caribbean from 1985-2000 renegotiation of the initial contract took place in 55% of transportation concessions, an average of three years after their reward. The majority of these renegotiations were initiated by the private side and involved an increase in tariffs in 62% of the cases, delays in investment obligations in 69% of the cases and reduced fees paid by the private side to the public sector in 31% of the cases (Guasch, 2004; Meany and Hope, 2012). There is little to assume that the situation in most OECD countries is very different.20
Zero-based budgeting (ZBB) ZBB emerged in the 1970s as a more rigorous alternative to PPBS, which could respond better to the fiscal pressures that emerged with the oil crises. ZBB consists of discussing funding for ongoing programs as if they were being created, asking fundamental questions on their justification and key design and operational choices. This should create the basis for comparisons across programs and more drastic funding decisions, including termination and reallocation of resources. While ZBB was technically appealing, it did not fit well with a budget process framed by political priorities and time constraints. In other words, there was not enough time to apply this kind of analysis to all government programs within the time scope of budget preparation and when it happened, conclusions were not feasible either on the grounds of sunk costs or due to lack of political support. This led governments to abandon or to replace it by simpler versions. Still, ZBB survived in the private sector and many companies, especially from industries experiencing abrupt transformations, have applied it to our days. For those companies, the ZBB approach allows top-level strategic goals to be built into the budgeting process by tying them to specific functional areas of the organization, where costs are first grouped, then measured against previous results and current expectations. This process gives top management the opportunity to judge the performance of managers and teams, creating the possibility of radically redesigning their cost structures, cutting spending on support functions while boosting efficiency and competitiveness. ZBB starts by re-envisioning the business and asks what activities and resources are needed to compete under current and future market conditions (Cichocki, et al., 2012). As ZBB takes a considerable amount of time companies have solved this problem by creating a rolling budget every year and perform a zero-based budget every three to five years, or when a major change occurs within the operation. This allows an organization to benefit from the advantages of zero-based budgeting without an excessive amount of work. From this it may distil that ZBB may still be feasible if performed outside the regular budget process, with appropriate time for analysis and implementation, very much like in the private sector. One concrete way of doing this would be applying ZBB as a series of overlapping 2-3 year exercises targeted at larger programs or to a set of programs aimed at the same objective. The screening process should include a clear identification of the program(s) to be analyzed, addressing the classical set of questions of ZBB on the justification and alternatives to a program, agreeing on a set of concrete actions –including funding—and their implementation in a multi-year framework. Overlapping this work means that at every point in time there would be exercises in different sectors at different stages of development. 20 One famous case of renegotiation that was handled well is the Sydney Cross City Tunnel. Demand risk had been transferred to the consortium but user demand proved weaker than expected. The government subsequently came under strong pressure to bail out the consortium (i.e. assume the demand risk). In the end the project did not receive a bail out and the PPP was reconfigured on a sustainable scale (Graham, D. 2010). Importantly the same terms applied (the contract stayed in place, there was no change in risk allocation, no change in pricing formula and all private sector obligations were transferred to the new owners).

24
To be coherent and effective, a scheme like this has to clarify two issues: (i) what differentiates it from evaluations that are currently performed by several countries, and (ii) how would it connect with the regular budget process. On the first point, ZBB differs from evaluations on the grounds of its explicit funding focus and on its organisation around specific program objectives. The key questions that ZBB ask is whether government should be pursuing a certain objective and whether it would be done in the same way if the program(s) to attain it were just being created. On the connection with the regular budget process, it should be evident that this type of exercises –including also evaluations, reviews and the cost-containment programs depicted below—require a further formalisation of the evaluation and programming phase of the budget cycle, perhaps even requiring restructuring of existing institutions. These issues will be developed further in the next section. It is difficult to assess the potential gains from an overlapping ZBB scheme, as its advantages come more from the methodological side, covering more of less the same pool of spending that can be analyzed through program evaluations. It would appear that there are clear synergies to be harvested by combining the approaches of ZBB with the strategic spending reviews. Indeed their objectives and to a great extent methods appear to be overlapping. The key element of the strategic review is the political mandate to deliver concrete proposals for saving. Combining such a mandate with ZBB rigour may fit well; arguably this approach has been applied in a number spending reviews as noted above. Cost containment programs Spending on some government programs is not driven by priorities or objectives but by costs. This is particularly true of sectors that strongly rely on powerful providers, be them either professionals/specialists, contractors or private suppliers. In these cases, industrial organisation may play strongly against the public interest, extracting considerable resources through creeping cost pressures. In those cases, governments may need to design strategies to prevent such pressures or to put themselves in a better bargaining position. A good example of the above is health in the US. The cost of health has been a highly visible topic of discussion or many years. Health care spending has been rising as a share of national income for decades and is projected to keep rising from 10% in 1985 to 17% in 2010 to nearly 25 percent in 2037. In recent years, a variety of health policy innovations and experiments have been put into place in the US to improve quality, control cost and expand coverage. The Patient Protection and Affordable Care Act, signed into law in March 2010 aims primarily at expanding health insurance coverage to more than 30 million uninsured US citizens without increasing the deficit, and it makes an important start on reining in the rapid growth of health care costs. Both government and private insurers have instituted cost containment measures designed to limit payments made to providers of health care services. A cost containment strategy should take a medium-term perspective, be prepared to persist and to adapt over time. It requires reviewing areas that previously were considered “off limits” or “out of scope”. In the case of private companies, the CEO and the board of directors are expecting fast cost reduction results without disruption of the company operations so cost containment initiatives require extreme collaboration among the functional groups. Potential savings from well-designed cost containment strategies may be substantial. If we consider only the health sector, OECD projections estimate that heath spending will increase rapidly over the next 50 years. In a cost-pressure scenario, which assumes no stepped-up policy action, health spending could reach 14% of GDP in 2060; in a cost containment scenario, however, it is projected to reach 9.5% in 2060 (OECD, 2012b).
25
Permanent legislation In all OECD countries the largest portion of public spending is not mandated by discretionary budget decisions but by permanent legislation. This is the case for most of social protection, which takes up about one third of general government spending, and for substantial parts of education, health and public order and safety, which take another third. These expenditures remain mostly untouched by budgets on the grounds that the latter have only an annual scope; even if some dimension of spending is modified in the annual budget, the modification is temporary compared to the permanent regulations written into legislation. Permanent legislation limits legislatures’ ability to review and change spending priorities in several ways. Although it is always possible for new legislation to alter current law, in practice, the many steps needed to pass new legislation, and potential opposition from parties in society who may be negatively affected by changes to legislation, render change difficult to achieve. Legislation that creates a permanent appropriation allows the recipient to spend money without further action by the legislature. Even when permanent legislation provides for funding to be carried out through the annual appropriations process, it may effectively mandate the appropriation so that the legislature can make little or no changes to the amount of funding. This is the case for example for Medicaid spending in the United States. Given the size of these entitlements, some legislatures have sought greater control over their growth through the budget process. In Sweden, for example, the expenditure ceilings set by the Riksdag have been extended to cover existing entitlements, including the old-age pension system which is not part of the central government budget. Should spending on existing entitlements exceed these ceilings, the government is required to submit supplementary budgets to the Riksdag for approval. The Italian legislature must also approve spending overruns for entitlement programmes. These legislatures may have little choice but to approve supplementary spending but they at least have the opportunity to express their own policy concerns in the process. Budget officials regularly complain about the limited flexibility that budgets have due to the weight of permanent legislation. The latter, however, is part of the political game and a choice of society, as many functions of the state are defined as permanent and some benefits are established as a right. Whether budget officials like it or not, such decisions take priority over their authority to shift resources in the budget exercise. The real problem comes when the fiscal implications of permanent legislation are not properly weighted at the time of discussing it. In fact, ddespite its fiscal importance, permanent legislation is usually not subject to the same scrutiny as annual budget appropriations. This problem increases when the pattern of spending mandated by permanent legislation is not evenly distributed over time. It is not uncommon to see legislative proposals that involve little spending in the immediate future but create huge commitments in the longer run. This makes the risk of time inconsistency of fiscal decisions considerably larger. There are a number of tools and procedural rules that can make the fiscal examination of permanent legislation more rigorous. Legislative proposals that have a fiscal impact tend to be formally approved or endorsed by the Ministry of Finance and analyzed separately by parliamentary finance committees; in some countries members of parliament can only vote up or down but not comment the proposals from the executive that have a fiscal impact; legislative proposals may be preceded by white papers that analyze their fiscal impact; draft legislation may be informed by memoranda on their fiscal implications; independent fiscal institutions (e.g. the United States Congressional Budget Office (CBO), Canadian Parliamentary Budget Officer (PBO), Korean National Assembly Budget Office (NABO), the Netherlands Bureau for Economic Policy Analysis (CPB), Sweden’s Fiscal Policy Council, and the United Kingdom’s Office for Budget Responsibility among others) may be called upon to provide independent estimates of the fiscal implications of proposed legislation; implementation of legislation may be conditional on the
26
availability of resources with the possibility of the government postponing it if there is not appropriate funding, or legislation may include provisions to adjust key parameters to ensure fiscal sustainability. The key to an effective management of fiscal commitments through permanent legislation does not stop at having one or more of these mechanisms in place, but extends to articulating them to ensure the appropriate checks and balances, to be able to consider alternative scenarios for the obligations undertaken by a program, and to have some safety valves in case that things go wrong. The growing fiscal pressures from demographic transition have fostered some progress in this direction. Nowadays, pension decisions are regularly informed by actuarial studies, usually carried by independent specialists or international organizations, which include alternatives to baseline scenarios. In addition, a number of countries are following the example set by Sweden in the 1990s, when the country converted a two-tier defined benefit scheme dating from 1960 into a combination of notional defined contribution, pay-as-you-go and financial defined contribution schemes (Palmer, 2000). This reform created a mechanism to automatically adjust the retirement age to guarantee the actuarial balance of the system in the presence of demographic change. Beyond these examples of good practice however, there is still a lot lo share and learn among countries, as the study of the institutions that shape fiscal decisions embodied into permanent legislation is far less developed than the analysis of budgets. Table 7 depicts some features of the five mechanisms outlined above. The table reaffirms the idea that these mechanisms carry a greater potential to generate fiscal space, but that this may change significantly from one country to another, as tax expenditures, PPPs and cost-pushed programs may change significantly in their weight, due to the choices of governments in policy design and delivery. ZBB exercises and fiscal assessments of permanent legislation may have a more universal impact.
Table 7. Mechanisms to create budget space beyond the annual budget framework
Mechanism Focus Key actors FS potential Risks/challenges
Rationalisation of tax expenditures
Tax expenditures CBO, tax administration, legislature
Large in some countries (US, Mexico)
Cooperation from legislature, resistance from pressure groups
PPP portfolio reviews
Fiscal commitments and contingent liabilities from PPPs
MoF, CBO, PPP unit Large in some countries (Spain, Portugal, UK, México, Chile)
Contract inflexibility, sunk costs
Overlapping zero-based budgeting exercises
Large programs Set of programs aimed at same objective
MoF, CBO, CoG, line ministries, Evaluation Office
Larger and medium-term, potentially overlaps with evaluations and reviews
Resistance from pressure groups, cooperation from line ministries
Cost containment programs
Cost-push in supply-driven areas
CBO, line ministries, procurement authority, competition authority
Large in some sectors (health, defense)
Resistance from pressure groups, cooperation from line ministries
Fiscal sustainability of new legislation
Permanent legislation with fiscal implications
MoF, CBO, legislature, Independent Fiscal Institutions
Large Cooperation from legislature, autonomous expertise
Source: Author’s analysis Table 7 suggests that in order to realize this fiscal spacing potential, however, some further effort needs to be done to involve actors beyond the CBO, and to respond to implementation challenges. Comparison with Table 6 should make clear that more actors are needed to seek fiscal space beyond the regular budget process. These includes some existing government bodies, like the tax administration, procurement and
27
competition authorities as well as some bodies that may need to be created, like a PPP unit21, an evaluation office or an independent fiscal institution22
. Some of these mechanisms would also require cooperation from the legislature, which may make necessary to involve the political authorities in the area of public finance. Beyond the willingness of legislators to cooperate, this may also require to build the procedures and the bodies to do so, as in many countries parliamentary budget committees are convened only for the annual budget discussion.
Table 7 also identifies some risks and challenges involved in these mechanisms that require an additional effort in setting them up. Most of such risks originate in the special interests nurtured by some fiscal benefits, especially those that are less visible, like tax expenditures and cost pressure from providers of essential services. In the case of PPPs providers may gain considerable power once projects gain political priority and sunk costs make a turnaround economically costly and politically embarrassing. To face these challenges and rationalize spending it may be necessary to gain the support of political authorities and legislators. Public disclosure of reviews, assessments and audits may help in this regard. However, the specialized, independent and technical expertise may not be easily available, and undertaking a fiscal spacing program like this may require addressing institutional needs from the start. IV.2. Analytical and institutional challenges The mechanisms outlined above should not be seen as an alternative to performance budgeting, but an elaboration on this concept. Creating fiscal space should not be an objective in itself but a way of safeguarding and mobilising scarce public resources to priority objectives. In fact, the existing tools of PB, the incremental mechanisms of section III and the expanded mechanisms proposed in this section should be seen as part of the same toolbox, aimed at optimising public policy results within a hard budget constraint. Still, if one of the limitations of the experience with PB in OECD countries has been the ability to feed into concrete budget decisions, such risk may be also relevant to the expanded toolbox. It is not enough that the proposed additional mechanisms have a greater potential to generate fiscal space to be considered by the actors of the budget process, especially if they operate outside the budget process; additional analytical, operational and institutional support may be needed for evidence and decision-making definitely connect. Analytical challenges On the analytical side, the main effort to be made is to strengthen the link between annual budgets and medium-term fiscal scenarios. If fiscal space is defined in a medium-term horizon, it refers not only to today’s fiscal space, but also to tomorrow’s.
21 Given the complexity of PPPs and their somewhat infrequent use, critical skills to ensure value for money may need to be concentrated in a PPP Unit that is made available to the relevant authorities. A PPP Unit’s function can be pursued by a number of complementary units. The PPP Unit can fill gaps in terms of specific skills, a lack of coordination or high transaction costs. Institutional shortcomings should be addressed taking the country’s needs and current institutional context into account. The PPP Unit should enable authorities (e.g. line ministries) to create, manage and evaluate a PPP efficiently and effectively (OECD, 2012a). 22 Independent fiscal institutions (IFI) are a growing phenomenon in OECD member countries. Particularly in the wake of the financial crisis, governments (as well as regional and international bodies and academic circles) are looking to IFIs as a way to enhance fiscal discipline and promote greater transparency and accountability. In the past decade alone, a diverse group of IFIs have sprung up in Korea (2003), Sweden (2007), Canada (2008), Hungary (2009 but effectively abolished as of 2011), Slovenia (2010), the UK (2010), and Australia, Ireland, Portugal, and the Slovak Republic (2011-2012) (OECD, 2012c).
28
Many OECD countries have been developing medium-term fiscal scenarios for some time. Medium-term frameworks typically cover a period of three to five years and aim to improve fiscal consolidation by combining prescriptive yearly ceiling with descriptive forward estimates. Estimates are calculations on how expenditure, revenue and the aggregate fiscal position will turn out under certain assumptions. Ceilings are targets set by the government regarding aggregate or policy area spending annually over the medium-term. Many OECD countries have introduced multi-year forward estimates (baselines) into the annual budget preparation process since the late 1970s and early 1980s. Today they are presented to the legislature in 32 OECD countries. In preparing forward estimates, about one-third (12) of OECD countries present forward estimates at an aggregate level to the legislature, five prepare them at a ministry level and eight at a line-item level. In other cases, Iceland’s forward estimates are prepared at a functional level within each ministry, while in Portugal they are prepared along programme lines. Medium-term expenditure estimates may be prepared at a greater level of detail than those presented to the legislature as part of the budget approval process. In Finland, for example, medium-term expenditure estimates are prepared for three years at line-item level but the information is only presented to the legislature in summary form. However, this same set of data reveals differences in the approach that different countries take to these scenarios. Some countries have tended to develop them as multi-year budgeting scenarios, involving both the MoF and/or CBO and line ministries, while others see medium-term scenarios as simulation exercises, including the financial impact of key sector policy choices. A third group of countries have developed medium-term expenditure frameworks, confronting existing commitments with the government’s overall fiscal constraint. The last type of exercise seems to be more appropriate for a multi-year analysis of fiscal space. With the development of the great recession the attention of many analysts and policymakers has turned to matters of fiscal sustainability. The latter is commonly defined as a situation in which a borrower is expected to be able to continue servicing its debts without an unrealistically large future correction to the balance of income and expenditure (IMF, 2002). As illustrated in section 2, this is very much the time span taken by OECD projections of fiscal consolidation needs, from which our conclusions on the need of fiscal space have emerged. Fiscal sustainability analysis requires longer-term projections than conventional 3-5 years medium-term frameworks. Usually fiscal sustainability is analyzed over 10-20 year horizons, matching the maturities of government bonds. Such long-term projections can capture patterns of spending that change gradually and cumulatively over time, like spending on pensions, health and education, reflecting not only government policy but also demographic trends. In the case of pensions and health, many countries have performed even longer term analysis to capture the full extent of the impact of demographic transition, sometimes built into actuarial studies. These may provide a good guidance for fiscal commitments and entitlements enacted through permanent legislation that press fiscal space. The longer the horizon of fiscal analysis, the more sensitive it becomes to projection assumptions and methodologies. For this reason, many such projections include a range of scenarios around a central or baseline projection. Such scenarios may take into account policy decisions, external parameters and the medium to long-term behaviour of government revenues. From a fiscal space perspective, alternative scenarios may provide a feeling of its vulnerability. The central problem with multi-year budgeting exercises is the definition of spending limits, as they require assuming fiscal policy choices. The existence of fiscal policy rules may help solve this problem. Many countries have been adopting such rules in recent years, the most prominent of which being the

29
adoption of a fiscal rule structure under the “Fiscal compact” agreed by leaders of European countries in early 2012. Some fiscal rules can, in addition, be linked to long term sustainability objectives. Fiscal rules have special significance for fiscal space analysis and generation since they give more certainty at least on one side of the equation –spending ceilings-- allowing work to concentrate on the commitments toward such limits. Operational adjustments On the operational side, the main concern is how to ensure that the evidence from the expanded fiscal spacing mechanisms is actually used to support budget decisions. This may require revisiting the budget cycle to identify when, how and by who are those critical decisions adopted and what changes could be made to ensure that (a) information is both timely and pertinent, and (b) that procedures allow giving it full attention. This should include, first, to enrich and to give proper attention to the evaluation phase of the budget cycle. Evaluation is routinely depicted as a phase of the budget but in many countries it is not given the necessary timing, inputs and attention it deserves. Some countries, like the Netherlands, Chile and the UK have acknowledged this and adjusted the programme of work in the executive branch and legislature to pay due attention to it prior to the submission of the next budget. As the experience of these countries indicates, this may require building a proper agenda for the evaluation phase of the budget, establishing how the evidence will be analyzed and how the conclusions from that analysis will be extracted and transmitted to the next phases of the budget cycle. But the main adjustment that may be needed is to give proper and specific attention on fiscal spacing prior to the resource allocation of resources. We have already noted that the most comment practice in CBOs today is to examine, challenge and negotiate cost estimates as part of the preparation of the budget. Yet this is done at the sector level, in an integrated exercise with resource allocation. In such a setting, if cost revisions generate some savings, these are easily absorbed by higher levels of activity or to solve funding needs in other programs of the same sector. This simultaneity compromises both the generation of fiscal space and the improvement of results, as many decisions are made as ‘internal deals’ with little room for evidence and analysis. One possible improvement to the budget process could be to: (i) further separate fiscal space generation from allocation, and (ii) to use this space to allocate resources in a more competitive way across sectors and ministries. In particular, the evaluation phase of the budget should be seen as an exercise to identify sources of fiscal space, using evidence from the toolbox proposed here. Once such sources are identified, sector budgets could be reduced to minimum statutory levels, deducting efficiency dividends and the resource allocation to programs and services where opportunities for rationalization have been identified through evaluations, expenditure reviews and ZBB exercises. The difference between the global expenditure ceiling, determined by fiscal policy, and this minimum level of expenditure would provide the fiscal space to be allocated in a second step. To allocate fiscal space, instead of defining sector spending ceilings, bids from ministries and agencies could be brought to a more open and competitive process. This process can be regulated to increase the evidence and commitments behind proposals. For instance, budget bids may be required to include a technical justification and tracking to key government objectives to provide evidence for decisions. Ex-ante evaluation may be reinforced in this process, including a rigorous analysis of the benefits and costs of direct service delivery, contracting out to the private sector and inducing change through regulation.

30
Programs that reduced their funding in the first phase should not be prevented from bidding to recover their funding in the second –which may reduce resistance to fiscal spacing—but in order to to so they would have to make a better case and clear commitments for improvement. Institutional rebalancing Adjustments to the budget formulation process should take into account the need to balance between top-down fiscal discipline and bottom-up optimisation of resource allocation. Such balance also impinges into the roles of different actors in the budget process. In this regard, it should be noted that efforts to increase fiscal space are not about centralising power at the level of the CBO or the MoF. Quite the contrary, they assume that these bodies cannot resolve fiscal policy and government effectiveness objectives on their own. The true root of fiscal discipline is that austerity and government efficiency are owned by a critical mass of stakeholders that influence the budget process. This point has been recently emphasized by Schick: “The lesson from disciplined countries is that each country must summon the will to make and live by rules, to be fiscally prudent, to strive for results, and to pay attention to program effectiveness in spending public money. Outsiders can guide and prod, but the most important quality is that government leaders, program managers, and citizens yearn to do the right thing” (Schick, 2012). This means that fiscal discipline should be valued by a critical mass of budget stakeholders, who may be essential to developing the type of fiscal spacing mechanisms outlined above. In addition to aligning incentives in the ways suggested above, special attention should be paid to the enforcement of budget commitments and agreements. The counterpart to the contribution of fiscal spacing to the ability to comply with fiscal policy targets is to reduce the uncertainty of line ministries and agencies on the future funding of key programs and services. In this regard, the commitment of the latter to deliver on performance standards should be mirrored by a commitment of the budget authority to provide the agreed levels of funding, especially when both are backed by an evaluation, an expenditure review or a ZBB exercise.
Openness and reciprocity may contribute to give fiscal spacing mechanisms the legitimacy they need to persist over time, if they are to operate beyond the immediate emergency. One further element that may contribute to this end is fairness in the treatment of different policy areas. One problem that has been observed in the current practice of many countries is that performance indicators and evaluations tend to concentrate disproportionately in certain policy areas. For example, based on the results of the OECD 2005 questionnaire on performance information, Curristine (2005) found that there are notable concentrations of performance measures and evaluations in health and education, followed by finance/budget and justice, while considerable less attention in areas like security, defence and foreign affairs. In this regard, opening up the range of instruments and mechanisms for fiscal spacing in the way proposed in this paper should substantially broaden and balance the examination of different sectors and policy areas. Fairness and legitimacy may be further enhanced by ensuring objectivity in the way evidence is raised and analyzed. In this regard, there is a distinctive trend in OECD countries towards the creation of specialized, independent bodies that provide key inputs to fiscal assessments, either at the macro or micro level. These include independent fiscal institutions (mentioned earlier) which are expected to provide a technical non-partisan oversight and analysis of, and/or advice on, fiscal policy and performance. By acting as a watchdog on fiscal targets, IFIs can give the different actors of the budget process a clear notion of the limits within which commitments have to be delivered and fiscal space should be created and allocated.
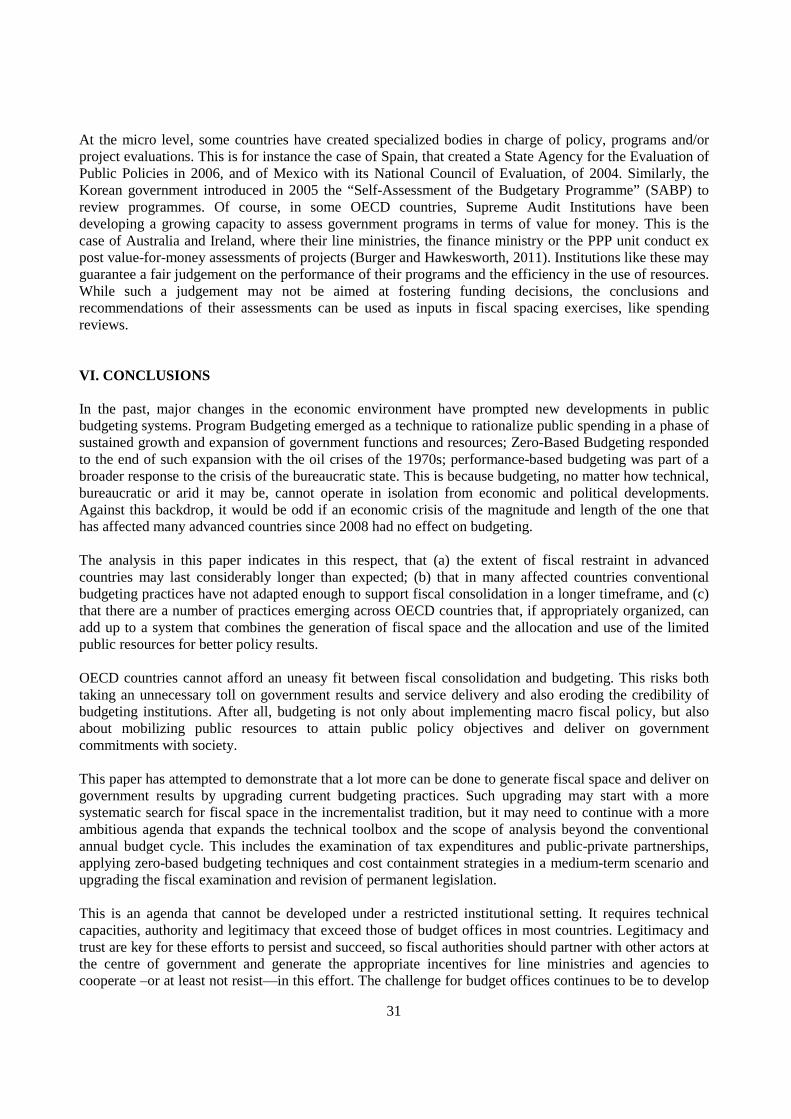
31
At the micro level, some countries have created specialized bodies in charge of policy, programs and/or project evaluations. This is for instance the case of Spain, that created a State Agency for the Evaluation of Public Policies in 2006, and of Mexico with its National Council of Evaluation, of 2004. Similarly, the Korean government introduced in 2005 the “Self-Assessment of the Budgetary Programme” (SABP) to review programmes. Of course, in some OECD countries, Supreme Audit Institutions have been developing a growing capacity to assess government programs in terms of value for money. This is the case of Australia and Ireland, where their line ministries, the finance ministry or the PPP unit conduct ex post value-for-money assessments of projects (Burger and Hawkesworth, 2011). Institutions like these may guarantee a fair judgement on the performance of their programs and the efficiency in the use of resources. While such a judgement may not be aimed at fostering funding decisions, the conclusions and recommendations of their assessments can be used as inputs in fiscal spacing exercises, like spending reviews. VI. CONCLUSIONS In the past, major changes in the economic environment have prompted new developments in public budgeting systems. Program Budgeting emerged as a technique to rationalize public spending in a phase of sustained growth and expansion of government functions and resources; Zero-Based Budgeting responded to the end of such expansion with the oil crises of the 1970s; performance-based budgeting was part of a broader response to the crisis of the bureaucratic state. This is because budgeting, no matter how technical, bureaucratic or arid it may be, cannot operate in isolation from economic and political developments. Against this backdrop, it would be odd if an economic crisis of the magnitude and length of the one that has affected many advanced countries since 2008 had no effect on budgeting. The analysis in this paper indicates in this respect, that (a) the extent of fiscal restraint in advanced countries may last considerably longer than expected; (b) that in many affected countries conventional budgeting practices have not adapted enough to support fiscal consolidation in a longer timeframe, and (c) that there are a number of practices emerging across OECD countries that, if appropriately organized, can add up to a system that combines the generation of fiscal space and the allocation and use of the limited public resources for better policy results. OECD countries cannot afford an uneasy fit between fiscal consolidation and budgeting. This risks both taking an unnecessary toll on government results and service delivery and also eroding the credibility of budgeting institutions. After all, budgeting is not only about implementing macro fiscal policy, but also about mobilizing public resources to attain public policy objectives and deliver on government commitments with society. This paper has attempted to demonstrate that a lot more can be done to generate fiscal space and deliver on government results by upgrading current budgeting practices. Such upgrading may start with a more systematic search for fiscal space in the incrementalist tradition, but it may need to continue with a more ambitious agenda that expands the technical toolbox and the scope of analysis beyond the conventional annual budget cycle. This includes the examination of tax expenditures and public-private partnerships, applying zero-based budgeting techniques and cost containment strategies in a medium-term scenario and upgrading the fiscal examination and revision of permanent legislation. This is an agenda that cannot be developed under a restricted institutional setting. It requires technical capacities, authority and legitimacy that exceed those of budget offices in most countries. Legitimacy and trust are key for these efforts to persist and succeed, so fiscal authorities should partner with other actors at the centre of government and generate the appropriate incentives for line ministries and agencies to cooperate –or at least not resist—in this effort. The challenge for budget offices continues to be to develop

32
the skills to use performance and cost information for budgeting decisions and to adapt budget procedures to inform funding decisions, but such information may originate in deeper and more specialized work performed elsewhere. This complementarity is especially relevant with analyses and assessments that extend beyond the annual budget cycle. Generating fiscal space through an enhanced budgeting system should not be seen as replacing political decisions, fiscal consolidation from the revenue side or performance-based budgeting. Politicians have indeed the final say in the allocation of fiscal space or at least in establishing the priorities that guide it. Authorities and legislators should be informed and have a say on the findings of evaluations, benchmarking exercises, performance assessments, cost-push forces and containment needs and zero-based budgeting analyses. Indeed, as many political leaders are currently setting fiscal policy commitments they need to be aware of what they mean for public service delivery and how social costs can be mitigated. One key political decision is, in fact, how to combine revenue enhancements with spending cuts in fiscal consolidation strategies. However, all these decisions may be facilitated by having more fiscal space than by lacking it. If the authorities decide to concentrate their consolidation efforts in raising revenue, fiscal space will grow to move faster and bolder in implementing priority spending or investment programs. Also, a rigorous examination of spending may be the best argument to support tax increases. As for performance-based budgeting, many of the tools proposed in this paper may be seen as enhancing rather than displacing it. In particular, subjecting tax expenditures, public-private partnerships and permanent legislation to a stricter analysis of its full costs and benefits can be seen as extending the principles of performance-based budgeting to areas that have been relatively isolated from it when working exclusively with performance indicators and program evaluations. Zero-based budgeting and cost-containment strategies, on the other hand are complementary approaches to promote value-for-money in the public sector with a longer-term focus than some program evaluations. Building the systems and developing the tools to budget for fiscal space at a deeper and broader scale, of course, is not an easy job. It requires methodological developments, professional capacities, institutional and operational arrangements that are way beyond business-as-usual. This is a good reason to start as soon as possible. For many countries timing to drive change in an autonomous way may be limited and there is indeed a serious risk of self-indulgence once there is a perception that the worst of the emergency is over. To respond to this urgency there is a wealth of good practices in OECD and non-OECD countries that can and should be shared, a small sample of which has been collected in this paper.
33
APPENDIX 1: COUNTRIES USE OF AUTOMATIC PRODUCTIVITY CUTS
Country Terminology Size Coverage
Australia Efficiency Dividend
Applied at the rate of 1.25% per annum (varying over time 1.0 – 1.5%). Applied an additional one-off efficiency dividend of 2.5% in 2012-13 to departmental appropriations.
Applied to the operational expenses of all agencies in the general government, unless they are specifically exempted, and to the total net departmental appropriations, excluding some specific receipts. It does not apply to administered expenses, such as grants, subsidies and benefit payments.
Denmark Re-prioritisation Contribution
A uniform 2% cut is a cut in the budget baseline, the actual outcome of the budget process may be different.
Applied to the operating expenditure of central government. Institutions and programmes subject to special political agreements are exempted from the cut (approximately 1/3 of central government operating expenditure).
Finland Programme for Effectiveness and Productivity
From 2011, increased focus is put on the effectiveness of government functions, the availability and quality of services, and on human resources management. Currently there is no absolute target but the financial impact is to be achieved in line with the previous staff cutting target of 8 414 by the year 2011 and further 5 034 in 2012-15. In 2007-2011 only half of the saved personnel costs were cut from the appropriations of administrative branches. In the years 2012-2015, 25 % of the savings will be cut.
Quantitative top-down targets were decided for ministries and agencies, based on ministerial productivity plans. Measures to achieve this were proposed by ministries and negotiated between the ministry of Finance and line-ministries, approved by Cabinet.
New Zealand Fixed Nominal Baselines and additional efficiency savings as of July 2012
New Zealand uses fixed nominal current operational expenditures as baseline in the annual budget cycle. This means that inflation has to be absorbed. Given that the inflation rate has been around 2.5% for the last few years, ministries had to achieve at least a similar productivity gain in order to maintain their existing level of output.
In addition, the efficiency savings will be added to the savings caused by the fixed nominal baselines. The size of the required savings is 3% for small agencies and 6% for larger agencies.
Fixed Nominal Baselines for operational expenditures are applied on the entire central government budget, without exception.
The efficiency savings introduced by 1 July 2012 apply to core government administration as defined by the full-time equivalent (FTE) cap.
Sweden Deduction in productivity growth (DPG)
It is assumed that the agencies can produce a constant output with decreased wage resources because of the corresponding increase in the productivity of labour. The model assumes productivity development in the public sector is the same as in the private sector.
The DPG is calculated as the average productivity growth in the public sector during the last ten years. Since its introduction, the DPG has kept within the range of 1% - 2%, and is applied to the wage index part of the Price and Wage Adjustment (PWA) index.
PWA applies to ca. 28% of the total state budget (FY2012). DPG applies to ca. 16% of the total budget (the percentage represents the base amount subject to DPG, not the actual deduction resulting from application of DPG).
Cuts are applied to the multi-annual estimates of agencies’ operational costs, as an integral part of the budget process. These estimates are put up in real terms but annually converted into nominal terms by an aggregated wage and price index.

34
APPENDIX 2. CALCULATING LOSS OF FISCAL SPACE
Table 4 shows the loss of fiscal space calculation for 29 OECD countries. Defined as the unavoidable budgetary restriction that governments will face in the medium term due to already set financial commitments, loss of fiscal space is expressed as the percentage that three financial obligations represent over the 2011 non-pension primary spending in each of the analysed countries. Except for the final result of loss of fiscal space, all the data shown in Table 2 is expressed as percentage of GDP. The non-pension primary spending has been calculated as the 2011 general government expenditure (available at the OECD Annual Projections of the Economic Outlook No 91 Dataset) minus the 2011 debt interest payments and 2011 public expenditure on pensions (available at the Economic Outlook No 91 Dataset and the OECD Social Expenditure Database, respectively) in order to have an accureate measure of the actual resources that governments have for its program financing and delivery of services. The three financial obligations affecting the current level of non-pension primary spending are: the expected increase in pensions expenditure from 2010 to 2030, the consolidation measures required to stabilise debt to 2030, and the additional consolidation measures required to reach a target gross debt-to-GDP ratio of 60% until 2030. The estimated increase in pensions spending is based on the OECD projections of public expenditure on pensions 2007-2060, available at the OECD Pensions Outlook 2012. The consolidation to stabilise debt is the average improvement in the underlying primary balance to 2030 (or 2040 for Japan) required to stabilise the gross government debt-to-GDP ratio, assuming consolidation in 2012-13 is consistent with the short-term projections described in Chapters 1 and 2 of the OECD Economic Outlook No. 91, and thereafter amounts to ½ percentage point of GDP per annum (1 percentage point of GDP in Japan). Fiscal consolidation projections are the consequence of applying a stylized fiscal consolidation path and should not be interpreted as a forecast. Data on consolidation to stabilise debt has been taken from the Economic Outlook No 91 Dataset. The additional consolidation to reduce debt is defined as the complementary average improvement in the underlying primary balance to 2030 (2040 for Japan) required to reach a target gross debt-to-GDP ratio of 60%, assuming consolidation in 2012-13 is consistent with the short-term projections described in Chapters 1 and 2 of the OECD Economic Outlook No. 91 and thereafter amounts to 1 percentage point of GDP per annum (1.5 percentage points in the case of Greece, Ireland, Italy, Portugal, United States, United Kingdom and Japan). Some countries have not quite achieved the 60% debt target by 2030, but with the exception of Japan, it is close enough that it is achieved within a few years after 2030 with little further consolidation. Countries with a projected debt ratio lower than 60% in 2013 are assumed to target their 2013 debt ratio. Data on consolidation to lower debt has also been taken from the Economic Outlook No 91 Dataset. It should be noted that these fiscal consolidation projections to stabilize and lower debt are the consequence of applying a stylized fiscal consolidation path and should not be interpreted as a forecast. These three financial obligations have been added in order to calculate the portion they represent over the non-pension primary spending in each country. The final result, called loss of fiscal space, is then expressed as the percentage of the 2011 non-pension primary spending for each of the 29 analysed OECD countries. Averages located at the bottom of Table 2 are GDP weighted averages and their calculation considered all the OECD area countries, including those not analysed in this table.
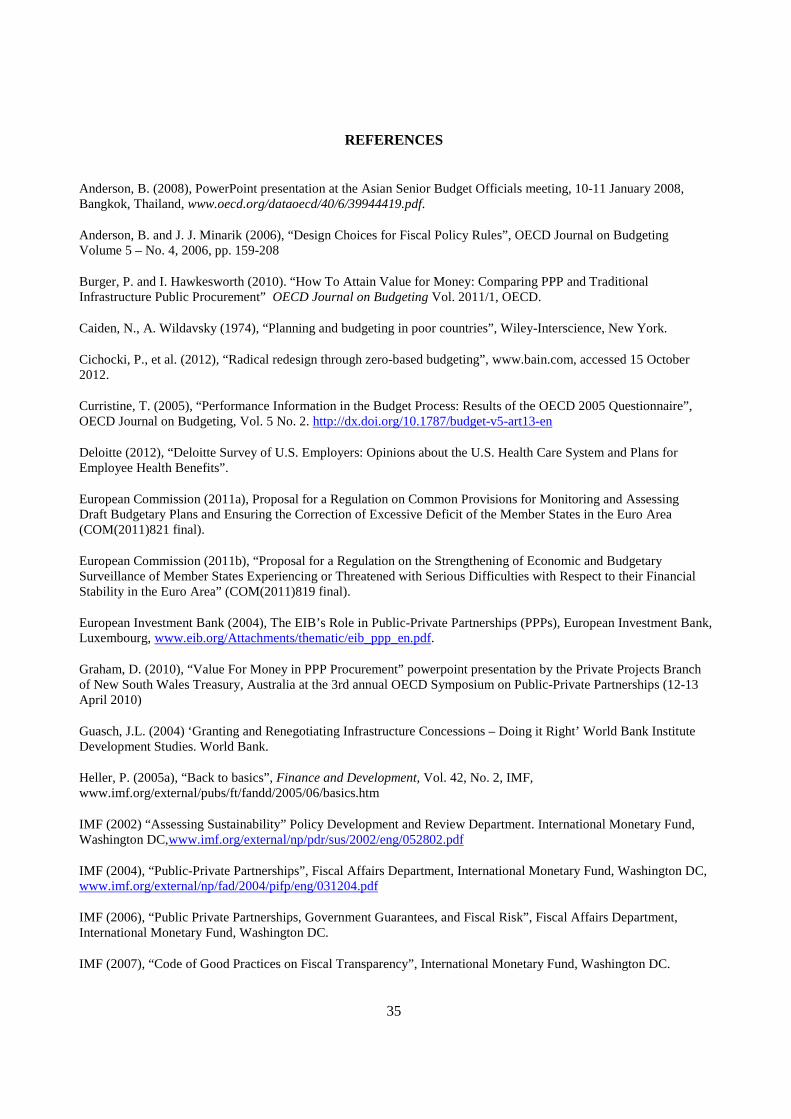
35
REFERENCES
Anderson, B. (2008), PowerPoint presentation at the Asian Senior Budget Officials meeting, 10-11 January 2008, Bangkok, Thailand, www.oecd.org/dataoecd/40/6/39944419.pdf.
Anderson, B. and J. J. Minarik (2006), “Design Choices for Fiscal Policy Rules”, OECD Journal on Budgeting Volume 5 – No. 4, 2006, pp. 159-208
Burger, P. and I. Hawkesworth (2010). “How To Attain Value for Money: Comparing PPP and Traditional Infrastructure Public Procurement” OECD Journal on Budgeting Vol. 2011/1, OECD.
Caiden, N., A. Wildavsky (1974), “Planning and budgeting in poor countries”, Wiley-Interscience, New York.
Cichocki, P., et al. (2012), “Radical redesign through zero-based budgeting”, www.bain.com, accessed 15 October 2012.
Curristine, T. (2005), “Performance Information in the Budget Process: Results of the OECD 2005 Questionnaire”, OECD Journal on Budgeting, Vol. 5 No. 2. http://dx.doi.org/10.1787/budget-v5-art13-en
Deloitte (2012), “Deloitte Survey of U.S. Employers: Opinions about the U.S. Health Care System and Plans for Employee Health Benefits”.
European Commission (2011a), Proposal for a Regulation on Common Provisions for Monitoring and Assessing Draft Budgetary Plans and Ensuring the Correction of Excessive Deficit of the Member States in the Euro Area (COM(2011)821 final).
European Commission (2011b), “Proposal for a Regulation on the Strengthening of Economic and Budgetary Surveillance of Member States Experiencing or Threatened with Serious Difficulties with Respect to their Financial Stability in the Euro Area” (COM(2011)819 final).
European Investment Bank (2004), The EIB’s Role in Public-Private Partnerships (PPPs), European Investment Bank, Luxembourg, www.eib.org/Attachments/thematic/eib_ppp_en.pdf.
Graham, D. (2010), “Value For Money in PPP Procurement” powerpoint presentation by the Private Projects Branch of New South Wales Treasury, Australia at the 3rd annual OECD Symposium on Public-Private Partnerships (12-13 April 2010)
Guasch, J.L. (2004) ‘Granting and Renegotiating Infrastructure Concessions – Doing it Right’ World Bank Institute Development Studies. World Bank.
Heller, P. (2005a), “Back to basics”, Finance and Development, Vol. 42, No. 2, IMF, www.imf.org/external/pubs/ft/fandd/2005/06/basics.htm
IMF (2002) “Assessing Sustainability” Policy Development and Review Department. International Monetary Fund, Washington DC,www.imf.org/external/np/pdr/sus/2002/eng/052802.pdf
IMF (2004), “Public-Private Partnerships”, Fiscal Affairs Department, International Monetary Fund, Washington DC, www.imf.org/external/np/fad/2004/pifp/eng/031204.pdf
IMF (2006), “Public Private Partnerships, Government Guarantees, and Fiscal Risk”, Fiscal Affairs Department, International Monetary Fund, Washington DC.
IMF (2007), “Code of Good Practices on Fiscal Transparency”, International Monetary Fund, Washington DC.
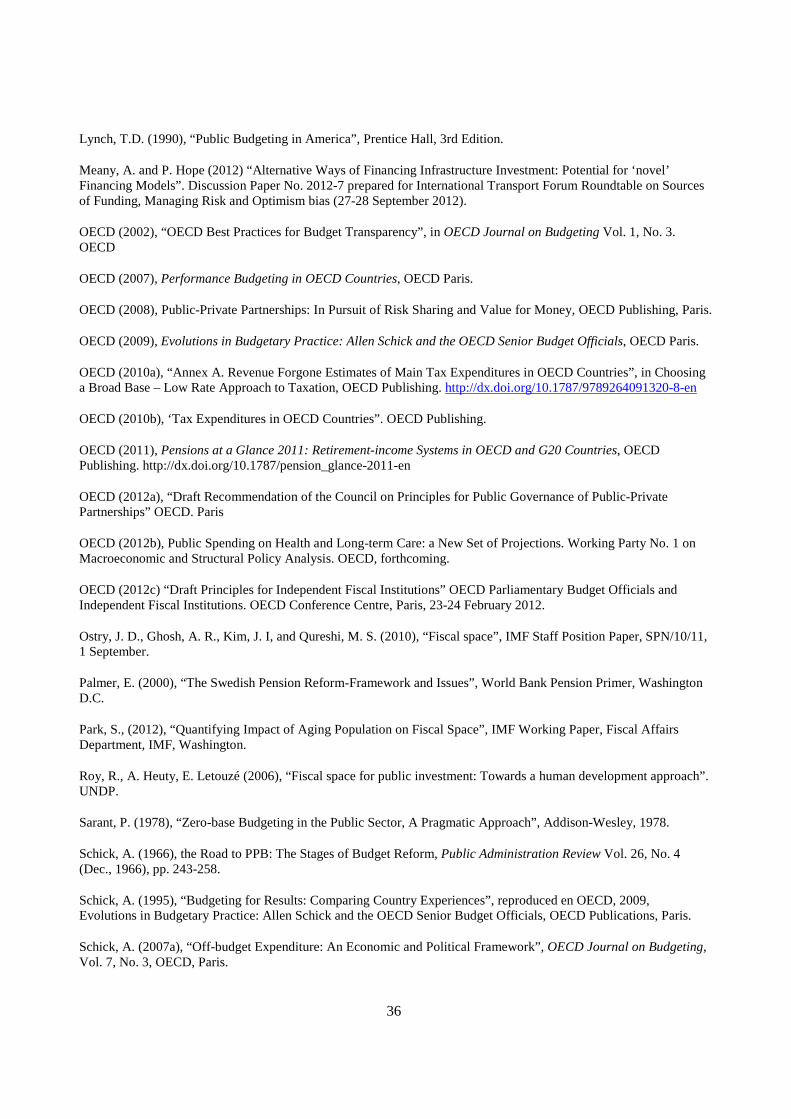
36
Lynch, T.D. (1990), “Public Budgeting in America”, Prentice Hall, 3rd Edition.
Meany, A. and P. Hope (2012) “Alternative Ways of Financing Infrastructure Investment: Potential for ‘novel’ Financing Models”. Discussion Paper No. 2012-7 prepared for International Transport Forum Roundtable on Sources of Funding, Managing Risk and Optimism bias (27-28 September 2012).
OECD (2002), “OECD Best Practices for Budget Transparency”, in OECD Journal on Budgeting Vol. 1, No. 3. OECD
OECD (2007), Performance Budgeting in OECD Countries, OECD Paris.
OECD (2008), Public-Private Partnerships: In Pursuit of Risk Sharing and Value for Money, OECD Publishing, Paris.
OECD (2009), Evolutions in Budgetary Practice: Allen Schick and the OECD Senior Budget Officials, OECD Paris.
OECD (2010a), “Annex A. Revenue Forgone Estimates of Main Tax Expenditures in OECD Countries”, in Choosing a Broad Base – Low Rate Approach to Taxation, OECD Publishing. http://dx.doi.org/10.1787/9789264091320-8-en
OECD (2010b), ‘Tax Expenditures in OECD Countries”. OECD Publishing.
OECD (2011), Pensions at a Glance 2011: Retirement-income Systems in OECD and G20 Countries, OECD Publishing. http://dx.doi.org/10.1787/pension_glance-2011-en
OECD (2012a), “Draft Recommendation of the Council on Principles for Public Governance of Public-Private Partnerships” OECD. Paris
OECD (2012b), Public Spending on Health and Long-term Care: a New Set of Projections. Working Party No. 1 on Macroeconomic and Structural Policy Analysis. OECD, forthcoming.
OECD (2012c) “Draft Principles for Independent Fiscal Institutions” OECD Parliamentary Budget Officials and Independent Fiscal Institutions. OECD Conference Centre, Paris, 23-24 February 2012.
Ostry, J. D., Ghosh, A. R., Kim, J. I, and Qureshi, M. S. (2010), “Fiscal space”, IMF Staff Position Paper, SPN/10/11, 1 September.
Palmer, E. (2000), “The Swedish Pension Reform-Framework and Issues”, World Bank Pension Primer, Washington D.C.
Park, S., (2012), “Quantifying Impact of Aging Population on Fiscal Space”, IMF Working Paper, Fiscal Affairs Department, IMF, Washington.
Roy, R., A. Heuty, E. Letouzé (2006), “Fiscal space for public investment: Towards a human development approach”. UNDP.
Sarant, P. (1978), “Zero-base Budgeting in the Public Sector, A Pragmatic Approach”, Addison-Wesley, 1978.
Schick, A. (1966), the Road to PPB: The Stages of Budget Reform, Public Administration Review Vol. 26, No. 4 (Dec., 1966), pp. 243-258.
Schick, A. (1995), “Budgeting for Results: Comparing Country Experiences”, reproduced en OECD, 2009, Evolutions in Budgetary Practice: Allen Schick and the OECD Senior Budget Officials, OECD Publications, Paris.
Schick, A. (2007a), “Off-budget Expenditure: An Economic and Political Framework”, OECD Journal on Budgeting, Vol. 7, No. 3, OECD, Paris.
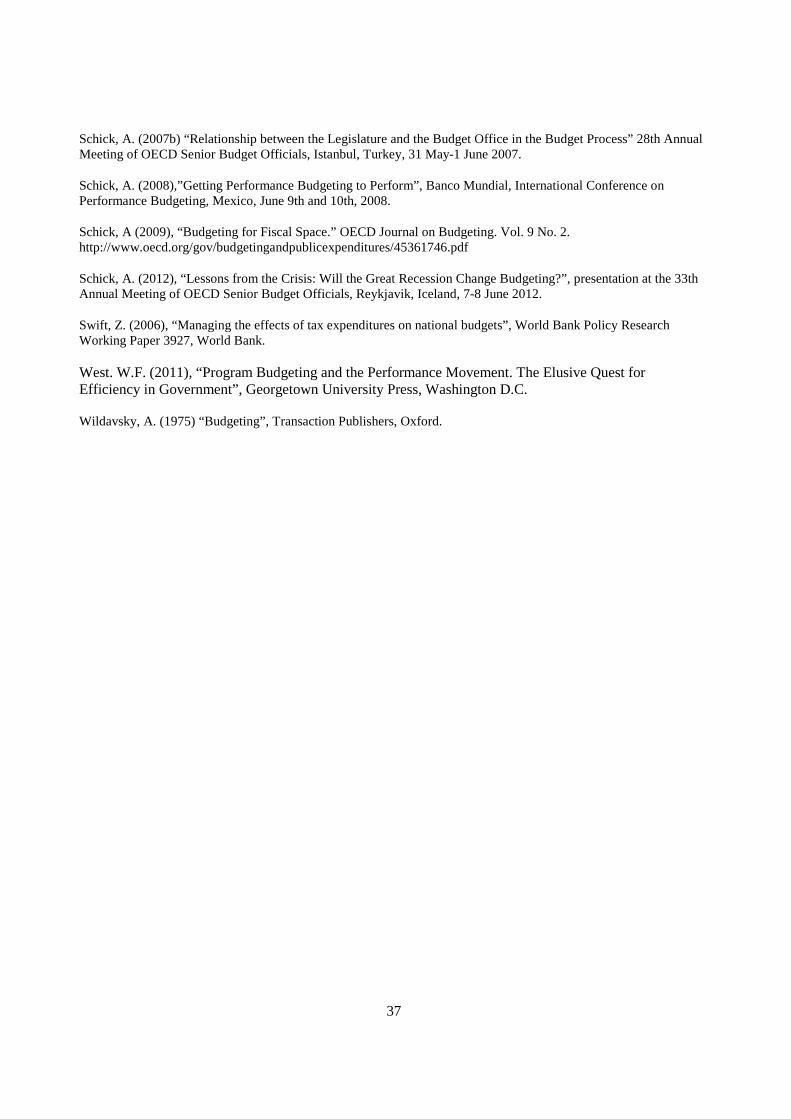
37
Schick, A. (2007b) “Relationship between the Legislature and the Budget Office in the Budget Process” 28th Annual Meeting of OECD Senior Budget Officials, Istanbul, Turkey, 31 May-1 June 2007.
Schick, A. (2008),”Getting Performance Budgeting to Perform”, Banco Mundial, International Conference on Performance Budgeting, Mexico, June 9th and 10th, 2008.
Schick, A (2009), “Budgeting for Fiscal Space.” OECD Journal on Budgeting. Vol. 9 No. 2. http://www.oecd.org/gov/budgetingandpublicexpenditures/45361746.pdf
Schick, A. (2012), “Lessons from the Crisis: Will the Great Recession Change Budgeting?”, presentation at the 33th Annual Meeting of OECD Senior Budget Officials, Reykjavik, Iceland, 7-8 June 2012.
Swift, Z. (2006), “Managing the effects of tax expenditures on national budgets”, World Bank Policy Research Working Paper 3927, World Bank.
West. W.F. (2011), “Program Budgeting and the Performance Movement. The Elusive Quest for Efficiency in Government”, Georgetown University Press, Washington D.C.
Wildavsky, A. (1975) “Budgeting”, Transaction Publishers, Oxford.