Embed Size (px)
Citation preview
Budget for Current Operations
2013-14
summary and detail
UN
IVE
RS
ITY
OF
CA
LIFOR
NIA
20
13-14 B
UD
GE
T FO
R C
UR
RE
NT
OP
ER
AT
ION
S

University of CaliforniaOffice of the President
Budget and Capital Resources1111 Franklin Street, 6th Floor
Oakland, California 94607-5200510-987-0648
http://budget.ucop.edu
University of CaliforniaOffice of the President
Budget and Capital Resources1111 Franklin Street, 6th Floor
Oakland, California 94607-5200510-987-0648
http://budget.ucop.edu
UNIVERSITY of CALIFORNIA
2013-14 BUDGET FOR CURRENT OPERATIONS BUDGET SUMMARY

S-1
MESSAGE FROM THE PRESIDENT
For the last four years, the University of California has struggled through budgeting challenges rife with uncertainty. This
year is no exception as the University labors under the specter of additional mid-year cuts in the current fiscal year if new
State revenue streams do not materialize.
Given California's economic constraints, UC's proposed 2013-14 spending plan represents a realistic picture of what is
needed to maintain the three hallmarks of this great public university system: access, affordability, and quality.
Despite the sharp declines in State support, UC has sought to preserve those three pillars of its public mission through
aggressive financial strategies and operational efficiencies. Every part of the UC community has shared in the sacrifices
needed to achieve those cost-saving goals. Every campus and the Office of the President have cut and consolidated
programs, eliminated jobs, laid off staff, and across the board produced more with fewer and fewer resources. Most
regrettably, UC students and their families now pay more of the cost of their education than the State contributes.
UC has now reached a point where quality is seriously at risk – and without renewed, stable State investment, the long
traditions of innovation, exceptional teaching, and committed public service will suffer. Not just the University, but all of
California, will feel the repercussions if that is allowed to happen.
UC's impact reaches far beyond the boundaries of its campuses. Every Californian benefits in some way from its health and
medical breakthroughs, its technological and scientific discoveries, its creative endeavors, and its economic benefits.
While UC continues to pursue its own revenue-increasing strategies and cost efficiencies, State General Fund support
remains a crucial part of its core budget. State funds not only provide support for academic programs and vital student
services, they also help generate additional public and private funds from outside California.
UC will do its part, but the State of California needs to do its part as well. The University will continue to strive for excellence
and efficiencies, affordability and accountability, and access and transparency. What UC needs from the State is a renewed
commitment that this great institution of higher learning will be preserved, that years of prior investment will not be forsaken,
and that the doors of opportunity will remain open wide for all Californians.
The University of California grew up with the state and for a century-and-a-half has served as a beacon of hope, an agent of
transformation, and a true source of pride for all Californians. Without adequate and stable State reinvestment, the
combination of educational quality, affordability, and access that sets UC apart from other public research universities will be
jeopardized. UC needs the support of the Governor and Legislature to make sure that doesn't happen.
I look forward to working with both to ensure a sustainable future for the University.
Mark G. YudofPresidentOctober, 2012
S-2
KEY ELEMENTS OF THE UNIVERSITY OF CALIFORNIA 2013-14 BUDGET
The University of California’s long tradition of excellence rests on three pillars: access, affordability, and quality. Through a
period of unprecedented State funding reductions, the University has protected two of those pillars: access and affordability.
Most states expect their public universities to offer a good education at an affordable price to those who wish to attend.
California’s expectation has been much higher – the investment by the State in the University of California has allowed UC
to offer a top-flight education taught by world-class faculty, comparable to those at elite private universities, to all who work
hard enough to qualify, irrespective of social background or economic situation. It is this access to excellence in a public
setting that sets UC apart from other major research universities. Yet it is quality – the third pillar of UC’s excellence – that
is seriously jeopardized by the State’s disinvestment in higher education. The University’s budget plan for 2013-14 reflects the University’s view that it must not only stabilize funding for core
operations, it must also focus on reinvesting in the quality of UC’s core instruction and research programs while continuing
to protect access and affordability. Building on the prospect of a multi-year funding agreement with the State, the plan seeks
to stabilize UC’s fiscal foundation through a combination of moderate increases in both State funding and tuition, aggressive
cost reductions and efficiency improvements that leverage UC’s economies of scale, and the active pursuit of alternative
revenues. A stable fiscal foundation will allow UC to plan for the future; to make the long-term investments needed to
secure its stature as a world-class university; and to provide its faculty, students, and employees with a more certain future. The proposed 2013-14 plan assumes passage of the Governor’s revenue-raising initiative, Proposition 30, in November
2012. Whether the initiative passes or fails, however, the University is committed to securing a path to fiscal stability and
pursuing a course that sustains and enhances the quality of its academic programs. If the initiative fails, the University will
face difficult choices, including the potential for an array of more extreme strategies to reduce costs and enhance alternative
revenues, as well as the potential for much higher tuition and fees – choices that together could alter the very nature of the
University of California. Key elements of the 2013-14 budget plan include:
Moderate increases in both State support and tuition and fees. The University proposes to meet escalating mandatory costs through its principal revenue sources. Moderate and predictable increases in both State support and tuition and fees can provide the funding needed to meet the University’s basic operating needs. For 2013-14, thebudget plan includes revenue associated with the State buy-out of 2012-13 tuition and fee increases ($125.4 million), a6% base budget adjustment ($150.2 million), and a 6% tuition and fee increase ($126.5 million, net of financial aid). Modest enrollment growth. UC proposes a 1% increase in funded enrollments to maintain momentum at the Merced campus and provide support for unfunded enrollments that currently exist on the general campuses and in health sciences programs. New medical school at UC Riverside. In October 2012, the Riverside campus received notice of preliminary accreditation for its new medical school. The inaugural class of 50 students for the medical school will enroll in Fall 2013. The University is requesting an additional $15 million, above the amount proposed from the new multi-year agreement, to fund this critically important initiative. Building a new medical school, which will be a regional and statewide resource, cannot be sustained through a redirection of existing resources. It is critical that the State commit to this endeavor by providing core support for the school’s academic program and basic operations.
Addressing continuing mandatory costs. The 2013-14 budget plan includes funding for employer contributions to the UC Retirement Plan, employee and retiree health benefit costs, inflation increases in non-salary costs, and modest compensation increases to prevent further erosion of faculty and staff salaries.
Reinvestment in the University’s core academic programs. The plan includes the first component of a multi-year reinvestment in the quality of UC’s core academic programs. This investment is focused on reducing the student-faculty ratio; increasing the competitiveness of faculty and staff salaries; enhancing graduate student support;expanding resources for core instructional support needs, such as instructional equipment and technology, libraries,and building maintenance; and addressing capital renewal of UC’s aging facilities and campus infrastructure.
S-3
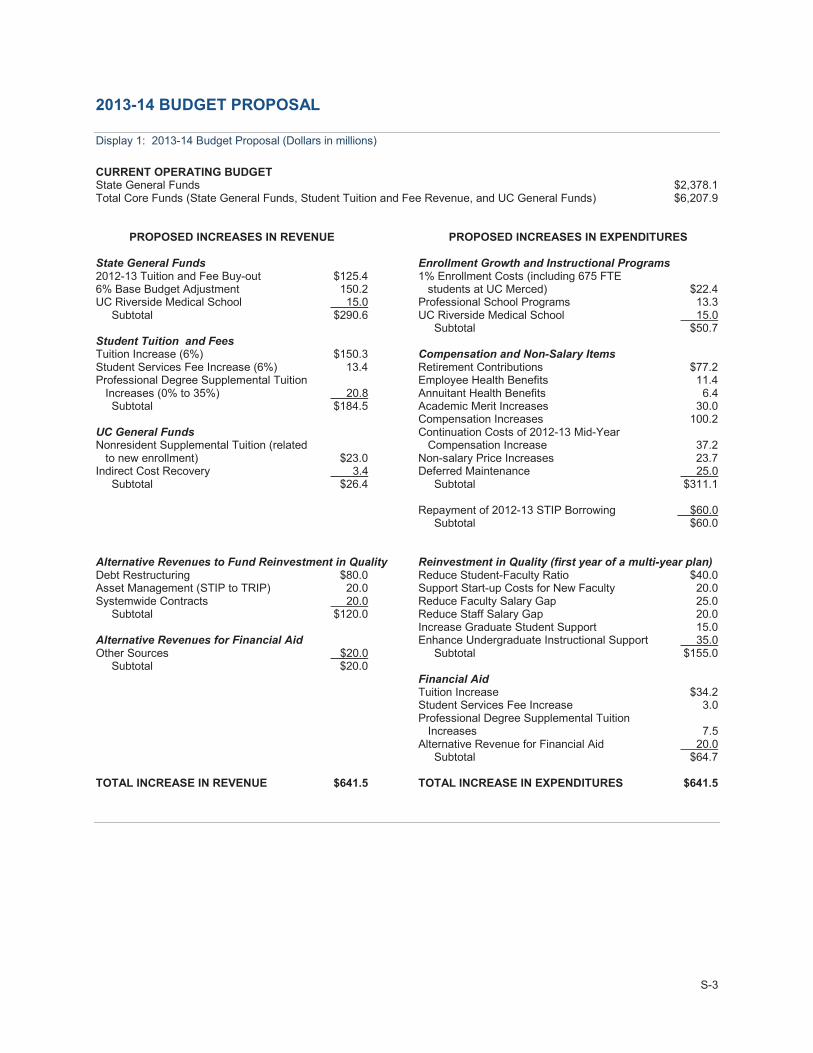
2013-14 BUDGET PROPOSAL
Display 1: 2013-14 Budget Proposal (Dollars in millions)
CURRENT OPERATING BUDGET State General Funds $2,378.1Total Core Funds (State General Funds, Student Tuition and Fee Revenue, and UC General Funds) $6,207.9
PROPOSED INCREASES IN REVENUE PROPOSED INCREASES IN EXPENDITURES
State General Funds Enrollment Growth and Instructional Programs2012-13 Tuition and Fee Buy-out $125.4 1% Enrollment Costs (including 675 FTE 6% Base Budget Adjustment 150.2 students at UC Merced) $22.4UC Riverside Medical School 15.0 Professional School Programs 13.3 Subtotal $290.6 UC Riverside Medical School 15.0
Subtotal $50.7Student Tuition and FeesTuition Increase (6%) $150.3 Compensation and Non-Salary ItemsStudent Services Fee Increase (6%) 13.4 Retirement Contributions $77.2Professional Degree Supplemental Tuition Employee Health Benefits 11.4
Increases (0% to 35%) 20.8 Annuitant Health Benefits 6.4 Subtotal $184.5 Academic Merit Increases 30.0
Compensation Increases 100.2UC General Funds Continuation Costs of 2012-13 Mid-Year Nonresident Supplemental Tuition (related Compensation Increase 37.2
to new enrollment) $23.0 Non-salary Price Increases 23.7Indirect Cost Recovery 3.4 Deferred Maintenance 25.0 Subtotal $26.4 Subtotal $311.1
Repayment of 2012-13 STIP Borrowing $60.0 Subtotal $60.0
Alternative Revenues to Fund Reinvestment in Quality Reinvestment in Quality (first year of a multi-year plan)Debt Restructuring $80.0 Reduce Student-Faculty Ratio $40.0Asset Management (STIP to TRIP) 20.0 Support Start-up Costs for New Faculty 20.0Systemwide Contracts 20.0 Reduce Faculty Salary Gap 25.0 Subtotal $120.0 Reduce Staff Salary Gap 20.0
Increase Graduate Student Support 15.0Alternative Revenues for Financial Aid Enhance Undergraduate Instructional Support 35.0Other Sources $20.0 Subtotal $155.0 Subtotal $20.0
Financial AidTuition Increase $34.2Student Services Fee Increase 3.0Professional Degree Supplemental Tuition
Increases 7.5Alternative Revenue for Financial Aid 20.0 Subtotal $64.7
TOTAL INCREASE IN REVENUE $641.5 TOTAL INCREASE IN EXPENDITURES $641.5
S-4
THE UNIVERSITY OF CALIFORNIA AT A CROSSROADS
At this juncture, the University must achieve fiscal stability and address its long-term
needs if it is to remain a world-class public research university.
More than a century-and-a-half of investment by the State
of California has made the University of California the finest
public university in the nation, and indeed the world – one
that can also compete with the pre-eminent private
universities around the globe. This tradition of excellence
has created untold advantages for the state of California
and its citizens, which belies the steady disinvestment by
the State that has occurred over the last two decades.
Recent budget cuts, unprecedented in magnitude, have
accelerated this long-term trend and heightened the stark
impacts of reduced support for UC’s core academic
programs.
Yet the University remains committed to ensuring that all
undergraduate students who work hard to become eligible
have a place somewhere in the University of California; to
training graduate students needed for the state’s workforce
in a knowledge-based economy; to supporting a highly
productive research enterprise that brings innovation,
economic development, and jobs to this state; and to
providing public services that enhance the quality of life for
all Californians. However, the cumulative effect of prior
recessions, coupled with the draconian cuts in State
support over the last four years, now threatens the
University’s ability to continue to provide the world-class
education, scholarship, and public service it has in the past.
If the University is going to continue to serve California in
valuable ways, it must achieve fiscal stability in the near
term and begin to reinvest over the long term in the
academic infrastructure that is the foundation of its many
contributions to California. This means shoring up the
quality that historically has set this public university apart
from all others – for no other institution of higher education
offers UC’s combination of explicit public access to a world-
class research university at an affordable price regardless
of social or economic background.
In this last year, the University developed a long-term
budget plan through 2016-17 which identifies the costs that
will need to be addressed over the next five years, as well
as potential funding solutions to support its basic needs.
This plan shows that without new resources from the State,
tuition and fees, and other sources, the University will face
a budget shortfall of $2.9 billion by 2016-17. This shortfall
exceeds the current University State-funded budget by
nearly $600 million – and is also equivalent to the combined
State funding for the Irvine, Riverside, Santa Barbara, and
Santa Cruz campuses.
It must be understood that closing this projected shortfall
would only address the recent reductions in State support
and new mandatory costs, basically preventing further
erosion of support for the University’s core mission
activities. Closing the $2.9 billion shortfall would not
address the effects on UC’s academic infrastructure of
nearly two decades of State disinvestment that preceded
the most recent State fiscal crisis. The damage to quality
that prior budget cuts have wrought can no longer be left
unaddressed. It is imperative that UC take action now to
reinvest in its academic program.
The University understands that resolving its budget gap
cannot be the sole burden of the State and its taxpayers;
rather, this must be a shared responsibility among the
State, the University, and those it serves. As a result, UC
has identified and is already implementing a vast array of
funding solutions – some of which generate new revenue,
some of which avoid costs, and some of which find newer
and more efficient ways of doing business – that will
address about $1 billion, or more than a third, of this gap
over the next several years. These actions are discussed
in more detail later in this document.
S-5
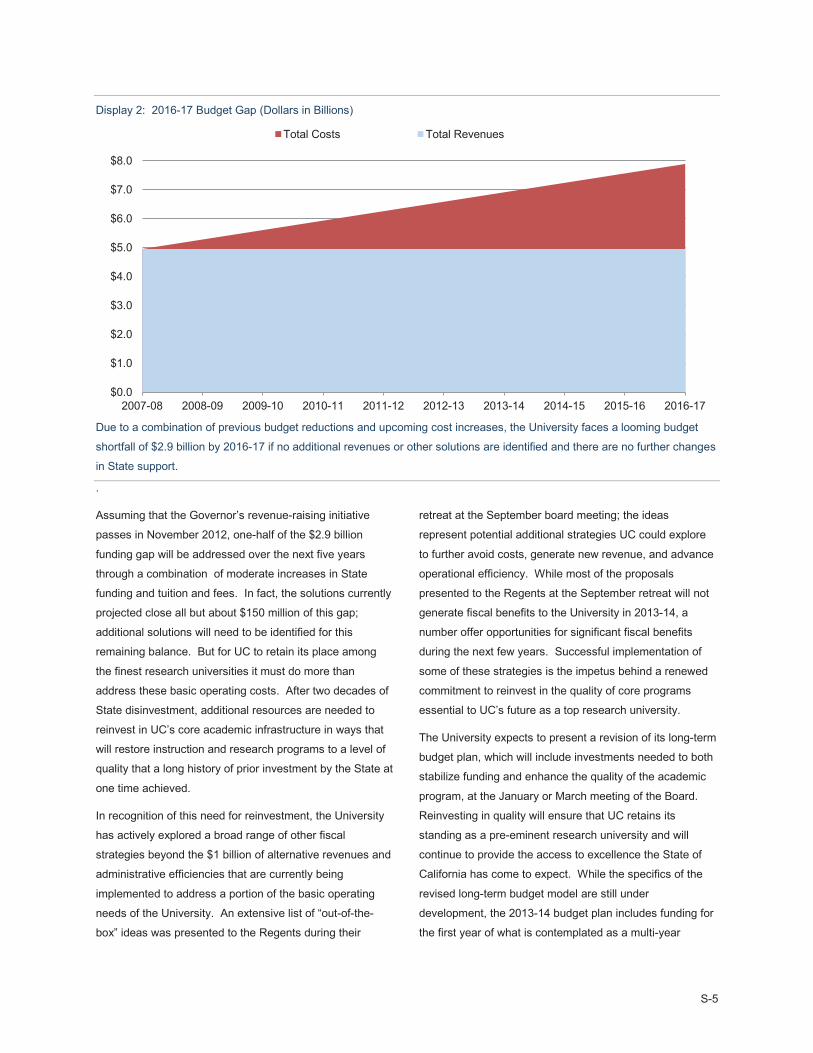
Display 2: 2016-17 Budget Gap (Dollars in Billions)
Due to a combination of previous budget reductions and upcoming cost increases, the University faces a looming budget
shortfall of $2.9 billion by 2016-17 if no additional revenues or other solutions are identified and there are no further changes
in State support.
.
Assuming that the Governor’s revenue-raising initiative
passes in November 2012, one-half of the $2.9 billion
funding gap will be addressed over the next five years
through a combination of moderate increases in State
funding and tuition and fees. In fact, the solutions currently
projected close all but about $150 million of this gap;
additional solutions will need to be identified for this
remaining balance. But for UC to retain its place among
the finest research universities it must do more than
address these basic operating costs. After two decades of
State disinvestment, additional resources are needed to
reinvest in UC’s core academic infrastructure in ways that
will restore instruction and research programs to a level of
quality that a long history of prior investment by the State at
one time achieved.
In recognition of this need for reinvestment, the University
has actively explored a broad range of other fiscal
strategies beyond the $1 billion of alternative revenues and
administrative efficiencies that are currently being
implemented to address a portion of the basic operating
needs of the University. An extensive list of “out-of-the-
box” ideas was presented to the Regents during their
retreat at the September board meeting; the ideas
represent potential additional strategies UC could explore
to further avoid costs, generate new revenue, and advance
operational efficiency. While most of the proposals
presented to the Regents at the September retreat will not
generate fiscal benefits to the University in 2013-14, a
number offer opportunities for significant fiscal benefits
during the next few years. Successful implementation of
some of these strategies is the impetus behind a renewed
commitment to reinvest in the quality of core programs
essential to UC’s future as a top research university.
The University expects to present a revision of its long-term
budget plan, which will include investments needed to both
stabilize funding and enhance the quality of the academic
program, at the January or March meeting of the Board.
Reinvesting in quality will ensure that UC retains its
standing as a pre-eminent research university and will
continue to provide the access to excellence the State of
California has come to expect. While the specifics of the
revised long-term budget model are still under
development, the 2013-14 budget plan includes funding for
the first year of what is contemplated as a multi-year
$0.0
$1.0
$2.0
$3.0
$4.0
$5.0
$6.0
$7.0
$8.0
2007-08 2008-09 2009-10 2010-11 2011-12 2012-13 2013-14 2014-15 2015-16 2016-17
Total Costs Total Revenues
S-6
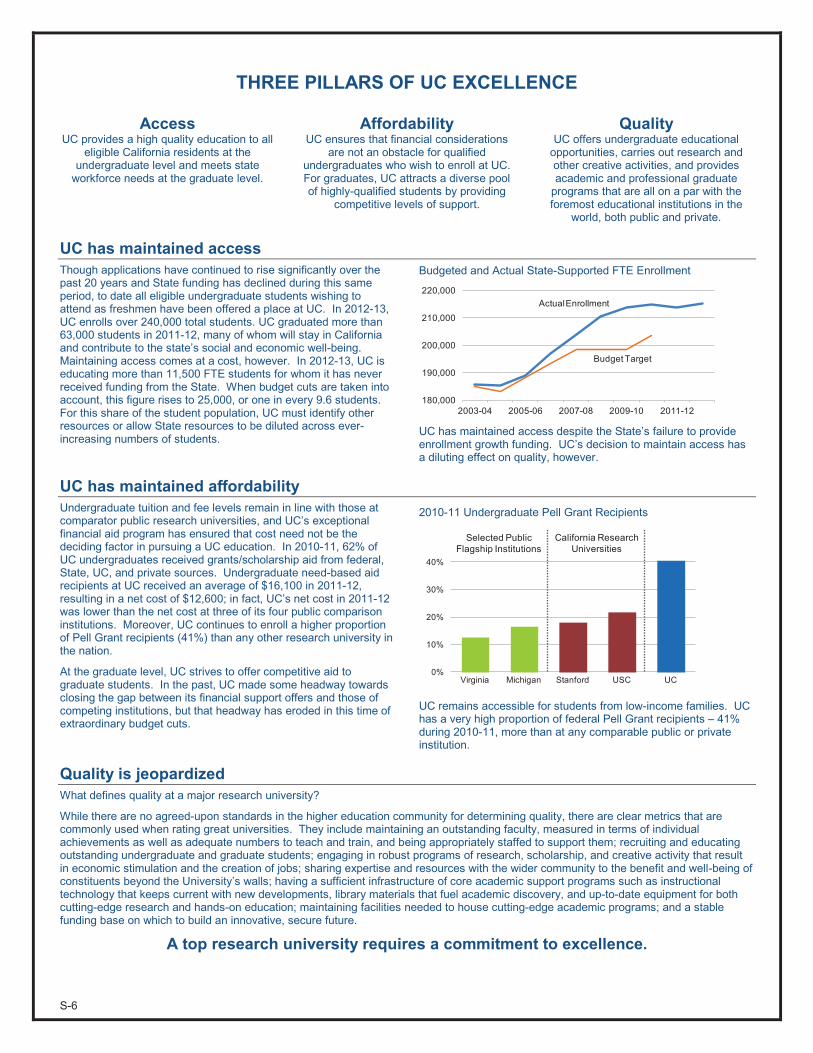
THREE PILLARS OF UC EXCELLENCE
AccessUC provides a high quality education to all
eligible California residents at the undergraduate level and meets state
workforce needs at the graduate level.
AffordabilityUC ensures that financial considerations
are not an obstacle for qualified undergraduates who wish to enroll at UC. For graduates, UC attracts a diverse pool of highly-qualified students by providing
competitive levels of support.
QualityUC offers undergraduate educational
opportunities, carries out research and other creative activities, and provides academic and professional graduate
programs that are all on a par with the foremost educational institutions in the
world, both public and private.
UC has maintained accessThough applications have continued to rise significantly over the past 20 years and State funding has declined during this same period, to date all eligible undergraduate students wishing to attend as freshmen have been offered a place at UC. In 2012-13,UC enrolls over 240,000 total students. UC graduated more than 63,000 students in 2011-12, many of whom will stay in California and contribute to the state’s social and economic well-being.Maintaining access comes at a cost, however. In 2012-13, UC is educating more than 11,500 FTE students for whom it has never received funding from the State. When budget cuts are taken into account, this figure rises to 25,000, or one in every 9.6 students. For this share of the student population, UC must identify other resources or allow State resources to be diluted across ever-increasing numbers of students.
Budgeted and Actual State-Supported FTE Enrollment
UC has maintained access despite the State’s failure to provide enrollment growth funding. UC’s decision to maintain access has a diluting effect on quality, however.
UC has maintained affordabilityUndergraduate tuition and fee levels remain in line with those atcomparator public research universities, and UC’s exceptional financial aid program has ensured that cost need not be the deciding factor in pursuing a UC education. In 2010-11, 62% of UC undergraduates received grants/scholarship aid from federal, State, UC, and private sources. Undergraduate need-based aid recipients at UC received an average of $16,100 in 2011-12, resulting in a net cost of $12,600; in fact, UC’s net cost in 2011-12was lower than the net cost at three of its four public comparison institutions. Moreover, UC continues to enroll a higher proportion of Pell Grant recipients (41%) than any other research university in the nation.
At the graduate level, UC strives to offer competitive aid to graduate students. In the past, UC made some headway towards closing the gap between its financial support offers and those of competing institutions, but that headway has eroded in this time of extraordinary budget cuts.
2010-11 Undergraduate Pell Grant Recipients
UC remains accessible for students from low-income families. UC has a very high proportion of federal Pell Grant recipients – 41% during 2010-11, more than at any comparable public or private institution.
Quality is jeopardizedWhat defines quality at a major research university?
While there are no agreed-upon standards in the higher education community for determining quality, there are clear metrics that are commonly used when rating great universities. They include maintaining an outstanding faculty, measured in terms of individual achievements as well as adequate numbers to teach and train, and being appropriately staffed to support them; recruiting and educating outstanding undergraduate and graduate students; engaging in robust programs of research, scholarship, and creative activity that result in economic stimulation and the creation of jobs; sharing expertise and resources with the wider community to the benefit and well-being of constituents beyond the University’s walls; having a sufficient infrastructure of core academic support programs such as instructional technology that keeps current with new developments, library materials that fuel academic discovery, and up-to-date equipment for both cutting-edge research and hands-on education; maintaining facilities needed to house cutting-edge academic programs; and a stable funding base on which to build an innovative, secure future.
A top research university requires a commitment to excellence.
180,000
190,000
200,000
210,000
220,000
2003-04 2005-06 2007-08 2009-10 2011-12
ActualEnrollment
Budget Target
0%
10%
20%
30%
40%
Virginia Michigan Stanford USC UC
California Research Universities
Selected Public Flagship Institutions
S-7
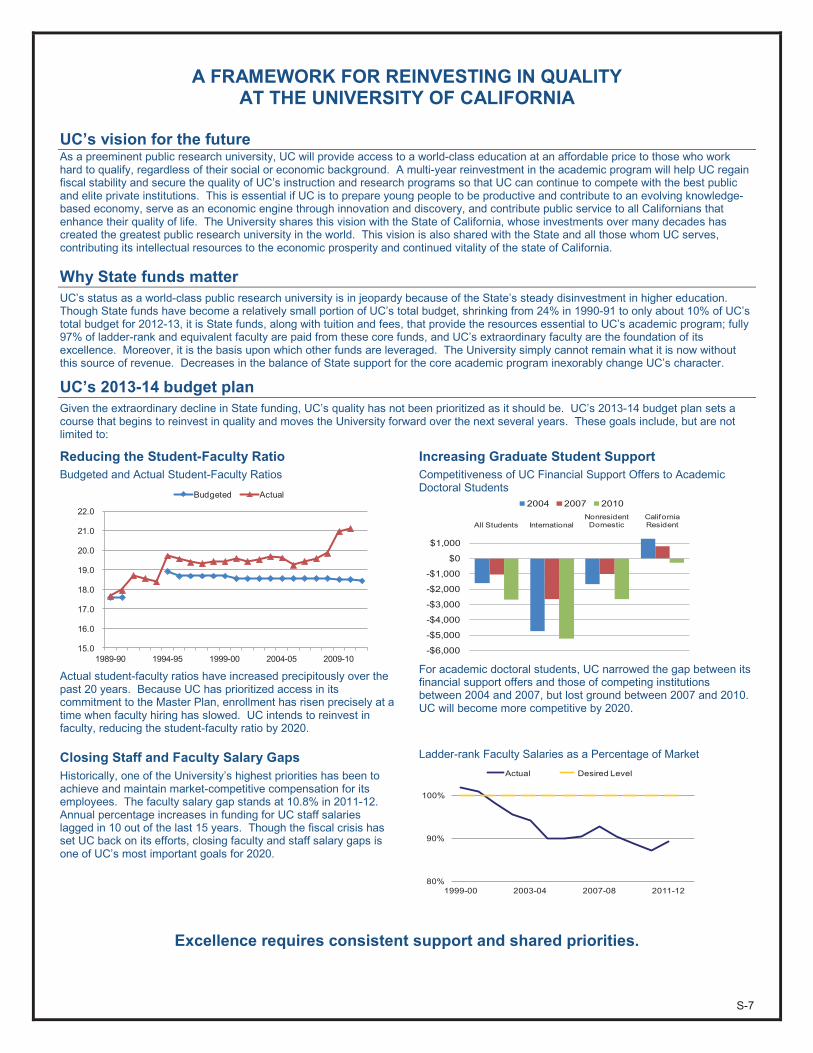
A FRAMEWORK FOR REINVESTING IN QUALITY AT THE UNIVERSITY OF CALIFORNIA
UC’s vision for the futureAs a preeminent public research university, UC will provide access to a world-class education at an affordable price to those who work hard to qualify, regardless of their social or economic background. A multi-year reinvestment in the academic program will help UC regain fiscal stability and secure the quality of UC’s instruction and research programs so that UC can continue to compete with the best public and elite private institutions. This is essential if UC is to prepare young people to be productive and contribute to an evolving knowledge-based economy, serve as an economic engine through innovation and discovery, and contribute public service to all Californians that enhance their quality of life. The University shares this vision with the State of California, whose investments over many decades has created the greatest public research university in the world. This vision is also shared with the State and all those whom UC serves, contributing its intellectual resources to the economic prosperity and continued vitality of the state of California.
Why State funds matterUC’s status as a world-class public research university is in jeopardy because of the State’s steady disinvestment in higher education. Though State funds have become a relatively small portion of UC’s total budget, shrinking from 24% in 1990-91 to only about 10% of UC’s total budget for 2012-13, it is State funds, along with tuition and fees, that provide the resources essential to UC’s academic program; fully 97% of ladder-rank and equivalent faculty are paid from these core funds, and UC’s extraordinary faculty are the foundation of itsexcellence. Moreover, it is the basis upon which other funds are leveraged. The University simply cannot remain what it is now without this source of revenue. Decreases in the balance of State support for the core academic program inexorably change UC’s character.
UC’s 2013-14 budget planGiven the extraordinary decline in State funding, UC’s quality has not been prioritized as it should be. UC’s 2013-14 budget plan sets a course that begins to reinvest in quality and moves the University forward over the next several years. These goals include, but are not limited to:
Reducing the Student-Faculty RatioBudgeted and Actual Student-Faculty Ratios
Actual student-faculty ratios have increased precipitously over the past 20 years. Because UC has prioritized access in its commitment to the Master Plan, enrollment has risen precisely at a time when faculty hiring has slowed. UC intends to reinvest in faculty, reducing the student-faculty ratio by 2020.
Increasing Graduate Student SupportCompetitiveness of UC Financial Support Offers to Academic Doctoral Students
For academic doctoral students, UC narrowed the gap between its financial support offers and those of competing institutions between 2004 and 2007, but lost ground between 2007 and 2010. UC will become more competitive by 2020.
Closing Staff and Faculty Salary GapsHistorically, one of the University’s highest priorities has been to achieve and maintain market-competitive compensation for its employees. The faculty salary gap stands at 10.8% in 2011-12.Annual percentage increases in funding for UC staff salaries lagged in 10 out of the last 15 years. Though the fiscal crisis has set UC back on its efforts, closing faculty and staff salary gaps is one of UC’s most important goals for 2020.
Ladder-rank Faculty Salaries as a Percentage of Market
Excellence requires consistent support and shared priorities.
15.0
16.0
17.0
18.0
19.0
20.0
21.0
22.0
1989-90 1994-95 1999-00 2004-05 2009-10
Budgeted Actual
-$6,000
-$5,000
-$4,000
-$3,000
-$2,000
-$1,000
$0
$1,000
All Students InternationalNonresident Domestic
California Resident
2004 2007 2010
80%
90%
100%
1999-00 2003-04 2007-08 2011-12
Actual Desired Level
S-8
reinvestment in critical elements of the core academic
program. Recognizing that immediate reinvestment in
program quality is constrained by the current fiscal
situation, the reinvestment plan is anticipated to extend
over a multi-year period with the expectation that more
resources will become available in later years, once many
of the financial strategies planned or underway come to
fruition. In the meantime, the 2013-14 budget plan directs
funding to several of the highest priority areas of the core
instruction and research program, areas that have suffered
the greatest deterioration as a result of State funding
reductions: the student-faculty ratio; start-up support for
newly hired faculty, faculty and staff salary gaps; graduate
student support; and instructional support items, including
instructional equipment and technology, libraries, and
building maintenance.
In the short term, the University faces perhaps the most
critical juncture in its history, depending on the outcome of
the November election. The Governor’s revenue-raising
initiative on the November 2012 ballot, Proposition 30,
seeks to provide the State of California with a path forward
to address its structural deficit and reestablish a sound
fiscal footing for State government. The initiative would
temporarily raise income taxes for the wealthiest earners in
the state and temporarily increase the sales tax by one-
quarter of one percent. The revenue would be used to fund
K-12 schools and local public safety programs, freeing up
State General Funds for the discretionary part of the
budget, including higher education. If the initiative passes,
the Governor has stated his intention to support a multi-
year agreement with UC that would promise steady,
moderate support from the State for the first time in a
decade. Such an agreement will permit the University to
keep tuition and fee increases moderate while still
addressing its basic operating needs and leaving open the
opportunity in the future for the State to reinvest in the
quality of the education, research, and public service UC
provides. This agreement is described in more detail later
in this document.
If the initiative fails, the path ahead for the University is
much more difficult. The University will face an immediate
trigger cut of $250 million in the current year. In addition,
the promise of funding in 2013-14 in order to avoid a tuition
and fee increase in the current year will be eliminated,
increasing the immediate shortfall in the University’s budget
to a total of $375 million. This cut would be on top of the
$750 million reduction UC absorbed in 2011-12. When the
loss of these increases is taken into account, the swing
between what the University would receive in 2013-14 if the
initiative passes or fails is more than $500 million. In
addition, if the initiative fails, the State’s role in continuing to
support the University will be highly uncertain. Given the
fiscal challenges it would face, the University would need to
make difficult choices about a wide array of issues that
could alter the very nature of the University.
In short, the University finds itself at a crossroads. UC’s
primary goal, regardless of whether the initiative passes or
fails, is to return to a level of quality that is in keeping with
its tradition of providing access to an affordable, high
quality research university. Developing the resources
necessary to promote all three pillars of excellence is the
goal and challenge that faces the University in the near
term. It is a challenge that the University must meet in
order to preserve the quality that the state, its citizens, and
the University have worked so hard and so long to achieve.
S-9
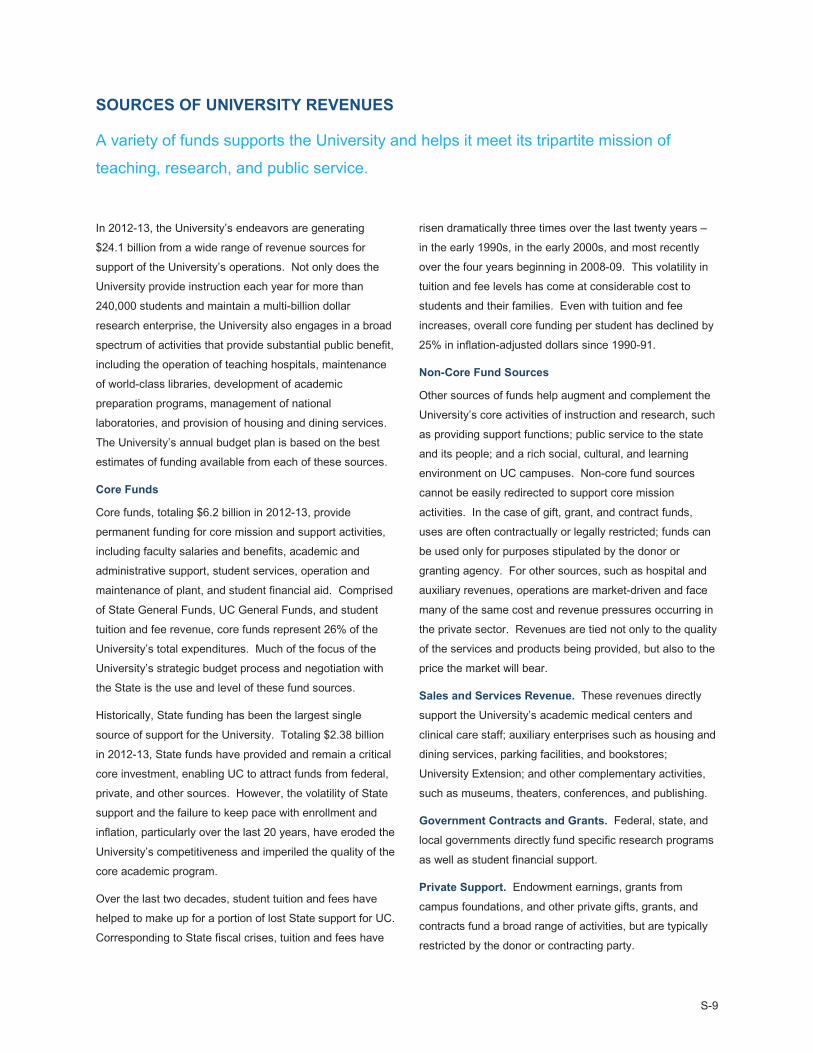
SOURCES OF UNIVERSITY REVENUES
A variety of funds supports the University and helps it meet its tripartite mission of
teaching, research, and public service.
In 2012-13, the University’s endeavors are generating
$24.1 billion from a wide range of revenue sources for
support of the University’s operations. Not only does the
University provide instruction each year for more than
240,000 students and maintain a multi-billion dollar
research enterprise, the University also engages in a broad
spectrum of activities that provide substantial public benefit,
including the operation of teaching hospitals, maintenance
of world-class libraries, development of academic
preparation programs, management of national
laboratories, and provision of housing and dining services.
The University’s annual budget plan is based on the best
estimates of funding available from each of these sources.
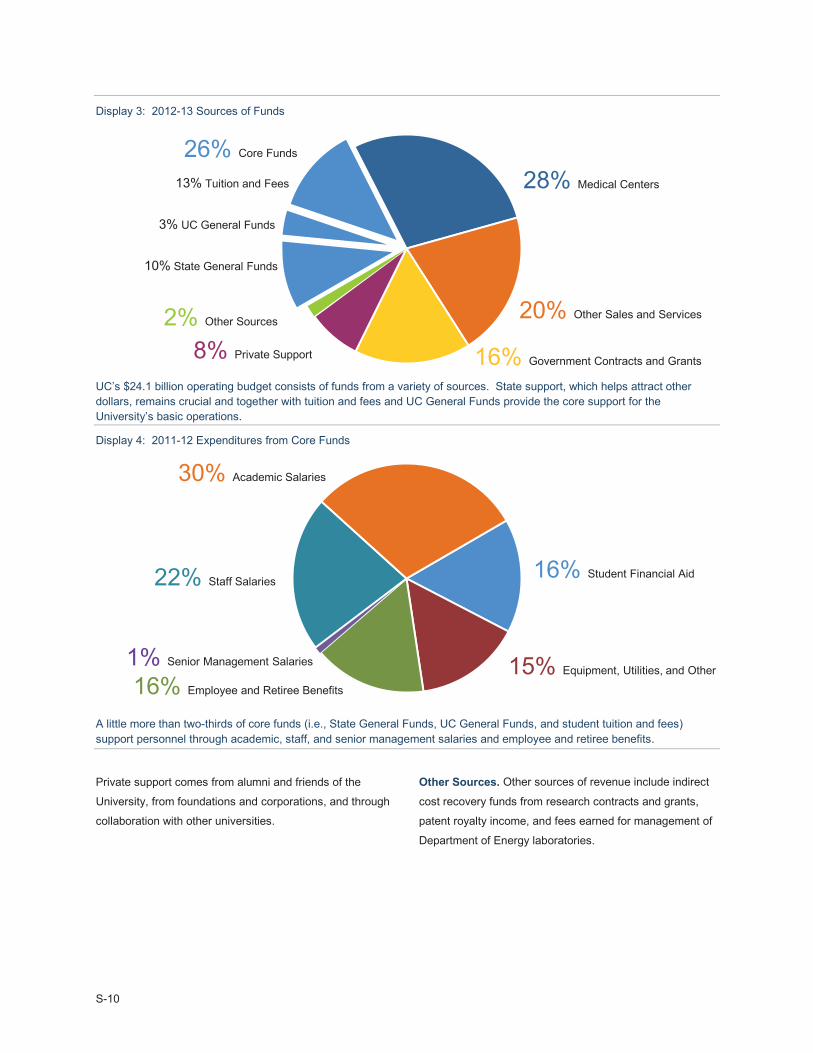
Core Funds
Core funds, totaling $6.2 billion in 2012-13, provide
permanent funding for core mission and support activities,
including faculty salaries and benefits, academic and
administrative support, student services, operation and
maintenance of plant, and student financial aid. Comprised
of State General Funds, UC General Funds, and student
tuition and fee revenue, core funds represent 26% of the
University’s total expenditures. Much of the focus of the
University’s strategic budget process and negotiation with
the State is the use and level of these fund sources.
Historically, State funding has been the largest single
source of support for the University. Totaling $2.38 billion
in 2012-13, State funds have provided and remain a critical
core investment, enabling UC to attract funds from federal,
private, and other sources. However, the volatility of State
support and the failure to keep pace with enrollment and
inflation, particularly over the last 20 years, have eroded the
University’s competitiveness and imperiled the quality of the
core academic program.
Over the last two decades, student tuition and fees have
helped to make up for a portion of lost State support for UC.
Corresponding to State fiscal crises, tuition and fees have
risen dramatically three times over the last twenty years –
in the early 1990s, in the early 2000s, and most recently
over the four years beginning in 2008-09. This volatility in
tuition and fee levels has come at considerable cost to
students and their families. Even with tuition and fee
increases, overall core funding per student has declined by
25% in inflation-adjusted dollars since 1990-91.
Non-Core Fund Sources
Other sources of funds help augment and complement the
University’s core activities of instruction and research, such
as providing support functions; public service to the state
and its people; and a rich social, cultural, and learning
environment on UC campuses. Non-core fund sources
cannot be easily redirected to support core mission
activities. In the case of gift, grant, and contract funds,
uses are often contractually or legally restricted; funds can
be used only for purposes stipulated by the donor or
granting agency. For other sources, such as hospital and
auxiliary revenues, operations are market-driven and face
many of the same cost and revenue pressures occurring in
the private sector. Revenues are tied not only to the quality
of the services and products being provided, but also to the
price the market will bear.
Sales and Services Revenue. These revenues directly
support the University’s academic medical centers and
clinical care staff; auxiliary enterprises such as housing and
dining services, parking facilities, and bookstores;
University Extension; and other complementary activities,
such as museums, theaters, conferences, and publishing.
Government Contracts and Grants. Federal, state, and
local governments directly fund specific research programs
as well as student financial support.
Private Support. Endowment earnings, grants from
campus foundations, and other private gifts, grants, and
contracts fund a broad range of activities, but are typically
restricted by the donor or contracting party.
S-10
Display 3: 2012-13 Sources of Funds
UC’s $24.1 billion operating budget consists of funds from a variety of sources. State support, which helps attract other dollars, remains crucial and together with tuition and fees and UC General Funds provide the core support for the University’s basic operations.
Display 4: 2011-12 Expenditures from Core Funds
A little more than two-thirds of core funds (i.e., State General Funds, UC General Funds, and student tuition and fees) support personnel through academic, staff, and senior management salaries and employee and retiree benefits.
Private support comes from alumni and friends of the
University, from foundations and corporations, and through
collaboration with other universities.
Other Sources. Other sources of revenue include indirect
cost recovery funds from research contracts and grants,
patent royalty income, and fees earned for management of
Department of Energy laboratories.
2% Other Sources
28% Medical Centers
26% Core Funds
13% Tuition and Fees
3% UC General Funds
10% State General Funds
8% Private Support 16% Government Contracts and Grants
20% Other Sales and Services
30% Academic Salaries
16% Student Financial Aid
1% Senior Management Salaries
16% Employee and Retiree Benefits
22% Staff Salaries
15% Equipment, Utilities, and Other
S-11
THE NEED TO ADDRESS THE IMPACT OF CALIFORNIA’S PERSISTING FISCAL CRISIS DRIVES THE UNIVERSITY’S BUDGET PLAN
In a context shaped by the State’s enduring fiscal challenges and the University’s efforts
to respond to inadequate and unreliable State funding, the 2013-14 budget plan marks
the beginning of a multi-year course for strengthening the excellence of the University’s
core instruction and research programs.
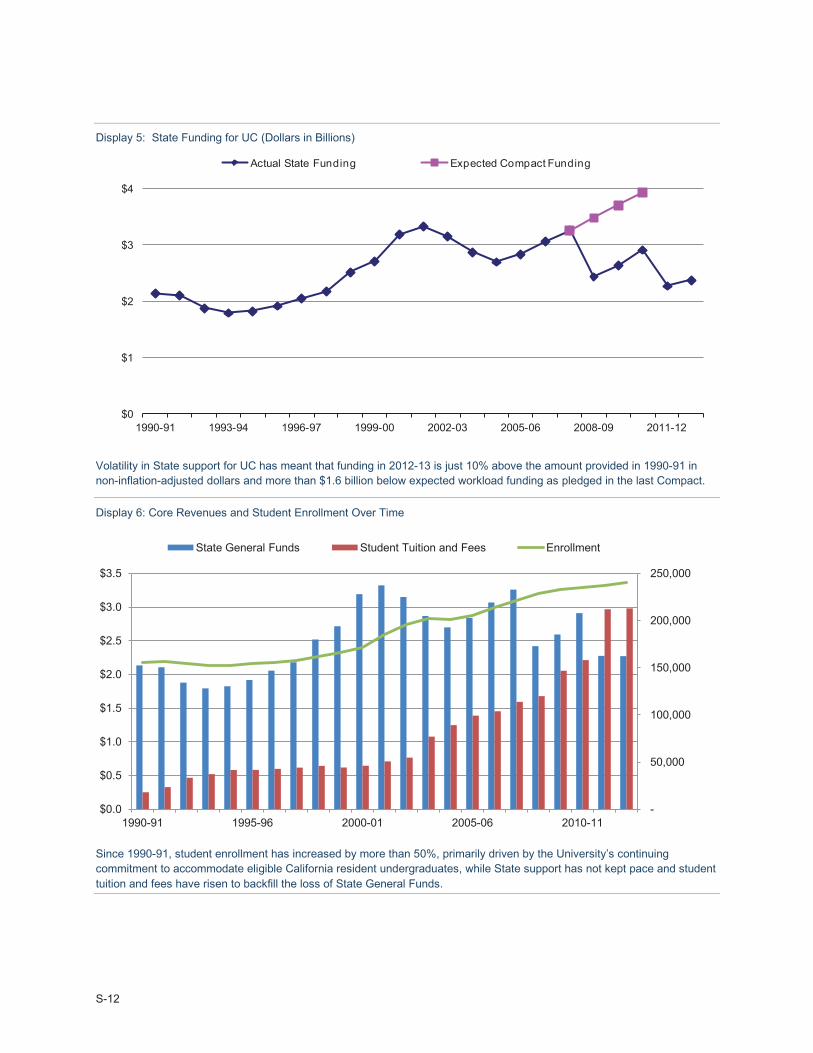
State Funding Has Declined Steadily Over the Last Twenty Years
Since 1990-91, State funding for the University of California
has been marked by dramatic reductions due to recurring
fiscal crises followed by temporary increases tied to
ambitious plans to restore support. While many parts of the
University, such as the medical centers and research
enterprise, have continued to flourish and grow, the
University’s core academic programs have suffered from
this decline in State funding.
In the early 1990s, the University lost the equivalent of 20% of its State support.
Later in the decade, under agreements with Governors Wilson and Davis, significant funding increases were provided for enrollment growth necessary to maintain the University’s commitment to the Master Plan, to avoid student fee increases, and to maintain quality.
Another State fiscal crisis during the early 2000s resulted in a significant step back in State support during a time of rapid enrollment growth due to increases in the number of California high school graduates.
Beginning in 2005-06, UC entered a six-year Compact with Governor Schwarzenegger to provide the minimum resources needed for the University to accommodate enrollment growth and sustain the quality of the institution. Through 2007-08, the Compact served the University, students, and the State well, allowing UC to continue enrollment growth, provide compensation increases for faculty and staff, and avoid a student fee increase in 2006-07.
The State’s ongoing budget shortfalls, compounded by the onset of the global financial crisis, led the State to renege on the Governor’s Compact and resulted in significant reductions in State support at the end of the decade. For two years, no funding was provided for enrollment growth and UC’s base budget was reduced at a time when demand to attend the University soared.Federal economic stimulus funds provided temporary support. When contributions to the UC Retirement Plan
(UCRP) were restarted in April 2010, the State failed to contribute its fair share, which increased the budgetary pressure on the University.
After partially restoring previous cuts to UC’s budget in 2010-11, the State reduced support to UC by$750 million in 2011-12, which included a $100 million mid-year “trigger cut.” The lagging economy and the State’s inability to extend temporary tax increases left State support to the University more than $1.6 billion less than it would have been under the most recent funding agreement with former Governor Schwarzenegger (see Display 5).
The University received $105.9 million in new State funding in 2012-13, including $89.1 million toward the State’s share of employer contributions to the University’s retirement plan. Considering the State’s continuing structural deficit and a projected State revenue shortfall of $15.7 billion, the University fared well relative to other State agencies. Nevertheless, even with this year’s augmentation UC’s State appropriation has fallen nearly $900 million, or 27%, since 2007-08.
The net result of these swings is that State support for UC
in 2012-13 is just $242 million above the amount provided
in 1990-91 in non-inflation-adjusted dollars, reflecting
average growth of just 0.5% annually.1
During this same period of volatility in State funding, the
number of California high school graduates has soared
(see Display 6). Despite lagging State support, the
University has met its commitment to preserve access for
California residents by continuing to accommodate growing
numbers of students prepared for and seeking a quality
university education. Since 1990-91, student enrollment
has risen 52% and UC has opened a tenth campus, while
1 As noted earlier, the 2012-13 Budget Act leaves UC vulnerable to further cuts. If the Governor’s revenue-raising tax initiative fails or is superseded by a competing initiative, the budget calls for a further mid-year trigger cut of $250 million and the elimination of a $125.4 million base budget adjustment in 2013-14 to cover a 2012-13 tuition and fee buy-out.
S-12
Display 5: State Funding for UC (Dollars in Billions)
Volatility in State support for UC has meant that funding in 2012-13 is just 10% above the amount provided in 1990-91 in non-inflation-adjusted dollars and more than $1.6 billion below expected workload funding as pledged in the last Compact.
Display 6: Core Revenues and Student Enrollment Over Time
Since 1990-91, student enrollment has increased by more than 50%, primarily driven by the University’s continuing commitment to accommodate eligible California resident undergraduates, while State support has not kept pace and student tuition and fees have risen to backfill the loss of State General Funds.
$0
$1
$2
$3
$4
1990-91 1993-94 1996-97 1999-00 2002-03 2005-06 2008-09 2011-12
Actual State Funding Expected Compact Funding
-
50,000
100,000
150,000
200,000
250,000
$0.0
$0.5
$1.0
$1.5
$2.0
$2.5
$3.0
$3.5
1990-91 1995-96 2000-01 2005-06 2010-11
State General Funds Student Tuition and Fees Enrollment
S-13
State support has risen only 10% in non-inflation-adjusted
dollars. If an adjustment is made for inflation, State support
to the University since 1990-91 has declined by 44%.
Mitigating State Cuts Has Both Positive and Negative Impacts
To help mitigate the impacts of the reductions in State
funding, UC has been obligated to increase student tuition
and fees. In 1990-91, tuition and fees were just $1,624 for
all California residents. In 2012-13, mandatory systemwide
tuition and fees total $12,192 for California resident
undergraduates and graduate academic students, and
mandatory charges are even higher for graduate
professional students. Increases over the last twenty years
have been implemented to offset cuts in State support
during the three major economic downturns in the State
since 1990. Tuition and fees increased 92% during the
recession of the early 1980s, 134% between 1990-91 and
1993-94, 58% between 2003-04 and 2005-06, and 83%
between 2007-08 and 2011-12.
Even with these steep increases, tuition and fees have only
partially made up for the reductions in State support. As
shown in Display 7, resources for educational programs for
general campus students (undergraduate and graduate
students combined) have declined on an inflation-adjusted
per-student basis – UC is spending less per student.
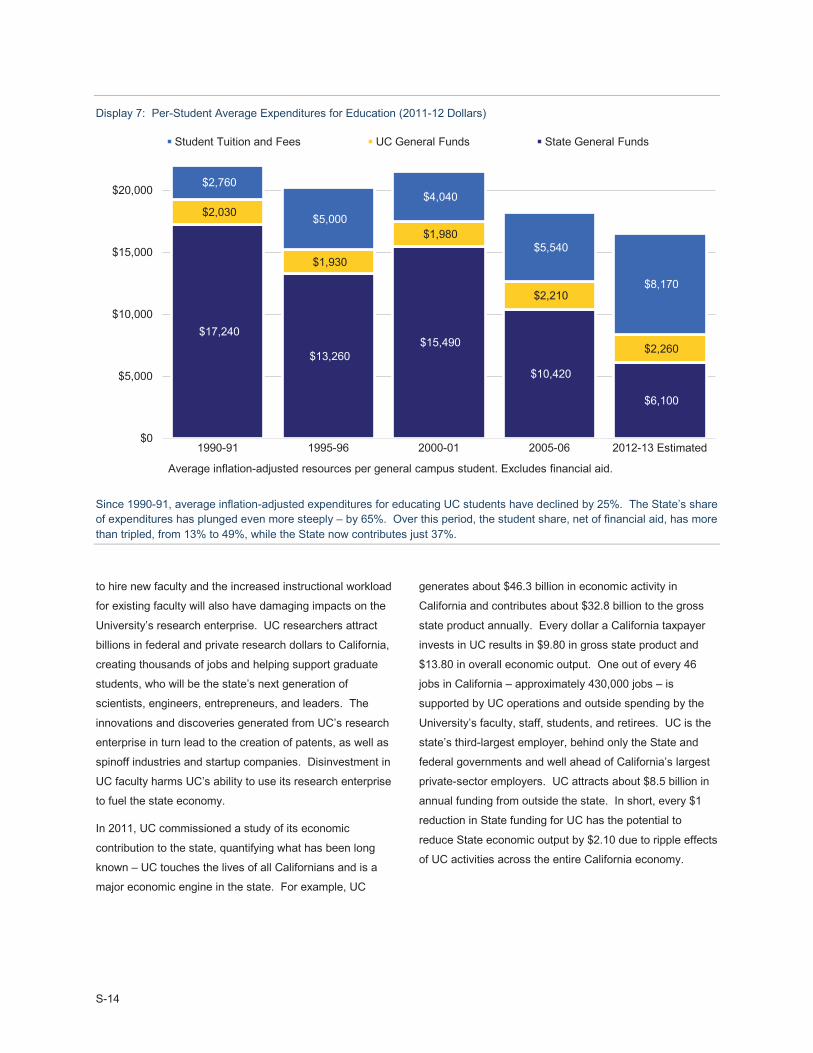
The average expenditure per student for a UC education has declined by 25% over 20 years – from $22,030 in 1990-91 to $16,530 in 2012-13.
State funding per student declined significantly – by 65%over an approximately 20-year period. In 1990-91, the State contributed $17,240 per student – 78% of the total cost. In 2012-13, the State share declined to $6,100, just 37%.
As the State subsidy has declined, the share students pay has more than tripled. In 1990-91, students contributed 13% of the cost of their education; students are paying 49% of the cost of their education in 2012-13.
The impact of State funding reductions has been
compounded for UC by unfunded cost increases for
academic merits, collective bargaining agreements, health
benefits, non-salary price increases, and annually
escalating employer contributions to the UC Retirement
Plan.
Tuition and fee increases have always been a direct result
of inadequate and volatile State support. However, the
University has also taken other actions to address
inadequate State support and unfunded cost increases.
Some of these actions have been positive, but many have
been negative.
Positive actions include operational improvements such as
development of information technology systems that reduce
personnel effort, strategic sourcing, shared library
resources, energy savings programs, curriculum redesign,
elimination or consolidation of redundant operations, new
financial investment strategies, and alternative instructional
delivery.
More significant, however, are the austerity measures
necessitated by the lack of support which have a negative
impact on quality and functionality:
faculty and staff salaries that significantly lag the market;
reduced faculty hiring, leading to rising student-faculty ratios, larger class sizes, and less depth and breadth in course offerings;
inadequate graduate student support;
reductions in services and service hours;
deferral of library material purchases and equipment replacement;
inadequate spending on ongoing building maintenance and the absence of systematic investment in capital renewal and deferred maintenance; and
increased risk due to constraints on administrative oversight.
Austerity measures are inevitable in times of fiscal crisis,
when UC must shoulder its share of cuts in the State
budget. However, such measures are not sustainable in
the long term if the University is to maintain its place among
the world’s top-tier research universities.
The impacts of even short-term actions on the academic
programs are of great concern. For example, reduced
course offerings and contact with faculty will ultimately
undermine the strength of the academic community and
lead to reduced student retention and lengthened time-to-
degree. Meanwhile, due to loss of staff support, remaining
faculty are being asked to assume more administrative
tasks and more student advising. Furthermore, the inability
S-14
Display 7: Per-Student Average Expenditures for Education (2011-12 Dollars)
Since 1990-91, average inflation-adjusted expenditures for educating UC students have declined by 25%. The State’s share of expenditures has plunged even more steeply – by 65%. Over this period, the student share, net of financial aid, has more than tripled, from 13% to 49%, while the State now contributes just 37%.
to hire new faculty and the increased instructional workload
for existing faculty will also have damaging impacts on the
University’s research enterprise. UC researchers attract
billions in federal and private research dollars to California,
creating thousands of jobs and helping support graduate
students, who will be the state’s next generation of
scientists, engineers, entrepreneurs, and leaders. The
innovations and discoveries generated from UC’s research
enterprise in turn lead to the creation of patents, as well as
spinoff industries and startup companies. Disinvestment in
UC faculty harms UC’s ability to use its research enterprise
to fuel the state economy.
In 2011, UC commissioned a study of its economic
contribution to the state, quantifying what has been long
known – UC touches the lives of all Californians and is a
major economic engine in the state. For example, UC
generates about $46.3 billion in economic activity in
California and contributes about $32.8 billion to the gross
state product annually. Every dollar a California taxpayer
invests in UC results in $9.80 in gross state product and
$13.80 in overall economic output. One out of every 46
jobs in California – approximately 430,000 jobs – is
supported by UC operations and outside spending by the
University’s faculty, staff, students, and retirees. UC is the
state’s third-largest employer, behind only the State and
federal governments and well ahead of California’s largest
private-sector employers. UC attracts about $8.5 billion in
annual funding from outside the state. In short, every $1
reduction in State funding for UC has the potential to
reduce State economic output by $2.10 due to ripple effects
of UC activities across the entire California economy.
$17,240
$13,260 $15,490
$10,420
$6,100
$2,030
$1,930
$1,980
$2,210
$2,260
$2,760
$5,000
$4,040
$5,540
$8,170
$0
$5,000
$10,000
$15,000
$20,000
1990-91 1995-96 2000-01 2005-06 2012-13 Estimated
Student Tuition and Fees UC General Funds State General Funds
Average inflation-adjusted resources per general campus student. Excludes financial aid.
S-15
The 2013-14 Budget Plan Marks the Beginning of a Multi-Year Reinvestment in UC’s Core Academic Programs
For the University of California to continue to be the world-
class public research university California has taken pride
in and benefited from, it must have sufficient resources over
the long term to employ outstanding faculty and staff,
recruit and educate well the best undergraduate and
academic and professional graduate students, engage in
robust programs of research, scholarship, and creative
activity, share its expertise and resources with the people of
California, and provide the considerable infrastructure
necessary to support its expansive operations.
The 2013-14 budget plan sets the groundwork for a new
multi-year plan to stabilize funding, provide a course for
addressing the University’s ongoing mandatory costs and
recent budget cuts, and leverage new sources of revenue
and cost reduction to reinvest in quality.
After a twenty-year trend of State disinvestment in higher
education punctuated by severe cuts in State support over
the last four years, UC’s stature as a world-class public
research university is imperiled unless it moves to reverse
the erosion of support for its core academic activities. State
funds now comprise just 10% of UC’s total budget, down
from 24% in 1990-91. The University’s expansive efforts to
broaden its revenue base and reduce costs through
administrative efficiencies have helped to mitigate the
impact of State cuts, but the University’s core instructional
and research programs still rely primarily on the
combination of State funds and tuition and fees. These
core funds remain the foundation of UC’s academic
program. Fully 97% of ladder-rank and equivalent faculty,
for example, are paid on core funds. Sustained cuts in
State funding and unfunded cost increases have taken their
toll on the quality of UC’s academic enterprise.
Since the latest State budget crisis began, State funds have
been reduced by $880 million – from $3.26 billion to
$2.38 billion – representing a 27% reduction. As noted
above, the shortfall is exacerbated by the fact that the State
has also not provided funding for $1.2 billion in mandatory
cost increases during that time. Tuition and fees have only
mitigated about 39% of the budget gap in recent years,
leaving campuses to absorb the remaining shortfall.
As noted earlier, the University’s budget shortfall is
projected to grow dramatically (the $2.9 billion gap
identified in Display 2) due to a variety of cost pressures.
Assuming passage of the Governor’s tax initiative and a
multi-year funding agreement with the State, the University
will be able to address most of this funding gap through
moderate increases in both State funding and tuition and
fees, as well as revenue enhancement and administrative
efficiencies that the University is currently pursuing. But
covering such costs, as substantial as they are, only
maintains the status quo. Investing in UC’s legacy of
excellence requires additional resources.
The University must ultimately address not only UC’s
mandatory costs, but also the overall level of core funding
needed to protect and enhance the quality of UC’s
academic programs. Within the constraints of the State’s
lingering fiscal woes, the 2013-14 budget plan recognizes
that such an investment represents a multi-year
commitment, yet sets the groundwork for moving forward
by proposing strategic investments in UC’s core academic
program – specifically investing in faculty, the cornerstone
of UC’s tradition of excellence; in graduate student support;
and in basic infrastructure needed to sustain the academic
program.
To fund this investment, the University is pursuing a wide
variety of alternative strategies ideas for cutting
administrative costs and generating new revenues, beyond
those already planned or underway to address basic
operating costs. At their September retreat, the Regents
were presented with a comprehensive list of these ideas in
four primary categories: balance street strategies; business
and finance strategies; enrollment, tuition and financial aid;
and proposals to enhance academic delivery of programs
or otherwise revise the academic model. The alternative
strategies ideas include:
asset management opportunities, such as restructuring working capital from the Short-term Investment Pool (STIP) to the Total Return Investment Pool (TRIP);
parking securitization, under which the University would receive an up-front monetization of its parking assets;
consolidation of medical center infrastructure andrationalization of the delivery of clinical services;
increases in systemwide contract utilization;
S-16
changes in health and welfare benefits (e.g., introducing a self-insured health plan option through UC’s medical centers, modifying employer contributions to health premiums, and revisiting UCRP and annuitant health reforms to further reduce employer costs);
further increases in nonresident student enrollment;
reform of UC’s financial aid model (e.g., refocusing on maintaining net cost rather than a fixed percentage of return-to-aid, and using philanthropy and other fund sources to help maintain the net cost for students with financial need); and
implementing differential tuition by campus or discipline.
Most of these proposals will not generate significant
revenue in 2013-14, but are expected to offer opportunities
for generating positive fiscal impacts over the next few
years. These options and others that the University is
currently exploring will support a multi-year reinvestment in
areas critical to UC’s core mission.
S-17
ACTIONS TO ADDRESS BUDGET SHORTFALLS
The State’s enduring fiscal challenges, the long-term decline in State support, and
substantial mandatory cost increases are forcing the University to reexamine all aspects
of its operations and develop new strategies.
As noted previously, the 2012-13 State-funded budget for
UC is nearly $900 million less than the level provided in
2007-08. Moreover, the State has steadily disinvested in
the University over the last 20 years. This long-term
decline in State support, combined with substantial
mandatory cost increases that have gone unfunded by the
State, has led the University to examine all aspects of its
operations to identify solutions that will have a positive
fiscal impact on its budget. Efforts at the campus level,
along with systemwide initiatives, are being implemented in
order to reduce costs and identify alternative revenue
sources, both in the short term and the long term.
Campus Actions
For four years, campuses have been implementing
measures to address funding shortfalls and discover new
ways of operating with far fewer funds. Academic and
administrative units on the campuses have been assigned
cuts ranging in general from 0% to 35%. More than 4,200
staff have been laid off and more than 9,500 positions have
been eliminated or remain unfilled since the most recent
fiscal crisis began. Over 180 programs have been
eliminated and others consolidated for an estimated
savings of over $116 million.
Against this backdrop it is important to note that the
University currently enrolls about 11,500 students for whom
it has never received funding from the State; when budget
cuts are taken into account, the University estimates it
enrolls more than 25,000 unfunded students. In addition,
UC lost more faculty to retirement and attrition than it hired
last year; total hires were more than 200 faculty less than
total separations, yet enrollment has grown by more than
10,000 students since the fiscal crisis began. All campuses
report moving aggressively toward implementing shared
service centers to reduce duplication and streamline
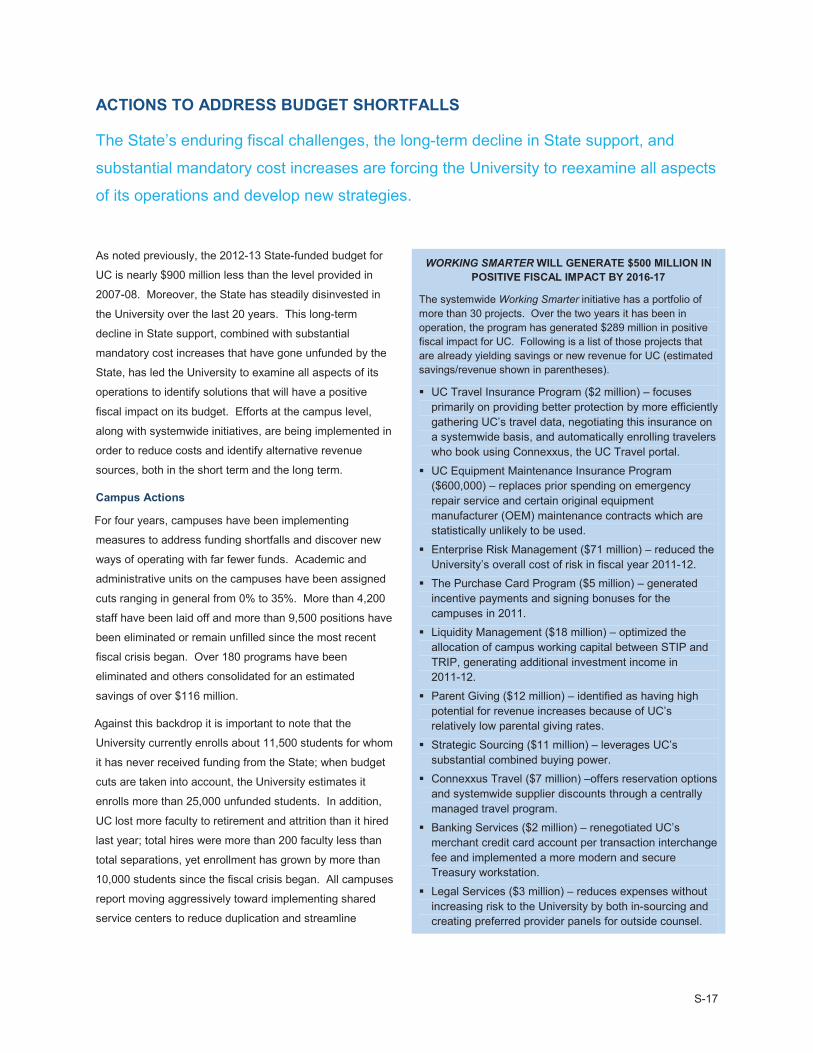
WORKING SMARTER WILL GENERATE $500 MILLION IN POSITIVE FISCAL IMPACT BY 2016-17
The systemwide Working Smarter initiative has a portfolio of more than 30 projects. Over the two years it has been in operation, the program has generated $289 million in positive fiscal impact for UC. Following is a list of those projects that are already yielding savings or new revenue for UC (estimated savings/revenue shown in parentheses).
UC Travel Insurance Program ($2 million) – focusesprimarily on providing better protection by more efficiently gathering UC’s travel data, negotiating this insurance on a systemwide basis, and automatically enrolling travelers who book using Connexxus, the UC Travel portal.
UC Equipment Maintenance Insurance Program($600,000) – replaces prior spending on emergency repair service and certain original equipment manufacturer (OEM) maintenance contracts which are statistically unlikely to be used.
Enterprise Risk Management ($71 million) – reduced the University’s overall cost of risk in fiscal year 2011-12.The Purchase Card Program ($5 million) – generated incentive payments and signing bonuses for the campuses in 2011.Liquidity Management ($18 million) – optimized the allocation of campus working capital between STIP and TRIP, generating additional investment income in 2011-12.
Parent Giving ($12 million) – identified as having high potential for revenue increases because of UC’s relatively low parental giving rates.
Strategic Sourcing ($11 million) – leverages UC’s substantial combined buying power.Connexxus Travel ($7 million) –offers reservation optionsand systemwide supplier discounts through a centrally managed travel program.Banking Services ($2 million) – renegotiated UC’s merchant credit card account per transaction interchange fee and implemented a more modern and secure Treasury workstation.
Legal Services ($3 million) – reduces expenses without increasing risk to the University by both in-sourcing and creating preferred provider panels for outside counsel.
S-18
processes. All campuses have curtailed faculty recruitment.
No campus is applying across-the-board cuts; each is using
a consultative, deliberative process to determine how
reductions should be allocated. All campuses are applying
disproportionate cuts to administrative programs in order to
reduce the impact on academic programs. Campuses also
report taking a wide variety of other measures to avoid or
reduce costs and raise new revenue to address budget
shortfalls. Some examples from the campus reports are
listed below. A more complete report on campus actions to
address budget gaps can be found at
http://regents.universityofcalifornia.edu/regmeet/jul12/f1.pdf.
Between April 2009 and April 2011, the Berkeley campus
reduced its staff workforce by more than 900, a drop of
10%; further reductions have occurred since. Davis reports
that there are 500 fewer faculty and staff FTE supported by
general funds and tuition than there were four years ago.
Irvine recently lost three professors to other institutions who
received salary increases of $27,000 to over $87,000 from
its competitors. Several organized research units on the
Los Angeles campus have been eliminated, including the
Institute of Social Research and the Brain Injury Institute.
At Merced, while the campus is being spared from budget
cuts as it continues to strive for self-sufficiency, the campus
is still severely underfunded and is struggling to contain and
avoid costs. The Riverside campus reports that the
average size of an undergraduate lower division lecture
class has increased 33%, from just over 66 in Fall 2008 to
over 88 in Fall 2011. San Diego has reduced library
services, including closing four out of nine library locations
and significantly reducing library staff, for a savings of
$2 million. San Francisco has eliminated Clinical Nurse
Specialist programs in cardiovascular care and neonatal
intensive care, as well as nurse practitioner programs.
Santa Barbara reports that the number of lecture,
laboratory, and seminar classes has been reduced by 6.5%
(94 classes) since 2007 at the same time enrollment has
grown by 1%. Santa Cruz reports that the funding
associated with 124 of the campus’ budgeted faculty FTE
has been cut.
These are just a few examples of the wide range of actions
underway at the campus level to address the
unprecedented cuts that have occurred to their budgets.
Systemwide Initiatives Underway
As noted earlier, the University projects a shortfall of
$2.9 billion by 2016-17, absent any revenue generating or
cost-cutting measures. Several strategies to raise new
revenue, cut costs, or otherwise have a positive fiscal
impact on this shortfall have already been initiated. It is
expected that together these initiatives will provide more
than $1 billion of solutions aimed at addressing the
$2.9 billion gap.
Working Smarter. The University’s five-year program to
introduce administrative efficiencies across the system is
expected to ultimately generate $500 million of positive
fiscal impact; two-thirds of these savings are expected to
accrue to core fund sources.
Philanthropy. The University aims to raise $50 million
annually in unrestricted or more flexible philanthropy.
Obtaining this additional revenue will require a considerable
expansion of UC’s fundraising efforts, as well as efforts to
request the elimination of endowment restrictions from
donors.
Research Cost Recovery. UC is pursuing increased
research indirect cost recovery (ICR) above current levels
over four years, ultimately for a total savings of $120
million, through negotiated increases in federal ICR rates
and reductions in ICR waivers for private and State
contracts and grants.
Nonresident Enrollment. Most campuses are increasing
enrollment of nonresident undergraduates. These students
pay more than the actual cost of their education. Every
1,000 nonresident students generates close to $23 million
in Nonresident Supplemental Tuition.
Other cost reductions. The University is also achieving
savings through efficiencies in central functions, reductions
and eliminations of earmarked programs that do not
advance the core mission of UC, and limits on increases in
the cost of employee and retiree health benefits. These
efforts could yield $120 million in savings by 2016-17.
S-19
MULTI-YEAR PLANNING WILL HELP BUILD FISCAL STABILITY
Fostering and maintaining quality at the caliber of the University of California requires
long-term planning and investment that, in turn, require fiscal stability.
The excellence that has made UC one of the very best
universities in the world is based on a long-term investment
that has taken many decades to develop. And yet, that
excellence is fragile and can rapidly disappear if the current
disinvestment by the State is not addressed.
The volatility in State funding in recent years has made it
difficult for campuses to plan – but thoughtful long-term
planning is fundamental to a world-class institution like UC.
Decisions to hire and tenure faculty; enroll students; add or
expand academic programs; build new residence halls,
classrooms, or research facilities; and invest in books or
digital technology for libraries all involve long-term
investments that require assurance of stable funding in the
future. Put another way, the University is unlike many
businesses, which can quickly increase or reduce
production and inventories depending on market conditions.
Without the assurance of stable funding, UC is inhibited
from making decisions that are essential to operating a
major research institution and allowing it to move forward,
particularly since the swings in State support are now
deeper and of longer durations.
UC’s high-quality faculty is its most precious asset. The
unpredictability and uncertainty that characterize the
current environment have led to a growing lack of
confidence among many faculty about UC’s ability to
maintain quality and provide competitive compensation and
benefits in the years ahead. Continued instability of UC’s
core funding will jeopardize the institution’s ability to recruit
and retain high quality faculty.
At the same time, students and their families have been hit
with large, frequent, unpredictable, and untimely tuition and
fee increases, while also feeling the effects of budget cuts
on the instructional program through reduced course
offerings, increased class sizes, and curtailed student
services. The instability of the University’s budget
promotes uneasiness among students and their families
about whether the high quality education to which students
work hard to gain access will be available in future years.
While considerable uncertainty remains about the fiscal
condition of the State, the 2013-14 budget is built on the
assumption that the University must gain some level of
fiscal stability to move forward. That stability requires
predictability of future State support and tuition and fee
levels, the two primary revenue sources supporting UC’s
core academic mission.
If the Governor’s tax initiative passes, the University and
the State may realize a level of fiscal stability that has been
lacking since the recent fiscal crisis began. As noted
earlier, the Governor has indicated that he will support a
long-term funding agreement with the University if his
initiative is successful. Such an agreement is likely to
include base budget adjustments of 6% annually through
2016-17, as well as a multi-year tuition and fee plan that
would include predictable and moderate tuition and fee
increases (between 6% and 7.5%, contingent on the State
funding the specified base budget adjustments). The State
would continue to contribute to student financial aid
equivalent to current commitments. The agreement would
also likely include performance metrics tied to such
variables as time-to-degree and transfer student
enrollments.
While a multi-year agreement is likely to provide no more
than a minimum level of support for the University over the
next five years, it would provide the foundation for
predictable and stable funding that is so critical for the
University as it faces decisions regarding how to reinvest in
quality in the future.
S-20
SUMMARY OF THE UNIVERSITY’S 2013-14 EXPENDITURE PLAN
To achieve its goals in the coming years, UC must strive to protect access, affordability,
and quality, at the same time maintaining fiscal health through key investments,
administrative efficiencies, and new sources of revenue.
SUMMARY OF PROPOSED INCREASES IN REVENUE
State General Funds
The University’s 2013-14 budget plan calls for moderate
increases in both State funding and tuition and fees,
consistent with the general framework of a multi-year
funding agreement that the University has been negotiating
with the Governor’s Office. The plan calls for $290.6 million in new State General
Funds, including: $125.4 million associated with the 2012-13 tuition and fee buy-out, as provided in the 2012-13 Budget Act;
$150.2 million from a 6% base budget adjustment; and
$15 million for the new UC Riverside medical school.
The plan assumes that the Governor’s revenue-raising
initiative will pass and that the University will secure a multi-
year funding agreement with the State, as proposed by the
Governor during negotiations on the 2012-13 budget.
Under the broad terms of the agreement, UC would receive
a 6% base budget adjustment from which it would need to
cover operating needs. Approximately 2% would be
earmarked as the State’s contribution to UC’s retirement
system costs and the rest as a general base adjustment to
be used to fund other operating cost increases.
In October 2012, the Riverside campus received notice of
preliminary accreditation for its new medical school. The
inaugural class of 50 students will enroll in Fall 2013.
Above the 6% base budget adjustment proposed in the
multi-year funding agreement, the University is requesting
$15 million to fund this critically important initiative, as
building a new medical school, which will be a regional and
statewide resource, cannot be sustained through a
redirection of existing resources. It is critical that the State
commit to this endeavor by providing core support for the
school’s academic program and basic operations.
Student Tuition and Fees
Also consistent with the principles of the proposed multi-
year funding agreement, the budget plan assumes
$163.7 million in revenue associated with a 6% (or $732)
increase in tuition and fees, of which a net of 5%, or
$126.5 million (after financial aid is accounted for) would be
available for operating costs. In addition, planned
increases in professional school fees, which vary by
discipline and range from between 0% and 35%, are
expected to generate a total of $20.8 million, of which
$7.5 million would be used for financial aid. For
undergraduates, the plan assumes that the equivalent of
33% of new tuition and fee revenue will be returned to
financial aid, with one-half of this amount coming from
corporate fundraising or other University sources. The plan
also assumes the equivalent of 33% in return-to-aid for
professional school students and 50% in return-to-aid for
graduate academic students. UC General Funds
Campuses have sought to expand nonresident enrollment
as a strategy to increase revenues. The budget plan
proposes $23 million in new revenue from Nonresident
Supplemental Tuition associated with a projected increase
in nonresident enrollment of 1,000 students, and a modest
increase in indirect cost recovery due to higher rates
achieved in recent renegotiations. Alternative Revenue Sources
As noted earlier, at their September retreat the Regents
were presented with a comprehensive list of “out-of-the-
box” ideas about how to enhance revenues and reduce
costs. Most of the proposed strategies are not expected to
generate significant revenue in the short term, but offer
opportunities in 2014-15 and subsequent years. The
University will continue to pursue these and other options
as it moves to stabilize its funding over the longer term. In
the meantime, the 2013-14 plan assumes $80 million of
S-21
new revenue from the restructuring of State lease revenue
bond debt, $20 million from asset management strategies
(i.e., moving Short Term Investment Pool funds to the Total
Return Investment Pool), and $20 million from procurement
savings through new systemwide contracts.
In addition, the University is planning to raise $20 million in
revenue from other sources, such as philanthropy, to assist
with meeting its financial aid goals to provide the equivalent
of 33% return-to-aid associated with the proposed increase
in mandatory systemwide tuition and fees. If these
alternative funds were not used for financial aid, the
University would have needed to ask the Regents to
approve a slightly higher tuition and fee increase for
2013-14 to ensure that the University generates sufficient
new revenue for both its operating budget needs and its
financial aid needs. SUMMARY OF PROPOSED EXPENDITURES The plan proposes $641.5 million in expenditure increases
for 2013-14. These increases consist of the following: $22.4 million to cover enrollment growth of 1% above current funded levels, or about 2,100 students, including continued expansion of the Merced campus and addressing unfunded enrollment of California residents and in the health sciences. The funding is based on amarginal cost of $10,000 for all students and supplemental funding for health sciences students;
$13.3 million, net of financial aid, for supporting instructional programs and maintaining quality in professional school programs;
$15 million to support planning and start-up activities for the UC Riverside medical school; $77.2 million to support new employer contribution costs for UC’s retirement plan associated with moving to a 12% employer contribution rate in 2013-14;$11.4 million in employee health benefit costs to fund an increase of approximately 3.5% in health benefit plans overall, or one-half the amount that had originally been planned. This represents one of the University’s aggressive “out-of-the-box” strategies for reducing costs, as discussed at the September Regents’ retreat;$6.4 million in retiree health benefit costs needed to provide funding for UC retiree health benefit cost increases equivalent to that being provided to other State employees;
$30 million to continue the academic merit program,critical to retaining high quality faculty;$100.2 million to cover 3% increases in merit-based
compensation for represented and non-represented employees. Salaries for represented employees are subject to notice, meeting and conferring, and/or consulting requirements under the Higher Education Employer-Employee Relations Act (HEERA);$37.2 million in continuation costs for a 3% mid-year salary increase to be implemented in 2012-13 if the Governor’s revenue-raising initiative passes;$23.7 million in non-salary price increases, representing a 2% increase over the prior year plus $8 million for rising electricity and natural gas costs; and$25 million for deferred maintenance and capital renewal,as the first of a multi-year effort to reinvest in UC’s aging facilities.
The plan also assumes repayment of $60 million of STIP
borrowing by campuses to help bridge the budget shortfall
in 2012-13. In addition to funding these basic operating costs, the
2013-14 budget plan includes the first year of a multi-year
reinvestment in the quality of the University’s academic
programs. The plan is focused on several well-established
and closely watched measures of academic program
quality, including the following: Reducing the student-faculty ratio. Delays in faculty hiring and unfilled vacancies have dramatically increased the actual student-faculty ratio. The University’s long-term goal is to return the actual student-faculty ratio to the budgeted level of 18.7:1.Increasing revenue to cover faculty start-up costs.Attracting high quality faculty requires up-front investment for research support, lab renovations, andother support. This has become extremely challenging in the current constrained budget environment.
Reducing faculty and staff salary gaps. Faculty salaries currently lag the average of the University’s comparison institutions by 10.8%; there is a similar or greaterproblem with staff salaries in most categories. Paying competitive salaries is critical to UC’s ability to recruit and retain the employees needed to secure the University’s future as a preeminent research university.Increasing graduate student support to competitive levels. UC graduate support packages fall far short of the packages offered by competing institutions. Enhancing undergraduate instructional support.Investments are needed in instructional technology, libraries, instructional equipment replacement, and building maintenance, all critical to the quality of the academic program.
S-22
A combination of State resources and tuition and fee
revenue is required to meet the University’s basic operating
costs and lose no further fiscal ground. Just to stay even –
in other words, to maintain its current fiscal position – the
University needs about $300 million in new revenue every
year to support cost increases on core funded-programs
needed to keep pace with workload, inflation, and other
market costs. These costs consist of the following:
enrollment growth, estimated at 1% per year, although enrollment increases in most years have exceeded this rate;employer contributions to the University’s retirement system, which will continue to be required to at least support normal cost and ultimately to help retire the unfunded liability;
health and welfare benefit increases;
annuitant health benefit increases;academic merit increases;
compensation increases for all employees – represented and non-represented – needed to stay even with inflationand lose no further ground to UC’s competition. This would not, however, help to close the current market gaps that exist between UC and its competitors;non-salary price increases, needed to stay even with inflation on non-salary expenditures; and
deferred maintenance and capital renewal.
Most of these cost increases are in one way or another
related to compensation and benefits for University
employees. While there are many pressures externally and
internally to keep these costs down, and despite the actions
the University has taken to control these costs, the fact of
the matter is that costs associated with employees make up
about 70% of the University’s operating budget. These
employees teach the students, conduct research, provide
services to the public, and keep the University operating on
a day-to-day basis. More importantly, the quality of the
University’s instruction and research programs is explicitly
tied to the success and performance of the University’s
employees. When enrollment increases occur and the
University is unable to hire new faculty to address these
increases, this has a direct bearing on such quality
indicators as class size, depth and breadth of instructional
offerings, research opportunities, and a variety of other
equally important measures of quality which allow the
University to compete for talented faculty and staff and
attract top students. An inability to hire, or even retain,
knowledgeable, qualified employees will ultimately hinder
the University from ensuring the quality of its programs.
Keeping pace with market-driven employee-related costs is
one of the most critical elements of the University’s budget
plan.
In the 2013-14 budget plan, mandatory cost increases total
$361.8 million. Even if the State returns to supporting its
share of funding cost increases on the State-funded portion
of the budget, rising costs continue to occur on the tuition
and fee-funded portion of the budget and those, too, must
be funded. Moreover, the tuition and fee-funded portion of
the budget now exceeds the State-funded portion by
hundreds of millions of dollars, making it imperative that
tuition and fee increases bear some share of responsibility
for funding these cost increases, thus the inclusion of a 6%
increase in tuition and fees in the 2013-14 budget plan.
It is critical to adopt this plan in November in order to allow
for sufficient notice to students and their parents to plan for
the coming year. Tuition increases implemented on short
notice create major challenges for students, parents, and
UC’s financial aid offices in terms of planning for
educational costs and financial aid packages. Moreover,
statutory language adopted in the 2012 legislative session
(AB 970, Fong) requests UC to adopt much stricter policies
with regard to advance notice and consultation before
setting tuition and fee increases and the elapsed time
between when a vote to increase tuition and fees is taken
and their implementation date. While this language does
not become operative until January 1, 2013, adopting a
tuition and fee increase in November is consistent with the
spirit of advanced notice contained in the legislation.
While increasing tuition and fees is always difficult, these
proposed increases are considerably moderated from the
double-digit increases the University has contemplated, and
implemented, in recent years because of the volatility of
State funding. Also, there is nothing precluding the State
from buying out the planned tuition and fee increase in any
year in which there are sufficient resources to do so. For
example, the State bought out every fee increase planned
for seven consecutive years following the then-
unprecedented recession, and significant fee increases that
occurred in the early 1990s.
S-23
ENROLLMENT GROWTH AND INSTRUCTIONAL PROGRAM EXPANSION
Accommodating enrollment without sufficient resources means that new and continuing
students alike are denied the highest quality academic experience.
California Resident Enrollment Growth
UC has long accepted its obligation, as a land-grant
institution and in accordance with the Master Plan for
Higher Education, to provide a quality education to all
eligible California resident undergraduate students who
wish to attend. This commitment was underscored in the
Compact with Governor Schwarzenegger, which included
an expectation of enrollment growth of about 2.5% annually
through 2010-11 as growth in the number of high school
graduates peaked. Funding for this growth was provided
during the first three years of what was intended to be a six-
year Compact.
In addition, the University planned to rebalance the
proportions of graduate and undergraduate students to
better meet state workforce needs, particularly in the health
science disciplines. UC was planning for continued growth
in graduate and professional enrollments after 2010-11,
when demographic projections indicated there would be a
significantly slower rate of growth in undergraduates.
The State was unable to provide funding for enrollment
growth that occurred during 2008-09 and 2009-10. As a
result, in 2009-10, UC enrolled more than 15,000 FTE
students for whom the State had not provided enrollment
growth funding.
In response to the State’s inability to provide the resources
necessary to support enrollment demand, particularly at the
undergraduate level, the University planned to slow
enrollment growth, reducing the number of new California
resident freshmen by more than 2,000 students in 2009-10
and by 1,800 during 2010-11. During these years, fewer
students were admitted to the campus or campuses of their
choice and more applications were sent to the referral pool
for accommodation, primarily at Merced. As a result,
students had fewer UC campus choices and, in some
cases, chose to pursue their education at other institutions.
The actual curtailment of freshmen was somewhat lower
than planned, with a reduction of approximately 1,000
students over a four-year period.
The freshman reductions were partially offset by a planned
increase of more than 1,000 California Community College
(CCC) transfer students. In fact, transfer enrollment grew
by nearly 1,300 over this period, exceeding the planned
increase. UC took this action in order to preserve the
transfer option in difficult economic times.
In 2010-11, the State budget provided enrollment growth
funding of $51.3 million to support 5,121 FTE students at
UC. No additional funds were provided for enrollment
growth in 2011-12, however, and the extraordinary
reduction in State support over the last several years
effectively means that the State is not providing support for
more than 25,000 California residents (based on a DOF
methodology) in 2012-13.
Accommodating enrollment without sufficient resources (as
student tuition and fees do not cover the cost of instruction)
means that new and existing students alike are affected by
the lack of resources needed to support a high quality
academic experience. Though campuses are employing a
variety of measures to deal with the budget shortfall –
dramatically slowing the hiring of permanent faculty,
narrowing course offerings, increasing class sizes,
curtailing library hours, and reducing support services for
students – these are negatively impacting what has
historically been an educational program characterized by
excellence and opportunity.
During a budget crisis, such steps are necessary. But
these actions are not sustainable over a long period of time
if the quality of the University is to be preserved. Revenue
from student tuition and fees has helped, but it has been
insufficient to fully address the loss of State funding.
Historically, the University has offered access, affordability,
and quality. The draconian reductions over the past
several years, however, mean that the University cannot
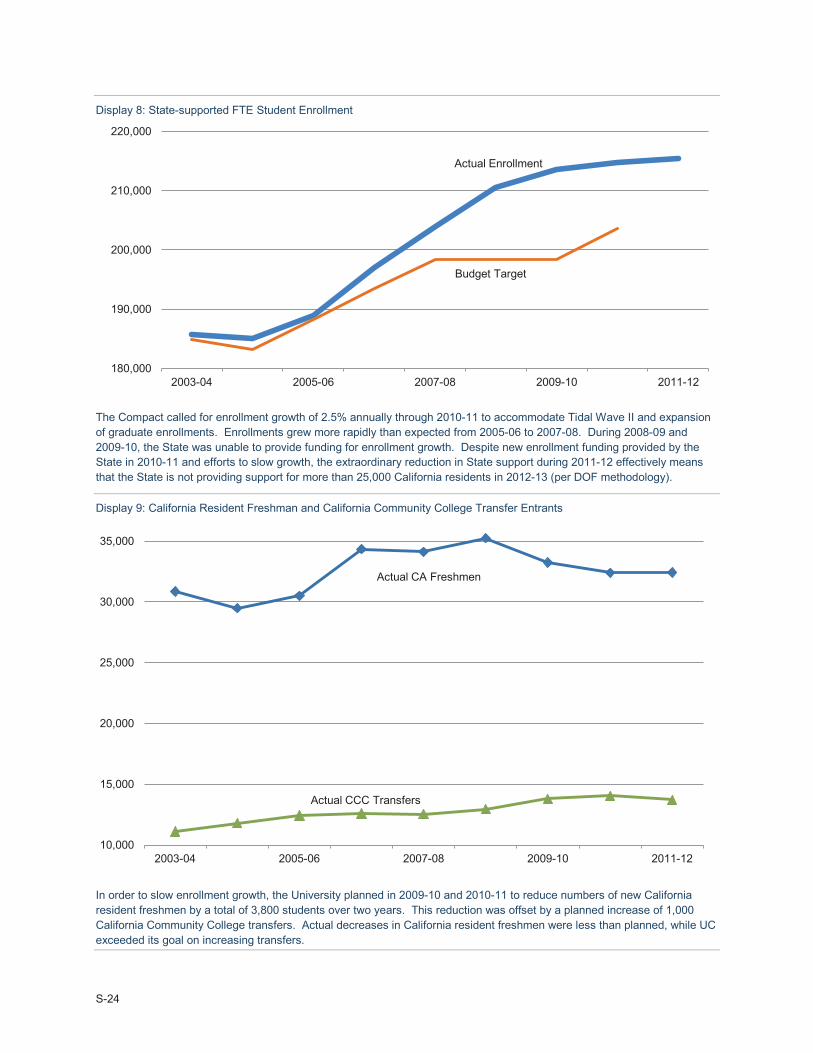
S-24
Display 8: State-supported FTE Student Enrollment
The Compact called for enrollment growth of 2.5% annually through 2010-11 to accommodate Tidal Wave II and expansion of graduate enrollments. Enrollments grew more rapidly than expected from 2005-06 to 2007-08. During 2008-09 and 2009-10, the State was unable to provide funding for enrollment growth. Despite new enrollment funding provided by the State in 2010-11 and efforts to slow growth, the extraordinary reduction in State support during 2011-12 effectively means that the State is not providing support for more than 25,000 California residents in 2012-13 (per DOF methodology).
Display 9: California Resident Freshman and California Community College Transfer Entrants
In order to slow enrollment growth, the University planned in 2009-10 and 2010-11 to reduce numbers of new California resident freshmen by a total of 3,800 students over two years. This reduction was offset by a planned increase of 1,000 California Community College transfers. Actual decreases in California resident freshmen were less than planned, while UC exceeded its goal on increasing transfers.
180,000
190,000
200,000
210,000
220,000
2003-04 2005-06 2007-08 2009-10 2011-12
Actual Enrollment
Budget Target
10,000
15,000
20,000
25,000
30,000
35,000
2003-04 2005-06 2007-08 2009-10 2011-12
Actual CA Freshmen
Actual CCC Transfers
S-25
DILUTION OF STATE FUNDING
Accommodating enrollment without sufficient State support (since the tuition income associated with enrollments only partially offsets the loss of State support) affects students and faculty alike, denying them the highest-qualityacademic experience they deserve and have come to expect. The lack of funding for recent growth dilutes the resources of the University.
For students, this means, among other things:
fewer high-caliber faculty hired,
fewer and narrower course offerings, larger class sizes,
a lack of functional and modern instructional equipment,
reduced interaction with leading faculty, andconstrained library holdings and longer waits for library and student services.
For faculty, some of the impacts include:fewer competitive offers to attract and retain the best faculty and graduate students,
less time spent on research and public service as more time must be spent teaching a larger number of students,
working with outdated equipment in inadequately maintained buildings, andimpaired morale at a time when offers from other institutions are becoming more attractive.
For students and faculty alike, dilution of resources leads to reduced quality and ultimately dissatisfaction with the academic experience. Ultimately, any loss of UC’spreeminence would have an impact beyond the campuses.
sustain all three. While the University has maintained
access and affordability thus far, quality is at risk. The
dilution of State funding over larger numbers of students
results in a lower quality experience for all students.
Growth in the number of California high school graduates
will be slower in the next several years than it has been
over the last decade, although UC expects continuing
growth in demand for a UC education from high school
graduates and community college transfers. Graduate
enrollments should also increase to meet the State’s
workforce needs: the last decade’s undergraduates are
this decade’s graduate students. The University’s
expenditure plan includes funding for moderate enrollment
growth at the Merced campus, as well as addressing
unfunded enrollment of California residents and PRograms
In Medical Education (PRIME) and nursing students.
Nonresident Enrollment Growth
While UC’s priority is to enroll eligible California residents
for whom the State has provided funding, nonresident
students are essential to the quality of the University and a
crucial part of the economic future of California. They
contribute to the educational experience of all students and
enhance the diversity of backgrounds and perspectives on
the campuses at which they enroll. Their contributions help
prepare all UC students to effectively live and work in an
increasingly global world. Nonresident enrollments also
help grow and sustain the University’s global reach,
promoting new opportunities for students and faculty.
In addition, because nonresident students pay
supplemental tuition not charged to California residents,
($22,878 in 2012-13 for undergraduates, an amount that far
exceeds the State support provided for California
residents), they provide extra revenue that enables UC to
improve educational programs for all students.
Systemwide nonresident undergraduate enrollment
represented only 8% of the undergraduate population at UC
in 2011-12, whereas over 30% of undergraduates at the
University of Michigan and the University of Virginia are
nonresidents. All campuses are attempting to increase
their nonresident undergraduate enrollments in the coming
year.
UC Merced
Adding to the difficulty of addressing State budget
reductions, cost increases, and unfunded enrollments is the
need for UC to maintain enrollment growth at Merced. The
Merced campus commenced its eighth year of operation in
2012-13 with a total enrollment of over 5,900 FTE students,
reflecting strong student interest in Merced’s unique
educational environment and programs. Deferring growth
at Merced is undesirable because it delays the point at
which the new campus reaches “critical mass” enrollment
and achieves economies of scale. Given its small size,
Merced is not capable of absorbing, even temporarily, the
additional instructional costs incurred by enrollment growth
without State support. In the absence of such support, UC
has been forced to turn to other resources.
In order to maintain the enrollment growth trajectory
needed to reach critical mass at the Merced campus,
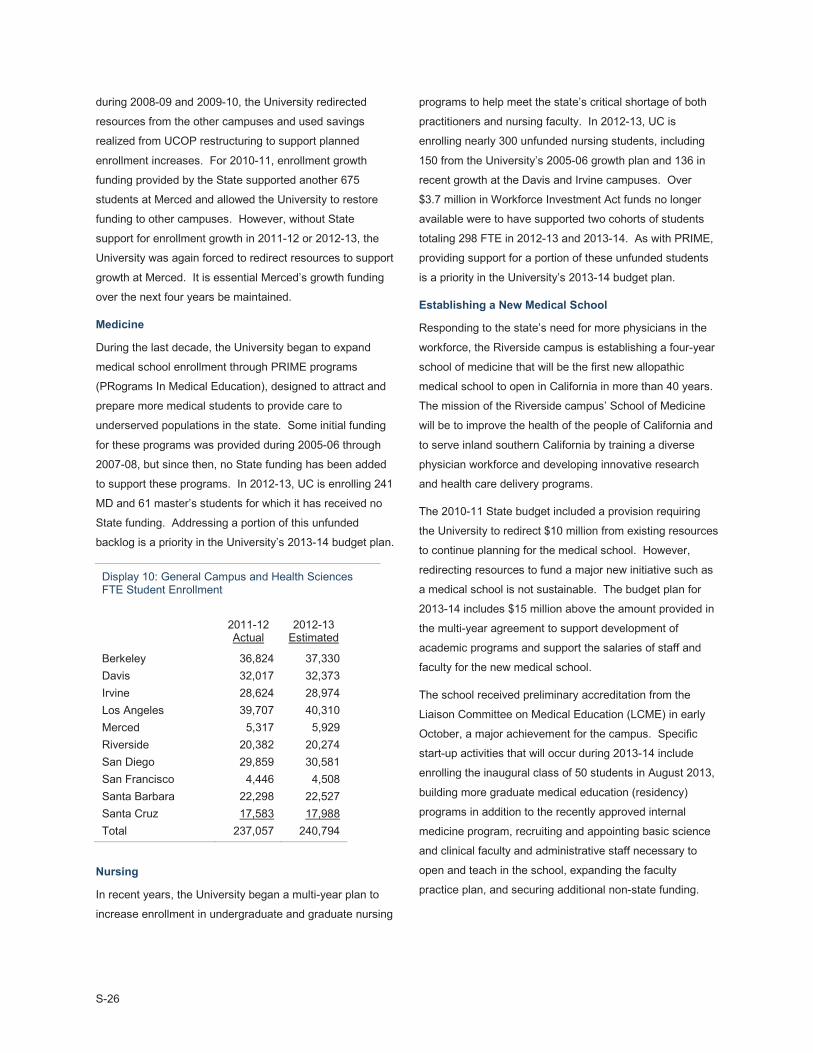
S-26
during 2008-09 and 2009-10, the University redirected
resources from the other campuses and used savings
realized from UCOP restructuring to support planned
enrollment increases. For 2010-11, enrollment growth
funding provided by the State supported another 675
students at Merced and allowed the University to restore
funding to other campuses. However, without State
support for enrollment growth in 2011-12 or 2012-13, the
University was again forced to redirect resources to support
growth at Merced. It is essential Merced’s growth funding
over the next four years be maintained.
Medicine
During the last decade, the University began to expand
medical school enrollment through PRIME programs
(PRograms In Medical Education), designed to attract and
prepare more medical students to provide care to
underserved populations in the state. Some initial funding
for these programs was provided during 2005-06 through
2007-08, but since then, no State funding has been added
to support these programs. In 2012-13, UC is enrolling 241
MD and 61 master’s students for which it has received no
State funding. Addressing a portion of this unfunded
backlog is a priority in the University’s 2013-14 budget plan.
Display 10: General Campus and Health Sciences FTE Student Enrollment
2011-12Actual
2012-13Estimated
Berkeley 36,824 37,330Davis 32,017 32,373Irvine 28,624 28,974Los Angeles 39,707 40,310Merced 5,317 5,929Riverside 20,382 20,274San Diego 29,859 30,581San Francisco 4,446 4,508Santa Barbara 22,298 22,527Santa Cruz 17,583 17,988Total 237,057 240,794
Nursing
In recent years, the University began a multi-year plan to
increase enrollment in undergraduate and graduate nursing
programs to help meet the state’s critical shortage of both
practitioners and nursing faculty. In 2012-13, UC is
enrolling nearly 300 unfunded nursing students, including
150 from the University’s 2005-06 growth plan and 136 in
recent growth at the Davis and Irvine campuses. Over
$3.7 million in Workforce Investment Act funds no longer
available were to have supported two cohorts of students
totaling 298 FTE in 2012-13 and 2013-14. As with PRIME,
providing support for a portion of these unfunded students
is a priority in the University’s 2013-14 budget plan.
Establishing a New Medical School
Responding to the state’s need for more physicians in the
workforce, the Riverside campus is establishing a four-year
school of medicine that will be the first new allopathic
medical school to open in California in more than 40 years.
The mission of the Riverside campus’ School of Medicine
will be to improve the health of the people of California and
to serve inland southern California by training a diverse
physician workforce and developing innovative research
and health care delivery programs.
The 2010-11 State budget included a provision requiring
the University to redirect $10 million from existing resources
to continue planning for the medical school. However,
redirecting resources to fund a major new initiative such as
a medical school is not sustainable. The budget plan for
2013-14 includes $15 million above the amount provided in
the multi-year agreement to support development of
academic programs and support the salaries of staff and
faculty for the new medical school.
The school received preliminary accreditation from the
Liaison Committee on Medical Education (LCME) in early
October, a major achievement for the campus. Specific
start-up activities that will occur during 2013-14 include
enrolling the inaugural class of 50 students in August 2013,
building more graduate medical education (residency)
programs in addition to the recently approved internal
medicine program, recruiting and appointing basic science
and clinical faculty and administrative staff necessary to
open and teach in the school, expanding the faculty
practice plan, and securing additional non-state funding.
S-27
COMPENSATION FOR ACADEMIC AND STAFF EMPLOYEES
Attracting and retaining quality faculty and staff to the University of California are critical
to building and maintaining the excellence of UC’s teaching and research programs.
Faculty and Staff Salaries
Recent cuts to the University’s budget have resulted in
significant disparities in faculty and staff salaries compared
to the market. In 2011-12, UC faculty salaries lagged the
market by 10.8%, and there is a similar or greater problem
with respect to staff salaries in most workforce categories.
The University is deeply concerned about the widening gap
between funds available for compensation and the
resources needed to fund competitive salaries. The most
recent study of UC’s total compensation program indicates
that, in general, average UC salaries are significantly below
the market median, but the total compensation package,
including salaries and health and welfare benefits for
employees as well as post-employment benefits (pension
and retiree health), was close to market.
Plans to eliminate the salary lags for faculty over four years
and for staff over a ten-year period were initiated in the
middle of the last decade, but the State’s ongoing fiscal
crisis delayed implementation of those plans. While the
merit and promotion system for academic employees has
been maintained, no general salary increases were
provided for faculty or non-represented staff in 2008-09,
2009-10, or 2010-11, although represented staff have
continued to receive increases required through their
collective bargaining agreements. In 2011-12, faculty
received their normal merit increases and general
increases, and non-represented staff (excluding executives
and those with salaries at or above $200,000) received
merit-based salary increases representing 3% of salary
funding, though these increases were partially offset by
increases in employee contributions to the UC Retirement
Plan (UCRP). The University had planned to support
another general salary increase for faculty and staff in
2012-13; however, any such action has been deferred
pending the outcome of the Governor’s initiative in the
November election.
Changes in the costs and structure of the University’s
employee benefits programs will intensify pressure for
salary increases over the next several years. While the
initial 2% member contributions to UCRP during 2010-11
were made by redirecting previous employee payments to
the Defined Contribution Plan, employee contributions have
increased by 3 percentage points since then, to a total of
5% in 2012-13; increases planned in subsequent years,
including an approved increase in employee contributions
to 6.5% in 2013-14, will have further impact on employee
take-home pay. In addition, inflationary cost increases in
health and welfare benefits will likely require that
employees pay an increased amount in medical insurance
premiums. Although the benefits provided by UC are an
important component of the packages offered to
candidates, the salary component itself must be competitive
to attract and retain quality faculty and staff employees if
the University is to retain its preeminent stature.
Furthermore, a national economic recovery is likely to have
daunting repercussions on recruitment and retention of
high-performing faculty and staff for UC. Campuses are
already experiencing significant faculty retention challenges
from other institutions within California, across the country,
and around the world. Similarly, economic recovery will
generate new competitive opportunities for staff.
To ensure that UC is able to recruit and retain faculty and
avoid further growth in salary lags for both faculty and staff,
the University must develop a stable, predictable program
for compensation increases. In 2013-14, the expenditure
plan includes an assumption of funding for the normal merit
salary increase program for faculty and a 3% salary
increase pool for faculty and staff.
Actual salary and benefit actions for represented
employees are subject to notice, meeting-and-conferring,
and/or consulting requirements under the Higher Education
Employer-Employee Relations Act.
S-28
Employee Health Benefits
Employee health benefit costs have been rising at a rapid
rate, typically between 8.5% and 11% in recent years.
Yet, no State funds have been provided for this purpose
since 2007-08. Campuses have been forced to redirect
funds from existing programs to address these cost
increases – beyond the redirections necessary to absorb
base budget cuts.
In 2011, through negotiations and the addition of new
programs to the employee benefit plan portfolio, UC was
able to limit health benefit cost increases to 7.1%. Again,
aggressive negotiating resulted in an increase of only 3.5%
for current employees in 2013. Minimizing the increase in
health benefit costs helps reduce the overall pressure on
strained UC budgets, but the resulting increases still must
be funded.
In addition, employees have been required to bear a larger
responsibility for the rising costs of these benefits, partially
offsetting any salary increases they may have received in
recent years. In 2002-03, the University instituted a
progressive medical premium rate structure (based on full-
time salary rates) designed to help offset the impact of
medical premium increases on lower-paid employees.
Although UC pays approximately 87% of monthly medical
premiums for employees on an aggregate basis, the
University made a strategic decision to cover an even
larger portion of the premium for those in the lower salary
brackets. In the current environment, with limited new
funding and growing cost pressures, it is expected that
some of the increases in cost will continue to be borne by
most employees. UC will continue to review its total
compensation program to ensure that all elements move
toward being more competitive in the market.
In March 2012, The University, through its Human
Resources Compliance unit, launched a Family Member
Eligibility Verification review for health benefits coverage.
The review was conducted to ensure that only those eligible
for coverage by University health benefits were, in fact,
enrolled in UC-funded plans. Ninety thousand staff, faculty,
and retirement plan participants, along with their 175,000
enrolled family members, were included in the process.
The annualized savings from this and ongoing efforts are
expected to be approximately $35 million.
Employee health benefit costs for core-funded programs
are projected to increase by $11.4 million in 2013-14.
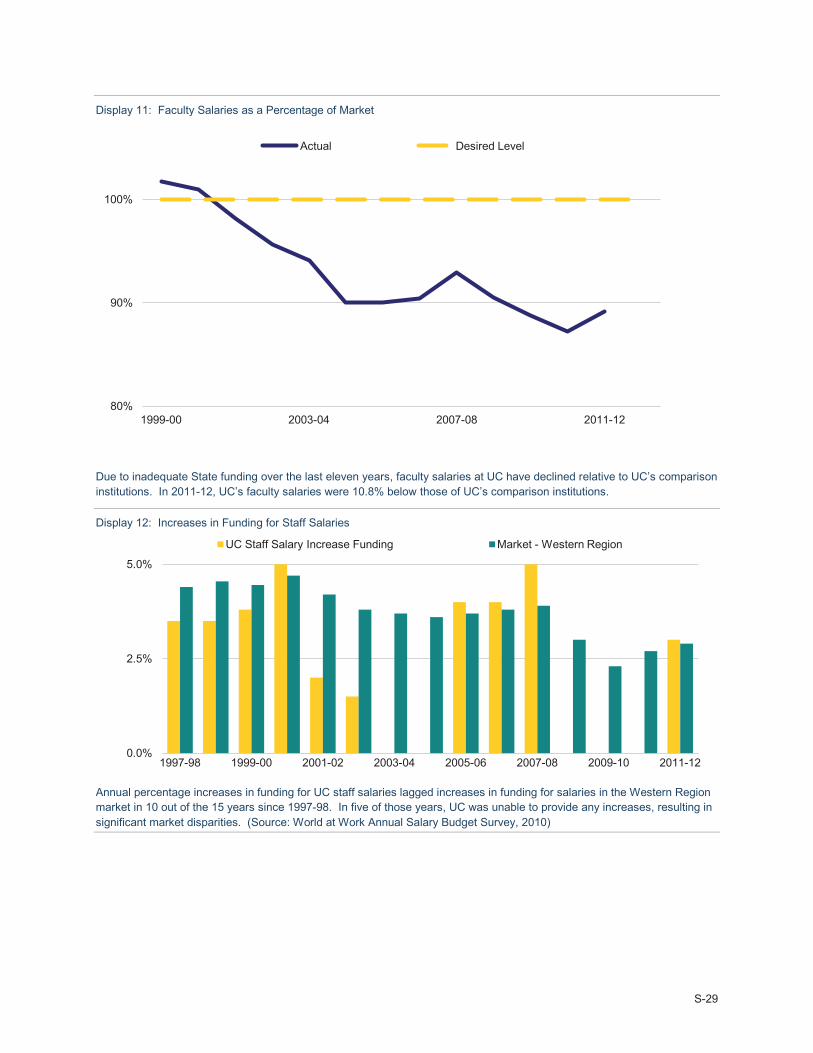
S-29
Display 11: Faculty Salaries as a Percentage of Market
Due to inadequate State funding over the last eleven years, faculty salaries at UC have declined relative to UC’s comparison institutions. In 2011-12, UC’s faculty salaries were 10.8% below those of UC’s comparison institutions.
Display 12: Increases in Funding for Staff Salaries
Annual percentage increases in funding for UC staff salaries lagged increases in funding for salaries in the Western Region market in 10 out of the 15 years since 1997-98. In five of those years, UC was unable to provide any increases, resulting in significant market disparities. (Source: World at Work Annual Salary Budget Survey, 2010)
80%
90%
100%
1999-00 2003-04 2007-08 2011-12
Actual Desired Level
0.0%
2.5%
5.0%
1997-98 1999-00 2001-02 2003-04 2005-06 2007-08 2009-10 2011-12
UC Staff Salary Increase Funding Market - Western Region
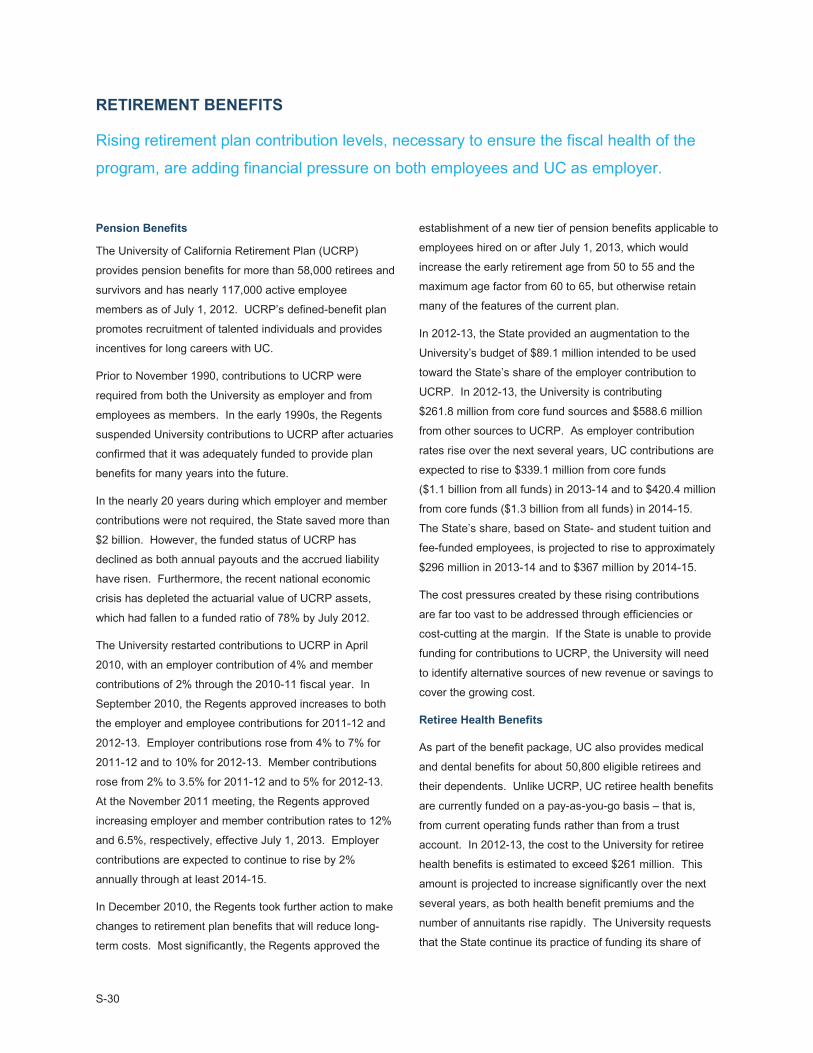
S-30
RETIREMENT BENEFITS
Rising retirement plan contribution levels, necessary to ensure the fiscal health of the
program, are adding financial pressure on both employees and UC as employer.
Pension Benefits
The University of California Retirement Plan (UCRP)
provides pension benefits for more than 58,000 retirees and
survivors and has nearly 117,000 active employee
members as of July 1, 2012. UCRP’s defined-benefit plan
promotes recruitment of talented individuals and provides
incentives for long careers with UC.
Prior to November 1990, contributions to UCRP were
required from both the University as employer and from
employees as members. In the early 1990s, the Regents
suspended University contributions to UCRP after actuaries
confirmed that it was adequately funded to provide plan
benefits for many years into the future.
In the nearly 20 years during which employer and member
contributions were not required, the State saved more than
$2 billion. However, the funded status of UCRP has
declined as both annual payouts and the accrued liability
have risen. Furthermore, the recent national economic
crisis has depleted the actuarial value of UCRP assets,
which had fallen to a funded ratio of 78% by July 2012.
The University restarted contributions to UCRP in April
2010, with an employer contribution of 4% and member
contributions of 2% through the 2010-11 fiscal year. In
September 2010, the Regents approved increases to both
the employer and employee contributions for 2011-12 and
2012-13. Employer contributions rose from 4% to 7% for
2011-12 and to 10% for 2012-13. Member contributions
rose from 2% to 3.5% for 2011-12 and to 5% for 2012-13.
At the November 2011 meeting, the Regents approved
increasing employer and member contribution rates to 12%
and 6.5%, respectively, effective July 1, 2013. Employer
contributions are expected to continue to rise by 2%
annually through at least 2014-15.
In December 2010, the Regents took further action to make
changes to retirement plan benefits that will reduce long-
term costs. Most significantly, the Regents approved the
establishment of a new tier of pension benefits applicable to
employees hired on or after July 1, 2013, which would
increase the early retirement age from 50 to 55 and the
maximum age factor from 60 to 65, but otherwise retain
many of the features of the current plan.
In 2012-13, the State provided an augmentation to the
University’s budget of $89.1 million intended to be used
toward the State’s share of the employer contribution to
UCRP. In 2012-13, the University is contributing
$261.8 million from core fund sources and $588.6 million
from other sources to UCRP. As employer contribution
rates rise over the next several years, UC contributions are
expected to rise to $339.1 million from core funds
($1.1 billion from all funds) in 2013-14 and to $420.4 million
from core funds ($1.3 billion from all funds) in 2014-15.
The State’s share, based on State- and student tuition and
fee-funded employees, is projected to rise to approximately
$296 million in 2013-14 and to $367 million by 2014-15.
The cost pressures created by these rising contributions
are far too vast to be addressed through efficiencies or
cost-cutting at the margin. If the State is unable to provide
funding for contributions to UCRP, the University will need
to identify alternative sources of new revenue or savings to
cover the growing cost.
Retiree Health Benefits
As part of the benefit package, UC also provides medical
and dental benefits for about 50,800 eligible retirees and
their dependents. Unlike UCRP, UC retiree health benefits
are currently funded on a pay-as-you-go basis – that is,
from current operating funds rather than from a trust
account. In 2012-13, the cost to the University for retiree
health benefits is estimated to exceed $261 million. This
amount is projected to increase significantly over the next
several years, as both health benefit premiums and the
number of annuitants rise rapidly. The University requests
that the State continue its practice of funding its share of
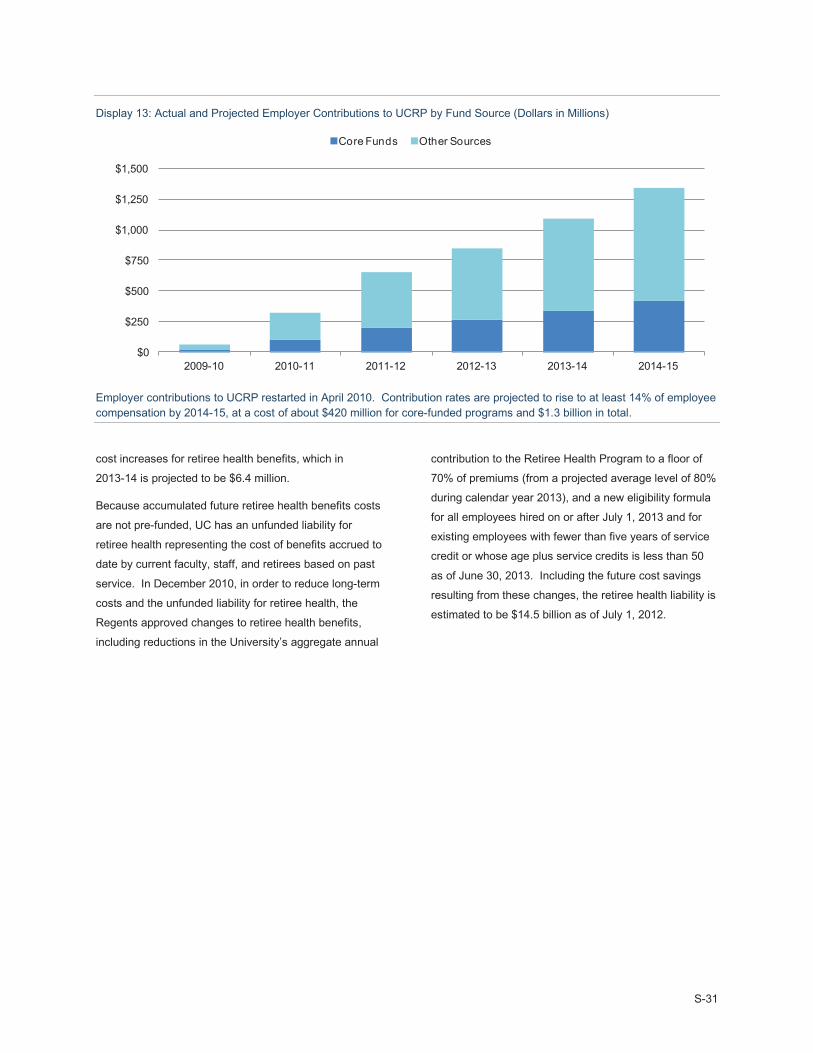
S-31
Display 13: Actual and Projected Employer Contributions to UCRP by Fund Source (Dollars in Millions)
Employer contributions to UCRP restarted in April 2010. Contribution rates are projected to rise to at least 14% of employee compensation by 2014-15, at a cost of about $420 million for core-funded programs and $1.3 billion in total.
cost increases for retiree health benefits, which in
2013-14 is projected to be $6.4 million.
Because accumulated future retiree health benefits costs
are not pre-funded, UC has an unfunded liability for
retiree health representing the cost of benefits accrued to
date by current faculty, staff, and retirees based on past
service. In December 2010, in order to reduce long-term
costs and the unfunded liability for retiree health, the
Regents approved changes to retiree health benefits,
including reductions in the University’s aggregate annual
contribution to the Retiree Health Program to a floor of
70% of premiums (from a projected average level of 80%
during calendar year 2013), and a new eligibility formula
for all employees hired on or after July 1, 2013 and for
existing employees with fewer than five years of service
credit or whose age plus service credits is less than 50
as of June 30, 2013. Including the future cost savings
resulting from these changes, the retiree health liability is
estimated to be $14.5 billion as of July 1, 2012.
$0
$250
$500
$750
$1,000
$1,250
$1,500
2009-10 2010-11 2011-12 2012-13 2013-14 2014-15
Core Funds Other Sources
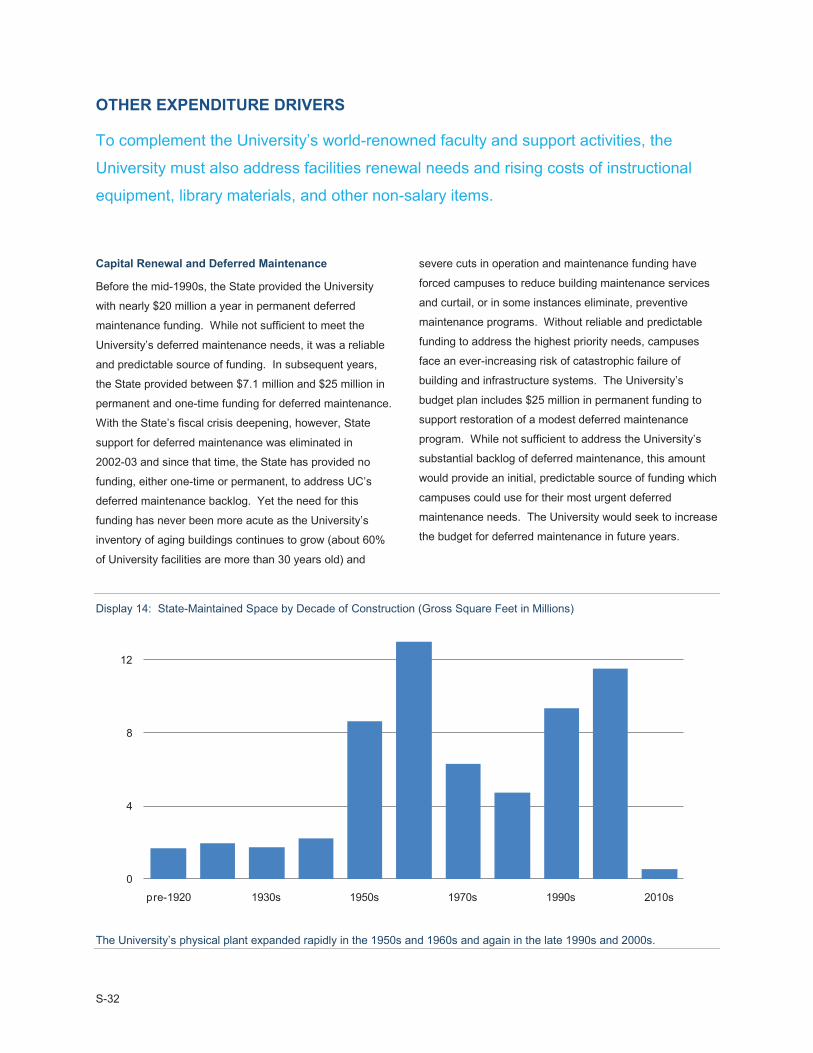
S-32
OTHER EXPENDITURE DRIVERS
To complement the University’s world-renowned faculty and support activities, the
University must also address facilities renewal needs and rising costs of instructional
equipment, library materials, and other non-salary items.
Capital Renewal and Deferred Maintenance
Before the mid-1990s, the State provided the University
with nearly $20 million a year in permanent deferred
maintenance funding. While not sufficient to meet the
University’s deferred maintenance needs, it was a reliable
and predictable source of funding. In subsequent years,
the State provided between $7.1 million and $25 million in
permanent and one-time funding for deferred maintenance.
With the State’s fiscal crisis deepening, however, State
support for deferred maintenance was eliminated in
2002-03 and since that time, the State has provided no
funding, either one-time or permanent, to address UC’s
deferred maintenance backlog. Yet the need for this
funding has never been more acute as the University’s
inventory of aging buildings continues to grow (about 60%
of University facilities are more than 30 years old) and
severe cuts in operation and maintenance funding have
forced campuses to reduce building maintenance services
and curtail, or in some instances eliminate, preventive
maintenance programs. Without reliable and predictable
funding to address the highest priority needs, campuses
face an ever-increasing risk of catastrophic failure of
building and infrastructure systems. The University’s
budget plan includes $25 million in permanent funding to
support restoration of a modest deferred maintenance
program. While not sufficient to address the University’s
substantial backlog of deferred maintenance, this amount
would provide an initial, predictable source of funding which
campuses could use for their most urgent deferred
maintenance needs. The University would seek to increase
the budget for deferred maintenance in future years.
Display 14: State-Maintained Space by Decade of Construction (Gross Square Feet in Millions)
The University’s physical plant expanded rapidly in the 1950s and 1960s and again in the late 1990s and 2000s.
0
4
8
12
pre-1920 1930s 1950s 1970s 1990s 2010s
S-33
Keeping Pace with Inflation
To maintain the quality of the instructional program and all
support activities, the University must regularly replace,
upgrade, or purchase new instructional equipment, library
materials, and other non-salary items. The University must
also purchase utilities to provide energy to its facilities. Just
as costs for salaries and benefits for employees rise, the
University’s non-salary spending is affected by inflation.
Costs of goods and services employed for education
generally rise faster than the typical basket of goods and
services used to measure inflation. In addition, between
2000 and 2011, market cost for electricity rose more than
50%, although this was partially offset by wild swings in
natural gas costs, which have ended up over the decade at
50% below the price in 2000-01. Campuses overall are
paying more for these costs despite only modest increases
in consumption. Yet, with the continuing fiscal crisis, the
State has not funded non-salary price increases for several
years. Even with the efficiencies described earlier, to offset
the impact of inflation and maintain the University’s
purchasing power, without State funding to support cost
increases, the University has been forced to redirect funds
from existing resources to cover non-salary price increases.
The University’s 2013-14 expenditure plan includes
$23.7 million for non-salary price increases and purchased
utilities costs, consisting of a 2% general non-salary prince
increase, as well as $8 million to cover projected higher
energy costs.
S-34
STUDENT TUITION AND FEES
Despite efficiencies achieved by UC in the delivery of education and research, in recent
years student tuition and fees have increased significantly in order to maintain quality in
the face of inadequate State support.
Student tuition and fees provide $2.98 billion for the
University’s basic operations and student financial aid
during 2012-13. Revenue from tuition and fees exceeded
State support for the first time in 2011-12 and now, in
2012-13, students are paying 49% of the cost of education.
As previously noted, the University’s 2013-14 budget plan
assumes passage of the Governor’s revenue-raising
initiative in November and support from the Governor for a
multi-year framework with the State that would result in a
6% base budget adjustment in 2013-14 for core operational
support of the University’s budget. In this context, at the
November Board meeting the Regents are being asked to
approve an increase of 6% (or $732, from $12,192 to
$12,924) in mandatory systemwide charges for 2013-14.
If the Governor’s initiative does not pass in November, the
University will revise its plan for 2013-14 in time for the
November Board meeting and request a higher increase
than the planned 6%. In addition, it is likely the University
would seek to implement a mid-year Tuition increase for
2012-13 to help address the $250 million trigger cut that
would occur with failure of the initiative.
Mandatory Systemwide Tuition and Fees
Mandatory systemwide tuition and fees consist of Tuition
and the Student Services Fee. Tuition provides general
support for the University’s operating budget, including
costs related to faculty and instructional support, libraries
and other academic support, student services, institutional
support, operation and maintenance of plant, and student
financial support. In 2012-13, Tuition is $11,220 for all
students. The Student Services Fee funds services that
are necessary to students, but not part of the University’s
programs of instruction, research, or public service. The
majority of these funds is spent on student services. In
2012-13, the Student Services Fee is $972 for all students.
Professional Degree Supplemental Tuition
Professional Degree Supplemental Tuition provides UC’s
professional degree programs with supplemental funds to
maintain quality – to recruit and retain excellent faculty,
provide a top-notch curriculum, and attract high-caliber
students – following significant budget cuts over the last
two decades. Tuition levels vary by program and are based
on an evaluation of program resources and needs,
comparison institution fees, and affordability for students.
In 2012-13, Professional Degree Supplemental Tuition
varies by program from $4,000 to $38,548. The 2013-14
budget plan assumes increases of between 0% and 35% in
Professional Degree Supplemental Tuition for various
programs, totaling from $0 to $3,256.
Nonresident Supplemental Tuition
In addition to mandatory systemwide tuition and fees,
nonresident students pay Nonresident Supplemental
Tuition in lieu of State support. Campuses use Nonresident
Supplemental Tuition to support the instructional enterprise.
For nonresident undergraduates, Nonresident
Supplemental Tuition is $22,878 during 2012-13. The
supplemental charges for nonresident graduate academic
and graduate professional students are $15,102 and
$12,245, respectively. The 2013-14 budget plan assumes
no increase in Nonresident Supplemental Tuition.
Total Charges and Comparison Institutions
In addition to the charges described above, students also
pay campus-based fees. Display 15 shows total charges
for undergraduate and graduate academic students by
residency status for 2012-13.
Despite recent fee increases, UC’s in-state fees remain
competitive with public comparison institutions for resident
undergraduates and graduate academic students.
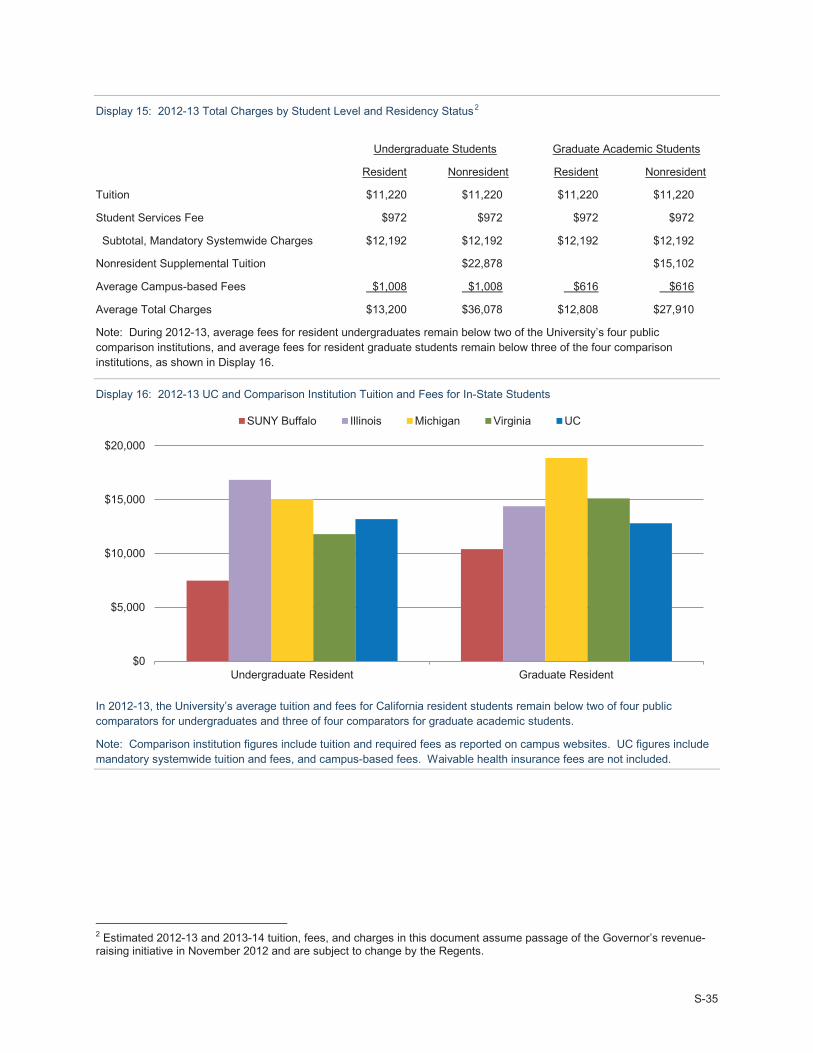
S-35
Display 15: 2012-13 Total Charges by Student Level and Residency Status2
Undergraduate Students Graduate Academic Students
Resident Nonresident Resident Nonresident
Tuition $11,220 $11,220 $11,220 $11,220
Student Services Fee $972 $972 $972 $972
Subtotal, Mandatory Systemwide Charges $12,192 $12,192 $12,192 $12,192
Nonresident Supplemental Tuition $22,878 $15,102
Average Campus-based Fees $1,008 $1,008 $616 $616
Average Total Charges $13,200 $36,078 $12,808 $27,910
Note: During 2012-13, average fees for resident undergraduates remain below two of the University’s four public comparison institutions, and average fees for resident graduate students remain below three of the four comparison institutions, as shown in Display 16.
Display 16: 2012-13 UC and Comparison Institution Tuition and Fees for In-State Students
In 2012-13, the University’s average tuition and fees for California resident students remain below two of four public comparators for undergraduates and three of four comparators for graduate academic students.
Note: Comparison institution figures include tuition and required fees as reported on campus websites. UC figures include mandatory systemwide tuition and fees, and campus-based fees. Waivable health insurance fees are not included.
2 Estimated 2012-13 and 2013-14 tuition, fees, and charges in this document assume passage of the Governor’s revenue-raising initiative in November 2012 and are subject to change by the Regents.
$0
$5,000
$10,000
$15,000
$20,000
Undergraduate Resident Graduate Resident
SUNY Buffalo Illinois Michigan Virginia UC
S-36
STUDENT FINANCIAL AID
Student financial aid from federal, State, UC, and private sources has helped UC
maintain access and affordability at the undergraduate level while also attracting
graduate students with exceptional potential.
The University’s student financial aid programs, guided by
policy adopted by the Regents in 1994, are closely linked to
the University’s goals of student accessibility and meeting
the state’s workforce needs. To mitigate the impact of
tuition and fee increases, as well as increases in other
educational expenses, the University has continued to use
a portion of the new revenue derived from tuition and fee
increases to support financial aid. Other sources of funds,
including State funding for Cal Grants and federal and
private funds, have helped UC meet its financial aid goals.
Undergraduate Aid
At the undergraduate level, the goal is to ensure that UC
remains financially accessible to all academically eligible
students so that financial considerations are not an
obstacle to student decisions to enroll at UC. During
2010-11, 62% of UC undergraduates received grant or
scholarship aid, averaging $14,715 per student. UC has
become nationally recognized as a leader in enrolling an
economically diverse pool of undergraduate students.
Despite tuition and fee increases, the University has
remained accessible to undergraduate students from all
income groups. Enrollments of low-income Pell Grant
recipients at other research institutions range from about
10% to 30%. During 2010-11, 41% of UC undergraduates
were Pell Grant recipients, more than at any other
comparably selective research institution.
For many years, the enrollment of students from middle-
income families also has remained relatively stable, at
about 43% between 2000-01 and 2006-07, despite fee
increases in most of those years. Since then the
percentage has declined, to 37% in 2010-11, which may
reflect a statewide decline in middle-income families
attributable to the economic recession. The University is
closely monitoring this trend, together with income trends
among California families generally.
Financial aid also contributes greatly to the University’s
undergraduate ethnic diversity. African-American,
Chicano/Latino, and Asian American students are
disproportionately low-income. Collectively, these students
receive 68% of all undergraduate gift assistance. For all of
these reasons, maintaining a robust financial aid program
remains a top University budget priority.
In recent years, several significant factors have helped UC
maintain affordability for undergraduates:
increases in the maximum federal Pell Grant;full funding of the State’s Cal Grant program;
continuation of UC’s 33% return-to-aid policy;
development and expansion of the Blue and Gold Opportunity Plan, which in 2012-13 ensures that all eligible students with household incomes below $80,000 receive gift aid covering systemwide tuition and fees upto their need level;
expansion of middle-income fee grants, covering one-half of tuition and fee increases for needy middle-income students, to students from families earning up to $120,000; and
temporary expansion of federal education tax credits.
As a result of these and other ongoing programs, financial
support generally has covered systemwide fee increases
for Cal Grant and UC Grant recipients in recent years and
is providing some coverage of other cost increases as well.
In 2013-14, the University proposes to set aside the
equivalent of 33% of new undergraduate fee revenue for
financial aid. In addition, the University will continue to
ensure that tuition and fee increases do not deter talented,
low-income students from aspiring to attend UC by fully
funding the Blue and Gold Opportunity Plan, which provides
full coverage of mandatory systemwide tuition and fees for
eligible resident undergraduates with family incomes up to
$80,000 (up to a student’s need) and provide assistance to
financially needy middle-income families.
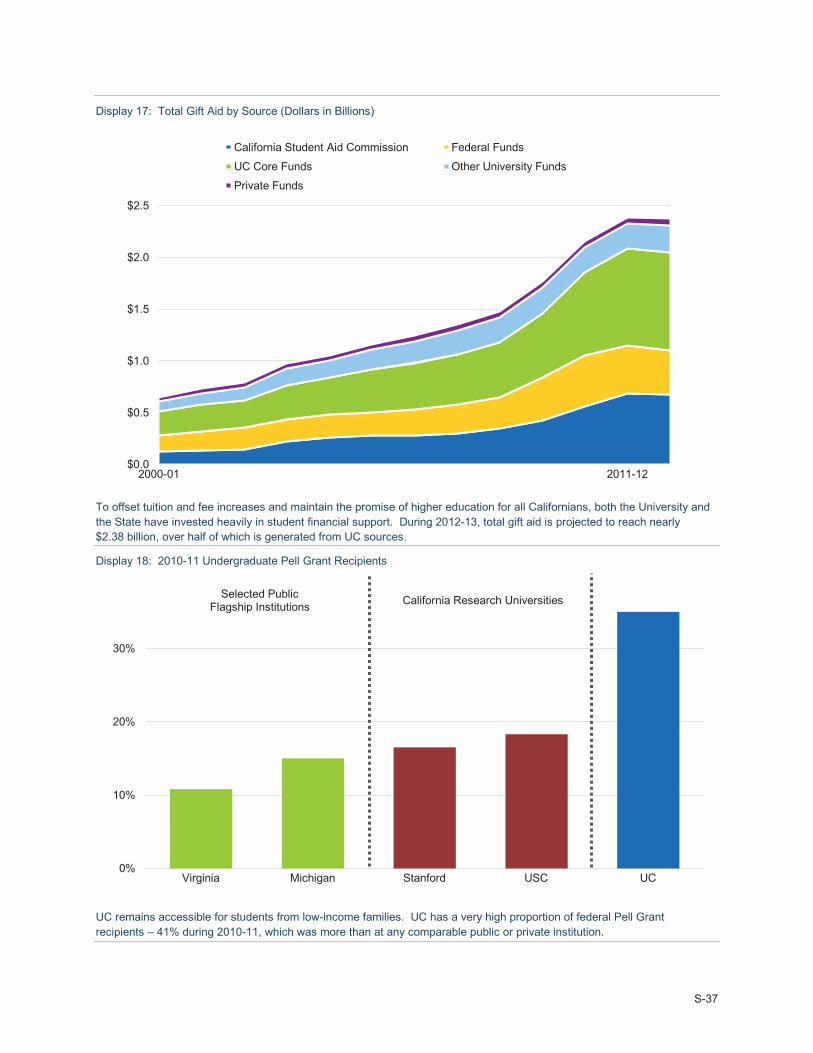
S-37
Display 17: Total Gift Aid by Source (Dollars in Billions)
To offset tuition and fee increases and maintain the promise of higher education for all Californians, both the University and the State have invested heavily in student financial support. During 2012-13, total gift aid is projected to reach nearly $2.38 billion, over half of which is generated from UC sources.
Display 18: 2010-11 Undergraduate Pell Grant Recipients
UC remains accessible for students from low-income families. UC has a very high proportion of federal Pell Grant recipients – 41% during 2010-11, which was more than at any comparable public or private institution.
$0.0
$0.5
$1.0
$1.5
$2.0
$2.5
2000-01 2011-12
California Student Aid Commission Federal Funds
UC Core Funds Other University Funds
Private Funds
0%
10%
20%
30%
Virginia Michigan Stanford USC UC
Selected PublicFlagship Institutions California Research Universities
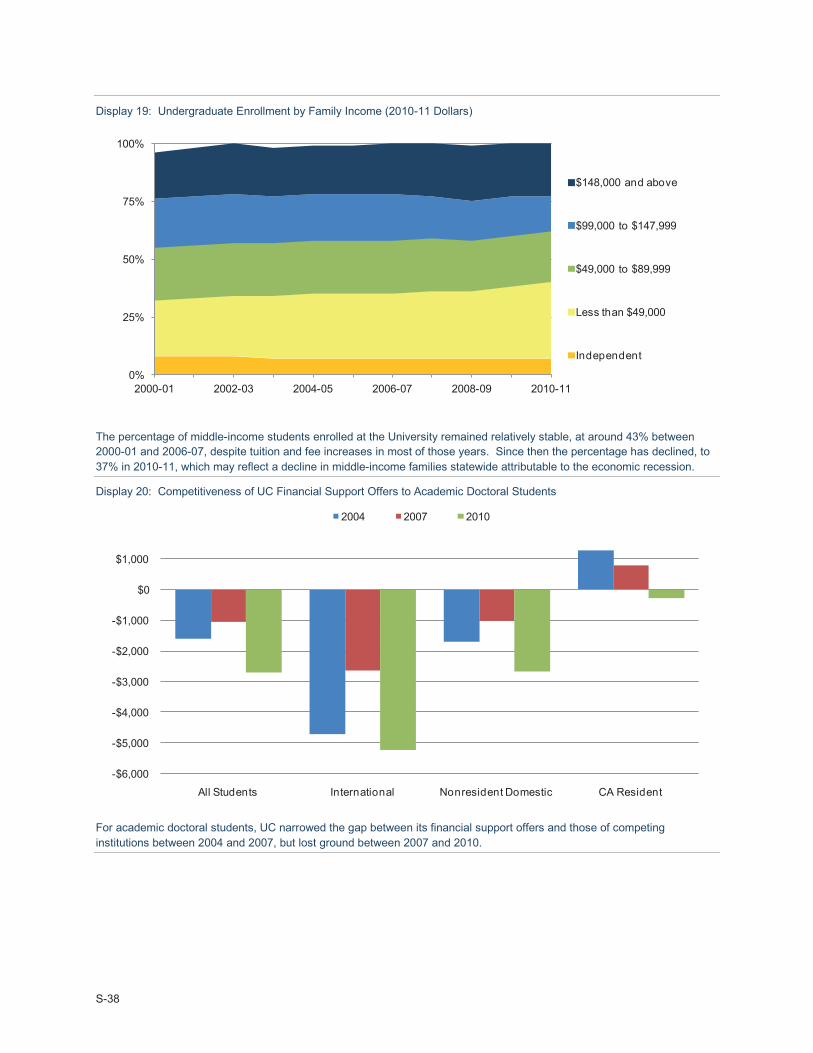
S-38
Display 19: Undergraduate Enrollment by Family Income (2010-11 Dollars)
The percentage of middle-income students enrolled at the University remained relatively stable, at around 43% between 2000-01 and 2006-07, despite tuition and fee increases in most of those years. Since then the percentage has declined, to 37% in 2010-11, which may reflect a decline in middle-income families statewide attributable to the economic recession.
Display 20: Competitiveness of UC Financial Support Offers to Academic Doctoral Students
For academic doctoral students, UC narrowed the gap between its financial support offers and those of competing institutions between 2004 and 2007, but lost ground between 2007 and 2010.
0%
25%
50%
75%
100%
2000-01 2002-03 2004-05 2006-07 2008-09 2010-11
$148,000 and above
$99,000 to $147,999
$49,000 to $89,999
Less than $49,000
Independent
-$6,000
-$5,000
-$4,000
-$3,000
-$2,000
-$1,000
$0
$1,000
All Students International Nonresident Domestic CA Resident
2004 2007 2010
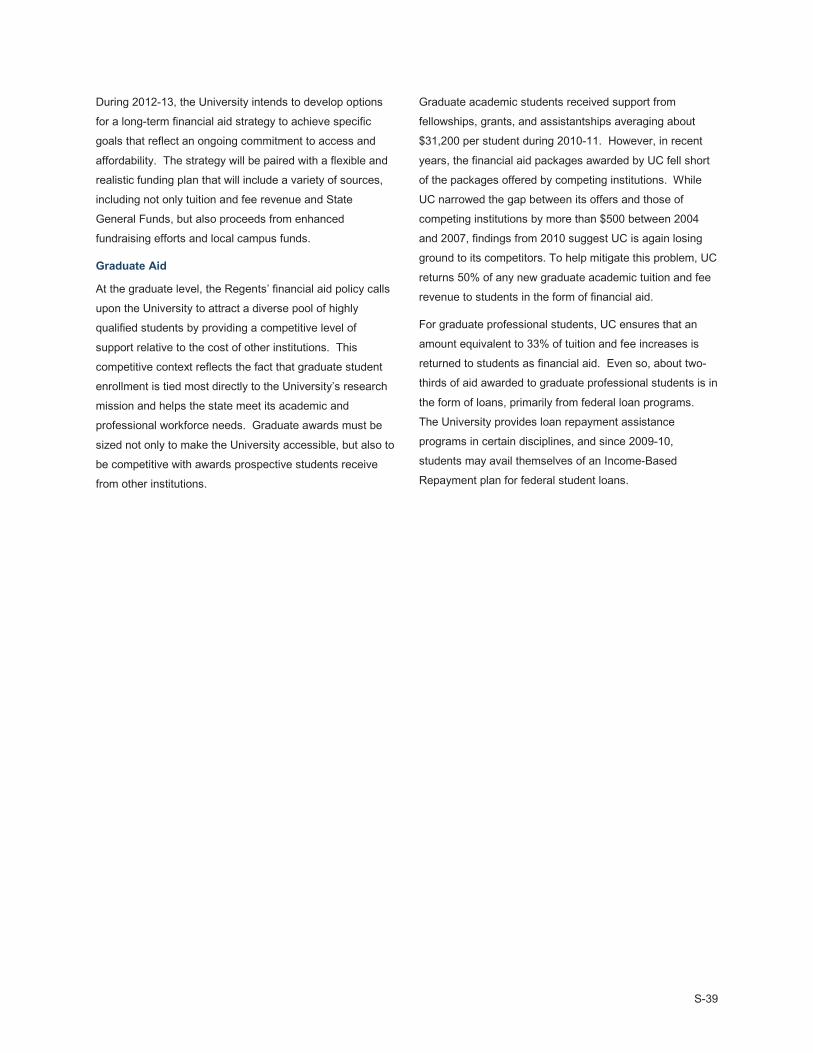
S-39
During 2012-13, the University intends to develop options
for a long-term financial aid strategy to achieve specific
goals that reflect an ongoing commitment to access and
affordability. The strategy will be paired with a flexible and
realistic funding plan that will include a variety of sources,
including not only tuition and fee revenue and State
General Funds, but also proceeds from enhanced
fundraising efforts and local campus funds.
Graduate Aid
At the graduate level, the Regents’ financial aid policy calls
upon the University to attract a diverse pool of highly
qualified students by providing a competitive level of
support relative to the cost of other institutions. This
competitive context reflects the fact that graduate student
enrollment is tied most directly to the University’s research
mission and helps the state meet its academic and
professional workforce needs. Graduate awards must be
sized not only to make the University accessible, but also to
be competitive with awards prospective students receive
from other institutions.
Graduate academic students received support from
fellowships, grants, and assistantships averaging about
$31,200 per student during 2010-11. However, in recent
years, the financial aid packages awarded by UC fell short
of the packages offered by competing institutions. While
UC narrowed the gap between its offers and those of
competing institutions by more than $500 between 2004
and 2007, findings from 2010 suggest UC is again losing
ground to its competitors. To help mitigate this problem, UC
returns 50% of any new graduate academic tuition and fee
revenue to students in the form of financial aid.
For graduate professional students, UC ensures that an
amount equivalent to 33% of tuition and fee increases is
returned to students as financial aid. Even so, about two-
thirds of aid awarded to graduate professional students is in
the form of loans, primarily from federal loan programs.
The University provides loan repayment assistance
programs in certain disciplines, and since 2009-10,
students may avail themselves of an Income-Based
Repayment plan for federal student loans.
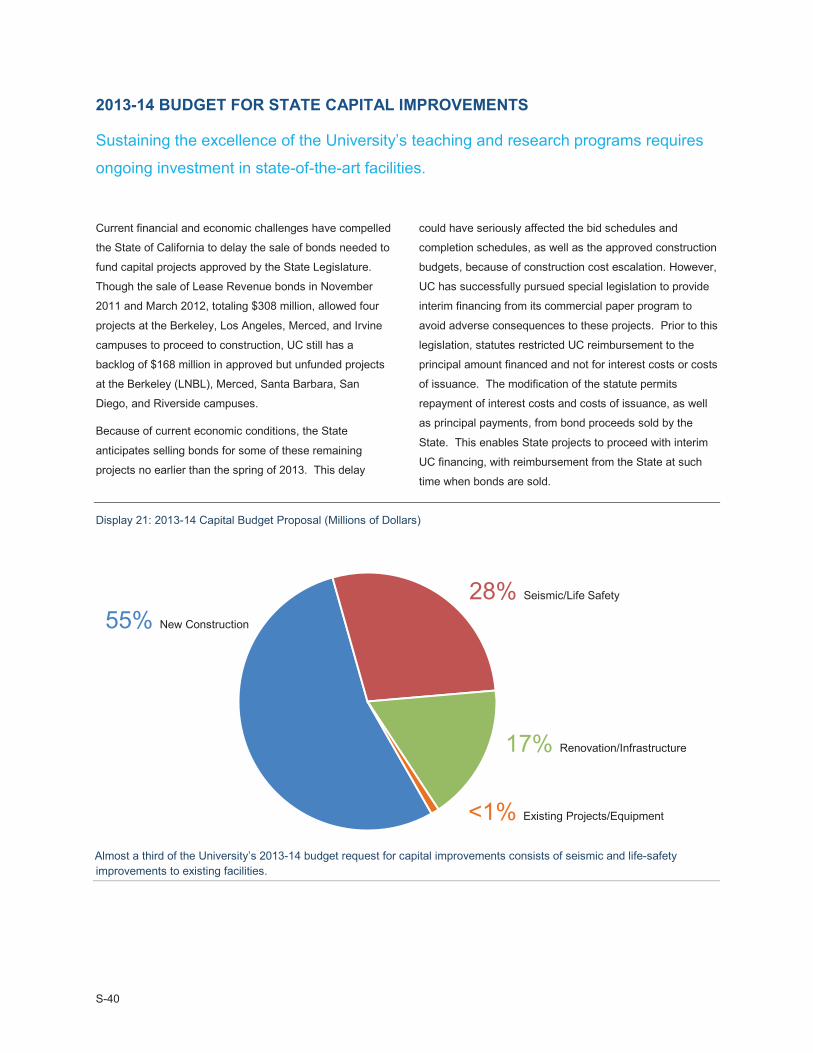
S-40
2013-14 BUDGET FOR STATE CAPITAL IMPROVEMENTS
Sustaining the excellence of the University’s teaching and research programs requires
ongoing investment in state-of-the-art facilities.
Current financial and economic challenges have compelled
the State of California to delay the sale of bonds needed to
fund capital projects approved by the State Legislature.
Though the sale of Lease Revenue bonds in November
2011 and March 2012, totaling $308 million, allowed four
projects at the Berkeley, Los Angeles, Merced, and Irvine
campuses to proceed to construction, UC still has a
backlog of $168 million in approved but unfunded projects
at the Berkeley (LNBL), Merced, Santa Barbara, San
Diego, and Riverside campuses.
Because of current economic conditions, the State
anticipates selling bonds for some of these remaining
projects no earlier than the spring of 2013. This delay
could have seriously affected the bid schedules and
completion schedules, as well as the approved construction
budgets, because of construction cost escalation. However,
UC has successfully pursued special legislation to provide
interim financing from its commercial paper program to
avoid adverse consequences to these projects. Prior to this
legislation, statutes restricted UC reimbursement to the
principal amount financed and not for interest costs or costs
of issuance. The modification of the statute permits
repayment of interest costs and costs of issuance, as well
as principal payments, from bond proceeds sold by the
State. This enables State projects to proceed with interim
UC financing, with reimbursement from the State at such
time when bonds are sold.
Display 21: 2013-14 Capital Budget Proposal (Millions of Dollars)
Almost a third of the University’s 2013-14 budget request for capital improvements consists of seismic and life-safety improvements to existing facilities.
28% Seismic/Life Safety
55% New Construction
<1% Existing Projects/Equipment
17% Renovation/Infrastructure
S-41
The need to ensure the safety of the campus
community and the urgency of renovations has
compelled some campuses to take on externally
financed debt to address several projects that would
normally have been funded by the State, reducing the
funding being requested of the State for the 2013-14
year.
The State of California’s recovery from the economic
recession has been slow and halting, and
unemployment rates in California remain the second
highest in the nation. The construction industry has
been particularly hard-hit. Capital projects initiated by
UC campuses will stimulate construction activity at a
point in the economy when it is sorely needed.
Proceeding to construction earlier also benefits the
University in terms of lower costs.
The University’s State capital budget proposal for the
2013-14 year totals $788.5 million for critical seismic
and life-safety improvements to support enrollment
growth that has already occurred, and for facilities
renewal and infrastructure.
The projects requested for State funding include
approximately 28% in critical seismic and life-safety
corrections, 55% to address existing enrollment needs, and
17% for infrastructure deficiencies and building-systems
renewal, including new infrastructure for physical expansion
within the Merced and Riverside campuses. The request
includes less than 1% to equip projects already funded for
construction.
The future of State capital funding for the University
remains uncertain. The last general obligation bond for
higher education capital projects was approved by the
voters in Fall 2006. Current fiscal and economic conditions
in the state do not favor passage of a general obligation
bond for capital outlay for at least another two years. The
multi-year agreement proposed by the Governor in 2011-12
included a provision whereby funding for capital outlay
projects would be added to the University’s base budget
and then would be subject to the base budget adjustment
each year along with the operating budget funding. The
University would have the flexibility to determine how much
of the budget each year should be directed toward the
construction, operation, maintenance, and renewal of
facilities. This proposal would give the University a degree
of stability and predictability in its capital funding that has
been absent in recent years, allowing the University to
proceed with project planning needed to address high
priority facilities needs. The Governor’s support for the
multi-year agreement is contingent on the passage of his
revenue-raising initiative on the November 2012 ballot.

S-42
UNIVERSITY of CALIFORNIA
2013-14 BUDGET FOR CURRENT OPERATIONSBUDGET DETAIL

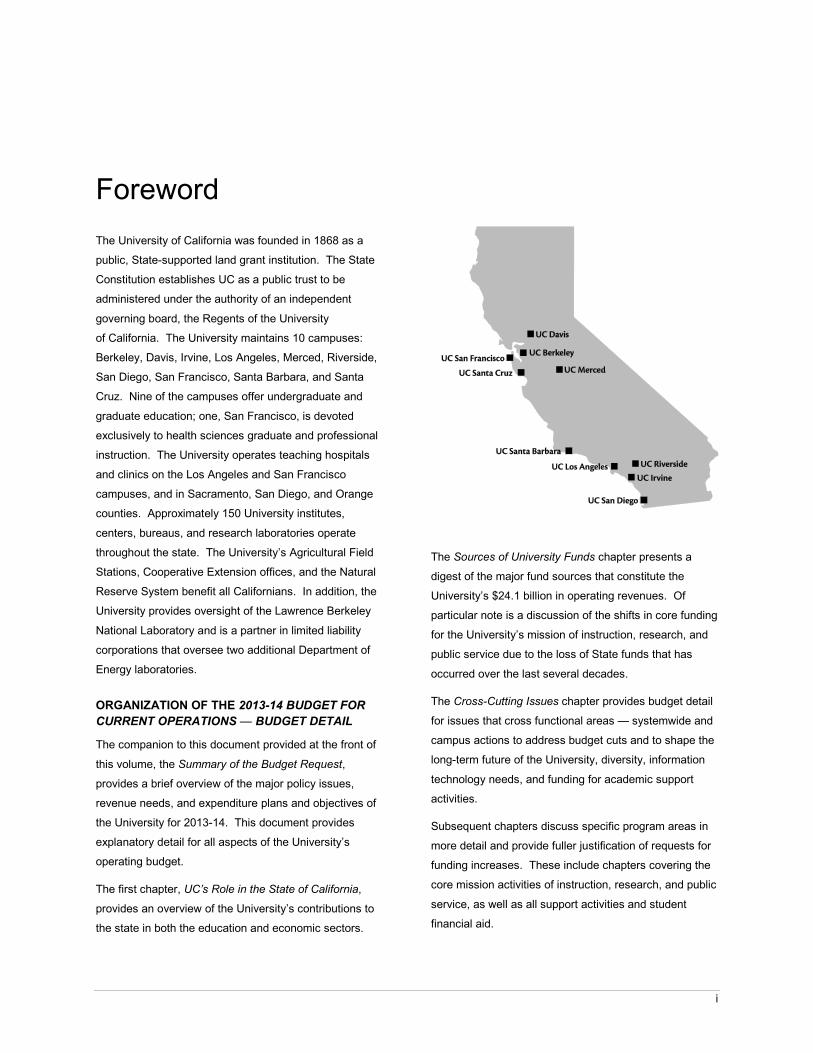
i
Foreword
The University of California was founded in 1868 as a
public, State-supported land grant institution. The State
Constitution establishes UC as a public trust to be
administered under the authority of an independent
governing board, the Regents of the University
of California. The University maintains 10 campuses:
Berkeley, Davis, Irvine, Los Angeles, Merced, Riverside,
San Diego, San Francisco, Santa Barbara, and Santa
Cruz. Nine of the campuses offer undergraduate and
graduate education; one, San Francisco, is devoted
exclusively to health sciences graduate and professional
instruction. The University operates teaching hospitals
and clinics on the Los Angeles and San Francisco
campuses, and in Sacramento, San Diego, and Orange
counties. Approximately 150 University institutes,
centers, bureaus, and research laboratories operate
throughout the state. The University’s Agricultural Field
Stations, Cooperative Extension offices, and the Natural
Reserve System benefit all Californians. In addition, the
University provides oversight of the Lawrence Berkeley
National Laboratory and is a partner in limited liability
corporations that oversee two additional Department of
Energy laboratories.
ORGANIZATION OF THE 2013-14 BUDGET FOR CURRENT OPERATIONS — BUDGET DETAIL
The companion to this document provided at the front of
this volume, the Summary of the Budget Request,
provides a brief overview of the major policy issues,
revenue needs, and expenditure plans and objectives of
the University for 2013-14. This document provides
explanatory detail for all aspects of the University’s
operating budget.
The first chapter, UC’s Role in the State of California,
provides an overview of the University’s contributions to
the state in both the education and economic sectors.
The Sources of University Funds chapter presents a
digest of the major fund sources that constitute the
University’s $24.1 billion in operating revenues. Of
particular note is a discussion of the shifts in core funding
for the University’s mission of instruction, research, and
public service due to the loss of State funds that has
occurred over the last several decades.
The Cross-Cutting Issues chapter provides budget detail
for issues that cross functional areas — systemwide and
campus actions to address budget cuts and to shape the
long-term future of the University, diversity, information
technology needs, and funding for academic support
activities.
Subsequent chapters discuss specific program areas in
more detail and provide fuller justification of requests for
funding increases. These include chapters covering the
core mission activities of instruction, research, and public
service, as well as all support activities and student
financial aid.
ii
Salary increases and rising costs of employee and retiree
benefits are major drivers of the University’s budget plan.
These issues are discussed in the Compensation,
Employee and Retirement Benefits, and Non-Salary Cost
Increases chapter.
The Student Tuition and Fees chapter provides
information about the University’s tuition and fee policy
and practices, as a significant and growing source of
revenue in support of UC’s teaching mission now comes
from student tuition and fees.
The Historical Perspective chapter provides a detailed
account of the history of State funding for the University
over the last several decades.
The Appendix includes various tables providing current
and historical budget, enrollment, and tuition information.
Finally, an index appears at the end of this document to
assist readers who are looking for a particular subject.
A separate volume, the 2012-22 Consolidated State and
Non-State Capital Financial Plan provides information
about the University’s capital facilities needs.
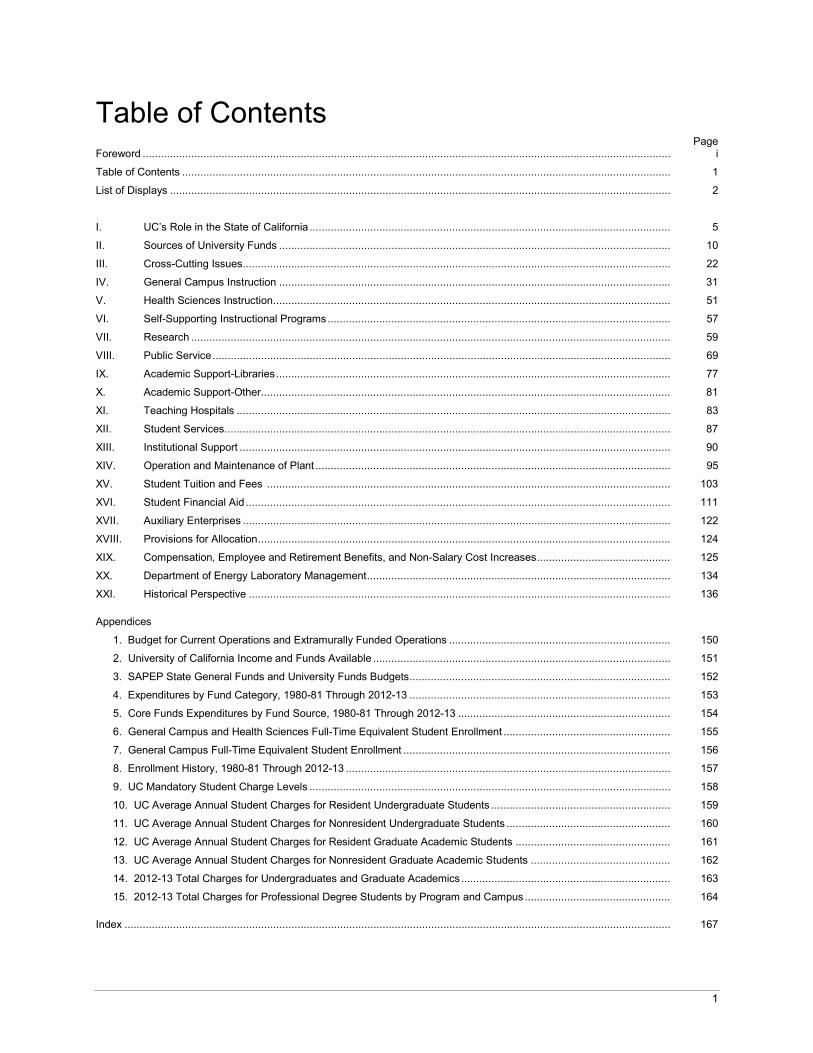
1
Table of ContentsPage
Foreword .............................................................................................................................................................................. i
Table of Contents ................................................................................................................................................................. 1
List of Displays ..................................................................................................................................................................... 2
I. UC’s Role in the State of California ....................................................................................................................... 5
II. Sources of University Funds ................................................................................................................................. 10
III. Cross-Cutting Issues............................................................................................................................................. 22
IV. General Campus Instruction ................................................................................................................................. 31
V. Health Sciences Instruction................................................................................................................................... 51
VI. Self-Supporting Instructional Programs................................................................................................................. 57
VII. Research .............................................................................................................................................................. 59
VIII. Public Service....................................................................................................................................................... 69
IX. Academic Support-Libraries.................................................................................................................................. 77
X. Academic Support-Other....................................................................................................................................... 81
XI. Teaching Hospitals ............................................................................................................................................... 83
XII. Student Services................................................................................................................................................... 87
XIII. Institutional Support .............................................................................................................................................. 90
XIV. Operation and Maintenance of Plant ..................................................................................................................... 95
XV. Student Tuition and Fees ..................................................................................................................................... 103
XVI. Student Financial Aid ............................................................................................................................................ 111
XVII. Auxiliary Enterprises ............................................................................................................................................. 122
XVIII. Provisions for Allocation........................................................................................................................................ 124
XIX. Compensation, Employee and Retirement Benefits, and Non-Salary Cost Increases............................................ 125
XX. Department of Energy Laboratory Management.................................................................................................... 134
XXI. Historical Perspective ........................................................................................................................................... 136
Appendices
1. Budget for Current Operations and Extramurally Funded Operations ......................................................................... 150
2. University of California Income and Funds Available .................................................................................................. 151
3. SAPEP State General Funds and University Funds Budgets...................................................................................... 152
4. Expenditures by Fund Category, 1980-81 Through 2012-13 ...................................................................................... 153
5. Core Funds Expenditures by Fund Source, 1980-81 Through 2012-13 ...................................................................... 154
6. General Campus and Health Sciences Full-Time Equivalent Student Enrollment ....................................................... 155
7. General Campus Full-Time Equivalent Student Enrollment ........................................................................................ 156
8. Enrollment History, 1980-81 Through 2012-13 ........................................................................................................... 157
9. UC Mandatory Student Charge Levels ....................................................................................................................... 158
10. UC Average Annual Student Charges for Resident Undergraduate Students ........................................................... 159
11. UC Average Annual Student Charges for Nonresident Undergraduate Students ...................................................... 160
12. UC Average Annual Student Charges for Resident Graduate Academic Students ................................................... 161
13. UC Average Annual Student Charges for Nonresident Graduate Academic Students .............................................. 162
14. 2012-13 Total Charges for Undergraduates and Graduate Academics..................................................................... 163
15. 2012-13 Total Charges for Professional Degree Students by Program and Campus................................................ 164
Index .................................................................................................................................................................................... 167
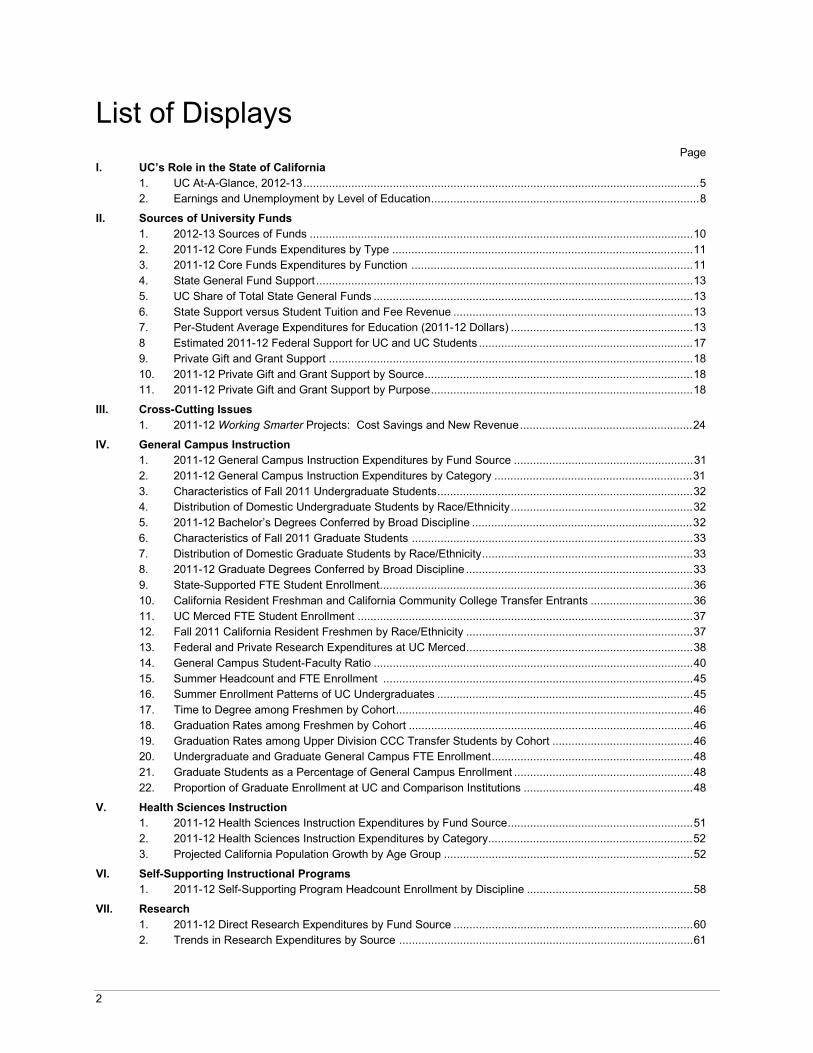
2
List of DisplaysPage
I. UC’s Role in the State of California1. UC At-A-Glance, 2012-13............................................................................................................................52. Earnings and Unemployment by Level of Education....................................................................................8
II. Sources of University Funds1. 2012-13 Sources of Funds ........................................................................................................................102. 2011-12 Core Funds Expenditures by Type ..............................................................................................113. 2011-12 Core Funds Expenditures by Function ........................................................................................114. State General Fund Support ......................................................................................................................135. UC Share of Total State General Funds ....................................................................................................136. State Support versus Student Tuition and Fee Revenue ...........................................................................137. Per-Student Average Expenditures for Education (2011-12 Dollars) .........................................................138 Estimated 2011-12 Federal Support for UC and UC Students ...................................................................179. Private Gift and Grant Support ..................................................................................................................1810. 2011-12 Private Gift and Grant Support by Source....................................................................................1811. 2011-12 Private Gift and Grant Support by Purpose..................................................................................18
III. Cross-Cutting Issues1. 2011-12 Working Smarter Projects: Cost Savings and New Revenue......................................................24
IV. General Campus Instruction1. 2011-12 General Campus Instruction Expenditures by Fund Source ........................................................312. 2011-12 General Campus Instruction Expenditures by Category ..............................................................313. Characteristics of Fall 2011 Undergraduate Students................................................................................324. Distribution of Domestic Undergraduate Students by Race/Ethnicity.........................................................325. 2011-12 Bachelor’s Degrees Conferred by Broad Discipline .....................................................................326. Characteristics of Fall 2011 Graduate Students ........................................................................................337. Distribution of Domestic Graduate Students by Race/Ethnicity..................................................................338. 2011-12 Graduate Degrees Conferred by Broad Discipline .......................................................................339. State-Supported FTE Student Enrollment..................................................................................................3610. California Resident Freshman and California Community College Transfer Entrants ................................3611. UC Merced FTE Student Enrollment .........................................................................................................3712. Fall 2011 California Resident Freshmen by Race/Ethnicity .......................................................................3713. Federal and Private Research Expenditures at UC Merced.......................................................................3814. General Campus Student-Faculty Ratio ....................................................................................................4015. Summer Headcount and FTE Enrollment .................................................................................................4516. Summer Enrollment Patterns of UC Undergraduates ................................................................................4517. Time to Degree among Freshmen by Cohort.............................................................................................4618. Graduation Rates among Freshmen by Cohort .........................................................................................4619. Graduation Rates among Upper Division CCC Transfer Students by Cohort ............................................4620. Undergraduate and Graduate General Campus FTE Enrollment...............................................................4821. Graduate Students as a Percentage of General Campus Enrollment ........................................................4822. Proportion of Graduate Enrollment at UC and Comparison Institutions .....................................................48
V. Health Sciences Instruction1. 2011-12 Health Sciences Instruction Expenditures by Fund Source..........................................................512. 2011-12 Health Sciences Instruction Expenditures by Category................................................................523. Projected California Population Growth by Age Group ..............................................................................52
VI. Self-Supporting Instructional Programs1. 2011-12 Self-Supporting Program Headcount Enrollment by Discipline ....................................................58
VII. Research1. 2011-12 Direct Research Expenditures by Fund Source ...........................................................................602. Trends in Research Expenditures by Source ............................................................................................61
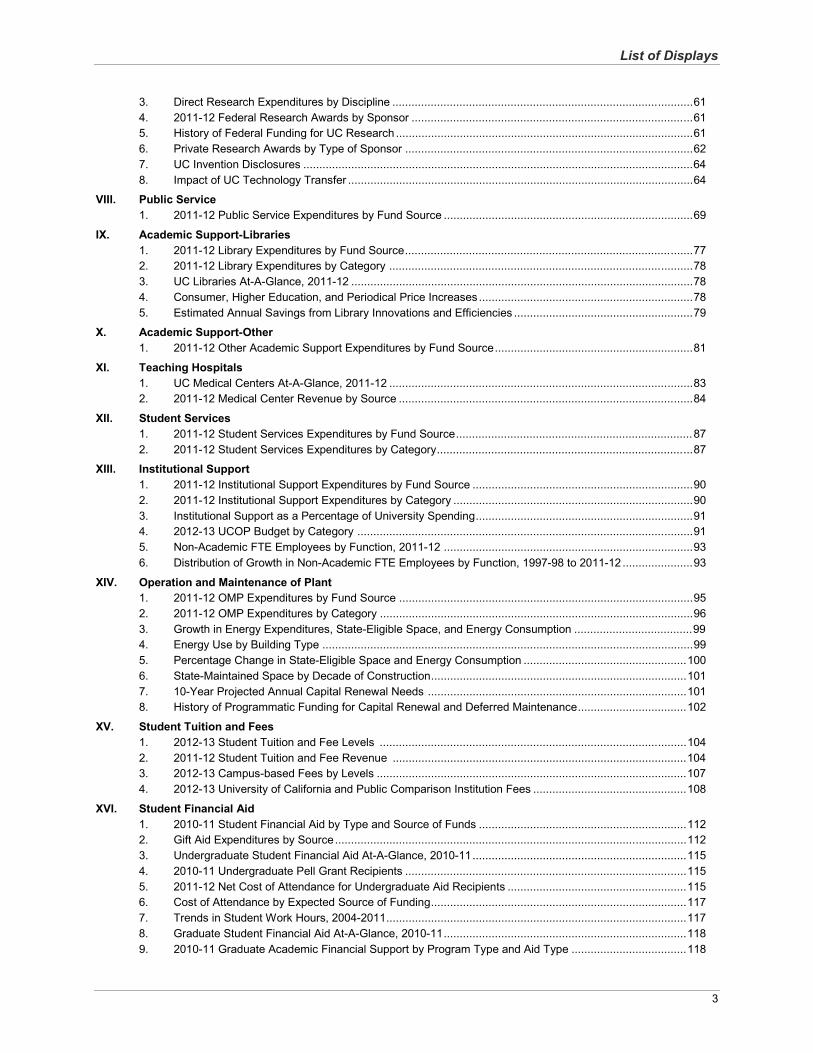
List of Displays
3
3. Direct Research Expenditures by Discipline ..............................................................................................614. 2011-12 Federal Research Awards by Sponsor ........................................................................................615. History of Federal Funding for UC Research .............................................................................................616. Private Research Awards by Type of Sponsor ..........................................................................................627. UC Invention Disclosures ..........................................................................................................................648. Impact of UC Technology Transfer ............................................................................................................64
VIII. Public Service1. 2011-12 Public Service Expenditures by Fund Source ..............................................................................69
IX. Academic Support-Libraries1. 2011-12 Library Expenditures by Fund Source..........................................................................................772. 2011-12 Library Expenditures by Category ...............................................................................................783. UC Libraries At-A-Glance, 2011-12 ...........................................................................................................784. Consumer, Higher Education, and Periodical Price Increases...................................................................785. Estimated Annual Savings from Library Innovations and Efficiencies ........................................................79
X. Academic Support-Other1. 2011-12 Other Academic Support Expenditures by Fund Source..............................................................81
XI. Teaching Hospitals1. UC Medical Centers At-A-Glance, 2011-12 ...............................................................................................832. 2011-12 Medical Center Revenue by Source ............................................................................................84
XII. Student Services1. 2011-12 Student Services Expenditures by Fund Source..........................................................................872. 2011-12 Student Services Expenditures by Category................................................................................87
XIII. Institutional Support1. 2011-12 Institutional Support Expenditures by Fund Source .....................................................................902. 2011-12 Institutional Support Expenditures by Category ...........................................................................903. Institutional Support as a Percentage of University Spending....................................................................914. 2012-13 UCOP Budget by Category .........................................................................................................915. Non-Academic FTE Employees by Function, 2011-12 ..............................................................................936. Distribution of Growth in Non-Academic FTE Employees by Function, 1997-98 to 2011-12 ......................93
XIV. Operation and Maintenance of Plant1. 2011-12 OMP Expenditures by Fund Source ............................................................................................952. 2011-12 OMP Expenditures by Category ..................................................................................................963. Growth in Energy Expenditures, State-Eligible Space, and Energy Consumption .....................................994. Energy Use by Building Type ....................................................................................................................995. Percentage Change in State-Eligible Space and Energy Consumption ...................................................1006. State-Maintained Space by Decade of Construction................................................................................1017. 10-Year Projected Annual Capital Renewal Needs .................................................................................1018. History of Programmatic Funding for Capital Renewal and Deferred Maintenance..................................102
XV. Student Tuition and Fees1. 2012-13 Student Tuition and Fee Levels ................................................................................................1042. 2011-12 Student Tuition and Fee Revenue ............................................................................................1043. 2012-13 Campus-based Fees by Levels .................................................................................................1074. 2012-13 University of California and Public Comparison Institution Fees ................................................108
XVI. Student Financial Aid1. 2010-11 Student Financial Aid by Type and Source of Funds .................................................................1122. Gift Aid Expenditures by Source..............................................................................................................1123. Undergraduate Student Financial Aid At-A-Glance, 2010-11...................................................................1154. 2010-11 Undergraduate Pell Grant Recipients ........................................................................................1155. 2011-12 Net Cost of Attendance for Undergraduate Aid Recipients ........................................................1156. Cost of Attendance by Expected Source of Funding................................................................................1177. Trends in Student Work Hours, 2004-2011..............................................................................................1178. Graduate Student Financial Aid At-A-Glance, 2010-11............................................................................1189. 2010-11 Graduate Academic Financial Support by Program Type and Aid Type ....................................118
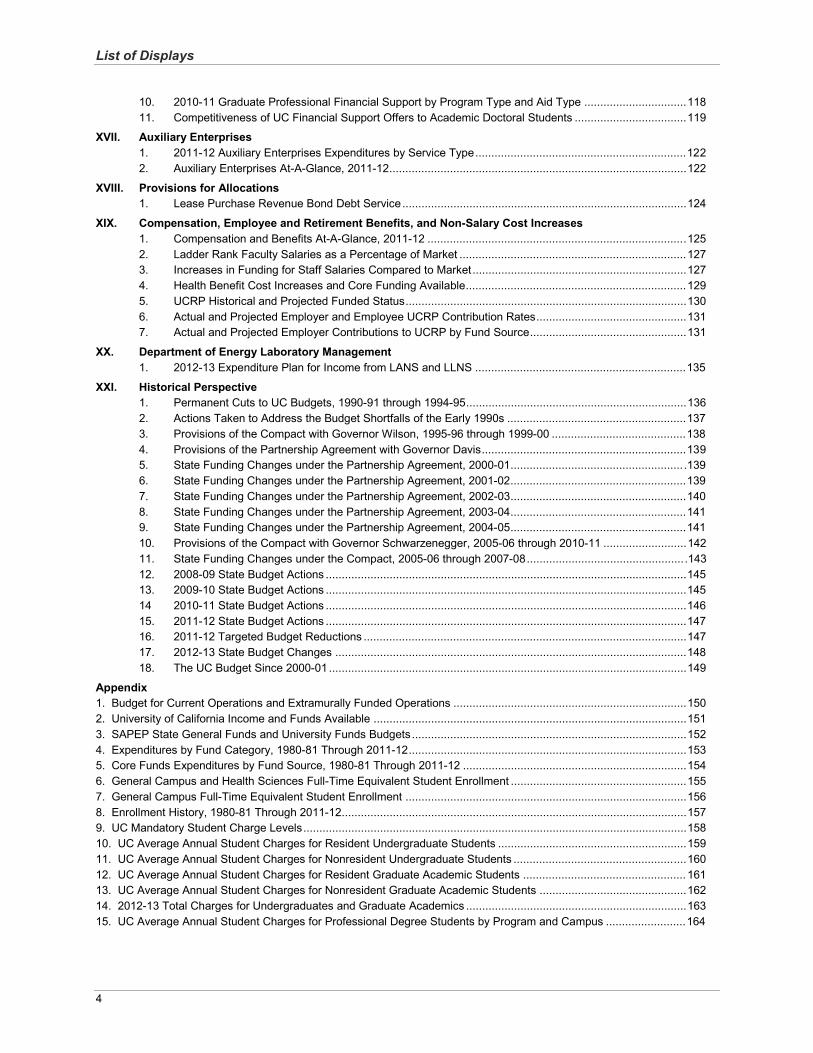
List of Displays
4
10. 2010-11 Graduate Professional Financial Support by Program Type and Aid Type ................................11811. Competitiveness of UC Financial Support Offers to Academic Doctoral Students ...................................119
XVII. Auxiliary Enterprises1. 2011-12 Auxiliary Enterprises Expenditures by Service Type..................................................................1222. Auxiliary Enterprises At-A-Glance, 2011-12.............................................................................................122
XVIII. Provisions for Allocations1. Lease Purchase Revenue Bond Debt Service.........................................................................................124
XIX. Compensation, Employee and Retirement Benefits, and Non-Salary Cost Increases1. Compensation and Benefits At-A-Glance, 2011-12 .................................................................................1252. Ladder Rank Faculty Salaries as a Percentage of Market .......................................................................1273. Increases in Funding for Staff Salaries Compared to Market...................................................................1274. Health Benefit Cost Increases and Core Funding Available.....................................................................1295. UCRP Historical and Projected Funded Status........................................................................................1306. Actual and Projected Employer and Employee UCRP Contribution Rates...............................................1317. Actual and Projected Employer Contributions to UCRP by Fund Source.................................................131
XX. Department of Energy Laboratory Management1. 2012-13 Expenditure Plan for Income from LANS and LLNS ..................................................................135
XXI. Historical Perspective1. Permanent Cuts to UC Budgets, 1990-91 through 1994-95.....................................................................1362. Actions Taken to Address the Budget Shortfalls of the Early 1990s ........................................................1373. Provisions of the Compact with Governor Wilson, 1995-96 through 1999-00 ..........................................1384. Provisions of the Partnership Agreement with Governor Davis................................................................1395. State Funding Changes under the Partnership Agreement, 2000-01...................................................... .1396. State Funding Changes under the Partnership Agreement, 2001-02.......................................................1397. State Funding Changes under the Partnership Agreement, 2002-03.......................................................1408. State Funding Changes under the Partnership Agreement, 2003-04.......................................................1419. State Funding Changes under the Partnership Agreement, 2004-05.......................................................14110. Provisions of the Compact with Governor Schwarzenegger, 2005-06 through 2010-11 ..........................14211. State Funding Changes under the Compact, 2005-06 through 2007-08................................................. .14312. 2008-09 State Budget Actions .................................................................................................................14513. 2009-10 State Budget Actions .................................................................................................................14514 2010-11 State Budget Actions .................................................................................................................14615. 2011-12 State Budget Actions .................................................................................................................14716. 2011-12 Targeted Budget Reductions .....................................................................................................14717. 2012-13 State Budget Changes ..............................................................................................................14818. The UC Budget Since 2000-01 ................................................................................................................149
Appendix1. Budget for Current Operations and Extramurally Funded Operations .........................................................................1502. University of California Income and Funds Available ..................................................................................................1513. SAPEP State General Funds and University Funds Budgets......................................................................................1524. Expenditures by Fund Category, 1980-81 Through 2011-12.......................................................................................1535. Core Funds Expenditures by Fund Source, 1980-81 Through 2011-12 ......................................................................1546. General Campus and Health Sciences Full-Time Equivalent Student Enrollment .......................................................1557. General Campus Full-Time Equivalent Student Enrollment ........................................................................................1568. Enrollment History, 1980-81 Through 2011-12............................................................................................................1579. UC Mandatory Student Charge Levels........................................................................................................................15810. UC Average Annual Student Charges for Resident Undergraduate Students ...........................................................15911. UC Average Annual Student Charges for Nonresident Undergraduate Students ......................................................16012. UC Average Annual Student Charges for Resident Graduate Academic Students ................................................... 16113. UC Average Annual Student Charges for Nonresident Graduate Academic Students ..............................................16214. 2012-13 Total Charges for Undergraduates and Graduate Academics .....................................................................16315. UC Average Annual Student Charges for Professional Degree Students by Program and Campus .........................164
“It is impossible to overstate the benefits UC brings to Californians, economically, culturally, and socially. UC is California’s primary driver of growth in each arena.”
Mark G. Yudof University of California
President
5
UC’s Role in the State of CaliforniaCalifornia’s far-sighted public investments in higher
education have fueled economic prosperity, social mobility,
and cultural opportunities for decades. The State’s historic
commitment has enabled the University of California not
only to educate the brightest students – over 237,000 in
2011-12 alone – but to touch the lives of every Californian:
UC educates the workforce needed by high technology,business, agriculture, health care, education, and other sectors of the economy.
UC conducts research that fuels the economy,creates jobs, increases productivity, and solves state and societal problems, leading to higher standards of living.
UC is a key source of innovation and entrepreneurs,which are essential to the industries that drive California’s competitiveness.
UC improves the health of Californians by providing an unmatched combination of state-of-the-art patient care facilities and groundbreaking research programs, which are integrated with the nation’s largest medical education program.
UC works with K-12 schools to improve the quality of instruction and expand educational opportunities.
UC has dozens of museums, concert halls, art galleries, botanical gardens, observatories and marine centers –academic resources but also exciting gathering places for the community.
Display I-1: UC At-A-Glance, 2012-13
Founded in 1869, the University of California consists of:
10 campuses serving almost 241,000 FTE students in over 700 instructional programs;
5 academic medical centers providing 3.9 million outpatient clinic visits per year;
a $4.5 billion research enterprise, seeking new knowledge and solutions to critical problems;Over 100 libraries housing 38 million print volumes;
More than 5,000 buildings comprising 129 million grosssquare feet; and
approximately 139,000 employees across the system.
UC’s excellence is well documented by the many honors
and awards conferred upon faculty, departments, and
campuses. That excellence, in turn, attracts billions of
dollars in federal and private funding every year and
supports the discovery and dissemination of new
knowledge that promotes economic, social, and cultural
development.
UC has long been a major contributor to California’s
vibrancy and strength. To maintain California’s leadership
role and to meet the changing needs of future generations,
California must continue to invest in the future by
supporting its world-class public research university
system.
THE STATE’S HISTORIC INVESTMENT IN UC
The University’s operating budget, totaling $24.1 billion in
2012-13, funds the core mission responsibilities of
teaching, research, and public service, as well as a wide
range of support activities, including teaching hospitals, the
Lawrence Berkeley National Laboratory, UC Extension,
housing and dining services, libraries, and other functions.
Historically, State funding has been the largest single source
of support for the University. However, the fiscal crises that
have rocked California since 1990 have reduced the State’s
share of core funding per student by more than half, as
described in the Sources of University Funds chapter of this
document. In 2011-12 alone the State cut $750 million from
the University’s base budget. California now funds UC at the
same level it did in 1997, when the University enrolled 83,000
fewer students. Due to enrollment growth and inflation that
have occurred since 1990-91, as well as the precipitous
decline in State funding, the value of the State’s
contribution has greatly diminished. The unprecedented
cuts of over $1 billion in State funding since 2008-09
threaten California’s ability to meet its critical need for a
world-class “publicly-supported” research university.
UC’s Role in the State of California
6
Over the last two decades, student tuition and fees and
other sources of general funds, such as federal indirect cost
recovery funding, have helped to mitigate the impact of
declines in State support for UC, but overall core funding
per student has declined by 25% in inflation-adjusted
dollars. Other fund sources augment the University’s core
activities of instruction and research; support academic and
administrative functions; allow UC to provide public service
to the state and its people; and support rich social, cultural,
and learning environments on UC campuses.
Yet State General Funds remain extremely critical because
they support the core instructional mission and make it
possible to attract funds from other sources. Each year, UC
draws approximately $8 billion from outside the state and
generates more than $46 billion in economic activity in
California. State funds help leverage significant private
funding, with one example being the California Institutes for
Science and Innovation, a unique funding partnership
between the State, industry, and UC; the Institutes are
discussed in more detail in the Research chapter of this
report.
The historic investment from the State has helped develop
the finest public university system in the world. That
investment must be restored if UC is to remain among the
world’s top universities and continue to provide the state
with the economic and social benefits that derive from a
great institution of research and learning.
Planning for the University’s 2013-14 budget is proceeding
against the backdrop of the State’s persisting fiscal
problems. UC is aggressively reducing operating costs and
identifying alternative sources of revenue to help offset lost
State support. These alternative revenue sources include
private and alumni giving, increased indirect cost recovery
rates, debt restructuring, and various balance sheet
strategies.
Yet even under the most optimistic assumptions, efficiency
improvements and alternative revenue generation are
sufficient to address only a portion of the projected budget
shortfall over the next few years. Tuition and fees have
historically increased to mitigate State funding reductions,
though these increases have only partially backfilled for the
cuts in State support – and in 2011-12, students began
THE PURSUIT OF EXCELLENCE
The University of California is internationally renowned for the quality of its academic programs and consistently ranks among the world’s leading institutions in the number of faculty, researchers, programs, and campuses singled out for awards and distinctions, election to academic and scientific organizations, and other honors.
59 Nobel laureates – more than any other public university, including a 2012 winner of the Physiology or Medicine prize, Shinya Yamanaka, and a 2012 winner of the Economics prize, Lloyd Shapley
61 Medal of Science winners
410 current, emeritus or retired National Academy of Science members
437 American Academy of Arts and Sciences members
More than 200 Institute of Medicine members
Almost 1,000 American Association for the Advancement of Science members
84 recipients of MacArthur Foundation “genius” grants since their start in 1981
1,494 Guggenheim fellowships since 1930 – more than any other university or college
For 19 years running, UC has developed more patents than any university in the United States
Washington Monthly 2012 college rankings that focused on how much an institution benefits the country — how well it performs as an engine of social mobility, fosters scientific and humanistic research, and promotes an ethic of service to the country – included seven UC campuses in the top 100, with the San Diego campus at the top of the list and three other campuses in the top ten.
In 2010, the National Research Council reviewed 322 UC programs in science, math, engineering, social sciences, and humanities, ranking 141 among the top 10 in their fields.
Six campuses were among the top 45 American universities, as ranked by US News and World Report for 2012-13.
The medical centers at Los Angeles and San Francisco were ranked fifth and thirteenth by US News in their 2012-13 Best Hospitals ”Honor Roll.”
The Institute of Higher Education at Shanghai Jiao Tong University in China annually ranks worldwide universities based on several indicators of academic or research performance. In 2012, nine campuses were included in the top 150 and four in the top 20.
UC’s Role in the State of California
7
THE CALIFORNIA MASTER PLAN FOR HIGHER EDUCATION
The Master Plan has served as California’s blueprint for higher education for more than 50 years, specifying the mission of each segment of higher education. UC’s mission is tripartite:
Teaching. UC serves students at all levels of higher education and is the public segment primarily responsible for awarding the doctorate and many professional degrees in areas such as medicine and law.
Research. UC is the primary State-supported academic agency for research. Research is inextricably linked with teaching at the graduate level and is increasingly so at the undergraduate level. Research also creates a vital link between UC and the private sector and development of new knowledge and innovation leading to new industries and jobs.
Public Service. UC contributes to the well-being of communities, the state, and the nation through efforts including academic preparation programs, Cooperative Extension, and health clinics. UC’s public service programs allow policy makers to draw on the expertise of UC’s faculty and staff to address public policy issues of importance to the state and society at large.
contributing more to their UC education than the State for
the first time in California history.
If the Governor’s revenue-raising initiative passes in
November, the Governor has expressed his intention to
enter into a multi-year framework with UC that would
include annual base budget increases from the State and
moderate, predictable tuition and fee increases going
forward. If the Governor’s initiative does not pass and the
State is not able to provide regular base budget
adjustments over the next few years, UC will undoubtedly
rely on larger tuition and fee increases to provide the
revenue needed to stabilize UC’s fiscal foundation.
UC’S COLLEGE GRADUATES AND THE CALIFORNIA ECONOMY
California’s Economic Performance. California has a
long history of strong economic performance, including
thriving industries and high-paying jobs. If California were a
country, its economy would be among the top 10 in the
world. In comparison to other states, salaries in California
have been well above the national average for the last
three decades.
California became one of the world’s leading economies in
the second half of the 20th century, in part because it has a
high number of excellent research universities and more
venture capital than other states, which has helped create
and attract knowledge-based companies. Basic research
at California’s research universities, for example, served as
the foundation for the biotechnology industry, while
hundreds of biotechnology companies have been founded
by UC faculty and former students. In addition, the success
of knowledge-based companies is heavily reliant upon
discoveries, well-educated employees, and technology
transfer from University research laboratories.
Declining Educational Attainment of the Labor Force. As baby boomers retire, they will be replaced by younger
workers. These younger workers, however, will have lower
educational levels than today’s retirees. According to the
2006 report by economists at the California State University
(CSU) at Sacramento’s Applied Research Center, “Keeping
California’s Edge: The Growing Demand for Highly
Educated Workers,”
“In recent history, California’s education pipeline has always assured that the next cohort to enter the labor force would be better educated than current and previous cohorts. Employers could anticipate the ever-improving educational attainment of the labor force. Now, for the first time, projections of California’s education pipeline indicate declining labor force quality compared to previous cohorts, which raises questions about our ability to supply the higher-educated labor force of the future.”
While 41% of California’s 45- to 64-year-olds hold an
associate’s degree or higher, only 36% of 25- to 34-year-
olds are as educated. The report projects, moreover, that
occupations in California requiring an associate’s degree or
higher will grow by more than 46% between 2002 and
2022, while occupations not requiring higher education will
grow by only 33.5%.
The industries that will be driving California’s longer-term
economic competitiveness will be knowledge-based
industries. California’s fastest growing occupational
categories are professional and managerial jobs. In the
early 1980s, professionals and managers held one-fourth of
all jobs in California. Today, that fraction has grown to one-
third of all jobs.
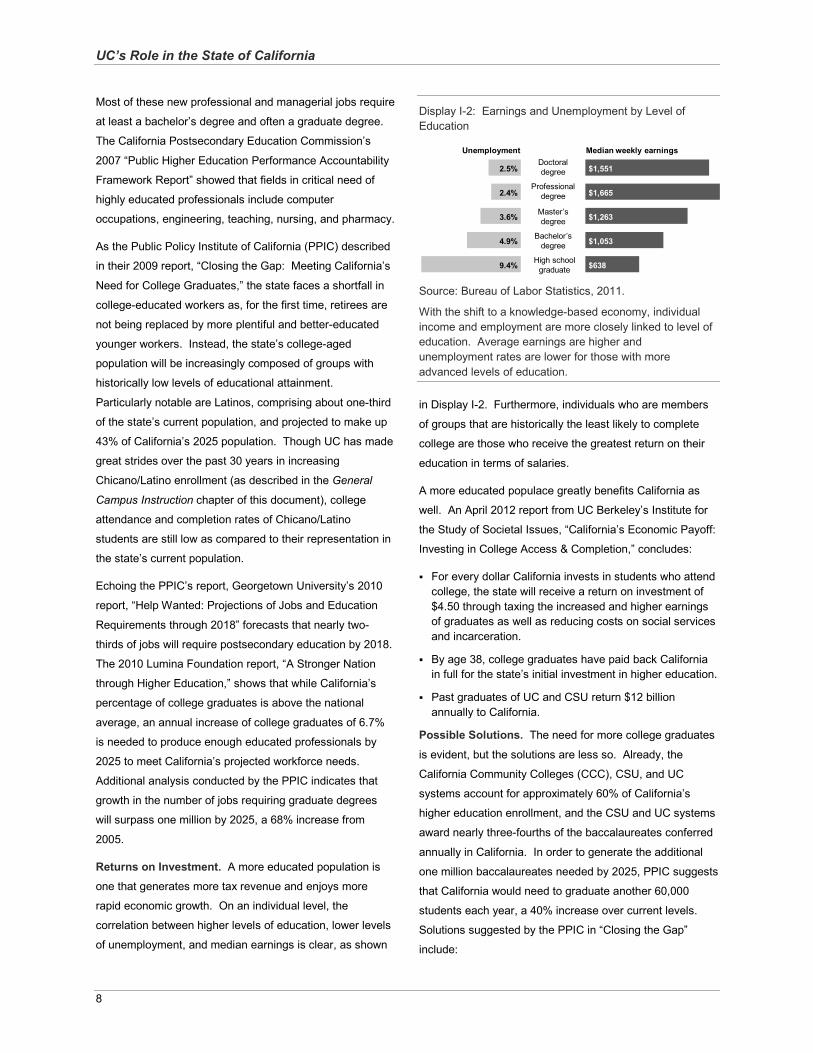
UC’s Role in the State of California
8
Most of these new professional and managerial jobs require
at least a bachelor’s degree and often a graduate degree.
The California Postsecondary Education Commission’s
2007 “Public Higher Education Performance Accountability
Framework Report” showed that fields in critical need of
highly educated professionals include computer
occupations, engineering, teaching, nursing, and pharmacy.
As the Public Policy Institute of California (PPIC) described
in their 2009 report, “Closing the Gap: Meeting California’s
Need for College Graduates,” the state faces a shortfall in
college-educated workers as, for the first time, retirees are
not being replaced by more plentiful and better-educated
younger workers. Instead, the state’s college-aged
population will be increasingly composed of groups with
historically low levels of educational attainment.
Particularly notable are Latinos, comprising about one-third
of the state’s current population, and projected to make up
43% of California’s 2025 population. Though UC has made
great strides over the past 30 years in increasing
Chicano/Latino enrollment (as described in the General
Campus Instruction chapter of this document), college
attendance and completion rates of Chicano/Latino
students are still low as compared to their representation in
the state’s current population.
Echoing the PPIC’s report, Georgetown University’s 2010
report, “Help Wanted: Projections of Jobs and Education
Requirements through 2018” forecasts that nearly two-
thirds of jobs will require postsecondary education by 2018.
The 2010 Lumina Foundation report, “A Stronger Nation
through Higher Education,” shows that while California’s
percentage of college graduates is above the national
average, an annual increase of college graduates of 6.7%
is needed to produce enough educated professionals by
2025 to meet California’s projected workforce needs.
Additional analysis conducted by the PPIC indicates that
growth in the number of jobs requiring graduate degrees
will surpass one million by 2025, a 68% increase from
2005.
Returns on Investment. A more educated population is
one that generates more tax revenue and enjoys more
rapid economic growth. On an individual level, the
correlation between higher levels of education, lower levels
of unemployment, and median earnings is clear, as shown
Display I-2: Earnings and Unemployment by Level of Education
Source: Bureau of Labor Statistics, 2011.
With the shift to a knowledge-based economy, individual income and employment are more closely linked to level of education. Average earnings are higher and unemployment rates are lower for those with more advanced levels of education.
in Display I-2. Furthermore, individuals who are members
of groups that are historically the least likely to complete
college are those who receive the greatest return on their
education in terms of salaries.
A more educated populace greatly benefits California as
well. An April 2012 report from UC Berkeley’s Institute for
the Study of Societal Issues, “California’s Economic Payoff:
Investing in College Access & Completion,” concludes:
For every dollar California invests in students who attend college, the state will receive a return on investment of $4.50 through taxing the increased and higher earnings of graduates as well as reducing costs on social services and incarceration.
By age 38, college graduates have paid back California in full for the state’s initial investment in higher education.
Past graduates of UC and CSU return $12 billion annually to California.
Possible Solutions. The need for more college graduates
is evident, but the solutions are less so. Already, the
California Community Colleges (CCC), CSU, and UC
systems account for approximately 60% of California’s
higher education enrollment, and the CSU and UC systems
award nearly three-fourths of the baccalaureates conferred
annually in California. In order to generate the additional
one million baccalaureates needed by 2025, PPIC suggests
that California would need to graduate another 60,000
students each year, a 40% increase over current levels.
Solutions suggested by the PPIC in “Closing the Gap”
include:
2.5%
3.6%
2.4%
4.9%
$6389.4%
$1,053
$1,263
$1,665
$1,551
Unemployment Median weekly earningsDoctoral degree
Professional degree
Master’s degree
Bachelor’s degree
High school graduate
UC’s Role in the State of California
9
Increase college attendance. The National Center for Public Policy and Higher Education found in 2008 that only 56% of California’s high school graduates directly matriculate to any college, compared to 62% nationwide.
Increase the transfer rate to CSU and UC. Only 20-30% of students who matriculate at a community college eventually transfer to a four-year institution, and community college students spend an average of four years at a CCC before transferring.
A May 2012 report from the PPIC, “Defunding Higher
Education: What Are the Effects on College Enrollment?”
examines the effects of California’s eroded financial
commitment to higher education on declining enrollment
rates at California’s institutes of higher education. Findings
include:
Enrollment rates at UC and CSU have fallen by one-fifth over the past five years, from about 22% of all high school graduates to below 18%.
Among the state’s most highly prepared high school graduates – those completing the ‘a-g’ courses required for admission to UC and CSU – the enrollment rate has declined even more, from around 67% to 55%.
About one in 10 students who were accepted to UC did not appear to enroll in any college.
The PPIC also projects that unless enrollment and
graduation rates substantially improve, by 2025 California
will fall one million college graduates short of economic
demand.
A lack of public investment in education will continue
to erode the economic advantages and quality of life that
Californians have long enjoyed. Unfortunately, because the
State has been unable to fully fund recent enrollment
growth, UC, like CSU, took steps to constrain enrollment
growth in recent years, thus limiting UC’s ability to
contribute to increasing college attendance. The University
can, however, make inroads with improving the transfer
rate. President Yudof has made increasing transfer
enrollments a priority for UC, and UC has several initiatives
to this end. In the future, California will also be in need of
students with graduate-level training. Recent enrollment
trends, efforts to expand transfer enrollment, and the need
for more graduate students are discussed in the General
Campus Instruction chapter of this document.
UC’S CONTRIBUTION TO THE STATE ECONOMY
In 2011, UC commissioned a study of its economic
contribution to the state of California. Though it has been
long known that UC-related economic activity touches
every corner of California, making important contributions
even in regions without a UC campus, the report quantified
many of UC’s economic impacts.
UC generates about $46.3 billion in economic activity in California and contributes about $32.8 billion to the Gross State Product annually.
Every dollar the California taxpayer invests in UC results in $9.80 in Gross State Product and $13.80 in overall economic output.
One out of every 46 jobs in California – approximately 430,000 jobs – is supported by UC operations and outside spending by the University’s faculty, staff, students, and retirees.
UC is the state’s third-largest employer, behind only the State and federal governments, and well ahead of California’s largest private-sector employers.
UC attracts about $8 billion in annual funding from outside the state.
Every $1 reduction in State funding for UC has the potential to reduce State economic output by $2.10 due to ripple effects of UC activities across the entire California economy.
The University of California is an inextricable part of the
California economy, truly touching the lives of all the state’s
citizens. The fortunes of UC and the state are intrinsically
linked, such that disinvestment in UC on the part of the
State represents a disinvestment in California and its
citizens as well.
While California remains among the highest educated and
earning states in the nation, that advantage is declining and
will disappear if current trends in education continue. The
University of California thus far remains one of the top
universities in the world, as a research institution and as an
engine of economic growth. Investment by the State in UC
translates to investment in the future of California.
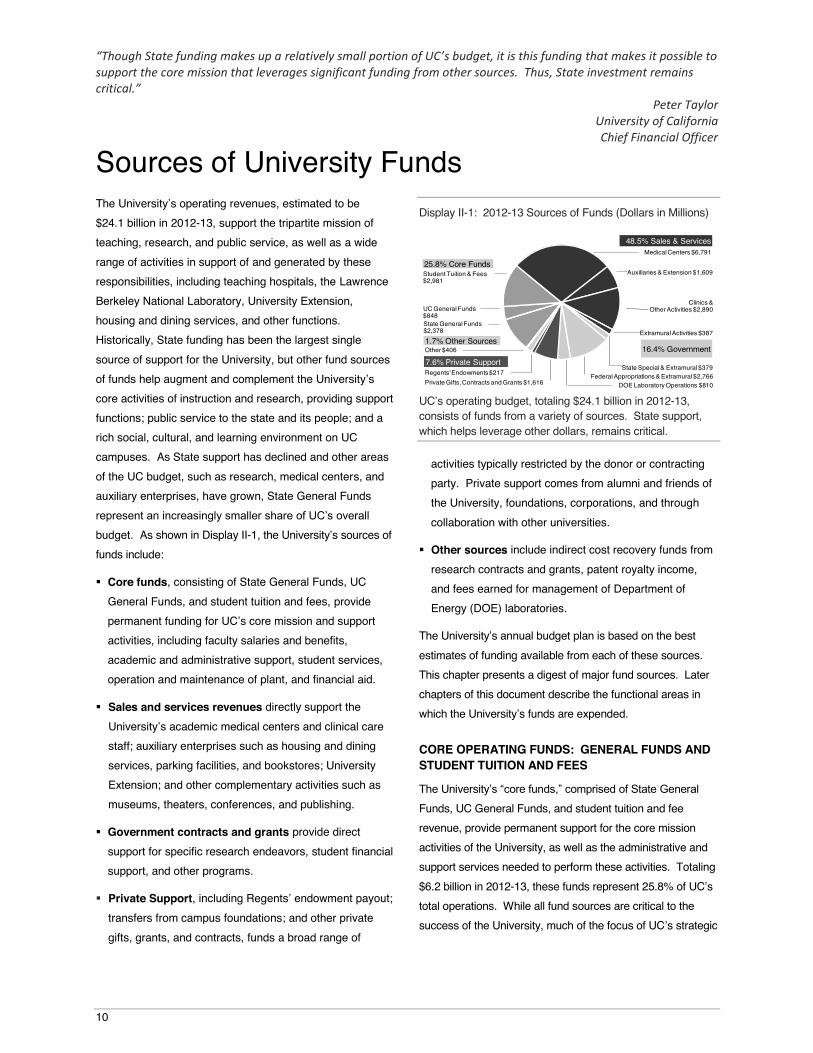
“Though State funding makes up a relatively small portion of UC’s budget, it is this funding that makes it possible to support the core mission that leverages significant funding from other sources. Thus, State investment remains critical.”
Peter Taylor University of California
Chief Financial Officer
10
Sources of University Funds The University’s operating revenues, estimated to be $24.1 billion in 2012-13, support the tripartite mission of teaching, research, and public service, as well as a wide range of activities in support of and generated by these responsibilities, including teaching hospitals, the Lawrence Berkeley National Laboratory, University Extension, housing and dining services, and other functions. Historically, State funding has been the largest single source of support for the University, but other fund sources of funds help augment and complement the University’s core activities of instruction and research, providing support functions; public service to the state and its people; and a rich social, cultural, and learning environment on UC campuses. As State support has declined and other areas of the UC budget, such as research, medical centers, and auxiliary enterprises, have grown, State General Funds represent an increasingly smaller share of UC’s overall
budget. As shown in Display II-1, the University’s sources of funds include:
Core funds, consisting of State General Funds, UC General Funds, and student tuition and fees, provide permanent funding for UC’s core mission and support activities, including faculty salaries and benefits, academic and administrative support, student services, operation and maintenance of plant, and financial aid.
Sales and services revenues directly support the University’s academic medical centers and clinical care staff; auxiliary enterprises such as housing and dining services, parking facilities, and bookstores; University Extension; and other complementary activities such as museums, theaters, conferences, and publishing.
Government contracts and grants provide direct support for specific research endeavors, student financial support, and other programs.
Private Support, including Regents’ endowment payout; transfers from campus foundations; and other private gifts, grants, and contracts, funds a broad range of
Display II-1: 2012-13 Sources of Funds (Dollars in Millions)
UC’s operating budget, totaling $24.1 billion in 2012-13, consists of funds from a variety of sources. State support, which helps leverage other dollars, remains critical.
activities typically restricted by the donor or contracting party. Private support comes from alumni and friends of the University, foundations, corporations, and through collaboration with other universities.
Other sources include indirect cost recovery funds from research contracts and grants, patent royalty income, and fees earned for management of Department of Energy (DOE) laboratories.
The University’s annual budget plan is based on the best estimates of funding available from each of these sources. This chapter presents a digest of major fund sources. Later chapters of this document describe the functional areas in which the University’s funds are expended.
CORE OPERATING FUNDS: GENERAL FUNDS AND STUDENT TUITION AND FEES
The University’s “core funds,” comprised of State General
Funds, UC General Funds, and student tuition and fee revenue, provide permanent support for the core mission activities of the University, as well as the administrative and support services needed to perform these activities. Totaling $6.2 billion in 2012-13, these funds represent 25.8% of UC’s total operations. While all fund sources are critical to the success of the University, much of the focus of UC’s strategic
48.5% Sales & Services
25.8% Core Funds
16.4% Government7.6% Private Support
State General Funds $2,378
UC General Funds $848
Student Tuition & Fees $2,981
Auxiliaries & Extension $1,609
Medical Centers $6,791
Private Gifts, Contracts and Grants $1,616Regents' Endowments $217
1.7% Other Sources
Federal Appropriations & Extramural $2,766State Special & Extramural $379
Extramural Activities $387
Clinics & Other Activities $2,890
DOE Laboratory Operations $810
Other $406
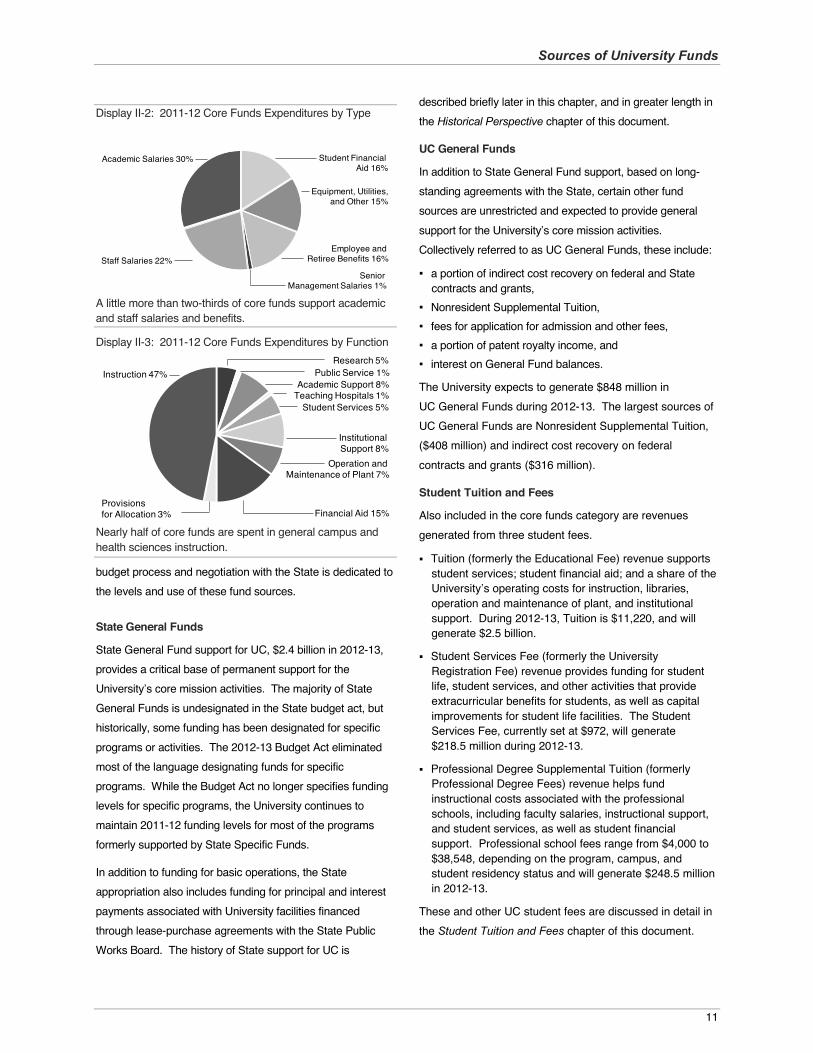
Sources of University Funds
11
Display II-2: 2011-12 Core Funds Expenditures by Type
A little more than two-thirds of core funds support academic and staff salaries and benefits.
Display II-3: 2011-12 Core Funds Expenditures by Function
Nearly half of core funds are spent in general campus and health sciences instruction.
budget process and negotiation with the State is dedicated to the levels and use of these fund sources.
State General Funds
State General Fund support for UC, $2.4 billion in 2012-13, provides a critical base of permanent support for the University’s core mission activities. The majority of State General Funds is undesignated in the State budget act, but historically, some funding has been designated for specific programs or activities. The 2012-13 Budget Act eliminated most of the language designating funds for specific programs. While the Budget Act no longer specifies funding levels for specific programs, the University continues to maintain 2011-12 funding levels for most of the programs formerly supported by State Specific Funds.
In addition to funding for basic operations, the State appropriation also includes funding for principal and interest payments associated with University facilities financed through lease-purchase agreements with the State Public Works Board. The history of State support for UC is
described briefly later in this chapter, and in greater length in the Historical Perspective chapter of this document.
UC General Funds
In addition to State General Fund support, based on long-standing agreements with the State, certain other fund sources are unrestricted and expected to provide general support for the University’s core mission activities. Collectively referred to as UC General Funds, these include:
a portion of indirect cost recovery on federal and State contracts and grants,
Nonresident Supplemental Tuition, fees for application for admission and other fees, a portion of patent royalty income, and interest on General Fund balances.
The University expects to generate $848 million in UC General Funds during 2012-13. The largest sources of UC General Funds are Nonresident Supplemental Tuition, ($408 million) and indirect cost recovery on federal contracts and grants ($316 million).
Student Tuition and Fees
Also included in the core funds category are revenues generated from three student fees.
Tuition (formerly the Educational Fee) revenue supports student services; student financial aid; and a share of the University’s operating costs for instruction, libraries, operation and maintenance of plant, and institutional support. During 2012-13, Tuition is $11,220, and will generate $2.5 billion.
Student Services Fee (formerly the University Registration Fee) revenue provides funding for student life, student services, and other activities that provide extracurricular benefits for students, as well as capital improvements for student life facilities. The Student Services Fee, currently set at $972, will generate $218.5 million during 2012-13.
Professional Degree Supplemental Tuition (formerly Professional Degree Fees) revenue helps fund instructional costs associated with the professional schools, including faculty salaries, instructional support, and student services, as well as student financial support. Professional school fees range from $4,000 to $38,548, depending on the program, campus, and student residency status and will generate $248.5 million in 2012-13.
These and other UC student fees are discussed in detail in the Student Tuition and Fees chapter of this document.
Academic Salaries 30%
Staff Salaries 22%Senior
Management Salaries 1%
Employee and Retiree Benefits 16%
Student Financial Aid 16%
Equipment, Utilities, and Other 15%
Instruction 47% Public Service 1%
Provisions for Allocation 3% Financial Aid 15%
Institutional Support 8%
Student Services 5%
Academic Support 8%
Research 5%
Teaching Hospitals 1%
Operation and Maintenance of Plant 7%
Sources of University Funds
12
Historical Changes in Core Funds Support
State funds represent a critical investment by the State, making it possible for the University to attract funds from other sources. Each year, UC attracts approximately $8 billion from outside the state and generates more than $46 billion in economic activity in California.
State funding for UC has fluctuated over time, as shown in Display II-4. Funding increases and reductions have largely coincided with changes in the state’s economy.
In the late 1980s, State funding for UC doubled due to the high priority placed on the University of California by Governor Deukmejian and the Legislature, but extraordinary declines occurred during recessionary years in the early 1990s.
Since 1990-91, State funding for the University of California has been marked by dramatic reductions due to recurrent fiscal crises followed by temporary increases tied to ambitious plans to restore support.
In the early 1990s, the University lost the equivalent of 20% of State support.
Later in the decade, under agreements with Governors Wilson and Davis, significant funding increases were provided for enrollment growth, to avoid student fee increases, and to maintain quality.
Another State fiscal crisis during the early 2000s meant a significant step back in State support during a time of rapid enrollment growth.
In the middle of the last decade, UC entered a six-year Compact with Governor Schwarzenegger to provide the minimum resources needed for the University to accommodate enrollment growth and sustain the quality of the institution. From 2005-06 through 2007-08, the Compact served the University, students, and the State well, allowing UC to continue enrollment growth, provide compensation increases for faculty and staff, and avoid a student fee increase in 2006-07.
The State’s ongoing budget shortfalls, compounded by the global financial crisis, led to the abrogation of the Governor’s Compact and significant reductions in State support at the end of the decade. For two years, no funding was provided for enrollment growth, at a time
when demand for UC was soaring. Federal economic stimulus funds provided temporary support.
In 2011-12, due to the lingering effects of the recession and ongoing State structural deficit, State funding for UC is more than $1.6 billion less than it would have been under the most recent agreement.
In 2012-13, the University received a $105.9 million increase in its State funding. This augmentation, though modest, is noteworthy given the State’s continuing $15.7 billion budget shortfall and the fact that nearly every other agency took cuts. The State directed most of the increased funding to cover a portion of the State’s
share of UC’s retirement costs. This is the first time since the State stopped making contributions to UCRP in the early 1990s that the State has acknowledged its responsibility to contribute to UC’s retirement costs, as it has always done for the California State University and California Community Colleges.
The net result of these swings is that State support is just $242 million above the amount provided in 1990-91, reflecting average annual growth of just 0.5%. During this same period of volatility in State funding, the number of California high school graduates has soared. The University accepted the challenge to accommodate growing numbers of students prepared for and seeking a quality university education, and succeeded in enrolling many more students. Student enrollment in 2012-13 is 52% greater than 1990-91 levels, and UC has opened a tenth campus, while State support for UC has grown just 11% in non-inflation-adjusted dollars. This discrepancy is further exacerbated by the inflation that has occurred since 1990-91, as described below.
Furthermore, while funding from the State in real dollars tripled during the period from 1980-81 through 2007-08, the University’s share of the total State General Fund budget declined markedly (see Display II-5). In 1980-81, the State dedicated 5% of the State General Fund to the University. In 2012-13, funding for UC represented just 2.6% of the State budget. Other State operations, and the prison system in particular, have taken increasingly larger shares. In 1990-91, the State’s corrections budget was slightly less than support for UC. Today, State funding for corrections exceeds
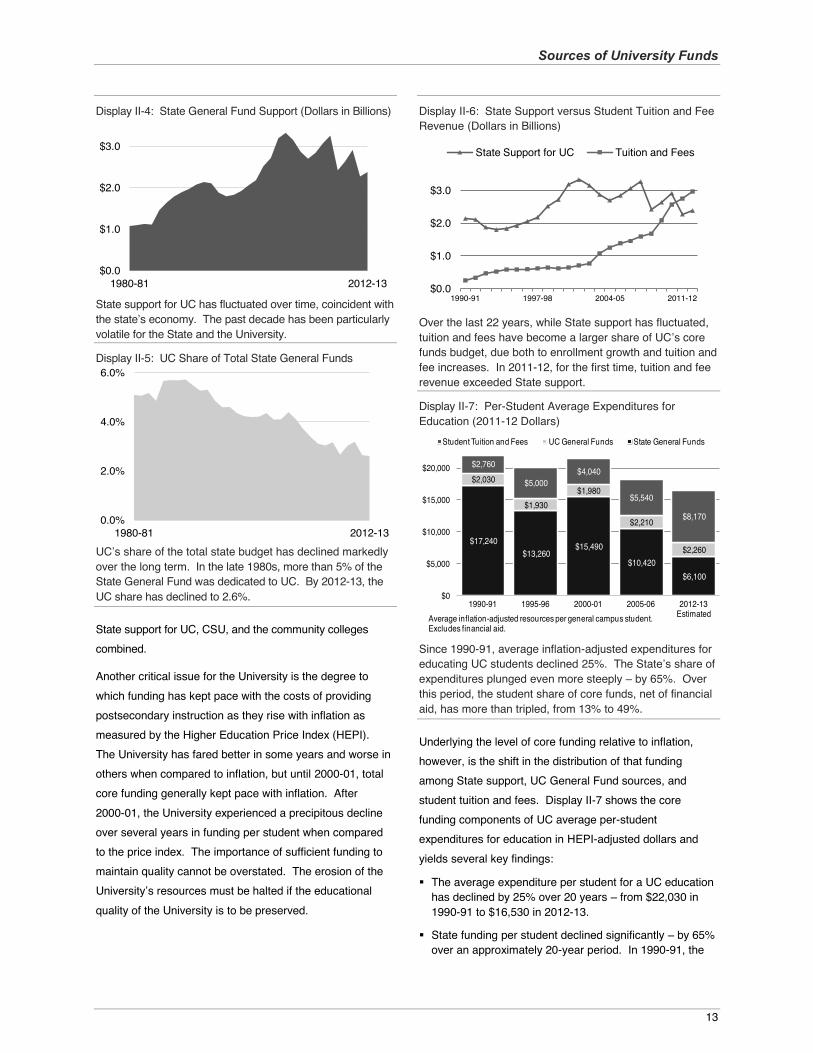
Sources of University Funds
13
Display II-4: State General Fund Support (Dollars in Billions)
State support for UC has fluctuated over time, coincident with the state’s economy. The past decade has been particularly volatile for the State and the University.
Display II-5: UC Share of Total State General Funds
UC’s share of the total state budget has declined markedly over the long term. In the late 1980s, more than 5% of the State General Fund was dedicated to UC. By 2012-13, the UC share has declined to 2.6%.
State support for UC, CSU, and the community colleges combined.
Another critical issue for the University is the degree to which funding has kept pace with the costs of providing postsecondary instruction as they rise with inflation as measured by the Higher Education Price Index (HEPI). The University has fared better in some years and worse in others when compared to inflation, but until 2000-01, total core funding generally kept pace with inflation. After 2000-01, the University experienced a precipitous decline over several years in funding per student when compared to the price index. The importance of sufficient funding to maintain quality cannot be overstated. The erosion of the University’s resources must be halted if the educational quality of the University is to be preserved.
Display II-6: State Support versus Student Tuition and Fee Revenue (Dollars in Billions)
Over the last 22 years, while State support has fluctuated, tuition and fees have become a larger share of UC’s core funds budget, due both to enrollment growth and tuition and fee increases. In 2011-12, for the first time, tuition and fee revenue exceeded State support.
Display II-7: Per-Student Average Expenditures for Education (2011-12 Dollars)
Since 1990-91, average inflation-adjusted expenditures for educating UC students declined 25%. The State’s share of expenditures plunged even more steeply – by 65%. Over this period, the student share of core funds, net of financial aid, has more than tripled, from 13% to 49%.
Underlying the level of core funding relative to inflation, however, is the shift in the distribution of that funding among State support, UC General Fund sources, and student tuition and fees. Display II-7 shows the core funding components of UC average per-student expenditures for education in HEPI-adjusted dollars and yields several key findings:
The average expenditure per student for a UC education has declined by 25% over 20 years – from $22,030 in 1990-91 to $16,530 in 2012-13.
State funding per student declined significantly – by 65% over an approximately 20-year period. In 1990-91, the
$0.0
$1.0
$2.0
$3.0
1980-81 2012-13
0.0%
2.0%
4.0%
6.0%
1980-81 2012-13
$0.0
$1.0
$2.0
$3.0
1990-91 1997-98 2004-05 2011-12
State Support for UC Tuition and Fees
$17,240 $13,260
$15,490
$10,420 $6,100
$2,030
$1,930 $1,980
$2,210
$2,260
$2,760
$5,000 $4,040
$5,540
$8,170
$0
$5,000
$10,000
$15,000
$20,000
1990-91 1995-96 2000-01 2005-06 2012-13 Estimated
Student Tuition and Fees UC General Funds State General Funds
Average inflation-adjusted resources per general campus student. Excludes financial aid.
Sources of University Funds
14
State contributed $17,240 per student – 78% of the total cost. In 2012-13, the State share declined to $6,100, just 37%.
As the State subsidy has declined, the share students pay has more than tripled. In 1990-91, students contributed 13% of the cost of their education; students are paying 49% of the cost of their education in 2012-13.
These findings raise several additional points. First, the funding gap that has developed since 1990-91 represents lost support totaling over $1.2 billion. Although the University has struggled to meet the challenge presented by this substantial decline in State funding, certain elements of the educational, research, and public service functions have been steadily compromised in order to preserve the core missions of the University. While austerity measures are necessary to address the short-term budget shortfall, they cannot be sustained over the long term if the institution is to retain its excellence. It is unrealistic to assume that cuts of this magnitude, particularly the cuts experienced over the last five years, will not damage the state’s brain trust, the California economy, and individual students’ chances for educational advancement. While the University has been able to reduce some costs through efficiencies that do not affect program quality, some of the reduced cost has come in the form of austerity measures that are detrimental to the quality of a UC education. Such austerity measures include increases in the student-faculty ratio; faculty and staff salary lags; reductions in purchases of instructional equipment and library materials; and deferred maintenance of classrooms, laboratories and other facilities.
Second, national news coverage about skyrocketing costs of college attendance masks what has really happened at UC. Expenditures per student have not increased, but rather have fallen (in constant dollars). Instead, tuition and fees paid by students have risen as funding from the State has declined. Most increases over the last thirty years have been implemented to offset cuts in State support during the four major economic downturns in the State since 1980. Tuition and fees increased 92% between 1980-81 and 1983-84, 134% between 1990-91 and 1993-94, 58% between 2003-04 and 2005-06, and 83% between 2007-08 and 2011-12.
Historically, student tuition and fee increases have helped maintain quality, but have not fully compensated for the loss of State funds. Under better circumstances, had the State subsidy not declined, student tuition and fees would have remained low.
Third, despite rising fees for students, UC has successfully maintained student access and affordability. While tuition and fees have increased, the University has provided significant increases in financial aid to help ensure access for low-income students. UC has maintained affordability for these students by sustaining a strong financial aid program.
SALES AND SERVICES REVENUES
About 48.5% of the University’s current budget consists of revenues from self-supporting enterprises operated by the University in support of its instruction, research, and public service missions. Such enterprises include the University’s academic medical centers and clinics; auxiliary enterprises such as housing and dining services, parking facilities, and bookstores; University Extension; and other complementary activities such as museums, theaters, conferences, and scholarly publishing. Revenues from these activities are restricted — operations are market-driven and face many of the same cost and revenue pressures occurring in the private sector. Revenues are tied not only to the quality of the direct services and products being provided, but also to the price the market will bear. The excellence of the core mission operation of the University also plays a role. For example, the cutting-edge research occurring in UC medical schools helps attract patients to UC’s medical centers. Conversely, damage to UC’s core operations is likely to have ripple effects to other activities.
Teaching Hospitals
The University’s academic medical centers generate three types of revenue:
Patient service revenues are charges for services rendered to patients at a medical center’s established rates, including rates charged for inpatient care, outpatient care, and ancillary services. Major sources of revenue are government-sponsored health care programs (i.e., Medicare and Medi-Cal), commercial insurance companies, managed care and other contracts, and self-pay patients.
Sources of University Funds
15
Other operating revenues are derived from non-patient care activities of the medical centers, such as cafeteria sales and parking fees. Another major source is Clinical Teaching Support (with a permanent budget of $22.7 million in 2011-12), provided by the State to help pay for the costs of teaching programs at the hospitals.
Non-operating revenues result from activities other than normal operations of the medical centers, such as interest income and salvage value from disposal of a capital asset.
Medical center revenues are used for operating expenses, including salaries and benefits, supplies and services, workers’ compensation and malpractice insurance, and other expenditures. Remaining revenues are used to meet working capital needs, fund capital improvements, and provide a reserve for unanticipated downturns.
Expenditures of hospital income for current operations are projected to total $6.8 billion during 2012-13. The Teaching
Hospitals chapter of this document discusses problems confronting the medical centers and how those problems have been and will continue to be addressed.
Auxiliary Enterprises
Auxiliary enterprises are non-instructional support services provided primarily to students, faculty, and staff. Programs include student residence and dining services, parking, bookstores, faculty housing, and, on three campuses, a portion of intercollegiate athletics or recreational activities. No State funds are provided for auxiliary enterprises; revenues are derived from fees directly related to the costs of goods and services provided. Expenditures for auxiliary enterprises are estimated to total $950 million in 2012-13.
University Extension, Other Self-supporting Instructional Programs, and Other Campus Fees
In addition to the tuition and fees charged for regular degree programs, the University also generates fee revenue from enrollment in University Extension courses and self-supporting instructional programs, and enrollment of non-UC students in summer instruction. These programs are entirely self-supporting; they receive no State funding and fees are charged to cover the full costs of offering the courses and programs. Programs are dependent upon user demand. Campuses also charge fees for a variety of student-related expenses not supported by mandatory systemwide tuition and fees, such as student
health insurance fees and course materials fees. Income from University Extension, other self-supporting instructional programs, and other campus fees is projected to be $659 million in 2012-13.
Educational and Support Activities
Income from sales and services of educational and support activities is projected to total $2.89 billion in 2012-13. This includes income from the health sciences faculty compensation plans and a number of other sources, such as neuropsychiatric hospitals, the veterinary medical teaching hospital, dental clinics, fine arts productions, museum ticket sales, publication sales, and athletic facilities users. Similar to auxiliary enterprises and teaching hospitals, revenues are generally dedicated to support the activity operations.
GOVERNMENT CONTRACTS, GRANTS, AND AGENCY APPROPRIATIONS
Contract and grant activity generates about $4 billion annually in revenue for the University and plays a key role in the University’s position as a major driver of the California economy. Government sources, including the Department of Energy and other federal agencies, state agencies, and local governments, are significant providers of contract and grant funding. Contract and grant activity that is codified in legislation or based on long-standing agency agreements is permanently budgeted. In addition, non-permanent extramural funds are provided for specified purposes. The majority of this funding supports research or provides student financial aid.
Federal Funds
Federal funds provide support for UC in three primary ways: research contracts and grants, student financial aid, and health care programs.
Federal funds are the University’s single most important source of support for research, generating $2.2 billion and accounting for nearly 50% of all University research expenditures in 2011-12. While UC researchers receive support from virtually all federal agencies, the National Institutes of Health and the National Science Foundation are the two largest sponsors, accounting for over 75% of UC’s federal research contract and grant awards in
Sources of University Funds
16
FEDERAL INDIRECT COST REIMBURSEMENT
All federal contract and grant activity generates costs which are divided into two basic categories — direct and indirect. Direct costs are those expenditures that can be identified as directly benefiting and directly charged to a specific contract or grant. Indirect costs are those expenses which cannot be specifically identified as solely benefiting one particular contract or grant, but instead are incurred for common or joint objectives of several contracts or grants. Because these costs are not charged against a specific contract or grant, indirect costs initially must be financed by University funds, with reimbursement based on rates negotiated for each campus later provided by the federal government.
The University has an agreement with the State regarding the disbursement of federal reimbursement. Pursuant to this agreement, the first 19.9% of the reimbursement accrues directly to the University for costs of contract and grant administration in campus sponsored project offices, academic departments, and research units. This is the source of the University’s Off-the-Top Fund, estimated to be $105 million in 2012-13.
The remaining 80% of the federal reimbursement is split into two funds. The first 55% is budgeted as UC General Funds. It is used, along with State General Funds and student fee revenue, to help fund the University’s basic budget (estimated to be $316 million in 2012-13).
The remaining 45% is the source of the University Opportunity Fund (estimated to be $258 million in 2012-13, which is used to make strategic investments in University and campus priorities, such as to enhance faculty recruitment packages through laboratory alterations, equipment purchases, and support for graduate student researchers; to provide innovative instructional programs; and to augment funding for capital outlay.
In 1990, the State approved legislation (SB 1308, Garamendi) authorizing the use of indirect cost reimbursement for the acquisition, construction, renovation, equipping, and ongoing maintenance of certain research facilities and related infrastructure. Under the provisions of the legislation, the University is authorized to use the reimbursement received as a result of new research conducted in, or as a result of, the new facility to finance and maintain the facility. A total of 23 facilities have been fully financed using this mechanism.
With the implementation of the Funding Streams Initiative in 2011-12, each campus retains all the indirect cost recovery funding generated by research activity at the campus. A discussion of efforts to improve indirect cost recovery is included in the Research chapter of this document.
2011-12. In the past, federal funds for UC research have grown dramatically, though more recently constraints on federal spending have led to more modest growth. UC has benefited significantly in the last several years from temporary federal economic stimulus funding provided to federal agencies that support academic research. Despite much of this funding ending, UC managed to maintain its level of graduate research funding in 2011-12.
Indirect cost recovery funding reimburses the University for costs of facilities and administration associated with research activity, but that cannot be identified as solely benefiting a particular contract or grant. During 2012-13, indirect cost recovery funding from federal contract and grant activity is projected to be about $750 million and is dedicated to support contract and grant administration, core mission activities (in the form of UC General Funds), and special programs. Federal research funds are discussed in more detail in the Research chapter of this document. The University is working to recover more of its indirect costs from research sponsors by increasing its negotiated federal rates and improving waiver management. Increased rates for Berkeley, San Francisco, Santa Barbara and Santa Cruz campuses have the potential to return an additional $70 million in indirect costs to those campuses above current rates. However, this impact will be spread out over the next four years as the new rates are phased in, with the greater share expected in later years.
In addition to research contracts and grants, federal funds entirely support the Lawrence Berkeley National Laboratory, for which UC has management responsibility. This support is projected to be $810 million in 2012-13.
In 2011-12, it is estimated that UC students received nearly $1.7 billion in federal financial aid, including $461.9 million in gift aid and the remainder in the form of loans and work-study. The significance of the federal loan programs for UC students is demonstrated by the fact that these programs comprise over two-thirds of all federally funded aid and 33% of the total financial support received by UC students in 2011-12. Federal aid also assists undergraduate and graduate students through a variety of other programs. Needy students are eligible for federally-funded grant programs such as Pell Grants, and they may seek employment under the Federal Work-Study
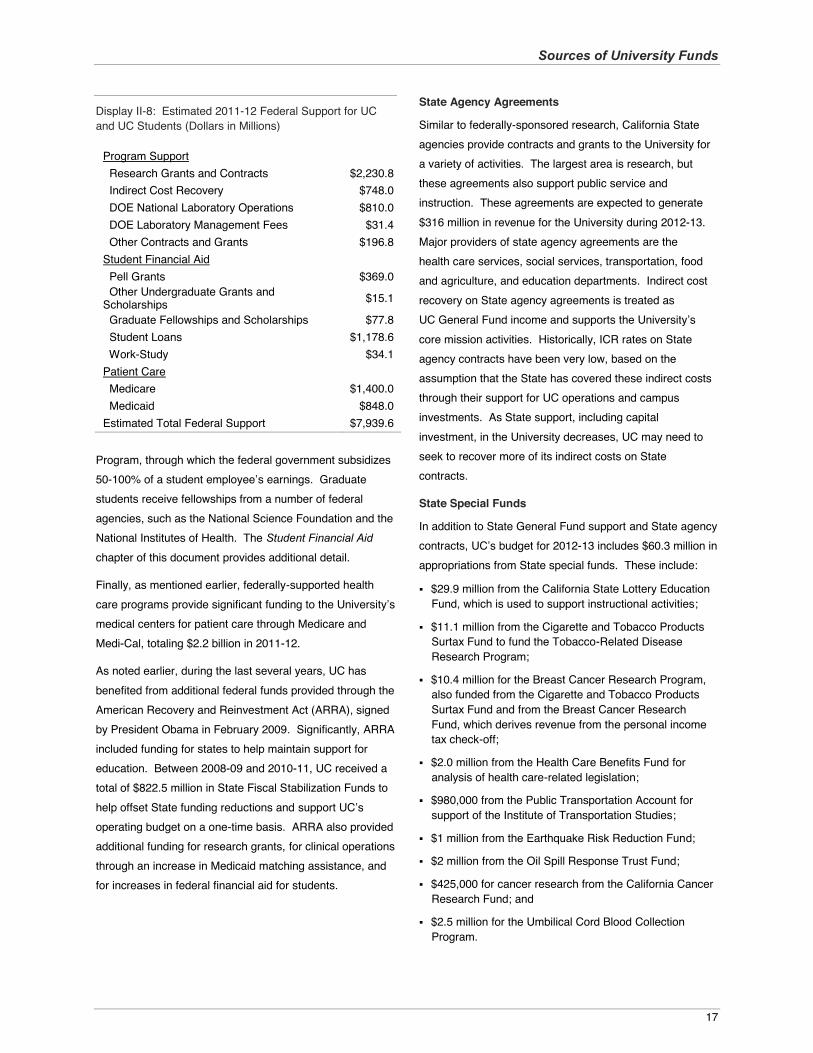
Sources of University Funds
17
Display II-8: Estimated 2011-12 Federal Support for UC and UC Students (Dollars in Millions)
Program Support Research Grants and Contracts $2,230.8 Indirect Cost Recovery $748.0 DOE National Laboratory Operations $810.0 DOE Laboratory Management Fees $31.4 Other Contracts and Grants $196.8 Student Financial Aid Pell Grants $369.0 Other Undergraduate Grants and Scholarships $15.1
Graduate Fellowships and Scholarships $77.8 Student Loans $1,178.6 Work-Study $34.1 Patient Care Medicare $1,400.0 Medicaid $848.0 Estimated Total Federal Support $7,939.6
Program, through which the federal government subsidizes 50-100% of a student employee’s earnings. Graduate students receive fellowships from a number of federal agencies, such as the National Science Foundation and the National Institutes of Health. The Student Financial Aid
chapter of this document provides additional detail.
Finally, as mentioned earlier, federally-supported health care programs provide significant funding to the University’s medical centers for patient care through Medicare and Medi-Cal, totaling $2.2 billion in 2011-12.
As noted earlier, during the last several years, UC has benefited from additional federal funds provided through the American Recovery and Reinvestment Act (ARRA), signed by President Obama in February 2009. Significantly, ARRA included funding for states to help maintain support for education. Between 2008-09 and 2010-11, UC received a total of $822.5 million in State Fiscal Stabilization Funds to help offset State funding reductions and support UC’s operating budget on a one-time basis. ARRA also provided additional funding for research grants, for clinical operations through an increase in Medicaid matching assistance, and for increases in federal financial aid for students.
State Agency Agreements
Similar to federally-sponsored research, California State agencies provide contracts and grants to the University for a variety of activities. The largest area is research, but these agreements also support public service and instruction. These agreements are expected to generate $316 million in revenue for the University during 2012-13. Major providers of state agency agreements are the health care services, social services, transportation, food and agriculture, and education departments. Indirect cost recovery on State agency agreements is treated as UC General Fund income and supports the University’s core mission activities. Historically, ICR rates on State agency contracts have been very low, based on the assumption that the State has covered these indirect costs through their support for UC operations and campus investments. As State support, including capital investment, in the University decreases, UC may need to seek to recover more of its indirect costs on State contracts.
State Special Funds
In addition to State General Fund support and State agency contracts, UC’s budget for 2012-13 includes $60.3 million in appropriations from State special funds. These include:
$29.9 million from the California State Lottery Education Fund, which is used to support instructional activities;
$11.1 million from the Cigarette and Tobacco Products Surtax Fund to fund the Tobacco-Related Disease Research Program;
$10.4 million for the Breast Cancer Research Program, also funded from the Cigarette and Tobacco Products Surtax Fund and from the Breast Cancer Research Fund, which derives revenue from the personal income tax check-off;
$2.0 million from the Health Care Benefits Fund for analysis of health care-related legislation;
$980,000 from the Public Transportation Account for support of the Institute of Transportation Studies;
$1 million from the Earthquake Risk Reduction Fund;
$2 million from the Oil Spill Response Trust Fund;
$425,000 for cancer research from the California Cancer Research Fund; and
$2.5 million for the Umbilical Cord Blood Collection Program.
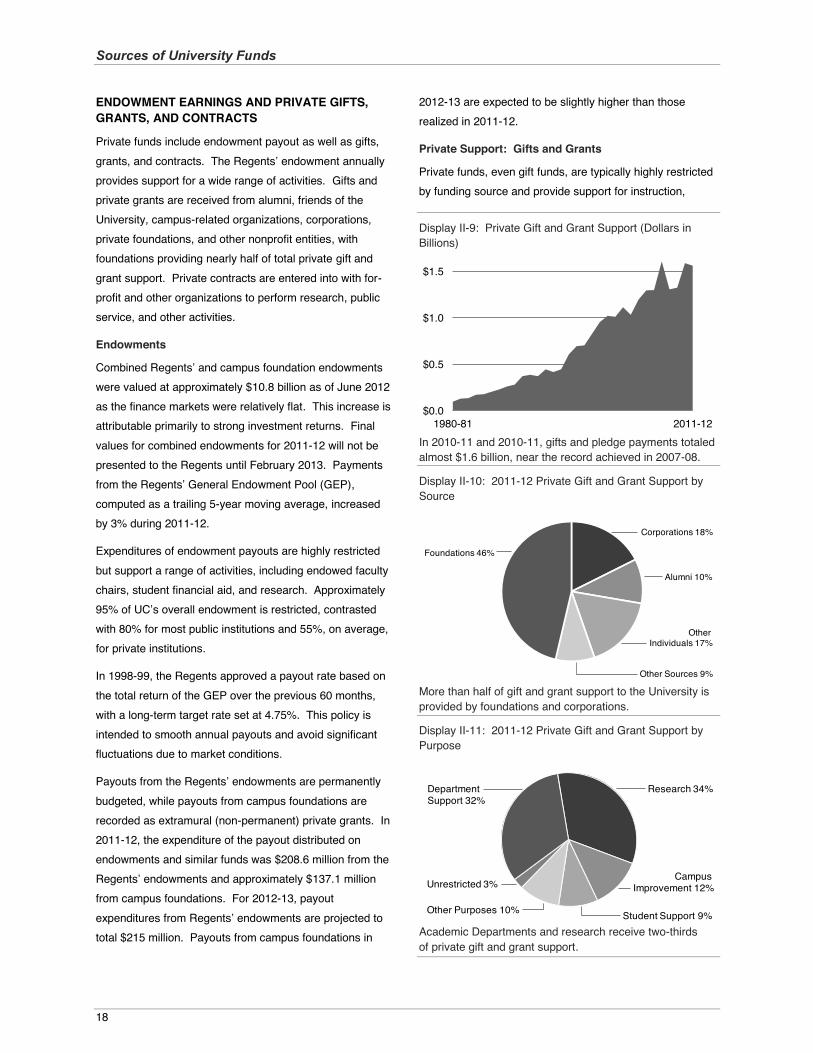
Sources of University Funds
18
ENDOWMENT EARNINGS AND PRIVATE GIFTS, GRANTS, AND CONTRACTS
Private funds include endowment payout as well as gifts, grants, and contracts. The Regents’ endowment annually provides support for a wide range of activities. Gifts and private grants are received from alumni, friends of the University, campus-related organizations, corporations, private foundations, and other nonprofit entities, with foundations providing nearly half of total private gift and grant support. Private contracts are entered into with for-profit and other organizations to perform research, public service, and other activities.
Endowments
Combined Regents’ and campus foundation endowments were valued at approximately $10.8 billion as of June 2012 as the finance markets were relatively flat. This increase is attributable primarily to strong investment returns. Final values for combined endowments for 2011-12 will not be presented to the Regents until February 2013. Payments from the Regents’ General Endowment Pool (GEP), computed as a trailing 5-year moving average, increased by 3% during 2011-12.
Expenditures of endowment payouts are highly restricted but support a range of activities, including endowed faculty chairs, student financial aid, and research. Approximately 95% of UC’s overall endowment is restricted, contrasted with 80% for most public institutions and 55%, on average, for private institutions.
In 1998-99, the Regents approved a payout rate based on the total return of the GEP over the previous 60 months, with a long-term target rate set at 4.75%. This policy is intended to smooth annual payouts and avoid significant fluctuations due to market conditions.
Payouts from the Regents’ endowments are permanently budgeted, while payouts from campus foundations are recorded as extramural (non-permanent) private grants. In 2011-12, the expenditure of the payout distributed on endowments and similar funds was $208.6 million from the Regents’ endowments and approximately $137.1 million from campus foundations. For 2012-13, payout expenditures from Regents’ endowments are projected to total $215 million. Payouts from campus foundations in
2012-13 are expected to be slightly higher than those realized in 2011-12.
Private Support: Gifts and Grants
Private funds, even gift funds, are typically highly restricted by funding source and provide support for instruction,
Display II-9: Private Gift and Grant Support (Dollars in Billions)
In 2010-11 and 2010-11, gifts and pledge payments totaled almost $1.6 billion, near the record achieved in 2007-08.
Display II-10: 2011-12 Private Gift and Grant Support by Source
More than half of gift and grant support to the University is provided by foundations and corporations.
Display II-11: 2011-12 Private Gift and Grant Support by Purpose
Academic Departments and research receive two-thirds of private gift and grant support.
$0.0
$0.5
$1.0
$1.5
1980-81 2011-12
Foundations 46%
Other Individuals 17%
Alumni 10%
Corporations 18%
Other Sources 9%
DepartmentSupport 32%
Student Support 9%
Campus Improvement 12%
Research 34%
Other Purposes 10%
Unrestricted 3%
Sources of University Funds
19
research, campus improvements, and student financial support, among other programs. In recent years, approximately 98% of new gifts received by UC are restricted in their use.
Since 1990, the University has experienced large, steady increases in private gifts received. In 2011-12, new gifts and private grants to the University totaled nearly $1.6 billion, only slightly below 2010-11 and the record total in 2007-08, before the economic downturn. Approximately $335 million of this total was designated for endowments, thus helping to ensure a strong future for UC, but making these funds unavailable for current expenditure. Health science disciplines receive nearly half of all private support. The University’s remarkable achievement in obtaining private funding in recent years — even during state and national economic downturns — is a testament to UC’s distinction as a leader in philanthropy among the nation’s colleges and universities, and the high regard in which its alumni, corporations, foundations, and other supporters hold the University. In 2012-13, expenditures of private gifts and grants to the University are expected to be similar to the expenditures in 2011-12.
The University is aggressively pursuing increased philanthropic giving as a means to help address budget shortfalls and expand student financial aid. Over the last two years, UC has launched two systemwide fundraising initiatives – Project You Can, an effort on all 10 campuses to raise $1 billion for student financial support over a four-year period; and a companion initiative intended to attract funding from California corporate institutions to support financial accessibility for UC students, who are a critical part of California’s future workforce.
Private Contracts
In 2011-12, awards from private contracts totaled $705 million, a 2% increase over 2010-11. Over the last 10 years, awards have more than doubled, making private contracts an increasingly important source of University funding. These contracts, which primarily support research purposes, include clinical drug trials with pharmaceutical and health care organizations, as well as agreements with other agencies, including institutions of higher education.
OTHER FUND SOURCES
DOE National Laboratory Management Fee Revenue
As compensation for its oversight of the DOE National Laboratories at Berkeley, Livermore, and Los Alamos, the University earns management fees which can be used to support other activities. Performance management fees from Lawrence Berkeley National Laboratory (LBNL) are gross earned amounts before the University’s payments of unreimbursed costs. In contrast, net income from the Los Alamos National Security LLC (LANS) and Lawrence Livermore National Security LLC (LLNS) reflects net share of fee income remaining after payment of unreimbursed costs at the two laboratories and shares to other owners. For 2012-13, LBNL is eligible to earn up to $4.5 million in performance fees and UC’s estimated share of income from
LANS and LLNS is $26.9 million.
Management fee revenue related to LBNL is used for costs of oversight, research programs, reserves for future claims, and unallowable costs associated with LBNL. Per Regental approval, revenue from LANS and LLNS will be used to provide supplemental income to select LANS employees, to cover unreimbursed oversight and post-contract costs, and to support a variety of University research programs. Further information about DOE Laboratory Management activity and revenue can be found in the Department of
Energy Laboratory Management chapter of this document.
Contract and Grant Administration
Contract and Grant Administration funds, also referred to as “Off-the-Top” funds, currently represent 19.9% of the total indirect costs recovered under federal awards, net of indirect cost recovery associated with facilities developed using the Garamendi financing mechanism. Pursuant to agreement with the State, funds must be used for costs related to federal contract and grant administration, including federal governmental relations, cost and financial analysis, sponsored projects offices, costs resulting from federal cost disallowances, “and any additional costs directly related to federal contract and grant activity as mutually agreed to by the University and the State.”1
1 Memorandum of Understanding between the University and the State Department of Finance for Disposition of
Sources of University Funds
20
University Opportunity Fund
The University Opportunity Fund, which consists of a share of federal indirect cost recovery funds, is used to fund programs and services that are not adequately supported from State funds. Beginning in 2012-13, with the implementation of the Funding Streams Initiative, as described later in this chapter, each campus retains all federal indirect cost recovery funding generated by research activity at the campus. This approach represents a reinvestment in research and an incentive to further develop UC’s research capacity.
Each campus has discretion as to the use of University Opportunity Funds. Generally, campuses have used Opportunity Funds to enhance faculty recruitment packages through laboratory alterations and support for graduate student researchers, to provide innovative instructional programs, and to augment funding for capital outlay, equipment purchases, and other institutional support.
Intellectual Property Royalty Income
Income derived from royalties, fees, and litigation recovery, less the sum of payments to joint holders, net legal expenses, and direct expenses, is distributed to various stakeholders according to the University Patent Policy and campus policies. Patent income fluctuates significantly from year to year and budget estimates are based upon historical trends. This revenue appears in the University budget in two categories: as a component of UC General Funds and under Other Funds. Income distributions after mandatory payments to joint holders and law firms (for legal expenses) were $164.6 million in 2010-11, the most recent year for which data are available. While 1,873 inventions generated royalty and fee income, the 25 most profitable inventions collectively accounted for more than 85% of total revenues.
Inventor Shares: The University Patent Policy grants inventors the right to receive a percentage of net income accruing to individual inventions. The terms of the inventor share calculations are established in the Patent Policy. In 2010-11, 2,153 inventors received $54.1 million.
General Fund Share: In 2010-11, the portion of net income allocated to the UC General Fund was
Receipts from Overhead on Federal Government Contracts and Grants, 1979.
$27.2 million, equal to 25% of the amount remaining after deducting payments to joint holders, legal expenses, and inventor shares.
Research Allocation Share: For inventions covered by the 1997 Patent Policy, 15% of net income from each invention is designated for research-related purposes at the inventor’s campus or Laboratory. This allocation totaled $4.5 million in 2010-11.
Income after Mandatory Distributions: All income remaining after deductions and other distributions is allocated to the campuses. These funds, totaling $78.8 million in 2010-11, are used by the chancellors to support education and research priorities.
FUNDING STREAMS AND REBENCHING INITIATIVES
Historically, certain revenues have been collected centrally by the UC Office of the President (UCOP) and redistributed across campuses to promote systemwide priorities. These included all State General Funds; Tuition (formerly the Educational Fee); indirect cost recovery of federal, state, and private research contracts and grants; application fee revenue; and a share of patent revenue. The funds were used to the benefit of the campuses, such as to assist campuses with cost increases, enrollment growth, and development of new schools or programs or for central administration and programs. Other funds, such as hospital and auxiliary revenues, Student Services Fees, and campus-based fee funds, have historically been retained by source campuses. Over time, the University’s budget practices and authority have become more decentralized and policies have changed so that more revenue has been retained by or returned to source campuses.
Following lengthy consultation with campus leadership, in 2011-12, the University made comprehensive changes in the way funds flow within the University and in the way central administration and programs are funded.
In order to simplify University financial activity, improve transparency, and incentivize campuses to maximize revenue, beginning in 2011-12, all campus-generated funds – tuition and fees, research indirect cost recovery, patent and investment income – is retained by or returned to the source campus.
In order to support central operations, the University has established a broad-based flat assessment on campus
Sources of University Funds
21
funds. Central operations are being defined as UCOP administration, UCOP-provided central services, (both administrative and academic), and systemwide initiatives, such as multi-campus research programs and initiatives and Cooperative Extension.
As an exception to the overarching principle that source campuses will retain all funds generated by the campus, redistribution of some funds across campuses will continue as a means to support the systemwide goals of the Education Financing Model (EFM) for undergraduate student financial aid. A key goal of the EFM is to equalize the expected student contribution level from employment and/or loans across the system, such that each individual undergraduate student would face the same net costs regardless of which campus the student chooses to attend. The EFM is described in more detail in the Student
Financial Aid chapter of this document.
The Funding Streams Initiative addressed the distribution of all revenues except State General Funds. With regard to
the allocation of State General Funds, in November 2010 the UC Commission on the Future recommended that the University examine the rationale for distributing State General Funds and design a proposal for “an equitable and
transparent readjustment of base funding formulas.” The Commission’s recommendation coincided with concerns
raised by others that the existing distribution model was too complex and opaque. These issues were addressed by the Rebenching Budget Committee, appointed by former Provost Pitts and Executive Vice President Brostrom. The Committee held its first meeting in April 2011 and completed its deliberations with a set of recommendations for rebenching State General Funds in March 2012. Among the Committee’s recommendations were the proposals that State General Funds be distributed on a weighted per-student enrollment and that the rebenching be implemented over a six year period. 2012-13 is the first year that State General Funds are being allocated based on the principles of rebenching.
“Innovation isn’t restricted to UC’s labs and classrooms—the University is dedicated to working more effectively in every corner.”
Mark G. Yudof University of California
President
22
Cross-Cutting IssuesSeveral of the University’s significant budget issues do not
fall into a single functional area but instead cut across
multiple areas. This chapter provides detailed information
about several of these cross-cutting issues for 2013-14:
systemwide and campus actions to address budget
shortfalls, the Working Smarter initiative, post-employment
benefits reform, the multi-year agreement with the State,
diversity, and core academic support.
SYSTEMWIDE AND CAMPUS ACTIONS TO ADDRESS THE FUNDING SHORTFALL
The continuing fiscal crisis facing the State, and indeed the
nation and the world, has presented the University with the
significant challenge of achieving major reductions to
budgets in a very short period of time. The 2012-13 State-
funded budget is nearly $900 million less than support
provided in 2007-08, representing a 27% reduction in State
support. While UC was grateful for a partial restoration in
2010-11, those gains were more than erased with
unprecedented cuts in 2011-12. The outlook for the next
several years is highly uncertain, ranging from an optimistic
scenario (if the Governor’s revenue-raising initiative passes
in November) of moderate yet still constrained budgets for
the next several years, to a worst-case scenario (if the
initiative fails) of further budget cuts and the potential for
new State funds is highly constrained. Furthermore, the
long-term decline in State support, combined with
substantial mandatory cost increases, including costs of
retirement benefits, is forcing the University to reexamine
all aspects of its operations and develop new strategies. It
is in this context that efforts are being made centrally as
well as at the campus level to reduce costs, both over the
short term and the long term.
Systemwide Actions Were Used to Address Shortfalls Early in the Crisis
While most of the response to budget gaps now falls to the campuses, in the early part of this current budget crisis, many of the actions taken to address cuts occurred at the systemwide level. Examples of systemwide actions taken during 2008-09 are below:
Enrollment: Campuses were asked to reduce enrollment of California resident freshmen by 3,800 students between 2008-09 and 2010-11. This curtailment was partially offset by a goal of increasing transfers from the community colleges by 1,000 students. Salary Reduction/Furlough Plan: In July 2009, the Regents approved a one-year salary reduction/furlough plan that provided $136 million in one-time General Fund savings and nearly $236 million in savings from all fund sources. This plan ended for most employees on August 31, 2010, although some represented employee groups remained on furlough several months later due to delayed starts. A Furlough Exchange Program for faculty generated an additional $21 million in General Fund savings.Merit Increases: Due to budget constraints, UC did not provide regular merit increases or range adjustments to a significant portion of its staff for three years.Debt Restructuring: UC took steps to delay debt service payments on capital projects during 2009-10 and 2010-11. The Regents authorized campuses to restructure $75 million in debt in each year for temporary relief to campuses. Further opportunities for reduction or consolidation of debt service are under review.Senior Management Group Compensation Actions: The furlough program for the President and other senior members of the Office of the President and campus leadership imposed pay reductions of 9% to 10% in most cases during 2009-10. In addition, systemwide salary freezes for Senior Management Group members were imposed for this same period. Further, while most nonrepresented staff received a 3% merit increase for 2011-12, Senior Management Group members and other staff earning more than $200,000 per year were ineligible for this salary increase.UCOP Restructuring and Downsizing: During 2007-08and 2008-09, the Office of the President (UCOP) underwent a thorough restructuring. Since that time, budget reductions have necessitated additional reviews of UCOP operations. Actions to date have resulted in areduction of 629 FTE (net of program transfers), a 25% decrease over a four-year period (from 2,069 to 1,440).Savings achieved over that time total $95 million in unrestricted fund sources. In addition, increased transparency and an improved budget system have made the Office of the President budget more understandable and accessible.
Cross-Cutting Issues
23
Campus Actions
The 2012-13 academic year marks the fifth year in which
UC campuses have been implementing measures to
reduce expenditures, avoid costs, and introduce efficiencies
at the local level to address significant budget gaps. Of the
total budget gap, only a little more than one-third has been
addressed through tuition increases. The remainder has,
for the most part, been borne by the campuses. Campus
actions to cut expenditures often take several years to be
fully implemented. While each campus is distinct in its
character as well as its fiscal situation, several common
themes have emerged.
Every campus is firmly committed to protecting quality, access, and, as much as possible, academic and student service programs.
Each campus is setting priorities that over the next several years will advance those initiatives that continue to be important to the development of the institution while eliminating or curtailing programs that no longer serve the identified priorities of the campus.
While campuses plan for permanent cuts that are likely to be implemented over the next several years uponcompletion of their highly deliberative review processes,they have taken temporary measures in the early part of the fiscal crisis through the use of one-time funds, vacancy control measures, and other steps.
While using different approaches, campuses have embraced a process for identifying and eliminating redundancy and for avoiding across-the-board reductions.
All campuses are approaching the issues with thorough consultation and deliberation.
The following provides a summary of the actions campuses
have taken to address budget shortfalls. It is not an
exhaustive list, but rather reflects the wide variety of actions
each campus is adopting.
Program Elimination/Consolidation – Over 180 programs
have been eliminated or consolidated with other
programs for an estimated savings of over $116 million.
Budget Cuts – Academic and administrative units were
assigned cuts ranging in general from 0% to 35%,
determined through a series of consultative processes on
each of the campuses. All campuses report significantly
higher cuts to administrative services as compared to
instructional programs. However, all campuses report a
growing concern over the impact that significant cuts
have had on administrative functions, given the
increased exposure to risk from regulatory
noncompliance and other activities that are not receiving
appropriate oversight.
Layoffs/Positions Eliminated – More than 4,200 staff
have been laid off and more than 9,500 positions have
been eliminated or unfilled since the fiscal crisis began,
while workload has continued to increase due to higher
levels of student enrollment, added regulations/oversight,
and other issues.
Enrollment – In 2012-13, the University of California
enrolls approximately 11,500 California residents for
whom the State never provided workload funding. When
recent budget cuts are taken into account, the University
estimates it enrolls more than 25,000 unfunded California
residents. No campuses plan to embark on major efforts
to decrease enrollment of funded California students. A
better match between resources and enrollment levels is
occurring naturally as larger classes from earlier years
graduate and make room for smaller classes being
enrolled now. Eventually, total enrollment will approach
funded levels.
Shared Service Centers – All campuses report moving
aggressively toward implementing shared service
centers where clusters of programs share human
resource and informational technology services. Many
such centers have been created and many more are
planned.
Faculty Recruitment – All campuses have curtailed the
number of faculty recruitments, in many cases by 50% or
more. Unfortunately, the University lost over 200 faculty
more than it hired last year, resulting in a diminishment in
the overall size of the faculty at the same time that
several campuses have continued to enroll growing
numbers of students. Deferred hiring cannot be
sustained indefinitely and campuses must begin to fill
many of the positions that have been left vacant.
Program Assessments – All campuses impose some
level of assessment upon auxiliaries to help defray the
cost of campus infrastructure. Many campuses are
reviewing this assessment and most are considering
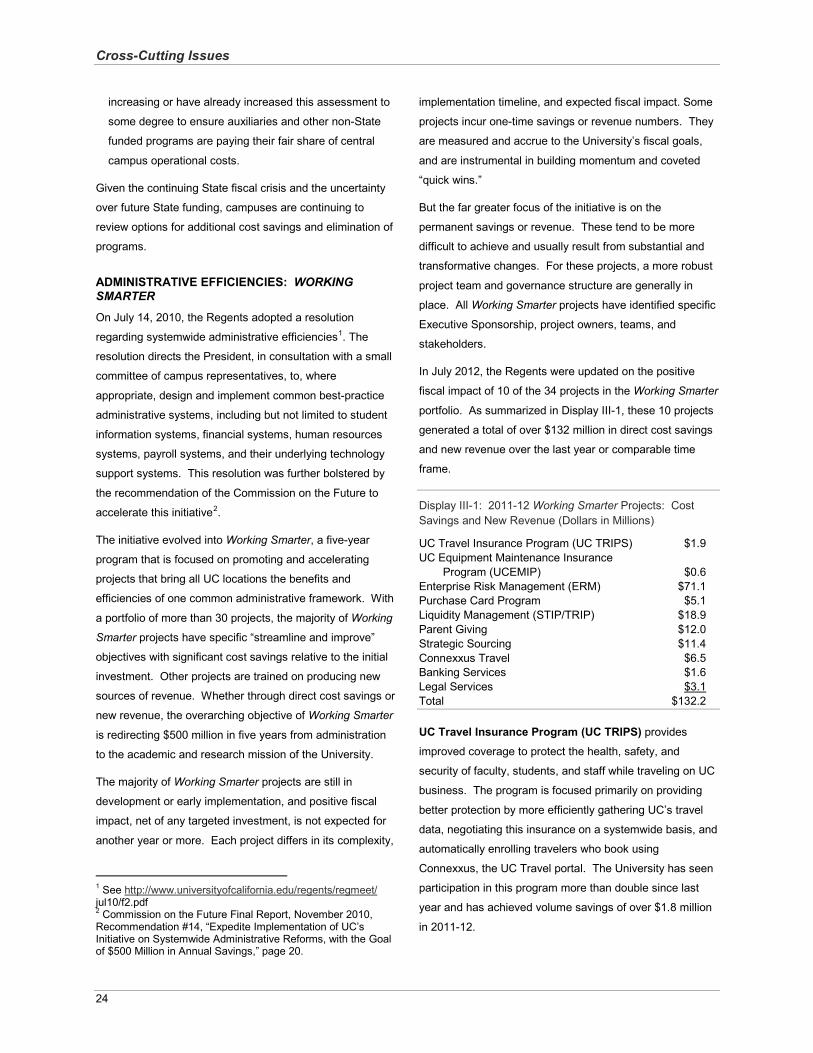
Cross-Cutting Issues
24
increasing or have already increased this assessment to
some degree to ensure auxiliaries and other non-State
funded programs are paying their fair share of central
campus operational costs.
Given the continuing State fiscal crisis and the uncertainty
over future State funding, campuses are continuing to
review options for additional cost savings and elimination of
programs.
ADMINISTRATIVE EFFICIENCIES: WORKING SMARTER
On July 14, 2010, the Regents adopted a resolution
regarding systemwide administrative efficiencies1. The
resolution directs the President, in consultation with a small
committee of campus representatives, to, where
appropriate, design and implement common best-practice
administrative systems, including but not limited to student
information systems, financial systems, human resources
systems, payroll systems, and their underlying technology
support systems. This resolution was further bolstered by
the recommendation of the Commission on the Future to
accelerate this initiative2.
The initiative evolved into Working Smarter, a five-year
program that is focused on promoting and accelerating
projects that bring all UC locations the benefits and
efficiencies of one common administrative framework. With
a portfolio of more than 30 projects, the majority of Working
Smarter projects have specific “streamline and improve”
objectives with significant cost savings relative to the initial
investment. Other projects are trained on producing new
sources of revenue. Whether through direct cost savings or
new revenue, the overarching objective of Working Smarter
is redirecting $500 million in five years from administration
to the academic and research mission of the University.
The majority of Working Smarter projects are still in
development or early implementation, and positive fiscal
impact, net of any targeted investment, is not expected for
another year or more. Each project differs in its complexity,
1 See http://www.universityofcalifornia.edu/regents/regmeet/jul10/f2.pdf2 Commission on the Future Final Report, November 2010, Recommendation #14, “Expedite Implementation of UC’sInitiative on Systemwide Administrative Reforms, with the Goal of $500 Million in Annual Savings,” page 20.
implementation timeline, and expected fiscal impact. Some
projects incur one-time savings or revenue numbers. They
are measured and accrue to the University’s fiscal goals,
and are instrumental in building momentum and coveted
“quick wins.”
But the far greater focus of the initiative is on the
permanent savings or revenue. These tend to be more
difficult to achieve and usually result from substantial and
transformative changes. For these projects, a more robust
project team and governance structure are generally in
place. All Working Smarter projects have identified specific
Executive Sponsorship, project owners, teams, and
stakeholders.
In July 2012, the Regents were updated on the positive
fiscal impact of 10 of the 34 projects in the Working Smarter
portfolio. As summarized in Display III-1, these 10 projects
generated a total of over $132 million in direct cost savings
and new revenue over the last year or comparable time
frame.
Display III-1: 2011-12 Working Smarter Projects: Cost Savings and New Revenue (Dollars in Millions)
UC Travel Insurance Program (UC TRIPS) $1.9UC Equipment Maintenance Insurance
Program (UCEMIP) $0.6Enterprise Risk Management (ERM) $71.1Purchase Card Program $5.1Liquidity Management (STIP/TRIP) $18.9Parent Giving $12.0Strategic Sourcing $11.4Connexxus Travel $6.5Banking Services $1.6Legal Services $3.1Total $132.2
UC Travel Insurance Program (UC TRIPS) provides
improved coverage to protect the health, safety, and
security of faculty, students, and staff while traveling on UC
business. The program is focused primarily on providing
better protection by more efficiently gathering UC’s travel
data, negotiating this insurance on a systemwide basis, and
automatically enrolling travelers who book using
Connexxus, the UC Travel portal. The University has seen
participation in this program more than double since last
year and has achieved volume savings of over $1.8 million
in 2011-12.
Cross-Cutting Issues
25
UC Equipment Maintenance Insurance Program (UCEMIP) is focused on a standardized, proactive
approach to the maintenance of the University’s equipment
and technology hardware. The program strives to replace
prior spending on emergency repair service and certain
original equipment manufacturer (OEM) maintenance
contracts which are statistically unlikely to be used.
Instead, a central equipment maintenance insurance policy
is priced to cover wide ranges of medical, engineering,
facilities, and IT equipment at any UC location; the policy
includes preventive maintenance for all covered physical
units as well as any needed repairs or replacement by
OEM-authorized service providers. Over the past year,
participating UC locations saw direct savings of over
$500,000.
As a strategic approach to managing enterprise-wide risk,
the Enterprise Risk Management (ERM) program reduced
the University’s overall cost of risk by over $71 million in
fiscal year 2011-12. These savings are based on the
University’s overall cost of risk associated with both hazard
risks (such as workers’ compensation, general liability,
employment practices liability, professional liability, auto
liability, and property) and other strategic, operational,
financial, and reputational risks. These savings represent
the reduction in combined premium costs in 2011-12 over
the average costs of a previous three-year period (2007-08
through 2009-10, consistent, rolling forward by one year,
with the approach noted in the July 13, 2011 Working
Smarter report).
The Purchase Card Program generated over $5 million in
incentive payments and signing bonuses for the campuses
in calendar year 2011. The program provided additional
benefits to the UC-operated national laboratories not
captured by the Working Smarter report. The Purchase
Card Program at UC changed significantly in 2005, when a
universitywide contract was awarded to a single vendor
following a public bid process. Since then, University
personnel at each location have been focused on
optimizing UC’s local use of the program to save time (i.e.,
compared to paper check based payments and other
methods) and maximize overall return while closely minding
potential risk.
Liquidity Management. By optimizing the allocation of
campus working capital between the University’s Short-
Term Investment Pool (STIP) and the longer-term Total
Return Investment Pool (TRIP), the University has
generated $18 million in additional investment income
during 2011-12. About $1.7 billion has been moved from
STIP to TRIP since October 2010, bringing the total
working capital portfolio to 70% STIP/30% TRIP.
Several years ago, Parent Giving was identified as having
high potential for revenue increases because of UC’s
relatively lower parental giving rates compared to parents at
other institutions. The Office of the President, working with
counterparts at each of the nine undergraduate campuses,
implemented what is now called the Parent Giving and
Supplemental Development Fund. Gifts from parents tend
to be more unrestricted or flexible than gifts from other
donor groups. When parent gifts are targeted, donors may
more directly influence the student experience. Perhaps
even more important than total dollars raised, this targeted
effort dramatically improved the participation rates of
parents and families. In the first year of the program,
systemwide parent giving rose to $10.7 million from
$3.6 million the previous year. This increase occurred
across all undergraduate campuses; Berkeley, Davis, and
Santa Barbara had especially significant gains. Parent
giving topped $12 million in 2011-12.
Strategic Sourcing is a universitywide program
coordinated at the Office of the President by Procurement
Services staff who negotiate vendor contracts to leverage
UC’s substantial combined buying power. Procurement
Services is currently designing and soon will begin
implementing a comprehensive data analysis and reporting
capability to better track and strategically plan for UC’s
“sourceable spend” across all locations (a Working Smarter
project in itself). Until this system is fully implemented,
anticipated in 2014, Working Smarter is reporting only the
total payments of contracted vendors under negotiated
patronage incentive agreements. In many vendor purchase
contracts, to encourage local contract compliance and aid
in supporting complementary programs such as
eProcurement use, the University receives quarterly cash
rebates of usually 2% of net purchases made under the
agreement. These payments are monitored centrally but
Cross-Cutting Issues
26
made directly to the local campus; in 2011-12, participating
UC locations received a combined total of over $11 million
back from purchases made through over 160 universitywide
managed contracts.
Connexxus Travel is a centrally managed travel program
offering reservation options and systemwide supplier
discounts. The central office at the Office of the President
also uses a complete data repository of all Connexxus-
booked travel to inform its regular direct negotiations with
UC’s top-used travel industry suppliers. Connexxus
adoption across all UC locations is uneven, ranging from
capturing only 6% of campus travel bookings to as much as
80% at another location in 2011. Across all UC locations,
overall usage is up 10% from the prior year to over 35%. In
2011, the Connexxus program delivered over $6 million in
direct negotiated savings and online booking discounts to
UC travel budgets. The Central Travel Management Office
at the Office of the President is keenly focused on
perceived and real barriers – many of which are location-
specific – to further increase use of Connexxus at all
locations in 2012 and beyond.
Banking Services is a project which targets UC’s
expenses and fees for depository, disbursement, payroll,
and merchant card accounts and related transaction
activities. The Banking and Treasury Services group within
the CFO Division at the Office of the President manages
these services and coordinates activities with all UC
locations. As part of the Working Smarter initiative,
Banking and Treasury services began a thorough re-
examination of its costs to find savings while maintaining or
improving world class control and functionality. Two
specific efforts returned direct cost savings to UC this past
year – the renegotiation of UC’s merchant credit card
account per-transaction interchange fee, and the
implementation of a more modern and secure Treasury
workstation, a software interface allowing cash
management across depository and disbursement
accounts. Together, these efforts netted over $1.6 million
in year-over-year savings.
In January 2010, the Office of General Counsel (OGC)
began implementing a new approach to reducing expenses
for UC’s Legal Services without increasing risk to the
University. The effort has two objectives, both very
targeted in their implementation: “in-sourcing” and
“preferred provider panels.” By in-sourcing, OGC is staffing
attorneys in-house where that work can replace what was
previously spent on outside counsel. Preferred Provider
Panels aim to negotiate lower billing rates based on higher
volumes and more predictable usage in selected areas of
legal practice. At the same time these programs have
rolled out, OGC increased its own analytics capability both
with in-house staff time reporting and outside counsel
billable data. This capability has documented a year-over-
year savings of over $3 million in Legal Services costs (net
of in-house new hires), and the data should inform future
decisions on in-sourcing and additional preferred provider
panels, or suggest other new areas of focus.
It is important to note that in both of the first two years of
Working Smarter, the progress has included monies that
accrue to core and non-core (such as auxiliaries and other
self-supporting functions within the University) operations.
The core budget savings will most directly help the
University through the current fiscal crisis by freeing up
funds that were previously used for other purposes,
avoiding costs, or generating revenue. It is estimated that
about two-thirds of the positive fiscal impact from Working
Smarter projects will accrue ultimately to core operations.
In evaluating projects as candidates for inclusion in the
portfolio, an assessment is made of expected fiscal impact
or process efficiency. Fiscal impact is reportable within the
portfolio only after savings or revenue eclipse any up-front
investment (such as in implementation services or new
technologies). Across all projects, only direct cost savings
and realized revenue are measured and reported as
positive fiscal impact under Working Smarter. In addition,
some projects incur permanent savings, usually resulting
from substantial and transformative changes; others are
more opportunistic. The latter, usually one-time events, are
measured and accrue to the University’s fiscal goals, but
the far greater focus of the initiative is on the permanent
savings or revenue, and those projects that reinforce a
focus on process efficiency.
This progress is encouraging: in two years, the University
has achieved over $289 million of its goal of achieving
$500 million in positive fiscal impact over five years through
the Working Smarter initiative. Maintaining the momentum
Cross-Cutting Issues
27
of the program will rest with both the continued progress of
more mature projects and the identification of new
strategies to deliver future and sustained impact.
POST-EMPLOYMENT BENEFITS REFORM
Both the unfunded liability for retirement benefits accrued to
date by UC employees and retirees and the cost of benefits
accrued by current employees going forward will place a
significant strain on the University’s budget in the future.
Sustaining these benefits has become increasingly difficult.
To help the University develop a comprehensive long-term
approach to post-employment benefits, both pension and
retiree health, at the request of the Regents, President
Yudof established a task force in 2009 to study and
recommend funding, policy, and benefits design
alternatives. The task force consisted of senior leadership,
faculty and staff representatives, and UC retirees, and
considered issues of market competitiveness, workforce
behavior and development, affordability, and sustainability.
The final report of the task force was submitted to the
President in August 2010. Based on the recommendations
of the task force, in December 2010, the Regents approved
changes to provisions for both pension and retiree health
benefits that will reduce long-term costs. Additional
information about post-employment benefits is available in
the Compensation, Employee and Retiree Benefits, and
Non-Salary Price Increase chapter of this document.
THE MULTI-YEAR AGREEMENT WITH THE STATE
Senior representatives of the Governor’s administration
have stated their intention to conclude a multi-year funding
agreement with UC and the California State University.
The agreement would provide steady increases of 6% per
year to the University’s base budget for four years,
beginning in 2013-14 through 2016-17. This, along with
moderate tuition and fee increases, will provide UC with a
solid foundation to help meet its minimum obligations with
respect to UC Retirement Plan employer contributions,
compensation agreements, health benefit costs, non-salary
price increases, and other heretofore unfunded cost
increases.
This framework, if supported by the Legislature, holds the
promise of financial stability and secures the University’s
ability to plan for the future, in stark contrast to recent
years, which have been characterized by year-by-year
reactions to one major budget cut following another. The
agreement would continue the tradition of earlier
agreements of specifying minimum funding levels critical to
ensuring the support of programs that are fundamental to
the character of this great public research university. More
importantly, it is an acknowledgement by the State of
California that it will again become a reliable partner with
the University of California.
However, stable and consistent State funding for UC
cannot be achieved without a stable fiscal situation for the
State. The Governor has indicated that a multi-year
funding framework is contingent on passage of his
November ballot initiative.
The importance of regaining stability and providing
campuses with an ability to plan cannot be overstated.
After years of extreme volatility, with proposals to cut UC’s
budget changing two and three times during a budget year,
campuses and UC’s students are eager for predictability
and reasonable budget outcomes. The Governor’s revenue
initiative on the November ballot holds the highest promise
in four years for achieving this goal. For this reason, the
Regents adopted a resolution to endorse the initiative.
DIVERSITY
UC is dedicated to achieving excellence through diversity in
the classroom, research laboratory, and the workplace. It
strives to establish a climate that welcomes, celebrates,
and promotes respect for the contributions of all students
and employees.
In 2007, the Regents adopted as policy the UC Diversity
Statement defining diversity as the “variety of personal
experiences, values, and worldviews that arise from
differences of culture and circumstance. Such differences
include race, ethnicity, gender, age, religion, language,
abilities/disabilities, sexual orientation, gender identity,
socioeconomic status, geographic region, and more.”3
The value of diversity in all aspects of UC’s educational
programs is fundamental to its mission as a land grant
institution.
3 www.universityofcalifornia.edu/diversity/documents/ diversityreport0907.pdf.
Cross-Cutting Issues
28
The unique environment created by UC’s system of 10
top-tier public research universities contributes to the
overall quality of a UC education. An important aspect of
this environment is the ability to take advantage of the
social, cultural, and intellectual contributions enabled by
having a diverse population of students, faculty, and staff
from a variety of underrepresented populations. A diverse
University community enhances the quality of education by
infusing perspectives and experiences from people of all
walks of life in California and beyond, enriching and
contributing to the educational environment.
While there are many pockets of success and innovation,
the University is committed to focusing greater
and sustained attention on its diversity efforts. To monitor
these efforts, the Regents requested an annual
accountability report on diversity at UC. The third
Accountability Sub-Report on Diversity at the University of
California4 was presented to the Regents in January 2012.
The report identifies three specific areas the University will
monitor over the coming years: faculty diversity, graduate
professional student diversity, and campus climate. Future
Sub-Reports will focus on these as special topics beginning
with faculty diversity in January 2013.
In recognition of the importance of gauging campus climate
to create more inclusive and welcoming environments, in
2010, UC President Yudof formed an Advisory Council on
Campus Climate, Culture, and Inclusion charged with
monitoring campus progress and metrics and examining
campus practice and policy. Each of the chancellors
created similar councils on the 10 campuses and, in May
2010, the Regents created the Ad Hoc Committee on
Campus Climate. In September 2010, UC launched an
online campus climate incident reporting system.
In June 2011, President Yudof announced that UC will
undergo a campus climate study in order to gather a variety
of data and assess the quality of life at UC for students,
faculty, and staff. The University is dedicated to fostering a
caring university community that provides leadership for
constructive participation in a diverse, multicultural world.
UC is determined to create a welcoming environment for
4http://accountability.universityofcalifornia.edu/documents/ accountabilityreport12.pdf.
everyone, improve the environment for working and
learning on campus, and help to nurture a culture of
inclusiveness and respect throughout every campus and
location in our system. This major initiative will provide
much-needed data and accountability measures. The
study will include all populations – students, faculty, and
staff – at the campuses, medical centers, the Office of the
President, the Division of Agriculture and Natural
Resources, and the Lawrence Berkeley National
Laboratory. In doing so, UC is taking a leading role in
proactively creating more welcoming and inclusive campus
environments. UC is the first higher education institution of
its size to commit to such a project. Study findings will be
available in Spring 2013.
Diversity Within the University Community
UC often describes its diversity aspirations in terms of
“reflecting the diversity of California.” Both the University
and the state are much more diverse than the nation as a
whole. However, while the University community has
become increasingly diverse, it has not kept pace with
demographic changes in California, especially the rapid
growth of the Hispanic population. In Fall 2011, the
University community of approximately 365,000 students,
faculty, and staff was 16.1% Chicano/Latino compared to
about 38% for California as a whole. African-Americans
represented 4.7% of the University community compared to
6% for California as a whole.
Racial and ethnic diversity at the University changes slowly
over time as populations turn over. At the undergraduate
level, students turn over every four to five years, providing
an opportunity for the University to become more
responsive to demographic shifts in the graduating high
school population. Conversely, faculty careers can last
30-40 years, requiring a longer trajectory for these
population shifts. Since new faculty hires are more diverse
than the faculty as a whole, slowing of faculty hiring in
response to budget cuts could result in delays in
diversifying the faculty. Over the last 15 years, proportions
of underrepresented minorities (Chicano/Latino, African-
American, or American Indian) have increased among
undergraduates by 27.4% compared to an increase of only
18.6% among ladder rank faculty. In Fall 2011, 23.7% of
UC’s almost 182,000 undergraduates were
Cross-Cutting Issues
29
underrepresented minorities, compared to only 18.6% of
133,000 undergraduates in Fall 1996. In Fall 2011, 8.3% of
all 9,800 ladder rank faculty were underrepresented
minorities, compared to just 7% of all 8,000 ladder rank
faculty in Fall 1996.
Staff Diversity. The most diversity is seen among the
Professional and Support Staff, and the least among the
Senior Management Group. Despite some progress over
the years, in 2011 the Senior Management Group
(consisting of just under 200 employees) was 79% white
and 63% male. Among the over 90,000 Professional and
Support Staff, roughly two-thirds are women across all
racial and ethnic groups. In Fall 2011, 27% of all 100,000
staff were underrepresented minorities and half were racial
and ethnic minorities (including Asian Americans), up from
25.4% underrepresented minorities and 42% racial and
ethnic minorities in Fall 1996 (72,500 total non-academic
staff population in Fall 1996). The largest increase was
among Asian Americans who comprised 16.7% of all staff
in Fall 1996 compared to 23% in Fall 2011, followed by
Chicano/Latino staff (13.5% in Fall 1996 compared to 18%
in Fall 2011).
Faculty Diversity. The ladder rank faculty at the University
of California is more diverse than the faculty at American
Association of Universities (AAU) public and private
institutions. Of all faculty and academics (34,000 in Fall
2011 and 24,000 in Fall 1996), 7% were underrepresented
racial and ethnic minorities in Fall 2011 compared to 6.7%
in Fall 1996. African-American faculty and academics
experienced a decrease in representation between Fall
1996 and Fall 2011 (2.3% versus 2%), and Chicano/Latinos
experienced a slight increase (4.7% versus 4.1%). Asian
American faculty and academics showed the largest
increase between Fall 1996 (11.8%) and Fall 2011 (15.1%).
Despite some gains overall, UC’s 9,800 ladder- and
equivalent-rank faculty is still over 73% white and over 70%
male. At the assistant professor level, UC hiring
of underrepresented faculty in life sciences, arts and
humanities, social sciences, and education exceeds
national availability but is below estimated national
availability in engineering and physical sciences.
Graduate Academic Students. UC’s graduate academic
programs lack racial and ethnic diversity. Just over 10% of
all 31,000 graduate academic students were
underrepresented minorities in 2011. An additional 26%
were Asian American, and 10% international. This number
has not changed as a proportion of all graduate academic
students since Fall 1996 (when about 10% of the total
35,000 graduate academic students were
underrepresented minorities). However, within each racial
and ethnic category, women are well represented. Among
African-American students, more women are enrolled than
men (59% versus 41%); but the reverse is true for whites,
among whom only 45% of enrolled students are women. In
all, men represent over 53% of all UC graduate academic
students, and across all racial and ethnic groups, men
receive more Ph.D.s in the physical sciences, mathematics,
and engineering.
Graduate Professional Students. Underrepresented
students are a very small percentage (13%) of the 18,400
total professional degree students and over 23% are
international. Over the last 15 years, underrepresented
minorities in UC professional programs has decreased by
over 27% (18.4%, or 1,300 students, in Fall 1996 compared
to 13%, or 2,400 students, in Fall 2011). Across all racial
and ethnic groups, men receive the greatest percentage of
professional degrees in business. For women, the greatest
percentage of professional degrees awarded is in “other
health” fields (dentistry, nursing, optometry, pharmacy,
public health, and veterinary medicine) with the exception
of Chicana/Latina women, who receive the highest
percentage of their degrees in education.
Undergraduates. At UC, undergraduate students have the
highest proportion of underrepresented minorities. In 2011,
24% of UC’s 182,000 undergraduate students were
underrepresented minorities, and over 38% were Asian
American. Since the 1980s, UC has enrolled greater
numbers of underrepresented minorities, as discussed in
the General Campus Instruction chapter of this document.
In Fall 1996, underrepresented minorities comprised 18.6%
of all 133,000 undergraduates compared to 23.7% of
182,000 in Fall 2011. Most notably, among new freshmen,
underrepresented minorities have increased nearly 50%
over the last 5 years, from 18.3% (5,750 of all 31,500 new
freshmen) in Fall 2005 to 27.4% (nearly 10,000 of all
36,300) in Fall 2011. Additionally, underrepresented
Cross-Cutting Issues
30
minorities among transfer students have increased nearly
23%, from 18% (2,400 of 13,000 transfer students) in
Fall 2005 versus 23% in Fall 2011 (3,800 of 17,000 transfer
students).
CORE ACADEMIC SUPPORT
Several areas of the budget are critical to academic quality,
but have been historically underfunded. Collectively
referred to as core academic support, these areas require
ongoing support and new investments to ensure that the
University is able to recruit and retain the best faculty and
students. Core academic support includes:
instructional technology to enhance and enrich students’learning experiences and prepare them for employment in a global knowledge economy;
instructional equipment replacement, providing up-to-date computing, laboratory, and classroom materials for teaching and research;
library resources to build and make available print and digital collections and to continue strategic investments in advanced, cost-effective reference and circulation services; and
ongoing building maintenance to support the janitorial, groundskeeping, and utility costs associated with maintaining facilities.
The Partnership Agreement with former Governor Davis
recognized the shortfall in these areas and planned a 1%
adjustment to the base each year to help address the gap.
Funds were provided for this purpose for two years. Once
the State’s fiscal crisis began during the early 2000s,
however, not only were increases discontinued, but
program cuts erased the progress that had been made
from earlier funding increases. The shortage in these areas
was estimated in 2007-08 to be over $100 million.
The Compact Agreement with Governor Schwarzenegger
again recognized the critical nature of the shortfall in these
budget areas and proposed a 1% annual adjustment in the
base budget beginning in 2008-09 to help address the
shortfall. The additional 1% base budget adjustment was
first funded in the Governor’s 2008-09 budget proposal
before applying a 10% budget-balancing reduction.
Similarly, between 2009-10 and 2011-12, no new funding
was provided for this purpose and in fact deep base budget
cuts were initiated, further exacerbating the chronic funding
shortfalls in these areas. The 2013-14 budget plan
includes $35 million in funding for the first year of a multi-
year reinvestment in these areas of the budget which are
so critical to academic quality.
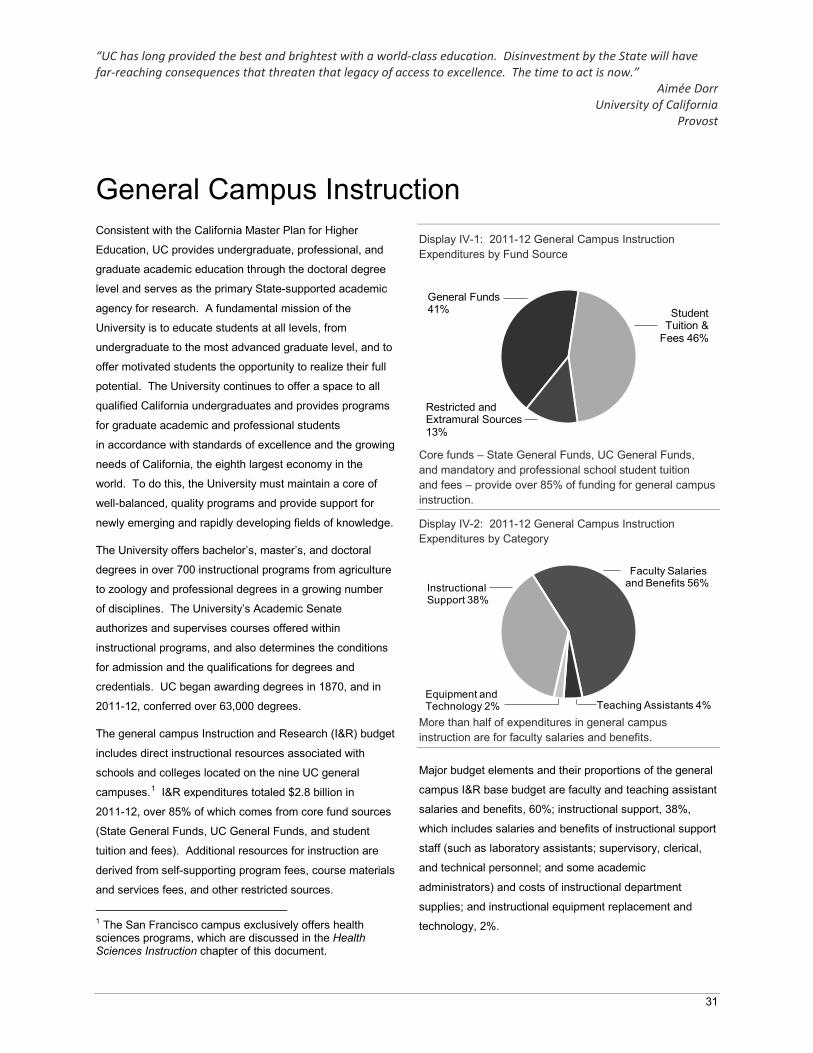
“UC has long provided the best and brightest with a world-class education. Disinvestment by the State will have far-reaching consequences that threaten that legacy of access to excellence. The time to act is now.”
Aimée Dorr University of California
Provost
31
General Campus InstructionConsistent with the California Master Plan for Higher
Education, UC provides undergraduate, professional, and
graduate academic education through the doctoral degree
level and serves as the primary State-supported academic
agency for research. A fundamental mission of the
University is to educate students at all levels, from
undergraduate to the most advanced graduate level, and to
offer motivated students the opportunity to realize their full
potential. The University continues to offer a space to all
qualified California undergraduates and provides programs
for graduate academic and professional students
in accordance with standards of excellence and the growing
needs of California, the eighth largest economy in the
world. To do this, the University must maintain a core of
well-balanced, quality programs and provide support for
newly emerging and rapidly developing fields of knowledge.
The University offers bachelor’s, master’s, and doctoral
degrees in over 700 instructional programs from agriculture
to zoology and professional degrees in a growing number
of disciplines. The University’s Academic Senate
authorizes and supervises courses offered within
instructional programs, and also determines the conditions
for admission and the qualifications for degrees and
credentials. UC began awarding degrees in 1870, and in
2011-12, conferred over 63,000 degrees.
The general campus Instruction and Research (I&R) budget
includes direct instructional resources associated with
schools and colleges located on the nine UC general
campuses.1 I&R expenditures totaled $2.8 billion in
2011-12, over 85% of which comes from core fund sources
(State General Funds, UC General Funds, and student
tuition and fees). Additional resources for instruction are
derived from self-supporting program fees, course materials
and services fees, and other restricted sources.
1 The San Francisco campus exclusively offers health sciences programs, which are discussed in the Health Sciences Instruction chapter of this document.
Display IV-1: 2011-12 General Campus Instruction Expenditures by Fund Source
Core funds – State General Funds, UC General Funds, and mandatory and professional school student tuition and fees – provide over 85% of funding for general campus instruction.
Display IV-2: 2011-12 General Campus Instruction Expenditures by Category
More than half of expenditures in general campus instruction are for faculty salaries and benefits.
Major budget elements and their proportions of the general
campus I&R base budget are faculty and teaching assistant
salaries and benefits, 60%; instructional support, 38%,
which includes salaries and benefits of instructional support
staff (such as laboratory assistants; supervisory, clerical,
and technical personnel; and some academic
administrators) and costs of instructional department
supplies; and instructional equipment replacement and
technology, 2%.
General Funds 41% Student
Tuition & Fees 46%
Restricted and Extramural Sources 13%
Faculty Salaries and Benefits 56%
Equipment and Technology 2%
Instructional Support 38%
Teaching Assistants 4%
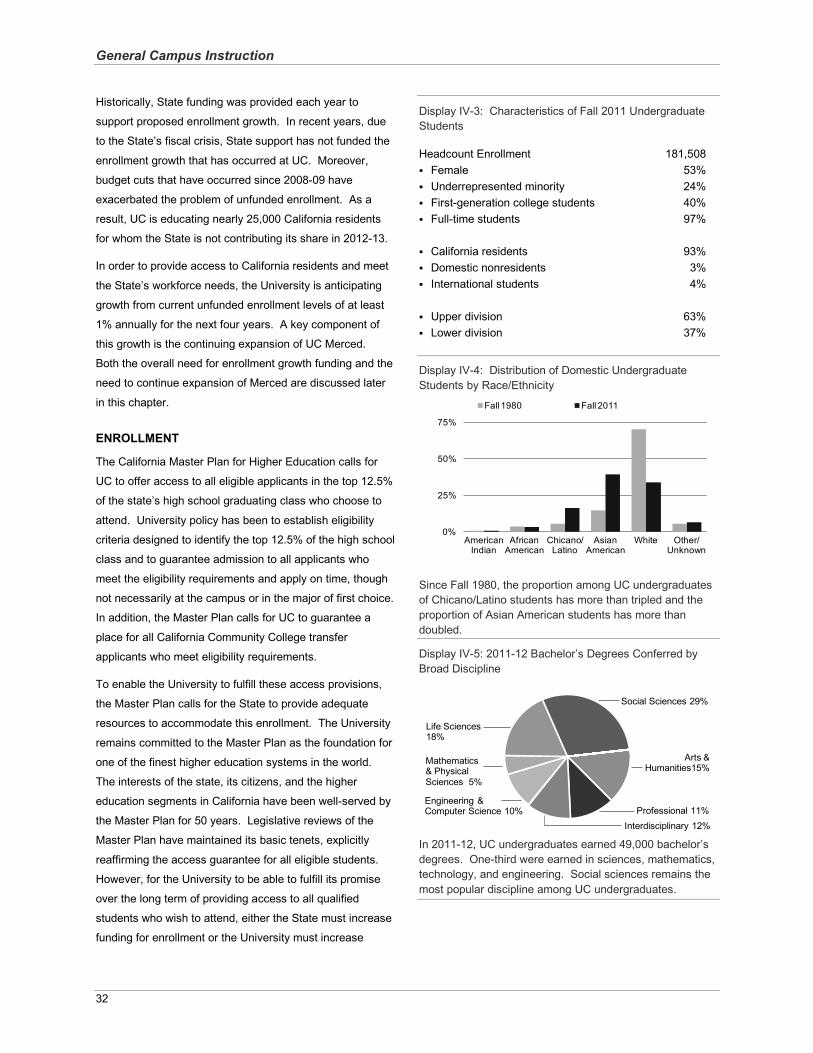
General Campus Instruction
32
Historically, State funding was provided each year to
support proposed enrollment growth. In recent years, due
to the State’s fiscal crisis, State support has not funded the
enrollment growth that has occurred at UC. Moreover,
budget cuts that have occurred since 2008-09 have
exacerbated the problem of unfunded enrollment. As a
result, UC is educating nearly 25,000 California residents
for whom the State is not contributing its share in 2012-13.
In order to provide access to California residents and meet
the State’s workforce needs, the University is anticipating
growth from current unfunded enrollment levels of at least
1% annually for the next four years. A key component of
this growth is the continuing expansion of UC Merced.
Both the overall need for enrollment growth funding and the
need to continue expansion of Merced are discussed later
in this chapter.
ENROLLMENT
The California Master Plan for Higher Education calls for
UC to offer access to all eligible applicants in the top 12.5%
of the state’s high school graduating class who choose to
attend. University policy has been to establish eligibility
criteria designed to identify the top 12.5% of the high school
class and to guarantee admission to all applicants who
meet the eligibility requirements and apply on time, though
not necessarily at the campus or in the major of first choice.
In addition, the Master Plan calls for UC to guarantee a
place for all California Community College transfer
applicants who meet eligibility requirements.
To enable the University to fulfill these access provisions,
the Master Plan calls for the State to provide adequate
resources to accommodate this enrollment. The University
remains committed to the Master Plan as the foundation for
one of the finest higher education systems in the world.
The interests of the state, its citizens, and the higher
education segments in California have been well-served by
the Master Plan for 50 years. Legislative reviews of the
Master Plan have maintained its basic tenets, explicitly
reaffirming the access guarantee for all eligible students.
However, for the University to be able to fulfill its promise
over the long term of providing access to all qualified
students who wish to attend, either the State must increase
funding for enrollment or the University must increase
Display IV-3: Characteristics of Fall 2011 Undergraduate Students
Headcount Enrollment 181,508Female 53%Underrepresented minority 24%First-generation college students 40%Full-time students 97%
California residents 93%Domestic nonresidents 3%International students 4%
Upper division 63%Lower division 37%
Display IV-4: Distribution of Domestic Undergraduate Students by Race/Ethnicity
Since Fall 1980, the proportion among UC undergraduates of Chicano/Latino students has more than tripled and the proportion of Asian American students has more than doubled.
Display IV-5: 2011-12 Bachelor’s Degrees Conferred by Broad Discipline
In 2011-12, UC undergraduates earned 49,000 bachelor’sdegrees. One-third were earned in sciences, mathematics, technology, and engineering. Social sciences remains the most popular discipline among UC undergraduates.
0%
25%
50%
75%
American Indian
African American
Chicano/ Latino
Asian American
White Other/ Unknown
Fall 1980 Fall 2011
Arts & Humanities15%
Social Sciences 29%
Interdisciplinary 12%
Life Sciences 18%
Mathematics & Physical Sciences 5%
Engineering & Computer Science 10% Professional 11%
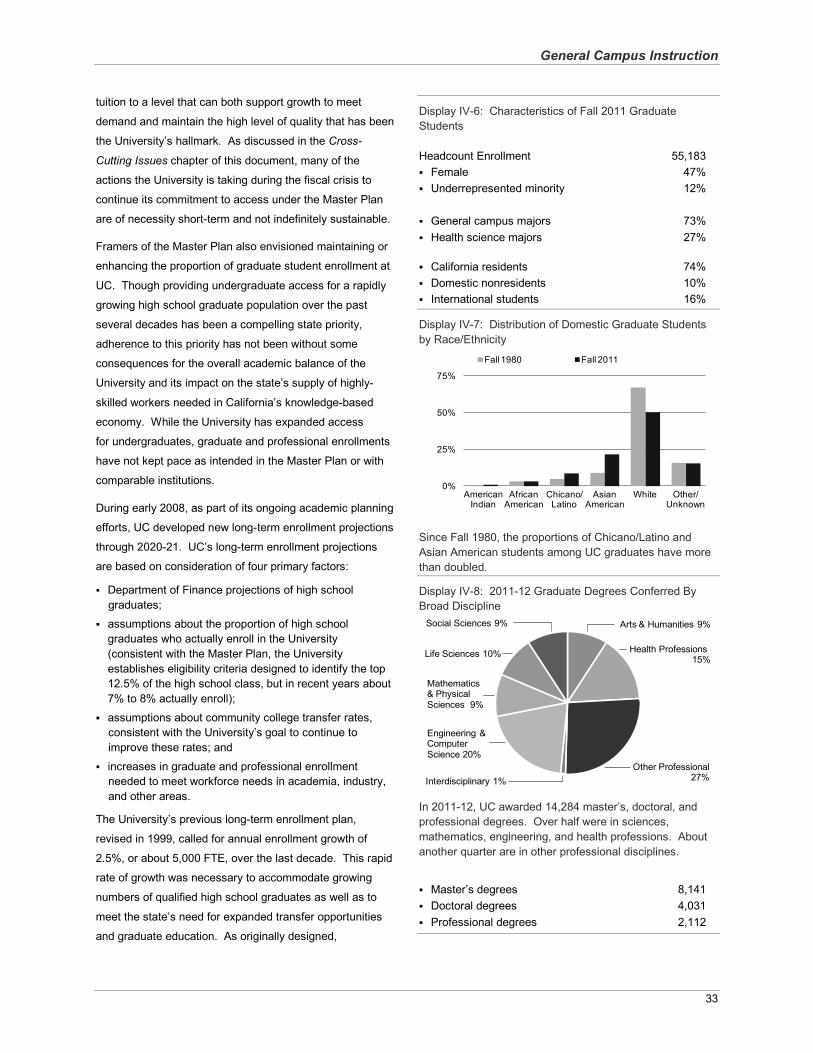
General Campus Instruction
33
tuition to a level that can both support growth to meet
demand and maintain the high level of quality that has been
the University’s hallmark. As discussed in the Cross-
Cutting Issues chapter of this document, many of the
actions the University is taking during the fiscal crisis to
continue its commitment to access under the Master Plan
are of necessity short-term and not indefinitely sustainable.
Framers of the Master Plan also envisioned maintaining or
enhancing the proportion of graduate student enrollment at
UC. Though providing undergraduate access for a rapidly
growing high school graduate population over the past
several decades has been a compelling state priority,
adherence to this priority has not been without some
consequences for the overall academic balance of the
University and its impact on the state’s supply of highly-
skilled workers needed in California’s knowledge-based
economy. While the University has expanded access
for undergraduates, graduate and professional enrollments
have not kept pace as intended in the Master Plan or with
comparable institutions.
During early 2008, as part of its ongoing academic planning
efforts, UC developed new long-term enrollment projections
through 2020-21. UC’s long-term enrollment projections
are based on consideration of four primary factors:
Department of Finance projections of high school graduates;
assumptions about the proportion of high school graduates who actually enroll in the University (consistent with the Master Plan, the University establishes eligibility criteria designed to identify the top 12.5% of the high school class, but in recent years about7% to 8% actually enroll);
assumptions about community college transfer rates, consistent with the University’s goal to continue to improve these rates; and
increases in graduate and professional enrollment needed to meet workforce needs in academia, industry, and other areas.
The University’s previous long-term enrollment plan,
revised in 1999, called for annual enrollment growth of
2.5%, or about 5,000 FTE, over the last decade. This rapid
rate of growth was necessary to accommodate growing
numbers of qualified high school graduates as well as to
meet the state’s need for expanded transfer opportunities
and graduate education. As originally designed,
Display IV-6: Characteristics of Fall 2011 Graduate Students
Headcount Enrollment 55,183Female 47%Underrepresented minority 12%
General campus majors 73%Health science majors 27%
California residents 74%Domestic nonresidents 10%International students 16%
Display IV-7: Distribution of Domestic Graduate Students by Race/Ethnicity
Since Fall 1980, the proportions of Chicano/Latino and Asian American students among UC graduates have more than doubled.
Display IV-8: 2011-12 Graduate Degrees Conferred By Broad Discipline
In 2011-12, UC awarded 14,284 master’s, doctoral, and professional degrees. Over half were in sciences, mathematics, engineering, and health professions. About another quarter are in other professional disciplines.
Master’s degrees 8,141Doctoral degrees 4,031Professional degrees 2,112
0%
25%
50%
75%
American Indian
African American
Chicano/ Latino
Asian American
White Other/ Unknown
Fall 1980 Fall 2011
Arts & Humanities 9%Social Sciences 9%
Interdisciplinary 1%
Life Sciences 10%
Mathematics & Physical Sciences 9%
Engineering & Computer Science 20%
Other Professional 27%
Health Professions 15%
General Campus Instruction
34
by 2010-11, the University would have reached its planned
target of 216,500 FTE students. However, in the early part
of the last decade, the University experienced far more
rapid enrollment growth than projected in the 1999 plan (in
fact, UC exceeded the 2010-11 target by more than 20,000
students). Following a State-enforced pause in enrollment
growth in the middle of the decade, the Compact with
Governor Schwarzenegger called for UC to return to its
earlier estimates of 2.5% enrollment growth per year
through 2010-11.
The University’s enrollment projections through 2020,
published in March 2008, included modest growth as
numbers of high school graduates stabilize, slowing to
approximately 1% from 2010-11 to 2020-21, and reaching
265,000 FTE students in 2020-21. According to the
projections, increasing undergraduate enrollment would
expand opportunity to populations historically underserved
by higher education, including low-income students, those
who are the first in their families to complete a four-year
degree, students from underserved communities, and
transfer students. Meanwhile, accelerated growth in
graduate enrollments, particularly in sciences, engineering
and mathematics, and professional disciplines would fuel
California’s economy and provide social and economic
mobility. To help the state remain competitive in a
knowledge-based global economy, UC proposed to
increase graduate enrollments by roughly 22,000 students
by 2020-21.
Development of a New Long-Range Enrollment Plan
While many of the goals of the March 2008 long-term
enrollment plan still stand, projections were developed at a
time when the outlook for continuing support from the State
for enrollment growth was more positive. Given the State’s
inability to fund recent enrollment growth and the significant
reductions in State support for UC during the last several
years, actual enrollment growth and admissions patterns
have diverged from the projections almost from the time
they were completed. Since 2008, there have been a
number of circumstances that warrant the development of a
new long range enrollment plan:
Continued deterioration of the state’s fiscal situation has been accompanied by large reductions in State funding for the University.Demand for undergraduate education at UC has grown in
spite of budget cuts and tuition increases, due in part to greater than expected growth in the size of California high school graduating classes.
Projections of California and U.S. workforce needs for individuals with bachelor’s and more advanced degrees indicate a larger attainment gap if California continues on its current course.
UC campuses, in the absence of State support for California residents, have been reaching out to and enrolling more undergraduate nonresidents. This growth in nonresidents was neither anticipated nor accounted for in the 2008 plan.
Projections for growth in graduate and professional programs were optimistic and aspirational in the 2008 plan. The greater use of Professional Degree Supplemental Tuition (PDST) helped accommodate professional growth, but expansion of academic graduate programs has proceeded at a much slower rate than planned in 2008.
Two major changes to UC’s funding model were not foreseen in 2008. Funding Streams allows campuses to keep all forms of revenue and thus impacts incentives forenrollment growth. Rebenching ties State funds to weighted student enrollment and approved enrollment targets. Both of these are briefly described in the Sources of University Funds chapter of this document.
Prospects for State support for further enrollment growth
during the next decade are a matter of concern, and many
of the solutions UC has implemented to help alleviate the
impact of recent budget cuts on program quality are
temporary and not sustainable in the long term. The
University will begin long-term enrollment planning over the
next year, aiming to balance the University’s continuing
commitment to maintaining access under the Master Plan
against the need to maintain quality in a period of declining
State resources.
State Support for Enrollment Growth
In a normal year, the State provides funding for each
additional FTE student added to the University’s current
budgeted enrollment level based on an amount known as
the “marginal cost of instruction,” calculated using an
agreed-upon methodology with the State and intended to
reflect the level of resources needed to educate additional
students at UC’s historical level of quality. The marginal
cost of instruction formula includes salary and benefits for
additional faculty positions (based on the assumption of a
budgeted student-faculty ratio of 18.7:1); related
instructional support such as clerical and technical
General Campus Instruction
35
personnel, supplies, and equipment; support for teaching
assistant positions; institutional support; and support for
operation and maintenance of plant, libraries, and student
services. Activities that the State has chosen not to
support, such as student health services, plant
administration, executive management, and logistical
services, are excluded. The methodology identifies the
State subsidy provided toward the cost of education as well
as the portion of this cost that is paid from student tuition
and fees. To the extent the methodology is based on
expenditures, the marginal cost rate does not capture the
full true costs of instruction. During 2010-11, the last time
the State provided such support, the State provided
enrollment growth funding at a marginal cost rate of
$10,012 per FTE student.
Funding for enrollment growth at the marginal cost of
instruction was included in the 2005-06, 2006-07, and
2007-08 budgets. However, due to substantial demand for
enrollment from growing numbers of high school graduates
and community college transfers, the University was
significantly over-enrolled in both 2006-07 and 2007-08.
The State’s ongoing fiscal woes led to reductions in support
for UC – and no new funding for enrollment growth – during
2008-09 and 2009-10. Without new State funding to
support enrollment growth, but in keeping with its
commitment to the California Master Plan and
undergraduate applicants who had worked hard to become
eligible for admission, the University made a decision in
2008-09 to ask that campuses, to the best of their ability,
implement the enrollment increases that had been planned
before the onset of budget cuts. This enrollment growth,
including growth planned in MD students in the PRograms
In Medical Education (PRIME), was funded through an
internal redirection of existing resources. As a result of this
action, and because recent incoming classes have been
larger than those graduating, the University’s enrollment
has continued to grow since 2008-09.
In 2009-10, 2010-11, and 2011-12, the University took
action to slow enrollment growth. The plan called for
reducing the targeted number of new California resident
freshmen enrolled by 3,800 students. To achieve this
reduction, fewer students were admitted to the campus or
campuses of their choice and more applications were sent
to the referral pool for accommodation at Riverside and
Merced (referral is the process by which UC-eligible
California applicants who are not selected at any of the
campuses where they apply are offered admission to an
alternate campus). Students had fewer campus choices
for accommodation at UC and, in some cases, chose to
pursue their education elsewhere. This freshman reduction
was to be partially offset by a planned increase of 1,000
CCC transfer students, an action taken to preserve the
transfer option in difficult economic times. The actual
curtailment of freshman enrollment was somewhat less
than planned, reducing by only about 1,000 students by
2012-13, while the University exceeded its goal to increase
transfers by 270 by 2012-13.
In 2010-11, the State budget provided $51.3 million to
support enrollment growth of 5,121 FTE students at UC at a
marginal cost rate of $10,012. In 2011-12, no funding for
enrollment was provided, and State support for the UC
budget was eventually reduced by $750 million. For
2012-13, the University is expecting enrollment to remain
relatively flat. Considering the devastating cuts in State
DILUTION OF STATE FUNDING
Accommodating enrollment without sufficient resources (asthe student fee income associated with enrollments is less than the cost of instruction) has impacted new and existing students alike by eroding UC’s traditional high quality academic experience.
For students, the dilution of resources means fewer and narrower course offerings, less access to functional and modern instructional equipment as part of the educational experience, larger class sizes, reduced interaction with topfaculty, longer waits for academic and student services, longer time-to-degree, fewer student jobs, and fewer library holdings and services relative to the number of students enrolled. This negative impact on the student experience comes at a time when students are being asked to pay a greater share of costs through higher tuition and fees.
For faculty, the impact is similar. As the funding gap widens, fewer competitive offers can be made to new faculty. Existing faculty find themselves spread increasingly thinly in order to manage the needs of ever larger classes, with less assistance from additional faculty and graduate students and less time for research or public service activities. Working with outdated equipment in unmaintained buildings, faculty morale suffers and opportunities at other institutions become more attractive. If the best faculty leave, UC’s quality will suffer.
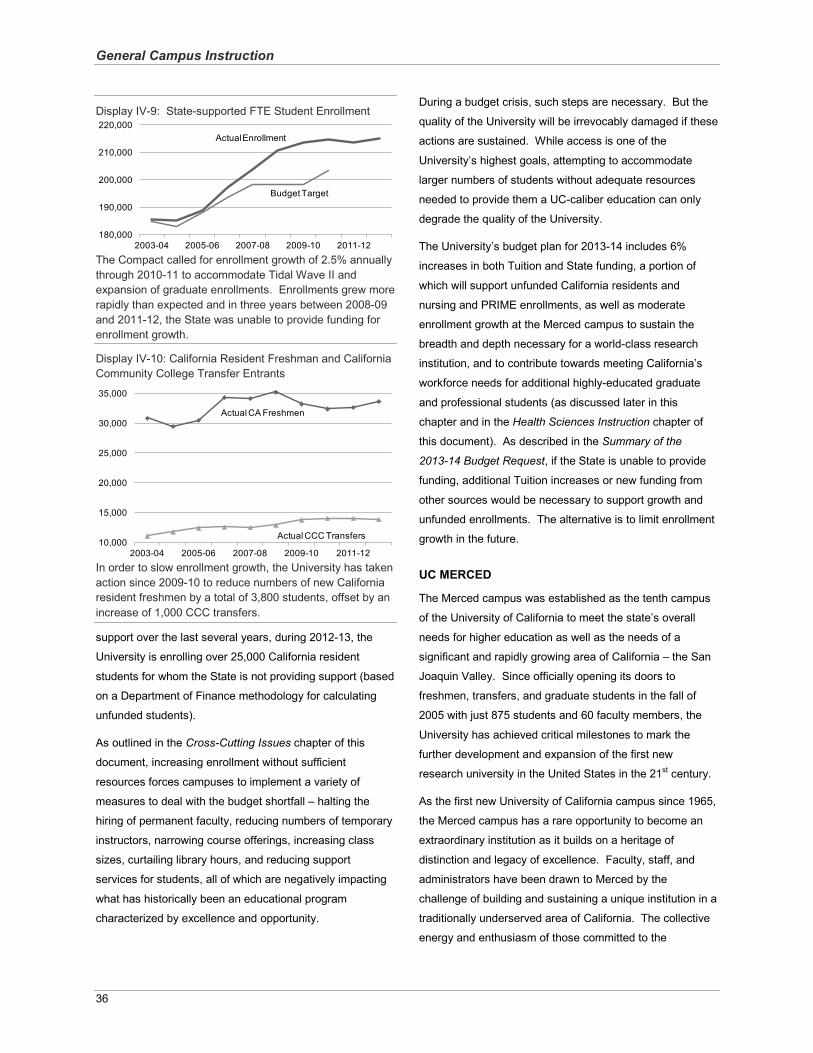
General Campus Instruction
36
Display IV-9: State-supported FTE Student Enrollment
The Compact called for enrollment growth of 2.5% annually through 2010-11 to accommodate Tidal Wave II and expansion of graduate enrollments. Enrollments grew more rapidly than expected and in three years between 2008-09 and 2011-12, the State was unable to provide funding for enrollment growth.
Display IV-10: California Resident Freshman and California Community College Transfer Entrants
In order to slow enrollment growth, the University has taken action since 2009-10 to reduce numbers of new California resident freshmen by a total of 3,800 students, offset by anincrease of 1,000 CCC transfers.
support over the last several years, during 2012-13, the
University is enrolling over 25,000 California resident
students for whom the State is not providing support (based
on a Department of Finance methodology for calculating
unfunded students).
As outlined in the Cross-Cutting Issues chapter of this
document, increasing enrollment without sufficient
resources forces campuses to implement a variety of
measures to deal with the budget shortfall – halting the
hiring of permanent faculty, reducing numbers of temporary
instructors, narrowing course offerings, increasing class
sizes, curtailing library hours, and reducing support
services for students, all of which are negatively impacting
what has historically been an educational program
characterized by excellence and opportunity.
During a budget crisis, such steps are necessary. But the
quality of the University will be irrevocably damaged if these
actions are sustained. While access is one of the
University’s highest goals, attempting to accommodate
larger numbers of students without adequate resources
needed to provide them a UC-caliber education can only
degrade the quality of the University.
The University’s budget plan for 2013-14 includes 6%
increases in both Tuition and State funding, a portion of
which will support unfunded California residents and
nursing and PRIME enrollments, as well as moderate
enrollment growth at the Merced campus to sustain the
breadth and depth necessary for a world-class research
institution, and to contribute towards meeting California’s
workforce needs for additional highly-educated graduate
and professional students (as discussed later in this
chapter and in the Health Sciences Instruction chapter of
this document). As described in the Summary of the
2013-14 Budget Request, if the State is unable to provide
funding, additional Tuition increases or new funding from
other sources would be necessary to support growth and
unfunded enrollments. The alternative is to limit enrollment
growth in the future.
UC MERCED
The Merced campus was established as the tenth campus
of the University of California to meet the state’s overall
needs for higher education as well as the needs of a
significant and rapidly growing area of California – the San
Joaquin Valley. Since officially opening its doors to
freshmen, transfers, and graduate students in the fall of
2005 with just 875 students and 60 faculty members, the
University has achieved critical milestones to mark the
further development and expansion of the first new
research university in the United States in the 21st century.
As the first new University of California campus since 1965,
the Merced campus has a rare opportunity to become an
extraordinary institution as it builds on a heritage of
distinction and legacy of excellence. Faculty, staff, and
administrators have been drawn to Merced by the
challenge of building and sustaining a unique institution in a
traditionally underserved area of California. The collective
energy and enthusiasm of those committed to the
180,000
190,000
200,000
210,000
220,000
2003-04 2005-06 2007-08 2009-10 2011-12
ActualEnrollment
Budget Target
10,000
15,000
20,000
25,000
30,000
35,000
2003-04 2005-06 2007-08 2009-10 2011-12
Actual CA Freshmen
Actual CCC Transfers
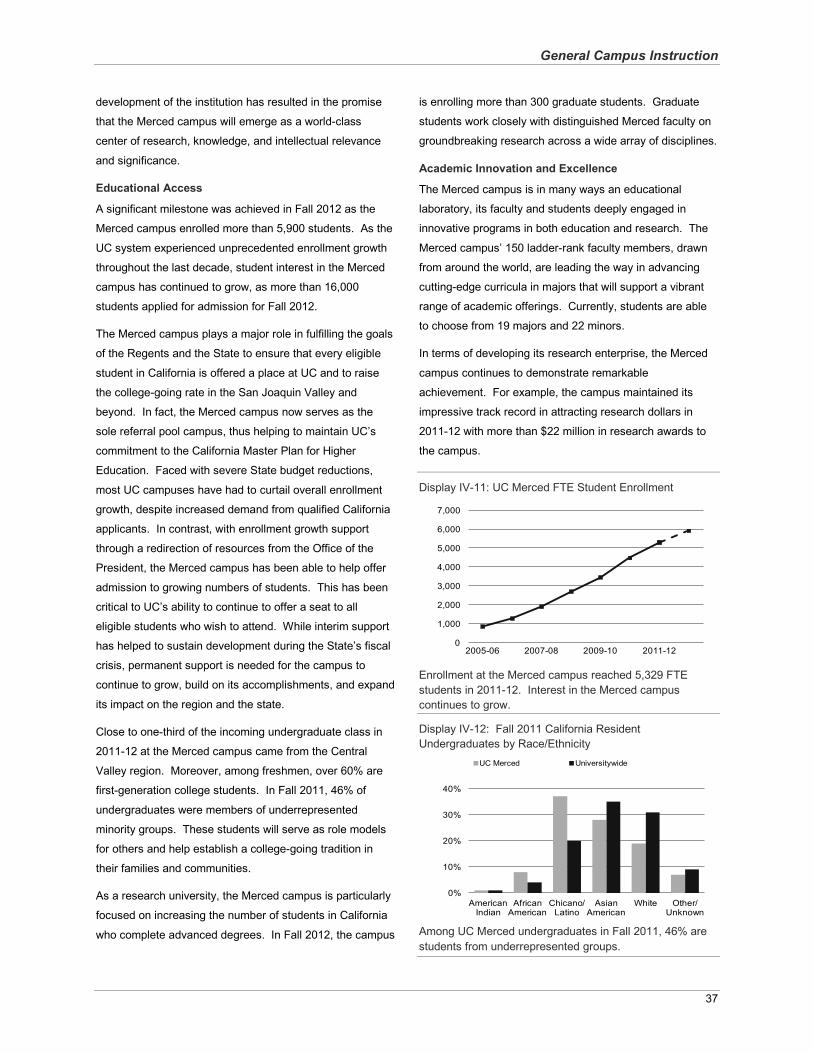
General Campus Instruction
37
development of the institution has resulted in the promise
that the Merced campus will emerge as a world-class
center of research, knowledge, and intellectual relevance
and significance.
Educational Access
A significant milestone was achieved in Fall 2012 as the
Merced campus enrolled more than 5,900 students. As the
UC system experienced unprecedented enrollment growth
throughout the last decade, student interest in the Merced
campus has continued to grow, as more than 16,000
students applied for admission for Fall 2012.
The Merced campus plays a major role in fulfilling the goals
of the Regents and the State to ensure that every eligible
student in California is offered a place at UC and to raise
the college-going rate in the San Joaquin Valley and
beyond. In fact, the Merced campus now serves as the
sole referral pool campus, thus helping to maintain UC’s
commitment to the California Master Plan for Higher
Education. Faced with severe State budget reductions,
most UC campuses have had to curtail overall enrollment
growth, despite increased demand from qualified California
applicants. In contrast, with enrollment growth support
through a redirection of resources from the Office of the
President, the Merced campus has been able to help offer
admission to growing numbers of students. This has been
critical to UC’s ability to continue to offer a seat to all
eligible students who wish to attend. While interim support
has helped to sustain development during the State’s fiscal
crisis, permanent support is needed for the campus to
continue to grow, build on its accomplishments, and expand
its impact on the region and the state.
Close to one-third of the incoming undergraduate class in
2011-12 at the Merced campus came from the Central
Valley region. Moreover, among freshmen, over 60% are
first-generation college students. In Fall 2011, 46% of
undergraduates were members of underrepresented
minority groups. These students will serve as role models
for others and help establish a college-going tradition in
their families and communities.
As a research university, the Merced campus is particularly
focused on increasing the number of students in California
who complete advanced degrees. In Fall 2012, the campus
is enrolling more than 300 graduate students. Graduate
students work closely with distinguished Merced faculty on
groundbreaking research across a wide array of disciplines.
Academic Innovation and Excellence
The Merced campus is in many ways an educational
laboratory, its faculty and students deeply engaged in
innovative programs in both education and research. The
Merced campus’ 150 ladder-rank faculty members, drawn
from around the world, are leading the way in advancing
cutting-edge curricula in majors that will support a vibrant
range of academic offerings. Currently, students are able
to choose from 19 majors and 22 minors.
In terms of developing its research enterprise, the Merced
campus continues to demonstrate remarkable
achievement. For example, the campus maintained its
impressive track record in attracting research dollars in
2011-12 with more than $22 million in research awards to
the campus.
Display IV-11: UC Merced FTE Student Enrollment
Enrollment at the Merced campus reached 5,329 FTE students in 2011-12. Interest in the Merced campuscontinues to grow.
Display IV-12: Fall 2011 California Resident Undergraduates by Race/Ethnicity
Among UC Merced undergraduates in Fall 2011, 46% are students from underrepresented groups.
0
1,000
2,000
3,000
4,000
5,000
6,000
7,000
2005-06 2007-08 2009-10 2011-12
0%
10%
20%
30%
40%
American Indian
African American
Chicano/ Latino
Asian American
White Other/ Unknown
UC Merced Universitywide
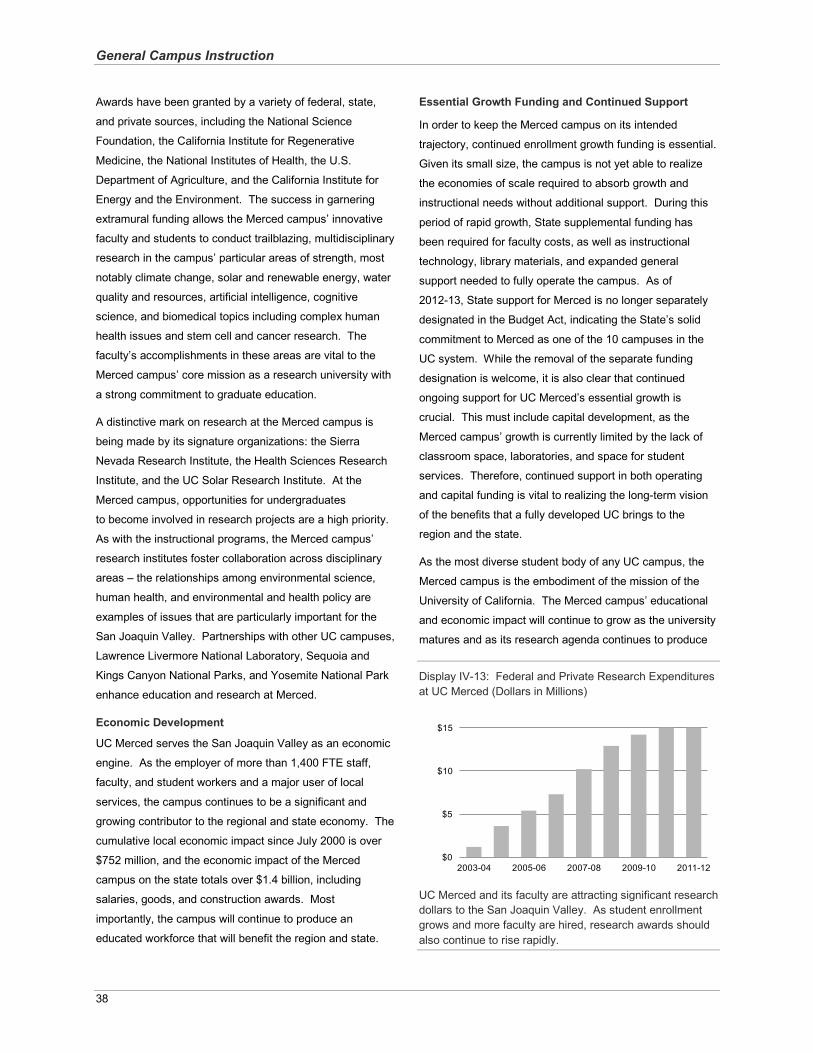
General Campus Instruction
38
Awards have been granted by a variety of federal, state,
and private sources, including the National Science
Foundation, the California Institute for Regenerative
Medicine, the National Institutes of Health, the U.S.
Department of Agriculture, and the California Institute for
Energy and the Environment. The success in garnering
extramural funding allows the Merced campus’ innovative
faculty and students to conduct trailblazing, multidisciplinary
research in the campus’ particular areas of strength, most
notably climate change, solar and renewable energy, water
quality and resources, artificial intelligence, cognitive
science, and biomedical topics including complex human
health issues and stem cell and cancer research. The
faculty’s accomplishments in these areas are vital to the
Merced campus’ core mission as a research university with
a strong commitment to graduate education.
A distinctive mark on research at the Merced campus is
being made by its signature organizations: the Sierra
Nevada Research Institute, the Health Sciences Research
Institute, and the UC Solar Research Institute. At the
Merced campus, opportunities for undergraduates
to become involved in research projects are a high priority.
As with the instructional programs, the Merced campus’
research institutes foster collaboration across disciplinary
areas – the relationships among environmental science,
human health, and environmental and health policy are
examples of issues that are particularly important for the
San Joaquin Valley. Partnerships with other UC campuses,
Lawrence Livermore National Laboratory, Sequoia and
Kings Canyon National Parks, and Yosemite National Park
enhance education and research at Merced.
Economic Development
UC Merced serves the San Joaquin Valley as an economic
engine. As the employer of more than 1,400 FTE staff,
faculty, and student workers and a major user of local
services, the campus continues to be a significant and
growing contributor to the regional and state economy. The
cumulative local economic impact since July 2000 is over
$752 million, and the economic impact of the Merced
campus on the state totals over $1.4 billion, including
salaries, goods, and construction awards. Most
importantly, the campus will continue to produce an
educated workforce that will benefit the region and state.
Essential Growth Funding and Continued Support
In order to keep the Merced campus on its intended
trajectory, continued enrollment growth funding is essential.
Given its small size, the campus is not yet able to realize
the economies of scale required to absorb growth and
instructional needs without additional support. During this
period of rapid growth, State supplemental funding has
been required for faculty costs, as well as instructional
technology, library materials, and expanded general
support needed to fully operate the campus. As of
2012-13, State support for Merced is no longer separately
designated in the Budget Act, indicating the State’s solid
commitment to Merced as one of the 10 campuses in the
UC system. While the removal of the separate funding
designation is welcome, it is also clear that continued
ongoing support for UC Merced’s essential growth is
crucial. This must include capital development, as the
Merced campus’ growth is currently limited by the lack of
classroom space, laboratories, and space for student
services. Therefore, continued support in both operating
and capital funding is vital to realizing the long-term vision
of the benefits that a fully developed UC brings to the
region and the state.
As the most diverse student body of any UC campus, the
Merced campus is the embodiment of the mission of the
University of California. The Merced campus’ educational
and economic impact will continue to grow as the university
matures and as its research agenda continues to produce
Display IV-13: Federal and Private Research Expenditures at UC Merced (Dollars in Millions)
UC Merced and its faculty are attracting significant research dollars to the San Joaquin Valley. As student enrollment grows and more faculty are hired, research awards should also continue to rise rapidly.
$0
$5
$10
$15
2003-04 2005-06 2007-08 2009-10 2011-12
General Campus Instruction
39
knowledge and innovations that lift up lives and
communities. Despite fiscal challenges, further investment
in the Merced campus promises that the substantial
difference to the Valley and to the state first envisioned for
the tenth campus will be fulfilled.
FACULTY EXCELLENCE
As documented in the UC’s Role in the State of California
chapter of this document, the University of California faculty
is among the best and brightest internationally, leading the
world in research excellence and productivity at higher
education institutions. UC faculty members provide stellar
instructional programs, research and creative work,
professional leadership, and public service. The faculty
fulfill the University’s goals on behalf of the State of
California by:
delivering excellence in teaching;driving intellectual engagement and discovery, community health, economic vitality, and cultural vibrancy;educating the workforce to keep the California economy competitive; and
attracting billions of research dollars, creating new products, technologies, jobs, companies, advances in health care, and improvements in the quality of life.
UC faculty continue to take on new challenges, such as
online education, increased enrollment, and
interdisciplinary initiatives. UC faculty comprise the core of
an eminent university, combining their roles as classroom
teachers and mentors with research and creative activities
that bring recognition throughout the nation and the world.
In Fall 2011, UC employed over 9,200 faculty with
appointments in the Ladder Rank Professorial series, the
core faculty series charged with the tripartite mission of
teaching, research, and public service. In addition, the
University employs lecturers, adjuncts, visiting faculty, and
others, including retired faculty recalled to part-time service,
to provide depth and breadth in fulfilling UC’s mission. In
2011-12, expenditures on base salaries for appointments in
all faculty series (from all revenue sources including State
funds, student tuition and fees, contracts and grants, gifts
and endowments, and clinical services) totaled $1.9 billion.
Current data reveal continuing faculty achievement
alongside increasing recruitment and retention challenges:
Faculty continue to perform at top levels marked by career awards for both established and early career faculty.
Despite considerable enrollment increases since 2007-08that would normally call for adding additional faculty, thesize and composition of the faculty remain relatively stable, with the notable exception of increases in the number of non-Senate faculty in the health sciences.Over the past two years, the University experienced a decrease in the number of general campus ladder andequivalent rank faculty, from 7,900 in 2010 to 7,800 in 2011. This growing imbalance between dramatic enrollment growth and the downward trend in the number of faculty is deeply troubling and must be addressed in the coming years.
The distribution of faculty by age has shifted, with more faculty members in older age cohorts. In 2011, over 6.5% of ladder rank faculty were age 70 or above. In 2011, approximately 21% of faculty in General Campus departments who had not yet retired were at or above age 62, which is the age at which an individual may usually start receiving Social Security retirement benefits.
Average UC salaries remain lower than at peer universities, while the most intense competition for faculty is with private universities, where salaries have continued to rise.Challenges of hiring a diverse faculty vary by discipline. Campus efforts to increase the representation of women and underrepresented minorities on the faculty have yielded limited progress.
In the last five years, UC has hired 2,299 ladder rank faculty, or 25% of the current number, to accommodate enrollment growth and replace faculty who have retired or otherwise left the University. During 2010-11, the number of new hires dropped dramatically from 379 the preceding year to 189, the lowest number of hires inmore than a decade.
Since 1994, the University’s budgeted student-faculty ratio
has been 18.7:1. However, the actual student-faculty ratio
has deteriorated dramatically in the recent fiscal crisis –the
actual student-faculty ratio currently stands at about 21:1.
Improving the student-faculty ratio at the University has
been among the highest priorities of the Regents. Doing so
would permit the University to:
offer smaller class sizes where possible,
improve the quality of the educational experience and richness of course offerings, and
help students complete requirements and graduate more quickly.
A lower student-faculty ratio also increases opportunities for
contact outside the classroom, guidance in internships and
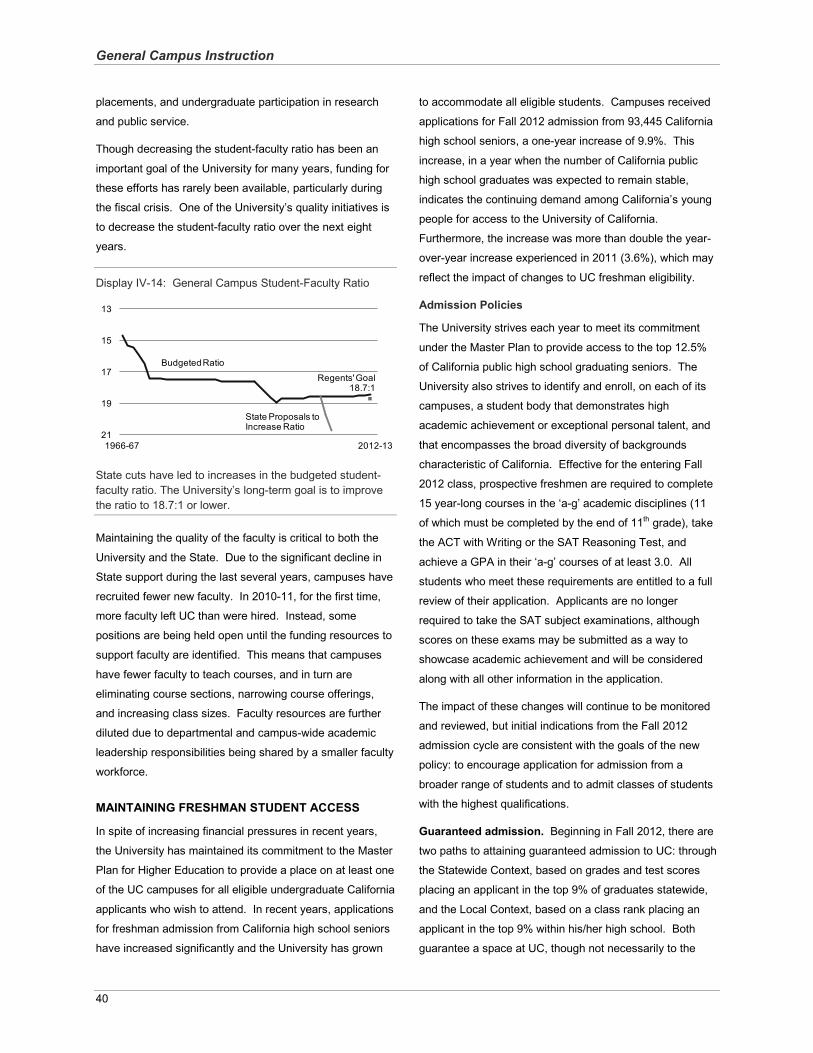
General Campus Instruction
40
placements, and undergraduate participation in research
and public service.
Though decreasing the student-faculty ratio has been an
important goal of the University for many years, funding for
these efforts has rarely been available, particularly during
the fiscal crisis. One of the University’s quality initiatives is
to decrease the student-faculty ratio over the next eight
years.
Display IV-14: General Campus Student-Faculty Ratio
State cuts have led to increases in the budgeted student-faculty ratio. The University’s long-term goal is to improve the ratio to 18.7:1 or lower.
Maintaining the quality of the faculty is critical to both the
University and the State. Due to the significant decline in
State support during the last several years, campuses have
recruited fewer new faculty. In 2010-11, for the first time,
more faculty left UC than were hired. Instead, some
positions are being held open until the funding resources to
support faculty are identified. This means that campuses
have fewer faculty to teach courses, and in turn are
eliminating course sections, narrowing course offerings,
and increasing class sizes. Faculty resources are further
diluted due to departmental and campus-wide academic
leadership responsibilities being shared by a smaller faculty
workforce.
MAINTAINING FRESHMAN STUDENT ACCESS
In spite of increasing financial pressures in recent years,
the University has maintained its commitment to the Master
Plan for Higher Education to provide a place on at least one
of the UC campuses for all eligible undergraduate California
applicants who wish to attend. In recent years, applications
for freshman admission from California high school seniors
have increased significantly and the University has grown
to accommodate all eligible students. Campuses received
applications for Fall 2012 admission from 93,445 California
high school seniors, a one-year increase of 9.9%. This
increase, in a year when the number of California public
high school graduates was expected to remain stable,
indicates the continuing demand among California’s young
people for access to the University of California.
Furthermore, the increase was more than double the year-
over-year increase experienced in 2011 (3.6%), which may
reflect the impact of changes to UC freshman eligibility.
Admission Policies
The University strives each year to meet its commitment
under the Master Plan to provide access to the top 12.5%
of California public high school graduating seniors. The
University also strives to identify and enroll, on each of its
campuses, a student body that demonstrates high
academic achievement or exceptional personal talent, and
that encompasses the broad diversity of backgrounds
characteristic of California. Effective for the entering Fall
2012 class, prospective freshmen are required to complete
15 year-long courses in the ‘a-g’ academic disciplines (11
of which must be completed by the end of 11th grade), take
the ACT with Writing or the SAT Reasoning Test, and
achieve a GPA in their ‘a-g’ courses of at least 3.0. All
students who meet these requirements are entitled to a full
review of their application. Applicants are no longer
required to take the SAT subject examinations, although
scores on these exams may be submitted as a way to
showcase academic achievement and will be considered
along with all other information in the application.
The impact of these changes will continue to be monitored
and reviewed, but initial indications from the Fall 2012
admission cycle are consistent with the goals of the new
policy: to encourage application for admission from a
broader range of students and to admit classes of students
with the highest qualifications.
Guaranteed admission. Beginning in Fall 2012, there are
two paths to attaining guaranteed admission to UC: through
the Statewide Context, based on grades and test scores
placing an applicant in the top 9% of graduates statewide,
and the Local Context, based on a class rank placing an
applicant in the top 9% within his/her high school. Both
guarantee a space at UC, though not necessarily to the
13
15
17
19
211966-67 2012-13
Regents' Goal18.7:1
State Proposals to Increase Ratio
Budgeted Ratio
General Campus Instruction
41
campus of choice. Consistent with past practice, for
California residents who are guaranteed admission but are
not accepted by any campus to which they apply, students
are admitted through the referral pool at one or more
campuses with space to admit more students. Currently,
the Merced campus admits all students from the referral
pool.
CRITERIA FOR FRESHMAN APPLICATION REVIEW AND ADMISSION GUARANTEES
Application Review Entitlement:Completion of at least 15 year-long ‘a-g’ courses and standardized tests (with completion of 11 of the 15 courses by the end of the junior year),
a minimum GPA of 3.0 in ‘a-g’ courses, and
completion of either the ACT plus Writing or the SAT Reasoning Test.
Statewide Context Guarantee:Satisfaction of the above criteria, anda combination of grades and test scores that place them within the top 9% of graduates statewide.
Local Context Guarantee:Satisfaction of a specified set of 11 courses by the end of the junior year,
a minimum GPA of 3.0 in ‘a-g’ courses, andrank within the top 9% of the high school class based on GPA in ‘a-g’ courses.
The University’s “comprehensive review” process, in place
since 2002, ensures the admission of highly-qualified
students by allowing UC campuses to consider the broad
variety of academic and other qualifications that all students
present on the application. Applicants admitted under
comprehensive review continue to be high-achieving
students. All freshman applicant records are analyzed not
only for their grades, test scores, and other academic
criteria – important baseline indicators of academic
potential – but also for additional evidence of such qualities
as leadership, intellectual curiosity, and initiative. This
policy sends a strong signal that UC is looking for students
who have achieved at high levels and, in doing so, have
challenged themselves to the greatest extent possible.
As part of its service to the state, UC is responsible for
certifying courses offered in California’s high schools as
meeting the ‘a-g’ course requirements, which are also
required for eligibility to the CSU system. For the 2011-12
academic year alone, UC reviewed over 23,000 high school
courses for UC and CSU eligibility. UC’s ‘a-g’ course lists,
which include over 160,000 approved courses from 2,200
high schools, are widely used nationally and internationally;
UC’s ‘a-g’ website received more than one million visits in
the last year.
In recent years, a great deal of attention has been devoted
to creating curricula that combine college preparatory work
with Career-Technical Education (CTE). Courses that
combine academic content knowledge with practical or
work-related applications may be eligible for ‘a-g’ approval.
To date, UC has reviewed and approved 10,833 CTE
courses as meeting ‘a-g’ standards, exceeding UC’s goal of
reviewing 10,000 CTE courses by 2011-12.
TRANSFER FROM CALIFORNIA COMMUNITY COLLEGES TO UC
For those students who choose not to attend a four-year
university directly out of high school, the ability to transfer
from a California Community College (CCC) to a four-year
institution for upper division coursework maintains the
state’s commitment to educational opportunity for all. The
Master Plan calls for UC to ensure that 60% of its enrolled
undergraduates be at the junior or senior level in order to
ensure adequate upper division spaces for transfer
students from the CCCs. Accordingly, the University’s
Commission on the Future recommended that UC, as it
improves the transfer function, pursue the goal of seeking
to reach the ratio of enrolling one new California resident
CCC transfer student for every two new California resident
freshmen.
Over the past decade, UC enrollment of new CCC transfer
students has grown by one-third. In Fall 2011, UC enrolled
14,360 new California resident CCC transfer students, and
the freshman-to-transfer ratio stood at 2.3:1. Reflecting the
priority the University places on its transfer mission, the
President recommended increasing CCC transfer
enrollments in recent years. Applications from transfer
students, however, dropped by 5.6% for Fall 2012, possibly
General Campus Instruction
42
due to limited class availability at community colleges or
increasing numbers of transfer to the California State
University, and therefore the University maintained, but did
not increase, its transfer enrollment targets for Fall 2012.
Key elements for a successful transfer function include
clearly-defined eligibility and selection criteria; availability of
academic and financial aid counseling from both CCC
counselors and UC transfer advisors; and complete,
accurate, timely, and available course articulation
information identifying which CCC courses are transferable
to UC and how individual courses will advance students to
a baccalaureate degree. The University makes efforts in all
three of these areas to help promote transfer student
access to UC.
Transfer Eligibility
The vast majority of transfer students are admitted to the
University at the junior level. In 2012, the UC Academic
Senate approved changes to minimum transfer eligibility
that responds to the development of new associate degrees
for transfer at the California Community Colleges. Full
implementation of the new policies is scheduled for the Fall
2015 admissions cycle.
TRANSFER ELIGIBILITYTransfer applicants who meet one of the following paths are guaranteed a comprehensive review of their application for admission.
Complete 60 semester/90 quarter units of transferable coursework with a 2.4 GPA and complete 7 specific transferable courses with a C grade or better in each, or
Complete an approved Associate of Arts or Associate of Science for Transfer at a California Community College,or
Complete an approved UC Transfer Curriculum (under development).
Admission as a Transfer
All UC campuses are open to new transfer students for
each fall term and the Merced campus accepts students in
the spring term. CCC transfer applicants who are California
residents and who have met UC’s eligibility requirements
and lower division major requirements are given top priority
in transfer admission at all campuses.
As with freshman applicants, campuses use
comprehensive review criteria for transfer applicants to
select students for admission to majors and campuses.
Selection criteria at campuses with more eligible applicants
than spaces available include academic factors such as
major preparation, as well as additional evidence of such
qualities as motivation, leadership, and intellectual curiosity.
Transfer Advising
In order to promote the transfer process, the University
provides admission advisors who regularly travel to
community colleges to meet with students and staff
regarding transfer admission and lower division preparation
requirements. Efforts are focused on community colleges
with high numbers of educationally disadvantaged students
and historically low transfer rates to UC. In 2006-07, State
funds totaling $2 million were added to the funds already
provided for community college transfer programs,
providing more advisors and funding other transfer
initiatives, such as the new online Transfer Admission
Planner (TAP). TAP allows students to begin tracking their
completed coursework at community colleges in their
freshman year and provides immediate feedback on their
progress towards transfer. Furthermore, the tool allows UC
and CCC counselors to track and communicate with
potential transfer students. Additionally, UC campuses
have transfer centers and advisors available to assist
prospective and new transfer students who enroll at UC.
Course Articulation
In order to plan for transfer, students must know how the
courses they take at a community college will apply toward
a degree at a particular UC campus. Articulation refers
to agreements between educational institutions that specify
how a course a student completes at one institution (e.g., a
community college) can be used to satisfy general
education, major preparation, and graduation requirements
at a second institution (e.g., a UC campus). Each UC
campus has articulated high demand majors with all 112
CCCs, and all campuses (except Merced) have more than
70 majors articulated on average with all of the community
colleges. Course articulation at UC falls into two
categories:
Universitywide Articulation. Transfer Course Agreements, reviewed by the UC Office of the President,
General Campus Instruction
43
designate which courses can be transferred for unit credit to meet University admissions, general education, and graduation requirements.
Major Preparation Articulation. Each UC campus designates which courses at the community college are comparable to courses taught at the UC campus and will be accepted as transfer credit toward the requirements ofa particular major.
Students can satisfy lower division general education
courses by completing the Intersegmental General
Education Transfer Curriculum (IGETC). In addition to
completing general education requirements, students must
complete specified coursework to prepare for their major.
CCC students have two primary tools to navigate the
transfer path. Students can locate course articulation
agreements at www.assist.org. ASSIST, the Articulation
System Stimulating Interinstitutional Student Transfer,
includes all official course articulation established among
CCC, CSU, and UC, and more than 13 million articulation
reports are generated annually for students.
University faculty have developed a second tool, UC
Transfer Preparation Paths, which establishes a framework
to identify specific courses at every CCC that students can
use to meet the lower division requirements in any of the
top 21 transfer majors. This information is available at
universityofcalifornia.edu/admissions/ transfer/preparation-
paths/index.html.
NONRESIDENT ENROLLMENT
UC’s priority is to enroll all eligible California residents for
whom the State has provided funding. The California
Master Plan for Higher Education establishes the
framework, calling for UC to offer a space to, and the State
to fund, all eligible California resident applicants at both the
freshman and transfer levels. Campus enrollment targets
for California residents are established on a universitywide
level based on available State funding and campus growth
plans. Enrollment targets for nonresident students,
however, are currently established at the campus level
rather than at the system level and are based on campus
physical and instructional capacity and the ability of the
campus to attract and enroll qualified nonresident students.
Until recently, UC enrollment of undergraduate
nonresidents has been less than 8% of total undergraduate
enrollments across the system. UC’s public peer
institutions typically have much higher enrollments of
nonresident students. For example, at the University of
Michigan and the University of Virginia, more than one-third
of undergraduates are nonresidents.
Just as other forms of diversity enhance the educational
experiences of students, California’s dependence on an
increasingly global society and economy requires
geographic diversity among the student body. Nonresident
students are essential to the University, contributing to the
academic quality and educational experience of all students
and enhancing the diversity of backgrounds and
perspectives on the campuses at which they enroll. Their
contributions help prepare all UC students to live and work
effectively in an increasingly global world. Nonresident
enrollments also help grow and sustain the University’s
global reach, promoting new opportunities for students and
faculty.
Nonresident undergraduates pay approximately $23,000
more than California residents in Nonresident Supplemental
Tuition, providing extra revenue that enables UC to improve
educational programs for all students. Among other things,
Nonresident Supplemental Tuition is used to help recruit
and retain high quality faculty, mount additional courses
that help lower class sizes and expand the breadth of
offerings, expand library collections and services for
students, renew instructional equipment and technology,
and otherwise ameliorate the dilution of quality described
earlier in this chapter.
Many nonresident students choose to stay in California
after graduation from UC. The state itself reaps benefits
from the contributions to California industries of talented
and highly qualified nonresident UC graduates. As
discussed in the UC’s Role in the State of California and
Health Sciences Instruction chapters of this document,
California is in desperate need of college-educated workers
in many industries. Nonresidents who stay in California
after earning their degree at UC bolster the pool of
educated workers in California and make significant
contributions to the state economy.
Nonresident students do not displace California residents
who are funded by the State. UC sets enrollment targets
General Campus Instruction
44
for California students based on the funding it receives from
the State, whereas each campus sets enrollment targets for
nonresident students, over and above its California resident
enrollment, based on its remaining physical and
instructional capacity.
UC is committed to enrolling as many California students as
the State is willing to fund. In recent years, the State has
not provided funding commensurate with UC’s enrollment
growth. Because the University has honored its historic
commitment to admit all eligible Californians, in 2012-13,
UC is enrolling 11,500 residents for whom the State has
never provided funding, resulting in a financially untenable
situation. When budget cuts are taken into account, the
number of unfunded students is actually 25,000.
In 2010, the UC Commission on the Future recommended
that UC actively pursue comparatively small increases in
nonresident enrollment at the undergraduate level up to
10% of the undergraduate student body both as a means of
enhancing the University experience and in order to help
maintain the fiscal health of the University, while
maintaining its commitment to the enrollment of California
residents.
All UC undergraduate campuses have experienced
nonresident enrollment increases, with a systemwide total
of over 14,600 undergraduate nonresidents estimated for
2012-13, an increase of more than 2,400 over the prior
year. As noted previously, systemwide undergraduate
nonresident enrollment represents only 8% of the total
undergraduate population at UC in 2011-12, significantly
less than the 30 – 35% range often found at other major
public research universities.
Nonresident demand and enrollment have risen at most
campuses, with projections for reaching the 10% cap
around 2014-15. At a special retreat meeting of the
Regents in September 2012, the Regents discussed a
number of “out-of-the-box” ideas for reducing costs or
generating new revenue, including the possibility of
increasing the nonresident cap from 10%, up to 15% or
20%. The increased revenue would be an important
element in the success of achieving UC’s goals for
reinvesting in the quality of the academic program.
Nonetheless, UC’s enrollment of nonresident students is –
and will continue to be – low relative to comparable
institutions, and will be in addition to enrollment of funded
California resident students.
SUMMER INSTRUCTION
Facing extraordinary growth in high school graduating
classes over the last decade and the need to accommodate
significant enrollment increases, the University, with funding
from the State, began expanding summer instruction
programs in 2001. Since that time, the University has more
than doubled its summer enrollments. In Summer 2011,
nearly 74,000 UC students participated in summer
instruction, or nearly 16,700 FTE students.
The key to achieving significant enrollment growth in the
summer has been to offer summer instruction that is critical
to student progress, along with essential student support
services, access to libraries, and student financial aid.
State funding for summer instruction has allowed campuses
to provide UC financial aid equivalent to the UC grant
support available during the regular academic year, fund
adequate student services, and hire more regular-rank
faculty to teach summer courses. In addition, with State
funding, campuses can afford to offer a greater breadth of
courses during the summer to maximize efficiency and
student progress toward the degree; campuses have more
than doubled the number of primary classes offered in the
summer since 2000, totaling over 5,500 in 2011. Summer
expansion has resulted in more efficient use of facilities and
accelerated time to degree for undergraduates, thereby
making room for more students during the regular year.
Students report using summer as a means to graduate on
time or even early, and enjoy the smaller class sizes and
faculty contact summer courses provide.
Summer enrollment at UC has likely reached its point of
maximum efficiency and further growth in the summer may
be difficult to achieve for several reasons. In recent years,
over 70% of undergraduate students have enrolled in at
least one summer session, and 40% enroll more than once
even though students can also use summer for other
opportunities, such as work, travel, or internships. Rather
than growing in recent years, this participation rate has
stabilized. Students are not replacing a regular academic
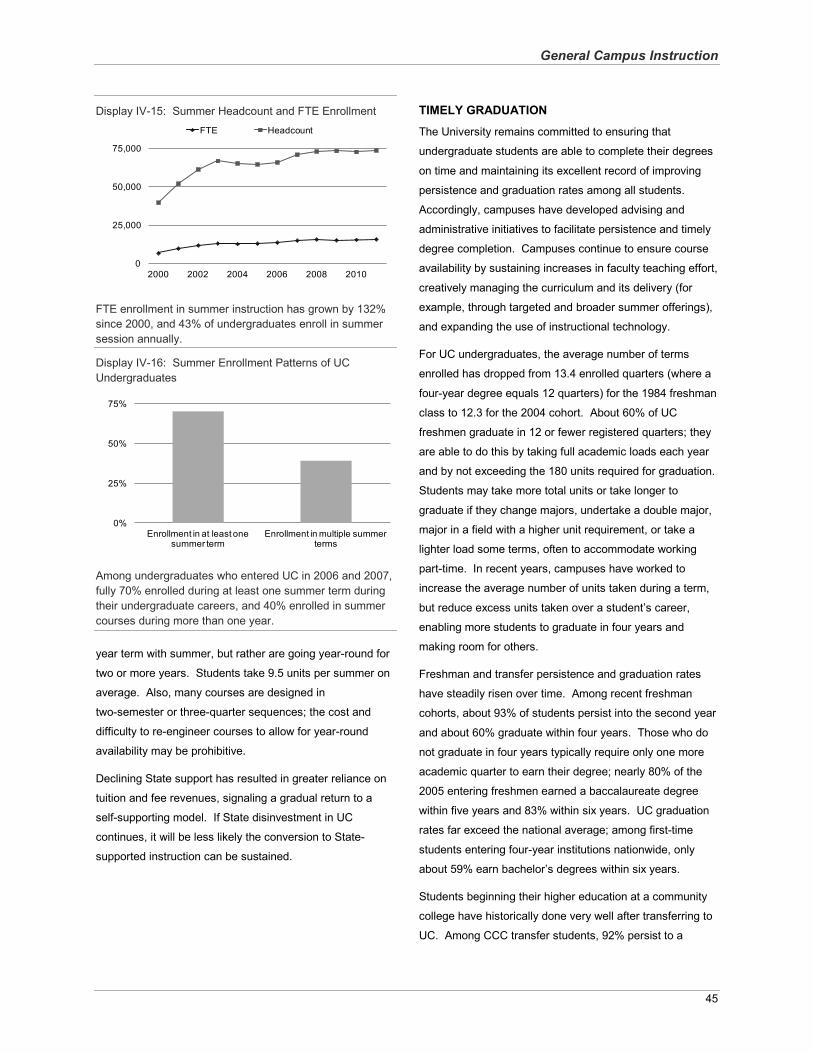
General Campus Instruction
45
Display IV-15: Summer Headcount and FTE Enrollment
FTE enrollment in summer instruction has grown by 132%since 2000, and 43% of undergraduates enroll in summer session annually.
Display IV-16: Summer Enrollment Patterns of UC Undergraduates
Among undergraduates who entered UC in 2006 and 2007,fully 70% enrolled during at least one summer term duringtheir undergraduate careers, and 40% enrolled in summer courses during more than one year.
year term with summer, but rather are going year-round for
two or more years. Students take 9.5 units per summer on
average. Also, many courses are designed in
two-semester or three-quarter sequences; the cost and
difficulty to re-engineer courses to allow for year-round
availability may be prohibitive.
Declining State support has resulted in greater reliance on
tuition and fee revenues, signaling a gradual return to a
self-supporting model. If State disinvestment in UC
continues, it will be less likely the conversion to State-
supported instruction can be sustained.
TIMELY GRADUATION
The University remains committed to ensuring that
undergraduate students are able to complete their degrees
on time and maintaining its excellent record of improving
persistence and graduation rates among all students.
Accordingly, campuses have developed advising and
administrative initiatives to facilitate persistence and timely
degree completion. Campuses continue to ensure course
availability by sustaining increases in faculty teaching effort,
creatively managing the curriculum and its delivery (for
example, through targeted and broader summer offerings),
and expanding the use of instructional technology.
For UC undergraduates, the average number of terms
enrolled has dropped from 13.4 enrolled quarters (where a
four-year degree equals 12 quarters) for the 1984 freshman
class to 12.3 for the 2004 cohort. About 60% of UC
freshmen graduate in 12 or fewer registered quarters; they
are able to do this by taking full academic loads each year
and by not exceeding the 180 units required for graduation.
Students may take more total units or take longer to
graduate if they change majors, undertake a double major,
major in a field with a higher unit requirement, or take a
lighter load some terms, often to accommodate working
part-time. In recent years, campuses have worked to
increase the average number of units taken during a term,
but reduce excess units taken over a student’s career,
enabling more students to graduate in four years and
making room for others.
Freshman and transfer persistence and graduation rates
have steadily risen over time. Among recent freshman
cohorts, about 93% of students persist into the second year
and about 60% graduate within four years. Those who do
not graduate in four years typically require only one more
academic quarter to earn their degree; nearly 80% of the
2005 entering freshmen earned a baccalaureate degree
within five years and 83% within six years. UC graduation
rates far exceed the national average; among first-time
students entering four-year institutions nationwide, only
about 59% earn bachelor’s degrees within six years.
Students beginning their higher education at a community
college have historically done very well after transferring to
UC. Among CCC transfer students, 92% persist to a
0
25,000
50,000
75,000
2000 2002 2004 2006 2008 2010
FTE Headcount
0%
25%
50%
75%
Enrollment in at least one summer term
Enrollment in multiple summer terms
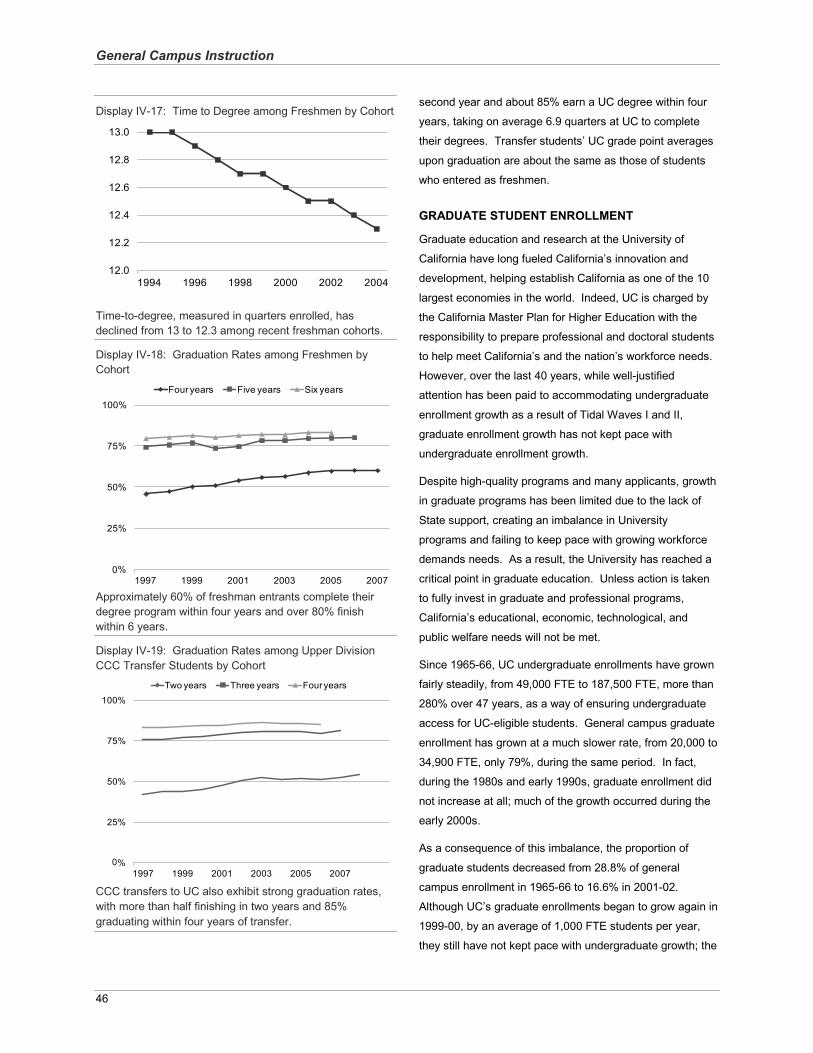
General Campus Instruction
46
Display IV-17: Time to Degree among Freshmen by Cohort
Time-to-degree, measured in quarters enrolled, hasdeclined from 13 to 12.3 among recent freshman cohorts.
Display IV-18: Graduation Rates among Freshmen by Cohort
Approximately 60% of freshman entrants complete their degree program within four years and over 80% finish within 6 years.
Display IV-19: Graduation Rates among Upper Division CCC Transfer Students by Cohort
CCC transfers to UC also exhibit strong graduation rates, with more than half finishing in two years and 85%graduating within four years of transfer.
second year and about 85% earn a UC degree within four
years, taking on average 6.9 quarters at UC to complete
their degrees. Transfer students’ UC grade point averages
upon graduation are about the same as those of students
who entered as freshmen.
GRADUATE STUDENT ENROLLMENT
Graduate education and research at the University of
California have long fueled California’s innovation and
development, helping establish California as one of the 10
largest economies in the world. Indeed, UC is charged by
the California Master Plan for Higher Education with the
responsibility to prepare professional and doctoral students
to help meet California’s and the nation’s workforce needs.
However, over the last 40 years, while well-justified
attention has been paid to accommodating undergraduate
enrollment growth as a result of Tidal Waves I and II,
graduate enrollment growth has not kept pace with
undergraduate enrollment growth.
Despite high-quality programs and many applicants, growth
in graduate programs has been limited due to the lack of
State support, creating an imbalance in University
programs and failing to keep pace with growing workforce
demands needs. As a result, the University has reached a
critical point in graduate education. Unless action is taken
to fully invest in graduate and professional programs,
California’s educational, economic, technological, and
public welfare needs will not be met.
Since 1965-66, UC undergraduate enrollments have grown
fairly steadily, from 49,000 FTE to 187,500 FTE, more than
280% over 47 years, as a way of ensuring undergraduate
access for UC-eligible students. General campus graduate
enrollment has grown at a much slower rate, from 20,000 to
34,900 FTE, only 79%, during the same period. In fact,
during the 1980s and early 1990s, graduate enrollment did
not increase at all; much of the growth occurred during the
early 2000s.
As a consequence of this imbalance, the proportion of
graduate students decreased from 28.8% of general
campus enrollment in 1965-66 to 16.6% in 2001-02.
Although UC’s graduate enrollments began to grow again in
1999-00, by an average of 1,000 FTE students per year,
they still have not kept pace with undergraduate growth; the
12.0
12.2
12.4
12.6
12.8
13.0
1994 1996 1998 2000 2002 2004
%
25%
50%
75%
100%
1997 1999 2001 2003 2005 2007
Four years Five years Six years
0
%
25%
50%
75%
100%
1997 1999 2001 2003 2005 2007
Two years Three years Four years
0
General Campus Instruction
47
proportion of general campus graduate students has
dropped to 15.7% in 2011-12. Graduate enrollments were
expected to continue to grow along with undergraduate
enrollments over the next several years. Because numbers
of high school graduates will stabilize, UC was expecting
increases in the proportion of graduate students during the
next decade, as indicated in the University’s March 2008
long-range enrollment projections.
The graduate student percentage of total enrollment has
remained essentially flat in recent years. From Fall 2003 to
Fall 2010, enrollments of graduate academic and
professional students (including health sciences and self-
supporting enrollments) have averaged about 22% of total
UC enrollment each year, while during that same period,
among other American Association of Universities (AAU)
institutions, approximately 33% of public and roughly 61%
of private enrollments were graduate students. UC’s total
graduate percentage is lower than the percentages at all of
UC’s eight comparators.
UC has fallen behind in graduate enrollments for several
reasons. Because of State budget constraints in the 1980s
and 1990s, graduate growth was held down to ensure
access to all eligible undergraduates who chose to attend
UC. But graduate enrollment growth has also been slowed,
in many cases, by the inability of graduate students or
departments to secure adequate and competitive student
financial support. Dramatic increases in student fees in
recent years have exacerbated these problems.
Graduate enrollments in high quality UC programs are
critical to the state’s economic vitality, as well as its social
and cultural development. In addition, UC graduate
students play a vital role as future faculty in higher
education in California, and serve a key function in
enhancing the quality of the instructional and research
enterprise while enrolled at UC.
Graduate Education and the State’s Economy
UC graduate education and research have a long history of
fueling economic development in California. UC graduate
education and research spawned the biotechnology
industry, and UC graduates have been drivers in the
development of the electronics industry, particularly
in communications and semiconductors.
UC graduate programs directly contribute to California’s
R&D-intensive industry sectors by supplying highly trained
alumni and attracting industry to California. Companies in
knowledge-based industries tend to form clusters around
major universities to take advantage of access to the pool
of specialized workers and to benefit from knowledge
transfers from the concentration of research, innovation,
and specialization.
In the future, California’s economy will depend even more
on high-tech industries. Stem cell research, environmental
research and innovation, global health care delivery, and
energy research will have significant impacts on the health
and economy of California and the world.
In the coming years, all sectors of California’s economy will
need many more highly-educated workers — engineers,
scientists, business entrepreneurs, and others whose
innovations will drive California’s prosperity. In keeping
with its charge under the Master Plan, the University will
play a key role in helping to meet the need for these
technically and analytically sophisticated workers. As the
state’s economy continues to shift toward jobs requiring
advanced education, California will need to fill more than a
million new positions requiring graduate degrees by 2025, a
68% increase from 2005. In addition, the looming
retirement of highly educated workers in the large baby-
boom generation and the declining in-migration of educated
workers from other states and nations create significant
challenges for California’s economy. Growth in UC
graduate programs would help meet the need for more
science and technology professionals. UC’s contribution
toward fulfilling the state’s need for intellectual resources is
not limited to science, engineering, and health care.
In addition to the needs of a technologically-based
economy, California and the nation face many social
challenges that require highly-educated individuals to
analyze and solve problems as they shape California’s
future. UC graduate programs in the arts, humanities,
social sciences, and professional fields continue to serve
these needs.
Notwithstanding the current economic climate, professional and managerial jobs are California’s fastest growth occupations, creating thousands of jobs for financial managers, marketing executives, computer scientists, engineers, consultants, and many other
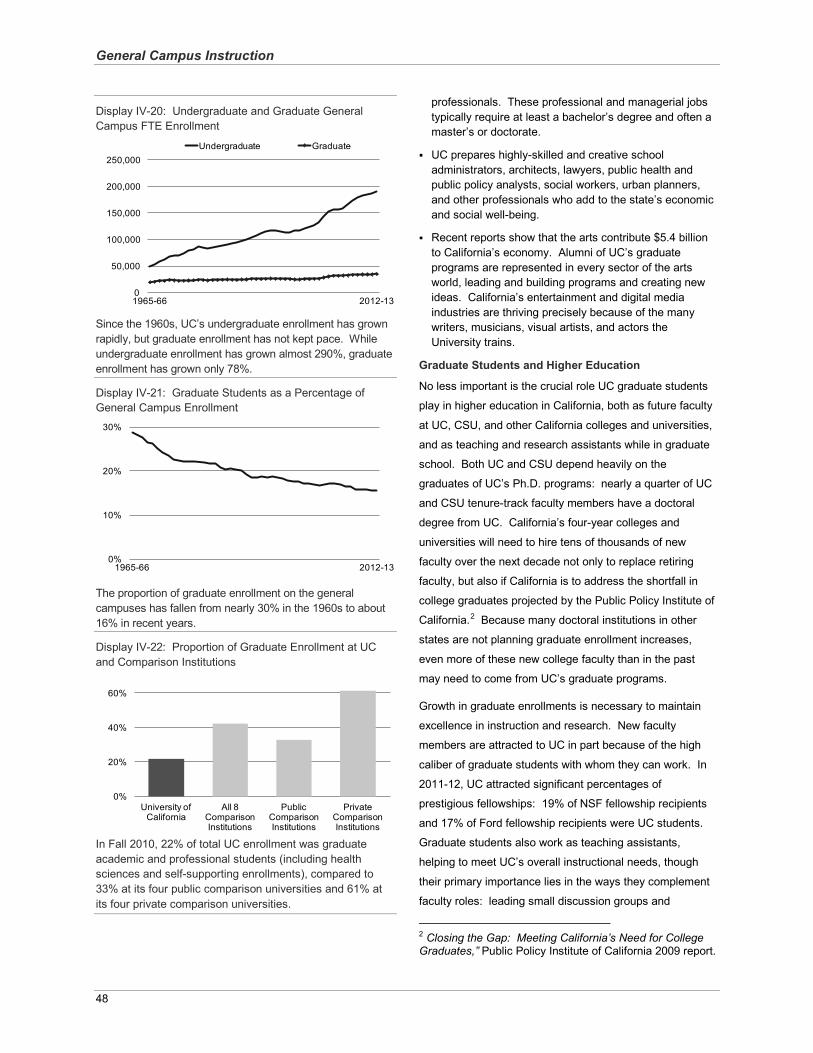
General Campus Instruction
48
Display IV-20: Undergraduate and Graduate GeneralCampus FTE Enrollment
Since the 1960s, UC’s undergraduate enrollment has grown rapidly, but graduate enrollment has not kept pace. While undergraduate enrollment has grown almost 290%, graduate enrollment has grown only 78%.
Display IV-21: Graduate Students as a Percentage of General Campus Enrollment
The proportion of graduate enrollment on the general campuses has fallen from nearly 30% in the 1960s to about 16% in recent years.
Display IV-22: Proportion of Graduate Enrollment at UC and Comparison Institutions
In Fall 2010, 22% of total UC enrollment was graduateacademic and professional students (including health sciences and self-supporting enrollments), compared to 33% at its four public comparison universities and 61% at its four private comparison universities.
professionals. These professional and managerial jobs typically require at least a bachelor’s degree and often a master’s or doctorate.
UC prepares highly-skilled and creative school administrators, architects, lawyers, public health and public policy analysts, social workers, urban planners,and other professionals who add to the state’s economic and social well-being.
Recent reports show that the arts contribute $5.4 billion to California’s economy. Alumni of UC’s graduate programs are represented in every sector of the arts world, leading and building programs and creating new ideas. California’s entertainment and digital media industries are thriving precisely because of the many writers, musicians, visual artists, and actors the University trains.
Graduate Students and Higher Education
No less important is the crucial role UC graduate students
play in higher education in California, both as future faculty
at UC, CSU, and other California colleges and universities,
and as teaching and research assistants while in graduate
school. Both UC and CSU depend heavily on the
graduates of UC’s Ph.D. programs: nearly a quarter of UC
and CSU tenure-track faculty members have a doctoral
degree from UC. California’s four-year colleges and
universities will need to hire tens of thousands of new
faculty over the next decade not only to replace retiring
faculty, but also if California is to address the shortfall in
college graduates projected by the Public Policy Institute of
California.2 Because many doctoral institutions in other
states are not planning graduate enrollment increases,
even more of these new college faculty than in the past
may need to come from UC’s graduate programs.
Growth in graduate enrollments is necessary to maintain
excellence in instruction and research. New faculty
members are attracted to UC in part because of the high
caliber of graduate students with whom they can work. In
2011-12, UC attracted significant percentages of
prestigious fellowships: 19% of NSF fellowship recipients
and 17% of Ford fellowship recipients were UC students.
Graduate students also work as teaching assistants,
helping to meet UC’s overall instructional needs, though
their primary importance lies in the ways they complement
faculty roles: leading small discussion groups and
2 Closing the Gap: Meeting California’s Need for College Graduates,” Public Policy Institute of California 2009 report.
0
50,000
100,000
150,000
200,000
250,000
1965-66 2012-13
Undergraduate Graduate
0%
10%
20%
30%
1965-66 2012-13
0%
20%
40%
60%
University of California
All 8 Comparison Institutions
Public Comparison Institutions
Private Comparison Institutions
General Campus Instruction
49
laboratory sections, offering a wider range of perspectives
and teaching delivery modes, and serving as mentors for
undergraduates.
Graduate students are vital to UC’s discovery and
innovation enterprise. Especially in the sciences and
engineering, the research process entails teamwork, and
graduate student researchers, as key members of these
teams, have been central to the creative breakthroughs that
have made UC one of the world’s greatest universities.
Graduate students further amplify UC’s research
contributions by supervising and mentoring undergraduates
engaged in research projects, thus enabling greater
involvement of undergraduates in primary research
activities.
In the 21st century, access to an undergraduate education
is no longer sufficient in all cases. While recent increases
in undergraduate enrollments have served to provide
access for Tidal Wave II, many members of this second
wave will seek to further their education beyond the
baccalaureate level in the coming years. Following the
extraordinary growth of high school graduates during the
last decade, California’s 25-34 year-old population will grow
17% between 2010 and 2020. As a result, demand for
graduate education will increase substantially, particularly
from the University’s own baccalaureate graduates — 46%
of UC undergraduates state a desire to earn a graduate or
professional degree. The University has an obligation to
provide all Californians with the opportunity to achieve at
the highest levels. UC must be particularly vigilant about
access to graduate education for historically
underrepresented groups, including individuals from
disadvantaged socioeconomic backgrounds. Within the
next 10 to 15 years, underrepresented minorities will be the
majority of California’s population. For California to meet its
growing workforce needs and to maximize the potential of
so much unrealized talent within the state, UC must engage
and help equip the emerging majority to pursue graduate
study.
Graduate student support is a key factor in enrolling
additional graduate students. The Student Financial Aid
chapter of this document and Budget Summary discuss
graduate student support in further detail.
UC ONLINE
The University has been offering online instruction for many
years. Not only have thousands of courses included at
least some element of instruction materials that were
delivered online, the University also has substantial
experience with fully online courses. Currently, the
University offers thousands of such courses, mostly through
its master’s degree and extension programs.
Building upon UC’s track record in this arena, the University
launched the Online Instruction Pilot Project in 2010. The
pilot project is a research-based effort to establish how
students at a highly selective public research university
learn most effectively in an online setting and which
technological tools are most helpful to them during the
learning process.
Based in part on the recommendation of the UC
Commission on the Future, initial plans for the Online
Instruction Pilot Project were presented to the Regents in
July 2010.
During 2011, selected faculty, instructional designers, and
other staff began developing courses and the pilot project
finalized evaluation and assessment frameworks. The first
online course launched in January 2012. Five more
courses followed in April 2012, and additional courses will
be released each term until approximately 35 courses will
have been taught by the end of August 2013. The
evaluation team will submit a preliminary report in Fall 2012
and a final pilot project evaluation report is expected in
Summer 2013.
In 2012-13, the project will begin offering some courses to
non-matriculated students. This new service will mark the
transition of the pilot project into the UC Online program.
UC Online will be a self-supporting program that will deliver
high-enrollment, lower division gateway courses online to
UC and non-UC students for UC credit. This program is the
University’s systemwide effort to contribute to high-quality
online course instruction and establish UC as a leader in
online innovation. UC Online will serve three
constituencies:
UC students, for whom UC Online enhances choice, alleviates overcrowding in high-demand courses, and improves time to degree;
General Campus Instruction
50
UC faculty, for whom UC Online enables innovation, supports new forms of scholarly communication, and drives new revenue into academic departments; and
Non-UC students, for whom UC Online broadens access to high-quality education designed by world-class faculty.
In contrast to many other online programs offered by
prominent academic institutions, UC Online offers non-
matriculated students the opportunity to take real UC
courses (reviewed and approved by the UC Academic
Senate), designed by UC faculty and taught by UC
instructors to UC students for UC credit. Their fees provide
the revenue that sustains the program.
During 2012-13, UC Online staff will engage with campus
and faculty groups to identify the financial, data, and policy
solutions that will facilitate cross-campus enrollments. The
goal is to pilot these solutions in 2013-14, allowing UC
students to easily enroll in online courses at any UC
campus, further enhancing student access to courses and
improving time to degree. If successful, cross-campus
enrollment solutions will not only benefit students enrolling
in UC Online courses, but also other academic programs
such as Education Abroad, UCDC,UC Sacramento Center,
and Summer Sessions.
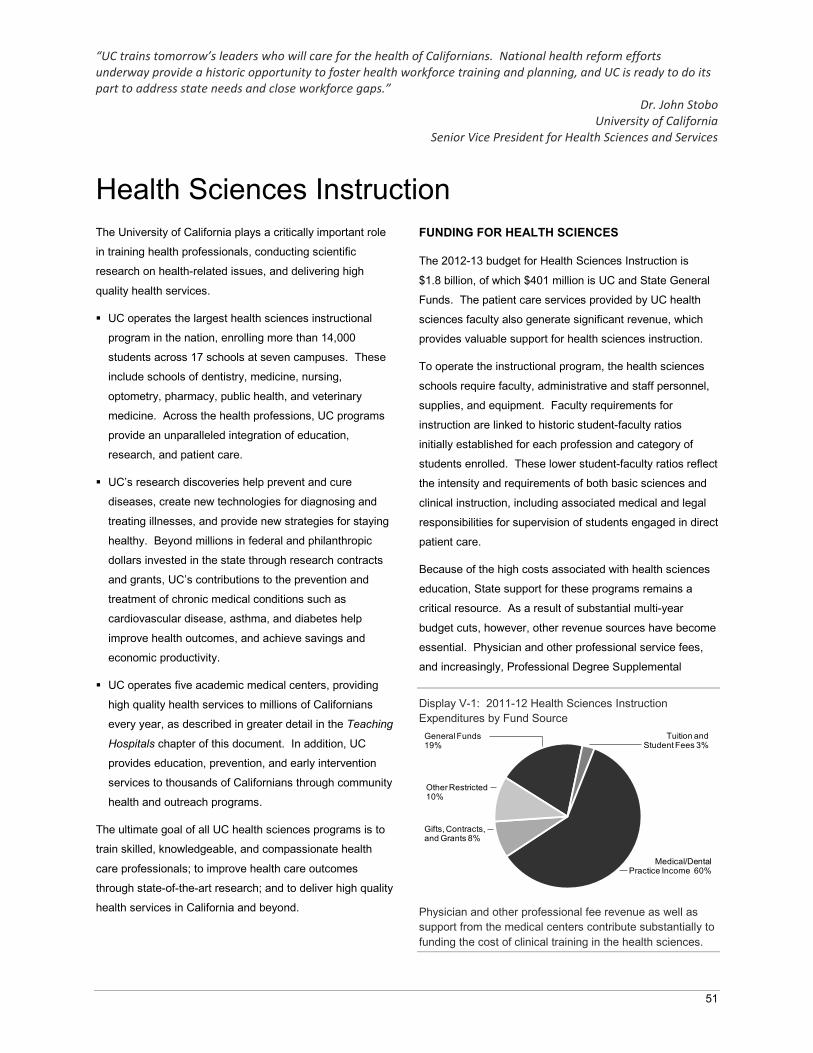
“UC trains tomorrow’s leaders who will care for the health of Californians. National health reform efforts underway provide a historic opportunity to foster health workforce training and planning, and UC is ready to do its part to address state needs and close workforce gaps.”
Dr. John Stobo University of California
Senior Vice President for Health Sciences and Services
51
Health Sciences InstructionThe University of California plays a critically important role
in training health professionals, conducting scientific
research on health-related issues, and delivering high
quality health services.
UC operates the largest health sciences instructional
program in the nation, enrolling more than 14,000
students across 17 schools at seven campuses. These
include schools of dentistry, medicine, nursing,
optometry, pharmacy, public health, and veterinary
medicine. Across the health professions, UC programs
provide an unparalleled integration of education,
research, and patient care.
UC’s research discoveries help prevent and cure
diseases, create new technologies for diagnosing and
treating illnesses, and provide new strategies for staying
healthy. Beyond millions in federal and philanthropic
dollars invested in the state through research contracts
and grants, UC’s contributions to the prevention and
treatment of chronic medical conditions such as
cardiovascular disease, asthma, and diabetes help
improve health outcomes, and achieve savings and
economic productivity.
UC operates five academic medical centers, providing
high quality health services to millions of Californians
every year, as described in greater detail in the Teaching
Hospitals chapter of this document. In addition, UC
provides education, prevention, and early intervention
services to thousands of Californians through community
health and outreach programs.
The ultimate goal of all UC health sciences programs is to
train skilled, knowledgeable, and compassionate health
care professionals; to improve health care outcomes
through state-of-the-art research; and to deliver high quality
health services in California and beyond.
FUNDING FOR HEALTH SCIENCES
The 2012-13 budget for Health Sciences Instruction is
$1.8 billion, of which $401 million is UC and State General
Funds. The patient care services provided by UC health
sciences faculty also generate significant revenue, which
provides valuable support for health sciences instruction.
To operate the instructional program, the health sciences
schools require faculty, administrative and staff personnel,
supplies, and equipment. Faculty requirements for
instruction are linked to historic student-faculty ratios
initially established for each profession and category of
students enrolled. These lower student-faculty ratios reflect
the intensity and requirements of both basic sciences and
clinical instruction, including associated medical and legal
responsibilities for supervision of students engaged in direct
patient care.
Because of the high costs associated with health sciences
education, State support for these programs remains a
critical resource. As a result of substantial multi-year
budget cuts, however, other revenue sources have become
essential. Physician and other professional service fees,
and increasingly, Professional Degree Supplemental
Display V-1: 2011-12 Health Sciences Instruction Expenditures by Fund Source
Physician and other professional fee revenue as well as support from the medical centers contribute substantially to funding the cost of clinical training in the health sciences.
Gifts, Contracts,and Grants 8%
Other Restricted 10%
Medical/Dental Practice Income 60%
General Funds 19%
Tuition and Student Fees 3%
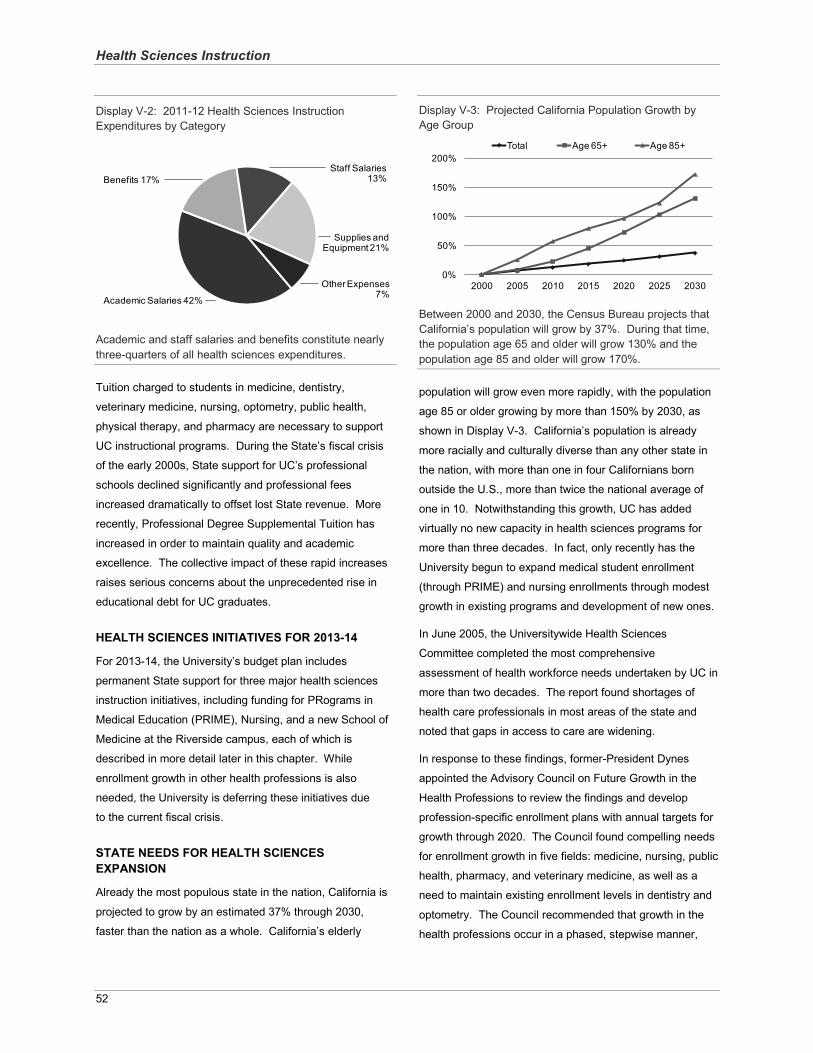
Health Sciences Instruction
52
Display V-2: 2011-12 Health Sciences Instruction Expenditures by Category
Academic and staff salaries and benefits constitute nearlythree-quarters of all health sciences expenditures.
Tuition charged to students in medicine, dentistry,
veterinary medicine, nursing, optometry, public health,
physical therapy, and pharmacy are necessary to support
UC instructional programs. During the State’s fiscal crisis
of the early 2000s, State support for UC’s professional
schools declined significantly and professional fees
increased dramatically to offset lost State revenue. More
recently, Professional Degree Supplemental Tuition has
increased in order to maintain quality and academic
excellence. The collective impact of these rapid increases
raises serious concerns about the unprecedented rise in
educational debt for UC graduates.
HEALTH SCIENCES INITIATIVES FOR 2013-14
For 2013-14, the University’s budget plan includes
permanent State support for three major health sciences
instruction initiatives, including funding for PRograms in
Medical Education (PRIME), Nursing, and a new School of
Medicine at the Riverside campus, each of which is
described in more detail later in this chapter. While
enrollment growth in other health professions is also
needed, the University is deferring these initiatives due
to the current fiscal crisis.
STATE NEEDS FOR HEALTH SCIENCES EXPANSION
Already the most populous state in the nation, California is
projected to grow by an estimated 37% through 2030,
faster than the nation as a whole. California’s elderly
Display V-3: Projected California Population Growth by Age Group
Between 2000 and 2030, the Census Bureau projects that California’s population will grow by 37%. During that time, the population age 65 and older will grow 130% and the population age 85 and older will grow 170%.
population will grow even more rapidly, with the population
age 85 or older growing by more than 150% by 2030, as
shown in Display V-3. California’s population is already
more racially and culturally diverse than any other state in
the nation, with more than one in four Californians born
outside the U.S., more than twice the national average of
one in 10. Notwithstanding this growth, UC has added
virtually no new capacity in health sciences programs for
more than three decades. In fact, only recently has the
University begun to expand medical student enrollment
(through PRIME) and nursing enrollments through modest
growth in existing programs and development of new ones.
In June 2005, the Universitywide Health Sciences
Committee completed the most comprehensive
assessment of health workforce needs undertaken by UC in
more than two decades. The report found shortages of
health care professionals in most areas of the state and
noted that gaps in access to care are widening.
In response to these findings, former-President Dynes
appointed the Advisory Council on Future Growth in the
Health Professions to review the findings and develop
profession-specific enrollment plans with annual targets for
growth through 2020. The Council found compelling needs
for enrollment growth in five fields: medicine, nursing, public
health, pharmacy, and veterinary medicine, as well as a
need to maintain existing enrollment levels in dentistry and
optometry. The Council recommended that growth in the
health professions occur in a phased, stepwise manner,
Academic Salaries 42%
Staff Salaries 13%
Other Expenses 7%
Benefits 17%
Supplies and Equipment 21%
0%
50%
100%
150%
200%
2000 2005 2010 2015 2020 2025 2030
Total Age 65+ Age 85+
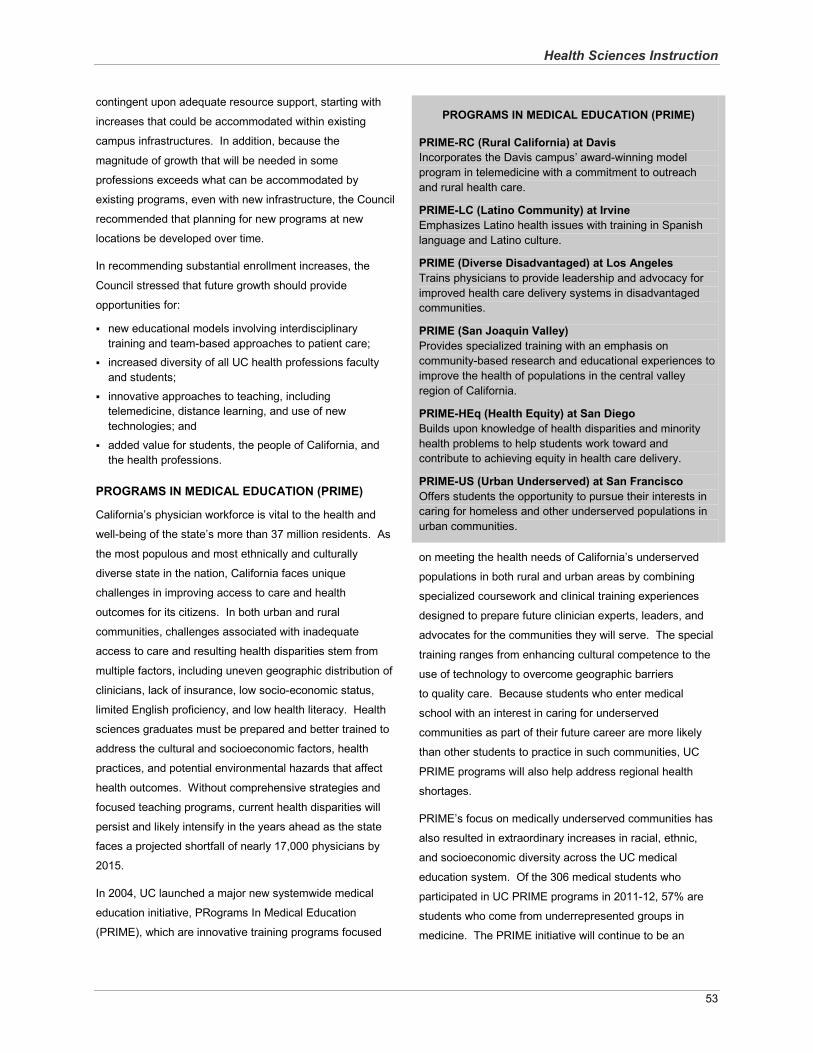
Health Sciences Instruction
53
contingent upon adequate resource support, starting with
increases that could be accommodated within existing
campus infrastructures. In addition, because the
magnitude of growth that will be needed in some
professions exceeds what can be accommodated by
existing programs, even with new infrastructure, the Council
recommended that planning for new programs at new
locations be developed over time.
In recommending substantial enrollment increases, the
Council stressed that future growth should provide
opportunities for:
new educational models involving interdisciplinary training and team-based approaches to patient care;increased diversity of all UC health professions faculty and students;
innovative approaches to teaching, including telemedicine, distance learning, and use of new technologies; and
added value for students, the people of California, and the health professions.
PROGRAMS IN MEDICAL EDUCATION (PRIME)
California’s physician workforce is vital to the health and
well-being of the state’s more than 37 million residents. As
the most populous and most ethnically and culturally
diverse state in the nation, California faces unique
challenges in improving access to care and health
outcomes for its citizens. In both urban and rural
communities, challenges associated with inadequate
access to care and resulting health disparities stem from
multiple factors, including uneven geographic distribution of
clinicians, lack of insurance, low socio-economic status,
limited English proficiency, and low health literacy. Health
sciences graduates must be prepared and better trained to
address the cultural and socioeconomic factors, health
practices, and potential environmental hazards that affect
health outcomes. Without comprehensive strategies and
focused teaching programs, current health disparities will
persist and likely intensify in the years ahead as the state
faces a projected shortfall of nearly 17,000 physicians by
2015.
In 2004, UC launched a major new systemwide medical
education initiative, PRograms In Medical Education
(PRIME), which are innovative training programs focused
PROGRAMS IN MEDICAL EDUCATION (PRIME)
PRIME-RC (Rural California) at DavisIncorporates the Davis campus’ award-winning model program in telemedicine with a commitment to outreach and rural health care.
PRIME-LC (Latino Community) at IrvineEmphasizes Latino health issues with training in Spanish language and Latino culture.
PRIME (Diverse Disadvantaged) at Los AngelesTrains physicians to provide leadership and advocacy for improved health care delivery systems in disadvantaged communities.
PRIME (San Joaquin Valley)Provides specialized training with an emphasis on community-based research and educational experiences to improve the health of populations in the central valley region of California.
PRIME-HEq (Health Equity) at San DiegoBuilds upon knowledge of health disparities and minority health problems to help students work toward and contribute to achieving equity in health care delivery.
PRIME-US (Urban Underserved) at San FranciscoOffers students the opportunity to pursue their interests in caring for homeless and other underserved populations in urban communities.
on meeting the health needs of California’s underserved
populations in both rural and urban areas by combining
specialized coursework and clinical training experiences
designed to prepare future clinician experts, leaders, and
advocates for the communities they will serve. The special
training ranges from enhancing cultural competence to the
use of technology to overcome geographic barriers
to quality care. Because students who enter medical
school with an interest in caring for underserved
communities as part of their future career are more likely
than other students to practice in such communities, UC
PRIME programs will also help address regional health
shortages.
PRIME’s focus on medically underserved communities has
also resulted in extraordinary increases in racial, ethnic,
and socioeconomic diversity across the UC medical
education system. Of the 306 medical students who
participated in UC PRIME programs in 2011-12, 57% are
students who come from underrepresented groups in
medicine. The PRIME initiative will continue to be an
Health Sciences Instruction
54
important element of the University’s efforts to train more
physicians who reflect the diversity of California’s growing
population.
State funding increases for PRIME have not been provided
since 2007-08. However, in order to maintain momentum
in the development of this program, the University
temporarily redirected funds from other programs to PRIME
to support planned enrollment growth. These unfunded
enrollments will not be sustainable without permanent State
support. Although redirecting funding from core medical
student enrollments to support PRIME offers a potential
mechanism for support, this approach would undermine
much-needed efforts to address California’s physician
workforce needs by increasing the number of medical
students that UC is able to graduate.
As of 2013-14, UC will enroll 241 MD students and 61
master’s students in PRIME for whom no State support has
been received. UC’s budget plan for 2013-14 includes
$22.4 million for systemwide enrollment growth and support
of unfunded students. Full funding of unfunded PRIME
enrollments totals $6.6 million, which will be phased in over
four years beginning in 2013-14.
NURSING PROGRAM EXPANSION TO MEET STATEWIDE NEEDS
Virtually all Americans will require nursing care at some
time in their lives. The recent nursing shortage raises
serious concerns that must be addressed in California and
nationwide, especially in light of national health care reform
and the expected substantial increase in numbers of
Californians who will have health insurance.
Notwithstanding recent efforts by the former Governor’s
Nurse Education Initiative to increase the state’s capacity to
train nurses, California remains among the states with the
lowest number of registered nurses per capita (664 versus
the U.S. average of 874 per 100,000). Causes of the
nursing shortage include rapid population growth
(especially of those over age 65) and an aging nursing
workforce (half of California’s licensed nurses are age 50
and older). Current nurse staffing ratios for California
hospitals and national accreditation standards limiting the
number of hours medical residents can work have created
further demand. The recent downturn in the U.S. economy
has led to an easing of the nursing shortage in some parts
of the country as some nurses delay retirement and others
work longer hours.
Though the nursing workforce is showing signs of
stabilizing, workforce analysts caution against assuming the
nursing shortage has been fully addressed. In the future,
when the economy recovers and the unemployment rate
declines, an estimated 118,000 nurses are expected to
leave the profession by 2015, which will leave many
vacancies to fill.
To help meet the state’s future nursing needs, the
University has been expanding its focus on graduate level
nursing education, including preparation of new faculty for
nursing programs and the education and training of
advanced practice nurses. UC also operates two
undergraduate nursing programs as part of its efforts to
rebuild the pool of nurses eligible to pursue future graduate
work to become nursing faculty, as well as to allow college-
bound high school graduates interested in nursing the
opportunity to pursue such a degree at UC.
Baccalaureate Nursing. In Fall 2006, UC re-established
the Los Angeles campus’ bachelor’s degree program in
nursing and added a new undergraduate program at the
Irvine campus and Davis campus (the Davis proposal is
discussed in more detail below). In recent years, the health
care industry has seen increased demand for nurses with
bachelor’s degrees. In a 2010 statewide survey of new
nursing graduates at all degree levels, undertaken by a
coalition of six organizations, including the Los Angeles
campus, to better understand why some newly licensed
registered nurses were having difficulty finding
employment, 35% of respondents stated that they were
informed that a baccalaureate degree in nursing was
preferred or required.
Graduate Nursing. The Los Angeles and San Francisco
campuses have expanded programs for professional
nurses and nursing faculty. The Irvine campus added a
graduate program in 2009-10 and has plans to expand the
program over the next four years.
Recent Initiatives. In 2007, the Gordon and Betty Moore
Foundation (GBMF) announced $100 million in founding
support, the largest commitment ever made to a nursing
Health Sciences Instruction
55
school, to launch the Betty Irene Moore School of Nursing
at the Davis campus. The GBMF’s vision for the School of
Nursing was as a public-private partnership between the
Foundation and the State in which both would provide
funding for the new school. The campus admitted its
inaugural class of students in the master’s and doctoral
programs in Fall 2010. Although no direct State support
has yet been provided, instructional support was provided,
in part, through temporary federal Workforce Investment
Act (WIA) funds for enrollment in 2010-11. A pre-licensure
nursing program is also planned for the future. When full
enrollment is reached in all programs, the school is
projected to have a total enrollment of 456 students. The
expectation of the GBMF, as memorialized in the grant
agreement executed with the University of California, was
that as students are enrolled in the school, funding to
support those students would be provided by the State in a
manner consistent with funding provided to UC nursing
programs at other campuses. This commitment was
affirmed by the Regents in their approval of the school in
March 2009. The GBMF commitment is disbursed in multi-
year grants, and ongoing disbursements are contingent
upon the school and University meeting expected goals and
commitments, including reaching target enrollments and
securing core State funding for the school. To date,
permanent State funding for Davis nursing enrollments has
not been provided.
Workforce Investment Act. Because of a strong demand
for UC-educated nurses, the California Labor and
Workforce Development Agency presented a proposal in
which, beginning in 2009-10, approximately $12 million in
new, one-time federal Workforce Investment Act funding
provided over five years would be available to UC to train
and graduate a limited number of new California nurses.
Under this proposal, UC committed to provide matching
funds and to train and graduate nearly 350 additional
nurses across multiple degree programs. This one-time
funding was intended for a limited number of one-time
cohorts of students to complete their nursing programs.
However, notwithstanding $3 million in appropriations in the
2011-12 enacted budget for federal WIA funds (year three
of the five-year approved plan), the University was informed
in October 2011 that as a result of reductions in federal
funding to the State, UC would not receive the promised
funding for 2011-12, and that there was considerable
uncertainty regarding the availability of any future WIA
funding for the remaining two years of the formally
approved plan. This unanticipated action created a
$3 million shortfall for UC nursing programs in 2011-12.
In fact, all four UC nursing campuses had budgeted for
2011-12 WIA resources and were relying on this funding to
support faculty salaries and related teaching costs for
students already enrolled. This unexpected elimination of
funds created an exceptionally difficult situation as nursing
students were already admitted and enrolled in classes,
and UC was committed to educating and graduating these
students. In late April 2012, the State notified UC that
$800,000 in WIA funding was approved to use toward the
original five-year commitment. Although the University was
pleased to receive $800,000, this one-time funding still
leaves a significant shortfall for 2012-13. Campuses will
strive to better align enrollment with available resources.
If the State wants further enrollment growth in this area, it
must provide sufficient resources to support the high-quality
educational experience students expect from UC.
Funding for Nursing Programs. The University has
requested enrollment growth in nursing programs each year
since 2006-07. In 2006-07 and 2007-08, UC’s requests
were fully funded, but in the last five years, no permanent
State funding has been provided.
For 2013-14, the University’s budget plan includes
$22.4 million to support systemwide enrollment growth and
support for unfunded enrollments. To permanently fund
150 unfunded baccalaureate level nurses, provide funding
for years four and five of the agreement between UC and
the State’s Labor Agency (for WIA), and to provide funding
for 136 graduate-level nurses would total $6.9 million,
which will be phased in over four years. Core permanent
funds are needed to support enrolled students, and to
sustain planned growth at newly developed nursing
programs at the Irvine and Davis campuses.
PLANNING AND PROGRESS TOWARD A NEW UC RIVERSIDE MEDICAL SCHOOL
The need to address physician workforce shortages by
training increased numbers of physicians is well
Health Sciences Instruction
56
recognized. Specific regions within California – in particular
the rapidly growing Inland Empire of Southern California –
are already experiencing a health care crisis due to a
shortage of physicians, nurses, and allied health
professionals, a crisis that will worsen without expanded
medical education. UC’s health workforce study
demonstrates that even if existing medical schools were to
expand to maximum capacity, the state would still fall far
short of achieving the number of doctors needed in the
coming years. Future demand for physician services will
grow even more rapidly than anticipated when the
provisions of healthcare reform go into effect in 2014, as
described in the Teaching Hospitals chapter.
A new school of medicine at Riverside, the first new
medical school proposed to open in California in over
40 years, will help meet health care needs in the state and
region by expanding access; by educating physicians who
are likely to enter residencies and practices in the region
and state; by training a culturally competent and diverse
physician workforce; and by undertaking research that will
help improve the health of people living in the region.
Among the goals of the new School of Medicine at the
Riverside campus is transforming the way healthcare is
delivered to the community by focusing on:
improving the population’s health through proactive primary and preventive care services and effective management of chronic diseases;enhancing the patient care experience by providing conveniently located, timely, and culturally sensitive services;lowering the costs of care through such interventions as reducing variations in practice and outcome and improving efficient use of specialty care services; anddeveloping research and clinical expertise in population-based assessment of health and wellness, health interventions, healthcare disparities, and access.
In 2010-11, the State required that UC redirect $10 million
of General Funds from the existing base budget to support
start-up costs at the Riverside campus’ School of Medicine.
In 2010-11, funds were used to establish the operational
and capital infrastructure needed in advance of opening the
school, including necessary appointments of leadership and
establishing the initial clinical affiliations needed for the
educational platform. In 2011-12 and for 2012-13, the
University is also using support from the County of
Riverside, the Office of the President, the Riverside campus
and other extramural funds to continue building the
operational infrastructure, recruiting additional teaching
faculty for expanded medical student enrollments, securing
additional resources to build a diversified funding base, and
launching its clinical enterprise. It should be emphasized,
however, that an initiative of this magnitude and complexity
cannot be launched through redirection of University
resources. For 2013-14, the University is requesting that
the State provide funding to support start-up activities as
well as provide a secure base of recurring resources to
open, operate, grow, and maintain the medical school on
an ongoing basis, totaling $15 million. In October 2012, the
Liaison Committee on Medical Education (LCME), the
national accrediting authority for medical education
programs leading to the MD degree in the U.S. and
Canada, notified the Riverside campus that the School of
Medicine was granted preliminary accreditation. Specific
start-up activities that will occur during 2013-14 include
enrolling the inaugural class of 50 students in August 2013,
building more graduate medical education (residency)
programs in addition to the recently approved internal
medicine program, recruiting and appointing basic science
and clinical faculty and administrative staff necessary to
open and teach in the school, expanding the faculty
practice plan, and securing additional non-state funding.
Permanent core support from the State is essential for the
Riverside School of Medicine to move forward and develop
all facets of the UC mission: education through the
expansion of the medical student enrollment and residency
programs; research to create new basic science, clinical,
and translational knowledge; provision of clinical services to
a medically underserved region; and service by expanding
student pipeline programs.
This funding is requested on a permanent basis because
future enrollments can be adequately funded through the
normal marginal cost (plus supplemental funding for MDs)
only if the State makes an initial investment in its core
operations before the school increases enrollment. The
opening of a medical school is a major and complex
endeavor that requires start-up investment, and as such,
UC is requesting permanent core support for the new
School of Medicine at Riverside.
“Learning is a lifelong process. A UC education opens doors that never close.” Aimée Dorr
University of California Provost
57
Self-Supporting Instructional ProgramsThis chapter describes three instructional program
categories that have historically received no State support:
University Extension, Summer Session, and self-supporting
graduate degree programs. Additional information about
UC Online can be found in the General Campus Instruction
chapter of this document.
UNIVERSITY EXTENSION
University Extension is the largest continuing education
program in the nation, annually providing courses to
300,000 registrants who are typically employed adult
learners with a bachelor’s degree. UC Extension is a
self-supporting operation and its offerings are dependent
upon user demand, which varies due to many factors,
including the strength of the economy. In 2011-12,
University Extension expenditures, derived from student fee
revenue, were $222.3 million.
The University offered its first Extension courses to
students beyond the immediate campus community more
than 100 years ago. Today, Extension divisions at each of
UC’s nine general campuses offer almost 19,000 courses,
programs, seminars, conferences, and field studies
throughout California and in a number of foreign countries.
The majority of Extension programs are designed to serve
the continuing education needs of professionals. Programs
are presented through open-enrollment courses for
individuals as well as through organizational partnerships
supported by contracts and grants with public agencies,
non-profit organizations, and corporations. Certificate
programs are offered in such areas as computing and
information technology, environmental management,
graphics and digital arts, and health and behavioral
sciences.
UC Extension offers a wide variety of online courses to
students in California, across the nation, and around the
world, ranging from undergraduate courses carrying UC
academic credit to professional-level courses in subjects
such as project management, computer programming,
and technical writing. These courses extend the
instructional resources of the University to the world
community.
While Extension does not offer degrees, it provides
transferrable degree credit study and cultural enrichment
and public service programs. Various undergraduate and
graduate degree credit courses are available, either as
replicas of existing UC campus courses or structured as
undergraduate classes but with content not found in an
existing campus offering. Extension explores history,
literature, and the arts in traditional and innovative ways,
providing cultural enrichment to Californians. Extension
also organizes lecture series, summer institutes, public
affairs forums, and other events for the general public.
SUMMER SESSION
In addition to the University’s course offerings during the
regular academic year, both UC and non-UC students may
enroll in courses during the summer session on any of the
nine general campuses. Historically, the State provided
funding for UC students enrolling in the fall, winter, and
spring terms, but not summer. Through Summer 2000,
summer sessions were supported from student course and
registration fees set by each campus.
With State support, UC began converting summer
instruction for UC students from a self-supported to a
State-supported program in 2001-02 and completed the
conversion of all general campuses in 2006-07. Funding
for summer sessions was shifted to the general campus
instruction budget; however, declining State support has
resulted in greater reliance on tuition and fee revenues,
signaling a gradual return to a self-supporting model. If
State disinvestment in UC continues, it will be less likely the
conversion to State-supported instruction can be sustained.
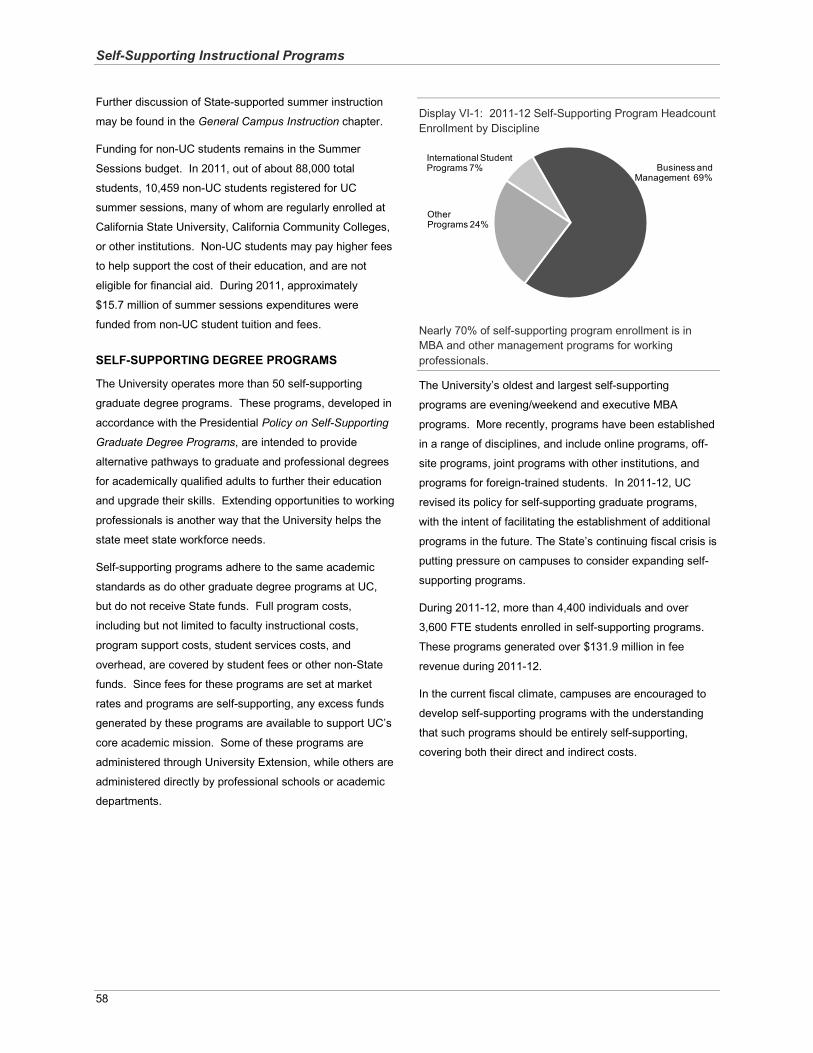
Self-Supporting Instructional Programs
58
Further discussion of State-supported summer instruction
may be found in the General Campus Instruction chapter.
Funding for non-UC students remains in the Summer
Sessions budget. In 2011, out of about 88,000 total
students, 10,459 non-UC students registered for UC
summer sessions, many of whom are regularly enrolled at
California State University, California Community Colleges,
or other institutions. Non-UC students may pay higher fees
to help support the cost of their education, and are not
eligible for financial aid. During 2011, approximately
$15.7 million of summer sessions expenditures were
funded from non-UC student tuition and fees.
SELF-SUPPORTING DEGREE PROGRAMS
The University operates more than 50 self-supporting
graduate degree programs. These programs, developed in
accordance with the Presidential Policy on Self-Supporting
Graduate Degree Programs, are intended to provide
alternative pathways to graduate and professional degrees
for academically qualified adults to further their education
and upgrade their skills. Extending opportunities to working
professionals is another way that the University helps the
state meet state workforce needs.
Self-supporting programs adhere to the same academic
standards as do other graduate degree programs at UC,
but do not receive State funds. Full program costs,
including but not limited to faculty instructional costs,
program support costs, student services costs, and
overhead, are covered by student fees or other non-State
funds. Since fees for these programs are set at market
rates and programs are self-supporting, any excess funds
generated by these programs are available to support UC’s
core academic mission. Some of these programs are
administered through University Extension, while others are
administered directly by professional schools or academic
departments.
Display VI-1: 2011-12 Self-Supporting Program Headcount Enrollment by Discipline
Nearly 70% of self-supporting program enrollment is in MBA and other management programs for working professionals.
The University’s oldest and largest self-supporting
programs are evening/weekend and executive MBA
programs. More recently, programs have been established
in a range of disciplines, and include online programs, off-
site programs, joint programs with other institutions, and
programs for foreign-trained students. In 2011-12, UC
revised its policy for self-supporting graduate programs,
with the intent of facilitating the establishment of additional
programs in the future. The State’s continuing fiscal crisis is
putting pressure on campuses to consider expanding self-
supporting programs.
During 2011-12, more than 4,400 individuals and over
3,600 FTE students enrolled in self-supporting programs.
These programs generated over $131.9 million in fee
revenue during 2011-12.
In the current fiscal climate, campuses are encouraged to
develop self-supporting programs with the understanding
that such programs should be entirely self-supporting,
covering both their direct and indirect costs.
Other Programs 24%
Business and Management 69%
International Student Programs 7%
“California’s knowledge-based economy, among the top ten in the world, owes no small part to UC’s scientists, doctors, engineers, and students.”
Steven Beckwith University of California
Vice President for Research and Graduate Studies
59
Research
The University of California is one of the leading academic
research enterprises in the world, performing about one-
twelfth of all the academic research and development
conducted in the United States. UC’s graduate students,
postdoctoral scholars, faculty, and professional research
staff are among the best in the world at finding new cures
for disease, developing technologies that produce new
industries, creating new knowledge through basic research,
and training the next generation of innovative thinkers. UC
researchers have discovered better ways to fight drought
and fire, prepare for earthquakes, reduce traffic and
greenhouse gas emissions, improve public health, and
identify sustainable sources of energy. With over
800 research centers, institutes, laboratories, and
programs, UC research tackles some of the most pressing
problems facing California and the world and creates the
knowledge that will improve lives over many decades. The
tremendous size, scope, and quality of UC’s research
enterprise are the fruits of California’s long-term planning
and investment, dating back to 1960 and the Master Plan
for Higher Education, which established UC as California’s
primary academic research institution.
This investment has resulted in new technologies, new
companies, and new industries over the last half century –
many within California. UC trains the skilled scientists,
doctors, and engineers who shape California’s knowledge
economy and support its large technology, agricultural, and
medical sectors. The State’s investment in UC has created
one of the most competitive research enterprises in the
nation, in 2011-12 securing over $7 in extramural funding
for every State research dollar invested.
UC’s research capabilities, built over many years, reflect a
long-term investment that has done well even during times
of economic difficulty. These capabilities are now
threatened because of the sustained State disinvestment in
higher education over the past two decades combined with
increasing competition for the best faculty and graduate
students from other universities throughout the world. UC’s
faculty have been extraordinarily successful at attracting
federal and private funds to the state. These funds will
disappear if the faculty are lured away by institutions with
more reliable financial structures, or if the faculty’s teaching
and mentoring responsibilities become so demanding that
they cannot devote adequate time to their research
activities. Reinvestment in UC’s faculty and research
infrastructure is critical to sustain the research enterprise at
UC and its beneficial impact on the state’s economy.
THE IMPORTANCE OF STATE INVESTMENT IN THE RESEARCH ENTERPRISE
UC’s world-class research enterprise requires the best
faculty and graduate students, state-of-the-art equipment
and supplies, and well-maintained facilities in which to
conduct research. State funds are the basis for UC’s
research success and are essential to its sustainability and
continued excellence. Not only do State funds support a
large portion of the salaries paid to faculty during the
academic year, they also provide start-up money to
purchase equipment, staff laboratories, support graduate
student research assistants needed to bring new ideas to
fruition, and maintain facilities to conduct cutting-edge
research.
As principal investigators on research grants, UC faculty
attracted $4.4 billion total in research awards in 2011-12,
averaging $600,000 per principal investigator. The
University’s success in attracting extramural funds to
California has been a critical element in the state’s
economic prosperity, a success jeopardized by the
declining State investment in UC.
Underpinning the UC research enterprise are exceptional
graduate students, postdoctoral scholars, professional
researchers, and specialists supported by State funds.
Research
60
Each year, UC trains more than 13,000 graduate student
researchers and employs or hosts nearly 6,650
postdoctoral scholars, exclusive of health science interns
and residents. Funding for graduate enrollment growth
helps expand the pool of individuals who engage in and
support research programs.
UC enables the success of its researchers by providing
very high quality research facilities, many of which were
financed using California state bonds. State funding
provided the core support to build the four California
Institutes for Science and Innovation, which are world-class
centers of research excellence in telecommunications,
quantitative biosciences, nanotechnology, and advanced
electronics, some of the most promising new areas of
growth for high-tech industries. The Institutes hold the
promise of keeping California industry at the forefront as
new technologies emerge. The California Institute of
Regenerative Medicine (CIRM) created a state bond-
funded award mechanism to make California a world leader
in stem cell research, one of the most promising new ways
to cure disease. To date, CIRM has awarded UC
$513 million in research and facility grants. These are only
two examples of how investment in UC research is
expected to help the California economy recover and
improve the lives of its citizens.
Unfortunately, State support for the University and its
research programs is declining at a time when global
competition is increasing, raising concerns about
California’s ability to maintain its competitive edge. The
cost of conducting cutting-edge research in science and
engineering is growing, and much of the research
connected to economic competitiveness requires large
interdisciplinary teams. Research depends increasingly on
modern infrastructure. In addition, the costs of compliance
with extramural contract and grant requirements have risen
rapidly as the federal government has added new
regulations, yet core support for the University’s research
staff and infrastructure has not kept pace with the amount
of extramurally funded research.
RESEARCH ENTERPRISE FUNDING
Direct research expenditures (contrasted with awards as
discussed in the previous section) totaled $4.5 billion in
Display VII-1: 2011-12 Direct Research Expenditures by Fund Source
Nearly 75% of research funding is derived from federal agencies and private sources.
2011-12, an increase of 2% over the prior year.1 Federal,
State, and private sources are major providers of UC
research funding. Federal funds are the University’s single
largest source of support for research, accounting for 50%
of all University research expenditures in 2011-12. Display
VII-1 shows actual research expenditures by fund source
for 2011-12, and Display VII-2 presents growth over time
among the major providers. Display VII-3 presents trend
data about research expenditures in the various disciplines.
Federal Funds
UC is a leader among universities receiving research
awards. The University was awarded $2.8 billion in federal
research funding alone in 2011-12. Awards from the
National Institutes of Health (NIH) and National Science
Foundation (NSF) accounted for nearly 80% of the
University’s federal research funding. Other agencies that
figure prominently in awards to UC are the Department of
Defense (DOD), National Aeronautics and Space
Administration (NASA), and Department of Energy (DOE).
During 2011-12, UC researchers competed successfully to
win nearly 6% and 8% of the NIH and NSF budgets,
respectively, accounting for over $2.2 billion in federal
research dollars for California. Display VII-4 shows the
distribution of federal research awards by agency. Federal
funds are nearly all targeted at research in STEM (Science,
Technology, Engineering and Mathematics) and medical
fields (about 93% of the total each year during the past
1 This rate of growth differs from the rate of growth in extramural awards noted earlier, reflecting the multi-year nature of research grant awards.
State & UC General Funds 11%
Federal Contracts & Grants 50%
Private Gifts& Grants 24%
Endowment Earnings 3%
Other 12%
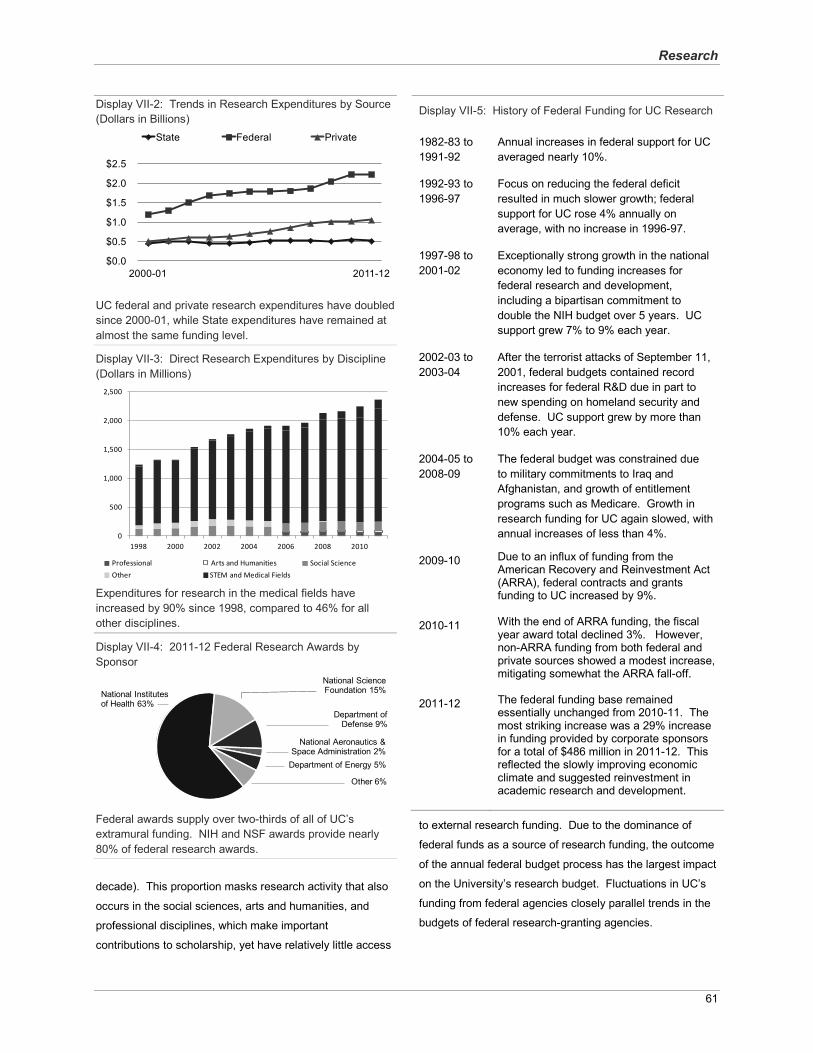
Research
61
Display VII-2: Trends in Research Expenditures by Source (Dollars in Billions)
UC federal and private research expenditures have doubledsince 2000-01, while State expenditures have remained at almost the same funding level.
Display VII-3: Direct Research Expenditures by Discipline (Dollars in Millions)
Expenditures for research in the medical fields have increased by 90% since 1998, compared to 46% for all other disciplines.
Display VII-4: 2011-12 Federal Research Awards by Sponsor
Federal awards supply over two-thirds of all of UC’s extramural funding. NIH and NSF awards provide nearly 80% of federal research awards.
decade). This proportion masks research activity that also
occurs in the social sciences, arts and humanities, and
professional disciplines, which make important
contributions to scholarship, yet have relatively little access
Display VII-5: History of Federal Funding for UC Research
1982-83 to1991-92
Annual increases in federal support for UC averaged nearly 10%.
1992-93 to 1996-97
Focus on reducing the federal deficit resulted in much slower growth; federal support for UC rose 4% annually on average, with no increase in 1996-97.
1997-98 to2001-02
Exceptionally strong growth in the national economy led to funding increases for federal research and development, including a bipartisan commitment to double the NIH budget over 5 years. UC support grew 7% to 9% each year.
2002-03 to 2003-04
After the terrorist attacks of September 11, 2001, federal budgets contained record increases for federal R&D due in part to new spending on homeland security and defense. UC support grew by more than 10% each year.
2004-05 to 2008-09
The federal budget was constrained due to military commitments to Iraq and Afghanistan, and growth of entitlement programs such as Medicare. Growth in research funding for UC again slowed, with annual increases of less than 4%.
2009-10 Due to an influx of funding from the American Recovery and Reinvestment Act (ARRA), federal contracts and grants funding to UC increased by 9%.
2010-11 With the end of ARRA funding, the fiscal year award total declined 3%. However, non-ARRA funding from both federal and private sources showed a modest increase, mitigating somewhat the ARRA fall-off.
2011-12 The federal funding base remainedessentially unchanged from 2010-11. The most striking increase was a 29% increasein funding provided by corporate sponsors for a total of $486 million in 2011-12. This reflected the slowly improving economic climate and suggested reinvestment in academic research and development.
to external research funding. Due to the dominance of
federal funds as a source of research funding, the outcome
of the annual federal budget process has the largest impact
on the University’s research budget. Fluctuations in UC’s
funding from federal agencies closely parallel trends in the
budgets of federal research-granting agencies.
$0.0
$0.5
$1.0
$1.5
$2.0
$2.5
2000-01 2011-12
State Federal Private
0
500
1,000
1,500
2,000
2,500
1998 2000 2002 2004 2006 2008 2010
Professional Arts and Humanities Social Science
Other STEM and Medical Fields
National Aeronautics &Space Administration 2%
Department of Defense 9%
National Science Foundation 15%National Institutes
of Health 63%
Other 6%
Department of Energy 5%
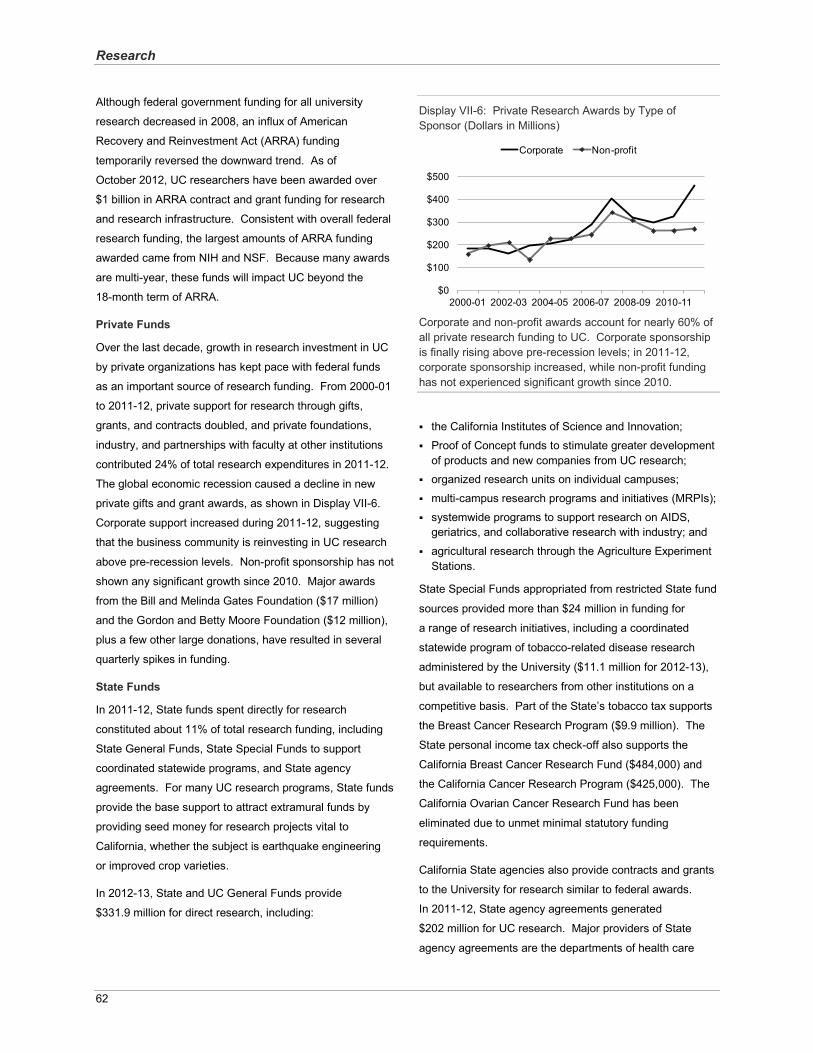
Research
62
Although federal government funding for all university
research decreased in 2008, an influx of American
Recovery and Reinvestment Act (ARRA) funding
temporarily reversed the downward trend. As of
October 2012, UC researchers have been awarded over
$1 billion in ARRA contract and grant funding for research
and research infrastructure. Consistent with overall federal
research funding, the largest amounts of ARRA funding
awarded came from NIH and NSF. Because many awards
are multi-year, these funds will impact UC beyond the
18-month term of ARRA.
Private Funds
Over the last decade, growth in research investment in UC
by private organizations has kept pace with federal funds
as an important source of research funding. From 2000-01
to 2011-12, private support for research through gifts,
grants, and contracts doubled, and private foundations,
industry, and partnerships with faculty at other institutions
contributed 24% of total research expenditures in 2011-12.
The global economic recession caused a decline in new
private gifts and grant awards, as shown in Display VII-6.
Corporate support increased during 2011-12, suggesting
that the business community is reinvesting in UC research
above pre-recession levels. Non-profit sponsorship has not
shown any significant growth since 2010. Major awards
from the Bill and Melinda Gates Foundation ($17 million)
and the Gordon and Betty Moore Foundation ($12 million),
plus a few other large donations, have resulted in several
quarterly spikes in funding.
State Funds
In 2011-12, State funds spent directly for research
constituted about 11% of total research funding, including
State General Funds, State Special Funds to support
coordinated statewide programs, and State agency
agreements. For many UC research programs, State funds
provide the base support to attract extramural funds by
providing seed money for research projects vital to
California, whether the subject is earthquake engineering
or improved crop varieties.
In 2012-13, State and UC General Funds provide
$331.9 million for direct research, including:
Display VII-6: Private Research Awards by Type of Sponsor (Dollars in Millions)
Corporate and non-profit awards account for nearly 60% of all private research funding to UC. Corporate sponsorshipis finally rising above pre-recession levels; in 2011-12,corporate sponsorship increased, while non-profit fundinghas not experienced significant growth since 2010.
the California Institutes of Science and Innovation;
Proof of Concept funds to stimulate greater development of products and new companies from UC research;organized research units on individual campuses;
multi-campus research programs and initiatives (MRPIs);
systemwide programs to support research on AIDS, geriatrics, and collaborative research with industry; and
agricultural research through the Agriculture Experiment Stations.
State Special Funds appropriated from restricted State fund
sources provided more than $24 million in funding for
a range of research initiatives, including a coordinated
statewide program of tobacco-related disease research
administered by the University ($11.1 million for 2012-13),
but available to researchers from other institutions on a
competitive basis. Part of the State’s tobacco tax supports
the Breast Cancer Research Program ($9.9 million). The
State personal income tax check-off also supports the
California Breast Cancer Research Fund ($484,000) and
the California Cancer Research Program ($425,000). The
California Ovarian Cancer Research Fund has been
eliminated due to unmet minimal statutory funding
requirements.
California State agencies also provide contracts and grants
to the University for research similar to federal awards.
In 2011-12, State agency agreements generated
$202 million for UC research. Major providers of State
agency agreements are the departments of health care
$0
$100
$200
$300
$400
$500
2000-01 2002-03 2004-05 2006-07 2008-09 2010-11
Corporate Non-profit
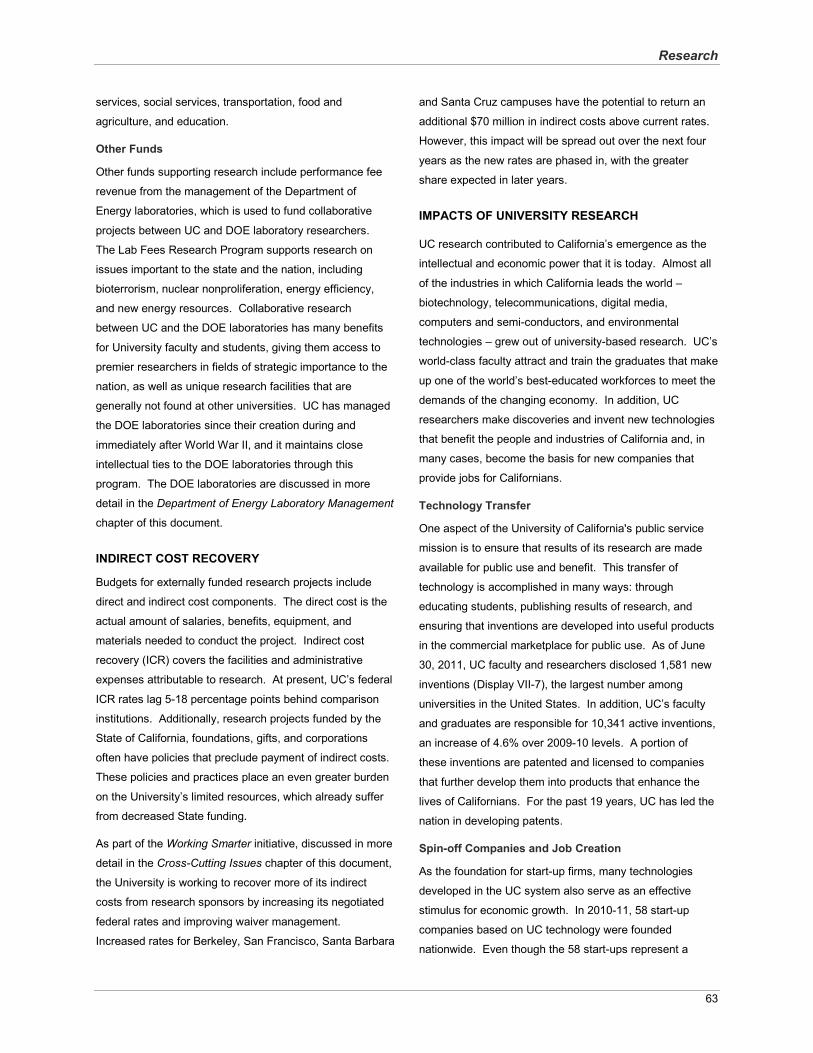
Research
63
services, social services, transportation, food and
agriculture, and education.
Other Funds
Other funds supporting research include performance fee
revenue from the management of the Department of
Energy laboratories, which is used to fund collaborative
projects between UC and DOE laboratory researchers.
The Lab Fees Research Program supports research on
issues important to the state and the nation, including
bioterrorism, nuclear nonproliferation, energy efficiency,
and new energy resources. Collaborative research
between UC and the DOE laboratories has many benefits
for University faculty and students, giving them access to
premier researchers in fields of strategic importance to the
nation, as well as unique research facilities that are
generally not found at other universities. UC has managed
the DOE laboratories since their creation during and
immediately after World War II, and it maintains close
intellectual ties to the DOE laboratories through this
program. The DOE laboratories are discussed in more
detail in the Department of Energy Laboratory Management
chapter of this document.
INDIRECT COST RECOVERY
Budgets for externally funded research projects include
direct and indirect cost components. The direct cost is the
actual amount of salaries, benefits, equipment, and
materials needed to conduct the project. Indirect cost
recovery (ICR) covers the facilities and administrative
expenses attributable to research. At present, UC’s federal
ICR rates lag 5-18 percentage points behind comparison
institutions. Additionally, research projects funded by the
State of California, foundations, gifts, and corporations
often have policies that preclude payment of indirect costs.
These policies and practices place an even greater burden
on the University’s limited resources, which already suffer
from decreased State funding.
As part of the Working Smarter initiative, discussed in more
detail in the Cross-Cutting Issues chapter of this document,
the University is working to recover more of its indirect
costs from research sponsors by increasing its negotiated
federal rates and improving waiver management.
Increased rates for Berkeley, San Francisco, Santa Barbara
and Santa Cruz campuses have the potential to return an
additional $70 million in indirect costs above current rates.
However, this impact will be spread out over the next four
years as the new rates are phased in, with the greater
share expected in later years.
IMPACTS OF UNIVERSITY RESEARCH
UC research contributed to California’s emergence as the
intellectual and economic power that it is today. Almost all
of the industries in which California leads the world –
biotechnology, telecommunications, digital media,
computers and semi-conductors, and environmental
technologies – grew out of university-based research. UC’s
world-class faculty attract and train the graduates that make
up one of the world’s best-educated workforces to meet the
demands of the changing economy. In addition, UC
researchers make discoveries and invent new technologies
that benefit the people and industries of California and, in
many cases, become the basis for new companies that
provide jobs for Californians.
Technology Transfer
One aspect of the University of California's public service
mission is to ensure that results of its research are made
available for public use and benefit. This transfer of
technology is accomplished in many ways: through
educating students, publishing results of research, and
ensuring that inventions are developed into useful products
in the commercial marketplace for public use. As of June
30, 2011, UC faculty and researchers disclosed 1,581 new
inventions (Display VII-7), the largest number among
universities in the United States. In addition, UC’s faculty
and graduates are responsible for 10,341 active inventions,
an increase of 4.6% over 2009-10 levels. A portion of
these inventions are patented and licensed to companies
that further develop them into products that enhance the
lives of Californians. For the past 19 years, UC has led the
nation in developing patents.
Spin-off Companies and Job Creation
As the foundation for start-up firms, many technologies
developed in the UC system also serve as an effective
stimulus for economic growth. In 2010-11, 58 start-up
companies based on UC technology were founded
nationwide. Even though the 58 start-ups represent a
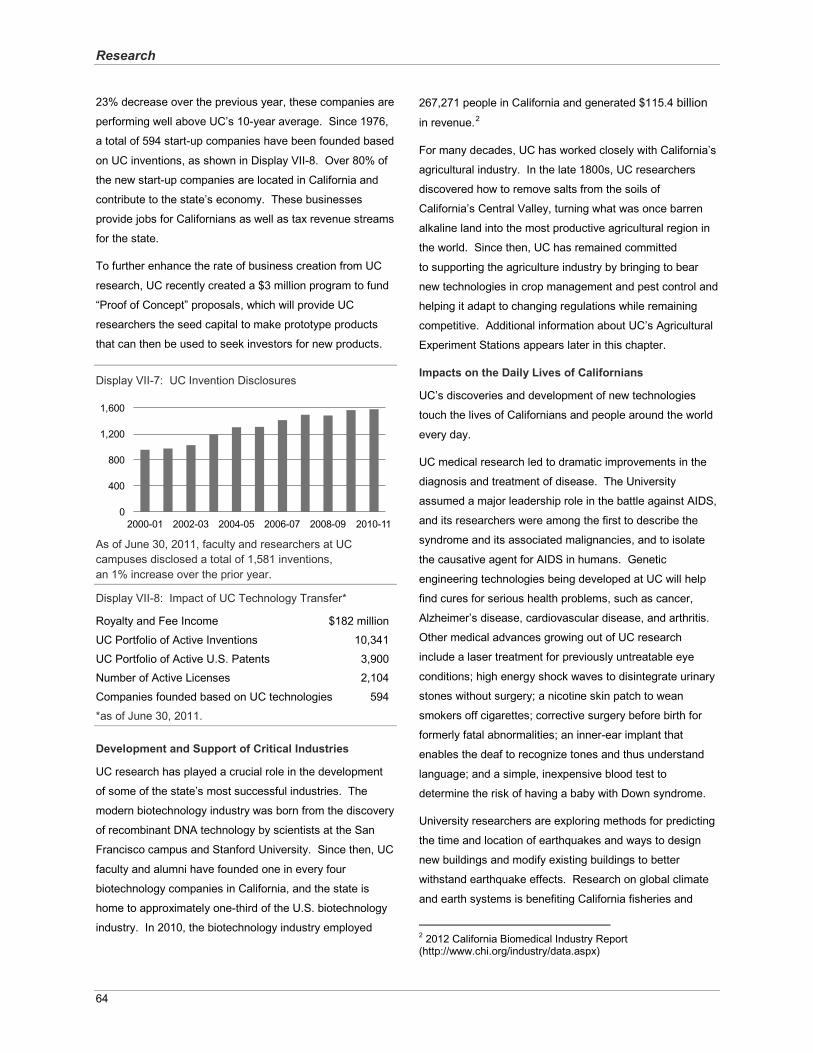
Research
64
23% decrease over the previous year, these companies are
performing well above UC’s 10-year average. Since 1976,
a total of 594 start-up companies have been founded based
on UC inventions, as shown in Display VII-8. Over 80% of
the new start-up companies are located in California and
contribute to the state’s economy. These businesses
provide jobs for Californians as well as tax revenue streams
for the state.
To further enhance the rate of business creation from UC
research, UC recently created a $3 million program to fund
“Proof of Concept” proposals, which will provide UC
researchers the seed capital to make prototype products
that can then be used to seek investors for new products.
Display VII-7: UC Invention Disclosures
As of June 30, 2011, faculty and researchers at UC campuses disclosed a total of 1,581 inventions,an 1% increase over the prior year.
Display VII-8: Impact of UC Technology Transfer*
Royalty and Fee Income $182 million
UC Portfolio of Active Inventions 10,341
UC Portfolio of Active U.S. Patents 3,900Number of Active Licenses 2,104
Companies founded based on UC technologies 594
*as of June 30, 2011.
Development and Support of Critical Industries
UC research has played a crucial role in the development
of some of the state’s most successful industries. The
modern biotechnology industry was born from the discovery
of recombinant DNA technology by scientists at the San
Francisco campus and Stanford University. Since then, UC
faculty and alumni have founded one in every four
biotechnology companies in California, and the state is
home to approximately one-third of the U.S. biotechnology
industry. In 2010, the biotechnology industry employed
267,271 people in California and generated $115.4 billionin revenue.2
For many decades, UC has worked closely with California’s
agricultural industry. In the late 1800s, UC researchers
discovered how to remove salts from the soils of
California’s Central Valley, turning what was once barren
alkaline land into the most productive agricultural region in
the world. Since then, UC has remained committed
to supporting the agriculture industry by bringing to bear
new technologies in crop management and pest control and
helping it adapt to changing regulations while remaining
competitive. Additional information about UC’s Agricultural
Experiment Stations appears later in this chapter.
Impacts on the Daily Lives of Californians
UC’s discoveries and development of new technologies
touch the lives of Californians and people around the world
every day.
UC medical research led to dramatic improvements in the
diagnosis and treatment of disease. The University
assumed a major leadership role in the battle against AIDS,
and its researchers were among the first to describe the
syndrome and its associated malignancies, and to isolate
the causative agent for AIDS in humans. Genetic
engineering technologies being developed at UC will help
find cures for serious health problems, such as cancer,
Alzheimer’s disease, cardiovascular disease, and arthritis.
Other medical advances growing out of UC research
include a laser treatment for previously untreatable eye
conditions; high energy shock waves to disintegrate urinary
stones without surgery; a nicotine skin patch to wean
smokers off cigarettes; corrective surgery before birth for
formerly fatal abnormalities; an inner-ear implant that
enables the deaf to recognize tones and thus understand
language; and a simple, inexpensive blood test to
determine the risk of having a baby with Down syndrome.
University researchers are exploring methods for predicting
the time and location of earthquakes and ways to design
new buildings and modify existing buildings to better
withstand earthquake effects. Research on global climate
and earth systems is benefiting California fisheries and
2 2012 California Biomedical Industry Report (http://www.chi.org/industry/data.aspx)
0
400
800
1,200
1,600
2000-01 2002-03 2004-05 2006-07 2008-09 2010-11
Research
65
agriculture by leading to better predictions of hazards such
as drought, flooding, and other natural disasters, and to
more effective means of mitigating their effects. New
materials are being developed for better synthetic products,
such as prosthetic devices more acceptable to the body
and longer-lasting, easy-care contact lenses.
Social science research is furthering our understanding of
issues critical to California’s social and political well-being.
Examples include collaborative research between California
and Mexico focusing on issues such as trade and economic
development, immigration, language acquisition and
development, educational access, international relations,
public policy issues around homeland security, population
growth, and the Pacific Rim, and a wide range of other
policy-relevant research areas.
In the humanities, research at the University of California
has flourished across the system: many UC programs are
at the top of the National Research Council rankings for
excellence in research. The UC Humanities Technology
Council brings together the top thinkers within UC from the
California Digital Library, UCTV, the California Institutes for
Science and Innovation, the San Diego Supercomputer
Center, the UC Digital Arts Research Network, the Museum
Online Archive of California, and other major projects to
promote collaboration and develop new ways of linking
humanities resources around the state, across the country,
and internationally.
Value to the Instructional Program
Undergraduate and graduate students alike pursue an
education at UC because of the high quality of the
University’s faculty, quality that includes excellence in
teaching, cutting-edge research, and leadership in
academia. For students, formal instruction is enhanced by
extraordinary informal learning opportunities that occur
across the system through the research enterprise. The
2010 UC Undergraduate Experience Survey found that
86% of senior undergraduates had participated in research
or other creative activities with faculty as part of their
coursework. The opportunity to learn from professors who
are leaders in their fields in the informal settings of the
research laboratory or fieldwork site is one of the unique
and unsurpassed benefits of being a UC student for both
undergraduates and graduates.
KEY RESEARCH PROGRAMS
California Institutes for Science and Innovation
In the early 2000s, the State of California, UC, and
hundreds of the state’s leading-edge businesses joined
together in an unprecedented partnership to create the
California Institutes for Science and Innovation, using
$400 million in State-supported capital funding matched
two-to-one from federal and private sources. The four
Institutes, each jointly operated by multiple UC campuses,
engage UC’s world-class research faculty directly with
California, national, and international companies in
attacking large-scale issues critical to the state’s economy
and its citizens’ quality of life. Information technology,
telecommunications, nanotechnology, quantitative
biosciences, health care, environmental management,
homeland security, and energy systems are among the
areas of focus for new research within the Institutes.
The Institutes have vastly increased technology
development and exchange with California’s industry and
government. For example:
California Institute for Telecommunications and Information Technology (Calit2) has worked with the San Diego Police, CalFire, and the San Diego Metropolitan Medical Strike Team to customize information and telecommunication technologies to their needs. They subsequently devised wireless video systems to put on the helmets of HazMat responders, allowing remote commanders to see and talk with front-line responders in dangerous environments.
California Institute for Quantitative Biosciences (QB3) has created low-cost “garage bench” space for aspiringentrepreneurs from UC who want to start biotechnologycompanies in San Francisco. This approach has been so successful in stimulating new start-up firms that the original space quickly filled up, and QB3 is seeking ways to create a new building on the Mission Bay sitededicated to fostering more young companies from UC research.
California Institute for Technology Research in the Interest of Society (CITRIS) created new programs indemand response and programmable communicating thermostats, and developed an intelligent infrastructure to explore the degradation of underground power distribution cables at the request of the California Energy Commission – demonstrating CITRIS’s active partnership with state entities to address its most pressing energy problems.
Research
66
California Nanosystems Institute (CNSI) researchers at the Los Angeles and Santa Barbara campuses explore the power and potential of manipulating structures atomby atom to engineer new materials, devices, andsystems that will revolutionize virtually every aspect of our quality of life, including medical delivery and health care, information technologies, and innovations for the environment. The CNSI technology incubator encourages University collaboration with industry andenables the rapid commercialization of discoveries in nanoscience and nanotechnology.
While capital funding allowed the development of these
state-of-the-art facilities, funding to ensure operations has
been inadequate. Operations require funding for advanced
technology infrastructure, specially trained technical
personnel to operate the advanced instrumentation, and
seed money for building new research teams across
disciplines and campuses, as well as attracting large-scale
extramural contracts and grants from industry and
governmental sources.
In 2011-12, the State provided $4.8 million for support of
the Institutes; this funding was supplemented by
$18.2 million from other UC sources, including both
permanent and one-time sources. In 2012-13, total support
for the Institutes is $13.2 million: $4.8 million in State
support, and $8.4 million in other UC funds. Due to
significant budget shortfalls, funding for the Institutes from
one-time sources was eliminated.
For several years during the previous decade, UC
requested additional State support for the Institutes without
success. Lack of permanent operating funds threatens the
viability of these newly vibrant institutes and the potential
loss of a large capital investment, as well as their ability to
create new jobs through their spin-off companies and
technologies.
Multi-campus Research Programs and Initiatives
UC’s unique strength among national university systems is
distributed excellence across all its campuses: six of the
UC campuses are members of the prestigious American
Association of Universities. This strength gives UC the
ability to create multi-campus collaborations drawing the
best talent from throughout the system for the most difficult
and emerging areas of research. UC’s Multi-campus
Research Programs and Initiatives (MRPIs) grants support
innovative multi-campus collaborative efforts to advance
scholarship, student training, and knowledge, particularly in
areas of importance to the University and the state.
The MRPIs use relatively modest UC support, typically in
the range of $100,000 to $500,000 annually, to stimulate
multi-campus engagement, as well as to dynamically link
research at the 10 campuses and three national labs into a
network of shared information, resources, and
dissemination, which in turn helps secure outside support in
emerging areas. Selected through rigorous independent
peer review, the MRPIs provide seed funding to support
innovative research, fund graduate student traineeships,
and work directly with State agencies to disseminate the
expertise of the UC faculty and their research. For
example:
The Athena Breast Cancer network initiative ties together UC’s five medical centers for breast cancer research, creating a patient base larger than any other in the United States. Subsequent to UC’s initial year MRPI award of $900,000 (projected to be about $5 million over five years), the program leveraged this award to attractanother $10 million from Safeway Corporation to enhance the program. Overall, the network expects to attract three times as much outside support as UC support for this initiative.
A new UC transportation research initiative teams UCresearchers from more than 30 disciplines on six UC campuses to reduce congestion, oil use, air pollution, and greenhouse gas emissions.
The newly-launched Center for Hydrologic Modeling linksresearchers at eight UC campuses and the three national labs to forecast how water availability will shrink because of climate change and diminishing snowpack.
The California Advanced Solar Technologies Institutes isa new initiative focused on the next generation of solar energy. Researchers at the Berkeley, Merced, and Santa Barbara campuses use nanotechnology and non-imaging optics to develop new solar cell materials and methods to cool and heat buildings or generate electricity.
Collaborative Research for an Equitable California bringsUC researchers together with community organizers and policy-makers to tackle the state’s crises in education, employment, interconnected health, nutrition, housing,and the environment, researching how disparities and inequities in these areas are linked.
Studies of Food and the Body, a five-campus collaboration led by a UC Davis professor of American Studies, used a $70,000 MRPI grant to help secure $800,000 of outside support from the Mellon Foundation
Research
67
for humanities research at UC for their novel approach to collaborative research in the humanities.
Dark Matter Search Initiative, UC’s multi-campus research at the Lick and Keck observatories, has helpedcreate one of the strongest programs in astrophysics in the world. UC astronomers are responsible for the discovery of dark energy (and shared the 2011 Nobel Prize in Physics for this discovery), the discovery of planets orbiting other stars, and the discovery of a black hole in the center of the Milky Way. UC researchers have won every prestigious prize in astronomy for research conducted within UC facilities.
Institute of Transportation Studies
With worsening traffic congestion threatening economic
growth and quality of life, as well as daunting energy and
climate change challenges, California and the nation need
new forms of transportation and new ways of thinking about
transportation. The Institute of Transportation Studies
(ITS), an MRPI, is recognized as the premier center of
transportation research in the world. It has been funded
with a small portion of the fuel taxes that have supported
the Public Transportation Account (PTA) since 1947.
The initial PTA funding of $920,000 has only risen to
$980,000 over the past 60 years, supplemented by
$250,000 of State General Funds cost increase funding
over time. Due to inflation, its purchasing power has
shrunk to about one-eighth of its initial value.
Despite this, ITS has been extraordinarily successful in
attracting nearly $35 million annually in extramural funding,
leveraging the core funding from the state’s PTA account at
a ratio of nearly 35:1. However, minimal core funding has a
significant disadvantage: it forces ITS to be almost entirely
reactive to funding opportunities defined by outside
agencies and companies, rather than focusing on specific
immediate and long-term needs of the state.
Agriculture
The Division of Agriculture and Natural Resources (ANR) is
a statewide network of UC researchers and educators
dedicated to the creation, development, and application of
knowledge in agriculture, natural, and human resources.
ANR’s mission is to maintain and enhance connections that
fully engage UC with the people of California and achieve
innovation in fundamental and applied research and
education that supports sustainable, safe, nutritious food
production and delivery systems; economic success in a
global economy; a sustainable, healthy, productive
environment; science literacy; and positive youth
development. ANR is unique in its three-way partnership
with federal, state, and county governments to provide local
and statewide research and extension programs that
address the critical agricultural issues of California. ANR’s
research and public service programs are delivered through
two organizational units: Agricultural Experiment Station
(AES) and Cooperative Extension (CE). While both units
conduct research, CE is the outreach arm for ANR,
extending ANR research to communities across the state,
as described in the Public Service chapter of this
document.
AES is located within three colleges on the Berkeley, Davis,
and Riverside campuses, as well as at the School of
Veterinary Medicine at Davis. There are nearly 600 AES
faculty housed in 38 academic departments. The AES
faculty hold split appointments, with an average of half of
their salaries paid for from AES funds for their research
responsibilities and the remainder funded from the general
campus for their teaching responsibilities. AES faculty
represent a variety of disciplines and, consistent with the
University’s land-grant status, are charged with conducting
fundamental and applied research related to contemporary
and relevant problems facing agriculture, natural resources,
nutrition, and youth development. ANR statewide programs
focus on specific issues that engage AES academics and
faculty from all UC campuses, allowing teams to work on
complex issues that require multidisciplinary approaches.
In addition, research and extension centers (RECs), located
in a variety of ecosystems across the state, provide a core
research and extension base.
ANR continues to implement budget cuts enacted due to
California’s enduring state budget crisis. ANR’s budget
reduction decisions aimed to reduce administrative
overhead while focusing ANR programs and people on the
future through its 2025 Strategic Vision. The resulting
restructured organization is responsive to the needs
articulated in the Strategic Vision and represents a strong
administrative and programmatic platform for the future.
ANR continues to seek alternatives to support its programs.
Research
68
Examples of research conducted by AES scientists that
help address challenges and inform policy include:
Plant Breeding. ANR researchers working with
international colleagues successfully introduced an existing
rice gene into modern rice varieties that makes them flood
resistant and allows them to thrive when floodwaters
recede. Over the past few years, national rice improvement
programs in Asia, including India, Bangladesh, Indonesia,
and the Philippines, have begun dissemination efforts.
Food Safety. ANR’s interstate research and extension
projects in food safety have had national impacts. ANR’s
collaboration with the University of Florida and the
University of Georgia evaluates practices to improve
handling and treatment of nuts to reduce contamination
risks from Salmonella. When Colorado cantaloupes were
found to be contaminated with Listeria, ANR academics
were called upon to contribute to the national discussion
regarding the 2011 outbreak.
Water Resources. ANR scientists developed techniques
to improve irrigation efficiency and other water conservation
practices needed to supply water to Southern California
and northern Baja California. It is estimated that growers in
this region realized $6 million in water and energy savings
as a result. The best management practices also informed
policy; they were included in the Colorado River Regional
Water Quality Control Board Silt/Sedimentation Total Daily
Maximum Load (TMDL) standards.
Energy. California has new sustainable energy
opportunities with the recent interest in the development of
small-scale enterprises, the use of non-timber size trees
(small trees) and other woody biomass resources, and the
national support for bioenergy. ANR academics have
provided local decision makers with the knowledge and
expertise needed to realistically evaluate these
opportunities. Over the past four years, ANR academics
have provided direct technical assistance to small
businesses, helping them to acquire 18 federal grants worth
more than $4.5 million.
Labor Research and Education
Growing international economic integration, policy changes,
transformations in business organization, new technology,
and other changes have brought many positive
developments, but have also resulted in emerging issues
and concerns for communities, researchers, and policy
makers. The UC labor program engages in research and
education that advances knowledge and understanding of
these new challenges and opportunities from a variety of
perspectives and disciplines, including historical,
comparative, and institutional approaches.
State funding for a new Institute for Labor and Employment
(ILE) was first provided in 2000-01, when the Legislature
proposed and the Governor sustained an additional
$6 million in the University’s budget to establish a
multi-campus research program focused on issues related
to labor and employment. However, since that time,
funding for the program has been unsteady. During the
early 2000s, the State’s fiscal crisis necessitated cuts to the
University’s State-funded research budget, including the
funding provided for ILE, and funding was eliminated
entirely in 2005-06. State funding was restored for 2006-07
and 2007-08, but not for the ILE. Instead, $6 million was
provided for labor research and, of that amount, budget
language authorized 40% ($2.4 million) for labor education
and training programs. The ILE, as it had been
established, was disbanded.
The State has not provided funding in the budget for labor
research since 2007-08. The University has continued
support for labor research by providing $4 million in
2008-09 and $2 million in 2009-10, and 2010-11. Since
2011-12, the funding provided to these programs was
reduced to $1 million for each center. Temporary funding
used to fund the labor centers was entirely redirected from
existing programs. Funding the Labor Centers by
implementing cuts to other programs was not sustainable,
however.
The wide array of research being done at UC impacts local
communities, the state, and the country in countless ways.
As discussed above, UC researchers attract billions in
federal and private research dollars to California, creating
thousands of jobs and helping support graduate students,
who will be the state’s next generation of scientists,
engineers, entrepreneurs, and leaders. The State’s
disinvestment in UC harms the University’s ability to use its
research enterprise to fuel the state economy and impact
society.
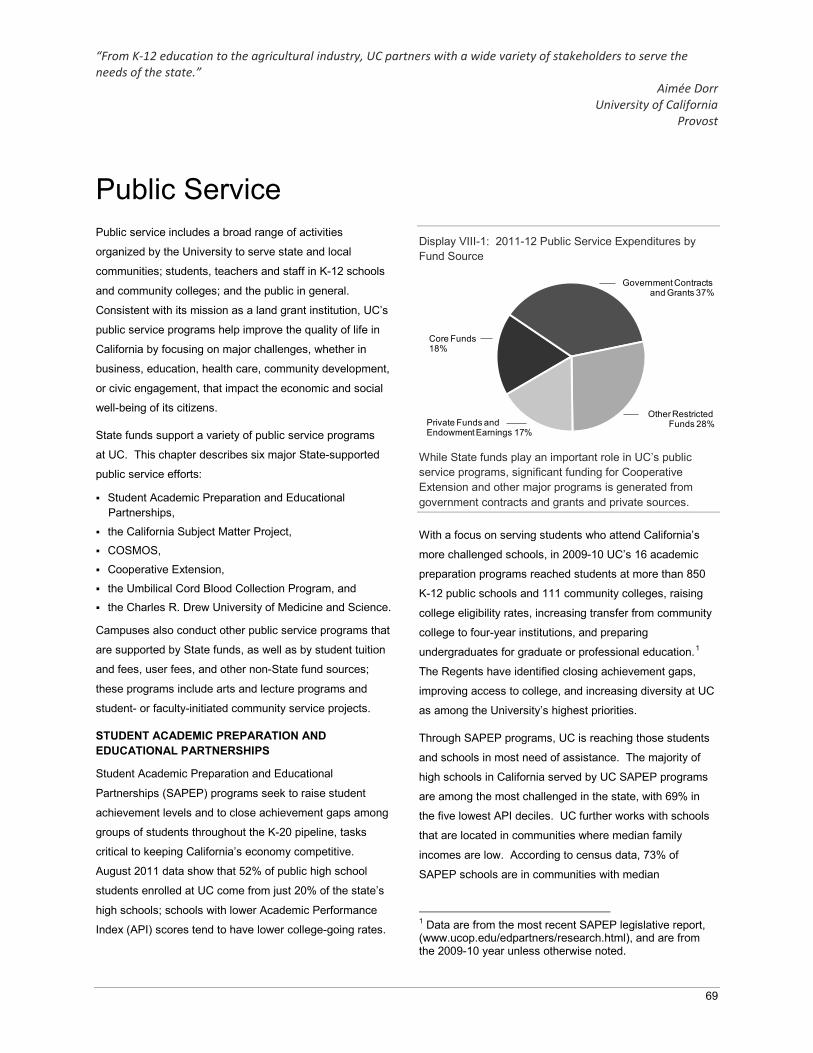
“From K-12 education to the agricultural industry, UC partners with a wide variety of stakeholders to serve the needs of the state.”
Aimée Dorr University of California
Provost
69
Public ServicePublic service includes a broad range of activities
organized by the University to serve state and local
communities; students, teachers and staff in K-12 schools
and community colleges; and the public in general.
Consistent with its mission as a land grant institution, UC’s
public service programs help improve the quality of life in
California by focusing on major challenges, whether in
business, education, health care, community development,
or civic engagement, that impact the economic and social
well-being of its citizens.
State funds support a variety of public service programs
at UC. This chapter describes six major State-supported
public service efforts:
Student Academic Preparation and Educational Partnerships,
the California Subject Matter Project,COSMOS,
Cooperative Extension,
the Umbilical Cord Blood Collection Program, and the Charles R. Drew University of Medicine and Science.
Campuses also conduct other public service programs that
are supported by State funds, as well as by student tuition
and fees, user fees, and other non-State fund sources;
these programs include arts and lecture programs and
student- or faculty-initiated community service projects.
STUDENT ACADEMIC PREPARATION AND EDUCATIONAL PARTNERSHIPS
Student Academic Preparation and Educational
Partnerships (SAPEP) programs seek to raise student
achievement levels and to close achievement gaps among
groups of students throughout the K-20 pipeline, tasks
critical to keeping California’s economy competitive.
August 2011 data show that 52% of public high school
students enrolled at UC come from just 20% of the state’s
high schools; schools with lower Academic Performance
Index (API) scores tend to have lower college-going rates.
Display VIII-1: 2011-12 Public Service Expenditures by Fund Source
While State funds play an important role in UC’s public service programs, significant funding for Cooperative Extension and other major programs is generated from government contracts and grants and private sources.
With a focus on serving students who attend California’s
more challenged schools, in 2009-10 UC’s 16 academic
preparation programs reached students at more than 850
K-12 public schools and 111 community colleges, raising
college eligibility rates, increasing transfer from community
college to four-year institutions, and preparing
undergraduates for graduate or professional education.1
The Regents have identified closing achievement gaps,
improving access to college, and increasing diversity at UC
as among the University’s highest priorities.
Through SAPEP programs, UC is reaching those students
and schools in most need of assistance. The majority of
high schools in California served by UC SAPEP programs
are among the most challenged in the state, with 69% in
the five lowest API deciles. UC further works with schools
that are located in communities where median family
incomes are low. According to census data, 73% of
SAPEP schools are in communities with median
1 Data are from the most recent SAPEP legislative report, (www.ucop.edu/edpartners/research.html), and are from the 2009-10 year unless otherwise noted.
Core Funds 18%
Private Funds and Endowment Earnings 17%
Other Restricted Funds 28%
Government Contracts and Grants 37%
Public Service
70
incomes of less than $50,000, compared to about 50% of
high schools statewide. In addition, 89% of students in
SAPEP’s three largest high school programs are from
groups underrepresented at the University.
The impact of the University’s SAPEP programs on
educationally disadvantaged and underrepresented
minority students is significant. While enrollment at UC is
not the specific goal of UC’s academic preparation
programs, the ability of students to compete successfully
for UC admission is a strong indicator of increased access
to postsecondary opportunities. At the same time, these
programs increase the diversity of the University. In Fall
2009, 15.6% of African-Americans and 18.4% of Chicano
and Latino students in the incoming freshman class at UC
campuses had been participants in UC’s student academic
preparation programs. Furthermore, CPEC eligibility data
show that in 2007, 6.3% of African-American students were
eligible for UC, compared to just 2.8% in 1996. For
Chicano and Latino students, eligibility gains were equally
strong, with 6.9% eligible in 2007 compared with only 3.8%
in 1996.2 Significant budget cuts since 2000-01, however,
reduced opportunities for more than 50,000 students to
participate in the University’s student academic preparation
programs, and fewer schools and teachers are served.
Budget constraints notwithstanding, UC has created
innovative ways to help generate systemic changes in
California’s educational system through long-term
partnerships with K-12 schools, businesses, and
community-based organizations. For example, the
University’s K-20 (Kindergarten - University) Intersegmental
Alliances align SAPEP programs with their local and
regional K-12, community college, educational, community,
and business partners. Activities and strategies vary by
region depending on the needs and priorities of partner
schools but include direct student and family services,
including academic enrichment and student academic and
career advising; dissemination of research and best
practices on teaching and learning; professional
development and coaching in specific content for teachers;
and collaboration with schools, districts, and community
agencies on grant writing and resource development.
2 California Postsecondary Education Commission (CPEC) report. University Eligibility Study for Class of 2007.
STUDENT ACADEMIC PREPARATION PROGRAMS WERE DEVELOPED NEARLY 40 YEARS AGO
As early as 1872, then-University President Daniel CoitGilman called on the University to collaborate with schools in enhancing student preparation for a college education so that the “work of the University shall clearly forward the welfare of the state, of the whole body politic.”
The current generation of student academic preparation programs took shape in the 1960s, when the civil rights movement drew attention to issues of access to the University. During this period when there were no fiscal constraints on enrollments, the Regents addressed access issues primarily through aggressive and innovative admissions policies.
In the 1970s, the University began providing under-represented students academic assistance and information to help them meet University admission standards. The Legislature passed the Meade Bill in 1975 (AB 2412),marking the first time that State resources were devoted to increasing the number and persistence of eligible minority students. With it was born the concept of developing a pipeline of academic preparation programs beginning with students in the seventh grade and continuing through their college careers. Academic preparation programs expanded gradually during the 1980s and early 1990s.
In July 1995 the Regents adopted Resolution SP-1, which eliminated consideration of race, ethnicity, and gender in UC admissions. At the same time, the Board called on the President to appoint the Outreach Task Force (OTF) to identify ways in which outreach programs could help to ensure that the University remain accessible to students from educationally disadvantaged backgrounds. Coupled with the passage by California voters of Proposition 209 in Fall 1996, which essentially placed the tenets of SP-1 in the State’s Constitution, these events elevated academic preparation programs to become the University’s most critical tool for promoting access to the University for educationally disadvantaged students in California.
The University used these partnerships to implement the
Transcript Evaluation Service (TES), which tracks
coursework progress and UC/CSU eligibility for both
individual students and entire schools. In addition, TES
provides aggregate data for school administrators to
diagnose course completion obstacles and improve
UC/CSU course requirement completion on a schoolwide
basis. TES has been recognized by the Campaign for
College Opportunity as a “Practice with Promise” for
transforming the educational opportunities in California’s
schools.
Public Service
71
Program Descriptions and Outcomes
In addition to partnerships with K-12 and community
organizations, UC’s portfolio of SAPEP programs raises
college eligibility rates, increases transfer from community
colleges to baccalaureate-degree granting institutions, and
prepares undergraduates for graduate programs.3
College Access and Preparation. With a focus on
academic advising and building college knowledge, the
Early Academic Outreach Program (EAOP), UC’s largest
academic preparation program, helps disadvantaged
students complete a rigorous college preparatory
curriculum in high school, complete UC and CSU
coursework and exam requirements, and apply for college
and financial aid. EAOP provides academic enrichment,
such as intensive workshops and summer courses;
advising; test preparation; information for parents, e.g., how
to apply for financial aid and college options in California;
and support for schools, such as assistance in establishing
school structures that have a direct link to students’
completion of college preparatory course requirements.
With a focus on science, technology, engineering and
mathematics (STEM) and workforce preparation, the
Mathematics, Engineering, Science Achievement (MESA) program helps middle and high school students
excel in math and science so they can graduate from
college with degrees in science, engineering, computer
science, or other math-based fields. MESA offers classes
during the school day that allow advisors to work with
students on academics and MESA activities. MESA’s
academic development curriculum includes math and
science coursework based on California Math and Science
Standards. MESA also offers individualized academic
planning, tutoring, math workshops, study groups, and
career exploration services. Parent involvement workshops
and events help parents learn how to become effective
advocates for their children’s academic success.
With a focus on literacy development, The Puente Projectprepares high school students – many of whom are English
language learners – for college through rigorous academic
3 Detailed descriptions of each SAPEP program can be found in the most recent SAPEP legislative report, available at www.ucop.edu/edpartners/research.html.
SAPEP FUNDING SINCE 1997-98
In 1997-98, after the adoption of SP-1 and Proposition 209, the Legislature considered the University’s academic preparation programs to be an effective means by which to increase accessto college for educationally disadvantaged students and promote diversity at UC. The University’s budget for student academic preparation programs grew from $18.1 million in State and University funds in 1997-98 to a peak of $85 million in 2000-01.
Due to the State’s fiscal crisis in the early 2000s, the SAPEP budget was reduced by $55.7 million over several years, including a 56% reduction in 2003-04, bringing the total budget to $29.3 million in 2005-06.
In 2006-07, a $2 million augmentation to expand community college transfer programs brought the SAPEP budget to $31.3 million.
The Governor’s proposed budget for 2009-10 originally slated SAPEP programs for elimination, but the Legislature converted the cut to an undesignated reduction. As permitted by the 2009-10 Budget Act, campuses were instructed to limit cuts to any program within the portfolio to no more than 10%, which was only half the percentage cut to the University’s State funds.
For 2010-11, the Budget Act called for the University to maintain funding for SAPEP programs at 2009-10 levels.
In 2011-12, the University experienced a 21.3% reduction in State funding. Budget Act language authorized reductions of no more than that percentage in SAPEP programs; however, the SAPEP portfolio experienced an overall budget reduction of only 16%.
Consistent with budget act language, the programs in the SAPEP portfolio are not eligible for budget reductions in 2012-13 unless the Governor’s revenue-enhancing initiative fails in November. In that event, SAPEP programs may not be reduced more than the percentage reduction to the overall State General Fund reduction.
From 2004-05 to 2007-08 – and again for 2009-10 and 2011-12, as noted above – State funding for SAPEP programs was the subject of debate and negotiations during each budget cycle, contributing to uncertainty as to whether or not programs would be able to continue from year to year. The University believes stability in the State funding of these programs is critical to their success. To that end, the University collects and analyzes accountability data demonstrating the scope and effectiveness of individual programs.4
SAPEP programs use State resources efficiently. The cost per student of most programs is substantially less than the cost per student of comparable federally funded programs. In 2008-09, programs supplemented the State and University investment of $31.3 million by raising an additional $54 million in support of K-14 efforts to be expended during the next three to five years.
4 The SAPEP Accountability Framework is also available at www.ucop.edu/edpartners/research.html.
Public Service
72
instruction in writing and literature, intensive college-
preparatory counseling, and mentoring from successful
members of the community. Students in the program study
with the same Puente-trained English teacher for ninth and
tenth grades in a college-preparatory English class, work
closely with a Puente-trained counselor to prepare an
academic plan and stay focused on their goals, participate
regularly in community involvement activities, and attend
field trips to college campuses.
Other programs promoting college access and preparation
include ArtsBridge, Student-Initiated Programs, UCCollege Preparation (UCCP), University-Community Engagement (UCE), and UC Links.
UC’s college access and preparation programs have been
recognized nationally as models of best practice. Among
specific program achievements are the following:
Increased college eligibility: Participants are twice as
likely to complete the ‘a-g’ courses for UC/CSU eligibility.
In 2009-10, a higher proportion of students took the SAT
or ACT than did non-participants in the same schools; for
example, on average 66% of EAOP-MESA-Puente
students at API 1 and 2 schools took the SAT or ACT
compared to 34% of non-participants; and
Increased college attendance: Approximately 68% of
participants attend college the first year after high school.
Community College Transfer. SAPEP programs also
promote transfer from community college to baccalaureate-
granting institutions.
Community College Articulation Agreements are
agreements between individual community colleges and
individual UC campuses that define how specific
community college courses can be used to satisfy subject
matter requirements at UC.
ASSIST, California’s official statewide repository for course
articulation and transfer information, provides counselors
and students with detailed course transfer and articulation
information to help streamline the transfer process.
The MESA Community College Program (CCP) provides
rigorous academic development for community college
students who are pursuing transfer to four-year universities
in majors that are calculus-based. All MESA CCP students
are required to attend Academic Excellence Workshops,
student-led supplemental instruction/study groups that
emphasize the most challenging aspects of classes within
the student’s major. Additional services include
individualized academic planning, college orientation for
math-based majors, career exploration and professional
development, and summer internships in business,
industry, and academia.
Students enrolled in The Puente Community College Program take a rigorous two-course English sequence,
receive transfer requirement counseling, and meet regularly
with a Puente-trained mentor from the professional
community. Teachers and counselors receive training in
innovative counseling and teaching methodologies for
educationally disadvantaged students.
Community College Transfer Programs increase
opportunities for community college students to transfer to
four-year institutions by providing comprehensive academic
guidance and support for prospective transfers. Services
include assistance with course selection, informational
workshops on academic requirements for transfer
admissions, and professional development and training for
community college counselors and faculty. Students
enrolled in these transfer programs are more likely to
transfer to a baccalaureate-granting institution than other
students.
Other program achievements include:
In 2010-11, over 2.3 million different individuals used ASSIST to view over 14.1 million articulation agreements;
UC continues to improve its transfer preparation paths to facilitate the smooth transfer of California Community College (CCC) students into UC’s top 20 transfer majors;
Almost all of MESA’s Community College Program participants transfer to a baccalaureate-degree granting college or university, and in 2010-11 100% of those students chose majors in math or science fields; and
More than 81% of Puente students are retained in community college for a year following participation in the program. The one-year persistence rate for all CCC students statewide is about 69%.
Graduate and Professional School Preparation. SAPEP
programs also prepare and encourage high-caliber
undergraduates from educationally disadvantaged
communities to pursue graduate and professional level
Public Service
73
training. Leadership Excellence through AdvancedDegrees Program (UC LEADS) places juniors and seniors
who have experienced conditions that have adversely
impacted their advancement in their field of study in two-
year intensive research experiences with faculty mentors.
Summer Research Internship Programs (SRIP) also
provide intensive research experience. UC Law Fellowsand Post-baccalaureate Medical School Programsprovide preparation for graduate study through academic
skills building, test preparation, and mentoring.
Achievements of these programs include:
More than three-quarters (80%) of graduate andprofessional school academic preparation program participants enroll in graduate or professional school; and
Independent research confirms that UC’s post-baccalaureate premedical programs improve applicants’ chances of admission to medical school.
CALIFORNIA SUBJECT MATTER PROJECT
The California Subject Matter Project (CSMP) is a
statewide network of subject-specific professional
development programs for teachers. CSMP engages K-12
educators with faculty in various disciplines from UC, CSU,
and private higher education institutions to develop and
deliver intensive institutes for education professionals. The
CSMP includes projects in nine subject areas: arts, history
- social science, international studies, mathematics,
physical education - health, reading and literature, science,
world languages, and writing.
During 2010-11, CSMP served over 25,000 teachers and
school administrators at 3,460 schools, more than a third of
which were low-performing schools.
CSMP has worked with an external evaluator (SRI
International) to understand the impact of CSMP on
teachers, their professional community, and their students.
In recent evaluations, SRI has concluded that teachers
consistently rate CSMP professional development more
highly than other professional development programs, and
that CSMP has been successful in meeting its goals to
serve teachers from low-performing schools and teachers
of English learners. Nearly all teachers report that CSMP
influenced their instructional practices and content
knowledge more than other professional development. In
addition, teachers report that their participation contributed
to students’ achievement (92%), conceptual understanding
(82%), engagement in activities (80%), and ability to
explain their reasoning (64%).
State funding has remained at $5 million since 2003-04 and
an additional $4.35 million is provided from the federal No
Child Left Behind (NCLB) Act, Title II, Part A program. The
federal funds figure reflects an 18% decrease that the
California Department of Education implemented in
2011-12. CSMP leverages State and federal funding with
foundation grants and district contracts to support the
professional development programs. The CSMP was
originally authorized in 1998 and was reauthorized in 2002,
2007, and again in 2011. The 2011 bill (SB 612) extends
authorization to June 30, 2017 and incorporates all nine
projects into the legislation.
COSMOS
The California State Summer School for Mathematics and
Science (COSMOS) provides an intensive academic
experience for students who wish to learn advanced
mathematics and science and prepare for careers in these
areas. COSMOS is a month-long residential academic
program for top high school students in mathematics and
science. COSMOS course clusters address topics not
traditionally taught in high schools such as astronomy,
aerospace engineering, biomedical sciences, computer
science, wetlands ecology, ocean science, robotics, game
theory, and more. The program takes place each summer
on the Davis, Irvine, Santa Cruz, and San Diego campuses.
Cluster sizes vary from 18-25 students and the student to
academic staff ratio is typically 5:1. In summer 2012, 677
students, drawn from an applicant pool of over 2,500
students, were selected to attend COSMOS.
In 2010-11, COSMOS received $1.9 million in State funds,
a 10% reduction from State support in 2007-08. Consistent
with budget act language, the University reduced State
support for COSMOS in 2011-12 to $1.7 million, also a 10%
reduction. In the 2012-13 Budget Act, the Governor
eliminated provisional language associated with several
programs, including COSMOS, which had specified the
funding level expected by the State for the budget year.
While the Governor’s action provides UC with more
flexibility in terms of setting funding levels for this program,
Public Service
74
UC is not currently proposing any funding reductions in
2012-13 for this program. The California Education Code
specifies that the State fund at least 50%, but not more
than 75%, of the program’s actual costs; funds are also
provided by participants with the ability to pay and from
private sources. In 2012, AB 1663 amended the Education
Code to set the program’s tuition level for California
residents at $2,810; COSMOS may increase this level up to
5% each year thereafter. AB 1663 was introduced to rectify
the ramifications of SB 755 (2005), which had permitted the
program to raise tuition levels for a few years but whose
provisions should have been extended prior to 2012.
COOPERATIVE EXTENSION
The Division of Agriculture and Natural Resources (ANR) is
a statewide network of UC researchers and educators
dedicated to the creation, development, and application of
knowledge in agricultural, natural, and human resources.
ANR’s mission is to maintain and enhance connections that
fully engage UC with the people of California and achieve
innovation in fundamental and applied research and
education that supports sustainable, safe, nutritious food
production and delivery systems; economic success in a
global economy; a sustainable, healthy, productive
environment; and science literacy and youth development
programs. ANR is unique in its three-way partnership with
federal, state, and county governments to provide local and
statewide research and extension programs that address
critical issues of California. ANR’s research and public
service programs are delivered through two organizational
units: Cooperative Extension (CE) and the Agricultural
Experiment Station (AES). While both conduct research,
CE is also ANR’s outreach arm, extending ANR research to
communities across the state. AES is described in more
detail in the Research chapter of this document.
CE links educational and research activities to the
resources of the U.S. Department of Agriculture (USDA),
land grant universities, and county administrative units to
solve local issues in agriculture, natural resources, and
human development. Over 300 CE academics (specialists
and advisors) partner with AES faculty, state and federal
agencies, and local clientele in 57 of California’s 58
counties. CE specialists (housed in ANR’s four
colleges/schools on the Berkeley, Davis, and Riverside
campuses) conduct research, develop new technologies,
transmit results to communities statewide, and serve as the
campus link to county CE advisors. CE academic county
advisors are situated in local communities to conduct
applied research and translate and test campus research
findings into solutions for local problems. This statewide
network of local CE sites is often the face of UC to local
clientele and stakeholders who may never set foot on a UC
campus. CE advisors work with teams of staff and
volunteers to deliver applied research and science-based
education programs in the areas of agriculture, natural
resources, nutrition and related human resources.
Collaboration with citizen volunteers is an integral part of
educational efforts in the 4-H Youth Development, Master
Gardener, and Master Food Preserver programs. Advisors
provide local residents and industry groups with science-
based information though workshops, demonstrations, field
days, classes, print and other media, and web sites.
Statewide programs, such as Integrated Pest Management;
Youth, Family, and Communities; and the Agriculture
Issues Center focus on specific issues that engage ANR
academics and faculty from all UC campuses, allowing
teams to work on complex issues that require
multidisciplinary approaches. In addition, nine research
and extension centers (RECs), located in a variety
of ecosystems across the state, provide a core research
and extension base.
In 2012-13, the CE base budget is $72 million and is
composed of State, federal, county, and other funds.
Through its partnerships and collaborations, CE is able to
generate additional extramural grant funding, further
increasing its ability to address local and statewide issues.
ANR continues to implement budget cuts enacted due to
California’s enduring state budget crisis. ANR’s budget
reduction decisions aimed to reduce administrative
overhead while focusing on ANR programs and people on
the future through its 2025 Strategic Vision. Efforts
continue to focus on reducing ANR’s administrative
footprint by forming multi-county partnerships, rather than
single county units, in order to administer UC’s research
and educational programs more efficiently and effectively.
In addition, ANR has refocused resources, including
existing competitive grant funds and endowment income
Public Service
75
(as appropriate), to support five strategic initiatives:
Sustainable Food Systems; Endemic and Invasive Pests
and Diseases; Sustainable Natural Ecosystems; Healthy
Families and Communities; and Water Quality, Quantity,
and Security.
Following are examples of CE programs working to address
challenges and inform policy:
Healthy Food Systems. Responding to local grower
issues, CE advisors played a key role in introducing new
UC-developed varieties of strawberries and blueberries to
California growers through field days, workshops, industry
meetings, and publications. A CE-led project on alternative
irrigation systems for rice fields led to a 98.5% reduction in
the mass flow of rice herbicides in the Sacramento River,
improving water quality for local residents and
demonstrating that alternative water quality management
strategies can be developed.
Healthy Environments. ANR’s Rangeland Watershed
Program won the 2012 Western Extension and Research
Director’s Award of Excellence. Over the past twenty
years, this program has collaborated with local water
districts, the U.S. Environmental Protection Agency, and
several state and federal natural resource agencies and
associations that own or influence the management of
rangelands. This multidisciplinary CE-AES team
successfully identified management strategies for
minimizing microbial hazards, developed monitoring
methods for assessing environmental or agro-ecosystem
health, and assessed vertebrate reservoirs of protozoa
pathogens.
Healthy Communities. ANR houses the California 4-H
Youth Development Program; 4-H is one of the largest
youth development programs in the nation. ANR’s program
has 20,000 dedicated volunteers, reaching youth (ages 5 to
19) statewide, across rural and urban areas. The program
engages youth in every California county through after-
school and classroom enrichment programs, science
literacy activities, and traditional livestock and leadership
club programs. Although over a century old, 4-H remains
very relevant, providing diverse experiences from robotics
clubs to promoting new community wellness programs.
The program serves as a driving force to position California
as a leader of science and technology.
Through the statewide Master Gardener Program, ANR
academics train local community members with research-
based information on landscape management and
horticulture, including plant selection, reduced pesticide
use, water conservation, and implementing “green”
practices. In 2011-12, over 5,400 UC Master Gardeners
volunteered more than 336,000 hours, the equivalent of
162 full-time positions.
Healthy Californians. In San Luis Obispo and Santa
Barbara counties, ANR’s Lunch Box program reached
3,600 families and improved the nutritional quality of
children’s packed lunches. Five educational handouts and
a poster in English and Spanish were developed to assist
parents in packing healthy lunches. The Lunch Box
handouts were provided to parents through their child’s
preschool, an ideal place for parents to learn positive ways
to contribute to their child’s overall health and well-being.
In addition, working with a Tulare school district, CE
advisors and specialists delivered the EatFit program to
sixth graders. The program includes nine lessons with an
online assessment (www.eatfit.net) and uses guided goal
setting to help students make positive behavior changes.
Students apply math concepts in EatFit while learning how
to improve their food choices and increase physical activity.
An evaluation of ANR’s EatFit program for low-income
students found that this approach not only improves eating
and physical activity habits, but also math and language
arts performance.
UMBILICAL CORD BLOOD COLLECTION PROGRAM
Developed pursuant to legislation chaptered in 2010
(AB 52, Portantino), UC established the Umbilical Cord
Blood Collection Program (UCBCP) to increase the
collection and availability of genetically diverse umbilical
cord blood for public use, including purposes such as life-
saving transplantation and adult stem cell research.
Revenue for the program will be provided, in part, through a
new $2 fee for certified copies of birth certificates, with
these fees estimated to generate $2.5 million annually. The
administrative home for the UCBCP is at the Davis campus
Public Service
76
with program activities extending across the state, within
the limits of available resources.
CHARLES R. DREW UNIVERSITY OF MEDICINE AND SCIENCE
The Charles R. Drew University of Medicine and Science
(CDU), a private, nonprofit corporation with its own Board of
Trustees, conducts educational and research programs in
south central Los Angeles. Since 1973, the State has
appropriated funds to UC to support a medical student
education program operated by the Los Angeles campus
in conjunction with CDU. State General Funds are
provided to CDU under two contracts, each administered by
the University. One contract provides State support for
medical education while the second supports a separate
public service program that funds activities in the Watts-
Willowbrook community.
Drew Medical Program
Historically, CDU received State funds through the
University’s budget for the training of 48 medical students
(including 24 third-year and 24 fourth-year students) and
170 medical residents. The historical activities
encompassed in the joint CDU/UCLA instructional program
are described in two affiliation agreements with the David
Geffen School of Medicine at the Los Angeles campus and
the Los Angeles campus’ School of Dentistry for student
clerkships. Students participating in the joint medical
education program earn a Doctor of Medicine (MD) degree,
which is granted by the Geffen School.
In 2008, CDU expanded its medical student enrollment by
four students (per class) as part of the UC PRogram in
Medical Education (PRIME) initiative. The Los Angeles
campus’ PRIME program is designed to train physician
leaders to be experts and advocates for improved
healthcare delivery systems in disadvantaged communities.
There are currently 126 medical students enrolled across a
four-year curriculum in the joint UCLA-CDU program,
including 56 budgeted third- and fourth-year students at
CDU.
Unfortunately, serious concerns involving patient care
activities occurred at Los Angeles County’s King/Drew
Medical Center (KDMC), the primary teaching hospital for
CDU, in the middle part of the last decade. Given the
seriousness of these matters, the Los Angeles County
Board of Supervisors, which has administrative and fiscal
responsibility for the hospital, closed KDMC in 2007. As a
result of the closure of the hospital, CDU voluntarily closed
its residency programs.
Although no residents are currently in training, the
University has worked with state, county, and other local
officials to develop a plan for opening the hospital under
new governance. This work is on schedule with a projected
goal for reopening the hospital in the fourth quarter of 2014.
Plans for re-establishing residency training are now in the
early stages of discussion.
Consistent with provisional language in the budget act, UC
reduced support for CDU by 5% in 2011-12. Funding for
CDU instructional and public service programs is
$8.3 million in State General Funds and $475,000 in
matching funds. The University provides additional support
from medical student Professional Degree Supplemental
Tuition revenue and other University funds to support CDU.
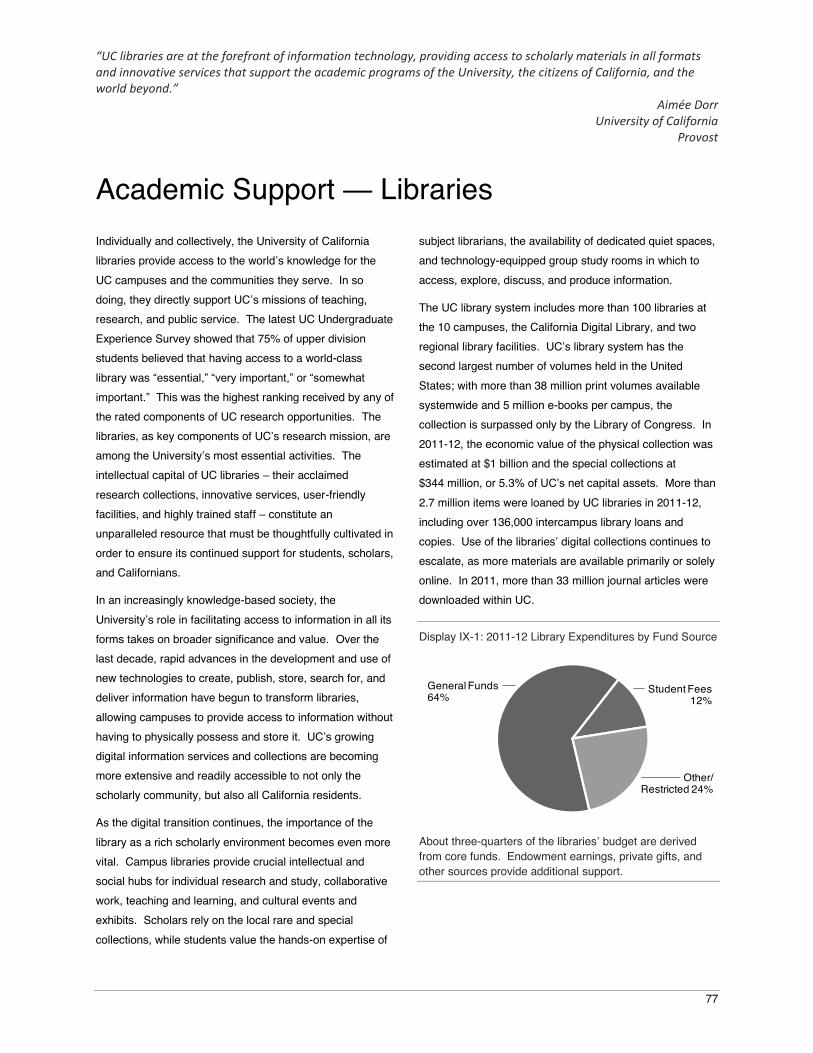
“UC libraries are at the forefront of information technology, providing access to scholarly materials in all formats and innovative services that support the academic programs of the University, the citizens of California, and the world beyond.”
Aimée Dorr University of California
Provost
77
Academic Support — Libraries
Individually and collectively, the University of California libraries provide access to the world’s knowledge for the UC campuses and the communities they serve. In so doing, they directly support UC’s missions of teaching, research, and public service. The latest UC Undergraduate Experience Survey showed that 75% of upper division students believed that having access to a world-class library was “essential,” “very important,” or “somewhat
important.” This was the highest ranking received by any of the rated components of UC research opportunities. The libraries, as key components of UC’s research mission, are among the University’s most essential activities. The intellectual capital of UC libraries – their acclaimed research collections, innovative services, user-friendly facilities, and highly trained staff – constitute an unparalleled resource that must be thoughtfully cultivated in order to ensure its continued support for students, scholars, and Californians.
In an increasingly knowledge-based society, the University’s role in facilitating access to information in all its forms takes on broader significance and value. Over the last decade, rapid advances in the development and use of new technologies to create, publish, store, search for, and deliver information have begun to transform libraries, allowing campuses to provide access to information without having to physically possess and store it. UC’s growing digital information services and collections are becoming more extensive and readily accessible to not only the scholarly community, but also all California residents.
As the digital transition continues, the importance of the library as a rich scholarly environment becomes even more vital. Campus libraries provide crucial intellectual and social hubs for individual research and study, collaborative work, teaching and learning, and cultural events and exhibits. Scholars rely on the local rare and special collections, while students value the hands-on expertise of
subject librarians, the availability of dedicated quiet spaces, and technology-equipped group study rooms in which to access, explore, discuss, and produce information.
The UC library system includes more than 100 libraries at the 10 campuses, the California Digital Library, and two regional library facilities. UC’s library system has the second largest number of volumes held in the United States; with more than 38 million print volumes available systemwide and 5 million e-books per campus, the collection is surpassed only by the Library of Congress. In 2011-12, the economic value of the physical collection was estimated at $1 billion and the special collections at $344 million, or 5.3% of UC’s net capital assets. More than 2.7 million items were loaned by UC libraries in 2011-12, including over 136,000 intercampus library loans and copies. Use of the libraries’ digital collections continues to escalate, as more materials are available primarily or solely online. In 2011, more than 33 million journal articles were downloaded within UC.
Display IX-1: 2011-12 Library Expenditures by Fund Source
About three-quarters of the libraries’ budget are derived from core funds. Endowment earnings, private gifts, and other sources provide additional support.
General Funds 64%
Student Fees 12%
Other/Restricted 24%
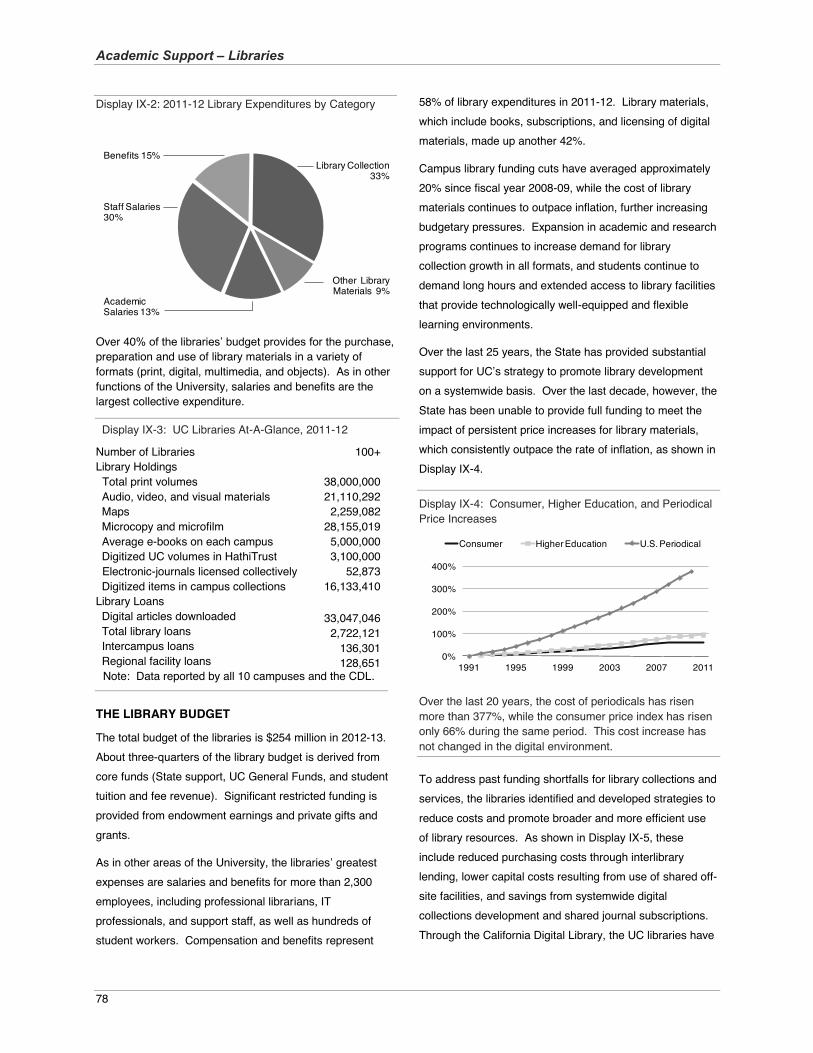
Academic Support – Libraries
78
Display IX-2: 2011-12 Library Expenditures by Category
Over 40% of the libraries’ budget provides for the purchase, preparation and use of library materials in a variety of formats (print, digital, multimedia, and objects). As in other functions of the University, salaries and benefits are the largest collective expenditure.
Display IX-3: UC Libraries At-A-Glance, 2011-12
Number of Libraries 100+ Library Holdings Total print volumes 38,000,000 Audio, video, and visual materials 21,110,292 Maps 2,259,082 Microcopy and microfilm 28,155,019 Average e-books on each campus 5,000,000 Digitized UC volumes in HathiTrust 3,100,000
Electronic-journals licensed collectively 52,873 Digitized items in campus collections 16,133,410
Library Loans Digital articles downloaded 33,047,046 Total library loans 2,722,121 Intercampus loans 136,301 Regional facility loans 128,651 Note: Data reported by all 10 campuses and the CDL.
THE LIBRARY BUDGET
The total budget of the libraries is $254 million in 2012-13. About three-quarters of the library budget is derived from core funds (State support, UC General Funds, and student tuition and fee revenue). Significant restricted funding is provided from endowment earnings and private gifts and grants.
As in other areas of the University, the libraries’ greatest expenses are salaries and benefits for more than 2,300 employees, including professional librarians, IT professionals, and support staff, as well as hundreds of student workers. Compensation and benefits represent
58% of library expenditures in 2011-12. Library materials, which include books, subscriptions, and licensing of digital materials, made up another 42%.
Campus library funding cuts have averaged approximately 20% since fiscal year 2008-09, while the cost of library materials continues to outpace inflation, further increasing budgetary pressures. Expansion in academic and research programs continues to increase demand for library collection growth in all formats, and students continue to demand long hours and extended access to library facilities that provide technologically well-equipped and flexible learning environments.
Over the last 25 years, the State has provided substantial support for UC’s strategy to promote library development on a systemwide basis. Over the last decade, however, the State has been unable to provide full funding to meet the impact of persistent price increases for library materials, which consistently outpace the rate of inflation, as shown in Display IX-4.
Display IX-4: Consumer, Higher Education, and Periodical Price Increases
Over the last 20 years, the cost of periodicals has risen more than 377%, while the consumer price index has risen only 66% during the same period. This cost increase has not changed in the digital environment.
To address past funding shortfalls for library collections and services, the libraries identified and developed strategies to reduce costs and promote broader and more efficient use of library resources. As shown in Display IX-5, these include reduced purchasing costs through interlibrary lending, lower capital costs resulting from use of shared off-site facilities, and savings from systemwide digital collections development and shared journal subscriptions. Through the California Digital Library, the UC libraries have
Academic Salaries 13%
Benefits 15%Library Collection
33%
Staff Salaries30%
Other Library Materials 9%
0%
100%
200%
300%
400%
1991 1995 1999 2003 2007 2011
Consumer Higher Education U.S. Periodical
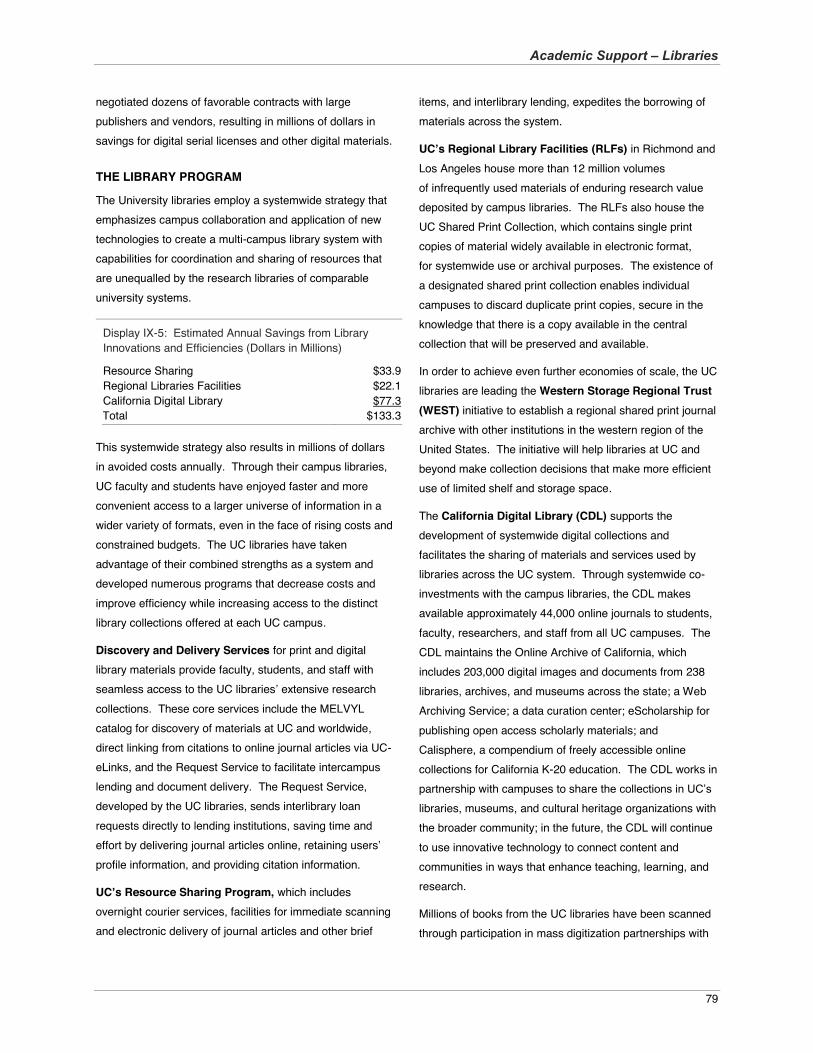
Academic Support – Libraries
79
negotiated dozens of favorable contracts with large publishers and vendors, resulting in millions of dollars in savings for digital serial licenses and other digital materials.
THE LIBRARY PROGRAM
The University libraries employ a systemwide strategy that emphasizes campus collaboration and application of new technologies to create a multi-campus library system with capabilities for coordination and sharing of resources that are unequalled by the research libraries of comparable university systems.
Display IX-5: Estimated Annual Savings from Library Innovations and Efficiencies (Dollars in Millions)
Resource Sharing $33.9 Regional Libraries Facilities $22.1 California Digital Library $77.3 Total $133.3
This systemwide strategy also results in millions of dollars in avoided costs annually. Through their campus libraries, UC faculty and students have enjoyed faster and more convenient access to a larger universe of information in a wider variety of formats, even in the face of rising costs and constrained budgets. The UC libraries have taken advantage of their combined strengths as a system and developed numerous programs that decrease costs and improve efficiency while increasing access to the distinct library collections offered at each UC campus.
Discovery and Delivery Services for print and digital library materials provide faculty, students, and staff with seamless access to the UC libraries’ extensive research collections. These core services include the MELVYL catalog for discovery of materials at UC and worldwide, direct linking from citations to online journal articles via UC-eLinks, and the Request Service to facilitate intercampus lending and document delivery. The Request Service, developed by the UC libraries, sends interlibrary loan requests directly to lending institutions, saving time and effort by delivering journal articles online, retaining users’ profile information, and providing citation information.
UC’s Resource Sharing Program, which includes overnight courier services, facilities for immediate scanning and electronic delivery of journal articles and other brief
items, and interlibrary lending, expedites the borrowing of materials across the system.
UC’s Regional Library Facilities (RLFs) in Richmond and Los Angeles house more than 12 million volumes of infrequently used materials of enduring research value deposited by campus libraries. The RLFs also house the UC Shared Print Collection, which contains single print copies of material widely available in electronic format, for systemwide use or archival purposes. The existence of a designated shared print collection enables individual campuses to discard duplicate print copies, secure in the knowledge that there is a copy available in the central collection that will be preserved and available.
In order to achieve even further economies of scale, the UC libraries are leading the Western Storage Regional Trust (WEST) initiative to establish a regional shared print journal archive with other institutions in the western region of the United States. The initiative will help libraries at UC and beyond make collection decisions that make more efficient use of limited shelf and storage space.
The California Digital Library (CDL) supports the development of systemwide digital collections and facilitates the sharing of materials and services used by libraries across the UC system. Through systemwide co-investments with the campus libraries, the CDL makes available approximately 44,000 online journals to students, faculty, researchers, and staff from all UC campuses. The CDL maintains the Online Archive of California, which includes 203,000 digital images and documents from 238 libraries, archives, and museums across the state; a Web Archiving Service; a data curation center; eScholarship for publishing open access scholarly materials; and Calisphere, a compendium of freely accessible online collections for California K-20 education. The CDL works in partnership with campuses to share the collections in UC’s
libraries, museums, and cultural heritage organizations with the broader community; in the future, the CDL will continue to use innovative technology to connect content and communities in ways that enhance teaching, learning, and research.
Millions of books from the UC libraries have been scanned through participation in mass digitization partnerships with
Academic Support – Libraries
80
Google and the Internet Archive. These projects expand the libraries’ ability to provide faculty, students, and the general
public with access to collections, as well as help preserve the content. Full text of public domain works, including historic and special collections, is freely available for browsing, reading, downloading, and research uses such as text-mining and digital scholarship.
The UC Libraries are founding partners in the HathiTrust, a collaboration of top-tier research universities to archive and share their digital collections. Through the HathiTrust, UC gains access to millions of digitized materials in the public domain, and benefits from cost-effective and reliable storage and preservation of its own materials.
The UC Curation Center (UC3) will help ensure that research data archiving and preservation meet the requirements of funding agencies by leveraging expertise and resources across UC to provide management, curation, and preservation of scholarly data.
Looking to the future, UC libraries are accelerating the digital transition by creating high-quality collections in digital formats while continuing to acquire traditional formats where needed. They are leading the way in the development of new licensing approaches, including open access and other new publishing models, pioneering solutions for the preservation and curation of digital materials, and expanding collaborative activities for greater efficiency. The libraries are becoming increasingly active partners in the dissemination of research, further ensuring that faculty, students, staff, and the general public have access to the world of UC’s scholarly collections and beyond. All of the UC libraries’ activities support the mission of UC as a leading research engine in the growth of California, the advancement of knowledge, and the education of California’s youth for a competitive workforce.
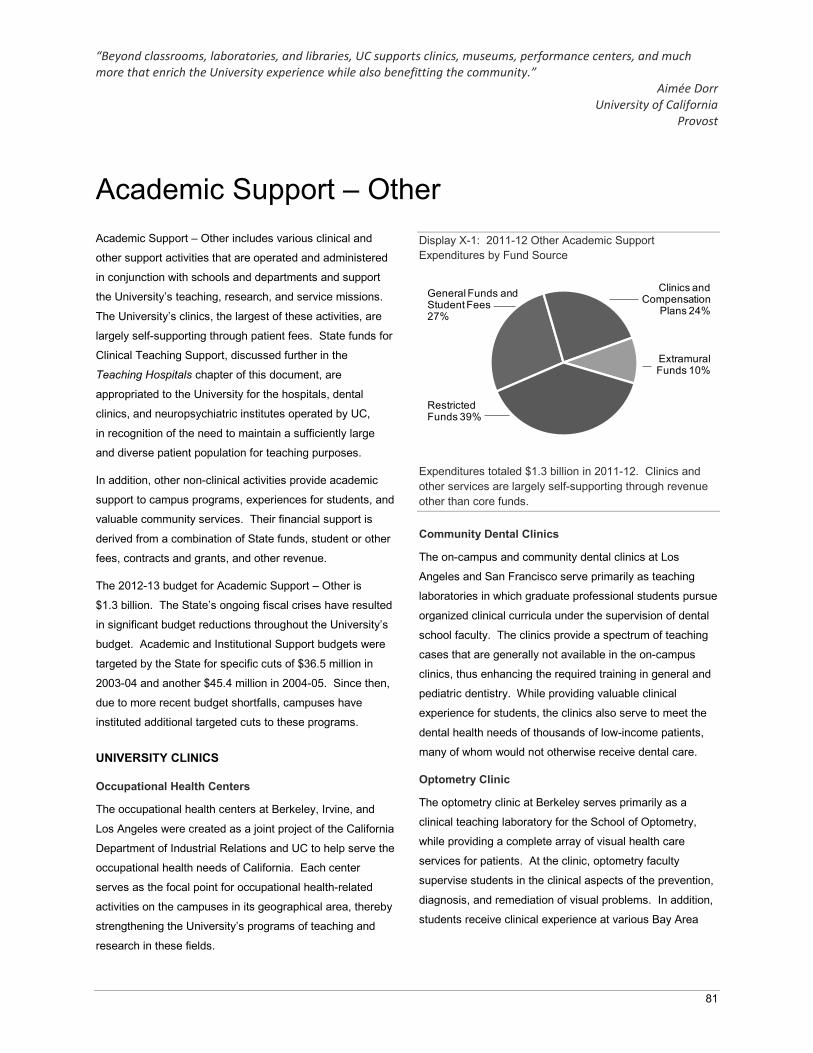
“Beyond classrooms, laboratories, and libraries, UC supports clinics, museums, performance centers, and much more that enrich the University experience while also benefitting the community.”
Aimée Dorr University of California
Provost
81
Academic Support – OtherAcademic Support – Other includes various clinical and
other support activities that are operated and administered
in conjunction with schools and departments and support
the University’s teaching, research, and service missions.
The University’s clinics, the largest of these activities, are
largely self-supporting through patient fees. State funds for
Clinical Teaching Support, discussed further in the
Teaching Hospitals chapter of this document, are
appropriated to the University for the hospitals, dental
clinics, and neuropsychiatric institutes operated by UC,
in recognition of the need to maintain a sufficiently large
and diverse patient population for teaching purposes.
In addition, other non-clinical activities provide academic
support to campus programs, experiences for students, and
valuable community services. Their financial support is
derived from a combination of State funds, student or other
fees, contracts and grants, and other revenue.
The 2012-13 budget for Academic Support – Other is
$1.3 billion. The State’s ongoing fiscal crises have resulted
in significant budget reductions throughout the University’s
budget. Academic and Institutional Support budgets were
targeted by the State for specific cuts of $36.5 million in
2003-04 and another $45.4 million in 2004-05. Since then,
due to more recent budget shortfalls, campuses have
instituted additional targeted cuts to these programs.
UNIVERSITY CLINICS
Occupational Health Centers
The occupational health centers at Berkeley, Irvine, and
Los Angeles were created as a joint project of the California
Department of Industrial Relations and UC to help serve the
occupational health needs of California. Each center
serves as the focal point for occupational health-related
activities on the campuses in its geographical area, thereby
strengthening the University’s programs of teaching and
research in these fields.
Display X-1: 2011-12 Other Academic Support Expenditures by Fund Source
Expenditures totaled $1.3 billion in 2011-12. Clinics and other services are largely self-supporting through revenue other than core funds.
Community Dental Clinics
The on-campus and community dental clinics at Los
Angeles and San Francisco serve primarily as teaching
laboratories in which graduate professional students pursue
organized clinical curricula under the supervision of dental
school faculty. The clinics provide a spectrum of teaching
cases that are generally not available in the on-campus
clinics, thus enhancing the required training in general and
pediatric dentistry. While providing valuable clinical
experience for students, the clinics also serve to meet the
dental health needs of thousands of low-income patients,
many of whom would not otherwise receive dental care.
Optometry Clinic
The optometry clinic at Berkeley serves primarily as a
clinical teaching laboratory for the School of Optometry,
while providing a complete array of visual health care
services for patients. At the clinic, optometry faculty
supervise students in the clinical aspects of the prevention,
diagnosis, and remediation of visual problems. In addition,
students receive clinical experience at various Bay Area
General Funds and Student Fees 27%
ExtramuralFunds 10%
Clinics and Compensation
Plans 24%
Restricted Funds 39%
Academic Support – Other
82
community health centers, which exposes them to a broad
range of cases and provides a much-needed public service
to the community.
Veterinary Clinics
The veterinary medicine clinical teaching facilities at Davis
and in the San Joaquin Valley, and the satellite site in San
Diego, are specialized teaching hospitals and clinics that
support the UC Davis School of Veterinary Medicine. In
these facilities, faculty train students enrolled in veterinary
medicine in the clinical aspects of diagnosis, treatment,
prevention, and control of diseases in animals.
Neuropsychiatric Institutes
UC’s two neuropsychiatric institutes are among the state’s
principal resources for the education and training of
psychiatric residents and other mental health professionals,
and for the provision of mental health services. The
primary missions of the institutes are to treat patients with
diseases of the nervous system and to strive for excellence
in the development of approaches to problems associated
with developmental, behavioral, psychological, and
neurological disorders.
OTHER ACADEMIC SUPPORT PROGRAMS
In addition to the clinics, UC operates a wide variety of
other programs that are administered with schools and
departments and enhance the University’s teaching,
research, and service activities. Some examples are
described below.
Laboratory School
The laboratory school at the Los Angeles campus serves
as a laboratory for experimentation, research, and teacher
professional development in the field of education. The
self-supporting school educates pre-K-6 children and
contributes to the advancement of education through
research efforts and application of results.
Vivaria and Herbaria
Each campus operates vivaria and herbaria, which are
centralized facilities for the ordering, receiving, and care of
all animals and plants essential to instruction and research.
Museums and Galleries
The University operates many museums and galleries.
These cultural resources are open to children and adults
throughout the state and are largely self-supporting,
generating revenue through ticket sales. Many of UC’s
museum and gallery holdings are also available to UC
faculty and students conducting research.
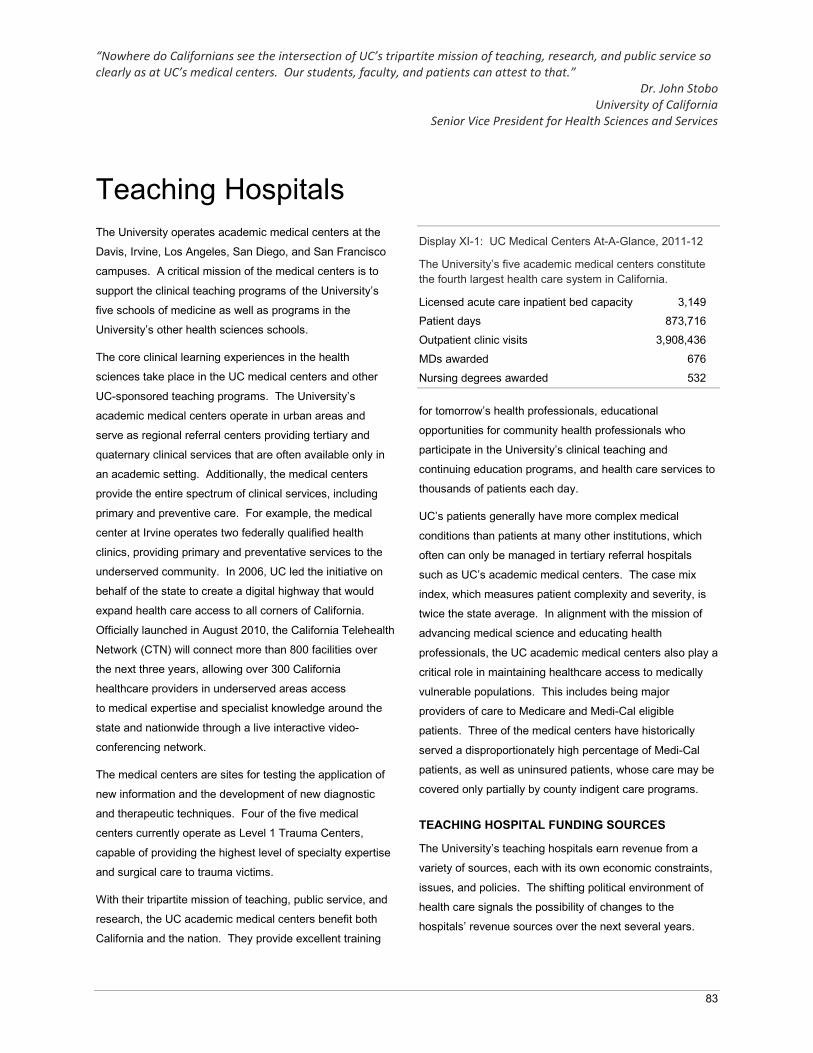
“Nowhere do Californians see the intersection of UC’s tripartite mission of teaching, research, and public service so clearly as at UC’s medical centers. Our students, faculty, and patients can attest to that.”
Dr. John Stobo University of California
Senior Vice President for Health Sciences and Services
83
Teaching HospitalsThe University operates academic medical centers at the
Davis, Irvine, Los Angeles, San Diego, and San Francisco
campuses. A critical mission of the medical centers is to
support the clinical teaching programs of the University’s
five schools of medicine as well as programs in the
University’s other health sciences schools.
The core clinical learning experiences in the health
sciences take place in the UC medical centers and other
UC-sponsored teaching programs. The University’s
academic medical centers operate in urban areas and
serve as regional referral centers providing tertiary and
quaternary clinical services that are often available only in
an academic setting. Additionally, the medical centers
provide the entire spectrum of clinical services, including
primary and preventive care. For example, the medical
center at Irvine operates two federally qualified health
clinics, providing primary and preventative services to the
underserved community. In 2006, UC led the initiative on
behalf of the state to create a digital highway that would
expand health care access to all corners of California.
Officially launched in August 2010, the California Telehealth
Network (CTN) will connect more than 800 facilities over
the next three years, allowing over 300 California
healthcare providers in underserved areas access
to medical expertise and specialist knowledge around the
state and nationwide through a live interactive video-
conferencing network.
The medical centers are sites for testing the application of
new information and the development of new diagnostic
and therapeutic techniques. Four of the five medical
centers currently operate as Level 1 Trauma Centers,
capable of providing the highest level of specialty expertise
and surgical care to trauma victims.
With their tripartite mission of teaching, public service, and
research, the UC academic medical centers benefit both
California and the nation. They provide excellent training
Display XI-1: UC Medical Centers At-A-Glance, 2011-12
The University’s five academic medical centers constitute the fourth largest health care system in California.
Licensed acute care inpatient bed capacity 3,149Patient days 873,716
Outpatient clinic visits 3,908,436
MDs awarded 676
Nursing degrees awarded 532
for tomorrow’s health professionals, educational
opportunities for community health professionals who
participate in the University’s clinical teaching and
continuing education programs, and health care services to
thousands of patients each day.
UC’s patients generally have more complex medical
conditions than patients at many other institutions, which
often can only be managed in tertiary referral hospitals
such as UC’s academic medical centers. The case mix
index, which measures patient complexity and severity, is
twice the state average. In alignment with the mission of
advancing medical science and educating health
professionals, the UC academic medical centers also play a
critical role in maintaining healthcare access to medically
vulnerable populations. This includes being major
providers of care to Medicare and Medi-Cal eligible
patients. Three of the medical centers have historically
served a disproportionately high percentage of Medi-Cal
patients, as well as uninsured patients, whose care may be
covered only partially by county indigent care programs.
TEACHING HOSPITAL FUNDING SOURCES
The University’s teaching hospitals earn revenue from a
variety of sources, each with its own economic constraints,
issues, and policies. The shifting political environment of
health care signals the possibility of changes to the
hospitals’ revenue sources over the next several years.
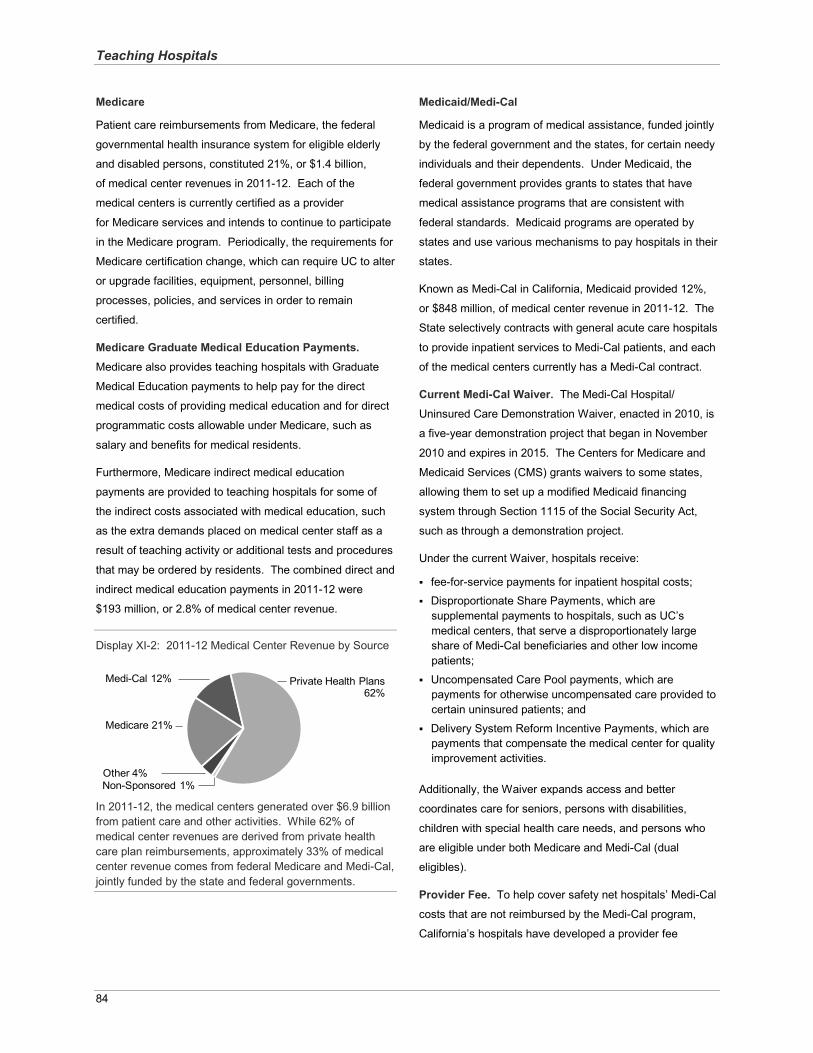
Teaching Hospitals
84
Medicare
Patient care reimbursements from Medicare, the federal
governmental health insurance system for eligible elderly
and disabled persons, constituted 21%, or $1.4 billion,
of medical center revenues in 2011-12. Each of the
medical centers is currently certified as a provider
for Medicare services and intends to continue to participate
in the Medicare program. Periodically, the requirements for
Medicare certification change, which can require UC to alter
or upgrade facilities, equipment, personnel, billing
processes, policies, and services in order to remain
certified.
Medicare Graduate Medical Education Payments.Medicare also provides teaching hospitals with Graduate
Medical Education payments to help pay for the direct
medical costs of providing medical education and for direct
programmatic costs allowable under Medicare, such as
salary and benefits for medical residents.
Furthermore, Medicare indirect medical education
payments are provided to teaching hospitals for some of
the indirect costs associated with medical education, such
as the extra demands placed on medical center staff as a
result of teaching activity or additional tests and procedures
that may be ordered by residents. The combined direct and
indirect medical education payments in 2011-12 were
$193 million, or 2.8% of medical center revenue.
Display XI-2: 2011-12 Medical Center Revenue by Source
In 2011-12, the medical centers generated over $6.9 billionfrom patient care and other activities. While 62% of medical center revenues are derived from private health care plan reimbursements, approximately 33% of medical center revenue comes from federal Medicare and Medi-Cal,jointly funded by the state and federal governments.
Medicaid/Medi-Cal
Medicaid is a program of medical assistance, funded jointly
by the federal government and the states, for certain needy
individuals and their dependents. Under Medicaid, the
federal government provides grants to states that have
medical assistance programs that are consistent with
federal standards. Medicaid programs are operated by
states and use various mechanisms to pay hospitals in their
states.
Known as Medi-Cal in California, Medicaid provided 12%,
or $848 million, of medical center revenue in 2011-12. The
State selectively contracts with general acute care hospitals
to provide inpatient services to Medi-Cal patients, and each
of the medical centers currently has a Medi-Cal contract.
Current Medi-Cal Waiver. The Medi-Cal Hospital/
Uninsured Care Demonstration Waiver, enacted in 2010, is
a five-year demonstration project that began in November
2010 and expires in 2015. The Centers for Medicare and
Medicaid Services (CMS) grants waivers to some states,
allowing them to set up a modified Medicaid financing
system through Section 1115 of the Social Security Act,
such as through a demonstration project.
Under the current Waiver, hospitals receive:
fee-for-service payments for inpatient hospital costs;Disproportionate Share Payments, which are supplemental payments to hospitals, such as UC’smedical centers, that serve a disproportionately large share of Medi-Cal beneficiaries and other low income patients;
Uncompensated Care Pool payments, which are payments for otherwise uncompensated care provided to certain uninsured patients; and
Delivery System Reform Incentive Payments, which are payments that compensate the medical center for quality improvement activities.
Additionally, the Waiver expands access and better
coordinates care for seniors, persons with disabilities,
children with special health care needs, and persons who
are eligible under both Medicare and Medi-Cal (dual
eligibles).
Provider Fee. To help cover safety net hospitals’ Medi-Cal
costs that are not reimbursed by the Medi-Cal program,
California’s hospitals have developed a provider fee
Private Health Plans 62%
Medicare 21%
Medi-Cal 12%
Non-Sponsored 1%Other 4%
Teaching Hospitals
85
program. Hospitals are assessed fees and the resulting
funds serve as the non-federal share to draw matching
federal funds.
Private Health Plans and Managed Care
Private health plans, in all forms, represent the largest
source of revenue for the medical centers. Revenue from
this source is $4.2 billion in 2011-12. Health care, including
hospital services, is increasingly paid for by “managed
care” plans that incentivize reduced or limited cost and
utilization of health care services. Managed care plans pay
providers in various ways, including:
negotiated fee-for-service rates, and
“capitation” payments under which hospitals are paid a predetermined periodic rate for each enrollee in the plan who is assigned or otherwise directed to receive care at a particular hospital.
Under each model of managed care, providers assume a
financial risk for the cost and scope of institutional care
provided to a plan’s enrollees. If a medical center is unable
to adequately contain its associated costs, net income is
adversely affected; conversely, medical centers that
improve efficiency or reduce incurred costs maximize
revenue.
Other Sources
Clinical Teaching Support. State General Funds are
appropriated to the University in recognition of the need to
maintain a sufficiently large and diverse patient population
at the medical centers for teaching purposes. These funds,
called Clinical Teaching Support (CTS), are generally used
to provide financial support for patients who are essential
for the teaching program because their cases are rare or
complicated (providing good training experience), but who
are unable to pay the full cost of their care. Prior to recent
budget cuts, CTS funds represented about $45 million,
about 1% of the total operating revenue for the medical
centers in 2007-08. During the recent fiscal crisis,
campuses have had the flexibility to reduce CTS funds to
help address budget shortfalls. In 2011-12, permanently
budgeted CTS funds declined to $22.7 million.
County Funding Programs. Counties in the State of
California reimburse certain hospitals for selected indigent
patients covered under the county’s adult indigent program.
Counties use local tax dollars from their general fund to
subsidize health care for the indigent. The downturn in the
state’s economy also affected local county revenues,
creating increased competition among local services
for reduced funds, severely constraining the ability of local
governments to adequately fund health care services to the
uninsured. Measures enacted to mitigate the impacts have
not provided full relief. In 2011-12, total county funding
represented $76.3 million, or 1.1% of medical center
revenue.
CURRENT CHALLENGES AND ISSUES
UC medical centers are subject to a wide variety of
pressures that may impact their financial outlook over the
next several years, including:
changes to the federal Medicare program that affect direct and indirect support for medical education and reimbursement for patient care;
changes to federal Medi-Cal payments for patient care, including aggregate caps on supplemental payments;
increased pressure to make health care services more affordable and link payments to the type and quality ofservice provided and the outcomes they achieve;
increasing unreimbursed costs related to medically uninsured patients;rising costs of pharmaceuticals and medical supplies;
increasing salary and benefit costs, including reinstatement of employer contributions to UC’s retirement system;
increasing employer contributions to UCRP, which are becoming a growing proportion of medical centers’ fixed costs, and without increasing efficiency, could result in negative operating margins;
financing seismic retrofit and other significant capital needs, such as upgrades necessary for programmatic changes;
increasing demand for services and capacity constraints; a shortage of key personnel, particularly laboratory technicians, and radiology technicians, resulting in increased use of temporary labor; community preparedness activities, such as establishing procedures for responding to epidemics; and
compliance with government regulations, such as AB 394, which established licensed nurse-to-patient ratio requirements, effective January 1, 2004.
Despite these economic issues, the UC medical centers
must generate sufficient funds to meet their teaching
mission and support their schools of medicine. The
Teaching Hospitals
86
financial viability of the UC medical centers depends upon
payment strategies that recognize the need to maintain an
operating margin sufficient to cover debt, provide working
capital, purchase state-of-the-art equipment, invest in
infrastructure and program expansion, support medical
education, and allow care for the poor. The medical
centers continue to grow and enjoy robust earnings, but the
future presents challenges, including those associated with
health care reform.
HEALTH CARE REFORM
The enactment of health care reform in March 2010,
through the Patient Protection and Affordable Care Act and
its accompanying reconciliation bill, the Health Care and
Education Reconciliation Act, is a historic opportunity to
improve the nation’s health care delivery system by
expanding health insurance coverage by the year 2019 to
32 million Americans who are currently uninsured. Health
care reform expands Medicaid coverage, offers coverage to
adults not currently covered by safety net programs for the
uninsured, provides broader access to insurance through
the establishment of insurance exchanges, and includes
many other provisions that would expand coverage.
Disproportionate Share Hospital Payments. UC medical
centers and other safety net hospitals that provide care to a
large number of low-income individuals stand to receive
lower federal supplements through the federal
Disproportionate Share Hospital (DSH) payments, which
serve to compensate hospitals for this type of more costly
care, and to help provide low-income individuals access to
treatment. In order to expand health insurance coverage to
another 32 million people, the health reform law reduces
DSH payments to California hospitals, including UC
teaching hospitals.
State Health Insurance Exchange. The California State
Health Insurance Exchange will be officially operational by
January 1, 2014. While it is difficult to predict the full
impact it will have on UC Health, it is clear the Exchange
seeks to control the costs of health insurance premiums,
challenging UC to lower unit costs and incentivize quality in
the delivery of health care. The University has several
initiatives underway that address cost and quality issues.
Graduate Medical Education. The Affordable Care Act
provides for an additional 32 million U.S. citizens to receive
health insurance, either through enrollment in the State
Medicaid Program or through participation in the State
Health Insurance Exchange. This will require the additional
provision of health care services, particularly in primary
care prevention areas. In turn, this will require additional
health care providers, or, more realistically, changes to how
health care is provided. This is an opportunity for UC to
use its expertise in using innovative health care delivery
systems to large populations.
UC as a Safety Net. UC’s five academic medical centers
are a major part of California’s hospital safety net and
provide complex care to a diverse population that includes
many low-income patients. Health care costs are
significantly higher in areas of poverty, where patients have
less access to care and tend to be sicker when they arrive
at hospitals, requiring more extensive, and thus more
expensive, care. This situation needs to be taken into
account when entities pay for health care services, as UC’s
cost for delivery are higher than non-safety net institutions.
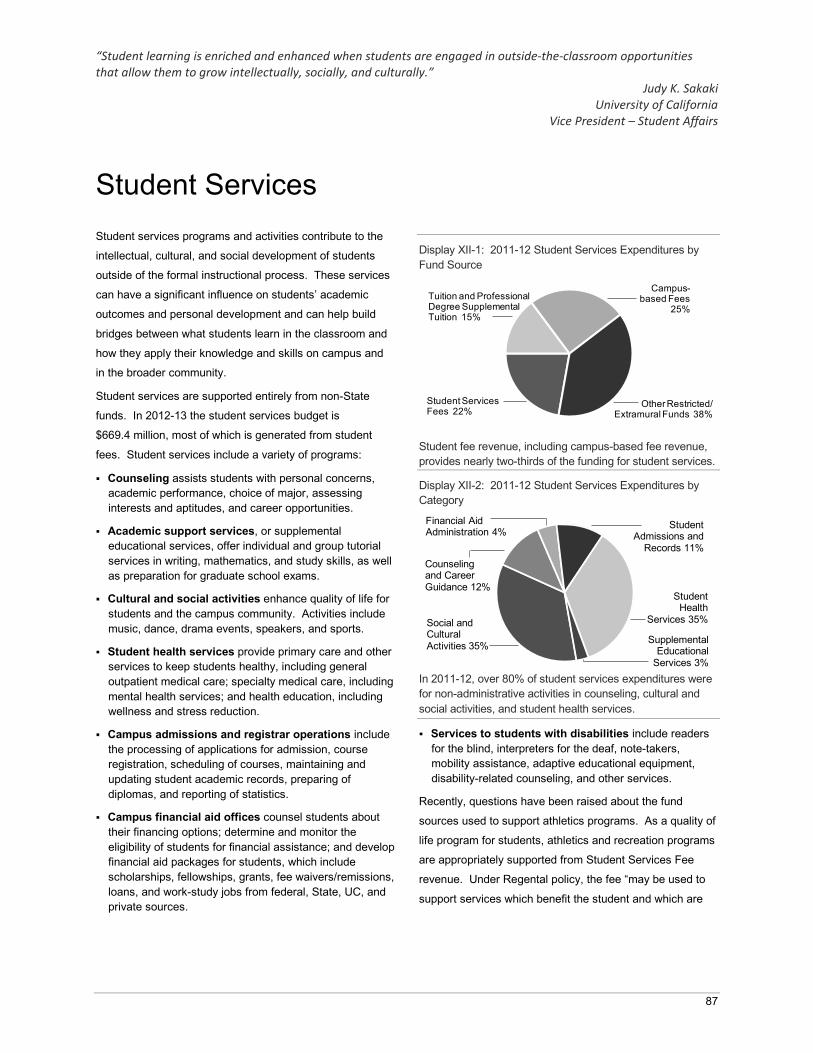
“Student learning is enriched and enhanced when students are engaged in outside-the-classroom opportunities that allow them to grow intellectually, socially, and culturally.”
Judy K. Sakaki University of California
Vice President – Student Affairs
87
Student ServicesStudent services programs and activities contribute to the
intellectual, cultural, and social development of students
outside of the formal instructional process. These services
can have a significant influence on students’ academic
outcomes and personal development and can help build
bridges between what students learn in the classroom and
how they apply their knowledge and skills on campus and
in the broader community.
Student services are supported entirely from non-State
funds. In 2012-13 the student services budget is
$669.4 million, most of which is generated from student
fees. Student services include a variety of programs:
Counseling assists students with personal concerns, academic performance, choice of major, assessing interests and aptitudes, and career opportunities.
Academic support services, or supplemental educational services, offer individual and group tutorial services in writing, mathematics, and study skills, as well as preparation for graduate school exams.
Cultural and social activities enhance quality of life for students and the campus community. Activities include music, dance, drama events, speakers, and sports.
Student health services provide primary care and other services to keep students healthy, including general outpatient medical care; specialty medical care, including mental health services; and health education, including wellness and stress reduction.
Campus admissions and registrar operations include the processing of applications for admission, course registration, scheduling of courses, maintaining and updating student academic records, preparing of diplomas, and reporting of statistics.
Campus financial aid offices counsel students about their financing options; determine and monitor the eligibility of students for financial assistance; and develop financial aid packages for students, which include scholarships, fellowships, grants, fee waivers/remissions, loans, and work-study jobs from federal, State, UC, and private sources.
Display XII-1: 2011-12 Student Services Expenditures by Fund Source
Student fee revenue, including campus-based fee revenue, provides nearly two-thirds of the funding for student services.
Display XII-2: 2011-12 Student Services Expenditures by Category
In 2011-12, over 80% of student services expenditures were for non-administrative activities in counseling, cultural and social activities, and student health services.
Services to students with disabilities include readers for the blind, interpreters for the deaf, note-takers,mobility assistance, adaptive educational equipment, disability-related counseling, and other services.
Recently, questions have been raised about the fund
sources used to support athletics programs. As a quality of
life program for students, athletics and recreation programs
are appropriately supported from Student Services Fee
revenue. Under Regental policy, the fee “may be used to
support services which benefit the student and which are
Tuition and Professional Degree Supplemental Tuition 15%
Other Restricted/ Extramural Funds 38%
Campus-based Fees
25%
Student Services Fees 22%
Social and Cultural Activities 35% Supplemental
Educational Services 3%
Counseling and Career Guidance 12%
Student Health
Services 35%
Student Admissions and
Records 11%
Financial Aid Administration 4%
Student Services
88
complementary to, but not a part of, the instructional
program.”1
Athletics and recreation are primarily budgeted as a student
service rather than an auxiliary enterprise, although three
campuses manage a portion of their intercollegiate athletics
and recreation programs as auxiliaries with self-supporting
revenue sources, such as ticket sales and concessions.
Issues about funding for intercollegiate athletics were
examined as part of a recent audit by the Bureau of State
Audits. The audit found no issue with UC’s policies or
procedures with regard to funding for athletics.
Student services programs, as with most University
programs, suffer from underfunding. Student services were
adversely affected by severe budget cuts during the early
1990s, when the University was forced to make reductions
due to the State’s fiscal crisis; those cuts have not
been restored. In 2002-03, student services programs
were again reduced by a mid-year cut of $6.3 million, which
grew to $25.3 million in 2003-04 – equivalent to a 20%
reduction in Student Services Fee-funded programs.
These reductions occurred when student enrollment
increased with corresponding growth in demand for student
services, including during summer.
Due to the University’s continued budget shortfall across
the system, student services positions have been
eliminated, frozen, and consolidated, even though the
demand for student services continues to grow on each of
the campuses. Campuses estimate that they will continue
to reduce staffing during this fiscal year.
While adequate support for student services remains a high
priority, it is becoming increasingly difficult, as student
needs change and more students enroll at UC, to provide
adequate services for students in the face of severely
reduced budgets.
STUDENT MENTAL HEALTH SERVICES
In recent years, student mental health issues have become
a growing concern at UC as well as at other higher
education institutions across the nation. Psychological
counseling has become an area of major importance, given
1 The University of California Student Tuition and Fee Policy is available at www.universityofcalifornia.edu/ regents/policies/3101.html.
the increasing numbers of students arriving annually who
are on medications or who manifest behavioral or other
psychological issues that negatively impact their wellness
and academic performance or that of other members of the
UC community.
A comprehensive systemwide review of student mental
health issues and the challenges associated with providing
these necessary services, which was presented to the
Regents in September 2006, found the following:
consistent with national trends, UC students are presenting mental health issues (e.g., suicidal threats,depression, stress, and anxiety) with greater frequency and complexity (e.g., prescribed psychotropic medications in combination with psychological counseling);
budget constraints limit campus capacity (e.g., increasing psychological counseling staff) to respond to mental health issues and result in longer student wait times, difficulty retaining staff, and decreased services and programs; and
increasing demand and declining capacity pose a threat to the learning environment because of the significant adverse impacts on faculty, staff, and fellow students when students are inadequately cared for through the existing mental health system.
Recommendations in the final report were organized within
a three-tier model: Critical Mental Health Services,
Targeted Interventions for Vulnerable Groups, and Creating
Healthier Learning Environments. The model was created
to provide a framework for meeting the fundamental mental
health needs of students and for providing safe and healthy
campus environments across the system. The
recommendations include:
Tier I, restoring critical mental health services to fully respond to students in distress or at risk;
Tier II, implementing and augmenting targeted interventions through education, support, and prevention programs, and restoring staffing levels in those units best poised to assist high-risk students; and
Tier III, taking a comprehensive approach to creating healthier learning environments by enhancing the full spectrum of student life services and by revising administrative policies and academic practices in order to promote communication and collaboration.
In response to the urgent priority to enhance mental health
services, in 2007-08 and 2008-09 the University dedicated
$12 million in funding from Student Services Fee increases
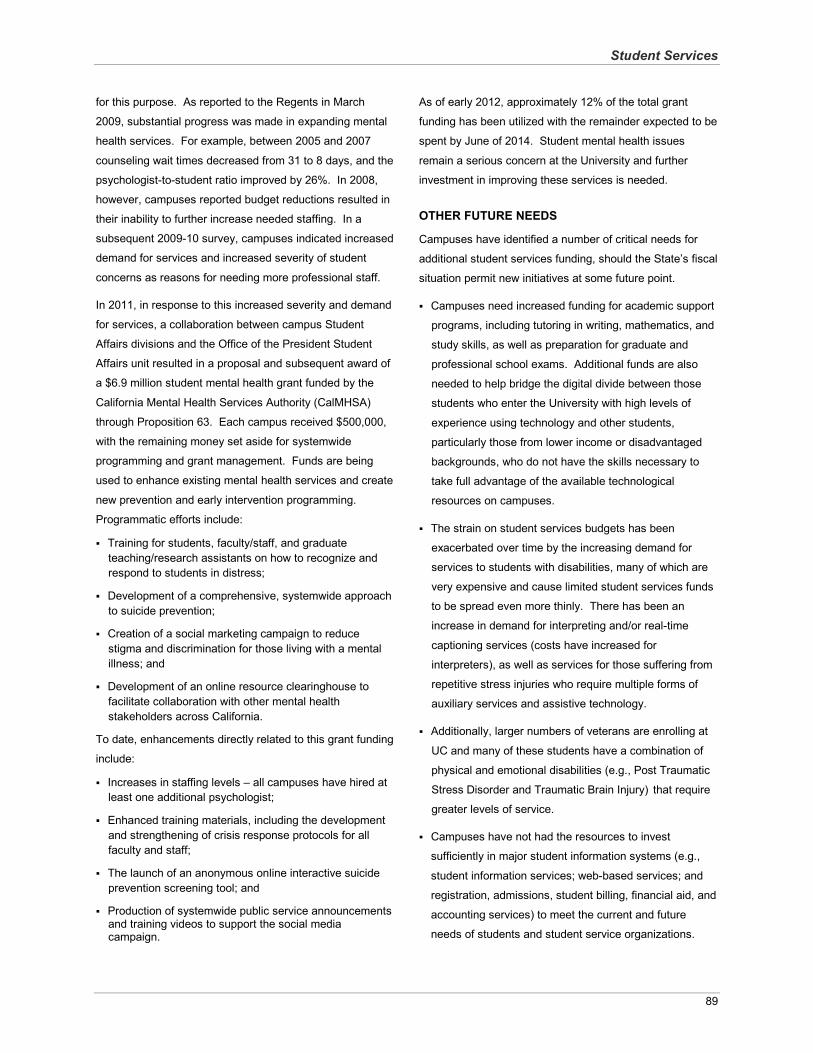
Student Services
89
for this purpose. As reported to the Regents in March
2009, substantial progress was made in expanding mental
health services. For example, between 2005 and 2007
counseling wait times decreased from 31 to 8 days, and the
psychologist-to-student ratio improved by 26%. In 2008,
however, campuses reported budget reductions resulted in
their inability to further increase needed staffing. In a
subsequent 2009-10 survey, campuses indicated increased
demand for services and increased severity of student
concerns as reasons for needing more professional staff.
In 2011, in response to this increased severity and demand
for services, a collaboration between campus Student
Affairs divisions and the Office of the President Student
Affairs unit resulted in a proposal and subsequent award of
a $6.9 million student mental health grant funded by the
California Mental Health Services Authority (CalMHSA)
through Proposition 63. Each campus received $500,000,
with the remaining money set aside for systemwide
programming and grant management. Funds are being
used to enhance existing mental health services and create
new prevention and early intervention programming.
Programmatic efforts include:
Training for students, faculty/staff, and graduate teaching/research assistants on how to recognize and respond to students in distress;
Development of a comprehensive, systemwide approach to suicide prevention;
Creation of a social marketing campaign to reduce stigma and discrimination for those living with a mental illness; and
Development of an online resource clearinghouse tofacilitate collaboration with other mental health stakeholders across California.
To date, enhancements directly related to this grant funding
include:
Increases in staffing levels – all campuses have hired at least one additional psychologist;
Enhanced training materials, including the development and strengthening of crisis response protocols for all faculty and staff;
The launch of an anonymous online interactive suicide prevention screening tool; and
Production of systemwide public service announcementsand training videos to support the social media campaign.
As of early 2012, approximately 12% of the total grant
funding has been utilized with the remainder expected to be
spent by June of 2014. Student mental health issues
remain a serious concern at the University and further
investment in improving these services is needed.
OTHER FUTURE NEEDS
Campuses have identified a number of critical needs for
additional student services funding, should the State’s fiscal
situation permit new initiatives at some future point.
Campuses need increased funding for academic support
programs, including tutoring in writing, mathematics, and
study skills, as well as preparation for graduate and
professional school exams. Additional funds are also
needed to help bridge the digital divide between those
students who enter the University with high levels of
experience using technology and other students,
particularly those from lower income or disadvantaged
backgrounds, who do not have the skills necessary to
take full advantage of the available technological
resources on campuses.
The strain on student services budgets has been
exacerbated over time by the increasing demand for
services to students with disabilities, many of which are
very expensive and cause limited student services funds
to be spread even more thinly. There has been an
increase in demand for interpreting and/or real-time
captioning services (costs have increased for
interpreters), as well as services for those suffering from
repetitive stress injuries who require multiple forms of
auxiliary services and assistive technology.
Additionally, larger numbers of veterans are enrolling at
UC and many of these students have a combination of
physical and emotional disabilities (e.g., Post Traumatic
Stress Disorder and Traumatic Brain Injury) that require
greater levels of service.
Campuses have not had the resources to invest
sufficiently in major student information systems (e.g.,
student information services; web-based services; and
registration, admissions, student billing, financial aid, and
accounting services) to meet the current and future
needs of students and student service organizations.
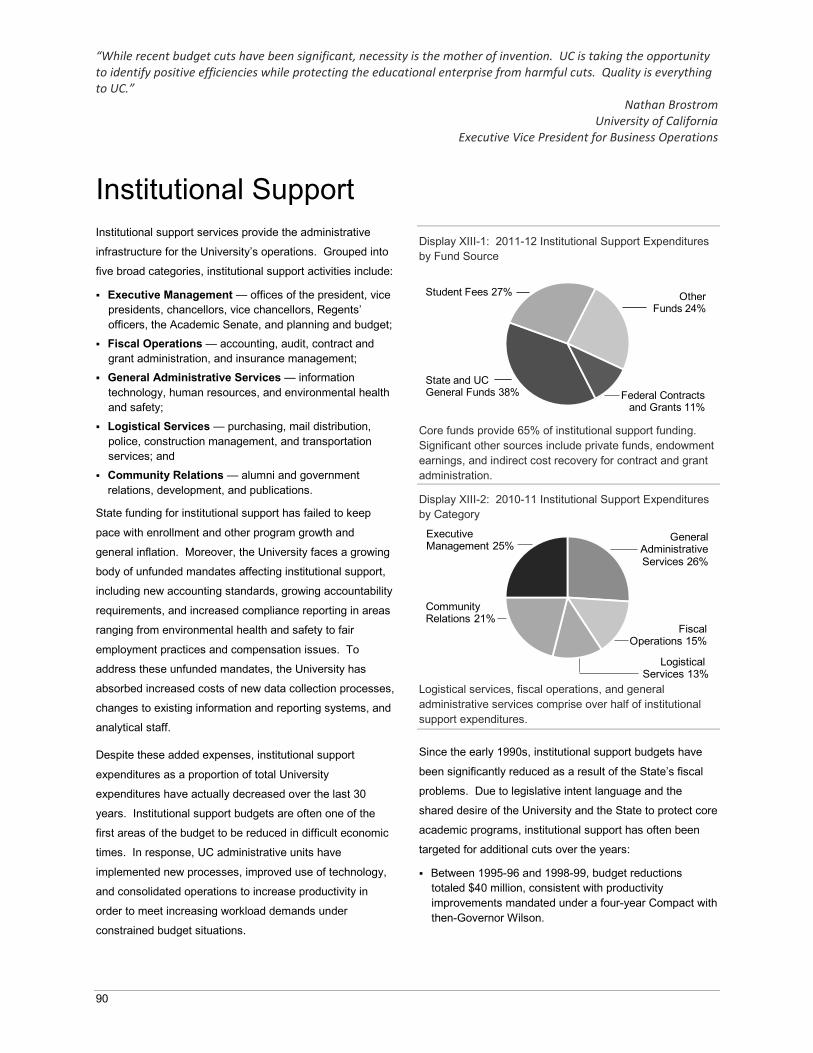
“While recent budget cuts have been significant, necessity is the mother of invention. UC is taking the opportunity to identify positive efficiencies while protecting the educational enterprise from harmful cuts. Quality is everything to UC.”
Nathan Brostrom University of California
Executive Vice President for Business Operations
90
Institutional SupportInstitutional support services provide the administrative
infrastructure for the University’s operations. Grouped into
five broad categories, institutional support activities include:
Executive Management — offices of the president, vice presidents, chancellors, vice chancellors, Regents’ officers, the Academic Senate, and planning and budget;
Fiscal Operations — accounting, audit, contract and grant administration, and insurance management;
General Administrative Services — information technology, human resources, and environmental health and safety;
Logistical Services — purchasing, mail distribution, police, construction management, and transportation services; and
Community Relations — alumni and government relations, development, and publications.
State funding for institutional support has failed to keep
pace with enrollment and other program growth and
general inflation. Moreover, the University faces a growing
body of unfunded mandates affecting institutional support,
including new accounting standards, growing accountability
requirements, and increased compliance reporting in areas
ranging from environmental health and safety to fair
employment practices and compensation issues. To
address these unfunded mandates, the University has
absorbed increased costs of new data collection processes,
changes to existing information and reporting systems, and
analytical staff.
Despite these added expenses, institutional support
expenditures as a proportion of total University
expenditures have actually decreased over the last 30
years. Institutional support budgets are often one of the
first areas of the budget to be reduced in difficult economic
times. In response, UC administrative units have
implemented new processes, improved use of technology,
and consolidated operations to increase productivity in
order to meet increasing workload demands under
constrained budget situations.
Display XIII-1: 2011-12 Institutional Support Expenditures by Fund Source
Core funds provide 65% of institutional support funding. Significant other sources include private funds, endowment earnings, and indirect cost recovery for contract and grant administration.
Display XIII-2: 2010-11 Institutional Support Expenditures by Category
Logistical services, fiscal operations, and general administrative services comprise over half of institutional support expenditures.
Since the early 1990s, institutional support budgets have
been significantly reduced as a result of the State’s fiscal
problems. Due to legislative intent language and the
shared desire of the University and the State to protect core
academic programs, institutional support has often been
targeted for additional cuts over the years:
Between 1995-96 and 1998-99, budget reductions totaled $40 million, consistent with productivity improvements mandated under a four-year Compact withthen-Governor Wilson.
Other Funds 24%
Federal Contracts and Grants 11%
Student Fees 27%
State and UC General Funds 38%
Fiscal Operations 15%
Logistical Services 13%
General Administrative Services 26%
Executive Management 25%
Community Relations 21%
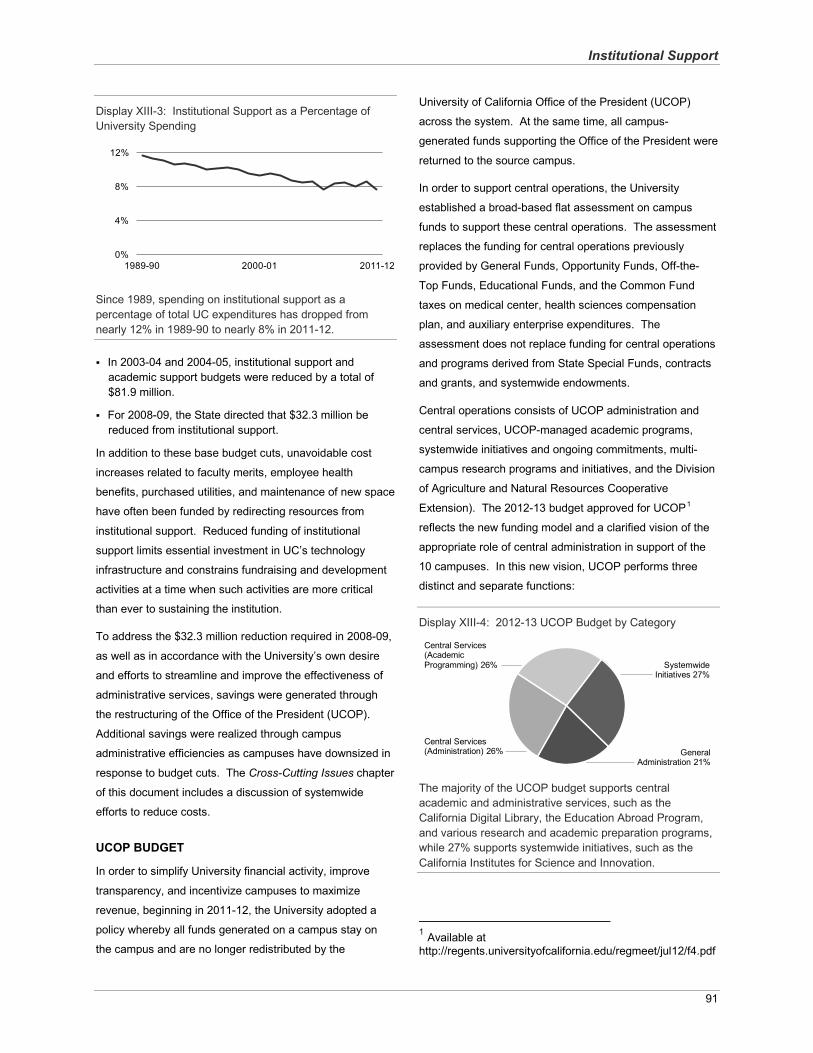
Institutional Support
91
Display XIII-3: Institutional Support as a Percentage of University Spending
Since 1989, spending on institutional support as a percentage of total UC expenditures has dropped fromnearly 12% in 1989-90 to nearly 8% in 2011-12.
In 2003-04 and 2004-05, institutional support andacademic support budgets were reduced by a total of $81.9 million.
For 2008-09, the State directed that $32.3 million be reduced from institutional support.
In addition to these base budget cuts, unavoidable cost
increases related to faculty merits, employee health
benefits, purchased utilities, and maintenance of new space
have often been funded by redirecting resources from
institutional support. Reduced funding of institutional
support limits essential investment in UC’s technology
infrastructure and constrains fundraising and development
activities at a time when such activities are more critical
than ever to sustaining the institution.
To address the $32.3 million reduction required in 2008-09,
as well as in accordance with the University’s own desire
and efforts to streamline and improve the effectiveness of
administrative services, savings were generated through
the restructuring of the Office of the President (UCOP).
Additional savings were realized through campus
administrative efficiencies as campuses have downsized in
response to budget cuts. The Cross-Cutting Issues chapter
of this document includes a discussion of systemwide
efforts to reduce costs.
UCOP BUDGET
In order to simplify University financial activity, improve
transparency, and incentivize campuses to maximize
revenue, beginning in 2011-12, the University adopted a
policy whereby all funds generated on a campus stay on
the campus and are no longer redistributed by the
University of California Office of the President (UCOP)
across the system. At the same time, all campus-
generated funds supporting the Office of the President were
returned to the source campus.
In order to support central operations, the University
established a broad-based flat assessment on campus
funds to support these central operations. The assessment
replaces the funding for central operations previously
provided by General Funds, Opportunity Funds, Off-the-
Top Funds, Educational Funds, and the Common Fund
taxes on medical center, health sciences compensation
plan, and auxiliary enterprise expenditures. The
assessment does not replace funding for central operations
and programs derived from State Special Funds, contracts
and grants, and systemwide endowments.
Central operations consists of UCOP administration and
central services, UCOP-managed academic programs,
systemwide initiatives and ongoing commitments, multi-
campus research programs and initiatives, and the Division
of Agriculture and Natural Resources Cooperative
Extension). The 2012-13 budget approved for UCOP1
reflects the new funding model and a clarified vision of the
appropriate role of central administration in support of the
10 campuses. In this new vision, UCOP performs three
distinct and separate functions:
Display XIII-4: 2012-13 UCOP Budget by Category
The majority of the UCOP budget supports central academic and administrative services, such as the California Digital Library, the Education Abroad Program, and various research and academic preparation programs, while 27% supports systemwide initiatives, such as the California Institutes for Science and Innovation.
1 Available at http://regents.universityofcalifornia.edu/regmeet/jul12/f4.pdf
0%
4%
8%
12%
1989-90 2000-01 2011-12
Central Services (Academic Programming) 26% Systemwide
Initiatives 27%
Central Services (Administration) 26% General
Administration 21%
Institutional Support
92
General administration, which includes those
responsibilities that UCOP performs on behalf of the entire
University of California system, including the campuses, the
medical centers, and the Lawrence Berkeley National
Laboratory. These responsibilities include governance, as
performed by the direct reports of the Board of the Regents
(the Secretary and Chief of Staff, the Chief Compliance and
Audit Officer, the Treasurer, and the General Counsel of
the Regents) and the Academic Senate.
Central services, which UCOP provides to the entire
system to avoid redundancy of functions at each campus.
These services include:
Administrative functions, including systemwide budget management and external relations, management of the single retirement and benefit systems, and the financial management of the University, including banking services, cash management, corporate accounting, risk services, and strategic sourcing; and
Academic programs, including central administration of a single digital library system, UC Press, campus-based research, admissions, and student academic preparation.
Systemwide initiatives, which are administered at and/or
funded from the center to the benefit of the entire UC
system. These initiatives include critical academic and
research programs, such as the UC Observatories and the
California Institutes for Science and Innovation; external
relations, advocacy and public service activities conducted
on behalf of the system; the statewide cooperative
extension program administered by Agriculture and Natural
Resources; and the administration of non-campus-based
facilities, such as the UC Washington Center.
As shown in Display XIII-4, over half of the UCOP budget
supports central services, both administrative and
academic. General administration, including the Academic
Senate and Regents’ Officers, is only 21% of total
operations.
In 2012-13, the total UCOP budget increased slightly, by
about 1%, from 2011-12. This is attributable entirely to a
change in budget methodology in the restricted portion of
its budget, whereby for the first time $42 million in patent
revenue – which flow through UCOP to the campuses – is
accounted for in the budget. UCOP, however, reduced
spending by 3% from unrestricted fund sources even after
absorbing dramatically rising fixed salary and benefit costs.
The total UCOP budget represents about 2.5% of the
overall University of California budget, with less than one-
fourth supporting core administrative functions. This level
of support compares favorably to other public university
systems, most of which have central administrations that
do not have responsibility for such functions as systemwide
retirement and benefits programs, labor relations,
centralized undergraduate admissions, and administration
of Department of Energy national laboratories.
UCOP remains critical to the success of the UC system.
A well-operated central administration reduces redundancy
across the system and helps strategically position the
campuses to excel.
GROWTH IN NON-ACADEMIC PERSONNEL
The growth in academic versus non-academic personnel is
a topic that reemerges periodically, particularly during times
of budgetary shortfalls and during salary negotiations for
specific employee groups. The current budget crisis has
rekindled concerns that growth in administration is
outpacing growth in student enrollments, and has come at
the expense of growth in faculty and the University’s
instructional program. An analysis of financial and payroll
data from fiscal years 1997-98 and 2011-12 helps to clarify
where personnel growth has occurred and identifies
primary factors driving such growth.
Almost three-quarters of the 139,049 base full-time
equivalent (FTE) personnel at the University in 2011-12
were employed in non-academic personnel categories—
Professional Support Staff (PSS), Managers and Senior
Professionals (MSP), and the Senior Management Group
(SMG). This proportion has been stable since 1997-98.
The high percentage of non-academic staff reflects the
complexity of the institution; the extraordinary array of
functions that support its tripartite mission of teaching,
research, and public service; and in part the way that
personnel are classified. In particular, non-academic
personnel include thousands of employees at UC’s medical
centers and at the campuses, who provide direct services
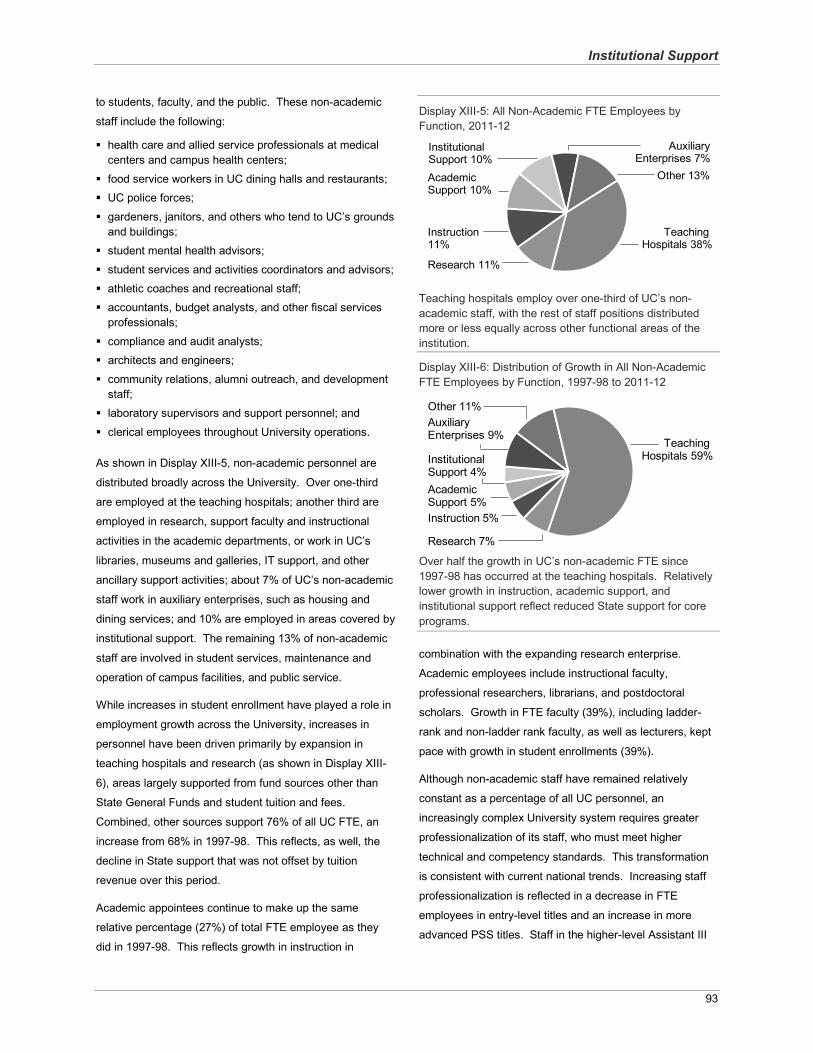
Institutional Support
93
to students, faculty, and the public. These non-academic
staff include the following:
health care and allied service professionals at medical centers and campus health centers;
food service workers in UC dining halls and restaurants;UC police forces;
gardeners, janitors, and others who tend to UC’s grounds and buildings;student mental health advisors;
student services and activities coordinators and advisors;
athletic coaches and recreational staff;accountants, budget analysts, and other fiscal services professionals;
compliance and audit analysts;architects and engineers;
community relations, alumni outreach, and development staff;laboratory supervisors and support personnel; and
clerical employees throughout University operations.
As shown in Display XIII-5, non-academic personnel are
distributed broadly across the University. Over one-third
are employed at the teaching hospitals; another third are
employed in research, support faculty and instructional
activities in the academic departments, or work in UC’s
libraries, museums and galleries, IT support, and other
ancillary support activities; about 7% of UC’s non-academic
staff work in auxiliary enterprises, such as housing and
dining services; and 10% are employed in areas covered by
institutional support. The remaining 13% of non-academic
staff are involved in student services, maintenance and
operation of campus facilities, and public service.
While increases in student enrollment have played a role in
employment growth across the University, increases in
personnel have been driven primarily by expansion in
teaching hospitals and research (as shown in Display XIII-
6), areas largely supported from fund sources other than
State General Funds and student tuition and fees.
Combined, other sources support 76% of all UC FTE, an
increase from 68% in 1997-98. This reflects, as well, the
decline in State support that was not offset by tuition
revenue over this period.
Academic appointees continue to make up the same
relative percentage (27%) of total FTE employee as they
did in 1997-98. This reflects growth in instruction in
Display XIII-5: All Non-Academic FTE Employees by Function, 2011-12
Teaching hospitals employ over one-third of UC’s non-academic staff, with the rest of staff positions distributed more or less equally across other functional areas of the institution.
Display XIII-6: Distribution of Growth in All Non-Academic FTE Employees by Function, 1997-98 to 2011-12
Over half the growth in UC’s non-academic FTE since 1997-98 has occurred at the teaching hospitals. Relatively lower growth in instruction, academic support, and institutional support reflect reduced State support for core programs.
combination with the expanding research enterprise.
Academic employees include instructional faculty,
professional researchers, librarians, and postdoctoral
scholars. Growth in FTE faculty (39%), including ladder-
rank and non-ladder rank faculty, as well as lecturers, kept
pace with growth in student enrollments (39%).
Although non-academic staff have remained relatively
constant as a percentage of all UC personnel, an
increasingly complex University system requires greater
professionalization of its staff, who must meet higher
technical and competency standards. This transformation
is consistent with current national trends. Increasing staff
professionalization is reflected in a decrease in FTE
employees in entry-level titles and an increase in more
advanced PSS titles. Staff in the higher-level Assistant III
Teaching Hospitals 38%
Academic Support 10%
Instruction 11%
Research 11%
Institutional Support 10%
Other 13%
Auxiliary Enterprises 7%
Other 11%
Teaching Hospitals 59%Institutional
Support 4%
Auxiliary Enterprises 9%
Academic Support 5%
Research 7%
Instruction 5%
Institutional Support
94
titles in the basic clerical/administrative series of the PSS
personnel program increased 74%, while staff in the mid-
range Assistant II titles fell 46%, and Assistant I titles,
populated with entry-level positions, declined by 81%
between 1997-98 and 2011-12. There has also been a
modest shift in the distribution of employees from the PSS
to the MSP category, with MSP titles growing from 3% to
6% of all FTE personnel and PSS titles experiencing a
corresponding decline from 70% to 67%. The MSP
category includes not only managers but a wide variety of
other professional occupations – among them computer
programmers and analysts, physicians and dentists,
engineers, and administrative budget/personnel analysts.
While still comprising over half of the personnel in the MSP
category, manager positions have declined slightly from
58% in 1997-98 to 54% in 2011-12, while computer
programmer and analyst positions have increased from
13% to 17%. There have also been small increases in the
relative proportion of MSP FTE employees in nursing
services, school relations services, and architecture and
planning.
The number of executive leadership personnel (SMG)
declined during this period from 315 to 191 FTE. This
decline reflects in large part a realignment of about 100
academic deans and other faculty administrator titles from
the SMG personnel category to the academic personnel
program. The SMG category continues to represent well
below 1% of total FTE employees.
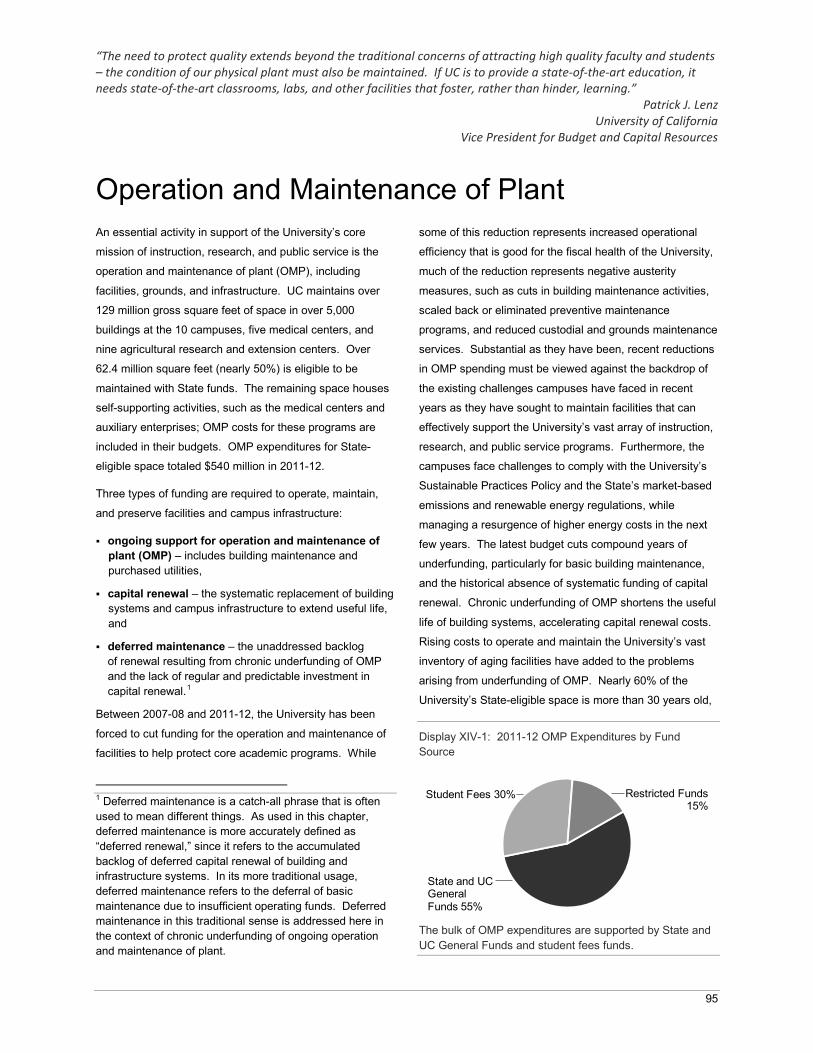
“The need to protect quality extends beyond the traditional concerns of attracting high quality faculty and students – the condition of our physical plant must also be maintained. If UC is to provide a state-of-the-art education, it needs state-of-the-art classrooms, labs, and other facilities that foster, rather than hinder, learning.”
Patrick J. Lenz University of California
Vice President for Budget and Capital Resources
95
Operation and Maintenance of PlantAn essential activity in support of the University’s core
mission of instruction, research, and public service is the
operation and maintenance of plant (OMP), including
facilities, grounds, and infrastructure. UC maintains over
129 million gross square feet of space in over 5,000
buildings at the 10 campuses, five medical centers, and
nine agricultural research and extension centers. Over
62.4 million square feet (nearly 50%) is eligible to be
maintained with State funds. The remaining space houses
self-supporting activities, such as the medical centers and
auxiliary enterprises; OMP costs for these programs are
included in their budgets. OMP expenditures for State-
eligible space totaled $540 million in 2011-12.
Three types of funding are required to operate, maintain,
and preserve facilities and campus infrastructure:
ongoing support for operation and maintenance of plant (OMP) – includes building maintenance and purchased utilities,
capital renewal – the systematic replacement of building systems and campus infrastructure to extend useful life,and
deferred maintenance – the unaddressed backlog of renewal resulting from chronic underfunding of OMPand the lack of regular and predictable investment in capital renewal.1
Between 2007-08 and 2011-12, the University has been
forced to cut funding for the operation and maintenance of
facilities to help protect core academic programs. While
1 Deferred maintenance is a catch-all phrase that is often used to mean different things. As used in this chapter, deferred maintenance is more accurately defined as “deferred renewal,” since it refers to the accumulated backlog of deferred capital renewal of building and infrastructure systems. In its more traditional usage, deferred maintenance refers to the deferral of basic maintenance due to insufficient operating funds. Deferred maintenance in this traditional sense is addressed here in the context of chronic underfunding of ongoing operation and maintenance of plant.
some of this reduction represents increased operational
efficiency that is good for the fiscal health of the University,
much of the reduction represents negative austerity
measures, such as cuts in building maintenance activities,
scaled back or eliminated preventive maintenance
programs, and reduced custodial and grounds maintenance
services. Substantial as they have been, recent reductions
in OMP spending must be viewed against the backdrop of
the existing challenges campuses have faced in recent
years as they have sought to maintain facilities that can
effectively support the University’s vast array of instruction,
research, and public service programs. Furthermore, the
campuses face challenges to comply with the University’s
Sustainable Practices Policy and the State’s market-based
emissions and renewable energy regulations, while
managing a resurgence of higher energy costs in the next
few years. The latest budget cuts compound years of
underfunding, particularly for basic building maintenance,
and the historical absence of systematic funding of capital
renewal. Chronic underfunding of OMP shortens the useful
life of building systems, accelerating capital renewal costs.
Rising costs to operate and maintain the University’s vast
inventory of aging facilities have added to the problems
arising from underfunding of OMP. Nearly 60% of the
University’s State-eligible space is more than 30 years old,
Display XIV-1: 2011-12 OMP Expenditures by Fund Source
The bulk of OMP expenditures are supported by State and UC General Funds and student fees funds.
Restricted Funds 15%
Student Fees 30%
State and UC General Funds 55%
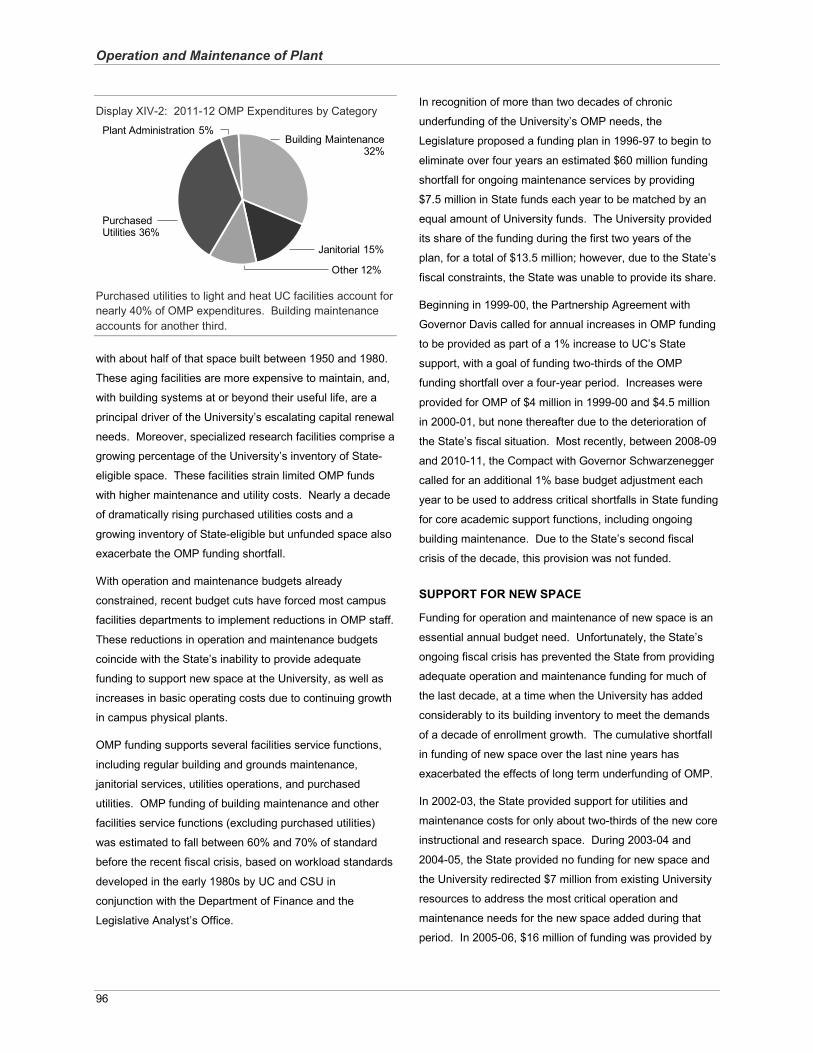
Operation and Maintenance of Plant
96
Display XIV-2: 2011-12 OMP Expenditures by Category
Purchased utilities to light and heat UC facilities account for nearly 40% of OMP expenditures. Building maintenance accounts for another third.
with about half of that space built between 1950 and 1980.
These aging facilities are more expensive to maintain, and,
with building systems at or beyond their useful life, are a
principal driver of the University’s escalating capital renewal
needs. Moreover, specialized research facilities comprise a
growing percentage of the University’s inventory of State-
eligible space. These facilities strain limited OMP funds
with higher maintenance and utility costs. Nearly a decade
of dramatically rising purchased utilities costs and a
growing inventory of State-eligible but unfunded space also
exacerbate the OMP funding shortfall.
With operation and maintenance budgets already
constrained, recent budget cuts have forced most campus
facilities departments to implement reductions in OMP staff.
These reductions in operation and maintenance budgets
coincide with the State’s inability to provide adequate
funding to support new space at the University, as well as
increases in basic operating costs due to continuing growth
in campus physical plants.
OMP funding supports several facilities service functions,
including regular building and grounds maintenance,
janitorial services, utilities operations, and purchased
utilities. OMP funding of building maintenance and other
facilities service functions (excluding purchased utilities)
was estimated to fall between 60% and 70% of standard
before the recent fiscal crisis, based on workload standards
developed in the early 1980s by UC and CSU in
conjunction with the Department of Finance and the
Legislative Analyst’s Office.
In recognition of more than two decades of chronic
underfunding of the University’s OMP needs, the
Legislature proposed a funding plan in 1996-97 to begin to
eliminate over four years an estimated $60 million funding
shortfall for ongoing maintenance services by providing
$7.5 million in State funds each year to be matched by an
equal amount of University funds. The University provided
its share of the funding during the first two years of the
plan, for a total of $13.5 million; however, due to the State’s
fiscal constraints, the State was unable to provide its share.
Beginning in 1999-00, the Partnership Agreement with
Governor Davis called for annual increases in OMP funding
to be provided as part of a 1% increase to UC’s State
support, with a goal of funding two-thirds of the OMP
funding shortfall over a four-year period. Increases were
provided for OMP of $4 million in 1999-00 and $4.5 million
in 2000-01, but none thereafter due to the deterioration of
the State’s fiscal situation. Most recently, between 2008-09
and 2010-11, the Compact with Governor Schwarzenegger
called for an additional 1% base budget adjustment each
year to be used to address critical shortfalls in State funding
for core academic support functions, including ongoing
building maintenance. Due to the State’s second fiscal
crisis of the decade, this provision was not funded.
SUPPORT FOR NEW SPACE
Funding for operation and maintenance of new space is an
essential annual budget need. Unfortunately, the State’s
ongoing fiscal crisis has prevented the State from providing
adequate operation and maintenance funding for much of
the last decade, at a time when the University has added
considerably to its building inventory to meet the demands
of a decade of enrollment growth. The cumulative shortfall
in funding of new space over the last nine years has
exacerbated the effects of long term underfunding of OMP.
In 2002-03, the State provided support for utilities and
maintenance costs for only about two-thirds of the new core
instructional and research space. During 2003-04 and
2004-05, the State provided no funding for new space and
the University redirected $7 million from existing University
resources to address the most critical operation and
maintenance needs for the new space added during that
period. In 2005-06, $16 million of funding was provided by
Janitorial 15%
Building Maintenance 32%
Plant Administration 5%
Other 12%
Purchased Utilities 36%
Operation and Maintenance of Plant
97
the State to support space added that year and to partially
backfill the unfunded space that had opened during the
preceding two years.
In response to legislative supplemental budget language,
the Department of Finance, the Legislative Analyst’s Office,
UC, and CSU revised the marginal cost of instruction
calculation formula in 2006-07 to reflect more accurately
the cost of both hiring new faculty and maintenance of new
space. Using the new methodology2, $8.3 million was
provided in 2006-07 and another $9.2 million was provided
in 2007-08 for new space.
With no State funding for OMP in 2008-09 due to the
State’s fiscal crisis, UC redirected $9.7 million of permanent
savings from restructuring at the Office of the President
to ensure that campuses had basic operating and
maintenance funds to open 983,000 gross square feet of
new space.
Given the absence of State funding again in 2009-10 and
the State’s continuing fiscal difficulties, the University
redirected one-time savings from debt restructuring
to provide $11.2 million in 2009-10 and $19.5 million in
2010-11 to cover maintenance of new space for 1.1 million
gross square feet. This funding did not address the
significant permanent budget need to support new space,
but it did provide temporary relief, especially to those
campuses opening large core instructional and research
buildings at a time of significant cuts to operating budgets.
The 2010-11 State budget provided $51.3 million for 5,121
new FTE (based on a marginal cost of instruction of
$10,012), of which approximately $6.4 million covered the
cost for maintenance of new space. However, since that
time, no funding for maintenance of new space has been
provided. In fact, the University has borne an additional
$750 million budget cut and continues to face severe
financial challenges due to unfunded cost increases. The
University is now operating over 4 million square feet of
core program space that is eligible for State support but
unfunded by the State, representing almost $40 million of
support that the State is not providing. Campuses have
been forced to redirect other resources or reduce other
2 A discussion of the marginal cost methodology may be found in the General Campus Instruction chapter.
OMP expenditures to operate these unfunded facilities.
Continuing to redirect funds from within strained existing
resources to operate and maintain facilities is not
sustainable over the long term. High-quality instructional
research and public service programs require well-
maintained, state-of-the-art facilities.
PURCHASED UTILITIES
For 2013-14, the University estimates an increase in
purchased utilities costs of only $8 million, based on a
projected increase above inflation of 4% for electricity and
1% for natural gas.3 This slowdown in energy commodity
cost increases is a significant change from recent years
primarily due to the abundance of natural gas availability for
electric generation. As discussed below, however, longer
term forecasts identify a number of factors that will drive a
resurgence of higher energy costs in the next few years.
Purchased Utilities Costs and Funding Since 2001
Since the energy crisis of 2001, rising electricity and natural
gas prices have had a severe impact on the ability of
campuses to manage overall OMP costs. The University’s
expenditures for electricity and natural gas commodities
jumped 120% between 1999-00 and 2009-10, which is
substantially higher than the general inflation rate of 31%
for the same period. Escalating energy costs have forced
campuses to redirect funds from other programs and make
cuts within constrained OMP budgets. Because of UC’s
long-term natural gas contracts, the steep decline in natural
gas prices in 2010 had a limited effect on lowering UC’s
procurement costs.
Evolving Energy and Carbon Markets and UC’s Sustainable Practices and Goals – New Challenges
Pressures in the electricity supply chain will push prices up
significantly through 2020 due to the implementation of the
carbon emissions market (“cap-and-trade”) under AB 32,
which also requires that, by 2020, a third of the State’s
energy generation be from renewable sources. As an
3 The projection of electricity prices is based on investor-owned utility rate cases as filed for the period beginning in 2013 and corroborated by the consulting firm E3, which provides projections to the utilities. Natural gas prices will remain relatively flat for the 2013-14 period based on NYMEX projections and the long-term contracts that most campuses have signed for natural gas purchases.
Operation and Maintenance of Plant
98
unintended consequence, this mandate renders the current
transmission system inadequate to accommodate the
remotely located renewable energy sources, and the aging
utility-owned distribution system will require significant
investment in the years ahead, including Smart Grid
expenditures. These factors and costs associated with
meeting the goals of UC’s Sustainable Practices Policy4
exacerbate the OMP funding challenges campuses already
face.
Financial Impact of AB 32 – Cap and Trade
Six UC campuses are classified as large emitters (i.e., sites
with emissions in excess of 25,000 metric tons of carbon
dioxide equivalent (MTCO2e) per year) under the current
cap-and-trade regulations promulgated by the California
Air Resources Board (CARB). Collectively these
campuses are required to purchase 625,000 tons of
carbon allowances in the first year at an estimated cost of
$6.3 - 25 million. Due to uncertainties in the evolving
market, it is not possible to forecast the carbon costs with
accuracy. Any costs will need to be funded from already
constrained OMP budgets. UC is in discussions with CARB
to find a strategy to help mitigate the financial impact on UC
of the cap-and-trade regulations.
Financial Impact of AB 32 – 33% Renewable Energy Content
Statewide, all utilities and energy service providers must
meet a 33% renewable energy content requirement for all
electricity deliveries by 2020. In order to achieve that
objective, besides having to construct massive renewable
energy generating facilities, the transmission delivery
system requires unprecedented upgrades to accommodate
these often remotely located generation sources. Further
goals to include small distributed generation in the supply
grid (e.g., the Thousand Roof photo-voltaic program) drive
the need for more sophisticated but costly local distribution
systems, generally referred to as Smart Grids. The major
utilities estimate that rates will increase by more than 16%
by 2020 over current prices to finance these infrastructure
improvements.
4 www.ucop.edu/ucophome/coordrev/policy/ sustainable-practices-policy.pdf
In the absence of additional State funding, campuses have
historically absorbed the steep rise in energy commodity
costs by reducing other operation and maintenance
expenditures – a difficult tradeoff during a time of declining
State funding and against the backdrop of historical
underfunding of OMP – and by redirecting other program
funds. Even with its aggressive efforts to reduce overall
energy use, UC will need to continue to redirect resources
to cover shortfalls in purchased utilities funding.
Impact of UC Growth on Purchased Utility Costs
Purchased utilities costs are affected by both commodity
rates and consumption levels. Higher commodity rates for
electricity and natural gas account for most of the steep rise
in purchased utilities costs since 1999-00, although costs
have declined modestly over the last few years. UC’s
energy consumption has also increased since 1999-00, but
at a slower rate than enrollment-driven growth in new space
as a result of aggressive energy efficiency standards for
new buildings and efficiency retrofits in existing facilities.
Between 1999-00 and 2009-10, the University’s State-
eligible space increased by 20% while overall energy
consumption increased by only about 13%. This slower
growth in energy consumption is noteworthy because much
of the University’s new space has been laboratory and
other specialized research facilities, which can typically
consume more than twice as much energy as basic
classroom and office buildings. Such buildings with
complex mechanical systems, which now comprise
approximately half of the total State-eligible space, account
for nearly two-thirds of the energy use in the University’s
State-eligible space, as shown in Display XIV-4. Energy
efficiency measures have helped to mitigate much of this
increased energy demand. With its requirement that new
facilities be designed so that energy use is 20% below
existing Title 24 State standards, the University’s Policy
on Sustainable Practices dictates that energy efficiency
remain a priority for new construction. Nevertheless, as it
continues to replace buildings with more complex
laboratories and specialized research facilities supporting
programs in engineering and the physical and biological
sciences, the University will face challenges as it seeks to
reduce energy consumption and keep costs down.
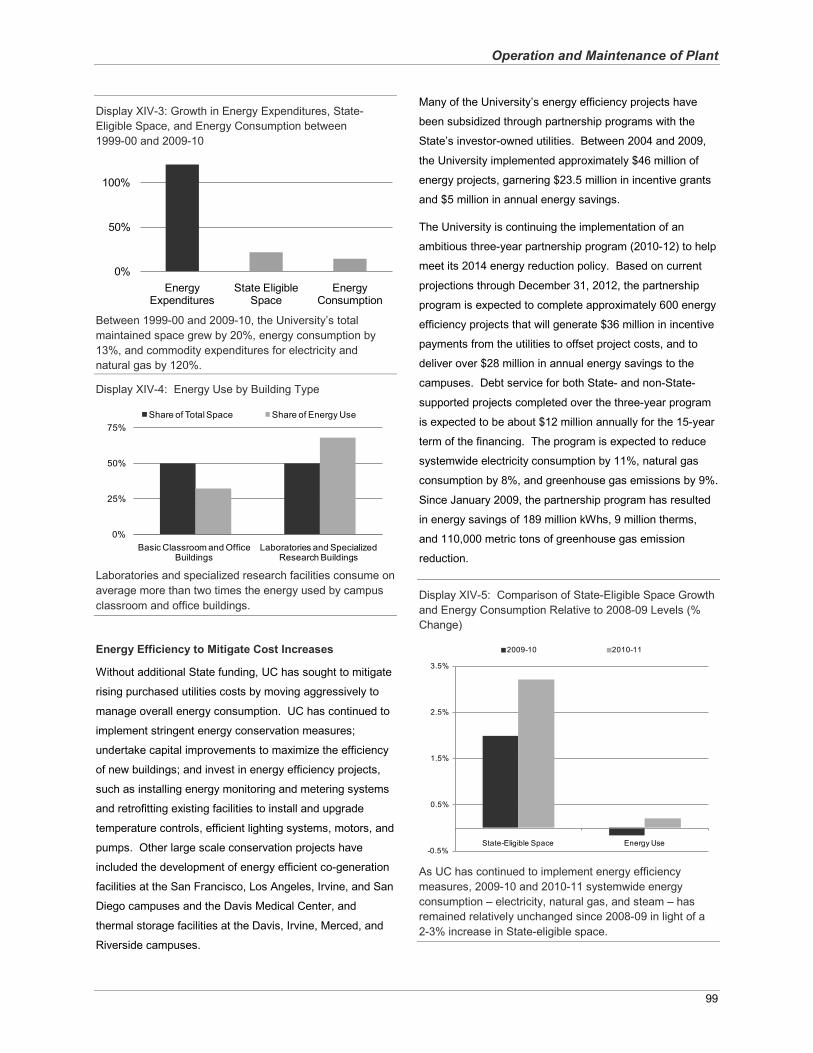
Operation and Maintenance of Plant
99
Display XIV-3: Growth in Energy Expenditures, State-Eligible Space, and Energy Consumption between 1999-00 and 2009-10
Between 1999-00 and 2009-10, the University’s total maintained space grew by 20%, energy consumption by 13%, and commodity expenditures for electricity and natural gas by 120%.
Display XIV-4: Energy Use by Building Type
Laboratories and specialized research facilities consume on average more than two times the energy used by campus classroom and office buildings.
Energy Efficiency to Mitigate Cost Increases
Without additional State funding, UC has sought to mitigate
rising purchased utilities costs by moving aggressively to
manage overall energy consumption. UC has continued to
implement stringent energy conservation measures;
undertake capital improvements to maximize the efficiency
of new buildings; and invest in energy efficiency projects,
such as installing energy monitoring and metering systems
and retrofitting existing facilities to install and upgrade
temperature controls, efficient lighting systems, motors, and
pumps. Other large scale conservation projects have
included the development of energy efficient co-generation
facilities at the San Francisco, Los Angeles, Irvine, and San
Diego campuses and the Davis Medical Center, and
thermal storage facilities at the Davis, Irvine, Merced, and
Riverside campuses.
Many of the University’s energy efficiency projects have
been subsidized through partnership programs with the
State’s investor-owned utilities. Between 2004 and 2009,
the University implemented approximately $46 million of
energy projects, garnering $23.5 million in incentive grants
and $5 million in annual energy savings.
The University is continuing the implementation of an
ambitious three-year partnership program (2010-12) to help
meet its 2014 energy reduction policy. Based on current
projections through December 31, 2012, the partnership
program is expected to complete approximately 600 energy
efficiency projects that will generate $36 million in incentive
payments from the utilities to offset project costs, and to
deliver over $28 million in annual energy savings to the
campuses. Debt service for both State- and non-State-
supported projects completed over the three-year program
is expected to be about $12 million annually for the 15-year
term of the financing. The program is expected to reduce
systemwide electricity consumption by 11%, natural gas
consumption by 8%, and greenhouse gas emissions by 9%.
Since January 2009, the partnership program has resulted
in energy savings of 189 million kWhs, 9 million therms,
and 110,000 metric tons of greenhouse gas emission
reduction.
Display XIV-5: Comparison of State-Eligible Space Growth and Energy Consumption Relative to 2008-09 Levels (% Change)
As UC has continued to implement energy efficiency measures, 2009-10 and 2010-11 systemwide energy consumption – electricity, natural gas, and steam – has remained relatively unchanged since 2008-09 in light of a 2-3% increase in State-eligible space.
0%
50%
100%
Energy Expenditures
State Eligible Space
Energy Consumption
0%
25%
50%
75%
Basic Classroom and Office Buildings
Laboratories and Specialized Research Buildings
Share of Total Space Share of Energy Use
-0.5%
0.5%
1.5%
2.5%
3.5%
State-Eligible Space Energy Use
2009-10 2010-11
Operation and Maintenance of Plant
100
The partnership program with the investor-owned utilities is
due to be extended through 2014 pending approval by the
California Public Utilities Commission. The Regents will be
requested to authorize a $100 million budget for additional
projects that the UC system has already identified and
qualified. Combined, the utilities have committed an
additional $20 million in incentive grants to help defray the
cost of energy projects, contingent upon the University
delivering on projected energy savings.
Strategic Efforts to Manage Purchased Utility Costsand Meet the University’s Carbon Neutrality Goals
In addition to pursuing energy conservation opportunities,
the University has continued efforts to obtain favorable
contracts for electricity while developing a long-term
strategy for energy procurement that will reduce costs and
advance efforts to meet the University’s Policy on
Sustainable Practices. The policy mandates that the
University reduce overall growth-adjusted energy
consumption by 10% below 2000 levels by 2014. The
policy also requires reducing greenhouse gas emissions to
2000 levels without a growth adjustment by 2014 and to
1990 levels by 2020.
Electricity. UC was able to take advantage of favorable
market conditions throughout 2011 and 2012 that provided
attractive commodity pricing, with several campuses
continuing contracts with the University’s direct access
provider through April 2013 and other campuses benefiting
from shorter term contracts. Once the current direct access
contracts expire in April 2013, UC intends to launch a long-
term procurement strategy that will position the University in
a more predictable energy market by delivering renewable
energy from remote sites to the campuses at a reasonable
cost. To date, efforts to expand the University’s use of
renewable power above mandated proportions have been
inhibited by regulatory uncertainties and prerequisite long-
term planning horizons. The direct access program can
facilitate the delivery of non-conventional energy sources to
the University’s participating campuses and medical
centers.
Based on current projections, the electricity supply cost
component that is furnished by the utilities is expected to
increase by 4% above inflation in 2012-13, while the
commodity portion furnished by the third-party provider has
stabilized at 6% below the equivalent utility cost.
Natural Gas. Most campuses have been managing natural
gas costs by developing a portfolio of longer-term natural
gas contracts, many with the State pool through the
Department of General Services (DGS). However, it is
unclear whether DGS will continue in its role of coordinating
statewide procurement of natural gas. It is also anticipated
that UC will need to acquire biogas assets to fuel the
University’s co-generation plants to help neutralize UC’s
carbon emissions. For these reasons, the University is
exploring non-traditional procurement channels that are
further elaborated on in the next section.
Strategic Procurement Efforts to Meet Carbon Neutrality Targets
If aggressive measures are not undertaken to reverse UC’s
emissions trajectory, the costs associated with emissions
will be substantial. As California’s market-based emissions
regulations take effect, the direct and indirect costs to emit
carbon will increase year by year, and campus-based
initiatives will not be sufficient to address the challenge.
From all emission sources, the University currently emits
approximately 1.7 million metric tons of carbon dioxide
equivalent (MTCO2e) per year, which is roughly equivalent
to 100,000 American households. With expected growth,
the University estimates emissions as high as 2 million
MTCO2e by 2014 and 2.15 million MTCO2e by 2020. The
University has made remarkable progress in reversing the
growth of greenhouse gas (GHG) emissions. Most
campuses have launched projects that will attain their 2014
GHG goal, and several campuses have voluntarily adopted
more aggressive plans to accelerate their 2020 GHG goal
to as early as 2014. However, several campuses will need
off-site renewable energy in order to attain the 2014 goal,
and essentially all campuses will need large-scale, off-site
solutions to achieve the 2020 goal.
Strategies. The University is pursuing the following
strategies designed to avert carbon costs and control
renewable energy costs while enabling the University to
achieve its climate commitments:
Minimize energy consumption through deep energy efficiency — continue and expand on conservation
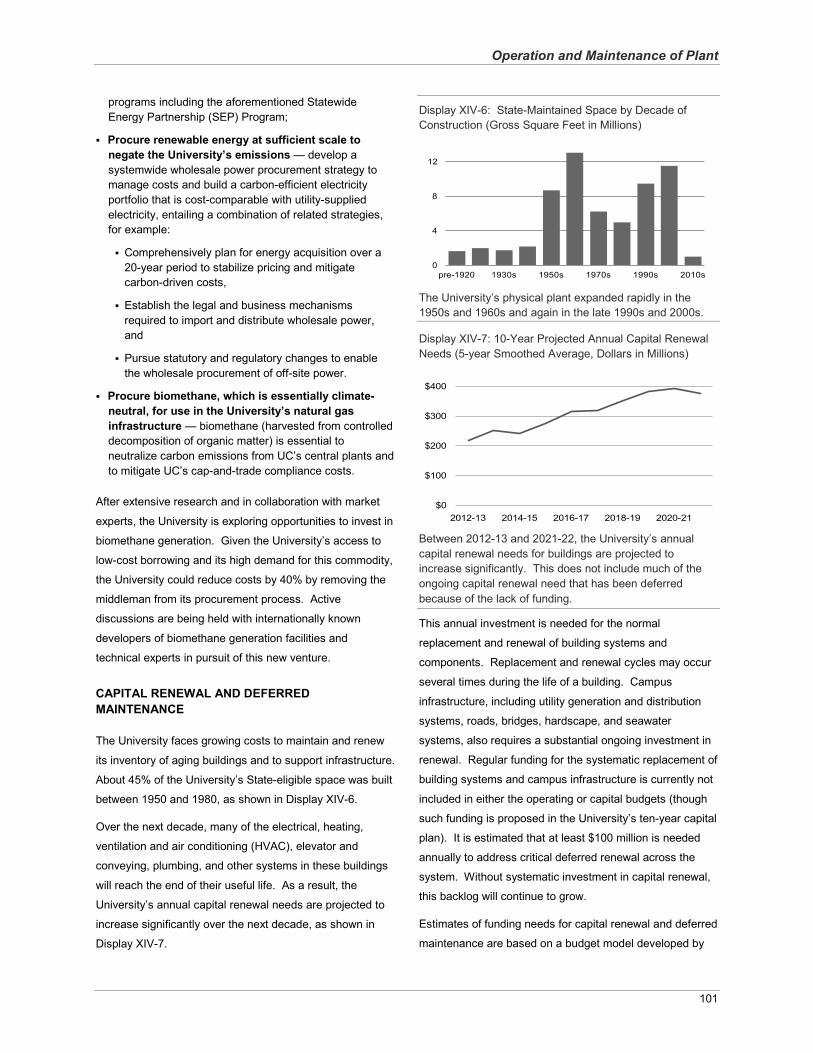
Operation and Maintenance of Plant
101
programs including the aforementioned Statewide Energy Partnership (SEP) Program;
Procure renewable energy at sufficient scale to negate the University’s emissions — develop a systemwide wholesale power procurement strategy to manage costs and build a carbon-efficient electricity portfolio that is cost-comparable with utility-supplied electricity, entailing a combination of related strategies,for example:
Comprehensively plan for energy acquisition over a 20-year period to stabilize pricing and mitigate carbon-driven costs,
Establish the legal and business mechanisms required to import and distribute wholesale power,and
Pursue statutory and regulatory changes to enable the wholesale procurement of off-site power.
Procure biomethane, which is essentially climate-neutral, for use in the University’s natural gas infrastructure — biomethane (harvested from controlled decomposition of organic matter) is essential to neutralize carbon emissions from UC’s central plants and to mitigate UC’s cap-and-trade compliance costs.
After extensive research and in collaboration with market
experts, the University is exploring opportunities to invest in
biomethane generation. Given the University’s access to
low-cost borrowing and its high demand for this commodity,
the University could reduce costs by 40% by removing the
middleman from its procurement process. Active
discussions are being held with internationally known
developers of biomethane generation facilities and
technical experts in pursuit of this new venture.
CAPITAL RENEWAL AND DEFERRED MAINTENANCE
The University faces growing costs to maintain and renew
its inventory of aging buildings and to support infrastructure.
About 45% of the University’s State-eligible space was built
between 1950 and 1980, as shown in Display XIV-6.
Over the next decade, many of the electrical, heating,
ventilation and air conditioning (HVAC), elevator and
conveying, plumbing, and other systems in these buildings
will reach the end of their useful life. As a result, the
University’s annual capital renewal needs are projected to
increase significantly over the next decade, as shown in
Display XIV-7.
Display XIV-6: State-Maintained Space by Decade of Construction (Gross Square Feet in Millions)
The University’s physical plant expanded rapidly in the 1950s and 1960s and again in the late 1990s and 2000s.
Display XIV-7: 10-Year Projected Annual Capital Renewal Needs (5-year Smoothed Average, Dollars in Millions)
Between 2012-13 and 2021-22, the University’s annual capital renewal needs for buildings are projected to increase significantly. This does not include much of the ongoing capital renewal need that has been deferred because of the lack of funding.
This annual investment is needed for the normal
replacement and renewal of building systems and
components. Replacement and renewal cycles may occur
several times during the life of a building. Campus
infrastructure, including utility generation and distribution
systems, roads, bridges, hardscape, and seawater
systems, also requires a substantial ongoing investment in
renewal. Regular funding for the systematic replacement of
building systems and campus infrastructure is currently not
included in either the operating or capital budgets (though
such funding is proposed in the University’s ten-year capital
plan). It is estimated that at least $100 million is needed
annually to address critical deferred renewal across the
system. Without systematic investment in capital renewal,
this backlog will continue to grow.
Estimates of funding needs for capital renewal and deferred
maintenance are based on a budget model developed by
0
4
8
12
pre-1920 1930s 1950s 1970s 1990s 2010s
$0
$100
$200
$300
$400
2012-13 2014-15 2016-17 2018-19 2020-21
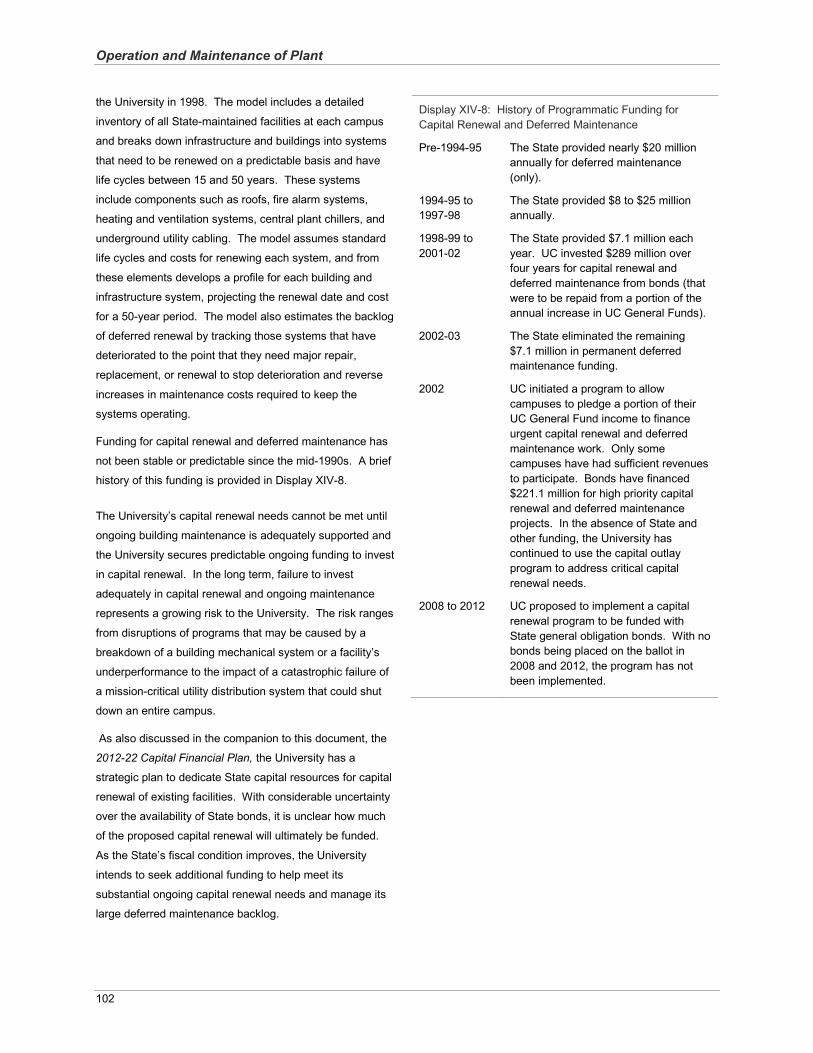
Operation and Maintenance of Plant
102
the University in 1998. The model includes a detailed
inventory of all State-maintained facilities at each campus
and breaks down infrastructure and buildings into systems
that need to be renewed on a predictable basis and have
life cycles between 15 and 50 years. These systems
include components such as roofs, fire alarm systems,
heating and ventilation systems, central plant chillers, and
underground utility cabling. The model assumes standard
life cycles and costs for renewing each system, and from
these elements develops a profile for each building and
infrastructure system, projecting the renewal date and cost
for a 50-year period. The model also estimates the backlog
of deferred renewal by tracking those systems that have
deteriorated to the point that they need major repair,
replacement, or renewal to stop deterioration and reverse
increases in maintenance costs required to keep the
systems operating.
Funding for capital renewal and deferred maintenance has
not been stable or predictable since the mid-1990s. A brief
history of this funding is provided in Display XIV-8.
The University’s capital renewal needs cannot be met until
ongoing building maintenance is adequately supported and
the University secures predictable ongoing funding to invest
in capital renewal. In the long term, failure to invest
adequately in capital renewal and ongoing maintenance
represents a growing risk to the University. The risk ranges
from disruptions of programs that may be caused by a
breakdown of a building mechanical system or a facility’s
underperformance to the impact of a catastrophic failure of
a mission-critical utility distribution system that could shut
down an entire campus.
As also discussed in the companion to this document, the
2012-22 Capital Financial Plan, the University has a
strategic plan to dedicate State capital resources for capital
renewal of existing facilities. With considerable uncertainty
over the availability of State bonds, it is unclear how much
of the proposed capital renewal will ultimately be funded.
As the State’s fiscal condition improves, the University
intends to seek additional funding to help meet its
substantial ongoing capital renewal needs and manage its
large deferred maintenance backlog.
Display XIV-8: History of Programmatic Funding for Capital Renewal and Deferred Maintenance
Pre-1994-95 The State provided nearly $20 million annually for deferred maintenance(only).
1994-95 to 1997-98
The State provided $8 to $25 million annually.
1998-99 to 2001-02
The State provided $7.1 million each year. UC invested $289 million over four years for capital renewal and deferred maintenance from bonds (that were to be repaid from a portion of the annual increase in UC General Funds).
2002-03 The State eliminated the remaining$7.1 million in permanent deferred maintenance funding.
2002 UC initiated a program to allow campuses to pledge a portion of their UC General Fund income to finance urgent capital renewal and deferred maintenance work. Only some campuses have had sufficient revenues to participate. Bonds have financed $221.1 million for high priority capital renewal and deferred maintenanceprojects. In the absence of State and other funding, the University has continued to use the capital outlay program to address critical capital renewal needs.
2008 to 2012 UC proposed to implement a capital renewal program to be funded with State general obligation bonds. With no bonds being placed on the ballot in 2008 and 2012, the program has not been implemented.
“As the State disinvests in its premier public university, UC is struggling to maintain access, quality and affordability. Recent increases in tuition and fees are difficult but necessary to achieve these goals.”
Patrick J. Lenz University of California
Vice President for Budget and Capital Resources
103
Student Tuition and FeesRevenue from student tuition and fees is a major source of
funding for the University’s core educational program;
in 2011-12, these sources provided approximately
$3.43 billion1 to supplement State funding and other
sources and help support basic operations.
Throughout the University’s history, but particularly since
1990, reductions in State support for higher education in
California have jeopardized UC’s commitment to
affordability, an impact that is recognized in the University
of California Student Tuition and Fee Policy2 established by
the Regents in 1994. The policy specifically authorizes the
use of Tuition revenue for general support of the University,
including costs related to instruction. As noted in the
Sources of University Funds chapter of this document,
students now pay approximately 49% of the cost of
education. Over the past 20 years, the State’s inflation-
adjusted contribution per UC student has declined by 65%;
in 2011-12, in fact, the contribution of students through their
tuition and fees surpassed the State’s funding contribution
for the first time in the University’s history.
Tuition and fee levels have been increased to help backfill
reductions in State funding but have not made up the entire
loss; in fact, tuition and fee increases have mitigated less
than half of the budget shortfall created by the current fiscal
crisis that began in 2008-09. Unfortunately, in a period of
declining State support, student tuition and fee increases
have been and will continue to be necessary if UC is to
sustain its mission to provide access to a high-quality
instructional program for the State’s most talented students.
Given the large share of instructional costs currently funded
from student tuition and fees, annual tuition and fee
1 This amount includes revenue from mandatory systemwide charges, Professional Degree Supplemental Tuition, and Nonresident Supplemental Tuition, but excludes fees charged at the campus level and UC Extension fees. 2 www.universityofcalifornia.edu/regents/policies/3101.html.
increases are increasingly necessary for the University to
address rising costs, barring extraordinary reinvestment by
the State. All tuition and fee increases since 1990-91 have
been a direct result of inadequate and volatile State
support.
Students3 at the University of California pay five different
types of charges:
Tuition, a mandatory systemwide charge assessed to all registered students providing general support for UC’sbudget; The Student Services Fee, another mandatory systemwide charge assessed to all registered students that supports services benefiting students;Professional Degree Supplemental Tuition, paid by students enrolled in a number of professional degree programs to support instruction and specifically to sustain and enhance program quality;
Nonresident Supplemental Tuition, charged to nonresident students in addition to mandatory charges
2013-14 PROPOSED TUITION AND FEE ACTIONS
At the Board’s November 2012 meeting, the Regents are being asked to approve the following actions for 2013-14:
An increase in mandatory systemwide charges (Tuition and Student Services Fee) of 6% for all students;Increases in Professional Degree Supplemental Tuition ranging from 0% to 35% and totaling from $0 to $3,256,depending on the campus and program; andExtension of the temporary Tuition surcharge to cover approximately $49 million in losses associated with the Luquetta judgment.
These increase amounts assume passage of the Governor’s revenue-raising initiative in November 2012. If the initiative fails, following the election a revised budget plan will be submitted for the November meeting, which willinclude revised recommendations for increases in tuition and fees.
3 Although included in enrollment counts as students, medical and other health sciences residents are not assessed student charges.
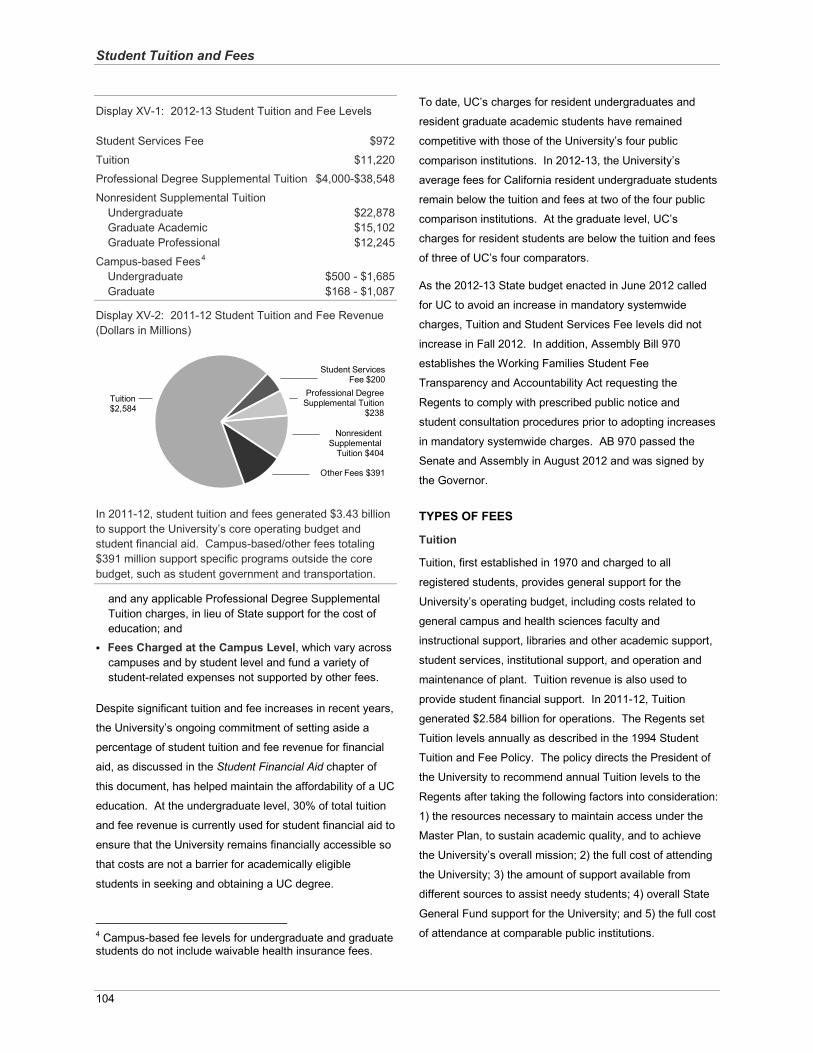
Student Tuition and Fees
104
Display XV-1: 2012-13 Student Tuition and Fee Levels
Student Services Fee $972
Tuition $11,220Professional Degree Supplemental Tuition $4,000-$38,548
Nonresident Supplemental TuitionUndergraduate $22,878Graduate Academic $15,102Graduate Professional $12,245
Campus-based Fees4
Undergraduate $500 - $1,685Graduate $168 - $1,087
Display XV-2: 2011-12 Student Tuition and Fee Revenue (Dollars in Millions)
In 2011-12, student tuition and fees generated $3.43 billionto support the University’s core operating budget andstudent financial aid. Campus-based/other fees totaling $391 million support specific programs outside the core budget, such as student government and transportation.
and any applicable Professional Degree Supplemental Tuition charges, in lieu of State support for the cost of education; and
Fees Charged at the Campus Level, which vary across campuses and by student level and fund a variety of student-related expenses not supported by other fees.
Despite significant tuition and fee increases in recent years,
the University’s ongoing commitment of setting aside a
percentage of student tuition and fee revenue for financial
aid, as discussed in the Student Financial Aid chapter of
this document, has helped maintain the affordability of a UC
education. At the undergraduate level, 30% of total tuition
and fee revenue is currently used for student financial aid to
ensure that the University remains financially accessible so
that costs are not a barrier for academically eligible
students in seeking and obtaining a UC degree.
4 Campus-based fee levels for undergraduate and graduate students do not include waivable health insurance fees.
To date, UC’s charges for resident undergraduates and
resident graduate academic students have remained
competitive with those of the University’s four public
comparison institutions. In 2012-13, the University’s
average fees for California resident undergraduate students
remain below the tuition and fees at two of the four public
comparison institutions. At the graduate level, UC’s
charges for resident students are below the tuition and fees
of three of UC’s four comparators.
As the 2012-13 State budget enacted in June 2012 called
for UC to avoid an increase in mandatory systemwide
charges, Tuition and Student Services Fee levels did not
increase in Fall 2012. In addition, Assembly Bill 970
establishes the Working Families Student Fee
Transparency and Accountability Act requesting the
Regents to comply with prescribed public notice and
student consultation procedures prior to adopting increases
in mandatory systemwide charges. AB 970 passed the
Senate and Assembly in August 2012 and was signed by
the Governor.
TYPES OF FEES
Tuition
Tuition, first established in 1970 and charged to all
registered students, provides general support for the
University’s operating budget, including costs related to
general campus and health sciences faculty and
instructional support, libraries and other academic support,
student services, institutional support, and operation and
maintenance of plant. Tuition revenue is also used to
provide student financial support. In 2011-12, Tuition
generated $2.584 billion for operations. The Regents set
Tuition levels annually as described in the 1994 Student
Tuition and Fee Policy. The policy directs the President of
the University to recommend annual Tuition levels to the
Regents after taking the following factors into consideration:
1) the resources necessary to maintain access under the
Master Plan, to sustain academic quality, and to achieve
the University’s overall mission; 2) the full cost of attending
the University; 3) the amount of support available from
different sources to assist needy students; 4) overall State
General Fund support for the University; and 5) the full cost
of attendance at comparable public institutions.
Student ServicesFee $200
Tuition $2,584
Professional DegreeSupplemental Tuition
$238
Other Fees $391
Nonresident Supplemental
Tuition $404
Student Tuition and Fees
105
Under the 1994 Student Tuition and Fee Policy, Tuition
revenue is limited to the general support of UC’s operating
budget and cannot be used for capital expenditures. Fee
increases have been needed primarily to offset reductions
in State support; in fact, every fee increase since 1990-91
has been levied to make up for inadequate State funding.
In 2012-13, Tuition is $11,220 for every student, regardless
of student level, residency, and program.
Student Services Fee
The Student Services Fee is also charged to all registered
students. Revenue from the fee funds services that are
necessary to students but not part of the University’s
programs of instruction, research, or public service. In
2011-12, the fee generated $200 million. The majority of
these funds are spent on student services, including
counseling and career guidance, cultural and social
activities, and student health services. In addition, some
Student Services Fee revenue is used for capital
improvements that provide extracurricular benefits for
students. As with Tuition, the Regents set Student
Services Fee levels annually in accordance with the 1994
Student Tuition and Fee Policy. In 2012-13, the Student
Services Fee is $972 for all students.
FEES VERSUS TUITION
The State and UC have long held the position that State support for the University’s instructional mission enabled the University to avoid charging “tuition.” This view was enshrined in the 1960 Master Plan. Historically, the University established modest “fees” for specific, limited purposes that supplemented the instructional mission.
Since the fiscal crisis of the 1990s, however, the University has been forced to increase fee levels significantly to offset State budget cuts and, in doing so, expand the uses of student fee revenue to include instruction and instructional support activities. Several of these fees are equivalent to tuition charged by other universities.
At their November 2010 meeting the Regents approved therenaming of two student charges as “tuition.” Using the word “tuition” increases transparency about UC’s costs for the general public, students, and families; makes UC’s terminology consistent with its public comparison institutions and entities to which UC reports its student charges; and helps UC avoid problems with the implementation of federal financial assistance programs.
Chancellors are authorized to determine specific allocations
of Student Services Fee income on their campuses, within
applicable University policies and guidelines. Each campus
has a Student Fee Advisory Committee, the membership of
which is at least 50% students, to advise the chancellor.
Professional Degree Supplemental Tuition
Professional Degree Supplemental Tuition (formerly known
as professional degree fees) was established in 1994-95 to
allow UC’s professional schools to offset reductions in State
support and maintain program quality.
In 2012-13, these fees are charged to students enrolled in
graduate professional degree programs in applied
economics and finance; architecture; art; biotechnology
management; business; dental hygiene; dentistry;
development practice; educational leadership; engineering;
engineering management; environmental design;
environmental science and engineering; genetic
counseling; health informatics; information management;
international relations and Pacific studies; law; medicine;
nursing; optometry; pharmacy; physical therapy; preventive
veterinary medicine; product development; public health;
public policy; social welfare; statistics; theater, film, and
television; urban planning; and veterinary medicine.
Assessed in addition to mandatory student charges and, if
applicable, Nonresident Supplemental Tuition, Professional
Degree Supplemental Tuition levels during 2012-13 range
from $4,000 to $38,548 depending on the program,
campus, and student residency. In 2011-12, these charges
generated $238 million.
Historically, many of UC’s professional schools have held a
place of prominence in the nation, promising a top-quality
education for a reasonable price. Budget cuts have
devastated the resources available to the professional
schools to such a degree that the professional school
deans are extremely concerned about their ability to recruit
and retain excellent faculty, provide an outstanding
curriculum, and attract high-caliber students. New revenue
generated from increases in Professional Degree
Supplemental Tuition is one of the ways to regain and
maintain the excellence threatened by budget cuts.
Student Tuition and Fees
106
The Regents’ Policy on Professional Degree Supplemental
Tuition5 specifies that these charges will be approved by
the Regents in the context of multi-year plans that advance
the mission and academic plans of each professional
school program. Multi-year planning with regard to
Professional Degree Supplemental Tuition is a vital and
fiscally prudent strategy that:
provides a more stable planning environment for the professional schools;
allows the schools to consider and act on long-term investment needs such as new faculty positions, facility needs, and financial aid program development;
provides each program with the opportunity to comprehensively analyze its program needs, the costs to address those needs, and the revenue available to support those needs; allows each program to examine its competitiveness with other institutions on a number of measures, including the “sticker price” of attendance, financial aid programs and their impact on the net cost to students, and other indicators of national competitiveness of the program;
helps inform decision making by clearly identifying each degree program’s goals and objectives and the steps that are needed to achieve them; and
enables each program to consult with students and faculty about long-term plans and tuition levels.
The Regents’ policy also includes specific conditions for
ensuring that the University’s commitment to access,
affordability, diversity, and students’ public service career
decisions are not adversely affected by increases in fees
for professional degree students.
In 2012-13, a systemwide Professional Degree
Supplemental Tuition Task Force will review a number of
issues related to these charges, specifically the policy
governing the charges, and will make recommendations to
the Regents for changes to policy.
Professional Degree Supplemental Tuition increases for
2012-13 varied by program but ranged between 0% and
35% and between $0 and $7,118. Almost three-quarters of
the programs charging Professional Degree Supplemental
Tuition prior to 2012-13 determined that, within their current
marketplace, annual increases in Professional Degree
Supplemental Tuition charges for 2012-13 of 7% or less
were sufficient to meet their program goals and objectives;
5 www.universityofcalifornia.edu/regents/policies/3103.html.
nursing programs were at the higher end of the range of
percentage increases. These increases were approved in
the context of the programs’ multi-year plans and are
enabling programs to act on investment needs such as new
faculty positions, facility needs, and financial aid program
development.
At their November 2012 meeting, the Regents will be asked
to approve increases in existing Professional Degree
Supplemental Tuition charges for 2013-14 ranging from 0%
to 35% and totaling from $0 to $3,256, depending on the
campus and program. In addition, the Regents will be
asked to establish new Professional Degree Supplemental
Tuition charges for a number of programs. Proposals have
been received for supplemental charges for programs in
games and playable media, health sciences, technology
and information management, and translational medicine.
Nonresident Supplemental Tuition
In addition to all other applicable tuition and fees, UC
students who do not qualify as California residents are
required to pay Nonresident Supplemental Tuition,
consistent with the State’s policy not to provide support for
nonresident students. Enrollment of approximately 23,300
nonresident students, including both undergraduate and
graduate international students and domestic students from
other states, generated $404 million in 2011-12.
STATE LAW REGARDING NONRESIDENT TUITION
Section 68052 of the California Education Code directs California’s public institutions of higher education to address the following when establishing nonresident student tuition levels:
Nonresident tuition methodologies used by California’s public postsecondary education segments should consider: 1) the total nonresident charges imposed by each of their public comparison institutions, and 2) the full average cost of instruction;
Nonresident tuition plus required fees should not fall below the marginal cost of instruction;
Increases in the level of nonresident tuition should be gradual, moderate, and predictable; and
In the event that State revenues and expenditures are substantially imbalanced due to factors unforeseen by the Governor and the Legislature, nonresident tuition willnot be subject to the law’s provisions.
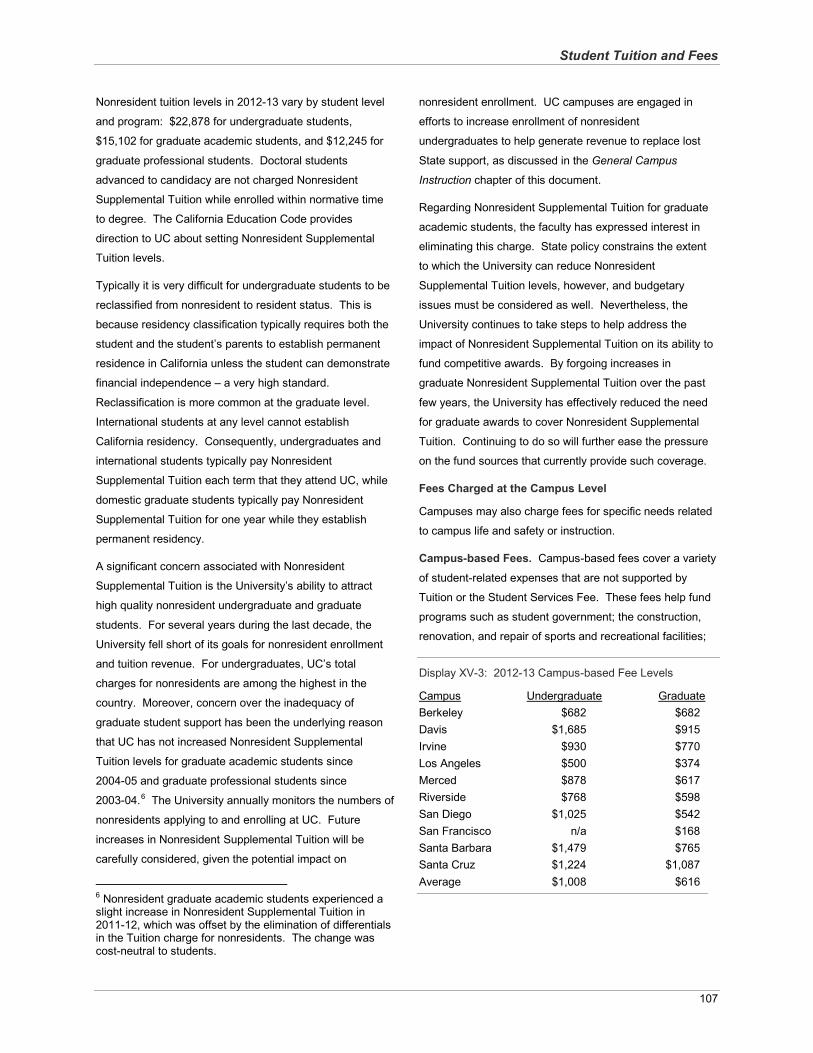
Student Tuition and Fees
107
Nonresident tuition levels in 2012-13 vary by student level
and program: $22,878 for undergraduate students,
$15,102 for graduate academic students, and $12,245 for
graduate professional students. Doctoral students
advanced to candidacy are not charged Nonresident
Supplemental Tuition while enrolled within normative time
to degree. The California Education Code provides
direction to UC about setting Nonresident Supplemental
Tuition levels.
Typically it is very difficult for undergraduate students to be
reclassified from nonresident to resident status. This is
because residency classification typically requires both the
student and the student’s parents to establish permanent
residence in California unless the student can demonstrate
financial independence – a very high standard.
Reclassification is more common at the graduate level.
International students at any level cannot establish
California residency. Consequently, undergraduates and
international students typically pay Nonresident
Supplemental Tuition each term that they attend UC, while
domestic graduate students typically pay Nonresident
Supplemental Tuition for one year while they establish
permanent residency.
A significant concern associated with Nonresident
Supplemental Tuition is the University’s ability to attract
high quality nonresident undergraduate and graduate
students. For several years during the last decade, the
University fell short of its goals for nonresident enrollment
and tuition revenue. For undergraduates, UC’s total
charges for nonresidents are among the highest in the
country. Moreover, concern over the inadequacy of
graduate student support has been the underlying reason
that UC has not increased Nonresident Supplemental
Tuition levels for graduate academic students since
2004-05 and graduate professional students since
2003-04.6 The University annually monitors the numbers of
nonresidents applying to and enrolling at UC. Future
increases in Nonresident Supplemental Tuition will be
carefully considered, given the potential impact on
6 Nonresident graduate academic students experienced a slight increase in Nonresident Supplemental Tuition in 2011-12, which was offset by the elimination of differentials in the Tuition charge for nonresidents. The change was cost-neutral to students.
nonresident enrollment. UC campuses are engaged in
efforts to increase enrollment of nonresident
undergraduates to help generate revenue to replace lost
State support, as discussed in the General Campus
Instruction chapter of this document.
Regarding Nonresident Supplemental Tuition for graduate
academic students, the faculty has expressed interest in
eliminating this charge. State policy constrains the extent
to which the University can reduce Nonresident
Supplemental Tuition levels, however, and budgetary
issues must be considered as well. Nevertheless, the
University continues to take steps to help address the
impact of Nonresident Supplemental Tuition on its ability to
fund competitive awards. By forgoing increases in
graduate Nonresident Supplemental Tuition over the past
few years, the University has effectively reduced the need
for graduate awards to cover Nonresident Supplemental
Tuition. Continuing to do so will further ease the pressure
on the fund sources that currently provide such coverage.
Fees Charged at the Campus Level
Campuses may also charge fees for specific needs related
to campus life and safety or instruction.
Campus-based Fees. Campus-based fees cover a variety
of student-related expenses that are not supported by
Tuition or the Student Services Fee. These fees help fund
programs such as student government; the construction,
renovation, and repair of sports and recreational facilities;
Display XV-3: 2012-13 Campus-based Fee Levels
Campus Undergraduate GraduateBerkeley $682 $682Davis $1,685 $915Irvine $930 $770Los Angeles $500 $374Merced $878 $617Riverside $768 $598San Diego $1,025 $542San Francisco n/a $168Santa Barbara $1,479 $765Santa Cruz $1,224 $1,087Average $1,008 $616
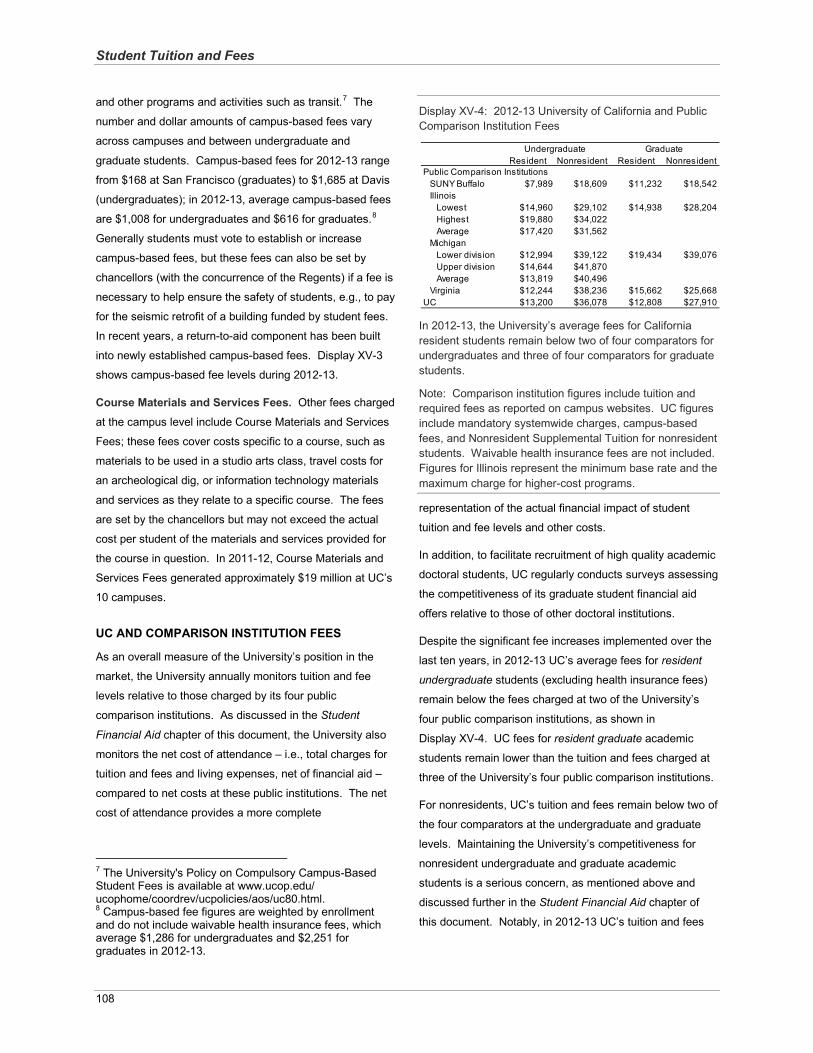
Student Tuition and Fees
108
and other programs and activities such as transit.7 The
number and dollar amounts of campus-based fees vary
across campuses and between undergraduate and
graduate students. Campus-based fees for 2012-13 range
from $168 at San Francisco (graduates) to $1,685 at Davis
(undergraduates); in 2012-13, average campus-based fees
are $1,008 for undergraduates and $616 for graduates.8
Generally students must vote to establish or increase
campus-based fees, but these fees can also be set by
chancellors (with the concurrence of the Regents) if a fee is
necessary to help ensure the safety of students, e.g., to pay
for the seismic retrofit of a building funded by student fees.
In recent years, a return-to-aid component has been built
into newly established campus-based fees. Display XV-3
shows campus-based fee levels during 2012-13.
Course Materials and Services Fees. Other fees charged
at the campus level include Course Materials and Services
Fees; these fees cover costs specific to a course, such as
materials to be used in a studio arts class, travel costs for
an archeological dig, or information technology materials
and services as they relate to a specific course. The fees
are set by the chancellors but may not exceed the actual
cost per student of the materials and services provided for
the course in question. In 2011-12, Course Materials and
Services Fees generated approximately $19 million at UC’s
10 campuses.
UC AND COMPARISON INSTITUTION FEES
As an overall measure of the University’s position in the
market, the University annually monitors tuition and fee
levels relative to those charged by its four public
comparison institutions. As discussed in the Student
Financial Aid chapter of this document, the University also
monitors the net cost of attendance – i.e., total charges for
tuition and fees and living expenses, net of financial aid –
compared to net costs at these public institutions. The net
cost of attendance provides a more complete
7 The University's Policy on Compulsory Campus-Based Student Fees is available at www.ucop.edu/ ucophome/coordrev/ucpolicies/aos/uc80.html.8 Campus-based fee figures are weighted by enrollment and do not include waivable health insurance fees, which average $1,286 for undergraduates and $2,251 forgraduates in 2012-13.
Display XV-4: 2012-13 University of California and Public Comparison Institution Fees
In 2012-13, the University’s average fees for California resident students remain below two of four comparators for undergraduates and three of four comparators for graduate students.
Note: Comparison institution figures include tuition and required fees as reported on campus websites. UC figuresinclude mandatory systemwide charges, campus-based fees, and Nonresident Supplemental Tuition for nonresident students. Waivable health insurance fees are not included.Figures for Illinois represent the minimum base rate and the maximum charge for higher-cost programs.
representation of the actual financial impact of student
tuition and fee levels and other costs.
In addition, to facilitate recruitment of high quality academic
doctoral students, UC regularly conducts surveys assessing
the competitiveness of its graduate student financial aid
offers relative to those of other doctoral institutions.
Despite the significant fee increases implemented over the
last ten years, in 2012-13 UC’s average fees for resident
undergraduate students (excluding health insurance fees)
remain below the fees charged at two of the University’s
four public comparison institutions, as shown in
Display XV-4. UC fees for resident graduate academic
students remain lower than the tuition and fees charged at
three of the University’s four public comparison institutions.
For nonresidents, UC’s tuition and fees remain below two of
the four comparators at the undergraduate and graduate
levels. Maintaining the University’s competitiveness for
nonresident undergraduate and graduate academic
students is a serious concern, as mentioned above and
discussed further in the Student Financial Aid chapter of
this document. Notably, in 2012-13 UC’s tuition and fees
Resident Nonresident Resident Nonresident
SUNY Buffalo $7,989 $18,609 $11,232 $18,542 Illinois Lowest $14,960 $29,102 $14,938 $28,204 Highest $19,880 $34,022 Average $17,420 $31,562 Michigan Lower division $12,994 $39,122 $19,434 $39,076 Upper division $14,644 $41,870 Average $13,819 $40,496 Virginia $12,244 $38,236 $15,662 $25,668 UC $13,200 $36,078 $12,808 $27,910
Undergraduate Graduate
Public Comparison Institutions
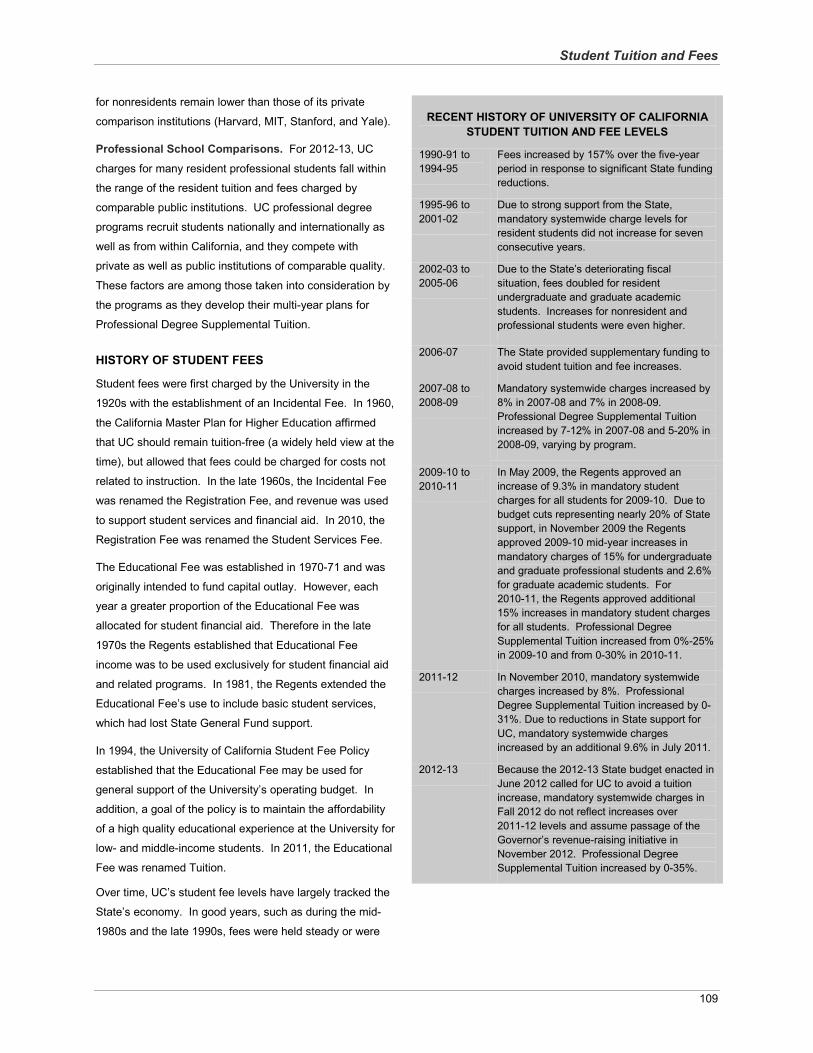
Student Tuition and Fees
109
for nonresidents remain lower than those of its private
comparison institutions (Harvard, MIT, Stanford, and Yale).
Professional School Comparisons. For 2012-13, UC
charges for many resident professional students fall within
the range of the resident tuition and fees charged by
comparable public institutions. UC professional degree
programs recruit students nationally and internationally as
well as from within California, and they compete with
private as well as public institutions of comparable quality.
These factors are among those taken into consideration by
the programs as they develop their multi-year plans for
Professional Degree Supplemental Tuition.
HISTORY OF STUDENT FEES
Student fees were first charged by the University in the
1920s with the establishment of an Incidental Fee. In 1960,
the California Master Plan for Higher Education affirmed
that UC should remain tuition-free (a widely held view at the
time), but allowed that fees could be charged for costs not
related to instruction. In the late 1960s, the Incidental Fee
was renamed the Registration Fee, and revenue was used
to support student services and financial aid. In 2010, the
Registration Fee was renamed the Student Services Fee.
The Educational Fee was established in 1970-71 and was
originally intended to fund capital outlay. However, each
year a greater proportion of the Educational Fee was
allocated for student financial aid. Therefore in the late
1970s the Regents established that Educational Fee
income was to be used exclusively for student financial aid
and related programs. In 1981, the Regents extended the
Educational Fee’s use to include basic student services,
which had lost State General Fund support.
In 1994, the University of California Student Fee Policy
established that the Educational Fee may be used for
general support of the University’s operating budget. In
addition, a goal of the policy is to maintain the affordability
of a high quality educational experience at the University for
low- and middle-income students. In 2011, the Educational
Fee was renamed Tuition.
Over time, UC’s student fee levels have largely tracked the
State’s economy. In good years, such as during the mid-
1980s and the late 1990s, fees were held steady or were
RECENT HISTORY OF UNIVERSITY OF CALIFORNIA STUDENT TUITION AND FEE LEVELS
1990-91 to 1994-95
Fees increased by 157% over the five-year period in response to significant State funding reductions.
1995-96 to 2001-02
Due to strong support from the State, mandatory systemwide charge levels for resident students did not increase for seven consecutive years.
2002-03 to 2005-06
Due to the State’s deteriorating fiscal situation, fees doubled for resident undergraduate and graduate academic students. Increases for nonresident and professional students were even higher.
2006-07 The State provided supplementary funding to avoid student tuition and fee increases.
2007-08 to 2008-09
Mandatory systemwide charges increased by 8% in 2007-08 and 7% in 2008-09. Professional Degree Supplemental Tuitionincreased by 7-12% in 2007-08 and 5-20% in 2008-09, varying by program.
2009-10 to 2010-11
In May 2009, the Regents approved anincrease of 9.3% in mandatory student charges for all students for 2009-10. Due to budget cuts representing nearly 20% of State support, in November 2009 the Regents approved 2009-10 mid-year increases in mandatory charges of 15% for undergraduate and graduate professional students and 2.6% for graduate academic students. For 2010-11, the Regents approved additional 15% increases in mandatory student charges for all students. Professional Degree Supplemental Tuition increased from 0%-25% in 2009-10 and from 0-30% in 2010-11.
2011-12 In November 2010, mandatory systemwide charges increased by 8%. Professional Degree Supplemental Tuition increased by 0-31%. Due to reductions in State support for UC, mandatory systemwide charges increased by an additional 9.6% in July 2011.
2012-13 Because the 2012-13 State budget enacted in June 2012 called for UC to avoid a tuition increase, mandatory systemwide charges in Fall 2012 do not reflect increases over 2011-12 levels and assume passage of the Governor’s revenue-raising initiative in November 2012. Professional Degree Supplemental Tuition increased by 0-35%.
Student Tuition and Fees
110
reduced. In years of fiscal crisis – during the early 1990s,
during the early 2000s, and more recently – student tuition
and fees increased dramatically in response to significant
reductions in State funding, though these increases have
only partially backfilled the reductions in State support. The
Appendices to this document include historical tuition and
fee levels for UC students by level and residency. The
2012-13 and 2013-14 tuition, fees, and charges included in
the Appendices are estimates subject to change by the
Regents and assume passage of the Governor’s revenue-
raising initiative in November 2012.
KASHMIRI AND LUQUETTA LAWSUITS
A lawsuit against the University, Kashmiri v. Regents, has
impacted Tuition levels for all students. The lawsuit was
filed against the University in 2003 by students who had
enrolled in UC’s professional degree programs prior to
December 16, 2002. The class action suit alleged that the
increases in Professional Degree Supplemental Tuition that
were approved by the Regents for Spring 2003 (and for all
subsequent years) violated a contract between the
University and these students that their Professional
Degree Supplemental Tuition levels would not increase
during their enrollment. The trial court entered an order
granting a preliminary injunction against the University,
prohibiting collection of the Professional Degree
Supplemental Tuition increases approved by the Regents
for 2004-05 and 2005-06 from students affected by the
lawsuit. As a result, at the end of 2011-12, the University
had lost $24.1 million in uncollected Professional Degree
Supplemental Tuition revenue.
In March 2006, the trial court entered a $33.8 million
judgment in favor of plaintiffs. After the University
exhausted its appeals, the trial court finalized the judgment
in January 2008. Currently, a temporary Tuition surcharge
of $60 is being assessed to all students until the lost
revenue is fully recovered and the judgment is fully paid off
(estimated to occur in 2012-13).
A second lawsuit, Luquetta v. Regents, was filed in 2005
and extended the Professional Degree Supplemental
Tuition claim to professional students who enrolled during
the 2003-04 academic year. In April 2010, the trial court
entered judgment in favor of the plaintiffs in the amount of
$39.4 million. The University unsuccessfully appealed the
court’s decision, and the judgment was made final in July
2012. At the November 2012 Regents’ meeting, the Board
will be asked to approve an extension of the temporary
Tuition surcharge to cover the Luquetta judgment. Due to
the accrual of post-judgment interest, losses associated
with the Luquetta case total approximately $49 million.
“A UC education should not be financially out of reach for any student. Accessibility is a critical factor in UC’s success, and the University is committed to preserving that for students at all income levels.”
Nathan Brostrom University of California
Executive Vice President for Business Operations
111
Student Financial AidGuided by policy adopted by the Regents in 1994, the
University’s financial aid program is closely linked to the
University’s goals of student accessibility and helping the
state meet its professional workforce needs.1 In 2010-11,
UC students received $3.4 billion in financial aid, of which
$1.1 billion (32%) was provided by UC. Maintaining a
robust financial aid program for UC undergraduate and
graduate students remains a top University budget priority.
At the undergraduate level, the goal of the University’s
financial aid program is to ensure that the University
remains financially accessible to all eligible students so that
financial considerations are not an obstacle to enrollment.
During the 2010-11 academic year, 62% of UC
undergraduates received grant/scholarship aid averaging
$14,715 per student. Despite tuition and fee increases, the
University of California is nationally recognized as a leading
institution in enrolling an economically diverse pool of
undergraduate students. In 2010-11, 41% of UC
undergraduates were low-income Pell Grant recipients —
more than at any other comparably selective research
institution.
At the graduate level, the Regents’ financial aid policy calls
upon the University to attract a diverse pool of highly
qualified students by providing a competitive level of
support relative to other institutions. This competitive
context reflects the fact that graduate student enrollment is
tied most directly to the University’s research mission and
helps the state meet its academic and professional
workforce needs. In 2010-11, 61% of graduate students
received grant or fellowship support averaging about
$15,600 per student, in addition to substantial support from
teaching assistantships and research assistantships. The
competitiveness of support packages for UC graduate
1 The University of California Financial Aid Policy is available at www.universityofcalifornia.edu/regents/policies/3201.html.
FINANCIAL AID PRIORITIES FOR 2013-14
In 2013-14, the University proposes to:
Set aside, as a minimum, amounts equal to 33% of new systemwide tuition and fee revenue from undergraduate and graduate professional students, and 50% of new systemwide tuition and fee revenue from graduate academic students, for student support;
Continue to ensure that tuition and fee increases do not deter talented, low-income students from aspiring to attend UC by fully funding the Blue and Gold Opportunity Plan, which provides full coverage of mandatory systemwide tuition and fees for eligible resident undergraduates with family incomes up to $80,000 (up to the students’ need);
Provide assistance to financially needy middle-income families to offset the impact of any tuition and fee increase proposed for 2013-14; and
Continue a fundraising effort that aims to raise $1 billion for student support over four years.
At the State level, UC will work with segments of higher education and other stakeholders to ensure that the Cal Grant program continues to be funded at necessary levels.
These plans assume passage of the Governor’s revenue-raising initiative in November 2012. If the initiative fails, following the election a revised budget plan will be submitted for the November meeting, which could affect UC’s financial aid proposals for 2013-14.
academic students and its impact on the ability of the
University to enroll top students from around the world has
been a longstanding concern at UC.
The University has faced several challenges in recent
years related both to affordability at the undergraduate level
and competitiveness at the graduate level. At the
undergraduate level, tuition and fee increases implemented
in response to declining State support for the University’s
budget contributed to an increase in the University’s cost of
attendance. These tuition and fee increases occurred while
other elements of the total cost of attendance — including
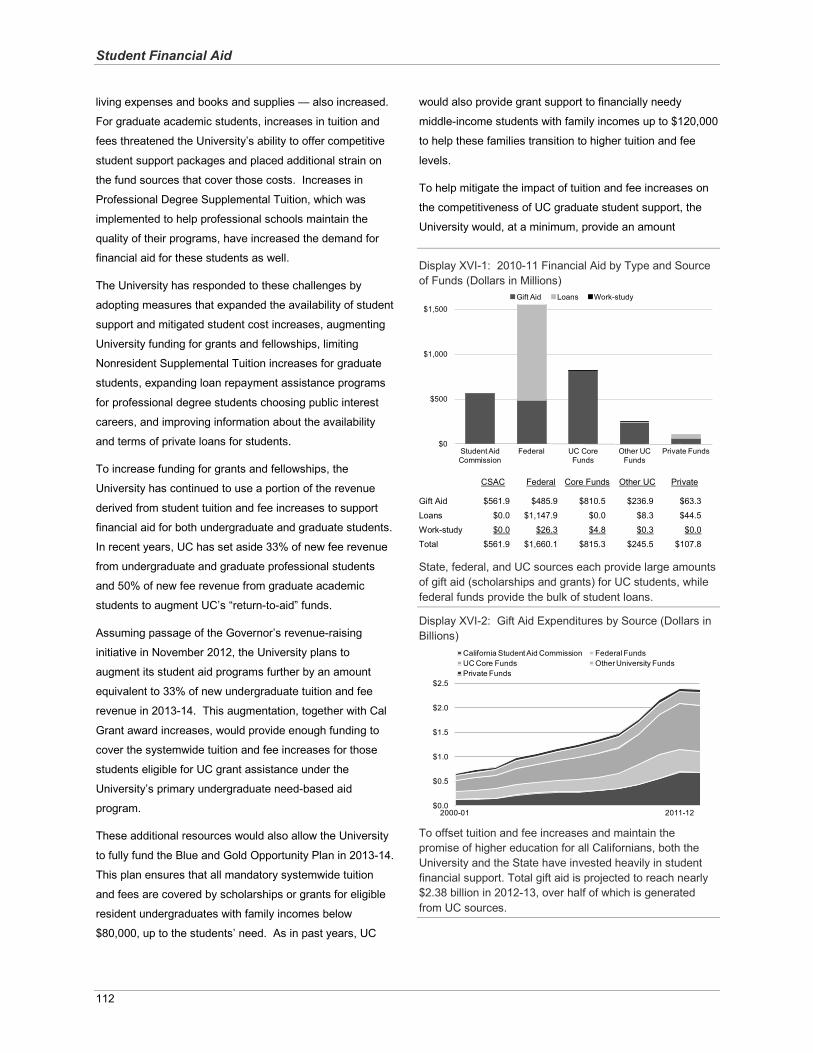
Student Financial Aid
112
living expenses and books and supplies — also increased.
For graduate academic students, increases in tuition and
fees threatened the University’s ability to offer competitive
student support packages and placed additional strain on
the fund sources that cover those costs. Increases in
Professional Degree Supplemental Tuition, which was
implemented to help professional schools maintain the
quality of their programs, have increased the demand for
financial aid for these students as well.
The University has responded to these challenges by
adopting measures that expanded the availability of student
support and mitigated student cost increases, augmenting
University funding for grants and fellowships, limiting
Nonresident Supplemental Tuition increases for graduate
students, expanding loan repayment assistance programs
for professional degree students choosing public interest
careers, and improving information about the availability
and terms of private loans for students.
To increase funding for grants and fellowships, the
University has continued to use a portion of the revenue
derived from student tuition and fee increases to support
financial aid for both undergraduate and graduate students.
In recent years, UC has set aside 33% of new fee revenue
from undergraduate and graduate professional students
and 50% of new fee revenue from graduate academic
students to augment UC’s “return-to-aid” funds.
Assuming passage of the Governor’s revenue-raising
initiative in November 2012, the University plans to
augment its student aid programs further by an amount
equivalent to 33% of new undergraduate tuition and fee
revenue in 2013-14. This augmentation, together with Cal
Grant award increases, would provide enough funding to
cover the systemwide tuition and fee increases for those
students eligible for UC grant assistance under the
University’s primary undergraduate need-based aid
program.
These additional resources would also allow the University
to fully fund the Blue and Gold Opportunity Plan in 2013-14.
This plan ensures that all mandatory systemwide tuition
and fees are covered by scholarships or grants for eligible
resident undergraduates with family incomes below
$80,000, up to the students’ need. As in past years, UC
would also provide grant support to financially needy
middle-income students with family incomes up to $120,000
to help these families transition to higher tuition and fee
levels.
To help mitigate the impact of tuition and fee increases on
the competitiveness of UC graduate student support, the
University would, at a minimum, provide an amount
Display XVI-1: 2010-11 Financial Aid by Type and Source of Funds (Dollars in Millions)
CSAC Federal Core Funds Other UC Private
Gift Aid $561.9 $485.9 $810.5 $236.9 $63.3
Loans $0.0 $1,147.9 $0.0 $8.3 $44.5
Work-study $0.0 $26.3 $4.8 $0.3 $0.0
Total $561.9 $1,660.1 $815.3 $245.5 $107.8
State, federal, and UC sources each provide large amounts of gift aid (scholarships and grants) for UC students, while federal funds provide the bulk of student loans.
Display XVI-2: Gift Aid Expenditures by Source (Dollars in Billions)
To offset tuition and fee increases and maintain the promise of higher education for all Californians, both the University and the State have invested heavily in student financial support. Total gift aid is projected to reach nearly $2.38 billion in 2012-13, over half of which is generated from UC sources.
$0
$500
$1,000
$1,500
Student Aid Commission
Federal UC Core Funds
Other UC Funds
Private Funds
Gift Aid Loans Work-study
$0.0
$0.5
$1.0
$1.5
$2.0
$2.5
2000-01 2011-12
California Student Aid Commission Federal FundsUC Core Funds Other University FundsPrivate Funds
Student Financial Aid
113
equivalent to 50% of new systemwide tuition and fee
revenue from graduate academic students to student
financial support in 2013-14.
The University would also set aside an amount equivalent
to 33% of new tuition and fee revenue from graduate
students in professional degree programs. In addition,
these programs will be expected to supplement financial aid
resources by an amount equivalent to at least 33% of new
Professional Degree Supplemental Tuition revenue in
2013-14, or to maintain a base level of financial aid
equivalent to at least 33% of the total Professional Degree
Supplemental Tuition revenue. The University continues to
monitor indicators of program affordability, including
demographic trends in enrollment and cumulative debt
levels. The availability of flexible loan repayment plans is
becoming increasingly important to these students. For
2013-14, UC expects that campuses will continue to
provide loan assistance repayment programs (LRAPs)
where appropriate to help borrowers with public interest
employment meet their student loan repayment obligations.
As mentioned in the Student Tuition and Fees chapter, the
University also proposes to freeze Nonresident
Supplemental Tuition for graduate academic students for
the ninth consecutive year and to freeze Nonresident
Supplemental Tuition for graduate professional students for
the tenth year in a row.2 By forgoing any increase in
graduate Nonresident Supplemental Tuition, the University
has effectively reduced the real cost of Nonresident
Supplemental Tuition in each of the past few years.
Each year UC prepares a comprehensive report for the
Regents describing how undergraduate and graduate
students finance their education.3 In 2012-13 and beyond,
the University will continue to closely monitor the
effectiveness of its financial support to evaluate its success
in adhering to the principles, articulated by the Regents, of
2 Graduate academic students experienced a slight increase in the nonresident tuition charge in 2011-12,which was offset by the elimination of differentials in Tuition for nonresident students. The change was cost-neutral to students.3 Annual student financial support reports, compiled by the Student Financial Support unit in the Student Affairs department at the UC Office of the President, are available at www.ucop.edu/sas/sfs/reports_data.html.
affordability at the undergraduate level and competitiveness
at the graduate level.
FUND SOURCES FOR FINANCIAL AID
UC students may receive scholarships, fellowships, grants,
loans, work-study jobs, and tuition and fee remissions to
assist them in paying the educational costs of attending
UC. The cost of attendance includes tuition and fees, living
expenses, books, and other expenses. UC students
receive assistance from four major fund sources: State aid
programs, federal aid programs, University funds, and
private entities.
State Aid Programs
Students at all California institutions of higher education
may receive financial support from a number of State
programs. These programs, administered on behalf of the
State by the California Student Aid Commission (CSAC),
include the Cal Grant A and B Programs, described below.
The Cal Grant A Program is the largest of the State’s aid programs and provides grants covering UC systemwide fees for needy, meritorious undergraduates.
The Cal Grant B Program provides grants covering systemwide charges and a small stipend for living expenses to undergraduates from particularly low-income or disadvantaged backgrounds. First-year recipients generally receive the stipend only.
The programs are designed to promote access to
postsecondary education and to foster student choice
among California institutions of higher education. Cal Grant
awards for recipients attending UC and CSU currently
cover systemwide student charges, but provide only
minimal assistance to help students cover other costs of
attendance. In 2010-11, nearly 56,000 UC students were
awarded $561 million in financial aid from all programs
administered by CSAC. Cal Grant funding for UC students
has increased in recent years as UC’s charges have
increased. It is anticipated that the State would provide
additional funding to cover proposed 2013-14 tuition and
fee increases for UC Cal Grant recipients. UC will
work with the other segments of higher education and
other stakeholders to ensure that the State maintains its
historic commitment to the Cal Grant program and that the
program continues to be funded at necessary levels,
including funding to cover the proposed increases.
Student Financial Aid
114
UNIVERSITY OF CALIFORNIA RETURN-TO-AID
Historically, the University has funded UC student financial support needs in part by setting aside a portion of revenue from tuition and fee increases for financial aid for needy students, a practice called “return-to-aid.” As UC more fully recognized student financial need not covered by external resources and as student need increased over time, the percentage of revenue from tuition and fee increases dedicated to financial aid also increased.
In 1987-88, the percentage of new tuition and fee revenuededicated to financial aid was 16%; this proportion has increased over time to 33% for undergraduates. Similarly, the University has increased its systemwide commitment to graduate student support through a return-to-aid of 50% on new tuition and fee revenue for graduate academic students and 33% of all new tuition and fee revenue for students in professional degree programs. In addition, campuses are expected to set aside a minimum of 25% of the revenue from newly enacted campus-based fees for return-to-aid.
UNIVERSITY OF CALIFORNIA BLUE AND GOLD OPPORTUNITY PLAN
In 2012-13, the Blue and Gold Opportunity Plan ensures that financially needy California undergraduates with total family income under $80,000 have systemwide tuition and fees covered (up to the students’ need) by scholarship or grant awards. This initiative, introduced in 2009-10, helps ensure that UC tuition and fee charges do not deter the half of California households with incomes below $80,000 from aspiring to a UC education. Over 70,000 UCundergraduates are expected to qualify for the Plan in 2012-13.
Federal Aid Programs
UC students receive federal support in three ways:
Federal grants and scholarships worth $486 million in 2010-11, which comprised 23% of all grants and scholarships received by UC students that year;
Loans totaling $1.1 billion in 2010-11; andFederal tax credits and income tax deductions, fromwhich many UC families benefited. Nationally, the value of these federal benefits has grown steadily since their introduction in 1997; tax credits and deductions are described in greater detail at the end of this chapter.
Augmentations to federal aid programs resulting from the
American Recovery and Reinvestment Act of 2009 affected
funding for 2010-11 and 2011-12 and are discussed later in
this chapter.
University Funds
University funds consist of two components: UC core
operating funds and other University aid funds. The
University designates $815 million in UC core operating
funds – i.e., student fee revenue, UC General Funds and
State General Funds – for student financial support. Other
University aid funds totaled $245 million in 2010-11 and
were provided through campus-based programs funded by
endowment income, current gifts, and campus discretionary
funds. Nearly all (99%) of the support provided by
University funds was in the form of fellowships,
scholarships, and grants.
Private Support for Financial Aid
Private agencies and firms also provide student financial
support through scholarships and other forms of aid. Funds
in this category range from traineeships and fellowships
from private firms (e.g., Hewlett Packard and IBM), to funds
from associations and foundations (e.g., the Gates
Millennium Scholars program and the American Cancer
Society), to small scholarships from community
organizations. Nearly all funds in this category are
awarded to students in the form of scholarship or grant
support. In 2010-11, $63 million was awarded to UC
students from private agency programs, representing 3% of
the gift aid students received during that year.
Private loans are an important financing option for students
with unique circumstances, such as international students
with no U.S. co-signers and students who have already
borrowed the maximum allowable amount under federal
student loan programs. Such loans are particularly
important for students in professional degree programs due
to the relatively high cost of those programs. UC students
borrowed $44 million from private lenders in 2010-11. UC
makes extensive efforts to identify lenders that offer private
student loans with competitive terms in order to help
students in various programs make well-informed decisions
about private loans.
Other, smaller sources of financial assistance, including
exemptions and tax credits, are described in more detail at
the end of this chapter.
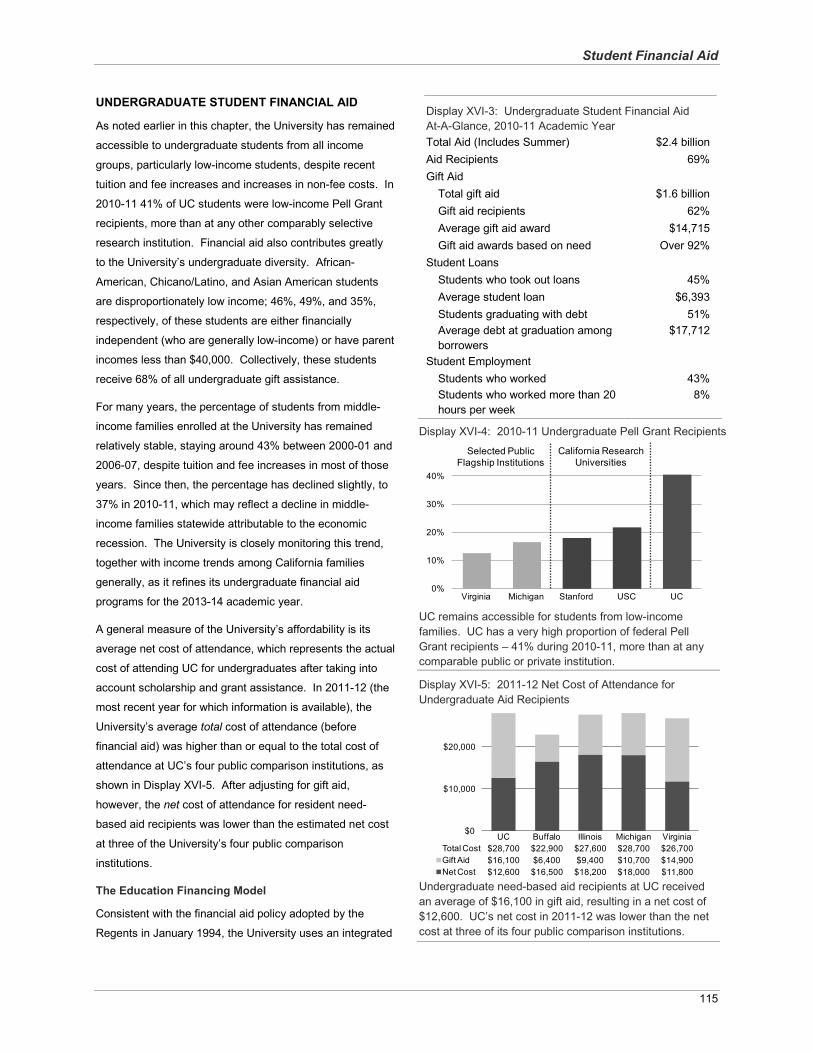
Student Financial Aid
115
UNDERGRADUATE STUDENT FINANCIAL AID
As noted earlier in this chapter, the University has remained
accessible to undergraduate students from all income
groups, particularly low-income students, despite recent
tuition and fee increases and increases in non-fee costs. In
2010-11 41% of UC students were low-income Pell Grant
recipients, more than at any other comparably selective
research institution. Financial aid also contributes greatly
to the University’s undergraduate diversity. African-
American, Chicano/Latino, and Asian American students
are disproportionately low income; 46%, 49%, and 35%,
respectively, of these students are either financially
independent (who are generally low-income) or have parent
incomes less than $40,000. Collectively, these students
receive 68% of all undergraduate gift assistance.
For many years, the percentage of students from middle-
income families enrolled at the University has remained
relatively stable, staying around 43% between 2000-01 and
2006-07, despite tuition and fee increases in most of those
years. Since then, the percentage has declined slightly, to
37% in 2010-11, which may reflect a decline in middle-
income families statewide attributable to the economic
recession. The University is closely monitoring this trend,
together with income trends among California families
generally, as it refines its undergraduate financial aid
programs for the 2013-14 academic year.
A general measure of the University’s affordability is its
average net cost of attendance, which represents the actual
cost of attending UC for undergraduates after taking into
account scholarship and grant assistance. In 2011-12 (the
most recent year for which information is available), the
University’s average total cost of attendance (before
financial aid) was higher than or equal to the total cost of
attendance at UC’s four public comparison institutions, as
shown in Display XVI-5. After adjusting for gift aid,
however, the net cost of attendance for resident need-
based aid recipients was lower than the estimated net cost
at three of the University’s four public comparison
institutions.
The Education Financing Model
Consistent with the financial aid policy adopted by the
Regents in January 1994, the University uses an integrated
Display XVI-3: Undergraduate Student Financial AidAt-A-Glance, 2010-11 Academic YearTotal Aid (Includes Summer) $2.4 billionAid Recipients 69%Gift Aid
Total gift aid $1.6 billionGift aid recipients 62%Average gift aid award $14,715Gift aid awards based on need Over 92%
Student LoansStudents who took out loans 45%Average student loan $6,393Students graduating with debt 51%Average debt at graduation among borrowers
$17,712
Student EmploymentStudents who worked 43%Students who worked more than 20 hours per week
8%
Display XVI-4: 2010-11 Undergraduate Pell Grant Recipients
UC remains accessible for students from low-income families. UC has a very high proportion of federal Pell Grant recipients – 41% during 2010-11, more than at any comparable public or private institution.
Display XVI-5: 2011-12 Net Cost of Attendance for Undergraduate Aid Recipients
Undergraduate need-based aid recipients at UC received an average of $16,100 in gift aid, resulting in a net cost of $12,600. UC’s net cost in 2011-12 was lower than the net cost at three of its four public comparison institutions.
0%
10%
20%
30%
40%
Virginia Michigan Stanford USC UC
California Research Universities
Selected Public Flagship Institutions
$0
$10,000
$20,000
UC Buffalo Illinois Michigan VirginiaTotal Cost $28,700 $22,900 $27,600 $28,700 $26,700Gift Aid $16,100 $6,400 $9,400 $10,700 $14,900Net Cost $12,600 $16,500 $18,200 $18,000 $11,800
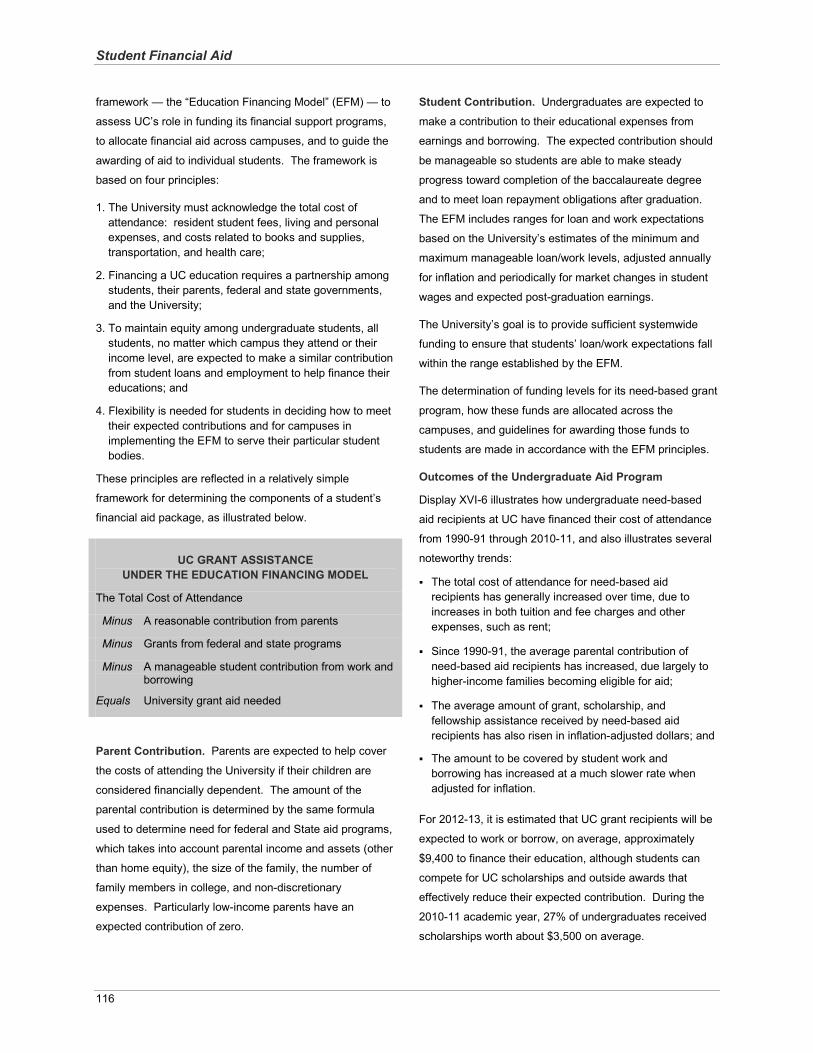
Student Financial Aid
116
framework — the “Education Financing Model” (EFM) — to
assess UC’s role in funding its financial support programs,
to allocate financial aid across campuses, and to guide the
awarding of aid to individual students. The framework is
based on four principles:
1. The University must acknowledge the total cost of attendance: resident student fees, living and personal expenses, and costs related to books and supplies, transportation, and health care;
2. Financing a UC education requires a partnership among students, their parents, federal and state governments, and the University;
3. To maintain equity among undergraduate students, all students, no matter which campus they attend or their income level, are expected to make a similar contribution from student loans and employment to help finance their educations; and
4. Flexibility is needed for students in deciding how to meet their expected contributions and for campuses in implementing the EFM to serve their particular student bodies.
These principles are reflected in a relatively simple
framework for determining the components of a student’s
financial aid package, as illustrated below.
UC GRANT ASSISTANCE UNDER THE EDUCATION FINANCING MODEL
The Total Cost of Attendance
Minus A reasonable contribution from parents
Minus Grants from federal and state programs
Minus A manageable student contribution from work andborrowing
Equals University grant aid needed
Parent Contribution. Parents are expected to help cover
the costs of attending the University if their children are
considered financially dependent. The amount of the
parental contribution is determined by the same formula
used to determine need for federal and State aid programs,
which takes into account parental income and assets (other
than home equity), the size of the family, the number of
family members in college, and non-discretionary
expenses. Particularly low-income parents have an
expected contribution of zero.
Student Contribution. Undergraduates are expected to
make a contribution to their educational expenses from
earnings and borrowing. The expected contribution should
be manageable so students are able to make steady
progress toward completion of the baccalaureate degree
and to meet loan repayment obligations after graduation.
The EFM includes ranges for loan and work expectations
based on the University’s estimates of the minimum and
maximum manageable loan/work levels, adjusted annually
for inflation and periodically for market changes in student
wages and expected post-graduation earnings.
The University’s goal is to provide sufficient systemwide
funding to ensure that students’ loan/work expectations fall
within the range established by the EFM.
The determination of funding levels for its need-based grant
program, how these funds are allocated across the
campuses, and guidelines for awarding those funds to
students are made in accordance with the EFM principles.
Outcomes of the Undergraduate Aid Program
Display XVI-6 illustrates how undergraduate need-based
aid recipients at UC have financed their cost of attendance
from 1990-91 through 2010-11, and also illustrates several
noteworthy trends:
The total cost of attendance for need-based aid recipients has generally increased over time, due to increases in both tuition and fee charges and otherexpenses, such as rent;
Since 1990-91, the average parental contribution of need-based aid recipients has increased, due largely to higher-income families becoming eligible for aid;
The average amount of grant, scholarship, and fellowship assistance received by need-based aid recipients has also risen in inflation-adjusted dollars; and
The amount to be covered by student work and borrowing has increased at a much slower rate whenadjusted for inflation.
For 2012-13, it is estimated that UC grant recipients will be
expected to work or borrow, on average, approximately
$9,400 to finance their education, although students can
compete for UC scholarships and outside awards that
effectively reduce their expected contribution. During the
2010-11 academic year, 27% of undergraduates received
scholarships worth about $3,500 on average.
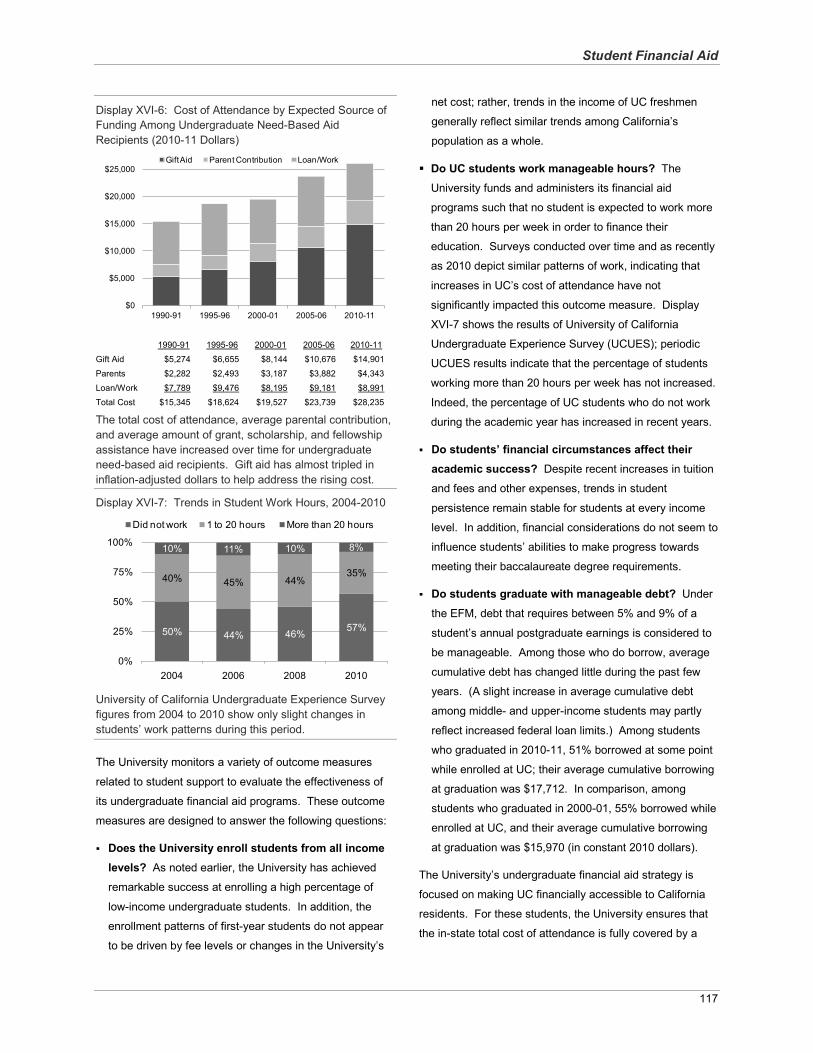
Student Financial Aid
117
Display XVI-6: Cost of Attendance by Expected Source of Funding Among Undergraduate Need-Based Aid Recipients (2010-11 Dollars)
1990-91 1995-96 2000-01 2005-06 2010-11
Gift Aid $5,274 $6,655 $8,144 $10,676 $14,901
Parents $2,282 $2,493 $3,187 $3,882 $4,343
Loan/Work $7,789 $9,476 $8,195 $9,181 $8,991
Total Cost $15,345 $18,624 $19,527 $23,739 $28,235
The total cost of attendance, average parental contribution, and average amount of grant, scholarship, and fellowship assistance have increased over time for undergraduate need-based aid recipients. Gift aid has almost tripled in inflation-adjusted dollars to help address the rising cost.
Display XVI-7: Trends in Student Work Hours, 2004-2010
University of California Undergraduate Experience Survey figures from 2004 to 2010 show only slight changes instudents’ work patterns during this period.
The University monitors a variety of outcome measures
related to student support to evaluate the effectiveness of
its undergraduate financial aid programs. These outcome
measures are designed to answer the following questions:
Does the University enroll students from all income levels? As noted earlier, the University has achieved
remarkable success at enrolling a high percentage of
low-income undergraduate students. In addition, the
enrollment patterns of first-year students do not appear
to be driven by fee levels or changes in the University’s
net cost; rather, trends in the income of UC freshmen
generally reflect similar trends among California’s
population as a whole.
Do UC students work manageable hours? The
University funds and administers its financial aid
programs such that no student is expected to work more
than 20 hours per week in order to finance their
education. Surveys conducted over time and as recently
as 2010 depict similar patterns of work, indicating that
increases in UC’s cost of attendance have not
significantly impacted this outcome measure. Display
XVI-7 shows the results of University of California
Undergraduate Experience Survey (UCUES); periodic
UCUES results indicate that the percentage of students
working more than 20 hours per week has not increased.
Indeed, the percentage of UC students who do not work
during the academic year has increased in recent years.
Do students’ financial circumstances affect their academic success? Despite recent increases in tuition
and fees and other expenses, trends in student
persistence remain stable for students at every income
level. In addition, financial considerations do not seem to
influence students’ abilities to make progress towards
meeting their baccalaureate degree requirements.
Do students graduate with manageable debt? Under
the EFM, debt that requires between 5% and 9% of a
student’s annual postgraduate earnings is considered to
be manageable. Among those who do borrow, average
cumulative debt has changed little during the past few
years. (A slight increase in average cumulative debt
among middle- and upper-income students may partly
reflect increased federal loan limits.) Among students
who graduated in 2010-11, 51% borrowed at some point
while enrolled at UC; their average cumulative borrowing
at graduation was $17,712. In comparison, among
students who graduated in 2000-01, 55% borrowed while
enrolled at UC, and their average cumulative borrowing
at graduation was $15,970 (in constant 2010 dollars).
The University’s undergraduate financial aid strategy is
focused on making UC financially accessible to California
residents. For these students, the University ensures that
the in-state total cost of attendance is fully covered by a
$0
$5,000
$10,000
$15,000
$20,000
$25,000
1990-91 1995-96 2000-01 2005-06 2010-11
Gift Aid Parent Contribution Loan/Work
50% 44% 46% 57%
40% 45% 44%35%
10% 11% 10% 8%
0%
25%
50%
75%
100%
2004 2006 2008 2010
Did not work 1 to 20 hours More than 20 hours
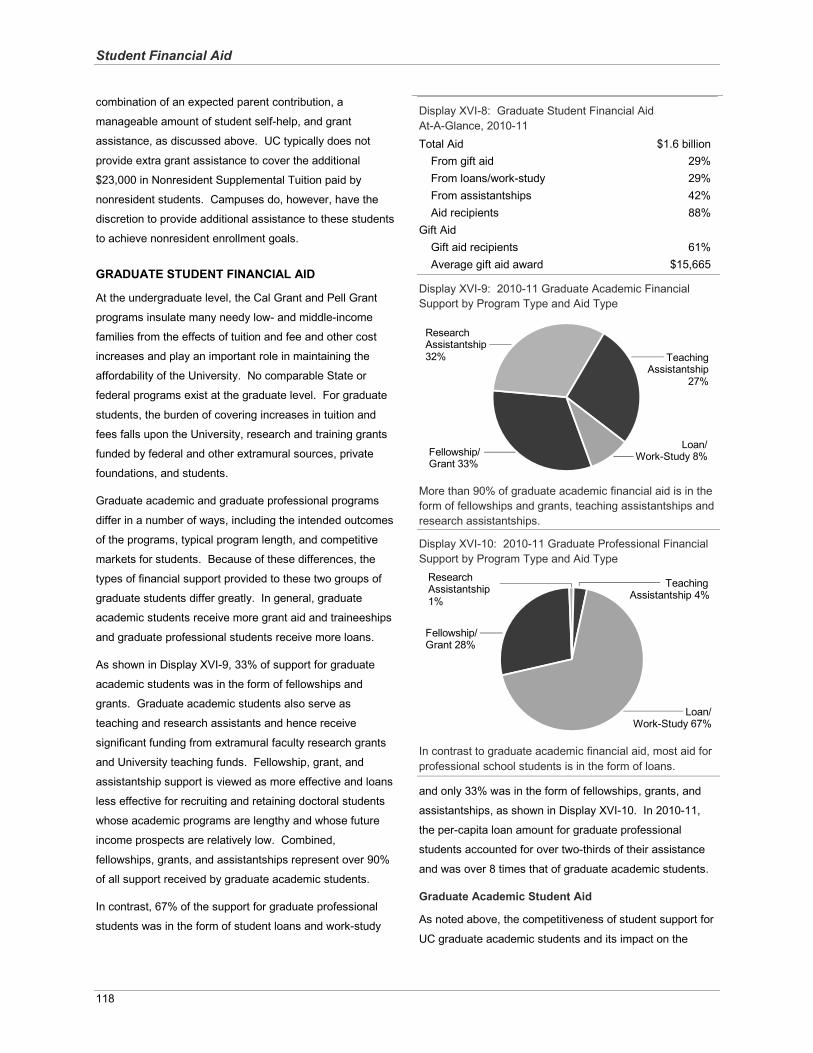
Student Financial Aid
118
combination of an expected parent contribution, a
manageable amount of student self-help, and grant
assistance, as discussed above. UC typically does not
provide extra grant assistance to cover the additional
$23,000 in Nonresident Supplemental Tuition paid by
nonresident students. Campuses do, however, have the
discretion to provide additional assistance to these students
to achieve nonresident enrollment goals.
GRADUATE STUDENT FINANCIAL AID
At the undergraduate level, the Cal Grant and Pell Grant
programs insulate many needy low- and middle-income
families from the effects of tuition and fee and other cost
increases and play an important role in maintaining the
affordability of the University. No comparable State or
federal programs exist at the graduate level. For graduate
students, the burden of covering increases in tuition and
fees falls upon the University, research and training grants
funded by federal and other extramural sources, private
foundations, and students.
Graduate academic and graduate professional programs
differ in a number of ways, including the intended outcomes
of the programs, typical program length, and competitive
markets for students. Because of these differences, the
types of financial support provided to these two groups of
graduate students differ greatly. In general, graduate
academic students receive more grant aid and traineeships
and graduate professional students receive more loans.
As shown in Display XVI-9, 33% of support for graduate
academic students was in the form of fellowships and
grants. Graduate academic students also serve as
teaching and research assistants and hence receive
significant funding from extramural faculty research grants
and University teaching funds. Fellowship, grant, and
assistantship support is viewed as more effective and loans
less effective for recruiting and retaining doctoral students
whose academic programs are lengthy and whose future
income prospects are relatively low. Combined,
fellowships, grants, and assistantships represent over 90%
of all support received by graduate academic students.
In contrast, 67% of the support for graduate professional
students was in the form of student loans and work-study
Display XVI-8: Graduate Student Financial Aid At-A-Glance, 2010-11Total Aid $1.6 billion
From gift aid 29%From loans/work-study 29%From assistantships 42%Aid recipients 88%
Gift AidGift aid recipients 61%Average gift aid award $15,665
Display XVI-9: 2010-11 Graduate Academic Financial Support by Program Type and Aid Type
More than 90% of graduate academic financial aid is in the form of fellowships and grants, teaching assistantships and research assistantships.
Display XVI-10: 2010-11 Graduate Professional Financial Support by Program Type and Aid Type
In contrast to graduate academic financial aid, most aid for professional school students is in the form of loans.
and only 33% was in the form of fellowships, grants, and
assistantships, as shown in Display XVI-10. In 2010-11,
the per-capita loan amount for graduate professional
students accounted for over two-thirds of their assistance
and was over 8 times that of graduate academic students.
Graduate Academic Student Aid
As noted above, the competitiveness of student support for
UC graduate academic students and its impact on the
Research Assistantship 32%
Fellowship/Grant 33%
Teaching Assistantship
27%
Loan/Work-Study 8%
Teaching Assistantship 4%
Research Assistantship 1%
Fellowship/Grant 28%
Loan/Work-Study 67%
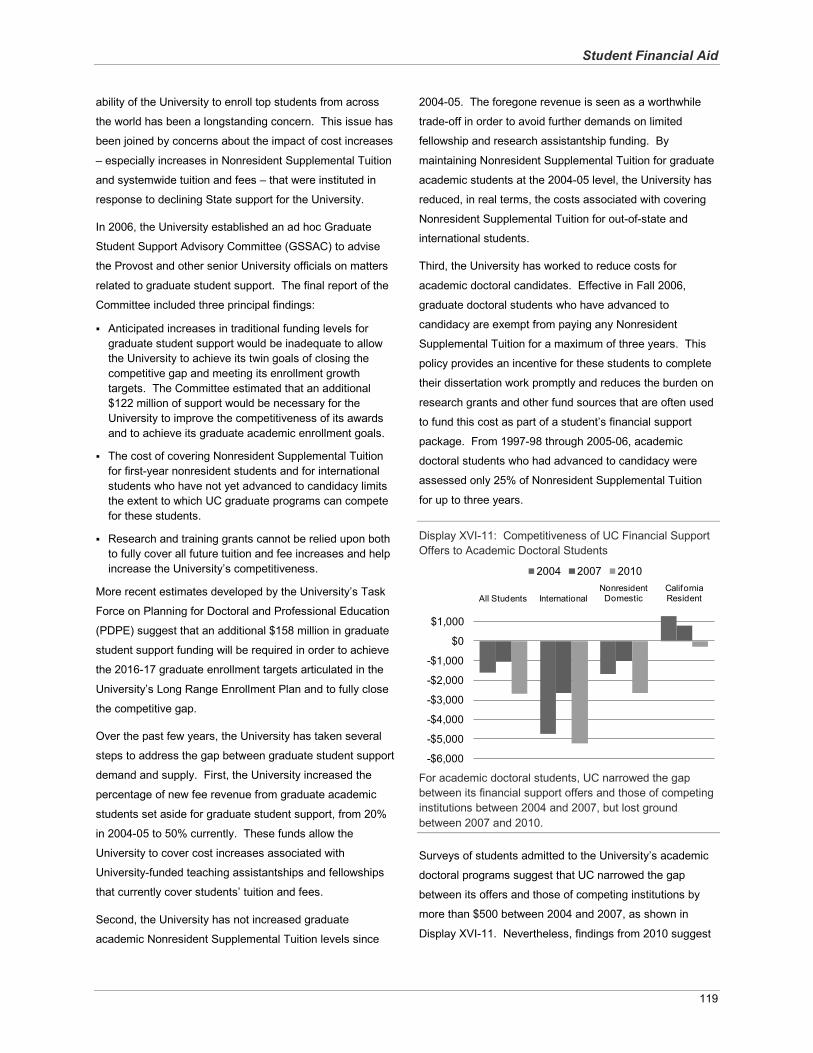
Student Financial Aid
119
ability of the University to enroll top students from across
the world has been a longstanding concern. This issue has
been joined by concerns about the impact of cost increases
– especially increases in Nonresident Supplemental Tuition
and systemwide tuition and fees – that were instituted in
response to declining State support for the University.
In 2006, the University established an ad hoc Graduate
Student Support Advisory Committee (GSSAC) to advise
the Provost and other senior University officials on matters
related to graduate student support. The final report of the
Committee included three principal findings:
Anticipated increases in traditional funding levels for graduate student support would be inadequate to allow the University to achieve its twin goals of closing the competitive gap and meeting its enrollment growth targets. The Committee estimated that an additional $122 million of support would be necessary for the University to improve the competitiveness of its awards and to achieve its graduate academic enrollment goals.
The cost of covering Nonresident Supplemental Tuition for first-year nonresident students and for international students who have not yet advanced to candidacy limits the extent to which UC graduate programs can compete for these students.
Research and training grants cannot be relied upon both to fully cover all future tuition and fee increases and help increase the University’s competitiveness.
More recent estimates developed by the University’s Task
Force on Planning for Doctoral and Professional Education
(PDPE) suggest that an additional $158 million in graduate
student support funding will be required in order to achieve
the 2016-17 graduate enrollment targets articulated in the
University’s Long Range Enrollment Plan and to fully close
the competitive gap.
Over the past few years, the University has taken several
steps to address the gap between graduate student support
demand and supply. First, the University increased the
percentage of new fee revenue from graduate academic
students set aside for graduate student support, from 20%
in 2004-05 to 50% currently. These funds allow the
University to cover cost increases associated with
University-funded teaching assistantships and fellowships
that currently cover students’ tuition and fees.
Second, the University has not increased graduate
academic Nonresident Supplemental Tuition levels since
2004-05. The foregone revenue is seen as a worthwhile
trade-off in order to avoid further demands on limited
fellowship and research assistantship funding. By
maintaining Nonresident Supplemental Tuition for graduate
academic students at the 2004-05 level, the University has
reduced, in real terms, the costs associated with covering
Nonresident Supplemental Tuition for out-of-state and
international students.
Third, the University has worked to reduce costs for
academic doctoral candidates. Effective in Fall 2006,
graduate doctoral students who have advanced to
candidacy are exempt from paying any Nonresident
Supplemental Tuition for a maximum of three years. This
policy provides an incentive for these students to complete
their dissertation work promptly and reduces the burden on
research grants and other fund sources that are often used
to fund this cost as part of a student’s financial support
package. From 1997-98 through 2005-06, academic
doctoral students who had advanced to candidacy were
assessed only 25% of Nonresident Supplemental Tuition
for up to three years.
Display XVI-11: Competitiveness of UC Financial Support Offers to Academic Doctoral Students
For academic doctoral students, UC narrowed the gap between its financial support offers and those of competing institutions between 2004 and 2007, but lost ground between 2007 and 2010.
Surveys of students admitted to the University’s academic
doctoral programs suggest that UC narrowed the gap
between its offers and those of competing institutions by
more than $500 between 2004 and 2007, as shown in
Display XVI-11. Nevertheless, findings from 2010 suggest
-$6,000
-$5,000
-$4,000
-$3,000
-$2,000
-$1,000
$0
$1,000
All Students InternationalNonresident Domestic
California Resident
2004 2007 2010
Student Financial Aid
120
that UC has lost ground in recent years in terms of the
competitiveness of its offers to these students.
This data informed a report released in 2012 by a Joint
Administrative/Senate workgroup on Graduate Student
Issues. The report expressed concern about the ability of
UC to attract quality academic doctoral students in light of
differences in support offered by UC and its competitor
institutions. The workgroup was particularly concerned with
the impact of Nonresident Supplemental Tuition on UC’s
ability to attract talented international students.
Professional School Student Aid
The Regents’ Policy on Professional Degree Supplemental
Tuition4, approved in 1994, stipulates that an amount of
funding equivalent to at least 33% of the total revenue from
Professional Degree Supplemental Tuition be used for
financial aid. The policy was amended in July 2007, at
which time the Regents adopted specific conditions for
ensuring that the University’s commitments to access,
affordability, diversity, and students’ public service career
decisions are not adversely affected by Professional
Degree Supplemental Tuition increases. As mentioned in
the Student Tuition and Fees chapter, in 2012-13 a
systemwide Professional Degree Supplemental Tuition
Task Force will review the policy, including sections of the
policy that address financial aid for professional students.
About two-thirds of aid awarded to graduate professional
students is in the form of loans, primarily from federal loan
programs, rather than fellowships or grants. The University
also sets aside less return-to-aid funding for professional
school students (33%) than for graduate academic students
(50%). A greater reliance on loans and a smaller return-to-
aid percentage are appropriate for professional school
students because their programs are shorter, and their
incomes after graduation tend to be higher, than those of
other graduate students.
University funds are also used for loan repayment
assistance programs (LRAPs) in certain disciplines. These
programs acknowledge the fact that students who choose
careers in the public interest often forego higher incomes;
thus, these students may be less able to meet their debt
4 www.universityofcalifornia.edu/regents/policies/3103.html.
repayment obligations. Other LRAPs are funded at the
federal, state, or regional level to encourage students to
serve specific populations (e.g., to work as a physician in a
medically underserved area). In recent years, every UC
law school has significantly expanded its LRAP to provide a
higher level of debt repayment relief to a broader population
of graduates. Other professional schools are continuing to
evaluate the appropriate mix of loan assistance and
fellowship support to ensure that public interest careers
remain a viable choice for their graduates.
Since 2009-10, students can avail themselves of an Income
Based Repayment plan (IBR) for federal student loans,
which is designed to make loan repayments easier for
students who take jobs with lower salaries. The amount of
debt repayment is determined not by the loan amount but
by the borrower’s discretionary income, and repayment will
never exceed 15% of net disposable income.
As noted earlier in this chapter, the University will continue
to monitor enrollment trends and debt levels for graduate
professional students.
OTHER SOURCES OF FINANCIAL ASSISTANCE
The federal government and the State provide a number of
vehicles to help students and their families finance
education.
Cal Vet Fee Exemptions. Consistent with provisions of
the California Education Code, by University policy,
dependents of veterans whose death or disability was
service-connected are generally eligible for exemption from
mandatory systemwide fees. In 2010-11, over 2,600 UC
students took advantage of such exemptions, worth a total
of $27.2 million.
AB 540 Tuition Exemption. Consistent with Section
68130.5 of the California Education Code, by University
policy, certain nonresident students who attended a
California high school for at least three years and who
graduated from a California high school may be eligible for
exemption from Nonresident Supplemental Tuition at UC.
Potentially eligible students include undocumented students
and domestic students who fail to meet the University’s
requirements for residency. In 2010-11, over 2,400 UC
students qualified for exemptions worth $45.6 million.
Student Financial Aid
121
Federal Tax Credits. The Taxpayer Relief Act of 1997
established two tax credit programs, the Hope Tax Credit
and the Lifetime Learning Tax Credit, designed to provide
tax credits to qualified taxpayers for tuition and fees paid for
postsecondary education. Under the American Recovery
and Reinvestment Act of 2009, the Hope Tax Credit was
expanded and renamed the American Opportunity Tax
Credit (AOTC). The AOTC’s key enhancements include an
increase in the maximum credit from $1,800 to $2,500; an
increase in the income ceiling from $116,000 to $180,000
for married filers; and an increase in the length of eligibility
from two to four years of education. The Lifetime Learning
Tax Credit provides smaller tax credits, and taxpayers are
not limited to payments made during the first four years. In
general, middle- and lower-middle-income students and
their families benefit from these tax credit programs. While
the total value of higher education tax credits benefitting UC
students and their families is not known, it likely exceeded
$140 million for tax year 2011.
Tax Deduction for Higher Education Expenses. In 2001,
a new higher education expense deduction was established
to provide relief to families whose incomes disqualify them
from participation in the federal education tax credits.
Eligible families can qualify for a deduction of up to $4,000.
Scholarshare Trust College Savings Program. This tax-
exempt college savings program administered by the
California State Treasurer encourages families to save for
college expenses.
Penalty-Free IRA Withdrawals. Taxpayers may withdraw
funds penalty-free from either a traditional Individual
Retirement Account (IRA) or a Roth IRA for postsecondary
education expenses. This provision is intended to assist
middle-income families.
Coverdell Education Savings Account. The Economic
Growth and Tax Relief Reconciliation Act of 2001
established the Coverdell Education Savings Account
(ESA) to replace the Education IRA and assist middle-
income families. Although contributions are not tax-
deductible, earnings on the ESA are tax-free and no taxes
are due upon withdrawal if used for qualified higher
education expenses.
U.S. Savings Bonds. The interest on U.S. savings bonds
is, under certain circumstances, tax-free when bond
proceeds are used to cover education expenses. Eligibility
is a function of income level when the bond is redeemed
and is intended to assist middle-income families.
Student Loan Interest Deduction. Borrowers may take a
tax deduction for interest paid on student loans. Middle-
and lower-middle-income borrowers with high debt are the
primary beneficiaries of this deduction.
Loan Repayment Assistance Programs. Loan
repayment assistance programs (LRAPs), loan assumption
programs, and loan forgiveness programs are available to
graduates who enter certain professions or who serve
specific populations after graduation.
Veterans Education Benefits. Several federal programs
provide financial assistance to help veterans and their
dependents finance a college education. In particular, the
newly enacted GI Bill provides eligible veterans attending
UC with an amount equivalent to what is charged to in-state
residents for tuition and fees.
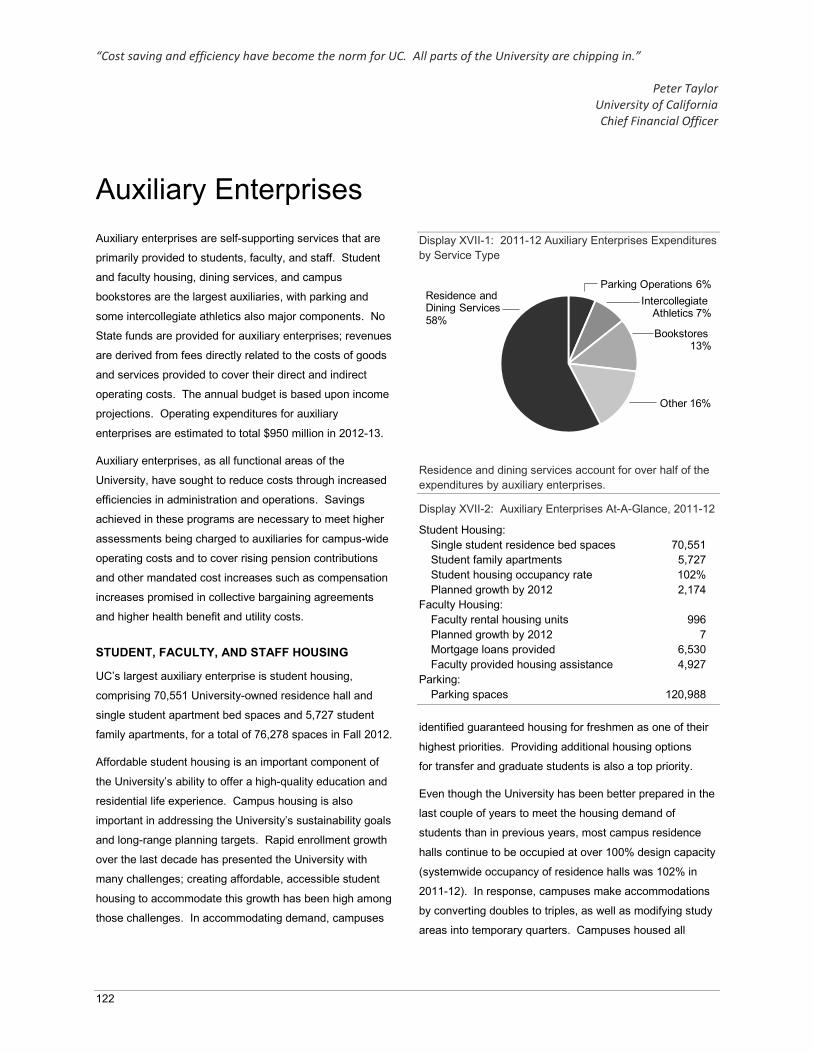
“Cost saving and efficiency have become the norm for UC. All parts of the University are chipping in.”
Peter Taylor University of California Chief Financial Officer
122
Auxiliary EnterprisesAuxiliary enterprises are self-supporting services that are
primarily provided to students, faculty, and staff. Student
and faculty housing, dining services, and campus
bookstores are the largest auxiliaries, with parking and
some intercollegiate athletics also major components. No
State funds are provided for auxiliary enterprises; revenues
are derived from fees directly related to the costs of goods
and services provided to cover their direct and indirect
operating costs. The annual budget is based upon income
projections. Operating expenditures for auxiliary
enterprises are estimated to total $950 million in 2012-13.
Auxiliary enterprises, as all functional areas of the
University, have sought to reduce costs through increased
efficiencies in administration and operations. Savings
achieved in these programs are necessary to meet higher
assessments being charged to auxiliaries for campus-wide
operating costs and to cover rising pension contributions
and other mandated cost increases such as compensation
increases promised in collective bargaining agreements
and higher health benefit and utility costs.
STUDENT, FACULTY, AND STAFF HOUSING
UC’s largest auxiliary enterprise is student housing,
comprising 70,551 University-owned residence hall and
single student apartment bed spaces and 5,727 student
family apartments, for a total of 76,278 spaces in Fall 2012.
Affordable student housing is an important component of
the University’s ability to offer a high-quality education and
residential life experience. Campus housing is also
important in addressing the University’s sustainability goals
and long-range planning targets. Rapid enrollment growth
over the last decade has presented the University with
many challenges; creating affordable, accessible student
housing to accommodate this growth has been high among
those challenges. In accommodating demand, campuses
Display XVII-1: 2011-12 Auxiliary Enterprises Expenditures by Service Type
Residence and dining services account for over half of the expenditures by auxiliary enterprises.
Display XVII-2: Auxiliary Enterprises At-A-Glance, 2011-12
Student Housing:Single student residence bed spaces 70,551Student family apartments 5,727Student housing occupancy rate 102%Planned growth by 2012 2,174
Faculty Housing:Faculty rental housing units 996Planned growth by 2012 7Mortgage loans provided 6,530Faculty provided housing assistance 4,927
Parking:Parking spaces 120,988
identified guaranteed housing for freshmen as one of their
highest priorities. Providing additional housing options
for transfer and graduate students is also a top priority.
Even though the University has been better prepared in the
last couple of years to meet the housing demand of
students than in previous years, most campus residence
halls continue to be occupied at over 100% design capacity
(systemwide occupancy of residence halls was 102% in
2011-12). In response, campuses make accommodations
by converting doubles to triples, as well as modifying study
areas into temporary quarters. Campuses housed all
Residence and Dining Services 58%
Parking Operations 6%
Other 16%
Bookstores 13%
Intercollegiate Athletics 7%
Auxiliary Enterprises
123
freshmen who met enrollment and housing application
deadlines. While enrollment growth has slowed, an
occupancy rate exceeding capacity is expected to continue
as campuses seek to meet increased demand by students
other than freshmen.
The California housing market is a continuing deterrent to
UC’s faculty recruitment efforts, particularly for junior
faculty, and adding faculty and staff housing units continues
to be a high priority. Various programs to alleviate this
problem have been implemented since 1978:
Rental housing units are made available to newlyappointed faculty according to criteria established by each campus. These units are self-supporting without subsidy from student rental income.Home loan programs provide mortgage loans with favorable interest rates and/or down payment requirements to faculty members and other designated employees.
The Faculty Recruitment Allowance Program providesfaculty members with housing assistance during their first years of employment with the University.
Six campuses have developed for-sale housing on land owned by the University. The land is leased to the purchaser of a unit built by a private developer.
BOOKSTORES
Nine of the campuses own and operate bookstores
providing a broad selection of general books, textbooks,
computer products, supplies, insignia apparel and
souvenirs, sporting goods, dormitory and apartment living
supplies, newsstand materials, groceries, and a variety
of other products. The Berkeley campus is the only
campus that contracts the management of the campus
bookstore to a private operator.
Although each campus bookstore serves the unique needs
of the campus within the context of the local marketplace,
there are common trends among UC bookstores and their
counterparts serving other research universities:
Declining disposable income among students, faculty, staff, and parents and slower enrollment growth, the result of the economic downturn in both the state and the nation, continue to have a negative impact on total revenue from book and merchandise sales.
Textbook sales, traditionally comprised of both new and used titles, now include custom content textbooks, digital textbooks, custom course packs, loose-leaf books, computer software, and rental textbooks.
Declines in the number of textbooks and general books sold have accelerated in recent years, and this trend isexpected to continue in 2013-14.
In recent years, the sale of course materials content has declined while bookstore sales of computer products (the tools to access that content) have increased. However, more recently, sales of computer products have leveled off as the much-coveted Educational Pricing is now available at Apple Computer stores as well as campus bookstores. UC bookstores are striving to add merchandise to add value to the quality of campus life and to offset the decline in textbook revenue.
Growth in revenues from online sales continues.
PARKING
UC’s parking program is another major auxiliary, with
approximately 121,000 spaces for students, faculty, staff,
and visitors. Campuses encourage students, faculty, and
staff to commute to campus via alternative modes to reduce
trips and greenhouse gas emissions. In support of the UC
Policy on Sustainable Practices and in conformance with
campus Long Range Development Plan Environmental
Impact Reports (EIRs), all campuses have implemented
extensive Transportation Demand Management programs,
including carpools, vanpools, shuttles, transit pass
subsidies, and similar initiatives. These programs are
funded, in part, by parking revenues. Campus Long Range
Development Plan EIRs require mitigation of University-
created traffic impacts, thus the more the campus
population commutes via alternative transportation modes,
the less UC’s impact on off-campus intersections.
INTERCOLLEGIATE ATHLETICS
Most UC campuses operate recreation and intercollegiate
athletics programs exclusively as student services (as
described in the Student Services chapter of this
document). However, the Berkeley and Los Angeles
campuses – both campuses with large intercollegiate sports
programs – operate a portion of their recreational and
intercollegiate athletics programs as auxiliary enterprises
with revenue generated from ticket sales, concessions, and
other self-supporting sources. The San Francisco campus
also runs its recreational facilities and programs as self-
supporting auxiliary enterprises, with modest subsidies from
Student Services Fee revenue.
“The University is strongly committed to responsibly managing its assets and maintaining the public trust.” Peter Taylor
University of California Chief Financial Officer
124
Provisions for AllocationProvisions for allocation serve as a temporary repository for
certain funds until final allocation decisions are made. For
instance, funds allocated for across-the-board cost
increases, such as salary adjustments, employee benefit
increases, and price increases that occur in most program
areas may be held in provision accounts pending final
allocation. Such cost increases are discussed in the
Compensation, Employee and Retirement Benefits, and
Non-Salary Cost Increases chapter of this document.
Provisions for allocation also include negative
appropriations, specifically undesignated reductions in
State General Fund budgets awaiting allocation decisions
and budgetary savings targets.
.
Display XVIII-1: Lease Purchase Revenue Bond Debt Service (Dollars in Millions)
2007-08 $159.1
2008-09 $156.6
2009-10 $141.7
2010-11 $199.5
2011-12 $199.6
2012-13 (budgeted) $212.0
DEBT SERVICE PAYMENTS FOR FACILITIES FUNDED FROM LEASE REVENUE BONDS
Funds to pay for debt service payments for University
facilities constructed from lease revenue bonds were
initially appropriated to the University in 1987-88. Under
the conditions of this funding mechanism, the University
contracts with the State to design and construct facilities,
provides the State Public Works Board (SPWB) with a land
lease for the site on which buildings will be constructed,
and enters into a lease purchase agreement for the
facilities with the SPWB.
Annual lease payments are appropriated from State funds
and used to retire the debt. At the end of the lease term,
ownership of the facilities automatically passes to the
University. In 2012-13, the State allocation to UC includes
$212 million for revenue bond lease payments. Typically,
the budgeted amount is adjusted by the State during the
year based on actual debt service payments, but this
adjustment does not have an impact on funding available
for basic operations. Consistent with past practice, the
funding level needed for lease revenue bond debt service
payments for 2013-14 will be determined by the State
Department of Finance.
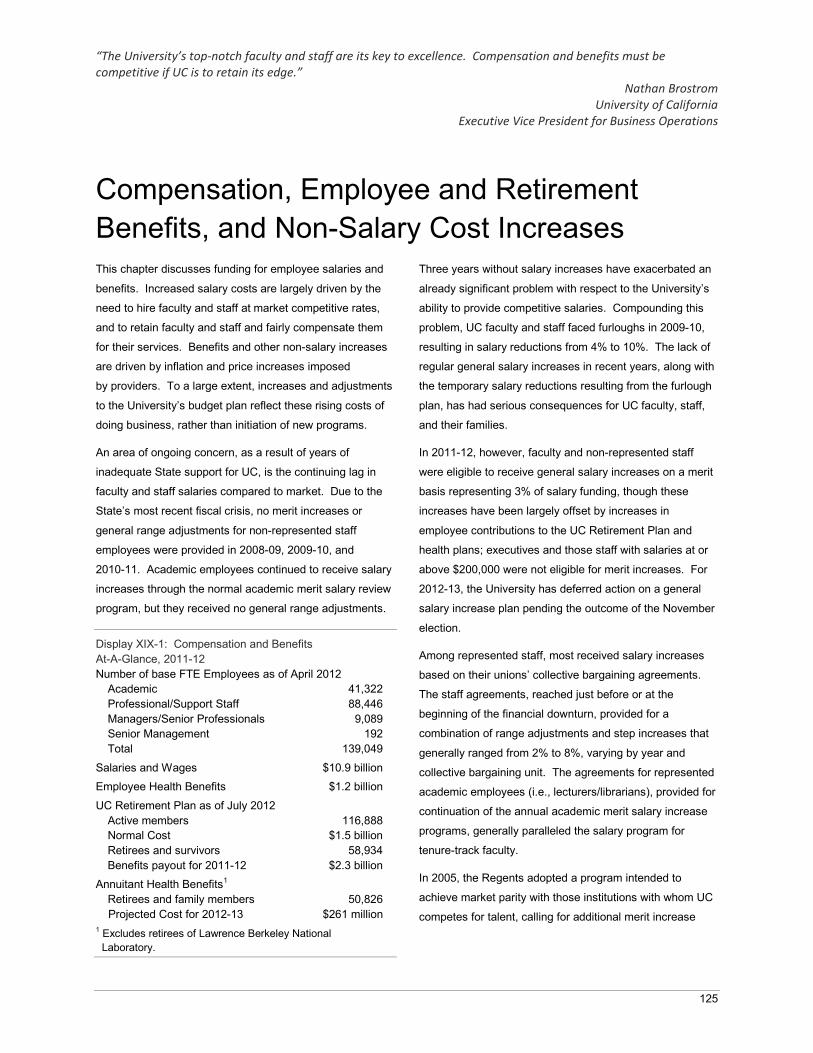
“The University’s top-notch faculty and staff are its key to excellence. Compensation and benefits must be competitive if UC is to retain its edge.”
Nathan Brostrom University of California
Executive Vice President for Business Operations
125
Compensation, Employee and Retirement Benefits, and Non-Salary Cost IncreasesThis chapter discusses funding for employee salaries and
benefits. Increased salary costs are largely driven by the
need to hire faculty and staff at market competitive rates,
and to retain faculty and staff and fairly compensate them
for their services. Benefits and other non-salary increases
are driven by inflation and price increases imposed
by providers. To a large extent, increases and adjustments
to the University’s budget plan reflect these rising costs of
doing business, rather than initiation of new programs.
An area of ongoing concern, as a result of years of
inadequate State support for UC, is the continuing lag in
faculty and staff salaries compared to market. Due to the
State’s most recent fiscal crisis, no merit increases or
general range adjustments for non-represented staff
employees were provided in 2008-09, 2009-10, and
2010-11. Academic employees continued to receive salary
increases through the normal academic merit salary review
program, but they received no general range adjustments.
Display XIX-1: Compensation and Benefits At-A-Glance, 2011-12Number of base FTE Employees as of April 2012
Academic 41,322Professional/Support Staff 88,446Managers/Senior Professionals 9,089Senior Management 192Total 139,049
Salaries and Wages $10.9 billionEmployee Health Benefits $1.2 billion
UC Retirement Plan as of July 2012Active members 116,888Normal Cost $1.5 billionRetirees and survivors 58,934Benefits payout for 2011-12 $2.3 billion
Annuitant Health Benefits1
Retirees and family members 50,826Projected Cost for 2012-13 $261 million
1 Excludes retirees of Lawrence Berkeley NationalLaboratory.
Three years without salary increases have exacerbated an
already significant problem with respect to the University’s
ability to provide competitive salaries. Compounding this
problem, UC faculty and staff faced furloughs in 2009-10,
resulting in salary reductions from 4% to 10%. The lack of
regular general salary increases in recent years, along with
the temporary salary reductions resulting from the furlough
plan, has had serious consequences for UC faculty, staff,
and their families.
In 2011-12, however, faculty and non-represented staff
were eligible to receive general salary increases on a merit
basis representing 3% of salary funding, though these
increases have been largely offset by increases in
employee contributions to the UC Retirement Plan and
health plans; executives and those staff with salaries at or
above $200,000 were not eligible for merit increases. For
2012-13, the University has deferred action on a general
salary increase plan pending the outcome of the November
election.
Among represented staff, most received salary increases
based on their unions’ collective bargaining agreements.
The staff agreements, reached just before or at the
beginning of the financial downturn, provided for a
combination of range adjustments and step increases that
generally ranged from 2% to 8%, varying by year and
collective bargaining unit. The agreements for represented
academic employees (i.e., lecturers/librarians), provided for
continuation of the annual academic merit salary increase
programs, generally paralleled the salary program for
tenure-track faculty.
In 2005, the Regents adopted a program intended to
achieve market parity with those institutions with whom UC
competes for talent, calling for additional merit increase
Compensation, Employee and Retirement Benefits, and Non-Salary Cost Increases
126
funding over a 10-year period. Due to budget constraints,
this additional funding has not been provided. In fact, since
2005, despite the Regents’ initiative, UC’s position relative
to market has worsened. In three out of the seven years
since then the University provided no salary increases, and
in one of those years implemented temporary salary
reductions and furloughs.
Thus, instead of closing market gaps, the lack of general
salary increases over a multi-year period is creating
profound talent management challenges in attracting and
retaining high-performing faculty and staff at UC. Without
UC action, these challenges will increase, particularly as
the economy recovers and other institutions are in a
position to recruit UC’s top performers.
The University’s 2013-14 budget plan includes the first year
of funding for a multi-year initiative to reinvest in quality
(described in the Budget Summary), part of which will be to
begin to address salary market gaps for all employees over
the next eight years. Paying competitive salaries for all
employees is one of the University’s highest priorities.
COMPENSATION FOR ACADEMIC AND STAFF EMPLOYEES: SALARY INCREASES
The University’s budget plan for 2013-14 includes an
expectation of resources available through revenue
increases and cost-savings measures in order to provide a
compensation increase package, which would generally
include the following elements for eligible employees:
continuation costs for salaries and health and welfare and retirement benefits provided in the previous year,
funding for merit salary increases,
general range adjustments,
market-based equity salary increases, and
health and welfare benefit cost increases.
Consistent with past practice, compensation increases
for employees funded from other fund sources – including
teaching hospital income, auxiliary enterprises, federal
funds, and other sources – will be accommodated from
within those fund sources and will conform to the
University’s established systemwide salary programs for
State-funded employees.
COMPONENTS OF A COMPENSATION PACKAGE
Continuation costs are costs incurred from salary and benefits increases provided in the previous year, but not fully funded because salary increases are often implemented on October 1 and benefit costs increase on January 1, rather than July 1 at the beginning of the budget year. Therefore, the unfunded portion must be recognized in the following budget year.
Merit increases recognize and reward relative levels of performance and contribution, and are critical to the preservation of the quality of the University and to reinforce a pay for performance philosophy. Merit salary increases for faculty and other academic employees in particular provide a reward mechanism to recognize expansion of teaching and research skills, and enable the University to compete with other major research universities in offering long-term career opportunities. Merit increases are never automatic and are based on demonstrated contributions.
General range adjustments for eligible employees are pay increases that reflect changes in the cost of living.
Market and equity adjustments help bring individual salaries to market level for employees in jobs with the biggest external market gaps and/or internal equity issues, or address recruitment and retention challenges.
In 2009, an updated study of UC’s total compensation
program indicated that, in general, average UC salaries
were significantly below the market median, but the total
compensation package, including salary and health and
welfare benefits for employees as well as post-employment
benefits (pension and retiree health), was close to market.
However, the value of the benefit package has been
decreasing as employee contributions to the UC Retirement
Plan have risen to 5% of salary, and will increase further in
the next few years to ensure the solvency of the retirement
program. In addition, inflationary increases of health
benefit costs may require employees to contribute a larger
share toward their medical premiums. The 2013-14 budget
plan includes a 3% general salary increase for all
employees.
Faculty Salary Gap
To evaluate its market position, UC compares its faculty
salaries with eight peer institutions. Due to State budget
cuts during the early 2000s, UC’s average faculty salaries
declined from parity with these comparators to a 9.6% lag
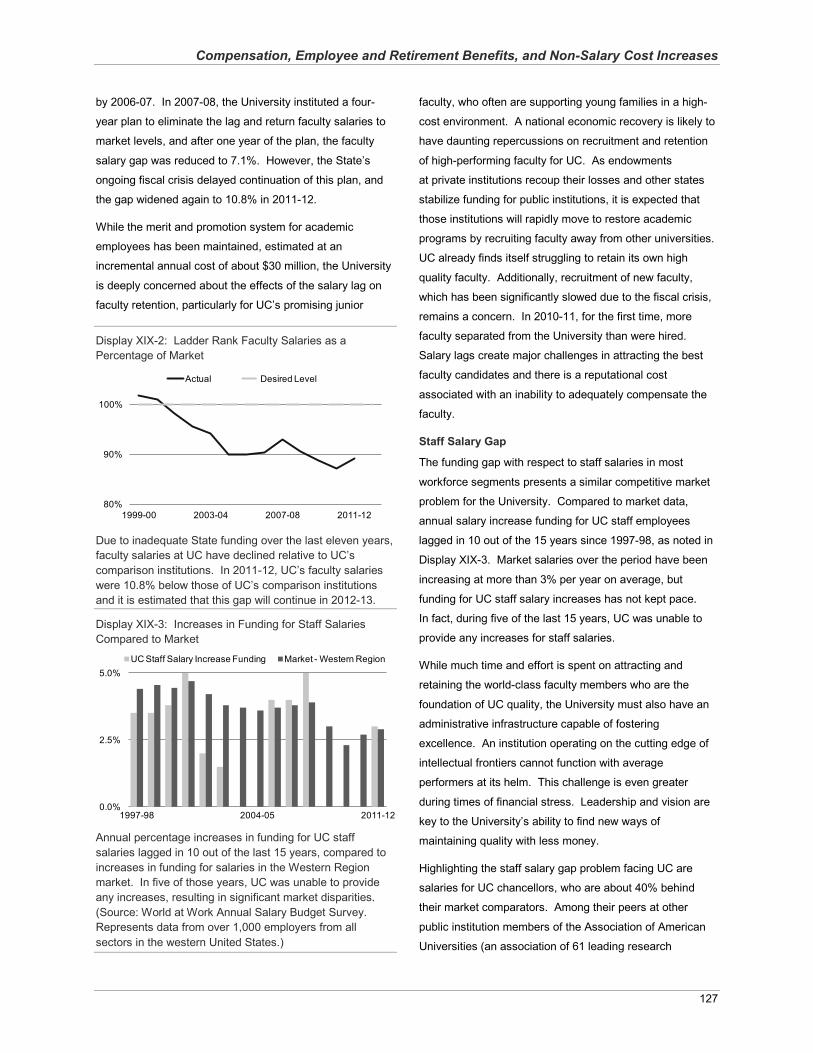
Compensation, Employee and Retirement Benefits, and Non-Salary Cost Increases
127
by 2006-07. In 2007-08, the University instituted a four-
year plan to eliminate the lag and return faculty salaries to
market levels, and after one year of the plan, the faculty
salary gap was reduced to 7.1%. However, the State’s
ongoing fiscal crisis delayed continuation of this plan, and
the gap widened again to 10.8% in 2011-12.
While the merit and promotion system for academic
employees has been maintained, estimated at an
incremental annual cost of about $30 million, the University
is deeply concerned about the effects of the salary lag on
faculty retention, particularly for UC’s promising junior
Display XIX-2: Ladder Rank Faculty Salaries as a Percentage of Market
Due to inadequate State funding over the last eleven years, faculty salaries at UC have declined relative to UC’s comparison institutions. In 2011-12, UC’s faculty salaries were 10.8% below those of UC’s comparison institutionsand it is estimated that this gap will continue in 2012-13.
Display XIX-3: Increases in Funding for Staff Salaries Compared to Market
Annual percentage increases in funding for UC staff salaries lagged in 10 out of the last 15 years, compared to increases in funding for salaries in the Western Region market. In five of those years, UC was unable to provide any increases, resulting in significant market disparities. (Source: World at Work Annual Salary Budget Survey. Represents data from over 1,000 employers from all sectors in the western United States.)
faculty, who often are supporting young families in a high-
cost environment. A national economic recovery is likely to
have daunting repercussions on recruitment and retention
of high-performing faculty for UC. As endowments
at private institutions recoup their losses and other states
stabilize funding for public institutions, it is expected that
those institutions will rapidly move to restore academic
programs by recruiting faculty away from other universities.
UC already finds itself struggling to retain its own high
quality faculty. Additionally, recruitment of new faculty,
which has been significantly slowed due to the fiscal crisis,
remains a concern. In 2010-11, for the first time, more
faculty separated from the University than were hired.
Salary lags create major challenges in attracting the best
faculty candidates and there is a reputational cost
associated with an inability to adequately compensate the
faculty.
Staff Salary Gap
The funding gap with respect to staff salaries in most
workforce segments presents a similar competitive market
problem for the University. Compared to market data,
annual salary increase funding for UC staff employees
lagged in 10 out of the 15 years since 1997-98, as noted in
Display XIX-3. Market salaries over the period have been
increasing at more than 3% per year on average, but
funding for UC staff salary increases has not kept pace.
In fact, during five of the last 15 years, UC was unable to
provide any increases for staff salaries.
While much time and effort is spent on attracting and
retaining the world-class faculty members who are the
foundation of UC quality, the University must also have an
administrative infrastructure capable of fostering
excellence. An institution operating on the cutting edge of
intellectual frontiers cannot function with average
performers at its helm. This challenge is even greater
during times of financial stress. Leadership and vision are
key to the University’s ability to find new ways of
maintaining quality with less money.
Highlighting the staff salary gap problem facing UC are
salaries for UC chancellors, who are about 40% behind
their market comparators. Among their peers at other
public institution members of the Association of American
Universities (an association of 61 leading research
80%
90%
100%
1999-00 2003-04 2007-08 2011-12
Actual Desired Level
0.0%
2.5%
5.0%
1997-98 2004-05 2011-12
UC Staff Salary Increase Funding Market - Western Region
Compensation, Employee and Retirement Benefits, and Non-Salary Cost Increases
128
FUNDING SHORTFALLS AND THE SALARY GAP
2001-02 and 2002-03: Staff salary increases were lower than planned because of inadequate State funding.
2003-04 and 2004-05: The University instituted additional internal budget cuts in order to fund academic merit increases for faculty, but no employees received a general range adjustment and staff employees received no merit increases.2005-06 through 2007-08: The Compact with the Governor provided funding for academic and staff salary increases, though not enough to reverse the effects of years without adequate salary increases.
2008-09 through 2010-11: Due to budget shortfalls, general salary increases were not provided to faculty or staff. However, the University continued to fund faculty merit increases by redirecting funds from existing resources. 2009-10: The Regents approved a one-year salary reduction/furlough plan effective September 1, 2009 to August 31, 2010. The plan instituted a tiered system of furloughs and pay reductions, based on employee pay; employees were furloughed from 10 to 26 days per year, with the lowest paid employees (up to $40,000) subject to the fewest furlough days. Pay reductions ranged from 4% to 10% per year for employees. The plan is estimated to have saved $136 million in General Funds to help address the State funding shortfall and $236 million from all fund sources.
2011-12: For the first time since 2007-08, non-represented staff were eligible for merit salary increases.
universities in the United States and Canada), salaries for
UC chancellors fall in the bottom third, despite the size,
complexity, and stature of UC. Similar issues exist for staff
employees at many levels. In Fall 2005, the Regents
adopted a plan calling for annual increases of 5% to 5.5%
in staff salaries over a period of ten years to close the staff
salary gap. From 2005-06 to 2007-08, with funding from
the Compact, UC slightly exceeded market salary increase
budgets, but during 2008-09, 2009-10, and 2010-11, no
funding was provided for staff salary increases. Further
implementation has been delayed due to the ongoing fiscal
crisis.
Similar to faculty, retention and recruitment of staff has
become a heightened concern due to the salary lag.
Economic recovery in California will generate new
opportunities for staff, and UC is beginning to experience
challenges in retaining its employees.
SALARY VERSUS TOTAL COMPENSATION
Job seekers often focus on salary to determine where to apply for employment. Salaries are the largest component of a compensation package and job seekers are not necessarily aware of the value of the benefits the University offers. If salaries are too low, job seekers may not even consider the total compensation package and apply elsewhere. In order to attract quality faculty and staff, the University cannot rely solely on their benefits package and must offer competitive salaries as well.
The University offers a total compensation package that is competitive with the market. However, due to the rising costs of health and welfare and retirement benefits, the value of the University’s compensation package is diminishing. As these costs continue to rise, the University will experience greater difficulty recruiting and retaining high quality faculty and staff.
In September 2011, the University implemented a 3% merit
pool for faculty effective October 1, 2011 and non-
represented staff employees retroactive to July 1, 2011.
This increase did not include employees who are a part of
the senior management group or any staff with base
salaries above $200,000. The purpose of this increase was
to help UC retain leading faculty members who are
increasingly being courted by competing institutions and to
demonstrate to non-represented staff members that the
University appreciates their contributions. Fairness dictated
that the University take this step.
For employees represented by unions, the University has
collective bargaining agreements that specify compensation
increases for their members. Actual merit or other salary
and benefit actions for UC employees are subject to notice,
meeting-and-conferring, and/or consulting requirements
under the Higher Education Employer-Employee Relations
Act (HEERA).
EMPLOYEE HEALTH AND WELFARE BENEFITS
As part of the total compensation package for faculty and
staff, the University offers competitive health and welfare
benefits. Depending upon appointment type, the University
may pay as much as 40% of an employee’s annual base
salary in employer benefit costs over and above salary.
While salary packages lag the market for both faculty and
staff, the total compensation package at the University
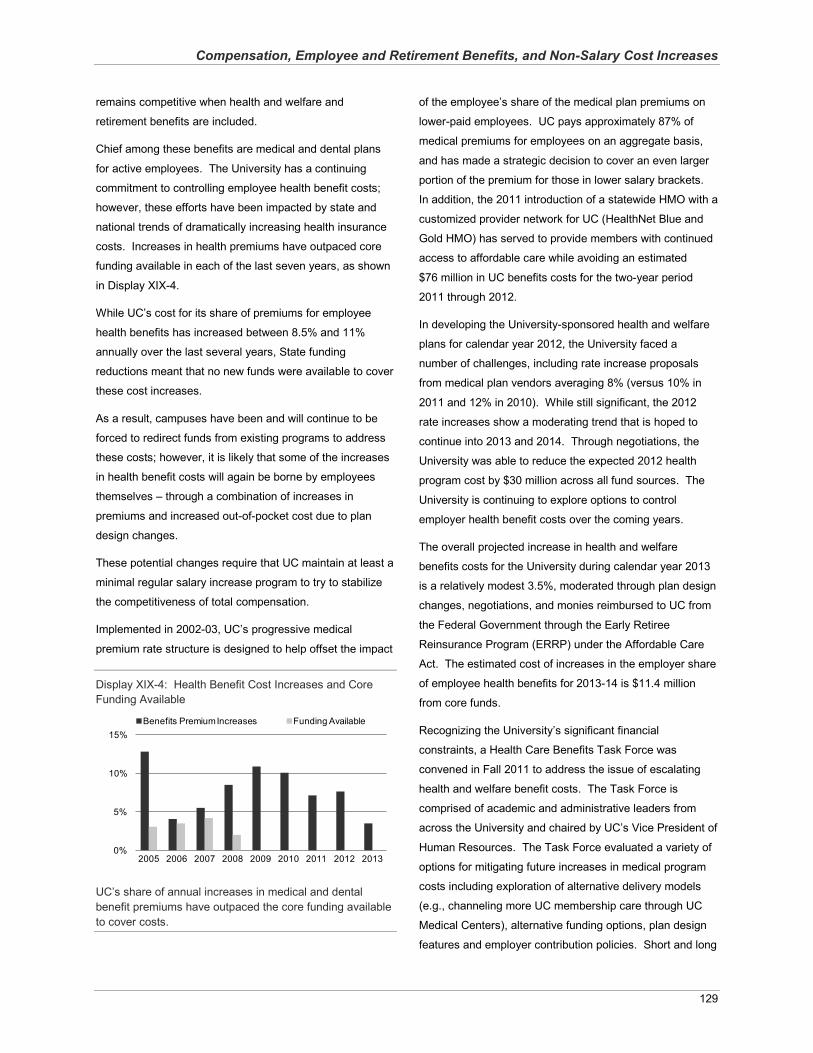
Compensation, Employee and Retirement Benefits, and Non-Salary Cost Increases
129
remains competitive when health and welfare and
retirement benefits are included.
Chief among these benefits are medical and dental plans
for active employees. The University has a continuing
commitment to controlling employee health benefit costs;
however, these efforts have been impacted by state and
national trends of dramatically increasing health insurance
costs. Increases in health premiums have outpaced core
funding available in each of the last seven years, as shown
in Display XIX-4.
While UC’s cost for its share of premiums for employee
health benefits has increased between 8.5% and 11%
annually over the last several years, State funding
reductions meant that no new funds were available to cover
these cost increases.
As a result, campuses have been and will continue to be
forced to redirect funds from existing programs to address
these costs; however, it is likely that some of the increases
in health benefit costs will again be borne by employees
themselves – through a combination of increases in
premiums and increased out-of-pocket cost due to plan
design changes.
These potential changes require that UC maintain at least a
minimal regular salary increase program to try to stabilize
the competitiveness of total compensation.
Implemented in 2002-03, UC’s progressive medical
premium rate structure is designed to help offset the impact
Display XIX-4: Health Benefit Cost Increases and Core Funding Available
UC’s share of annual increases in medical and dental benefit premiums have outpaced the core funding available to cover costs.
of the employee’s share of the medical plan premiums on
lower-paid employees. UC pays approximately 87% of
medical premiums for employees on an aggregate basis,
and has made a strategic decision to cover an even larger
portion of the premium for those in lower salary brackets.
In addition, the 2011 introduction of a statewide HMO with a
customized provider network for UC (HealthNet Blue and
Gold HMO) has served to provide members with continued
access to affordable care while avoiding an estimated
$76 million in UC benefits costs for the two-year period
2011 through 2012.
In developing the University-sponsored health and welfare
plans for calendar year 2012, the University faced a
number of challenges, including rate increase proposals
from medical plan vendors averaging 8% (versus 10% in
2011 and 12% in 2010). While still significant, the 2012
rate increases show a moderating trend that is hoped to
continue into 2013 and 2014. Through negotiations, the
University was able to reduce the expected 2012 health
program cost by $30 million across all fund sources. The
University is continuing to explore options to control
employer health benefit costs over the coming years.
The overall projected increase in health and welfare
benefits costs for the University during calendar year 2013
is a relatively modest 3.5%, moderated through plan design
changes, negotiations, and monies reimbursed to UC from
the Federal Government through the Early Retiree
Reinsurance Program (ERRP) under the Affordable Care
Act. The estimated cost of increases in the employer share
of employee health benefits for 2013-14 is $11.4 million
from core funds.
Recognizing the University’s significant financial
constraints, a Health Care Benefits Task Force was
convened in Fall 2011 to address the issue of escalating
health and welfare benefit costs. The Task Force is
comprised of academic and administrative leaders from
across the University and chaired by UC’s Vice President of
Human Resources. The Task Force evaluated a variety of
options for mitigating future increases in medical program
costs including exploration of alternative delivery models
(e.g., channeling more UC membership care through UC
Medical Centers), alternative funding options, plan design
features and employer contribution policies. Short and long
0%
5%
10%
15%
2005 2006 2007 2008 2009 2010 2011 2012 2013
Benefits Premium Increases Funding Available
Compensation, Employee and Retirement Benefits, and Non-Salary Cost Increases
130
term challenges exist in this arena and, given the
increasing importance of health and welfare benefits to
UC’s membership and UC’s unique position as both a
provider and purchaser of health care, the Task Force is
expected to have an ongoing role in exploring and
evaluating opportunities to manage future cost and the
health of UC’s membership.
The University, through its Human Resources Compliance
unit, launched a Family Member Eligibility Verification
review for health benefits coverage in March 2012. The
review was conducted to ensure that only those eligible for
coverage by University health benefits were, in fact,
enrolled in UC-funded plans. Ninety thousand staff, faculty,
and retirement plan participants, along with their 175,000
enrolled family members, were included in the process.
The annualized savings from this and ongoing efforts are
expected to be approximately $35 million. More regular
reviews of this nature will be conducted in the future and
will become part of the University’s initial benefits
enrollment process to help manage costs and continue to
strengthen the administration of these important, high value
programs.
While the University has historically had a very competitive
benefit package compared to those of other institutions, it is
anticipated that within the next few years there will be an
unavoidable decrease in the employer-provided value of
the overall benefit package due in part to increases
in employee-paid health premiums.
RETIREMENT BENEFITS
Pension Benefits
The University of California Retirement Plan (“UCRP” or
“the Plan”) is a governmental defined benefit plan that
provides pension benefits for more than 58,000 retirees and
survivors and has nearly 117,000 active employee
members as of July 1, 2012. UCRP promotes recruitment
of talented individuals and provides incentives for long
careers with UC. Because UCRP provides guaranteed
benefits, career faculty and staff gain income security over
the span of their retirement years. UCRP disbursed
$2.3 billion in retirement benefits during 2011-12.
Prior to November 1990, contributions to UCRP were
required from all employer fund sources and from
Display XIX-5: UCRP Historical and Projected Funded Status (Dollars in Billions)1
The surplus in the UC Retirement Plan has diminished over time and is estimated to have fallen to a level of 78% on an actuarial value of assets (AVA) basis by July 2012. Even with employer and member contributions to the UCRP beginning in April 2010, the AVA-funded status of the Plan will continue to decline as losses are incorporated from the past few years.1 Excludes retirees of Lawrence Berkeley National Laboratory
employees (members). In the early 1990s, the Regents
suspended University and member contributions to UCRP
after actuaries determined that UCRP was adequately
funded to provide benefits for many years into the future.
The University estimates that in the nearly 20 years during
which employer contributions were not required, the State
saved over $2 billion in contributions for those UCRP
members whose salaries were State-funded.
The total cessation of contributions, which was desirable at
the time for a variety of reasons, has created a serious
problem today. For almost 20 years, faculty and staff
continued to earn additional benefits as they accumulated
UCRP service credit, yet no funds were collected from the
various fund sources that were supporting member salaries
and invested in UCRP to offset the annual increase in
liabilities. Plan liabilities currently increase by $1.5 billion
(17.4% of covered payroll) annually as active members
earn an additional year of UCRP service credit.
Due to both increasing liability and recent turmoil in
financial markets, the actuarial-funded status of UCRP fell
from 156% in July 2000 to 78% in July 2012. The accrued
liability exceeds the actuarial value of assets by
$10.1 billion. However, this valuation does not include full
recognition of investment losses in recent years. If the
deferred losses were recognized immediately, the funded
0%
50%
100%
150%
$0
$25
$50
$75
2002 2004 2006 2008 2010 2012
Accrued Liability Value of Assets Funded Ratio
Compensation, Employee and Retirement Benefits, and Non-Salary Cost Increases
131
percentage would decrease to 76.5%. The extent to which
this unfunded liability grows depends on future investment
returns, as well as employer and member contributions to
UCRP and changes in plan provisions.
It has been clear since at least 2005 that resumption of
contributions is necessary to cover the cost of additional
service credit accrued each year. Unfortunately, in 2007,
the State was unwilling to restart contributions to UCRP
due to the Plan’s overfunded status at that time. The lack
of State funding to support retirement contributions delayed
the restart of contributions from other fund sources as well.
The 2009-10 Governor’s Budget acknowledged the need to
provide $96 million for its share of employer contributions
(covering employees funded from State funds and student
fees), representing a rate of 4% to begin on July 1, 2009,
rather than the proposed 9.5% employer rate. However,
the Governor’s budget proposal reduced this amount to
$20 million, and ultimately, no funding for this purpose was
included in the final budget act.
The University restarted employer and member
contributions in April 2010, with an employer contribution of
4% and contributions from most members of 2% for the
period from April 2010 through the 2010-11 fiscal year. The
State’s share was funded by redirecting resources from
existing programs and student tuition increases.
In September 2010, the Regents approved increases to
both employer and member contributions for 2011-12 and
2012-13. Employer contributions rose from 4% in 2010-11
to 7% for 2011-12 and to 10% for 2012-13. Member
contributions rose from approximately 2% in 2010-11 to
3.5% for 2011-12 and rose to 5% for 2012-13. Because the
combined contribution rate of 15% in 2012-13 remains
below the current normal cost of annually accrued benefits
(i.e., Normal Cost) as a percentage of salary (17.44%),
these contribution rates will slow, but not eliminate, the
growth in unfunded liability. At the November 2011
meeting, the Regents approved increases in employer and
existing member contribution rates to 12% and 6.5%,
respectively, effective July 1, 2013. New employees will
pay 7% beginning July 1, 2013, as described below.
In December 2010 and March 2011, the Regents gave the
President authority to transfer funds from the UC Short
Term Investment Pool (STIP) to UCRP to stop further
increases in the unfunded liability. Approximately
$1.1 billion was transferred to UCRP in April 2011. Another
$936 million was transferred to UCRP in July 2011, which
was garnered from external borrowing through the issuance
of a variable rate general corporate bond. Campus and
medical center payroll funds will be assessed a fee to cover
the principal and interest on the STIP note and bond debt.
These cash transfers to UCRP were authorized to prevent
Display XIX-6: Actual and Projected Employer and Employee UCRP Contribution Rates1
Display XIX-7: Actual and Projected Employer Contributions to UCRP by Fund Source (Dollars in Millions)
Employer contributions to UCRP restarted in April 2010. Contribution rates are projected to rise to at least 14% of employee compensation by 2014-15, at a cost of about$420 million to core-funded programs and $1.3 billion in total.
Member
UCRPSTIP Note/ Bond Debt2 UCRP
2010-11 Actual 4.00% 0.00% 2.00%
2011-12 Actual 7.00% 0.07% 3.50%
2012-13 Actual 10.00% 0.63% 5.00%
2013-14 Approved 12.00% 0.65% 6.50%3
2014-15 Projected 14.00% 1.00% Undetermined
1 Measured as a percentage of base pay. Member contribution amounts are pretax and less $19 per month. Member contributions are subject to collective bargaining agreements. Contributions began in April 2010 at the2010-11 rates.2 Payroll assessment to cover the principal and interest on the STIP note and bond debt used to stop further increases in the unfunded liability for UCRP.3 Member contributions for employees hired on or after July 1, 2013 w ill be 7% w ith no $19 per month offset.
Employer
$0
$500
$1,000
$1,500
2009-10 2010-11 2011-12 2012-13 2013-14 2014-15
Core Funds Other Sources
Compensation, Employee and Retirement Benefits, and Non-Salary Cost Increases
132
future employer contributions to UCRP from rising to
unsustainable levels. However, under the current plan,
employer contributions are expected to continue to rise by
2% annually through at least 2014-15.
In December 2010, the Regents took further action to make
changes to post-employment benefits, including retirement
plan benefits that will reduce long-term costs. Most
significantly, the Regents approved the establishment of a
new tier of pension benefits applicable to employees hired
or (in certain situations) rehired on or after July 1, 2013,
which would increase the early retirement age from 50 to
55 and the maximum age factor from 60 to 65, but
otherwise retain many of the features of the current plan. In
2013-14, UCRP members hired on or after July 1, 2013 will
be paying 7% of covered. UC is continuing to explore
further changes to retirement plan benefits to ensure that
benefits are market competitive and cost effective.
In September 2012, the Governor signed legislation to
reform the California Public Employees Retirement System
(CalPERS) for State employees hired after January 1,
2013. The new legislation limits the maximum
compensation used for benefit calculations, requires State
employees to pay 50% of their pension costs, and
increases the early retirement age from 50 to 52 and the
age at which the maximum age factor applies from 63 to
67. The pension reform also included measures (similar to
measures the University already has) to prevent abusive
practices such as “spiking,” when employees are given big
raises in their final year of employment as a way to inflate
their pensions.
General Accounting Standards Board (GASB) rules require
UC to report accrued unfunded pension liabilities on its
financial statements. For 2011-12, UC recorded an
unfunded pension liability accrual of $1.9 billion.
In 2012-13, the University is contributing $261.8 million
from core fund sources and $588.6 million from other
sources to UCRP. As employer contribution rates rise over
the next several years, UC contributions are expected to
rise to $339.1 million from core funds ($1.1 billion from all
funds) in 2013-14 and to $420.4 million from core funds
($1.3 billion from all funds) in 2014-15. The State’s share,
based on State- and student tuition and fee-funded
employees, is projected to rise to approximately
$296 million in 2013-14 and to $367 million by 2014-15. In
2012-13, the State provided an augmentation to the
University’s budget of $89.1 million intended as actual
support of the State’s share of the contribution to UCRP.
This was welcome acknowledgement of the State’s
responsibility for its share of these costs. However, this
amount is far short of the $228.6 million needed to fully
fund the State’s 2012-13 share of UCRP. The budget plan
for 2013-14 includes $77.2 million for the increase in these
costs for core-funded programs in 2013-14. Of this,
$67.5 million is the State’s share of UCRP employer
contributions and the remaining $9.7 million is related to
programs funded from UC General Funds.
Annuitant Health Benefits
As part of the benefit package, UC provides medical and
dental benefits for about 50,800 eligible retirees and their
dependents.1 Eligible individuals who retire from UC with a
monthly pension have health care coverage options similar
to those offered to active employees. On average, in 2013,
UC will pay 80% of retiree medical premiums.
Currently, the University does not pre-fund retiree health
benefits and pays its share of health benefits for annuitants
on a “pay-as-you-go” basis, whereby current plan premiums
and costs are paid from an assessment on payroll of
3.72%. During 2012-13, UC’s costs for annuitant health
benefits are estimated to exceed $261 million from all fund
sources.
Because future retiree health benefits costs are not pre-
funded and because health care costs have risen rapidly,
as of July 2012, UC has an unfunded liability for retiree
health of $14.5 billion. This amount represents the cost of
benefits accrued to date by current faculty, staff, and
retirees based on past service. In December 2010, in order
to reduce long-term costs and the unfunded liability for
retiree health, the Regents approved changes to retiree
health benefits. Changes included gradual reductions in
the University’s aggregate annual contribution to the
Retiree Health Program to a floor of 70% (subject to annual
review) and a new eligibility formula for all employees hired
on or after July 1, 2013, and for existing employees with
1 Excludes retirees of Lawrence Berkeley NationalLaboratory.
Compensation, Employee and Retirement Benefits, and Non-Salary Cost Increases
133
fewer than five years of service credit or whose age plus
UCRP service credit is less than 50 as of June 30, 2013.
GASB rules require the University to report in its financial
statements all post-employment benefits expense, including
retiree medical and dental costs, on an accrual basis over
the employees’ years of service, along with the related
liability, net of any plan assets. The accrual may be
amortized over a number of years, and for 2011-12, the
University’s financial statements recorded a total liability of
$6.4 billion.
The University’s budget plan for 2013-14 includes
$6.4 million for increases in retiree health program costs
consistent with the funding provided for the State’s
annuitants.
NON-SALARY PRICE INCREASES
Prices of equipment, supplies, utilities, and other non-salary
items purchased by the University are also rising. Non-
salary items include instructional equipment and supplies
such as chemicals, computers, machinery, library materials,
and purchased utilities. Increases in non-salary costs
without corresponding increases in budgeted funds oblige
campuses to find alternative fund sources or efficiencies to
cover these costs.
Historically, funding for price increases on non-salary
portions of the budget are included as part of the
University’s annual base budget adjustment; however, the
continuing State fiscal crisis means funding for price
increases have not been provided in recent years. The
Consumer Price Index (CPI) showed a decrease of nearly
2% in 2008-09, but between 2009 and 2011 the CPI rose
slowly, increasing to 2.7% in 2010-11. More recently,
inflation has moderated, declining to about 1.7% in
2011-12. Costs of goods and services purchased by
educational institutions, as measured by the Higher
Education Price Index (HEPI), typically rise faster than the
CPI, though HEPI has tracked more closely to the CPI in
recent years. For reasons discussed in the Operation and
Maintenance of Plant chapter of this document, inflationary
pressures are expected to be greater for UC’s energy costs
than other non-salary items. In 2013-14, UC’s electricity
costs are expected to increase 4% above inflation and
natural gas costs 1% above inflation. The budget plan
includes $23.7 million for non-salary price increases,
consisting of a 2% general non-salary price increase, as
well as $8 million to cover projected higher energy costs.
Longer term forecasts identify a number of factors that are
expected to drive a resurgence of higher energy costs in
the next few years.
“UC’s partnership with the U.S. Department of Energy affords opportunities for research unmatched elsewhere. UC and the national labs are leaders in scientific and technological innovation that benefit not only the nation, but the world.”
Glenn Mara University of California
Vice President of Laboratory Management
134
Department of Energy Laboratory ManagementFor more than 60 years, the University has played a major
public service role as a manager of three Department of
Energy (DOE) National Laboratories. UC’s partnership with
DOE has provided extensive research opportunities for
faculty, and in consideration for the University’s
management service, UC generates revenue to support
operations and the research enterprise.
Lawrence Berkeley National Laboratory (LBNL). The
University was awarded a new management and operating
contract for LBNL on April 19, 2005. This contract, which
has an initial five-year term, has been extended through
2017 following favorable DOE evaluations. The contract
may be extended further through an award term provision
that adds contract years based on excellent performance
for additional years, not to exceed 20 years in total.
Los Alamos National Security and Lawrence Livermore National Security Limited Liability Companies. The
University’s original contracts for the Los Alamos National
Laboratory (LANL) and the Lawrence Livermore National
Laboratory (LLNL) expired on May 31, 2006 and
September 30, 2007, respectively. Both laboratories are
now managed by limited liability companies (LLCs) partially
owned by the University. The Los Alamos National
Security LLC (LANS) was awarded a new management and
operating contract for LANL on December 21, 2005 and
commenced full operations on June 1, 2006. The
Lawrence Livermore National Security LLC (LLNS) was
awarded a new management and operating contract for
LLNL on May 8, 2007, and commenced full operations on
October 1, 2007. Both contracts have initial seven-year
terms and may be extended further based on performance
through an award term provision for additional years, not to
exceed 20 years in total. As a result of 2011 performance,
the LANS contract was extended to eleven years and the
LLNS contract was extended to ten years after DOE
evaluations.
REVENUE STREAMS
Indirect Cost Reimbursement
Under its contract for LBNL and its earlier contracts for
LANL and LLNL, the University received indirect cost
reimbursement from DOE. During the early 2000s, this
funding amounted to more than $10 million annually. In
accordance with a Memorandum of Understanding between
the University and the State Department of Finance, this
indirect cost reimbursement contributes to UC General
Fund income and helps to support the University’s
operating budget, in particular its research programs.
Since the University no longer directly manages LANL and
LLNL, the University no longer receives indirect cost
reimbursement related to LANL and LLNL.
Furthermore, beginning in October 2009, DOE requested a
change from indirect cost reimbursement for corporate
services rendered to LBNL by UC. Negotiations with DOE
are underway on a proposal to increase the maximum
award fee to include an amount that will be directed
annually to UCOP for corporate services.
DOE Management Fee
Performance management fees from LBNL are gross
earned amounts before the University’s payments of
unreimbursed costs. During 2011-12, LBNL is eligible to
earn a maximum of $4.5 million in management fee
revenue related to LBNL, which will be used for costs of
LBNL research programs, reserves for future claims, and
unallowable costs associated with LBNL. As noted above,
a proposal to increase the maximum award fee is under
consideration by DOE.
Department of Energy Laboratory Management
135
LLC Income
Net income to UC from LANS and LLNS reflects UC’s net
share of fee income remaining after payment of
unreimbursed costs incurred by the LLCs at the two
laboratories and shares to other LLC owners. UC’s LLC
income is estimated to be $26.9 million for 2012, and the
Regents also allocated accumulated funds for research
from prior years in the amount of $10.9 million. At their July
2012 meeting, the Regents approved an expenditure plan
for the total of $37.8 million, as shown in Display XX-1.
UC’s projected fee income share from LANS and LLNS for
2012 became available the first quarter of calendar year
2012. Because the accepted LLC proposals provided for a
smaller fee opportunity after the first three years of each
contract, the amount of net fee income may decrease in
future years unless laboratory budgets increase.
Display XX-1: 2012-13 Expenditure Plan for Income from LANS and LLNS (Dollars in Millions)
Research Funds from LLC revenues 2012 $18.28Research Funds from prior years $10.90UCOP Oversight $5.12Supplemental Compensation $1.50Contingencies (post-contract, other) $2.00Total $37.80
“Access, quality, and affordability are the pillars of UC’s excellence. In good times and bad, UC’s commitment to each is unwavering, but the University cannot go it alone – we need the State to recommit to its historic partnership with UC to provide the best public higher education in the world.”
Mark G. Yudof University of California
President
136
Historical PerspectiveHistorically, the University’s State-funded budget has
reflected the cyclical nature of the State’s economy. During
times of recession, the State’s revenues have declined and
appropriations to the University either held constant or were
reduced. When the State’s economy has been strong, there
have been efforts to catch up. The last four decades have
all begun with significant economic downturns followed by
sustained periods of moderate, and sometimes
extraordinary, economic growth. This chapter details the
history of State funding of the University1.
1967-1990: TWO CYCLES OF CRISIS
The University experienced budget reductions of about
20% in real dollars during the late 1960s and early 1970s.
Faculty positions and research funding were cut, and the
student-faculty ratio deteriorated by about 20%.
In the late 1970s and early 1980s, the University again
experienced a series of budget cuts. By the early 1980s,
faculty salaries lagged far behind those at the University’s
comparison institutions and top faculty were being lost
to other institutions; buildings needed repair; classrooms,
laboratories, and clinics were poorly equipped; libraries
suffered; and the building program virtually came to a halt.
The situation improved significantly in the mid-1980s when
a period of rebuilding was initiated. Faculty and staff
salaries returned to competitive levels, funds became
available for basic needs such as instructional equipment
replacement and building maintenance, and research
efforts were expanded. The capital budget also improved
dramatically. There was significant growth in private giving,
and the University once again became highly competitive
for federal research funds. By the late 1980s, however, the
situation began to change. Fiscal problems at the State
level led to a growing erosion of gains made during the mid-
1 Information about State funding is also available in the Sources of University Funds chapter.
1980s. By 1989-90, UC was struggling with the early
stages of a fiscal problem that subsequently turned into a
major crisis.
1990-91 THROUGH 1994-95: BUDGET CRISIS
The University experienced dramatic shortfalls in State
funding during the first four years of the 1990s. Although
State funding increased in 1990-91, it was below the level
needed to maintain the base budget and fund a normal
workload budget. Over the next three years, State funding
for UC dropped by $341 million. At the same time, the
University had to cope with inflation, fixed cost increases,
and workload growth. Consequently, the University made
budget cuts totaling $433 million, equivalent to roughly 20%
of its State General Fund budget in 1989-90, as depicted
in Display XXI-1. (By way of comparison to the current
fiscal crisis, the proportion by which the UC’s budget was
reduced over a four-year period in the 1990s is equivalent
to the one-year proportional reduction in 2009-10).
Display XXI-1: Permanent Cuts to UC Budgets, 1990-91through 1994-95 (Dollars in Millions)
1990-91 5% cut in research, public service, and administration.
$25
1991-92 Workforce reduction in both instructional and non-instructional programs, cut in non-salary budgets, undesignated cut.
$120
1992-93 Permanent cut of $200 million phased in over two years.
$200
1993-94 Reduction in campus and Office of the President budgets, resulting in further workforce reductions.
$35
1994-95 Reductions in campus and Office of the President budgets in order to fund restoration of salary funds cut temporarily in 1993-94.
$53
Total $433
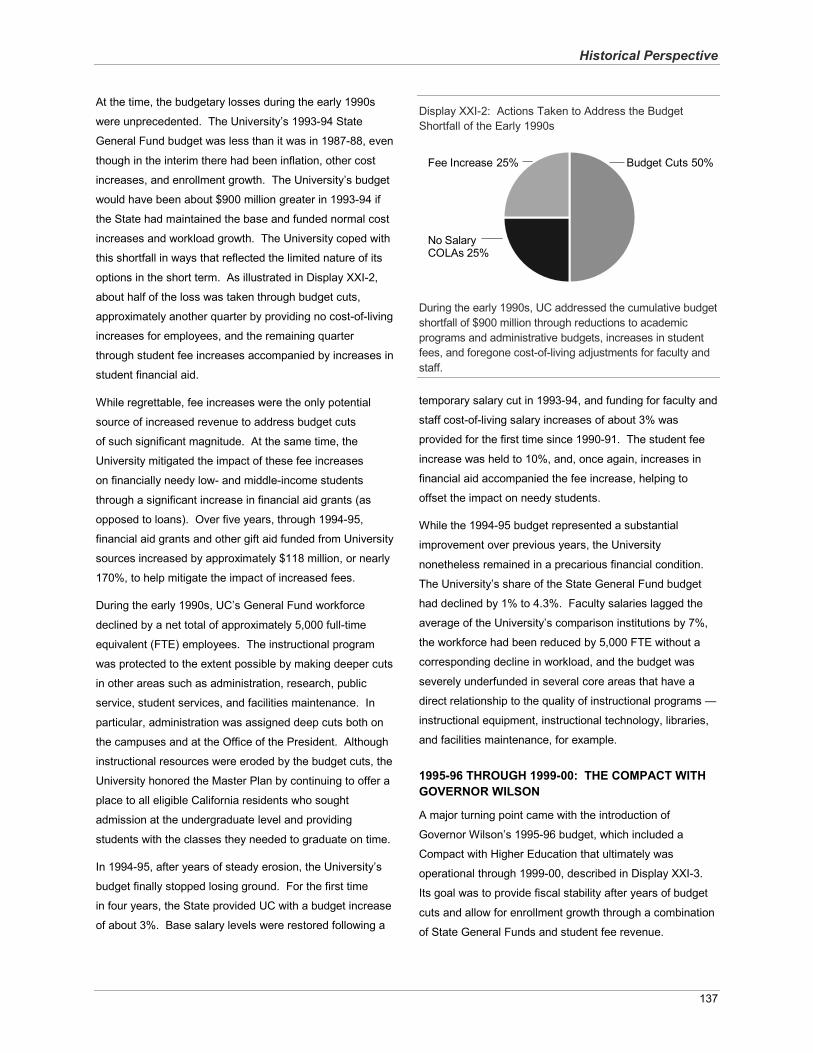
Historical Perspective
137
At the time, the budgetary losses during the early 1990s
were unprecedented. The University’s 1993-94 State
General Fund budget was less than it was in 1987-88, even
though in the interim there had been inflation, other cost
increases, and enrollment growth. The University’s budget
would have been about $900 million greater in 1993-94 if
the State had maintained the base and funded normal cost
increases and workload growth. The University coped with
this shortfall in ways that reflected the limited nature of its
options in the short term. As illustrated in Display XXI-2,
about half of the loss was taken through budget cuts,
approximately another quarter by providing no cost-of-living
increases for employees, and the remaining quarter
through student fee increases accompanied by increases in
student financial aid.
While regrettable, fee increases were the only potential
source of increased revenue to address budget cuts
of such significant magnitude. At the same time, the
University mitigated the impact of these fee increases
on financially needy low- and middle-income students
through a significant increase in financial aid grants (as
opposed to loans). Over five years, through 1994-95,
financial aid grants and other gift aid funded from University
sources increased by approximately $118 million, or nearly
170%, to help mitigate the impact of increased fees.
During the early 1990s, UC’s General Fund workforce
declined by a net total of approximately 5,000 full-time
equivalent (FTE) employees. The instructional program
was protected to the extent possible by making deeper cuts
in other areas such as administration, research, public
service, student services, and facilities maintenance. In
particular, administration was assigned deep cuts both on
the campuses and at the Office of the President. Although
instructional resources were eroded by the budget cuts, the
University honored the Master Plan by continuing to offer a
place to all eligible California residents who sought
admission at the undergraduate level and providing
students with the classes they needed to graduate on time.
In 1994-95, after years of steady erosion, the University’s
budget finally stopped losing ground. For the first time
in four years, the State provided UC with a budget increase
of about 3%. Base salary levels were restored following a
Display XXI-2: Actions Taken to Address the Budget Shortfall of the Early 1990s
During the early 1990s, UC addressed the cumulative budget shortfall of $900 million through reductions to academic programs and administrative budgets, increases in student fees, and foregone cost-of-living adjustments for faculty and staff.
temporary salary cut in 1993-94, and funding for faculty and
staff cost-of-living salary increases of about 3% was
provided for the first time since 1990-91. The student fee
increase was held to 10%, and, once again, increases in
financial aid accompanied the fee increase, helping to
offset the impact on needy students.
While the 1994-95 budget represented a substantial
improvement over previous years, the University
nonetheless remained in a precarious financial condition.
The University’s share of the State General Fund budget
had declined by 1% to 4.3%. Faculty salaries lagged the
average of the University’s comparison institutions by 7%,
the workforce had been reduced by 5,000 FTE without a
corresponding decline in workload, and the budget was
severely underfunded in several core areas that have a
direct relationship to the quality of instructional programs —
instructional equipment, instructional technology, libraries,
and facilities maintenance, for example.
1995-96 THROUGH 1999-00: THE COMPACT WITH GOVERNOR WILSON
A major turning point came with the introduction of
Governor Wilson’s 1995-96 budget, which included a
Compact with Higher Education that ultimately was
operational through 1999-00, described in Display XXI-3.
Its goal was to provide fiscal stability after years of budget
cuts and allow for enrollment growth through a combination
of State General Funds and student fee revenue.
Budget Cuts 50%Fee Increase 25%
No Salary COLAs 25%
Historical Perspective
138
Display XXI-3: Provisions of the Compact with Governor Wilson, 1995-96 through 1999-00
State funding increases averaging 4% per yearStudent fee increases averaging about 10% annually
Further fee increases in selected professional schools
At least 33% of new student fee revenue dedicated to financial aid
Added financial aid through State Cal Grant Program
Additional funding and deferred maintenance$10 million budget reduction each year for four years
$150 million a year for capital budget
Priority for life-safety and seismic projects, infrastructure, and educational technology
The funding provided under the Compact was to be
sufficient to prevent a further loss of financial ground as the
University entered a period of moderate enrollment growth
of about 1% per year. The Compact was not intended to
provide restoration of funding that had been cut during the
early 1990s, but it did provide UC with much-needed fiscal
stability after years of cuts as well as a framework to begin
planning for the future.
The Compact of 1995-2000 was remarkably successful,
allowing the University to maintain the quality, accessibility,
and affordability that have been the hallmarks of
California’s system of public higher education. The
University enrolled more students than the Compact
anticipated, particularly at the undergraduate level, and the
State provided funding to support them. Faculty salaries
were restored to competitive levels, allowing the University
to once again recruit the nation’s best faculty. Declining
budgets were stabilized and further deterioration of the
University’s budget was halted.
In fact, the Legislature and the Governor not only honored
the funding principles of the Compact, but also provided
funding above the levels envisioned in the Compact. This
additional funding allowed buyouts of student fee increases,
even allowing for reductions in student fees for California
resident students, helped restore UC faculty salaries to
competitive levels more quickly, provided $35 million for a
number of high priority research efforts, and increased
funding for K-14 and graduate outreach by $38.5 million to
expand existing programs and develop new ones.
In all, the State provided nearly $170 million in funding
above the level envisioned in the Compact. In addition,
general obligation bonds and/or lease revenue bonds were
provided each year for high priority capital projects.
2000-01: A NEW PARTNERSHIP AGREEMENT WITH GOVERNOR DAVIS
Governor Davis entered office in January 1999 with a
commitment to improve California public education at all
levels. For UC, his commitment manifested itself in a new
Partnership Agreement, described in Display XXI-4, a
comprehensive statement of the minimum resources
needed for the University to maintain quality and
accommodate enrollment growth projected throughout the
decade. The Agreement was accompanied by the
expectation that the University would manage these
resources in such a way as to maintain quality, improve
relationships with K-12 schools, and increase community
college transfer, among other goals.
The significant infusion of State funding over this period
was welcome support for the University. Faculty salaries
had once again reached competitive levels, the University
was beginning to address salary lags for staff employees,
enrollment growth was fully funded, progress was being
made to reduce shortfalls in funding for core areas of the
budget, student fees were kept low, and support was
provided for a variety of research and public service
initiatives of importance to the State and the University.
2001-02 THROUGH 2004-05: ANOTHER STATE FISCAL CRISIS
Unfortunately, by 2001-02, the State’s fiscal situation began
to deteriorate. The University based its budget request on
the Partnership Agreement and included information about
other high priorities for the University and the State to be
funded when the State’s economic situation improved.
While the Governor’s Budget, released in January 2001,
proposed full funding for the University’s budget request as
well as additional funds for initiatives beyond the
Partnership Agreement, by the time the May Revise was
issued, the State’s financial situation had weakened to the
point of requiring reductions to funding levels the Governor
had originally proposed, and the State was fully engaged in
a major fiscal crisis that was to last four years.
Historical Perspective
139
Display XXI-4: Provisions of the Partnership Agreement with Governor Davis
4% increase to the base budget each year to provide adequate funding for salaries and other cost increases
Marginal cost funding for enrollment growth
Further 1% annual increase to the base budget to address chronic underfunding of State support for core areas of the budget
Acknowledgement of the need to either increase fees or provide equivalent revenue
Commitment to provide State support for summer instructionState bond funding of $210 million annually
Display XXI-5: State Funding Changes under thePartnership Agreement, 2000-01 (Dollars in Thousands)
For the first year of the Partnership, the University’sbasic budget request was fully funded consistent with the funding principles of the Partnership. The State was also provided additional funding in several areas.Partnership Funding
Annuitant Health and Dental Benefits $1,753Base Budget Increase $104,437Core Academic Support $26,109Enrollment Growth $51,234
Other InitiativesK-12 Internet Connectivity $32,000UC Internet Connectivity (One-Time) $18,000California Subject Matter Project $40,000MIND Institute (One-Time) $28,000Professional Development Programs $31,000Teaching Hospitals (One-Time) $25,000Academic Support $20,000Buyout of 4.5% Student Fee Increase $19,300Additional 1.5% for Low-Paid Workers $19,000Research Programs $35,000Other Academic and Outreach Initiatives $6,109Summer Session Fee Buy-down $13,800Charles R. Drew Medical Program $7,850UC Merced Base Budget Funding $9,900Geriatrics Endowed Chairs (One-Time) $6,000English Learners Teacher’s Institute $5,000Expand AP Program Development $4,000Outreach $2,000Algebra and Pre-Algebra Academies $1,700Summer School for Math and Science $1,000Governor’s Education Programs $1,000New Teacher Center at UCSC $600Reapportionment Data Base $100
Total State Funding = $3.192 billion
Display XXI-6: State Funding Changes under thePartnership Agreement, 2001-02 (Dollars in Thousands)
Partnership FundingBase Increase (4%) $59,853Enrollment Growth $65,022Annuitant Health and Dental Benefits $829
ReductionsIncreased Natural Gas Costs $50,620California Subject Matter Project ($250)Professional Development Institutes ($11,000)Undesignated Reduction ($5,000)K-12 Internet ($4,850)Outreach Redirection ($3,250)Labor Studies ($500)Substance Abuse Research ($310)
Other InitiativesBuyout of 4.9% Student Fee Increase $21,542Year-round Instruction $20,654MESA and Puente $1,500Clinical Teaching Support Hospitals $5,000Spinal Cord Injury Research $1,000Aging Study $250CPEC Eligibility Study $28UC Merced (one-time) $2,000
Total State Funding = $3.323 billion
The final 2001-02 budget was the first budget in seven
years that did not provide full funding of the Partnership
Agreement or the Compact (see Display XXI-6).
Partnership funds totaling $90 million were eliminated from
the University’s proposed budget, thereby significantly
reducing the funding available for compensation and other
fixed costs and eliminating the additional 1% ($30 million)
originally proposed for core needs.
The budget did, however, provide an increase
of $131 million, including partial funding of the Partnership
as well as funding above the Partnership for initiatives
representing high priorities for the Governor and the
Legislature. Several initiatives also were funded above the
level called for under the Partnership, totaling $75 million in
one-time and $3 million in permanent funds.
Funds for strengthening the quality of undergraduate
education were not provided, however, and UC funding
available for debt financing for deferred maintenance
projects was reduced from $6 million to $4 million to help
Historical Perspective
140
fund compensation increases. UC’s State General Fund
budget for 2001-02 totaled $3.3 billion.
By the time development of the 2002-03 budget began, the
State’s fiscal situation had deteriorated markedly,
necessitating the unusual action on the part of the
Governor and the Legislature to adopt mid-year budget
reductions for UC totaling $45.8 million for the 2001-02
budget. The State’s budget deficit for 2002-03 eventually
grew to $23.5 billion.
The final budget act for the 2002-03 budget, described in
Display XXI-7, provided funding to the University for a 1.5%
increase to the basic budget — instead of the 4% called for
in the Partnership Agreement — to fund compensation,
health and welfare benefits, and other increases. Increases
to UC’s State General Fund budget totaled $149 million.
While the increases to the budget were welcome, the
budget also included base budget reductions totaling
$322 million. State General Funds provided to the
University in the 2002-03 Budget Act totaled $3 billion.
Display XXI-7: State Funding Changes under thePartnership Agreement, 2002-03 (Dollars In Thousands)
Partnership FundingAnnuitant Health and Dental Benefits $16,824Enrollment Growth $69,201
ReductionsBase Increase (4% reduced to 1.5%) $47,590Base Reduction Offset by Fee Increases ($19,000)Core Needs (one-time reduction) ($29,000)Professional Development Institute ($50,866)Research ($48,482)Academic and Institutional Support ($20,000)Student Financial Aid ($17,000)Outreach ($14,396)Student Services ($6,336)K-12 Internet Connectivity ($6,250)AP Online – Revert Savings (one-time) ($4,000)Public Service Programs ($2,289)California Subject Matter Project ($503)
Other InitiativesYear-round Instruction $8,443Dual Admissions Program $2,500CA Institutes for Science and Innovation $4,750CPEC Eligibility Study $7UC Merced (one-time) $4,000
Total State Funding = $3.15 billion
Mid-year cuts instituted in December 2002 (though not
formally approved by the Legislature until March 2003)
included $70.9 million in further base budget cuts for UC.
In addition to cuts targeted at specific programs, $19 million
was designated as an unallocated reduction, which the
University offset by instituting an increase in mandatory
systemwide student fees.
By the time the mid-year budget cuts were approved for
2002-03, the State was facing a deficit for 2003-04 that was
unprecedented in magnitude. With the release of the May
Revision, the Governor estimated the deficit to total
$38.2 billion. For the University, cuts proposed by the
Governor in January totaling $373.3 million and affecting
nearly every area of the budget were all approved in the
final budget act, including $179 million in cuts offset
by increases in student fees that otherwise would have
been targeted at instructional programs. The Regents
again adopted an increase in mandatory systemwide
student fees to offset this reduction in 2003-04.
The University took $34.8 million of the total cut that had
been targeted at increasing the University’s student-faculty
ratio as an unallocated reduction instead. In addition to
cuts proposed by the Governor, the Legislature proposed
$98.5 million in unallocated cuts that ultimately were
included in the final budget. Of the total, $80.5 million was
designated as one-time and $18 million was designated as
permanent.
The final budget did include some funding increases (see
Display XXI-8), but most of the Partnership was not funded
and the $29 million reduction in 2002-03 to core areas of
the budget that had previously been specified as a one-time
cut was not restored. The 2003-04 State General Fund
budget approved in the budget act for the University was
$2.87 billion, $282 million less than the State General Fund
budget for 2002-03 adopted in September 2002.
A final round of mid-year reductions occurred in December
2003, totaling $29.7 million. While these mid-year
reductions originally were intended by the Governor to be
permanent reductions, the budget agreement for 2004-05
restored funding for some programs. Consequently, the
mid-year reductions were taken on a temporary basis in
2003-04 and only the $15 million associated with the
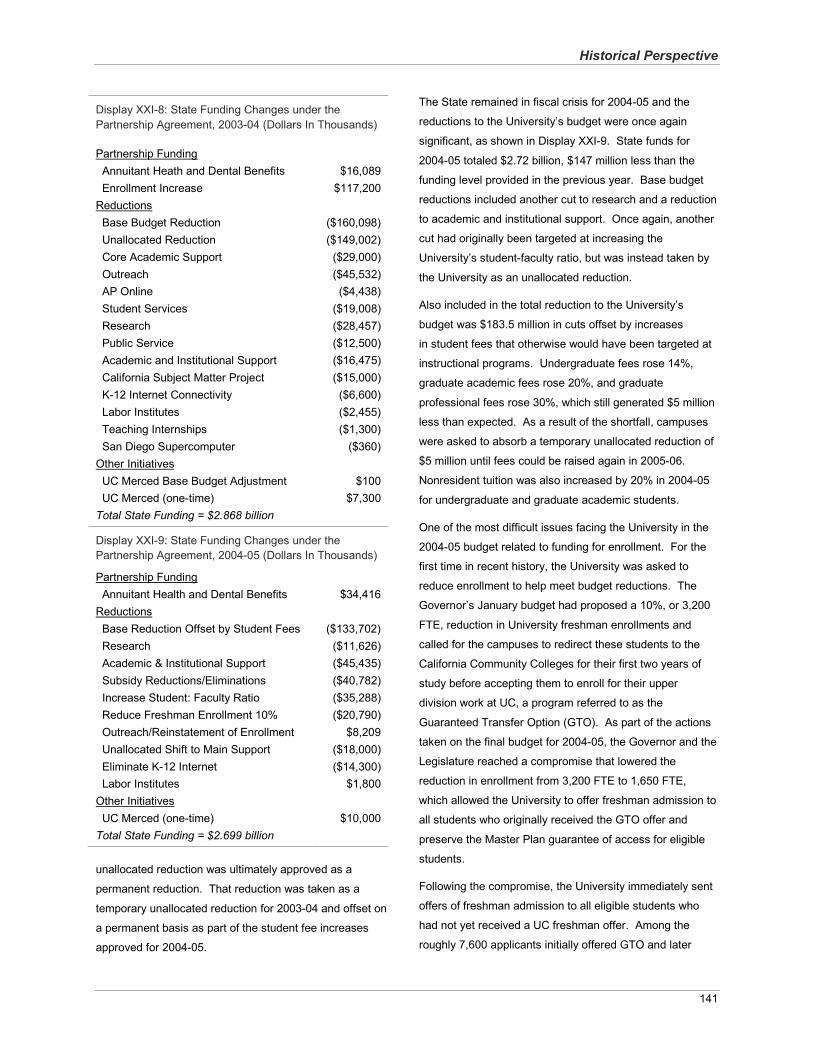
Historical Perspective
141
Display XXI-8: State Funding Changes under thePartnership Agreement, 2003-04 (Dollars In Thousands)
Partnership FundingAnnuitant Heath and Dental Benefits $16,089Enrollment Increase $117,200
ReductionsBase Budget Reduction ($160,098)Unallocated Reduction ($149,002)Core Academic Support ($29,000)Outreach ($45,532)AP Online ($4,438)Student Services ($19,008)Research ($28,457)Public Service ($12,500)Academic and Institutional Support ($16,475)California Subject Matter Project ($15,000)K-12 Internet Connectivity ($6,600)Labor Institutes ($2,455)Teaching Internships ($1,300)San Diego Supercomputer ($360)
Other InitiativesUC Merced Base Budget Adjustment $100UC Merced (one-time) $7,300
Total State Funding = $2.868 billion
Display XXI-9: State Funding Changes under thePartnership Agreement, 2004-05 (Dollars In Thousands)
Partnership FundingAnnuitant Health and Dental Benefits $34,416
ReductionsBase Reduction Offset by Student Fees ($133,702)Research ($11,626)Academic & Institutional Support ($45,435)Subsidy Reductions/Eliminations ($40,782)Increase Student: Faculty Ratio ($35,288)Reduce Freshman Enrollment 10% ($20,790)Outreach/Reinstatement of Enrollment $8,209Unallocated Shift to Main Support ($18,000)Eliminate K-12 Internet ($14,300)Labor Institutes $1,800
Other InitiativesUC Merced (one-time) $10,000
Total State Funding = $2.699 billion
unallocated reduction was ultimately approved as a
permanent reduction. That reduction was taken as a
temporary unallocated reduction for 2003-04 and offset on
a permanent basis as part of the student fee increases
approved for 2004-05.
The State remained in fiscal crisis for 2004-05 and the
reductions to the University’s budget were once again
significant, as shown in Display XXI-9. State funds for
2004-05 totaled $2.72 billion, $147 million less than the
funding level provided in the previous year. Base budget
reductions included another cut to research and a reduction
to academic and institutional support. Once again, another
cut had originally been targeted at increasing the
University’s student-faculty ratio, but was instead taken by
the University as an unallocated reduction.
Also included in the total reduction to the University’s
budget was $183.5 million in cuts offset by increases
in student fees that otherwise would have been targeted at
instructional programs. Undergraduate fees rose 14%,
graduate academic fees rose 20%, and graduate
professional fees rose 30%, which still generated $5 million
less than expected. As a result of the shortfall, campuses
were asked to absorb a temporary unallocated reduction of
$5 million until fees could be raised again in 2005-06.
Nonresident tuition was also increased by 20% in 2004-05
for undergraduate and graduate academic students.
One of the most difficult issues facing the University in the
2004-05 budget related to funding for enrollment. For the
first time in recent history, the University was asked to
reduce enrollment to help meet budget reductions. The
Governor’s January budget had proposed a 10%, or 3,200
FTE, reduction in University freshman enrollments and
called for the campuses to redirect these students to the
California Community Colleges for their first two years of
study before accepting them to enroll for their upper
division work at UC, a program referred to as the
Guaranteed Transfer Option (GTO). As part of the actions
taken on the final budget for 2004-05, the Governor and the
Legislature reached a compromise that lowered the
reduction in enrollment from 3,200 FTE to 1,650 FTE,
which allowed the University to offer freshman admission to
all students who originally received the GTO offer and
preserve the Master Plan guarantee of access for eligible
students.
Following the compromise, the University immediately sent
offers of freshman admission to all eligible students who
had not yet received a UC freshman offer. Among the
roughly 7,600 applicants initially offered GTO and later
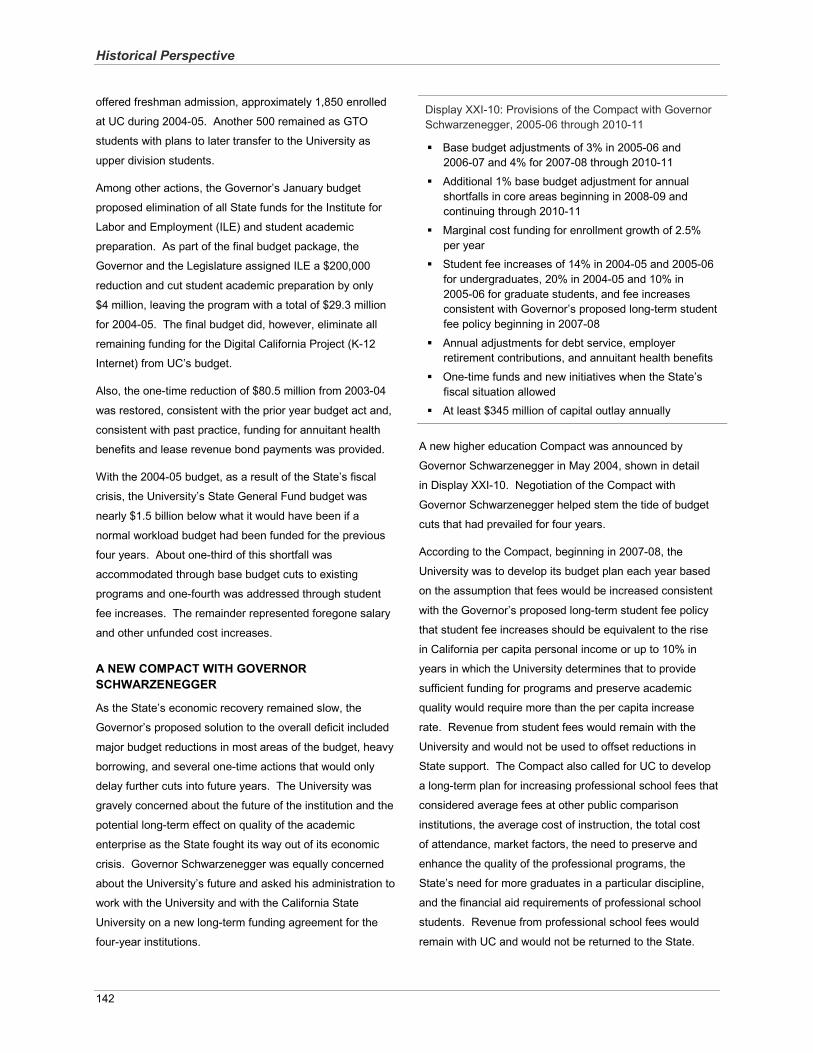
Historical Perspective
142
offered freshman admission, approximately 1,850 enrolled
at UC during 2004-05. Another 500 remained as GTO
students with plans to later transfer to the University as
upper division students.
Among other actions, the Governor’s January budget
proposed elimination of all State funds for the Institute for
Labor and Employment (ILE) and student academic
preparation. As part of the final budget package, the
Governor and the Legislature assigned ILE a $200,000
reduction and cut student academic preparation by only
$4 million, leaving the program with a total of $29.3 million
for 2004-05. The final budget did, however, eliminate all
remaining funding for the Digital California Project (K-12
Internet) from UC’s budget.
Also, the one-time reduction of $80.5 million from 2003-04
was restored, consistent with the prior year budget act and,
consistent with past practice, funding for annuitant health
benefits and lease revenue bond payments was provided.
With the 2004-05 budget, as a result of the State’s fiscal
crisis, the University’s State General Fund budget was
nearly $1.5 billion below what it would have been if a
normal workload budget had been funded for the previous
four years. About one-third of this shortfall was
accommodated through base budget cuts to existing
programs and one-fourth was addressed through student
fee increases. The remainder represented foregone salary
and other unfunded cost increases.
A NEW COMPACT WITH GOVERNOR SCHWARZENEGGER
As the State’s economic recovery remained slow, the
Governor’s proposed solution to the overall deficit included
major budget reductions in most areas of the budget, heavy
borrowing, and several one-time actions that would only
delay further cuts into future years. The University was
gravely concerned about the future of the institution and the
potential long-term effect on quality of the academic
enterprise as the State fought its way out of its economic
crisis. Governor Schwarzenegger was equally concerned
about the University’s future and asked his administration to
work with the University and with the California State
University on a new long-term funding agreement for the
four-year institutions.
Display XXI-10: Provisions of the Compact with Governor Schwarzenegger, 2005-06 through 2010-11
Base budget adjustments of 3% in 2005-06 and 2006-07 and 4% for 2007-08 through 2010-11
Additional 1% base budget adjustment for annual shortfalls in core areas beginning in 2008-09 and continuing through 2010-11
Marginal cost funding for enrollment growth of 2.5% per yearStudent fee increases of 14% in 2004-05 and 2005-06 for undergraduates, 20% in 2004-05 and 10% in 2005-06 for graduate students, and fee increases consistent with Governor’s proposed long-term student fee policy beginning in 2007-08
Annual adjustments for debt service, employer retirement contributions, and annuitant health benefits
One-time funds and new initiatives when the State’sfiscal situation allowedAt least $345 million of capital outlay annually
A new higher education Compact was announced by
Governor Schwarzenegger in May 2004, shown in detail
in Display XXI-10. Negotiation of the Compact with
Governor Schwarzenegger helped stem the tide of budget
cuts that had prevailed for four years.
According to the Compact, beginning in 2007-08, the
University was to develop its budget plan each year based
on the assumption that fees would be increased consistent
with the Governor’s proposed long-term student fee policy
that student fee increases should be equivalent to the rise
in California per capita personal income or up to 10% in
years in which the University determines that to provide
sufficient funding for programs and preserve academic
quality would require more than the per capita increase
rate. Revenue from student fees would remain with the
University and would not be used to offset reductions in
State support. The Compact also called for UC to develop
a long-term plan for increasing professional school fees that
considered average fees at other public comparison
institutions, the average cost of instruction, the total cost
of attendance, market factors, the need to preserve and
enhance the quality of the professional programs, the
State’s need for more graduates in a particular discipline,
and the financial aid requirements of professional school
students. Revenue from professional school fees would
remain with UC and would not be returned to the State.
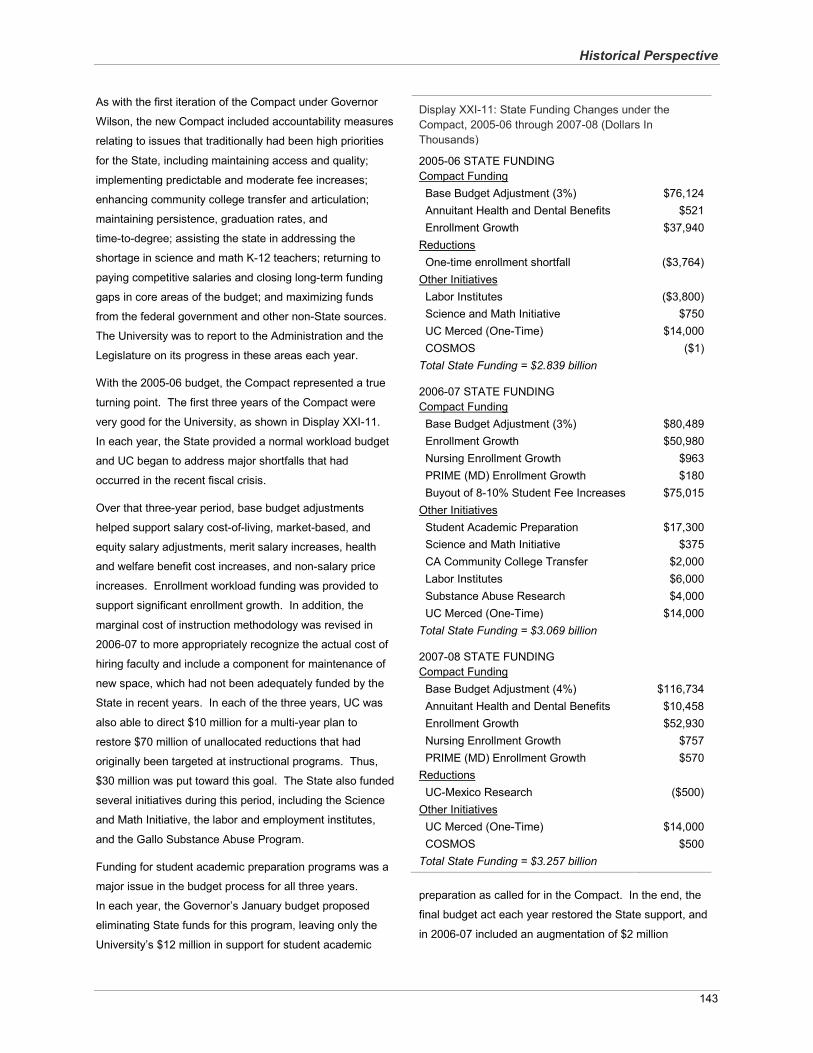
Historical Perspective
143
As with the first iteration of the Compact under Governor
Wilson, the new Compact included accountability measures
relating to issues that traditionally had been high priorities
for the State, including maintaining access and quality;
implementing predictable and moderate fee increases;
enhancing community college transfer and articulation;
maintaining persistence, graduation rates, and
time-to-degree; assisting the state in addressing the
shortage in science and math K-12 teachers; returning to
paying competitive salaries and closing long-term funding
gaps in core areas of the budget; and maximizing funds
from the federal government and other non-State sources.
The University was to report to the Administration and the
Legislature on its progress in these areas each year.
With the 2005-06 budget, the Compact represented a true
turning point. The first three years of the Compact were
very good for the University, as shown in Display XXI-11.
In each year, the State provided a normal workload budget
and UC began to address major shortfalls that had
occurred in the recent fiscal crisis.
Over that three-year period, base budget adjustments
helped support salary cost-of-living, market-based, and
equity salary adjustments, merit salary increases, health
and welfare benefit cost increases, and non-salary price
increases. Enrollment workload funding was provided to
support significant enrollment growth. In addition, the
marginal cost of instruction methodology was revised in
2006-07 to more appropriately recognize the actual cost of
hiring faculty and include a component for maintenance of
new space, which had not been adequately funded by the
State in recent years. In each of the three years, UC was
also able to direct $10 million for a multi-year plan to
restore $70 million of unallocated reductions that had
originally been targeted at instructional programs. Thus,
$30 million was put toward this goal. The State also funded
several initiatives during this period, including the Science
and Math Initiative, the labor and employment institutes,
and the Gallo Substance Abuse Program.
Funding for student academic preparation programs was a
major issue in the budget process for all three years.
In each year, the Governor’s January budget proposed
eliminating State funds for this program, leaving only the
University’s $12 million in support for student academic
Display XXI-11: State Funding Changes under theCompact, 2005-06 through 2007-08 (Dollars In Thousands)
2005-06 STATE FUNDINGCompact Funding
Base Budget Adjustment (3%) $76,124Annuitant Health and Dental Benefits $521Enrollment Growth $37,940
ReductionsOne-time enrollment shortfall ($3,764)
Other InitiativesLabor Institutes ($3,800)Science and Math Initiative $750UC Merced (One-Time) $14,000COSMOS ($1)
Total State Funding = $2.839 billion
2006-07 STATE FUNDINGCompact Funding
Base Budget Adjustment (3%) $80,489Enrollment Growth $50,980Nursing Enrollment Growth $963PRIME (MD) Enrollment Growth $180Buyout of 8-10% Student Fee Increases $75,015
Other InitiativesStudent Academic Preparation $17,300Science and Math Initiative $375CA Community College Transfer $2,000Labor Institutes $6,000Substance Abuse Research $4,000UC Merced (One-Time) $14,000
Total State Funding = $3.069 billion
2007-08 STATE FUNDINGCompact Funding
Base Budget Adjustment (4%) $116,734Annuitant Health and Dental Benefits $10,458Enrollment Growth $52,930Nursing Enrollment Growth $757PRIME (MD) Enrollment Growth $570
ReductionsUC-Mexico Research ($500)
Other InitiativesUC Merced (One-Time) $14,000COSMOS $500
Total State Funding = $3.257 billion
preparation as called for in the Compact. In the end, the
final budget act each year restored the State support, and
in 2006-07 included an augmentation of $2 million
Historical Perspective
144
for community college academic preparation programs.
In 2007-08, the University’s budget included $500,000
to support an increase for the California State Summer
School for Mathematics and Science (COSMOS), an
intensive academic four-week residential program for
talented and motivated high school students.
Also in 2007-08, the Governor’s January budget had
proposed elimination of State funds for labor and
employment research, but the Legislature augmented the
University’s budget by $6 million to restore funding for labor
research to its original level when the program was initiated
in 2000-01.
In 2005-06 and 2007-08, fee increases were implemented,
but in 2006-07, the State provided funding to avoid planned
increases in student fees.
There were several initiatives the University had proposed
in 2007-08 that were not funded in the final budget. The
University had requested that employer and employee
contributions to the UC Retirement Plan be reinstated (at
an estimated cost of $60 million during the first year);
however, the final budget did not include these funds.
Also in 2007-08, the January Governor’s budget proposed
increasing core support for the four California Institutes for
Science and Innovation by a total of $15 million to ensure
that each Institute had a minimum level of support with
which to operate, which in turn would serve as seed money
to continue to attract funds from industry and governmental
sources. Finally, for several years, the State budget had
contained language authorizing the University to use
operating funds (up to $7 million) to support renovations
needed for the University’s educational facility in Mexico
City, Casa de California; however, it was agreed by the
Governor and the Legislature that no State funds would be
used for this facility going forward.
The State-funded budget rose 5% in 2005-06, 8.2% in
2006-07, and 5.9% in 2007-08, rising from $2.8 billion in
2005-06 to $3.26 billion in 2007-08.
2008-09 THROUGH 2011-12: A SECOND STATE FISCAL CRISIS IN A DECADE
The 2008-09 academic year began, fiscally, as a very
difficult year for the State. The State’s ongoing structural
deficit was estimated to be about $6 billion when the
University developed its plan for 2008-09 in November
2007 and ended up totaling closer to $14.5 billion when the
Governor and the Legislature negotiated a final budget in
September 2008. The State addressed its problem through
a combination of budget cuts, borrowing, and revenue
enhancements such as closing tax loopholes, among other
actions.
For the University, the budget was constrained, falling short
of funding basic costs. In developing the Governor’s
Budget, the Department of Finance first “funded” a normal
workload budget consistent with the Compact with the
Governor, and then proposed a 10% reduction (totaling
$332 million) to that higher budget to address the State’s
fiscal situation. The net result in the Governor’s January
proposal between 2007-08 and 2008-09 was a reduction to
the University’s base budget of $108 million (excluding
lease revenue bond payments and one-time funds). The
Governor’s May revision proposed to restore $98.5 million
of the cut proposed in January, and this restoration was
sustained through the signing of the budget act. With the
adoption of a new State spending plan in September 2008,
the University’s State-funded budget was essentially flat
compared to 2007-08, totaling $3.25 billion.
Unfortunately, the nation, and indeed the world, was
entering the worst economic recession since the Great
Depression of the 1930s. As a result, estimates of revenue
contained in the State’s September 2008 budget act proved
unrealistic and the State began a process of budget
negotiations over a 10-month period to resolve its deficit.
First, action occurred in October, after the final budget act
had been passed, which required the University to achieve
$33.1 million in one-time savings during 2008-09. During
November, the Governor called a special session of the
Legislature to deal with the State’s fiscal crisis. That effort
ended with a new 18-month budget package adopted in
February 2009 that implemented mid-year cuts for 2008-09
and developed a spending plan for 2009-10 instituting
additional cuts. Within a matter of weeks, it became
evident the revenue estimates used to adopt the February
Special Session budget were too optimistic. Late into the
summer, the Legislature adopted its third budget for
2008-09 (after the fiscal year had ended) and a revised
Historical Perspective
145
spending plan for 2009-10 to resolve an estimated
$24 billion deficit.
Again, the State used a combination of spending cuts,
borrowing, transfers to the General Fund, and increased
revenue (through accounting system changes rather than
additional taxes) to resolve the budget deficit. The new 18-
month State budget included unprecedented cuts for the
Display XXI-12: 2008-09 State Budget Actions (Dollars inThousands)
Compact FundingBase Budget Adjustment (4%) $123,832Additional 1% for Core Academic Support $30,958Annuitant Health and Dental Benefits $11,081Enrollment Growth $56,370PRIME (MD) Enrollment Growth $975Other Adjustments10% Budget Reduction ($220,185)May Revise Restoration $98,548
Mid-year and Year-end ActionsMandatory Savings Target (one-time) ($33,051)Mid-year Special Session Reduction ($65,497)May Revise Reduction (one-time) ($510,000)May 26 Reduction (one-time) ($207,500)Conference Committee Restoration $2,000
Other InitiativesUC Merced (one-time) $10,000
Total State Funding = $2.418 billion
Display XXI-13: 2009-10 State Budget Actions (Dollars inThousands)
Compact FundingBase Budget Adjustment (5%) $153,764Annuitant Health and Dental Benefits $11,332Enrollment Growth $56,180PRIME (MD) Enrollment Growth $1,460Nursing Enrollment Growth $1,087Other AdjustmentsElimination of Compact Funding ($209,944)May Revise Restoration $98,548
Subsequent ActionsSpecial Session Vetoes (one-time) ($305,000)May Revise Reductions ($81,300)May 26 Reduction (two-year) ($167,500)Conference Committee Adjustment ($17,800)
Other InitiativesUC Merced (one-time) $5,000
Total State Funding = $2.591 billion
University. Reductions in 2008-09 totaled $814 million
and included both permanent and one-time cuts. These
reductions were partially offset by $716.5 million in one-
time funds provided by the federal government through the
American Recovery and Reinvestment Act (ARRA) as part
of a wide-ranging economic stimulus package intended to
jump-start economic recovery in a number of sectors,
including education. Many of the reductions for 2008-09
were not approved until after the fiscal year had ended. In
addition, much of the ARRA money was not provided until
the new fiscal year. Thus, the University carried forward a
large negative balance at the end of 2008-09.
The funding cuts for the University’s 2009-10 budget
reflected the continuing fiscal crisis in the State. When
compared to the budget adopted in September 2008 before
the mid-year cuts began, the University’s 2009-10 State
funded budget was $637 million less, totaling $2.6 billion, a
reduction of 20%. Displays XXI-12 and XXI-13 show the
actions that occurred during 2008-09 and 2009-10.
The fiscal turbulence that characterized the 20 months
between December 2008 and August 2010 for the State of
California did not subside with the adoption of the 2009-10
budget. The State remained unable to develop permanent
solutions to address its ongoing fiscal deficit.
Thus, with the presentation in January 2010 of a proposed
budget for 2010-11, the Governor once again had difficult
choices to make. As a signal of the high priority he placed
on maintaining funding for higher education, the Governor
proposed additional funding totaling $370.4 million for UC,
including the following:
restoration of a $305 million one-time cut adopted as part of the 2009-10 budget package;
$51.3 million to support 5,121 FTE students (at the time, UC estimated it had enrolled more than 14,000 students for whom it had not received State funding); and
$14.1 million in annuitant benefits.
While the funding only partially addressed the shortfalls UC
has experienced since 2007-08, the Governor’s proposal
was welcome news for UC’s students, faculty, and staff,
signaling that adequate funding for UC continues to be
important to the State of California.
Budget negotiations continued throughout the spring and
summer with no agreement by the Governor and the
Historical Perspective
146
Legislature. Ultimately, it was not until October 8th, more
than 100 days into the fiscal year, that a final budget
package for 2010-11 was signed into law.
Supporting the budget proposals Governor
Schwarzenegger submitted in his January budget, the final
budget included an additional $264.4 million for the
University of California; another $106 million in one-time
ARRA funds was approved in early September. Of this
amount, $199 million was permanent funding to partially
restore the one-time budget cut agreed to as part of the
2009-10 State budget. When combined with the one-time
$106 million in ARRA funds, the total amount restored was
$305 million, which is the total restoration the Governor
originally proposed. The total also included the
$51.3 million to address UC’s unfunded enrollment.
Another $14.1 million was included for the increase in
health care costs for UC’s retired annuitants.
An issue of great concern had been the funding of the
State’s share of the employer contribution to the
University’s retirement program, estimated to be
$95.7 million in 2010-11. The final budget package did not
contain the funding to support this cost. However, the
Legislature did approve trailer bill language to eliminate the
current statutory language prohibiting any new State
General Fund dollars from supporting the State’s obligation
to the University of California Retirement Program. The
Legislature also adopted budget bill language asking for the
Legislative Analyst, the Department of Finance, and UC to
work together to develop a proposal for how UC’s
retirement plan would be funded in future years. While this
language was vetoed by the Governor, the Legislative
Analyst began to present the liability for contributions to the
University’s retirement program as an issue that must be
addressed.
Other actions approved in the final package include budget
language requiring UC to redirect $10 million from existing
resources to support planning for a new medical school at
UC Riverside and $600,000 to be redirected from existing
resources for the Institute of Governmental Studies at UC
Berkeley. Display XXI-14 summarizes the changes to the
University’s operating budget as approved in the final
budget.
Display XXI-14: 2010-11 State Budget Actions (Dollars inThousands)
Major ActionsRestoration of One-time Cuts (permanent) $199,000Restoration of One-time Cuts (one-time) $106,000Annuitant Health and Dental Benefits $14,121Enrollment Growth $51,272Debt Service Adjustments $52,190
Other InitiativesUC Merced (one-time) $5,000
Redirections of Existing FundsUCR Medical School ($10 million) $0Reapportionment Database ($600,000) $0
Total State Funding = $2.911 billion
While some of the earlier cuts in State support imposed on
the University in 2008-09 and 2009-10 were restored in
2010-11, the University continued to face significant
mandatory cost increases and a significant budget shortfall.
In November 2010, in addition to requesting further
restoration of funding, support for contributions to the UC
Retirement Plan, and funding to cover the costs of
unfunded enrollments from the State, UC implemented an
8% student tuition and fee increase for 2011-12.
Despite the University’s request for an increase in funding,
in January 2011, newly-elected Governor Brown proposed
the restoration of $106 million that had been funded
through ARRA during 2010-11, a $7.1 million increase to
support retiree health benefit cost increases, and a
$500 million undesignated reduction in State support for
UC. This reduction was part of a budget package seeking
the extension of temporary tax increases that were set to
expire in 2011-12 through the referendum process. In
spring 2011, the Legislature approved the Governor’s
proposal for UC for 2011-12. UC also faced $362.5 million
in unfunded mandatory costs, bringing UC’s total budget
gap for 2011-12 at that point to $862.5 million.
Ultimately, the Governor was unable to gain approval for
placing the tax extension referendum on the ballot for
2011-12. On June 30, 2011, the Governor signed a second
budget package for 2011-12 that included additional
targeted reductions for many State programs, including
$150 million each for UC and CSU, an assumption of
Historical Perspective
147
significant revenue increases, and a trigger mechanism for
more cuts mid-year if revenue targets were not realized.
The combined reduction for UC totaled $750 million,
$100 million of which was not allocated until mid-year. The
decrease represented a cut of 26% over the prior year.
Combined with the mandatory cost increases of
$360 million, the University’s budget shortfall rose above
$1 billion.
In response to the additional reduction of $150 million, at
their July meeting, the Regents approved a 9.6% increase
in mandatory systemwide charges, effective for the Fall
2011 term, to replace the lost State funding. This increase,
Display XXI-15: 2011-12 State Budget Actions (Dollars in Thousands)
Major ActionsRestoration of One-time Cuts $106,000Annuitant Health and Dental Benefits $7,089Undesignated Reduction (January) ($500,000)Undesignated Reduction (June) ($150,000)Trigger Cut (December) $100,000
Other InitiativesUC Merced (one-time) $5,000
Total State Funding = $2.274 billion**Subsequent adjustments reduced this total to $2.271 billion.
Display XXI-16: 2011-12 Reductions for Previously Earmarked Programs (Dollars in Thousands)
Elimination of State support ReductionEarthquake Engineering Research $384Lupus Research $624Spinal Cord Research $1,246Substance Abuse Research $13,770Preuss School $1,000
Reductions up to 21.3%San Diego Supercomputer Center $690Other SAPEP Programs (estimated) $4,056COSMOS (estimated) $192
Reductions up to 5%AIDS Research $461 Charles R. Drew Medical Program $462MIND Institute $156CA Policy on Access to Care $50US-Mexican Treaty Project $10Study of Latino Health & Culture $30
No reductionsLabor Institutes $0
combined with the increase approved in November 2010,
meant that mandatory charges rose by $1,890, or 18.3%,
over 2010-11 charges. These increases covered about
26% of the University’s budget shortfall for 2011-12.
The University sought endorsement by the Legislature of its
plan to target specific cuts to programs that had received
large increases from the State but had not been reviewed
to determine their necessity or appropriate funding level.
While many of the targeted program cuts were accepted,
several were protected by the Legislature, as shown in
Display XXI-16.
FUNDING IN THE CURRENT YEAR – 2012-13
The budget package adopted by the Governor and the
Legislature for 2012-13 resolved about $10 billion of the
$15.7 billion gap identified by the Governor in his May
Revision, primarily through cuts to Health and Human
Services, Social Services, child care, Proposition 98 and
other State programs. The 2012-13 State budget assumes
adoption of the Governor’s revenue-raising initiative (The
Schools and Local Public Safety Protection Act of 2012 –
Attorney General reference number 12-0009) on the
November ballot, which would address about $5.6 billion of
the gap. If the Governor’s revenue-raising initiative is not
adopted in the November election, the budget calls for
nearly $6 billion in trigger reductions to various State
agency budgets, including $250 million to UC and
$250 million to the California State University.
For the University, the 2012-13 budget includes no further
cuts to the base budget and provides an augmentation of
$89.1 million toward the State’s share of the employer
contribution to the University’s retirement plan. The budget
also includes an augmentation of $5.2 million for annuitant
health benefits and $11.6 million for lease revenue bond
debt service. The new State funding base for UC in
2012-13 will be $2.378 billion, up from $2.271 billion in
2011-12. Considering the $15.7 billion budget gap the
Legislature and the Governor were addressing, UC fared
well compared to other State agencies.
The budget deal also provides UC with $125.4 million in
deferred tuition buy-out funding in the 2013-14 budget if the
Governor’s revenue-raising initiative passes in November
Historical Perspective
148
and if the University does not implement the 6% tuition
increase UC had expected to implement in 2012-13.
In addition, UC students were spared major cuts to their Cal
Grants in the 2012-13 State budget. The Governor’s
January budget had proposed several changes to the
entitlement provisions, all of which were rejected by the
Legislature.
The University was seeking approval of a proposal that was
not included in the final budget. This initiative would have
involved the University assuming responsibility for the
State’s lease revenue bond debt for University facilities
(totaling approximately $2.5 billion), and restructuring that
debt to save approximately $80 million (in part because of
UC’s more favorable credit rating) on an ongoing basis that
Display XXI-17: 2012-13 State Budget Changes (Dollars in Thousands)
AugmentationUC Retirement Plan $89,135Annuitant Health Benefits $5,168Lease Revenue Bond Debt Service $11,648
Total State Funding = $2.378 billion*
could have been used to help cover operating budget
shortfalls and some capital outlay needs. Unfortunately,
strong opposition precluded this proposal from being
adopted in the legislative budget process. The debt
restructuring proposal was critical not only to assisting UC
with its budget shortfall, but also to addressing capital
facility projects the State is no longer willing to fund. The
University will continue to pursue this proposal for 2013-14.
While every decade in recent history has begun with an
economic downturn that has negatively affected the
University’s fiscal stability, the past decade was
unprecedented as two major multi-year fiscal crises
occurred within a ten-year period. It is critical for the
future of the University of California that the State find
solutions to its fiscal woes – until that occurs, the University
of California will experience increasingly difficult fiscal
challenges as it hopes to move forward. Display XXI-17
provides a brief outline of State budget actions since
2000-01. The Cross-Cutting Issues chapter of this
document contains detail on the actions of the University to
address the budget cuts in recent years.
Historical Perspective
149
Display XXI-17: The UC Budget Since 2000-01
2000-01Partnership Agreement with Governor Davis funding allows increases to base, core needs, enrollment, research, and outreach, as well as new and expanded funding for initiatives, and fee buy-downs for students.
2001-02
While a fiscal crisis looms, the State is able to provide Partnership funding, but by the end of the year must make some cuts to research, outreach, and public service.
2002-03With the State in fiscal crisis, Partnership funding is provided for enrollment and annuitant benefits, but UC’s base increase is lower than planned and partially offset by fee increases, and cuts are made throughout the University.
2003-04Large cuts are made throughout the enterprise, as high as 50% in outreach, but increases to enrollment and annuitant benefits are still provided.2004-05
The State budget crisis’ effect on UC peaks, with increases in student fees and the student-faculty ratio, a smaller freshman class, and large budget reductions throughout the University.
2005-06A return to increases in base budget and enrollment funding and few targeted cuts through the new Compact with Governor Schwarzenegger signal a turning point in UC’s budget after four years of reductions.
2006-07
The State provides Compact funding, as well as additional funding for outreach and research, and provides students with fee increase buyouts.
2007-08Compact funding is again available, with some additional funding for outreach.
2008-09With the onset of another fiscal crisis, the Compact is funded but equivalent unallocated cuts are assigned and institutional support is reduced.2009-10
The Compact is again funded, but equivalent unallocated cuts are assigned, and large and wide-ranging cuts are assigned throughout the University.
2010-11
The Governor prioritizes investing in higher education, which is reflected in the final State budget with partial restoration of earlier cuts and new funding for enrollment.
2011-12With the Governor unable to place a referendum to extend temporary tax increases on the ballot, higher education is assigned cuts totaling $1.7 billion. Also, for the first time, revenue from student tuition and fees exceeded revenue from the State.
2012-13While most other State agencies received more budget cuts, the University received a budget augmentation to help fund the State’s share of the employer contribution to the University’s retirement plan. However, if the Governor’s revenue-raising initiative on the November ballot is not adopted, UC faces another mid-year trigger reduction of $250 million.
150
Appendix Display 1: Budget for Current Operations and Extramurally Funded Operations (Dollars in Thousands)
I N C O M E2011-12 2012-13Actual Estimated
BUDGET FOR CURRENT OPERATIONSGeneral FundState of California $ 2,271,410 $ 2,378,124 State Fiscal Stabilization Funds 0 $ 0UC Sources 792,340 848,466 Total General Funds $ 3,063,750 $ 3,226,590 Restricted FundsState of California $ 87,477 $ 63,344 U. S. Government Appropriations 20,244 23,000 Tuition, Student Services Fee & Professional School Tuition 3,022,602 2,981,299 Extension, Summer Session & Other Fees 629,891 658,956 Teaching Hospitals 6,288,149 6,791,201 Auxiliary Enterprises 992,096 950,099 Endowment Earnings 212,700 217,359 Other 3,143,583 3,296,888 Total Restricted Funds $ 14,396,742 $ 14,982,14TOTAL BUDGET FOR CURRENT OPERATIONS $ 17,460,492 $ 18,208,73
EXTRAMURALLY FUNDED OPERATIONS
State of California $ 328,912 $ 316,073 U.S. Government 2,895,534 2,743,275 Private Gifts, Contracts & Grants 1,568,830 1,615,895 Other 496,633 386,718 TOTAL EXTRAMURALLY FUNDED OPERATIONS $ 5,289,909 $ 5,061,961
DEPARTMENT OF ENERGY LABORATORY (LBNL) $ 822,808 $ 810,000
TOTAL OPERATIONS $ 23,573,209 $ 24,080,697
E X P E N D I T U R E S2011-12 2012-12Actual Budgeted
BUDGET FOR CURRENT OPERATIONSInstruction:
General Campus $ 2,663,201 $ 2,708,596Health Sciences 1,773,463 1,842,412Summer Session 15,656 15,656University Extension 223,263 235,766
Research 685,533 711,052Public Service 248,252 257,348Academic Support: Libraries 240,907 253,986Academic Support: Other 1,090,976 1,110,893Teaching Hospitals 6,310,850 6,813,902Student Services 668,757 669,363Institutional Support 662,455 652,469Operation and Maintenance of Plant 525,146 537,722Student Financial Aid 1,177,152 1,272,291Auxiliary Enterprises 992,096 950,099Provisions for Allocation 212,785 177,181TOTAL BUDGET FOR CURRENT OPERATIONS $ 17,460,492 $ 18,208,736
EXTRAMURALLY FUNDED OPERATIONSSponsored Research $ 3,561,026 $ 3,425,568Other Activities 1,728,883 1,636,393TOTAL EXTRAMURALLY FUNDED OPERATIONS $ 5,289,909 $ 5,061,961
DEPARTMENT OF ENERGY LABORATORY (LBNL) $ 822,808 $ 810,000
TOTAL OPERATIONS $ 23,573,209 $ 24,080,697
151
Appendix Display 2: University of California Income and Funds Available (Dollars in Thousands)
Actual Estimated2011-12 2012-13
STATE APPROPRIATIONS General Fund $ 2,271,410 2,378,124 Special Funds 87,477 63,344
TOTAL, STATE APPROPRIATIONS $ 2,358,887 2,441,468
UNIVERSITY SOURCES General Funds Income Student Fees Nonresident Supplemental Tuition $ 404,404 407,584 Application for Admission and Other Fees 29,229 30,200 Interest on General Fund Balances 6,145 5,000 Federal Contract & Grant Overhead 305,108 316,377 Overhead on State Agency Agreements 15,063 15,500 Other 24,017 15,000 Subtotal $ 783,966 789,661
Prior Year's Income Balance 67,179 58,805 Available in Subsequent Year -58,805 Total UC General Fund Income $ 792,340 848,466
Special Funds Income GEAR UP State Grant Program $ 5,000 5,000 United States Appropriations 15,244 18,000 Local Government 104,114 96,639 Student Fees Tuition [Educational Fee] 2,584,272 2,514,326 Student Services Fee [Registration Fee] 200,188 218,482 Professional School Tuition 238,142 248,491 University Extension Fees 223,263 235,766 Summer Session Fees 15,656 15,656 Other Fees 390,972 407,534 Sales & Services - Teaching Hospitals 6,288,149 6,791,201 Sales & Services - Educational Activities 1,943,169 2,137,486 Sales & Services - Support Activities 637,287 656,363 Endowments 212,700 217,359 Auxiliary Enterprises 992,096 950,099 Contract and Grant Off-the-Top Overhead 142,012 105,000 DOE Management Fee 31,624 31,400 University Opportunity Fund 170,683 145,000 Other 114,694 125,000 Total Special Funds $ 14,309,265 14,918,802
TOTAL, UNIVERSITY SOURCES $ 15,101,605 15,767,268
TOTAL INCOME AND FUNDS AVAILABLE $ 17,460,492 18,208,736Note: Excludes extramural funds.
152
Appendix Display 3: SAPEP State General Funds and University Funds Budgets (Dollars in Thousands)
This table shows the budget for each SAPEP program in 1997-98, prior to significant funding augmentations; in 2000-01, when SAPEP funding reached its peak; in 2008-09, representative of a few years of stable funding for SAPEP programs; and in 2009-10 and 2011-12, when SAPEP programs were subject to budget reductions.
1997-98 2000-01 2008-09 2009-10 2011-12
Direct Student Services ProgramsCommunity College Transfer Programs $1,718 $5,295 $3,279 $3,058 $2,431
EAOP 4,794 16,094 8,914 8,416 7,599
Graduate and Professional School Programs 1,893 8,575 2,661 2,623 2,467
MESA Schools Program 4,169 9,355 4,861 4,394 3,806
MESA Community College Program 22 1,309 327 327 327
Puente High School Program - 1,800 1,051 980 793
Puente Community College Program 162 757 450 419 340
Student-Initiated Programs - - 440 440 414
UC Links - 1,656 694 622 622
Statewide Infrastructure Programs
ASSIST 360 360 429 389 377
Community College Articulation - - 600 600 600
Longer-Term Strategies
K-20 Regional Intersegmental Alliances1 - 15,591 1,395 1,361 1,255
Direct Instructional Programs
Preuss Charter School - 1,000 1,000 1,000 -
UC College Preparation (online courses) - 8,400 3,106 3,059 2,411
Other Programs
Evaluation - 1,386 1,180 1,077 863
Other Programs2 203 3,887 936 829 652
Programs that have been eliminated or consolidated3 4,750 9,717 - - -
Total $18,071 $85,182 $31,323 $29,594 $24,957
General Funds $16,996 $82,243 $19,323 $17,594 $12,957
University Funds $1,075 $2,939 $12,000 $12,000 $12,0001 Formerly School-University Partnerships.2 Currently includes University-Community Engagement, ArtsBridge, and other programs.3 Includes Test Preparation, Dual Admissions, Gateways, Informational Outreach and Recruitment, Central Valley Programs, and UC ACCORD.
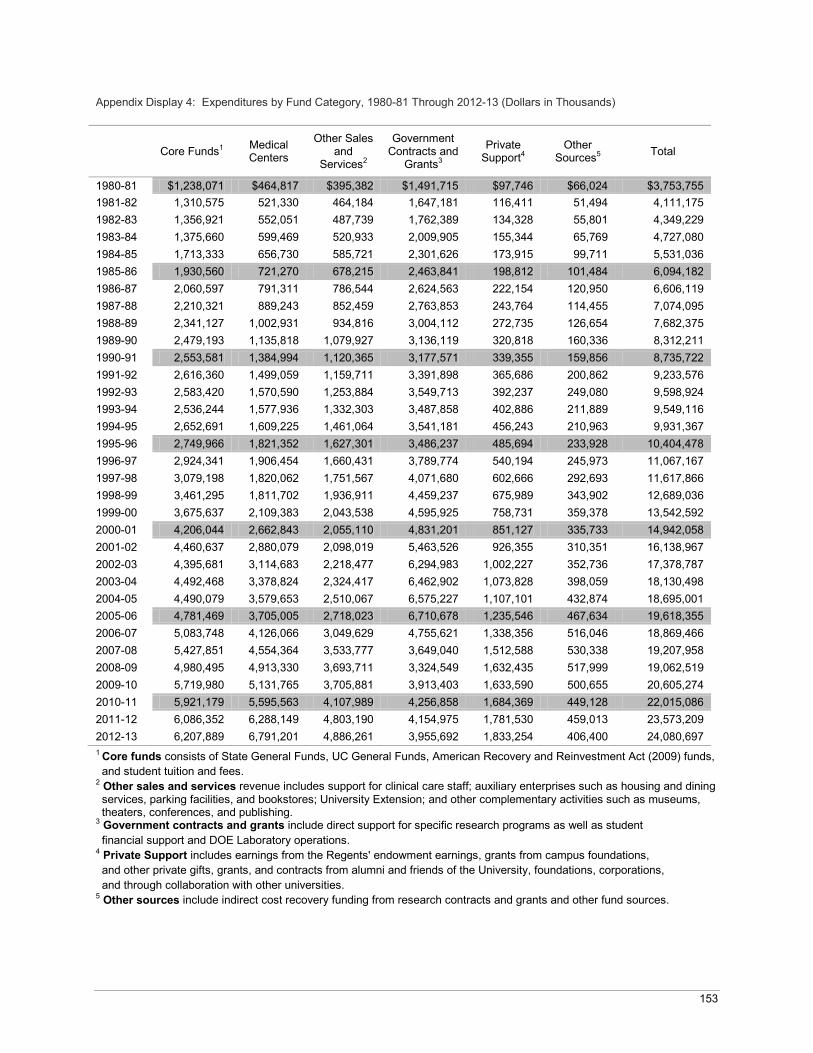
153
Appendix Display 4: Expenditures by Fund Category, 1980-81 Through 2012-13 (Dollars in Thousands)
Core Funds1 Medical Centers
Other Sales and
Services2
Government Contracts and
Grants3
Private Support4
Other Sources5 Total
1980-81 $1,238,071 $464,817 $395,382 $1,491,715 $97,746 $66,024 $3,753,7551981-82 1,310,575 521,330 464,184 1,647,181 116,411 51,494 4,111,1751982-83 1,356,921 552,051 487,739 1,762,389 134,328 55,801 4,349,2291983-84 1,375,660 599,469 520,933 2,009,905 155,344 65,769 4,727,0801984-85 1,713,333 656,730 585,721 2,301,626 173,915 99,711 5,531,0361985-86 1,930,560 721,270 678,215 2,463,841 198,812 101,484 6,094,1821986-87 2,060,597 791,311 786,544 2,624,563 222,154 120,950 6,606,1191987-88 2,210,321 889,243 852,459 2,763,853 243,764 114,455 7,074,0951988-89 2,341,127 1,002,931 934,816 3,004,112 272,735 126,654 7,682,3751989-90 2,479,193 1,135,818 1,079,927 3,136,119 320,818 160,336 8,312,2111990-91 2,553,581 1,384,994 1,120,365 3,177,571 339,355 159,856 8,735,7221991-92 2,616,360 1,499,059 1,159,711 3,391,898 365,686 200,862 9,233,5761992-93 2,583,420 1,570,590 1,253,884 3,549,713 392,237 249,080 9,598,9241993-94 2,536,244 1,577,936 1,332,303 3,487,858 402,886 211,889 9,549,1161994-95 2,652,691 1,609,225 1,461,064 3,541,181 456,243 210,963 9,931,3671995-96 2,749,966 1,821,352 1,627,301 3,486,237 485,694 233,928 10,404,4781996-97 2,924,341 1,906,454 1,660,431 3,789,774 540,194 245,973 11,067,1671997-98 3,079,198 1,820,062 1,751,567 4,071,680 602,666 292,693 11,617,8661998-99 3,461,295 1,811,702 1,936,911 4,459,237 675,989 343,902 12,689,0361999-00 3,675,637 2,109,383 2,043,538 4,595,925 758,731 359,378 13,542,5922000-01 4,206,044 2,662,843 2,055,110 4,831,201 851,127 335,733 14,942,0582001-02 4,460,637 2,880,079 2,098,019 5,463,526 926,355 310,351 16,138,9672002-03 4,395,681 3,114,683 2,218,477 6,294,983 1,002,227 352,736 17,378,7872003-04 4,492,468 3,378,824 2,324,417 6,462,902 1,073,828 398,059 18,130,4982004-05 4,490,079 3,579,653 2,510,067 6,575,227 1,107,101 432,874 18,695,0012005-06 4,781,469 3,705,005 2,718,023 6,710,678 1,235,546 467,634 19,618,3552006-07 5,083,748 4,126,066 3,049,629 4,755,621 1,338,356 516,046 18,869,4662007-08 5,427,851 4,554,364 3,533,777 3,649,040 1,512,588 530,338 19,207,9582008-09 4,980,495 4,913,330 3,693,711 3,324,549 1,632,435 517,999 19,062,5192009-10 5,719,980 5,131,765 3,705,881 3,913,403 1,633,590 500,655 20,605,2742010-11 5,921,179 5,595,563 4,107,989 4,256,858 1,684,369 449,128 22,015,0862011-12 6,086,352 6,288,149 4,803,190 4,154,975 1,781,530 459,013 23,573,2092012-13 6,207,889 6,791,201 4,886,261 3,955,692 1,833,254 406,400 24,080,6971 Core funds consists of State General Funds, UC General Funds, American Recovery and Reinvestment Act (2009) funds, and student tuition and fees.
2 Other sales and services revenue includes support for clinical care staff; auxiliary enterprises such as housing and dining services, parking facilities, and bookstores; University Extension; and other complementary activities such as museums, theaters, conferences, and publishing.
3 Government contracts and grants include direct support for specific research programs as well as student financial support and DOE Laboratory operations.
4 Private Support includes earnings from the Regents' endowment earnings, grants from campus foundations, and other private gifts, grants, and contracts from alumni and friends of the University, foundations, corporations, and through collaboration with other universities.
5 Other sources include indirect cost recovery funding from research contracts and grants and other fund sources.
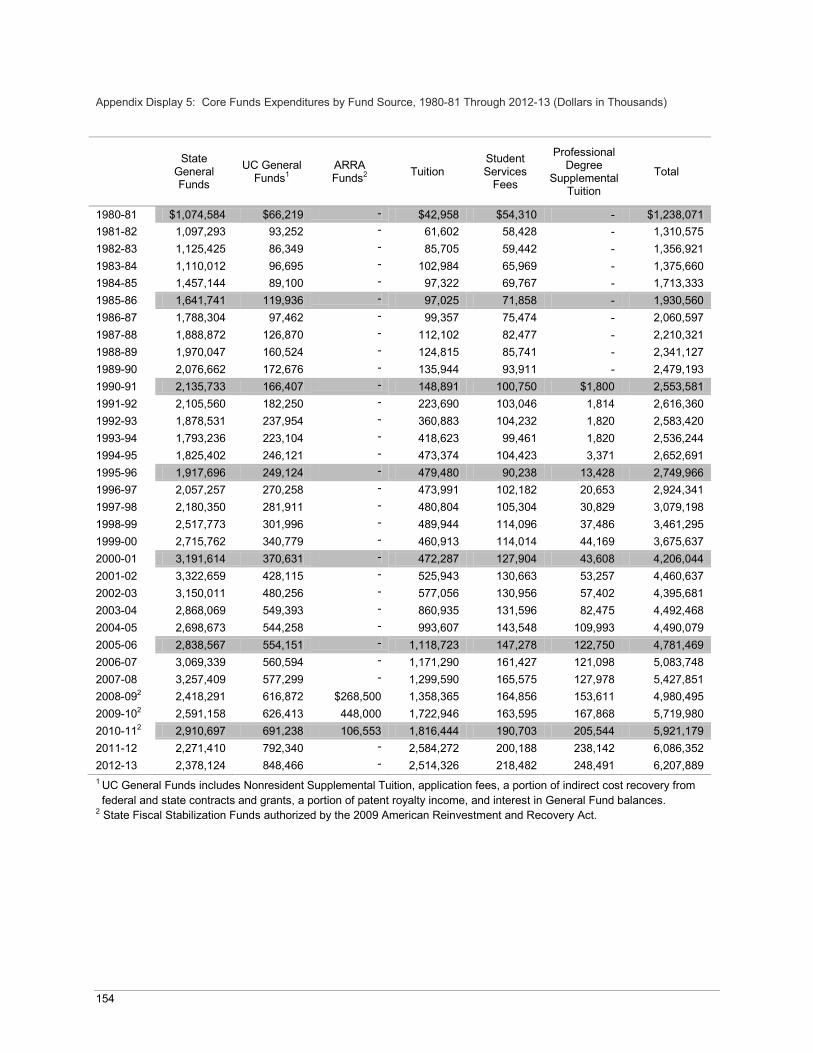
154
Appendix Display 5: Core Funds Expenditures by Fund Source, 1980-81 Through 2012-13 (Dollars in Thousands)
State General Funds
UC General Funds1
ARRA Funds2 Tuition
Student Services
Fees
Professional Degree
Supplemental Tuition
Total
1980-81 $1,074,584 $66,219 - $42,958 $54,310 - $1,238,0711981-82 1,097,293 93,252 - 61,602 58,428 - 1,310,5751982-83 1,125,425 86,349 - 85,705 59,442 - 1,356,9211983-84 1,110,012 96,695 - 102,984 65,969 - 1,375,6601984-85 1,457,144 89,100 - 97,322 69,767 - 1,713,3331985-86 1,641,741 119,936 - 97,025 71,858 - 1,930,5601986-87 1,788,304 97,462 - 99,357 75,474 - 2,060,5971987-88 1,888,872 126,870 - 112,102 82,477 - 2,210,3211988-89 1,970,047 160,524 - 124,815 85,741 - 2,341,1271989-90 2,076,662 172,676 - 135,944 93,911 - 2,479,1931990-91 2,135,733 166,407 - 148,891 100,750 $1,800 2,553,5811991-92 2,105,560 182,250 - 223,690 103,046 1,814 2,616,3601992-93 1,878,531 237,954 - 360,883 104,232 1,820 2,583,4201993-94 1,793,236 223,104 - 418,623 99,461 1,820 2,536,2441994-95 1,825,402 246,121 - 473,374 104,423 3,371 2,652,6911995-96 1,917,696 249,124 - 479,480 90,238 13,428 2,749,9661996-97 2,057,257 270,258 - 473,991 102,182 20,653 2,924,3411997-98 2,180,350 281,911 - 480,804 105,304 30,829 3,079,1981998-99 2,517,773 301,996 - 489,944 114,096 37,486 3,461,2951999-00 2,715,762 340,779 - 460,913 114,014 44,169 3,675,6372000-01 3,191,614 370,631 - 472,287 127,904 43,608 4,206,0442001-02 3,322,659 428,115 - 525,943 130,663 53,257 4,460,6372002-03 3,150,011 480,256 - 577,056 130,956 57,402 4,395,6812003-04 2,868,069 549,393 - 860,935 131,596 82,475 4,492,4682004-05 2,698,673 544,258 - 993,607 143,548 109,993 4,490,0792005-06 2,838,567 554,151 - 1,118,723 147,278 122,750 4,781,4692006-07 3,069,339 560,594 - 1,171,290 161,427 121,098 5,083,7482007-08 3,257,409 577,299 - 1,299,590 165,575 127,978 5,427,8512008-092 2,418,291 616,872 $268,500 1,358,365 164,856 153,611 4,980,4952009-102 2,591,158 626,413 448,000 1,722,946 163,595 167,868 5,719,9802010-112 2,910,697 691,238 106,553 1,816,444 190,703 205,544 5,921,1792011-12 2,271,410 792,340 - 2,584,272 200,188 238,142 6,086,3522012-13 2,378,124 848,466 - 2,514,326 218,482 248,491 6,207,8891 UC General Funds includes Nonresident Supplemental Tuition, application fees, a portion of indirect cost recovery from federal and state contracts and grants, a portion of patent royalty income, and interest in General Fund balances.
2 State Fiscal Stabilization Funds authorized by the 2009 American Reinvestment and Recovery Act.
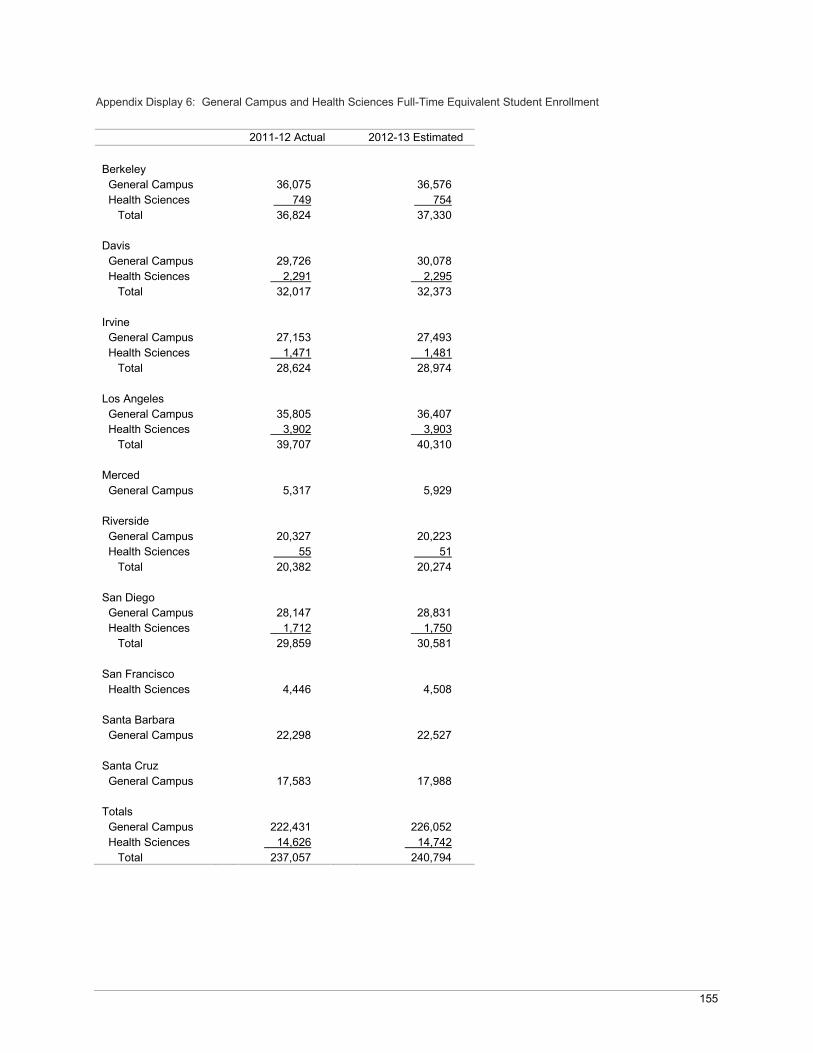
155
Appendix Display 6: General Campus and Health Sciences Full-Time Equivalent Student Enrollment
2011-12 Actual 2012-13 Estimated
BerkeleyGeneral Campus 36,075 36,576Health Sciences 749 754
Total 36,824 37,330
DavisGeneral Campus 29,726 30,078Health Sciences 2,291 2,295
Total 32,017 32,373
IrvineGeneral Campus 27,153 27,493Health Sciences 1,471 1,481
Total 28,624 28,974
Los AngelesGeneral Campus 35,805 36,407Health Sciences 3,902 3,903
Total 39,707 40,310
MercedGeneral Campus 5,317 5,929
RiversideGeneral Campus 20,327 20,223Health Sciences 55 51
Total 20,382 20,274
San DiegoGeneral Campus 28,147 28,831Health Sciences 1,712 1,750
Total 29,859 30,581
San FranciscoHealth Sciences 4,446 4,508
Santa BarbaraGeneral Campus 22,298 22,527
Santa CruzGeneral Campus 17,583 17,988
TotalsGeneral Campus 222,431 226,052Health Sciences 14,626 14,742
Total 237,057 240,794
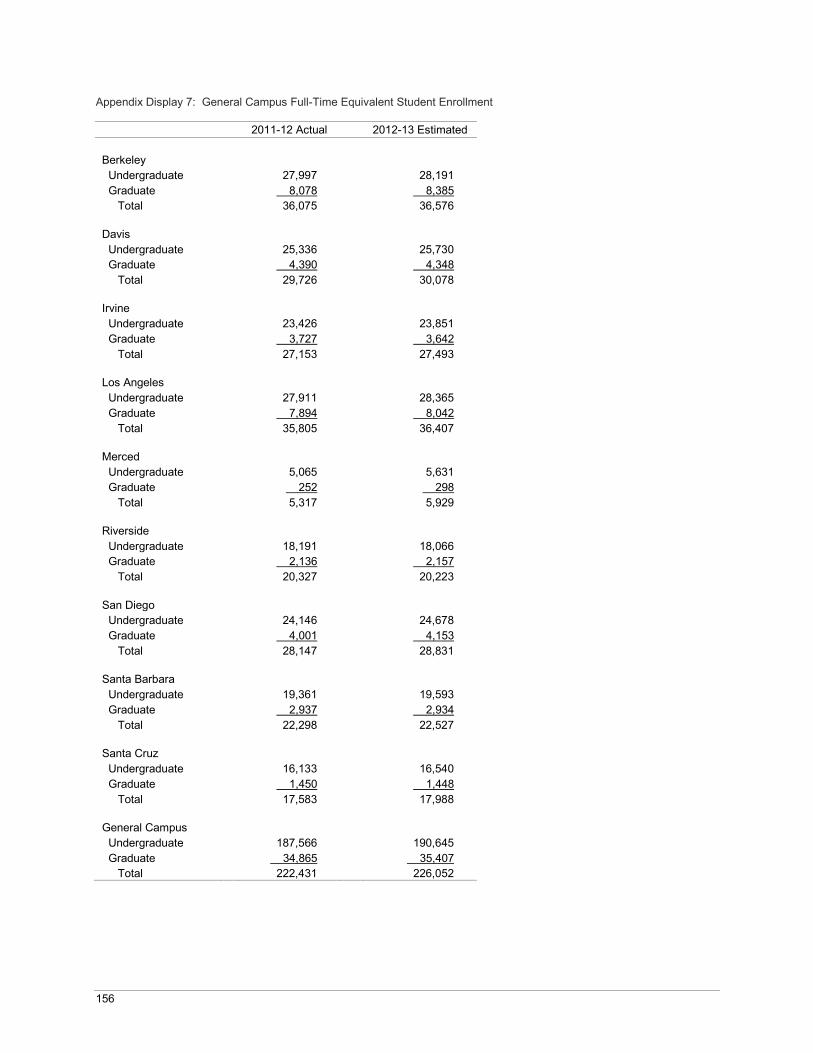
156
Appendix Display 7: General Campus Full-Time Equivalent Student Enrollment
2011-12 Actual 2012-13 Estimated
BerkeleyUndergraduate 27,997 28,191Graduate 8,078 8,385
Total 36,075 36,576
DavisUndergraduate 25,336 25,730Graduate 4,390 4,348
Total 29,726 30,078
IrvineUndergraduate 23,426 23,851Graduate 3,727 3,642
Total 27,153 27,493
Los AngelesUndergraduate 27,911 28,365Graduate 7,894 8,042
Total 35,805 36,407
MercedUndergraduate 5,065 5,631Graduate 252 298
Total 5,317 5,929
RiversideUndergraduate 18,191 18,066Graduate 2,136 2,157
Total 20,327 20,223
San DiegoUndergraduate 24,146 24,678Graduate 4,001 4,153
Total 28,147 28,831
Santa BarbaraUndergraduate 19,361 19,593Graduate 2,937 2,934
Total 22,298 22,527
Santa CruzUndergraduate 16,133 16,540Graduate 1,450 1,448
Total 17,583 17,988
General CampusUndergraduate 187,566 190,645Graduate 34,865 35,407
Total 222,431 226,052
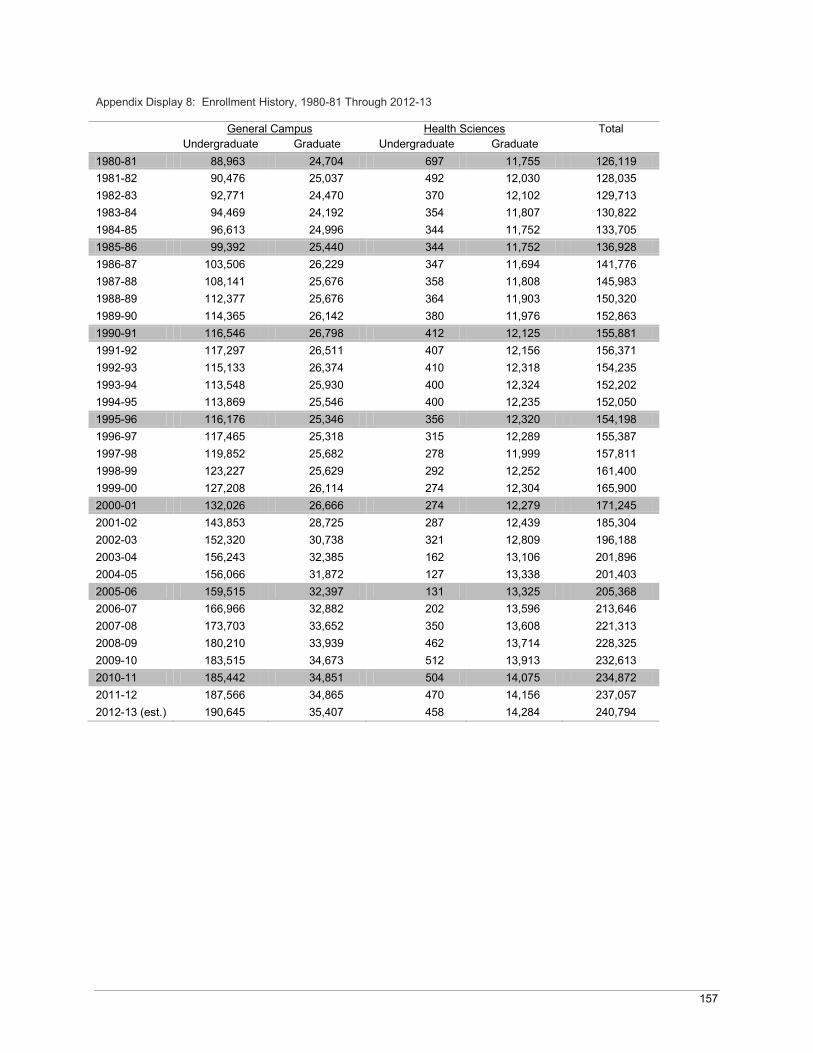
157
Appendix Display 8: Enrollment History, 1980-81 Through 2012-13
General Campus Health Sciences TotalUndergraduate Graduate Undergraduate Graduate
1980-81 88,963 24,704 697 11,755 126,1191981-82 90,476 25,037 492 12,030 128,0351982-83 92,771 24,470 370 12,102 129,7131983-84 94,469 24,192 354 11,807 130,8221984-85 96,613 24,996 344 11,752 133,7051985-86 99,392 25,440 344 11,752 136,9281986-87 103,506 26,229 347 11,694 141,7761987-88 108,141 25,676 358 11,808 145,9831988-89 112,377 25,676 364 11,903 150,3201989-90 114,365 26,142 380 11,976 152,8631990-91 116,546 26,798 412 12,125 155,8811991-92 117,297 26,511 407 12,156 156,3711992-93 115,133 26,374 410 12,318 154,2351993-94 113,548 25,930 400 12,324 152,2021994-95 113,869 25,546 400 12,235 152,0501995-96 116,176 25,346 356 12,320 154,1981996-97 117,465 25,318 315 12,289 155,3871997-98 119,852 25,682 278 11,999 157,8111998-99 123,227 25,629 292 12,252 161,4001999-00 127,208 26,114 274 12,304 165,9002000-01 132,026 26,666 274 12,279 171,2452001-02 143,853 28,725 287 12,439 185,3042002-03 152,320 30,738 321 12,809 196,1882003-04 156,243 32,385 162 13,106 201,8962004-05 156,066 31,872 127 13,338 201,4032005-06 159,515 32,397 131 13,325 205,3682006-07 166,966 32,882 202 13,596 213,6462007-08 173,703 33,652 350 13,608 221,3132008-09 180,210 33,939 462 13,714 228,3252009-10 183,515 34,673 512 13,913 232,6132010-11 185,442 34,851 504 14,075 234,8722011-12 187,566 34,865 470 14,156 237,0572012-13 (est.) 190,645 35,407 458 14,284 240,794
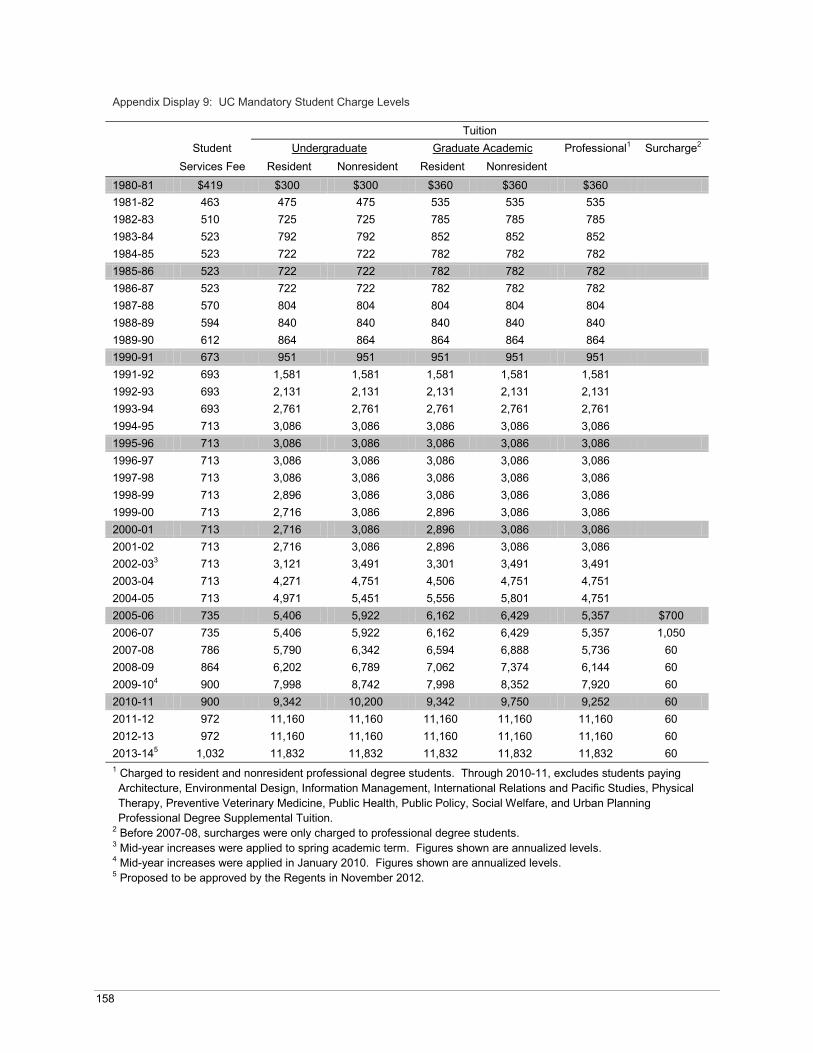
158
Appendix Display 9: UC Mandatory Student Charge Levels
TuitionStudent Undergraduate Graduate Academic Professional1 Surcharge2
Services Fee Resident Nonresident Resident Nonresident1980-81 $419 $300 $300 $360 $360 $3601981-82 463 475 475 535 535 5351982-83 510 725 725 785 785 7851983-84 523 792 792 852 852 8521984-85 523 722 722 782 782 7821985-86 523 722 722 782 782 7821986-87 523 722 722 782 782 7821987-88 570 804 804 804 804 8041988-89 594 840 840 840 840 8401989-90 612 864 864 864 864 8641990-91 673 951 951 951 951 9511991-92 693 1,581 1,581 1,581 1,581 1,5811992-93 693 2,131 2,131 2,131 2,131 2,1311993-94 693 2,761 2,761 2,761 2,761 2,7611994-95 713 3,086 3,086 3,086 3,086 3,0861995-96 713 3,086 3,086 3,086 3,086 3,0861996-97 713 3,086 3,086 3,086 3,086 3,0861997-98 713 3,086 3,086 3,086 3,086 3,0861998-99 713 2,896 3,086 3,086 3,086 3,0861999-00 713 2,716 3,086 2,896 3,086 3,0862000-01 713 2,716 3,086 2,896 3,086 3,0862001-02 713 2,716 3,086 2,896 3,086 3,0862002-033 713 3,121 3,491 3,301 3,491 3,4912003-04 713 4,271 4,751 4,506 4,751 4,7512004-05 713 4,971 5,451 5,556 5,801 4,7512005-06 735 5,406 5,922 6,162 6,429 5,357 $7002006-07 735 5,406 5,922 6,162 6,429 5,357 1,0502007-08 786 5,790 6,342 6,594 6,888 5,736 602008-09 864 6,202 6,789 7,062 7,374 6,144 602009-104 900 7,998 8,742 7,998 8,352 7,920 602010-11 900 9,342 10,200 9,342 9,750 9,252 602011-12 972 11,160 11,160 11,160 11,160 11,160 602012-13 972 11,160 11,160 11,160 11,160 11,160 602013-145 1,032 11,832 11,832 11,832 11,832 11,832 601 Charged to resident and nonresident professional degree students. Through 2010-11, excludes students paying Architecture, Environmental Design, Information Management, International Relations and Pacific Studies, Physical Therapy, Preventive Veterinary Medicine, Public Health, Public Policy, Social Welfare, and Urban PlanningProfessional Degree Supplemental Tuition.
2 Before 2007-08, surcharges were only charged to professional degree students.3 Mid-year increases were applied to spring academic term. Figures shown are annualized levels.4 Mid-year increases were applied in January 2010. Figures shown are annualized levels.5 Proposed to be approved by the Regents in November 2012.
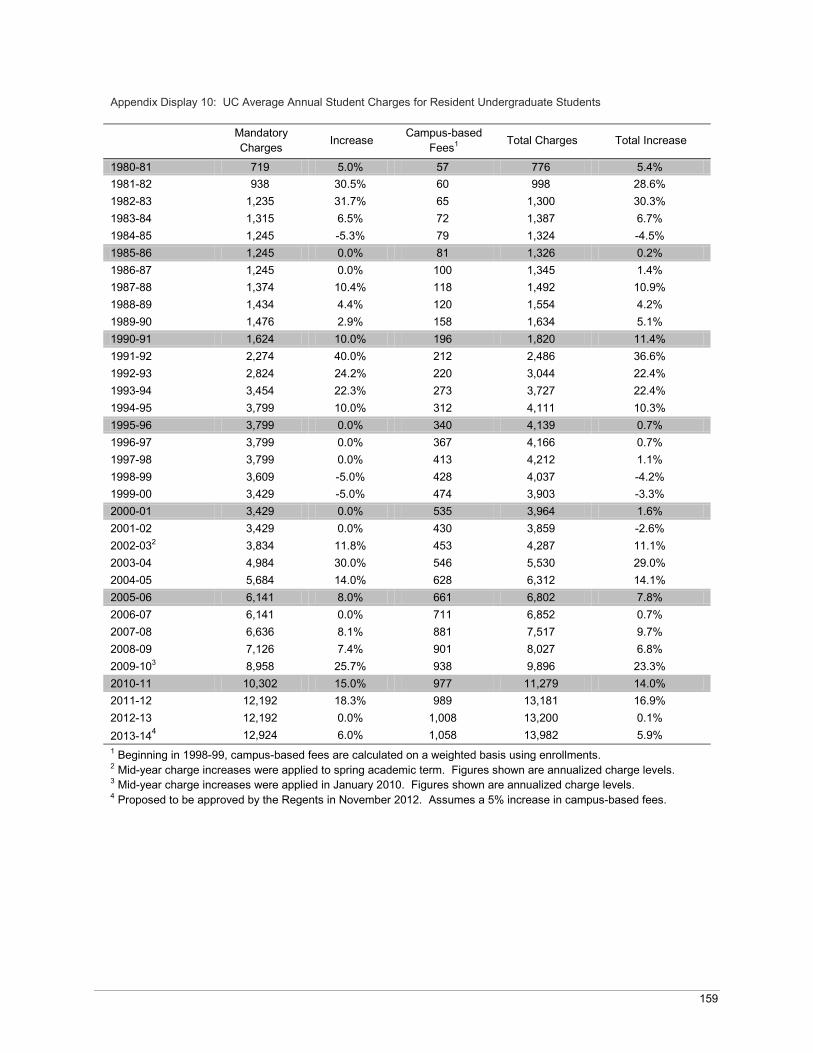
159
Appendix Display 10: UC Average Annual Student Charges for Resident Undergraduate Students
Mandatory Charges Increase Campus-based
Fees1 Total Charges Total Increase
1980-81 719 5.0% 57 776 5.4%1981-82 938 30.5% 60 998 28.6%1982-83 1,235 31.7% 65 1,300 30.3%1983-84 1,315 6.5% 72 1,387 6.7%1984-85 1,245 -5.3% 79 1,324 -4.5%1985-86 1,245 0.0% 81 1,326 0.2%1986-87 1,245 0.0% 100 1,345 1.4%1987-88 1,374 10.4% 118 1,492 10.9%1988-89 1,434 4.4% 120 1,554 4.2%1989-90 1,476 2.9% 158 1,634 5.1%1990-91 1,624 10.0% 196 1,820 11.4%1991-92 2,274 40.0% 212 2,486 36.6%1992-93 2,824 24.2% 220 3,044 22.4%1993-94 3,454 22.3% 273 3,727 22.4%1994-95 3,799 10.0% 312 4,111 10.3%1995-96 3,799 0.0% 340 4,139 0.7%1996-97 3,799 0.0% 367 4,166 0.7%1997-98 3,799 0.0% 413 4,212 1.1%1998-99 3,609 -5.0% 428 4,037 -4.2%1999-00 3,429 -5.0% 474 3,903 -3.3%2000-01 3,429 0.0% 535 3,964 1.6%2001-02 3,429 0.0% 430 3,859 -2.6%2002-032 3,834 11.8% 453 4,287 11.1%2003-04 4,984 30.0% 546 5,530 29.0%2004-05 5,684 14.0% 628 6,312 14.1%2005-06 6,141 8.0% 661 6,802 7.8%2006-07 6,141 0.0% 711 6,852 0.7%2007-08 6,636 8.1% 881 7,517 9.7%2008-09 7,126 7.4% 901 8,027 6.8%2009-103 8,958 25.7% 938 9,896 23.3%2010-11 10,302 15.0% 977 11,279 14.0%2011-12 12,192 18.3% 989 13,181 16.9%2012-13 12,192 0.0% 1,008 13,200 0.1%2013-144 12,924 6.0% 1,058 13,982 5.9%1 Beginning in 1998-99, campus-based fees are calculated on a weighted basis using enrollments.2 Mid-year charge increases were applied to spring academic term. Figures shown are annualized charge levels.3 Mid-year charge increases were applied in January 2010. Figures shown are annualized charge levels.4 Proposed to be approved by the Regents in November 2012. Assumes a 5% increase in campus-based fees.
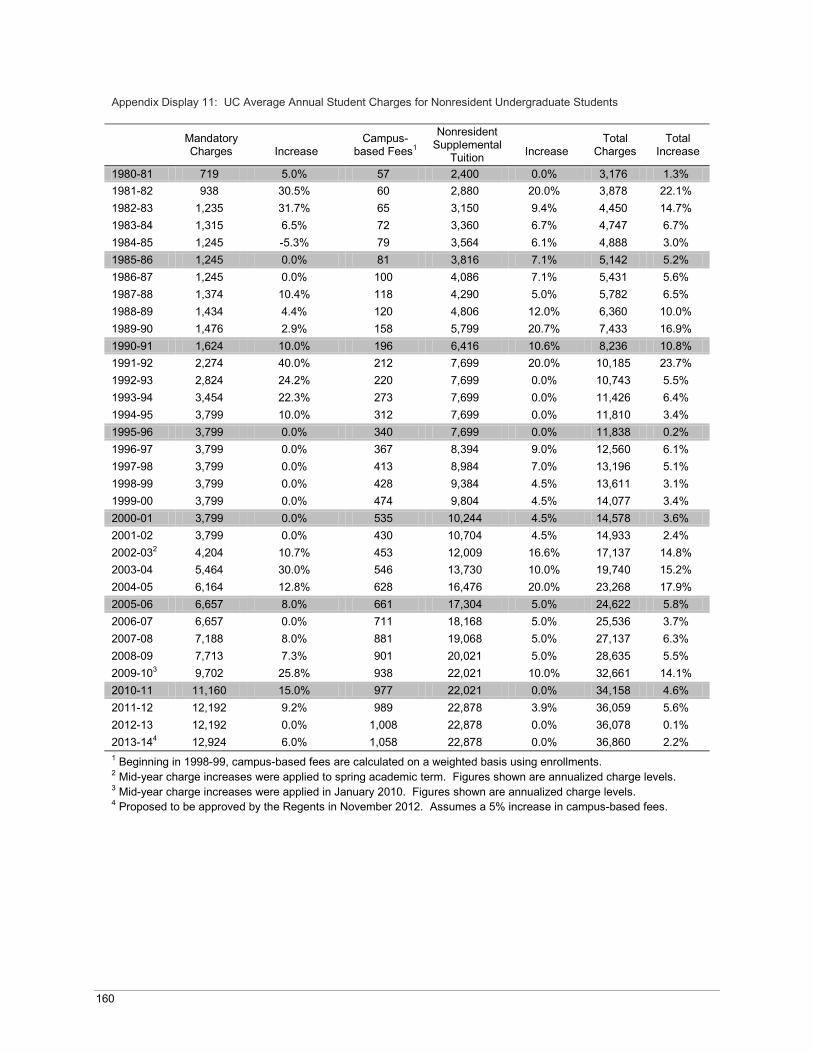
160
Appendix Display 11: UC Average Annual Student Charges for Nonresident Undergraduate Students
Mandatory Charges Increase
Campus-based Fees1
NonresidentSupplemental
Tuition IncreaseTotal
ChargesTotal
Increase
1980-81 719 5.0% 57 2,400 0.0% 3,176 1.3%1981-82 938 30.5% 60 2,880 20.0% 3,878 22.1%1982-83 1,235 31.7% 65 3,150 9.4% 4,450 14.7%1983-84 1,315 6.5% 72 3,360 6.7% 4,747 6.7%1984-85 1,245 -5.3% 79 3,564 6.1% 4,888 3.0%1985-86 1,245 0.0% 81 3,816 7.1% 5,142 5.2%1986-87 1,245 0.0% 100 4,086 7.1% 5,431 5.6%1987-88 1,374 10.4% 118 4,290 5.0% 5,782 6.5%1988-89 1,434 4.4% 120 4,806 12.0% 6,360 10.0%1989-90 1,476 2.9% 158 5,799 20.7% 7,433 16.9%1990-91 1,624 10.0% 196 6,416 10.6% 8,236 10.8%1991-92 2,274 40.0% 212 7,699 20.0% 10,185 23.7%1992-93 2,824 24.2% 220 7,699 0.0% 10,743 5.5%1993-94 3,454 22.3% 273 7,699 0.0% 11,426 6.4%1994-95 3,799 10.0% 312 7,699 0.0% 11,810 3.4%1995-96 3,799 0.0% 340 7,699 0.0% 11,838 0.2%1996-97 3,799 0.0% 367 8,394 9.0% 12,560 6.1%1997-98 3,799 0.0% 413 8,984 7.0% 13,196 5.1%1998-99 3,799 0.0% 428 9,384 4.5% 13,611 3.1%1999-00 3,799 0.0% 474 9,804 4.5% 14,077 3.4%2000-01 3,799 0.0% 535 10,244 4.5% 14,578 3.6%2001-02 3,799 0.0% 430 10,704 4.5% 14,933 2.4%2002-032 4,204 10.7% 453 12,009 16.6% 17,137 14.8%2003-04 5,464 30.0% 546 13,730 10.0% 19,740 15.2%2004-05 6,164 12.8% 628 16,476 20.0% 23,268 17.9%2005-06 6,657 8.0% 661 17,304 5.0% 24,622 5.8%2006-07 6,657 0.0% 711 18,168 5.0% 25,536 3.7%2007-08 7,188 8.0% 881 19,068 5.0% 27,137 6.3%2008-09 7,713 7.3% 901 20,021 5.0% 28,635 5.5%2009-103 9,702 25.8% 938 22,021 10.0% 32,661 14.1%2010-11 11,160 15.0% 977 22,021 0.0% 34,158 4.6%2011-12 12,192 9.2% 989 22,878 3.9% 36,059 5.6%2012-13 12,192 0.0% 1,008 22,878 0.0% 36,078 0.1%2013-144 12,924 6.0% 1,058 22,878 0.0% 36,860 2.2%1 Beginning in 1998-99, campus-based fees are calculated on a weighted basis using enrollments.2 Mid-year charge increases were applied to spring academic term. Figures shown are annualized charge levels.3 Mid-year charge increases were applied in January 2010. Figures shown are annualized charge levels.4 Proposed to be approved by the Regents in November 2012. Assumes a 5% increase in campus-based fees.
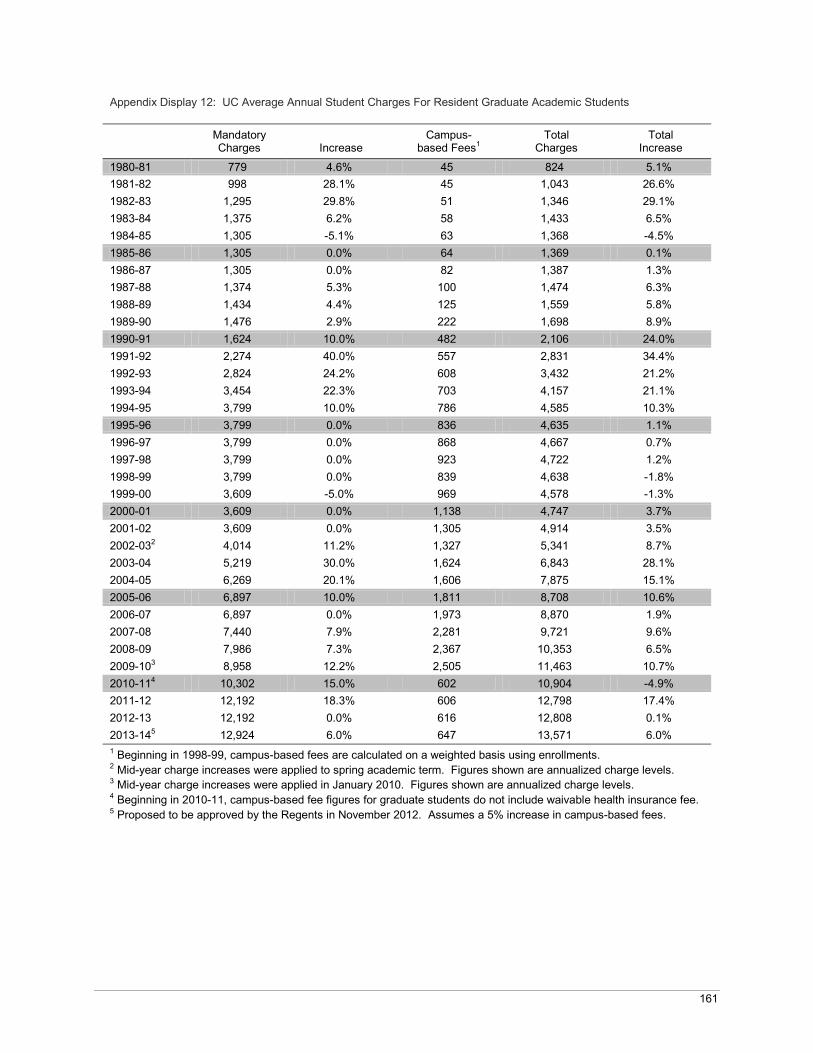
161
Appendix Display 12: UC Average Annual Student Charges For Resident Graduate Academic Students
Mandatory Charges Increase
Campus-based Fees1
TotalCharges
TotalIncrease
1980-81 779 4.6% 45 824 5.1%1981-82 998 28.1% 45 1,043 26.6%1982-83 1,295 29.8% 51 1,346 29.1%1983-84 1,375 6.2% 58 1,433 6.5%1984-85 1,305 -5.1% 63 1,368 -4.5%1985-86 1,305 0.0% 64 1,369 0.1%1986-87 1,305 0.0% 82 1,387 1.3%1987-88 1,374 5.3% 100 1,474 6.3%1988-89 1,434 4.4% 125 1,559 5.8%1989-90 1,476 2.9% 222 1,698 8.9%1990-91 1,624 10.0% 482 2,106 24.0%1991-92 2,274 40.0% 557 2,831 34.4%1992-93 2,824 24.2% 608 3,432 21.2%1993-94 3,454 22.3% 703 4,157 21.1%1994-95 3,799 10.0% 786 4,585 10.3%1995-96 3,799 0.0% 836 4,635 1.1%1996-97 3,799 0.0% 868 4,667 0.7%1997-98 3,799 0.0% 923 4,722 1.2%1998-99 3,799 0.0% 839 4,638 -1.8%1999-00 3,609 -5.0% 969 4,578 -1.3%2000-01 3,609 0.0% 1,138 4,747 3.7%2001-02 3,609 0.0% 1,305 4,914 3.5%2002-032 4,014 11.2% 1,327 5,341 8.7%2003-04 5,219 30.0% 1,624 6,843 28.1%2004-05 6,269 20.1% 1,606 7,875 15.1%2005-06 6,897 10.0% 1,811 8,708 10.6%2006-07 6,897 0.0% 1,973 8,870 1.9%2007-08 7,440 7.9% 2,281 9,721 9.6%2008-09 7,986 7.3% 2,367 10,353 6.5%2009-103 8,958 12.2% 2,505 11,463 10.7%2010-114 10,302 15.0% 602 10,904 -4.9%2011-12 12,192 18.3% 606 12,798 17.4%2012-13 12,192 0.0% 616 12,808 0.1%2013-145 12,924 6.0% 647 13,571 6.0%1 Beginning in 1998-99, campus-based fees are calculated on a weighted basis using enrollments.2 Mid-year charge increases were applied to spring academic term. Figures shown are annualized charge levels.3 Mid-year charge increases were applied in January 2010. Figures shown are annualized charge levels.4 Beginning in 2010-11, campus-based fee figures for graduate students do not include waivable health insurance fee.5 Proposed to be approved by the Regents in November 2012. Assumes a 5% increase in campus-based fees.
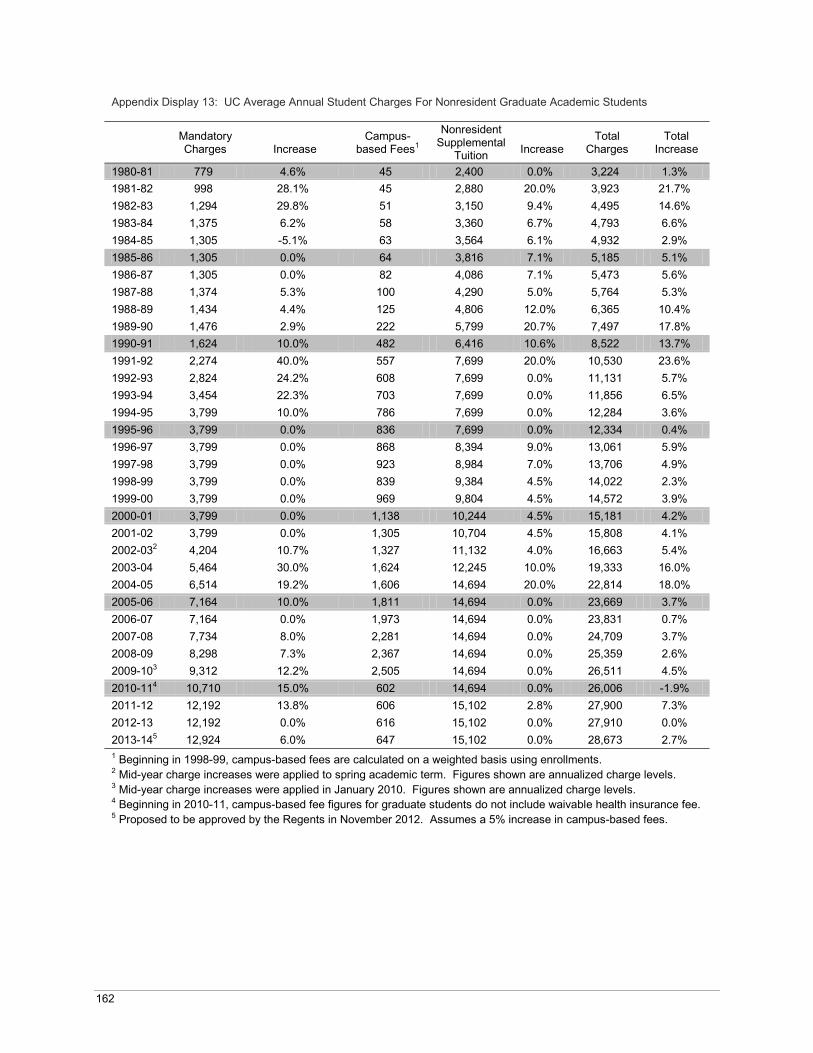
162
Appendix Display 13: UC Average Annual Student Charges For Nonresident Graduate Academic Students
Mandatory Charges Increase
Campus-based Fees1
NonresidentSupplemental
Tuition IncreaseTotal
Charges Total
Increase
1980-81 779 4.6% 45 2,400 0.0% 3,224 1.3%1981-82 998 28.1% 45 2,880 20.0% 3,923 21.7%1982-83 1,294 29.8% 51 3,150 9.4% 4,495 14.6%1983-84 1,375 6.2% 58 3,360 6.7% 4,793 6.6%1984-85 1,305 -5.1% 63 3,564 6.1% 4,932 2.9%1985-86 1,305 0.0% 64 3,816 7.1% 5,185 5.1%1986-87 1,305 0.0% 82 4,086 7.1% 5,473 5.6%1987-88 1,374 5.3% 100 4,290 5.0% 5,764 5.3%1988-89 1,434 4.4% 125 4,806 12.0% 6,365 10.4%1989-90 1,476 2.9% 222 5,799 20.7% 7,497 17.8%1990-91 1,624 10.0% 482 6,416 10.6% 8,522 13.7%1991-92 2,274 40.0% 557 7,699 20.0% 10,530 23.6%1992-93 2,824 24.2% 608 7,699 0.0% 11,131 5.7%1993-94 3,454 22.3% 703 7,699 0.0% 11,856 6.5%1994-95 3,799 10.0% 786 7,699 0.0% 12,284 3.6%1995-96 3,799 0.0% 836 7,699 0.0% 12,334 0.4%1996-97 3,799 0.0% 868 8,394 9.0% 13,061 5.9%1997-98 3,799 0.0% 923 8,984 7.0% 13,706 4.9%1998-99 3,799 0.0% 839 9,384 4.5% 14,022 2.3%1999-00 3,799 0.0% 969 9,804 4.5% 14,572 3.9%2000-01 3,799 0.0% 1,138 10,244 4.5% 15,181 4.2%2001-02 3,799 0.0% 1,305 10,704 4.5% 15,808 4.1%2002-032 4,204 10.7% 1,327 11,132 4.0% 16,663 5.4%2003-04 5,464 30.0% 1,624 12,245 10.0% 19,333 16.0%2004-05 6,514 19.2% 1,606 14,694 20.0% 22,814 18.0%2005-06 7,164 10.0% 1,811 14,694 0.0% 23,669 3.7%2006-07 7,164 0.0% 1,973 14,694 0.0% 23,831 0.7%2007-08 7,734 8.0% 2,281 14,694 0.0% 24,709 3.7%2008-09 8,298 7.3% 2,367 14,694 0.0% 25,359 2.6%2009-103 9,312 12.2% 2,505 14,694 0.0% 26,511 4.5%2010-114 10,710 15.0% 602 14,694 0.0% 26,006 -1.9%2011-12 12,192 13.8% 606 15,102 2.8% 27,900 7.3%2012-13 12,192 0.0% 616 15,102 0.0% 27,910 0.0%2013-145 12,924 6.0% 647 15,102 0.0% 28,673 2.7%1 Beginning in 1998-99, campus-based fees are calculated on a weighted basis using enrollments.2 Mid-year charge increases were applied to spring academic term. Figures shown are annualized charge levels.3 Mid-year charge increases were applied in January 2010. Figures shown are annualized charge levels.4 Beginning in 2010-11, campus-based fee figures for graduate students do not include waivable health insurance fee.5 Proposed to be approved by the Regents in November 2012. Assumes a 5% increase in campus-based fees.
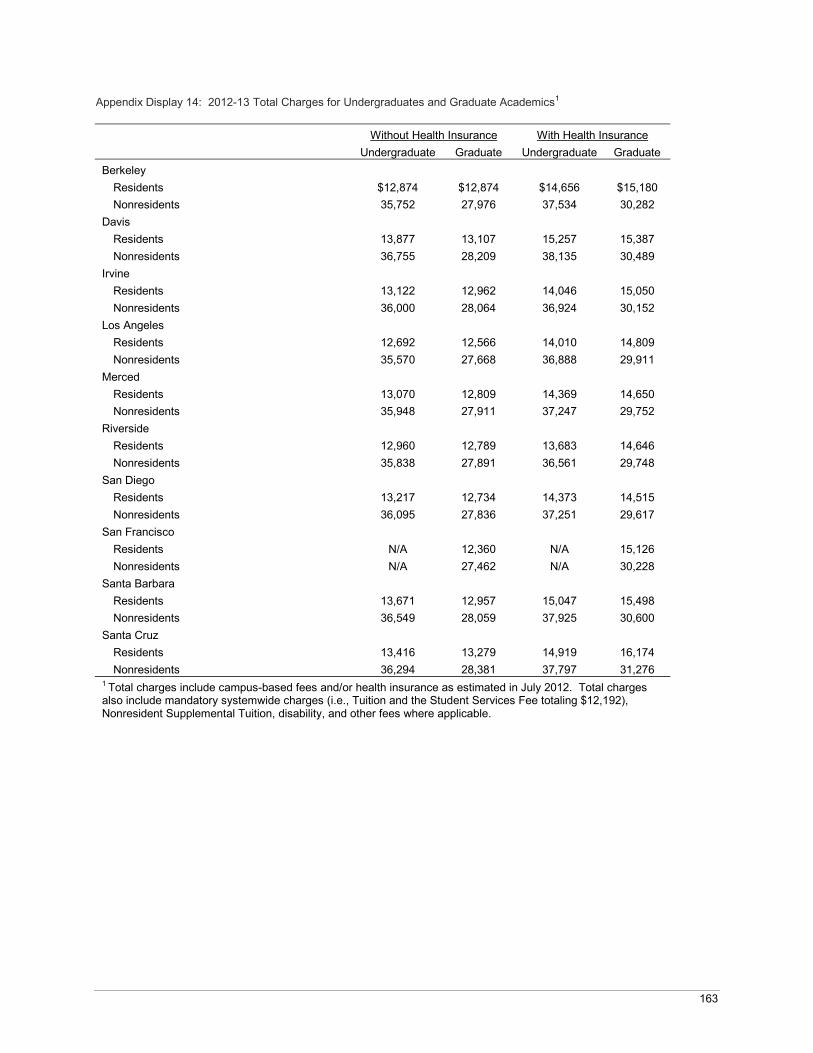
163
Appendix Display 14: 2012-13 Total Charges for Undergraduates and Graduate Academics1
Without Health Insurance With Health InsuranceUndergraduate Graduate Undergraduate Graduate
BerkeleyResidents $12,874 $12,874 $14,656 $15,180Nonresidents 35,752 27,976 37,534 30,282
DavisResidents 13,877 13,107 15,257 15,387Nonresidents 36,755 28,209 38,135 30,489
IrvineResidents 13,122 12,962 14,046 15,050Nonresidents 36,000 28,064 36,924 30,152
Los AngelesResidents 12,692 12,566 14,010 14,809Nonresidents 35,570 27,668 36,888 29,911
MercedResidents 13,070 12,809 14,369 14,650Nonresidents 35,948 27,911 37,247 29,752
RiversideResidents 12,960 12,789 13,683 14,646Nonresidents 35,838 27,891 36,561 29,748
San DiegoResidents 13,217 12,734 14,373 14,515Nonresidents 36,095 27,836 37,251 29,617
San FranciscoResidents N/A 12,360 N/A 15,126Nonresidents N/A 27,462 N/A 30,228
Santa BarbaraResidents 13,671 12,957 15,047 15,498Nonresidents 36,549 28,059 37,925 30,600
Santa CruzResidents 13,416 13,279 14,919 16,174Nonresidents 36,294 28,381 37,797 31,276
1 Total charges include campus-based fees and/or health insurance as estimated in July 2012. Total charges also include mandatory systemwide charges (i.e., Tuition and the Student Services Fee totaling $12,192), Nonresident Supplemental Tuition, disability, and other fees where applicable.
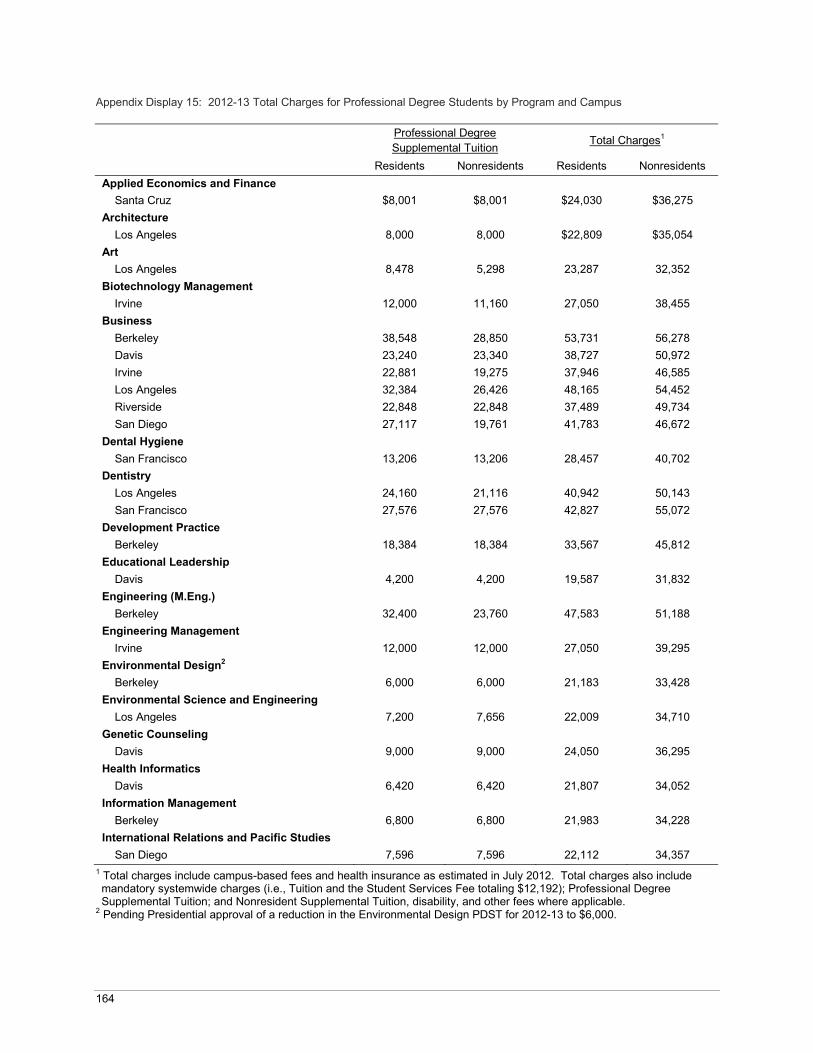
164
Appendix Display 15: 2012-13 Total Charges for Professional Degree Students by Program and Campus
Professional Degree Supplemental Tuition Total Charges1
Residents Nonresidents Residents NonresidentsApplied Economics and Finance
Santa Cruz $8,001 $8,001 $24,030 $36,275Architecture
Los Angeles 8,000 8,000 $22,809 $35,054Art
Los Angeles 8,478 5,298 23,287 32,352Biotechnology Management
Irvine 12,000 11,160 27,050 38,455Business
Berkeley 38,548 28,850 53,731 56,278Davis 23,240 23,340 38,727 50,972Irvine 22,881 19,275 37,946 46,585Los Angeles 32,384 26,426 48,165 54,452Riverside 22,848 22,848 37,489 49,734San Diego 27,117 19,761 41,783 46,672
Dental HygieneSan Francisco 13,206 13,206 28,457 40,702
DentistryLos Angeles 24,160 21,116 40,942 50,143San Francisco 27,576 27,576 42,827 55,072
Development PracticeBerkeley 18,384 18,384 33,567 45,812
Educational LeadershipDavis 4,200 4,200 19,587 31,832
Engineering (M.Eng.)Berkeley 32,400 23,760 47,583 51,188
Engineering ManagementIrvine 12,000 12,000 27,050 39,295
Environmental Design2
Berkeley 6,000 6,000 21,183 33,428Environmental Science and Engineering
Los Angeles 7,200 7,656 22,009 34,710Genetic Counseling
Davis 9,000 9,000 24,050 36,295Health Informatics
Davis 6,420 6,420 21,807 34,052Information Management
Berkeley 6,800 6,800 21,983 34,228International Relations and Pacific Studies
San Diego 7,596 7,596 22,112 34,3571 Total charges include campus-based fees and health insurance as estimated in July 2012. Total charges also include mandatory systemwide charges (i.e., Tuition and the Student Services Fee totaling $12,192); Professional Degree Supplemental Tuition; and Nonresident Supplemental Tuition, disability, and other fees where applicable.
2 Pending Presidential approval of a reduction in the Environmental Design PDST for 2012-13 to $6,000.
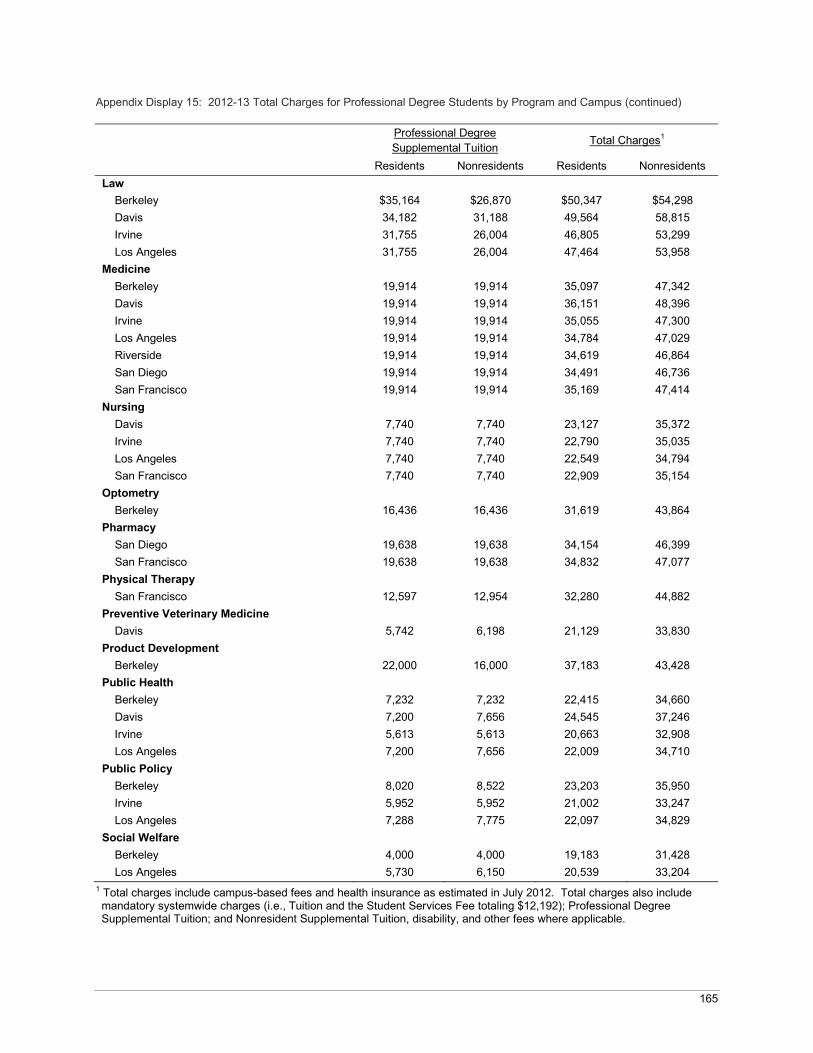
165
Appendix Display 15: 2012-13 Total Charges for Professional Degree Students by Program and Campus (continued)
Professional Degree Supplemental Tuition Total Charges1
Residents Nonresidents Residents NonresidentsLaw
Berkeley $35,164 $26,870 $50,347 $54,298Davis 34,182 31,188 49,564 58,815Irvine 31,755 26,004 46,805 53,299Los Angeles 31,755 26,004 47,464 53,958
MedicineBerkeley 19,914 19,914 35,097 47,342Davis 19,914 19,914 36,151 48,396Irvine 19,914 19,914 35,055 47,300Los Angeles 19,914 19,914 34,784 47,029Riverside 19,914 19,914 34,619 46,864San Diego 19,914 19,914 34,491 46,736San Francisco 19,914 19,914 35,169 47,414
NursingDavis 7,740 7,740 23,127 35,372Irvine 7,740 7,740 22,790 35,035Los Angeles 7,740 7,740 22,549 34,794San Francisco 7,740 7,740 22,909 35,154
OptometryBerkeley 16,436 16,436 31,619 43,864
PharmacySan Diego 19,638 19,638 34,154 46,399San Francisco 19,638 19,638 34,832 47,077
Physical TherapySan Francisco 12,597 12,954 32,280 44,882
Preventive Veterinary MedicineDavis 5,742 6,198 21,129 33,830
Product DevelopmentBerkeley 22,000 16,000 37,183 43,428
Public HealthBerkeley 7,232 7,232 22,415 34,660Davis 7,200 7,656 24,545 37,246Irvine 5,613 5,613 20,663 32,908Los Angeles 7,200 7,656 22,009 34,710
Public PolicyBerkeley 8,020 8,522 23,203 35,950Irvine 5,952 5,952 21,002 33,247Los Angeles 7,288 7,775 22,097 34,829
Social WelfareBerkeley 4,000 4,000 19,183 31,428Los Angeles 5,730 6,150 20,539 33,204
1 Total charges include campus-based fees and health insurance as estimated in July 2012. Total charges also include mandatory systemwide charges (i.e., Tuition and the Student Services Fee totaling $12,192); Professional Degree Supplemental Tuition; and Nonresident Supplemental Tuition, disability, and other fees where applicable.
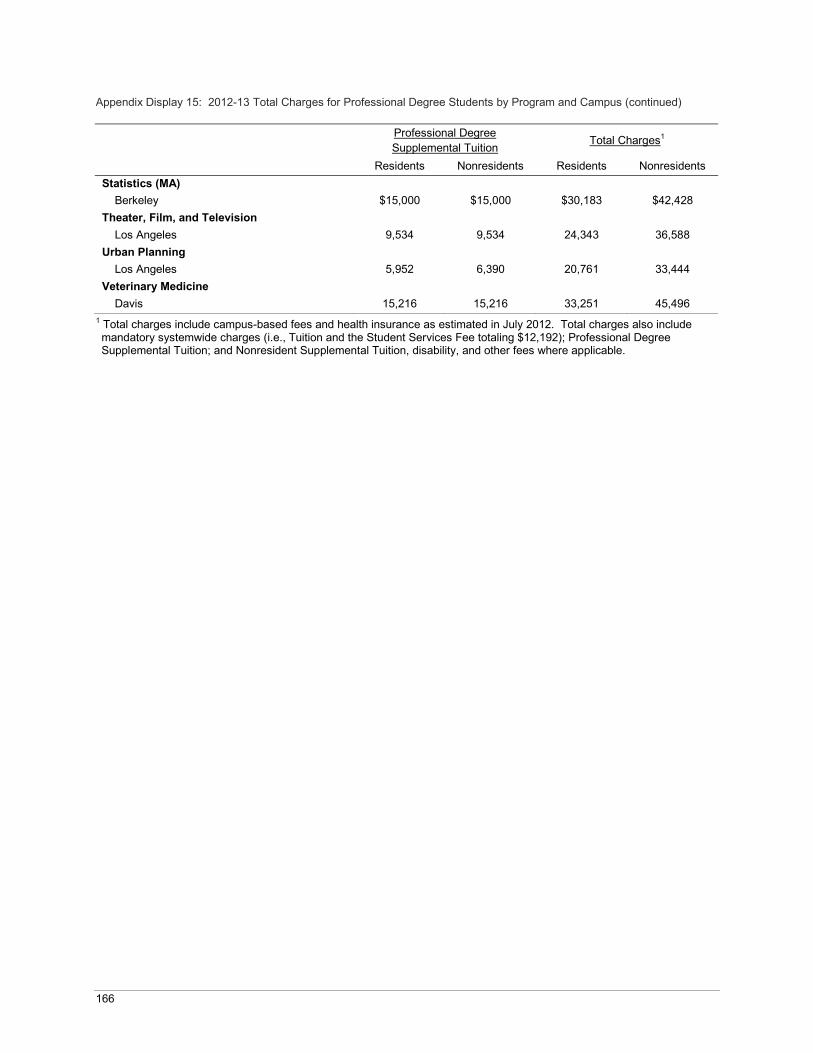
166
Appendix Display 15: 2012-13 Total Charges for Professional Degree Students by Program and Campus (continued)
Professional Degree Supplemental Tuition Total Charges1
Residents Nonresidents Residents NonresidentsStatistics (MA)
Berkeley $15,000 $15,000 $30,183 $42,428Theater, Film, and Television
Los Angeles 9,534 9,534 24,343 36,588Urban Planning
Los Angeles 5,952 6,390 20,761 33,444Veterinary Medicine
Davis 15,216 15,216 33,251 45,4961 Total charges include campus-based fees and health insurance as estimated in July 2012. Total charges also include mandatory systemwide charges (i.e., Tuition and the Student Services Fee totaling $12,192); Professional Degree Supplemental Tuition; and Nonresident Supplemental Tuition, disability, and other fees where applicable.
167
Index Academic support, 77-82 Admission to UC, 40-41 Administrative efficiencies, 24-26 Agricultural Experiment Stations (AES), 67-68 Agriculture and Natural Resources (ANR), 67-68, 74-75 Annuitant benefits, 125, 132-133 ARRA, 61-62 Articulation agreements, 43 ASSIST, 43, 72 Auxiliary enterprises, 16, 122-123 Blue and Gold Opportunity Plan, 111, 112, 114 Bookstores, 123 Budget cuts, 22-30 Campus actions to address budget cuts, 23-24 History of UC budget, 136-149 Systemwide actions to address budget cuts, 20, 22-24 Budget request display, 150 Cal Grants, 112-113, 118 California Digital Library, 77-79 California Institutes for Science and Innovation, 65-66 California Master Plan for Higher Education, 7, 31-47, 59,
104-109, 137-141 California State Summer School for Mathematics and
Science (COSMOS), 73-74 California Subject Matter Project, 73 Campus actions to address budget cuts, 23-24 Campus-based fees, 107-108 Capital renewal, 101-102 Clinical teaching support, 85 Commission on the Future, 22, 24 Community College Articulation Agreements, 42-43, 72 Community College transfer eligibility and admission, 42-43 Community College Transfer Programs, 72 Compact, 13, 30, 34, 36, 90, 96, 128, 137-149 Compensation, 125-133 Continuation costs, 126 Contract and Grant Administration, 20 Cooperative Extension, 74-75 Core academic support, 30 Core funds, 10 Costs, Continuation costs, 126 Cost of attendance and student fees, 104-108 Cost of living adjustments, COLAs (see General Range
Adjustment) Energy costs, 95, 97, 133 Federal indirect cost reimbursement, 17 Course Materials and Services Fees, 108 Debt service payments, 22, 124 Deferred maintenance, 95, 101-102, 124 Department of Energy Laboratory Management, 20, 134-
135
Diversity, 27-30 Drew University of Medicine and Science, 76 EAOP, 71 Education Financing Model, 115-116 Eligibility for admission, 40-43 Employee benefits, 27, 128-130 Endowments, 18-19 Energy costs, 95-97, 133 Enrollment, General campus, 46 Graduate enrollment, 46-49 Health sciences, 52-56 Nonresident, 43-44 Summer sessions, 44, 57-58 Equity compensation increases, 126 Facilities needs, 95-97 Faculty honors and awards, 5 Faculty housing, 122 Faculty salaries, 126-127 Federal economic stimulus funds, 61-62 Federal funding, Financial aid, 114 Research, 61 Federal indirect cost reimbursement, 17 Federal research awards, 59-62 Fees (see Student Tuition and Fees) Financial aid, Cal Grants, 108, 112-113, 118 Federal funding, 114 Graduate student support, 118-120 Institutional support, 104 Other sources of support, 120-121
Pell Grant recipients, 111, 115 Policy, 103-109 Private support, 19-20, 114 Professional school student aid, 120
Undergraduate support, 115-117 Freshman eligibility and admission, 40-41 Funding Streams, 20-21, 91 Funds, Core funds, 10-15 Federal funding, 16-18, 59-62 Federal Economic Stimulus funds, 61-62 Medi-Cal funds, 15, 18, 84 Medicare funds, 15, 18, 84 “Off-the-Top” funds, 17, 20 State General Funds, 11, 62-63 State Special Funds, 18 UC General Funds, 12 University Opportunity Funds, 20-21, 114 Furlough (see Salary Reduction Plan/Furlough Plan) General campus instruction, 31-50
Index
168
General Range Adjustment, 125-128 Graduate and Professional School Preparation programs, 72-73 Graduate student enrollment, 46-49 Graduate student support, 112, 114, 119 Graduation rates, 45-46 Growth in nonacademic personnel, 92-94 Health care reform, 86 Health sciences enrollments, 52-56 Health sciences instruction, 51-56 History of student fees, 109-110 History of UC budget, 136-149 Housing, Student, Faculty and Staff, 122-123 Information technology, 23-30 Institute of Transportation Studies, 67 Institutional support, 90-94 Instructional equipment replacement, 31, 35, 43 Invention disclosures, 64 Kashmiri lawsuit, 110 Labor research, 68-69 Lease revenue bond payments, 124 Libraries, 77-80 Long range planning, 34 Luquetta lawsuit, 103-110 Maintenance of new space, 96-97 Marginal cost of instruction, 34-35 Market and equity compensation increases, 126 Mathematics, Engineering, Science Achievement (MESA), 71 Medi-Cal funds, 15, 18, 85 Medicare funds, 15, 18, 85 Merced campus, 36-42 Merit salary increases, 125-128 Multi-campus Research Programs and Initiatives (MRPIs), 66-67 Nonresident enrollment, 43-44 Nonresident Supplemental Tuition, 103-108 Non-salary price increases, 133 Nursing, 54-55 “Off-the-Top” funds, 17, 20 Online Instruction, 49-50 Operation and maintenance of plant (OMP), 95-102 Support for new space, 96-97 Opportunity funds, 17, 20-21 Outreach (see Student Academic Preparation and
Educational Partnerships) Parking, 123 Patent revenue, 21 Pell Grant recipients, 111, 115, 118 Pension benefits, 130-132 Persistence rates, 45 Pharmacy, 51-52 Price increases, 125 Private support, 10, 19-20 Professional Degree Supplemental Tuition, 103, 106-110 Financial aid, 113, 120 PRograms In Medical Education (PRIME), 52-54
Public health, 48, 52 Public service, 69-76 Puente, 71-72 Purchased utilities, 97-98 Rebenching, 21 Research, 59-69 Retirement contributions, 125-132 Return-to-aid, 108 Riverside Medical School, 55-56 Salaries, 126-128 Salary Reduction/Furlough Plan, 22, 125, 128 Self-supporting degree programs, 57-58 State Agency Agreements, 17, 62-63 State General Funds, 11 State Special Funds, 18 Student Academic Preparation and Educational
Partnerships, 69-71 Funding, 69 History, 70 Student-Initiated Programs, 72 Student-faculty ratio, 34, 39-40 Student mental health services, 88-89 Student services, 87-89 Student Services Fee, 87-88 Student Tuition and Fees, 103-110 Campus-based fees, 107-108 Comparison institutions, 108-109 Course Materials and Services Fees, 108 Fees vs. tuition, 105 History, 109-110 Nonresident Supplemental Tuition, 106-107 Professional Degree Supplemental Tuition, 105-106 Student Services Fee, 105 Tuition, 104 Summer instruction, 44, 57-58 Systemwide actions to address budget cuts, 20, 22-24 Teaching hospitals, 15, 83-86 Technology transfer, 63 Telemedicine, 53 Time to degree, 45-46 Transfer eligibility and admission, 41-43 Tuition, 12 UC General Funds, 10 UC Office of the President restructuring, 22, 91 UC Retirement Plan (UCRP), 27, 130-133 Undergraduate support, 115-118 University Extension, 16, 57 University Opportunity Fund, 16, 20 Working Smarter, 24-27

University of CaliforniaOffice of the President
Budget and Capital Resources1111 Franklin Street, 6th Floor
Oakland, California 94607-5200510-987-0648
http://budget.ucop.edu
University of CaliforniaOffice of the President
Budget and Capital Resources1111 Franklin Street, 6th Floor
Oakland, California 94607-5200510-987-0648
http://budget.ucop.edu

Budget for Current Operations
2013-14
summary and detail
UN
IVE
RS
ITY
OF
CA
LIFOR
NIA
20
13-14 B
UD
GE
T FO
R C
UR
RE
NT
OP
ER
AT
ION
S