Embed Size (px)
Citation preview
1
Budget 2017
• Key figures for the Norwegian economy• Main figures of the Fiscal Budget• Direct and indirect tax rates
Norwegian Ministryof Finance

2
3
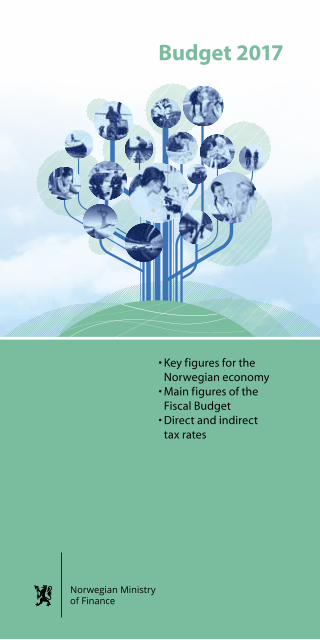
Main figures of the Fiscal Budget and the Pension Fund excluding borrowing and lending transactions for 2016 and 2017 (NOK million)
Estimated accounts
2016
Adoptedbudget
2017
Total revenue of the Fiscal Budget 1 158 390 1 180 571 Revenue from petroleum activities 149 671 163 771 Revenue excluding petroleum revenue 1 008 719 1 016 800
Total expenditure of the Fiscal Budget 1 249 234 1 301 806 Expenditure on petroleum activities 28 000 25 500 Expenditure excluding petroleum expenditure 1 221 234 1 276 306
= Fiscal Budget surplus before transfers to the Pension Fund Global -90 845 -121 235
- Net cash flow from petroleum activities 121 671 138 271
= Petroleum adjusted surplus -212 516 -259 506 + Transferred from the Pension Fund Global 212 516 259 506
= Fiscal Budget surplus 0 0+ Net allocated to the Pension Fund Global -90 845 -121 235 + Fund revenue from interest and dividends 200 100 207 500
=Total surplus of the Fiscal Budget and the Pension Fund 109 255 86 265
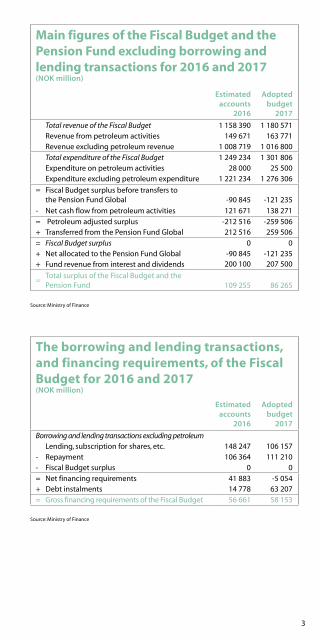
The borrowing and lending transactions, and financing requirements, of the Fiscal Budget for 2016 and 2017 (NOK million)
Estimated accounts
2016
Adoptedbudget
2017
Borrowing and lending transactions excluding petroleumLending, subscription for shares, etc. 148 247 106 157
- Repayment 106 364 111 210 - Fiscal Budget surplus 0 0
= Net financing requirements 41 883 -5 054 + Debt instalments 14 778 63 207
= Gross financing requirements of the Fiscal Budget 56 661 58 153
Source: Ministry of Finance
Source: Ministry of Finance
4
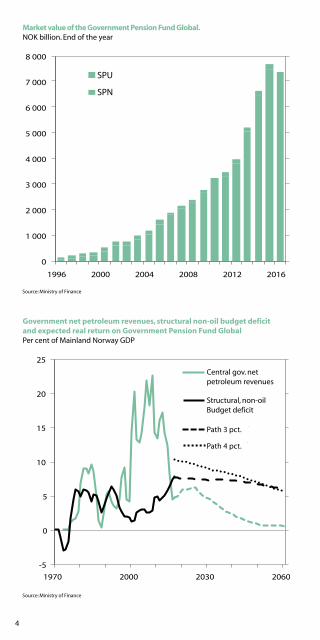
Market value of the Government Pension Fund Global.NOK billion. End of the year
Government net petroleum revenues, structural non-oil budget deficit and expected real return on Government Pension Fund GlobalPer cent of Mainland Norway GDP
Source: Ministry of Finance
Source: Ministry of Finance
0
1 000
2 000
3 000
4 000
5 000
6 000
7 000
8 000
1996 2000 2004 2008 2012 2016
Statens pensjonsfond utland
Statens pensjonsfond Norge
-5
0
5
10
15
20
25
1970 2000 2030 2060
Statens netto kontantstrøm
Strukturelt underskudd
3 pst. uttak
4 pst. uttak
Central gov. netpetroleum revenues
Structural, non-oilBudget deficit
Path 3 pct.
Path 4 pct.
SPU
SPN
5
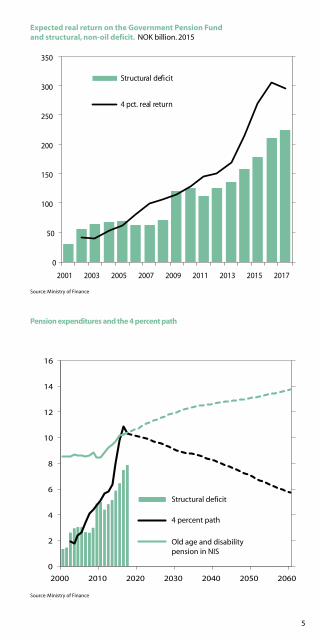
Pension expenditures and the 4 percent path
Expected real return on the Government Pension Fundand structural, non-oil deficit. NOK billion. 2015
Source: Ministry of Finance
Source: Ministry of Finance
0
2
4
6
8
10
12
14
16
2000 2010 2020 2030 2040 2050 2060
Strukturelt underskudd
4-prosentbanen
Alders- og uførepensjon
i folketrygden
0
50
100
150
200
250
300
350
2001 2003 2005 2007 2009 2011 2013 2015 2017
Structural deficit
4 pct. real return
Structural deficit
4 percent path
Old age and disabilitypension in NIS
6
1) Effects of an oil price increase of NOK 10 per barrel.2) Income tax and special tax on petroleum income. Area fee and tax on CO
2 emissions etc.
3) Taxes and excise duties. Net revenues from SDØE (State Direct Financial Interest) and dividends from Statoil.
Sources: Statistics Norway, Ministry of Petroleum and Energy, Ministry of Finance and Macrobond.
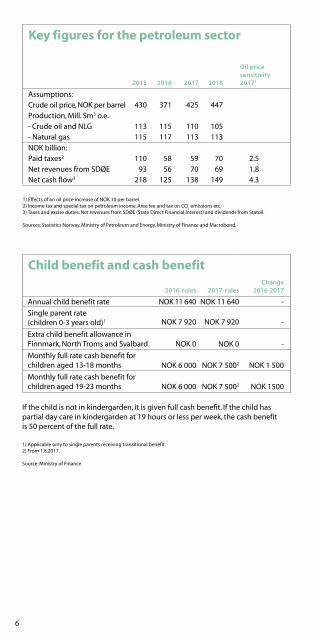
If the child is not in kindergarden, it is given full cash benefit. If the child has partial day care in kindergarden at 19 hours or less per week, the cash benefit is 50 percent of the full rate.
1) Applicable only to single parents receiving transitional benefit.2) From 1.8.2017.
Source: Ministry of Finance
Key figures for the petroleum sector
2015 2016 2017 2018
Oil price sensitivity 20171
Assumptions:Crude oil price, NOK per barrel 430 371 425 447Production, Mill. Sm3 o.e.- Crude oil and NLG 113 115 110 105- Natural gas 115 117 113 113
NOK billion:Paid taxes2 110 58 59 70 2.5Net revenues from SDØE 93 56 70 69 1.8Net cash flow3 218 125 138 149 4.3
Child benefit and cash benefit
2016-rules 2017-rulesChange
2016-2017
Annual child benefit rate NOK 11 640 NOK 11 640 -
Single parent rate (children 0-3 years old)1 NOK 7 920 NOK 7 920 -
Extra child benefit allowance in Finnmark, North Troms and Svalbard NOK 0 NOK 0 -
Monthly full rate cash benefit for children aged 13-18 months NOK 6 000 NOK 7 5002 NOK 1 500
Monthly full rate cash benefit for children aged 19-23 months NOK 6 000 NOK 7 5002 NOK 1500
7
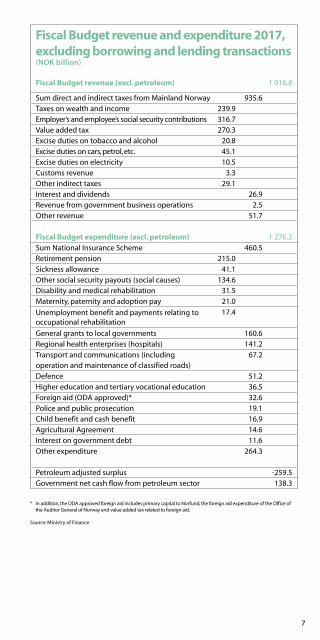
* In addition, the ODA approved foreign aid includes primary capital to Norfund, the foreign aid expenditure of the Office of the Auditor General of Norway and value added tax related to foreign aid.
Source: Ministry of Finance
Fiscal Budget revenue and expenditure 2017, excluding borrowing and lending transactions (NOK billion)
Fiscal Budget revenue (excl. petroleum) 1 016.8
Sum direct and indirect taxes from Mainland Norway 935.6 Taxes on wealth and income 239.9 Employer’s and employee’s social security contributions 316.7 Value added tax 270.3 Excise duties on tobacco and alcohol 20.8 Excise duties on cars, petrol, etc. 45.1 Excise duties on electricity 10.5 Customs revenue 3.3 Other indirect taxes 29.1 Interest and dividends 26.9 Revenue from government business operations 2.5 Other revenue 51.7
Fiscal Budget expenditure (excl. petroleum) 1 276.3
Sum National Insurance Scheme 460.5Retirement pension 215.0Sickness allowance 41.1Other social security payouts (social causes) 134.6Disability and medical rehabilitation 31.5Maternity, paternity and adoption pay 21.0
Unemployment benefit and payments relating to occupational rehabilitation
17.4
General grants to local governments 160.6Regional health enterprises (hospitals) 141.2
Transport and communications (including 67.2operation and maintenance of classified roads)
Defence 51.2Higher education and tertiary vocational education 36.5Foreign aid (ODA approved)* 32.6Police and public prosecution 19.1Child benefit and cash benefit 16.9Agricultural Agreement 14.6Interest on government debt 11.6
Other expenditure 264.3
Petroleum adjusted surplus -259.5Government net cash flow from petroleum sector 138.3
8
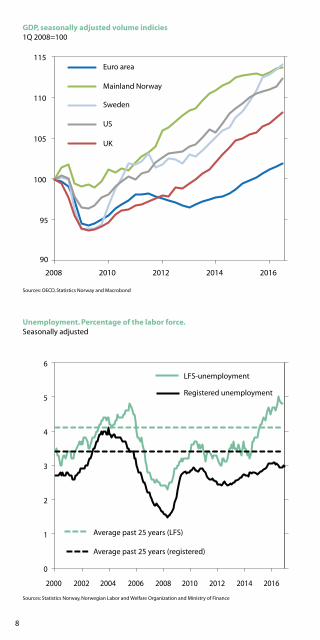
GDP, seasonally adjusted volume indicies1Q 2008=100
Unemployment. Percentage of the labor force.Seasonally adjusted
Sources: OECD, Statistics Norway and Macrobond
Sources: Statistics Norway, Norwegian Labor and Welfare Organization and Ministry of Finance
95
90
100
105
110
115
2008 2010 2012 2014 2016
Euroområdet
Fastlands-Norge
Sverige
USA
UK
0
1 Gj.sn. siste 25 år (AKU)
Gj.sn. siste 25 år (registrert)
2
3
4
5
6
AKU-ledighet
Registrert ledighet
2000 2002 2004 2006 2008 2010 2012 2014 2016
Euro area
LFS-unemployment
Registered unemployment
Average past 25 years (LFS)
Average past 25 years (registered)
Mainland Norway
Sweden
US
UK
9
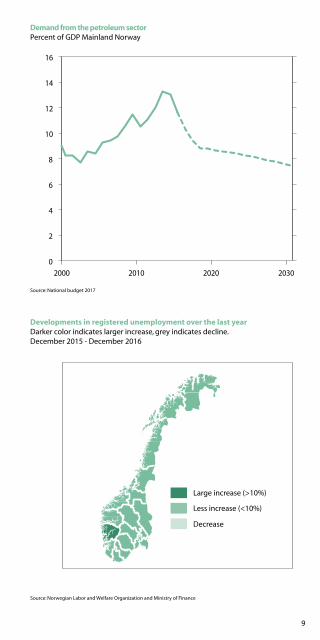
Demand from the petroleum sectorPercent of GDP Mainland Norway
Developments in registered unemployment over the last yearDarker color indicates larger increase, grey indicates decline. December 2015 - December 2016
Source: National budget 2017
Source: Norwegian Labor and Welfare Organization and Ministry of Finance
0
2
4
6
8
10
12
14
16
2000 2010 2020 2030
Large increase (>10%)
Less increase (<10%)
Decrease
10 11
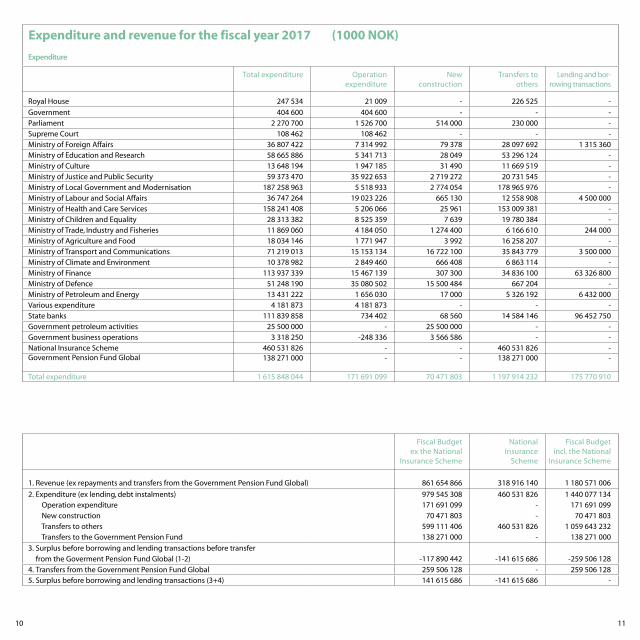
Expenditure and revenue for the fiscal year 2017 (1000 NOK)
Expenditure
Total expenditure Operation expenditure
New construction
Transfers to others
Lending and bor-rowing transactions
Royal House 247 534 21 009 - 226 525 -
Government 404 600 404 600 - - -Parliament 2 270 700 1 526 700 514 000 230 000 -Supreme Court 108 462 108 462 - - -Ministry of Foreign Affairs 36 807 422 7 314 992 79 378 28 097 692 1 315 360Ministry of Education and Research 58 665 886 5 341 713 28 049 53 296 124 -Ministry of Culture 13 648 194 1 947 185 31 490 11 669 519 -Ministry of Justice and Public Security 59 373 470 35 922 653 2 719 272 20 731 545 -Ministry of Local Government and Modernisation 187 258 963 5 518 933 2 774 054 178 965 976 -Ministry of Labour and Social Affairs 36 747 264 19 023 226 665 130 12 558 908 4 500 000Ministry of Health and Care Services 158 241 408 5 206 066 25 961 153 009 381 -Ministry of Children and Equality 28 313 382 8 525 359 7 639 19 780 384 -Ministry of Trade, Industry and Fisheries 11 869 060 4 184 050 1 274 400 6 166 610 244 000Ministry of Agriculture and Food 18 034 146 1 771 947 3 992 16 258 207 -Ministry of Transport and Communications 71 219 013 15 153 134 16 722 100 35 843 779 3 500 000Ministry of Climate and Environment 10 378 982 2 849 460 666 408 6 863 114 -Ministry of Finance 113 937 339 15 467 139 307 300 34 836 100 63 326 800Ministry of Defence 51 248 190 35 080 502 15 500 484 667 204 -Ministry of Petroleum and Energy 13 431 222 1 656 030 17 000 5 326 192 6 432 000Various expenditure 4 181 873 4 181 873 - - -State banks 111 839 858 734 402 68 560 14 584 146 96 452 750Government petroleum activities 25 500 000 - 25 500 000 - -Government business operations 3 318 250 -248 336 3 566 586 - -National Insurance Scheme 460 531 826 - - 460 531 826 -Government Pension Fund Global 138 271 000 - - 138 271 000 -
Total expenditure 1 615 848 044 171 691 099 70 471 803 1 197 914 232 175 770 910
Fiscal Budgetex the National
Insurance Scheme
National Insurance
Scheme
Fiscal Budgetincl. the National
Insurance Scheme
1. Revenue (ex repayments and transfers from the Government Pension Fund Global) 861 654 866 318 916 140 1 180 571 006
2. Expenditure (ex lending, debt instalments) 979 545 308 460 531 826 1 440 077 134 Operation expenditure 171 691 099 - 171 691 099 New construction 70 471 803 - 70 471 803 Transfers to others 599 111 406 460 531 826 1 059 643 232 Transfers to the Government Pension Fund 138 271 000 - 138 271 000
3. Surplus before borrowing and lending transactions before transfer from the Goverment Pension Fund Global (1-2) -117 890 442 -141 615 686 -259 506 128
4. Transfers from the Government Pension Fund Global 259 506 128 - 259 506 1285. Surplus before borrowing and lending transactions (3+4) 141 615 686 -141 615 686 -
12 13
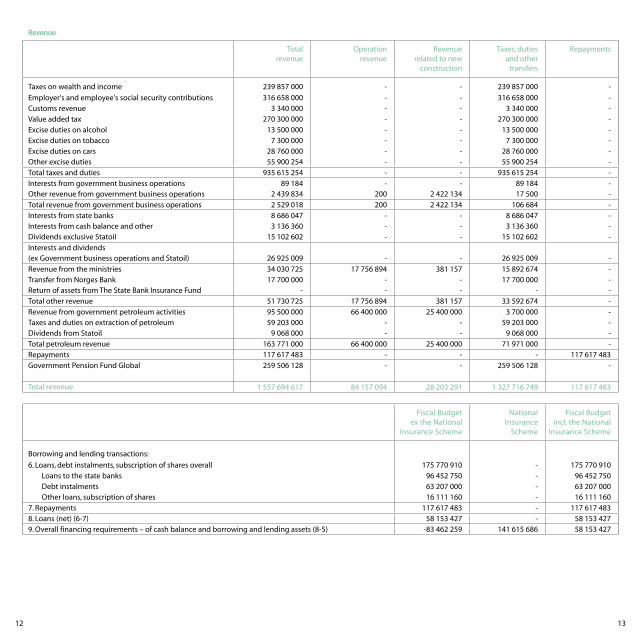
Revenue
Total revenue
Operation revenue
Revenue related to new
construction
Taxes, duties and other
transfers
Repayments
Taxes on wealth and income 239 857 000 - - 239 857 000 -
Employer's and employee's social security contributions 316 658 000 - - 316 658 000 - Customs revenue 3 340 000 - - 3 340 000 - Value added tax 270 300 000 - - 270 300 000 - Excise duties on alcohol 13 500 000 - - 13 500 000 - Excise duties on tobacco 7 300 000 - - 7 300 000 - Excise duties on cars 28 760 000 - - 28 760 000 - Other excise duties 55 900 254 - - 55 900 254 -
Total taxes and duties 935 615 254 - - 935 615 254 -
Interests from government business operations 89 184 - - 89 184 - Other revenue from government business operations 2 439 834 200 2 422 134 17 500 -
Total revenue from government business operations 2 529 018 200 2 422 134 106 684 -
Interests from state banks 8 686 047 - - 8 686 047 - Interests from cash balance and other 3 136 360 - - 3 136 360 - Dividends exclusive Statoil 15 102 602 - - 15 102 602 -
Interests and dividends(ex Government business operations and Statoil) 26 925 009 - - 26 925 009 -
Revenue from the ministries 34 030 725 17 756 894 381 157 15 892 674 - Transfer from Norges Bank 17 700 000 - - 17 700 000 - Return of assets from The State Bank Insurance Fund - - - - -
Total other revenue 51 730 725 17 756 894 381 157 33 592 674 -
Revenue from government petroleum activities 95 500 000 66 400 000 25 400 000 3 700 000 - Taxes and duties on extraction of petroleum 59 203 000 - - 59 203 000 - Dividends from Statoil 9 068 000 - - 9 068 000 -
Total petroleum revenue 163 771 000 66 400 000 25 400 000 71 971 000 - Repayments 117 617 483 - - - 117 617 483
Government Pension Fund Global 259 506 128 - - 259 506 128 -
Total revenue 1 557 694 617 84 157 094 28 203 291 1 327 716 749 117 617 483
Fiscal Budgetex the National
Insurance Scheme
National Insurance
Scheme
Fiscal Budgetincl. the National
Insurance Scheme
Borrowing and lending transactions:
6. Loans, debt instalments, subscription of shares overall 175 770 910 - 175 770 910 Loans to the state banks 96 452 750 - 96 452 750 Debt instalments 63 207 000 - 63 207 000 Other loans, subscription of shares 16 111 160 - 16 111 160
7. Repayments 117 617 483 - 117 617 4838. Loans (net) (6-7) 58 153 427 - 58 153 4279. Overall financing requirements – of cash balance and borrowing and lending assets (8-5) -83 462 259 141 615 686 58 153 427
14
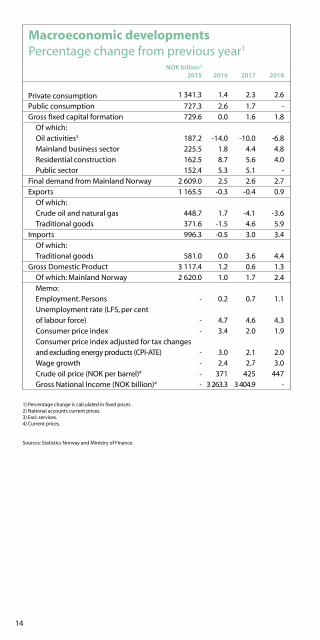
1) Percentage change is calculated in fixed prices.2) National accounts current prices.3) Excl. services.4) Current prices.
Sources: Statistics Norway and Ministry of Finance.
Macroeconomic developments Percentage change from previous year1
NOK billion2
2015 2016 2017 2018
Private consumption 1 341.3 1.4 2.3 2.6
Public consumption 727.3 2.6 1.7 -Gross fixed capital formation 729.6 0.0 1.6 1.8
Of which:Oil activities3 187.2 -14.0 -10.0 -6.8Mainland business sector 225.5 1.8 4.4 4.8Residential construction 162.5 8.7 5.6 4.0Public sector 152.4 5.3 5.1 -
Final demand from Mainland Norway 2 609.0 2.5 2.6 2.7Exports 1 165.5 -0.3 -0.4 0.9
Of which:Crude oil and natural gas 448.7 1.7 -4.1 -3.6Traditional goods 371.6 -1.5 4.6 5.9
Imports 996.3 -0.5 3.0 3.4
Of which:Traditional goods 581.0 0.0 3.6 4.4
Gross Domestic Product 3 117.4 1.2 0.6 1.3Of which: Mainland Norway 2 620.0 1.0 1.7 2.4
Memo:Employment. Persons - 0.2 0.7 1.1Unemployment rate (LFS, per centof labour force) - 4.7 4.6 4.3Consumer price index - 3.4 2.0 1.9Consumer price index adjusted for tax changesand excluding energy products (CPI-ATE) - 3.0 2.1 2.0Wage growth - 2.4 2.7 3.0Crude oil price (NOK per barrel)4 - 371 425 447Gross National Income (NOK billion)4 - 3 263.3 3 404.9 -
15
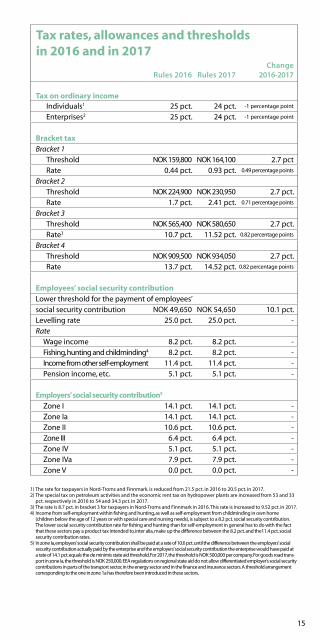
1) The rate for taxpayers in Nord-Troms and Finnmark. is reduced from 21.5 pct. in 2016 to 20.5 pct. in 2017.2) The special tax on petroleum activities and the economic rent tax on hydropower plants are increased from 53 and 33
pct. respectively in 2016 to 54 and 34.3 pct. in 2017.3) The rate is 8.7 pct. in bracket 3 for taxpayers in Nord-Troms and Finnmark in 2016. This rate is increased to 9.52 pct. in 2017.4) Income from self-employment within fishing and hunting, as well as self-employment from childminding in own home
(children below the age of 12 years or with special care and nursing needs), is subject to a 8.2 pct. social security contribution. The lower social security contribution rate for fishing and hunting than for self-employment in general has to do with the fact that these sectors pay a product tax intended to, inter alia, make up the difference between the 8.2 pct. and the11.4 pct. social security contribution rates.
5) In zone Ia, employers’ social security contribution shall be paid at a rate of 10.6 pct. until the difference between the employers’ social security contribution actually paid by the enterprise and the employers’ social security contribution the enterprise would have paid at a rate of 14.1 pct. equals the de minimis state aid threshold. For 2017, the threshold is NOK 500,000 per company. For goods road trans-port in zone Ia, the threshold is NOK 250,000. EEA regulations on regional state aid do not allow differentiated employer’s social security contributions in parts of the transport sector, in the energy sector and in the finance and insurance sectors. A threshold arrangement corresponding to the one in zone 1a has therefore been introduced in these sectors.
Tax rates, allowances and thresholds in 2016 and in 2017
Rules 2016 Rules 2017Change
2016-2017
Tax on ordinary income Individuals1 25 pct. 24 pct. -1 percentage point
Enterprises2 25 pct. 24 pct. -1 percentage point
Bracket taxBracket 1 Threshold NOK 159,800 NOK 164,100 2.7 pct Rate 0.44 pct. 0.93 pct. 0.49 percentage points
Bracket 2 Threshold NOK 224,900 NOK 230,950 2.7 pct. Rate 1.7 pct. 2.41 pct. 0.71 percentage points
Bracket 3 Threshold NOK 565,400 NOK 580,650 2.7 pct. Rate3 10.7 pct. 11.52 pct. 0.82 percentage points
Bracket 4 Threshold NOK 909,500 NOK 934,050 2.7 pct. Rate 13.7 pct. 14.52 pct. 0.82 percentage points
Employees’ social security contributionLower threshold for the payment of employees’social security contribution NOK 49,650 NOK 54,650 10.1 pct.Levelling rate 25.0 pct. 25.0 pct. -Rate
Wage income 8.2 pct. 8.2 pct. -Fishing, hunting and childminding4 8.2 pct. 8.2 pct. -Income from other self-employment 11.4 pct. 11.4 pct. -Pension income, etc. 5.1 pct. 5.1 pct. -
Employers’ social security contribution5
Zone I 14.1 pct. 14.1 pct. - Zone Ia 14.1 pct. 14.1 pct. - Zone II 10.6 pct. 10.6 pct. - Zone III 6.4 pct. 6.4 pct. - Zone IV 5.1 pct. 5.1 pct. - Zone IVa 7.9 pct. 7.9 pct. - Zone V 0.0 pct. 0.0 pct. -
16
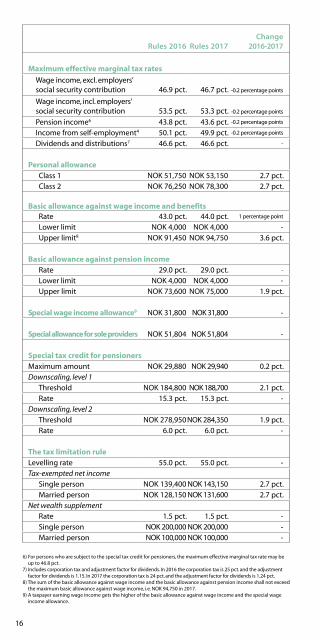
6) For persons who are subject to the special tax credit for pensioners, the maximum effective marginal tax rate may be up to 46.8 pct.
7) Includes corporation tax and adjustment factor for dividends. In 2016 the corporation tax is 25 pct. and the adjustment factor for dividends is 1.15. In 2017 the corporation tax is 24 pct. and the adjustment factor for dividends is 1.24 pct.
8) The sum of the basic allowance against wage income and the basic allowance against pension income shall not exceed the maximum basic allowance against wage income, i.e. NOK 94,750 in 2017.
9) A taxpayer earning wage income gets the higher of the basic allowance against wage income and the special wage income allowance.
Rules 2016 Rules 2017Change
2016-2017
Maximum effective marginal tax rates
Wage income, excl. employers’ social security contribution 46.9 pct. 46.7 pct. -0.2 percentage points
Wage income, incl. employers’ social security contribution 53.5 pct. 53.3 pct. -0.2 percentage points
Pension income6 43.8 pct. 43.6 pct. -0.2 percentage points
Income from self-employment4 50.1 pct. 49.9 pct. -0.2 percentage points
Dividends and distributions7 46.6 pct. 46.6 pct. -
Personal allowance Class 1 NOK 51,750 NOK 53,150 2.7 pct. Class 2 NOK 76,250 NOK 78,300 2.7 pct.
Basic allowance against wage income and benefits Rate 43.0 pct. 44.0 pct. 1 percentage point
Lower limit NOK 4,000 NOK 4,000 - Upper limit8 NOK 91,450 NOK 94,750 3.6 pct.
Basic allowance against pension income Rate 29.0 pct. 29.0 pct. -
Lower limit NOK 4,000 NOK 4,000 - Upper limit NOK 73,600 NOK 75,000 1.9 pct.
Special wage income allowance9 NOK 31,800 NOK 31,800 -
Special allowance for sole providers NOK 51,804 NOK 51,804 -
Special tax credit for pensionersMaximum amount NOK 29,880 NOK 29,940 0.2 pct.Downscaling, level 1 Threshold NOK 184,800 NOK 188,700 2.1 pct. Rate 15.3 pct. 15.3 pct. -Downscaling, level 2 Threshold NOK 278,950NOK 284,350 1.9 pct. Rate 6.0 pct. 6.0 pct. -
The tax limitation ruleLevelling rate 55.0 pct. 55.0 pct. -Tax-exempted net income Single person NOK 139,400 NOK 143,150 2.7 pct. Married person NOK 128,150 NOK 131,600 2.7 pct.Net wealth supplement Rate 1.5 pct. 1.5 pct. - Single person NOK 200,000 NOK 200,000 - Married person NOK 100,000 NOK 100,000 -
17
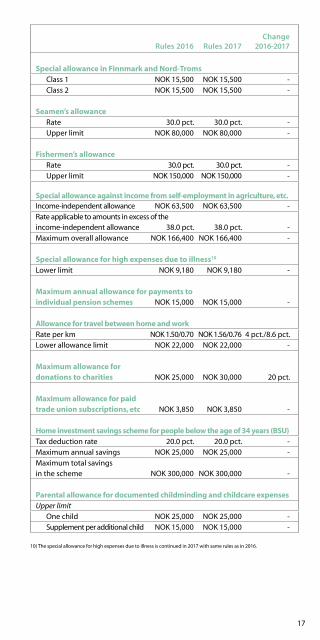
10) The special allowance for high expenses due to illness is continued in 2017 with same rules as in 2016.
Rules 2016 Rules 2017Change
2016-2017
Special allowance in Finnmark and Nord-Troms Class 1 NOK 15,500 NOK 15,500 - Class 2 NOK 15,500 NOK 15,500 -
Seamen’s allowance Rate 30.0 pct. 30.0 pct. - Upper limit NOK 80,000 NOK 80,000 -
Fishermen’s allowance Rate 30.0 pct. 30.0 pct. - Upper limit NOK 150,000 NOK 150,000 -
Special allowance against income from self-employment in agriculture, etc.Income-independent allowance NOK 63,500 NOK 63,500 -
Rate applicable to amounts in excess of theincome-independent allowance 38.0 pct. 38.0 pct. -
Maximum overall allowance NOK 166,400 NOK 166,400 -
Special allowance for high expenses due to illness10
Lower limit NOK 9,180 NOK 9,180 -
Maximum annual allowance for payments to individual pension schemes NOK 15,000 NOK 15,000 -
Allowance for travel between home and workRate per km NOK 1.50/0.70 NOK 1.56/0.76 4 pct./8.6 pct.Lower allowance limit NOK 22,000 NOK 22,000 -
Maximum allowance for donations to charities NOK 25,000 NOK 30,000 20 pct.
Maximum allowance for paidtrade union subscriptions, etc NOK 3,850 NOK 3,850 -
Home investment savings scheme for people below the age of 34 years (BSU)Tax deduction rate 20.0 pct. 20.0 pct. -Maximum annual savings NOK 25,000 NOK 25,000 -
Maximum total savings in the scheme NOK 300,000 NOK 300,000 -
Parental allowance for documented childminding and childcare expensesUpper limit One child NOK 25,000 NOK 25,000 - Supplement per additional child NOK 15,000 NOK 15,000 -
18
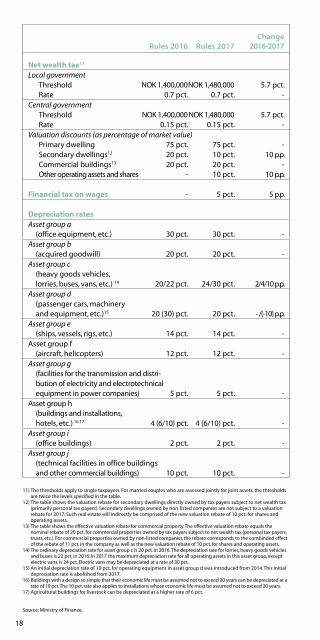
11) The thresholds apply to single taxpayers. For married couples who are assessed jointly for joint assets, the thresholds are twice the levels specified in the table.
12) The table shows the valuation rebate for secondary dwellings directly owned by tax payers subject to net wealth tax (primarily personal tax payers). Secondary dwellings owned by non-listed companies are not subject to a valuation rebate for 2017. Such real estate will indirectly be comprised of the new valuation rebate of 10 pct. for shares and operating assets.
13) The table shows the effective valuation rebate for commercial property. The effective valuation rebate equals the nominal rebate of 20 pct. for commercial properties owned by tax payers subject to net wealth tax (personal tax payers, trusts, etc.). For commercial properties owned by non-listed companies the rebate corresponds to the combinded effect of the rebate of 11 pct. in the company as well as the new valuation rebate of 10 pct. for shares and operating assets.
14) The ordinary depreciation rate for asset group c is 20 pct. in 2016. The depreciation rate for lorries, heavy goods vehicles and buses is 22 pct. in 2016. In 2017 the maximum depreciation rate for all operating assets in this asset group, except electric vans, is 24 pct. Electric vans may be depreciated at a rate of 30 pct.
15) An initial depreciation rate of 10 pct. for operating equipment in asset group d was introduced from 2014. This initial depreciation rate is abolished from 2017.
16) Buildings with a design so simple that their economic life must be assumed not to exceed 20 years can be depreciated at a rate of 10 pct. The 10 pct. rate also applies to installations whose economic life must be assumed not to exceed 20 years.
17) Agricultural buildings for livestock can be depreciated at a higher rate of 6 pct.
Source: Ministry of Finance.
Rules 2016 Rules 2017Change
2016-2017
Net wealth tax11
Local government Threshold NOK 1,400,000NOK 1,480,000 5.7 pct. Rate 0.7 pct. 0.7 pct. -Central government Threshold NOK 1,400,000NOK 1,480,000 5.7 pct. Rate 0.15 pct. 0.15 pct. -Valuation discounts (as percentage of market value) Primary dwelling 75 pct. 75 pct. - Secondary dwellings12 20 pct. 10 pct. 10 p.p.
Commercial buildings13 20 pct. 20 pct. -Other operating assets and shares - 10 pct. 10 p.p.
Financial tax on wages - 5 pct. 5 p.p.
Depreciation ratesAsset group a
(office equipment, etc.) 30 pct. 30 pct. -Asset group b
(acquired goodwill) 20 pct. 20 pct. -Asset group c
(heavy goods vehicles,lorries, buses, vans, etc.) 14 20/22 pct. 24/30 pct. 2/4/10 p.p.
Asset group d (passenger cars, machinery and equipment, etc.)15 20 (30) pct. 20 pct. - /(-10) p.p.
Asset group e(ships, vessels, rigs, etc.) 14 pct. 14 pct. -
Asset group f (aircraft, helicopters) 12 pct. 12 pct. -
Asset group g(facilities for the transmission and distri-bution of electricity and electrotechnicalequipment in power companies) 5 pct. 5 pct. -
Asset group h(buildings and installations, hotels, etc.) 16.17 4 (6/10) pct. 4 (6/10) pct. -
Asset group i (office buildings) 2 pct. 2 pct. -
Asset group j (technical facilities in office buildingsand other commercial buildings) 10 pct. 10 pct. -
19
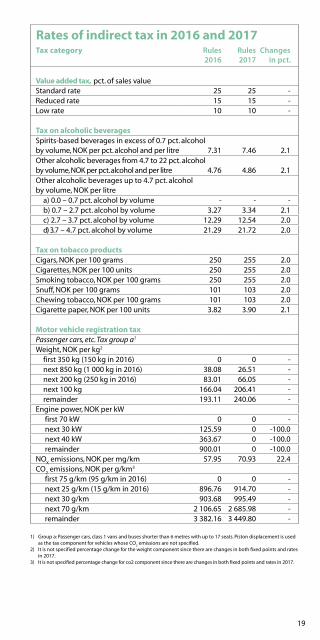
1) Group a: Passenger cars, class 1 vans and buses shorter than 6 metres with up to 17 seats. Piston displacement is used as the tax component for vehicles whose CO
2 emissions are not specified.
2) It is not specified percentage change for the weight component since there are changes in both fixed points and rates in 2017.
3) It is not specified percentage change for co2 component since there are changes in both fixed points and rates in 2017.
Rates of indirect tax in 2016 and 2017Tax category Rules
2016 Rules 2017
Changes in pct.
Value added tax, pct. of sales valueStandard rate 25 25 -Reduced rate 15 15 -Low rate 10 10 -
Tax on alcoholic beveragesSpirits-based beverages in excess of 0.7 pct. alcoholby volume, NOK per pct. alcohol and per litre 7.31 7.46 2.1Other alcoholic beverages from 4.7 to 22 pct. alcohol by volume, NOK per pct. alcohol and per litre 4.76 4.86 2.1Other alcoholic beverages up to 4.7 pct. alcohol by volume, NOK per litre
a) 0.0 – 0.7 pct. alcohol by volume - - -b) 0.7 – 2.7 pct. alcohol by volume 3.27 3.34 2.1c) 2.7 – 3.7 pct. alcohol by volume 12.29 12.54 2.0d) 3.7 – 4.7 pct. alcohol by volume 21.29 21.72 2.0
Tax on tobacco products Cigars, NOK per 100 grams 250 255 2.0Cigarettes, NOK per 100 units 250 255 2.0Smoking tobacco, NOK per 100 grams 250 255 2.0Snuff, NOK per 100 grams 101 103 2.0Chewing tobacco, NOK per 100 grams 101 103 2.0Cigarette paper, NOK per 100 units 3.82 3.90 2.1
Motor vehicle registration taxPassenger cars, etc. Tax group a1
Weight, NOK per kg2
first 350 kg (150 kg in 2016) 0 0 -next 850 kg (1 000 kg in 2016) 38.08 26.51 - next 200 kg (250 kg in 2016) 83.01 66.05 - next 100 kg 166.04 206.41 - remainder 193.11 240.06 -
Engine power, NOK per kW first 70 kW 0 0 - next 30 kW 125.59 0 -100.0 next 40 kW 363.67 0 -100.0 remainder 900.01 0 -100.0
NOX emissions, NOK per mg/km 57.95 70.93 22.4
CO2 emissions, NOK per g/km3
first 75 g/km (95 g/km in 2016) 0 0 - next 25 g/km (15 g/km in 2016) 896.76 914.70 - next 30 g/km 903.68 995.49 - next 70 g/km 2 106.65 2 685.98 - remainder 3 382.16 3 449.80 -
20
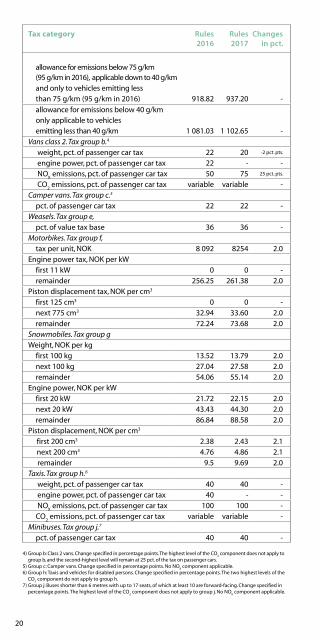
4) Group b: Class 2 vans. Change specified in percentage points. The highest level of the CO2 component does not apply to
group b, and the second-highest level will remain at 25 pct. of the tax on passenger cars.5) Group c: Camper vans. Change specified in percentage points. No NO
X component applicable.
6) Group h: Taxis and vehicles for disabled persons. Change specified in percentage points. The two highest levels of the CO
2 component do not apply to group h.
7) Group j: Buses shorter than 6 metres with up to 17 seats, of which at least 10 are forward-facing. Change specified in percentage points. The highest level of the CO
2 component does not apply to group j. No NO
X component applicable.
Tax category Rules 2016
Rules 2017
Changesin pct.
allowance for emissions below 75 g/km(95 g/km in 2016), applicable down to 40 g/kmand only to vehicles emitting less than 75 g/km (95 g/km in 2016) 918.82 937.20 -
allowance for emissions below 40 g/km only applicable to vehiclesemitting less than 40 g/km 1 081.03 1 102.65 -
Vans class 2. Tax group b.4
weight, pct. of passenger car tax 22 20 -2 pct. pts.
engine power, pct. of passenger car tax 22 - - NO
X emissions, pct. of passenger car tax 50 75 25 pct. pts.
CO2 emissions, pct. of passenger car tax variable variable -
Camper vans. Tax group c.5
pct. of passenger car tax 22 22 -Weasels. Tax group e,
pct. of value tax base 36 36 -Motorbikes. Tax group f,
tax per unit, NOK 8 092 8254 2.0 Engine power tax, NOK per kW
first 11 kW 0 0 -remainder 256.25 261.38 2.0
Piston displacement tax, NOK per cm3
first 125 cm3 0 0 -next 775 cm3 32.94 33.60 2.0 remainder 72.24 73.68 2.0
Snowmobiles. Tax group gWeight, NOK per kg
first 100 kg 13.52 13.79 2.0 next 100 kg 27.04 27.58 2.0 remainder 54.06 55.14 2.0
Engine power, NOK per kWfirst 20 kW 21.72 22.15 2.0 next 20 kW 43.43 44.30 2.0 remainder 86.84 88.58 2.0
Piston displacement, NOK per cm3 first 200 cm3 2.38 2.43 2.1 next 200 cm3 4.76 4.86 2.1 remainder 9.5 9.69 2.0
Taxis. Tax group h.6
weight, pct. of passenger car tax 40 40 - engine power, pct. of passenger car tax 40 - - NO
X emissions, pct. of passenger car tax 100 100 -
CO2 emissions, pct. of passenger car tax variable variable -
Minibuses. Tax group j.7
pct. of passenger car tax 40 40 -
21
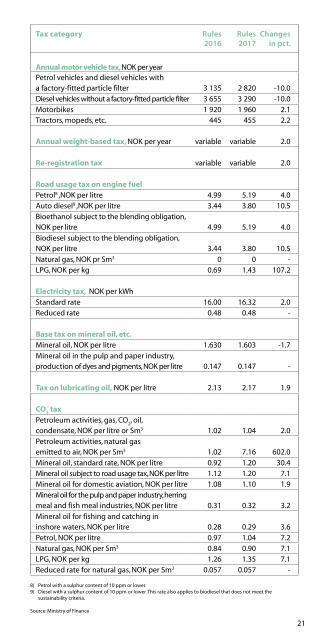
8) Petrol with a sulphur content of 10 ppm or lower.9) Diesel with a sulphur content of 10 ppm or lower. This rate also applies to biodiesel that does not meet the
sustainability criteria.
Source: Ministry of Finance
Tax category Rules 2016
Rules 2017
Changesin pct.
Annual motor vehicle tax, NOK per year Petrol vehicles and diesel vehicles with a factory-fitted particle filter 3 135 2 820 -10.0
Diesel vehicles without a factory-fitted particle filter 3 655 3 290 -10.0Motorbikes 1 920 1 960 2.1 Tractors, mopeds, etc. 445 455 2.2
Annual weight-based tax, NOK per year variable variable 2.0
Re-registration tax variable variable 2.0
Road usage tax on engine fuelPetrol8 ,NOK per litre 4.99 5.19 4.0Auto diesel9 ,NOK per litre 3.44 3.80 10.5
Bioethanol subject to the blending obligation,NOK per litre 4.99 5.19 4.0
Biodiesel subject to the blending obligation,NOK per litre 3.44 3.80 10.5
Natural gas, NOK pr Sm3 0 0 -LPG, NOK per kg 0.69 1.43 107.2
Electricity tax, NOK per kWh
Standard rate 16.00 16.32 2.0Reduced rate 0.48 0.48 -
Base tax on mineral oil, etc.Mineral oil, NOK per litre 1.630 1.603 -1.7
Mineral oil in the pulp and paper industry, production of dyes and pigments, NOK per litre 0.147 0.147 -
Tax on lubricating oil, NOK per litre 2.13 2.17 1.9
CO2 tax
Petroleum activities, gas, CO2, oil,
condensate, NOK per litre or Sm3 1.02 1.04 2.0
Petroleum activities, natural gas emitted to air, NOK per Sm3 1.02 7.16 602.0
Mineral oil, standard rate, NOK per litre 0.92 1.20 30.4Mineral oil subject to road usage tax, NOK per litre 1.12 1.20 7.1Mineral oil for domestic aviation, NOK per litre 1.08 1.10 1.9
Mineral oil for the pulp and paper industry, herringmeal and fish meal industries, NOK per litre 0.31 0.32 3.2
Mineral oil for fishing and catching in inshore waters, NOK per litre 0.28 0.29 3.6
Petrol, NOK per litre 0.97 1.04 7.2Natural gas, NOK per Sm3 0.84 0.90 7.1LPG, NOK per kg 1.26 1.35 7.1Reduced rate for natural gas, NOK per Sm3 0.057 0.057 -
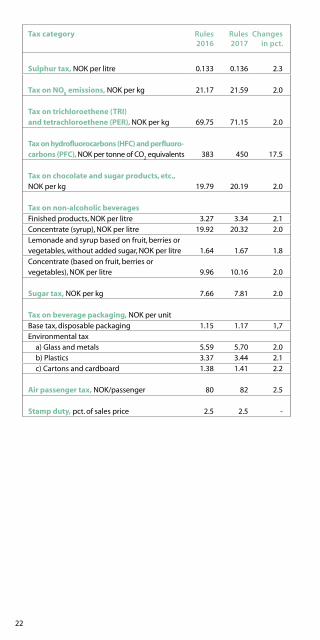
22
Tax category Rules 2016
Rules 2017
Changesin pct.
Sulphur tax, NOK per litre 0.133 0.136 2.3
Tax on NOX emissions, NOK per kg 21.17 21.59 2.0
Tax on trichloroethene (TRI) and tetrachloroethene (PER), NOK per kg 69.75 71.15 2.0
Tax on hydrofluorocarbons (HFC) and perfluoro-carbons (PFC), NOK per tonne of CO
2 equivalents 383 450 17.5
Tax on chocolate and sugar products, etc., NOK per kg 19.79 20.19 2.0
Tax on non-alcoholic beverages
Finished products, NOK per litre 3.27 3.34 2.1Concentrate (syrup), NOK per litre 19.92 20.32 2.0
Lemonade and syrup based on fruit, berries orvegetables, without added sugar, NOK per litre 1.64 1.67 1.8
Concentrate (based on fruit, berries or vegetables), NOK per litre 9.96 10.16 2.0
Sugar tax, NOK per kg 7.66 7.81 2.0
Tax on beverage packaging, NOK per unit
Base tax, disposable packaging 1.15 1.17 1,7Environmental tax
a) Glass and metals 5.59 5.70 2.0b) Plastics 3.37 3.44 2.1c) Cartons and cardboard 1.38 1.41 2.2
Air passenger tax, NOK/passenger 80 82 2.5
Stamp duty, pct. of sales price 2.5 2.5 -
23
Pho
to: Jiri H
avran
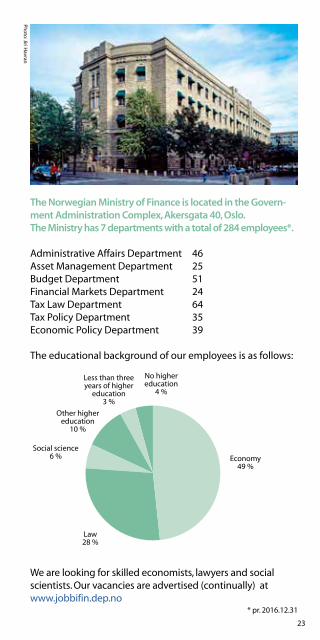
The Norwegian Ministry of Finance is located in the Govern-ment Administration Complex, Akersgata 40, Oslo. The Ministry has 7 departments with a total of 284 employees*.
Administrative Affairs Department 46Asset Management Department 25Budget Department 51Financial Markets Department 24Tax Law Department 64 Tax Policy Department 35Economic Policy Department 39
The educational background of our employees is as follows:
We are looking for skilled economists, lawyers and social scientists. Our vacancies are advertised (continually) at www.jobbifin.dep.no
Economy49 %
Law28 %
Social science6 %
Other higher education
10 %
Less than three years of higher
education 3 %
No higher education
4 %
* pr. 2016.12.31
Budget 2017
Key web sites:
Ministry of Finance: http://www.regjeringen.no/fin
Fiscal Budget: http://www.statsbudsjettet.no
The Tax Administration: http://www.skatteetaten.no
The Norwegian Customs: http://www.toll.no
Published by Ministry of FinanceMailing address: P. O. Box 8008 Dep, 0030 OsloVisiting address: Akersgt. 40Telephone: 22 24 90 90Internet: http://www.regjeringen.no/finE-mail: [email protected]
Public institutions may order additional copies from:Norwegian Government Security and Service OrganisationInternet: www.publikasjoner.dep.no E-mail: [email protected]: 22 24 20 00
Publication number: R-0650 EISBN: 978-93457-04-6
Print: DSS 02/17 - 200