Embed Size (px)
Citation preview

Bucharest, 10-February-2004
Neural Risk Management S.A.Scoring solutions
Making full use of your data
Bucharest, 10-February-2004
Agenda
1. Neural Risk Management & Neural Technologies
2. Neural computing
3. Scoring solutions
4. Scorecard development
5. Database consistency analysis
6. Optimum cut-off value
7. Applications of Decider
8. Business benefits of Decider
Bucharest, 10-February-2004
NRM & NT
Neural Risk Management
Independent company, opened in 2002;
Neural Technologies local business partner;
Neural Technologies Privately owned company in Hampshire, UK Focus on telecom & financial sectors Strategic Partnerships
India, Egypt, Mexico, Singapore, Malaysia & Indonesia, etc. 5+ years experience of credit scoring & risk management
Unique solutions delivering huge savings Solution not technology Used by leading telecom & financial companies
Bucharest, 10-February-2004
Neural Computing
It has the capacity to learn from experience and apply what has been learnt;
A neural system decision is purely objective and not subjective;
It can understand relationships between variables hidden deep within data;
The ability to cope with little or incomplete data;
It develops highly accurate scorecards and models – it reaches 30-40% increased bad debts prevention;
Our solutions are based on neural computing Strengths of neural technology:
Pattern Recognition e.g. customer profiling Prediction e.g. customer purchasing patterns Anomaly Detection e.g. fraudulent trading
Bucharest, 10-February-2004
Scoring solutions
Scorecard development - based on customers behaviour
history for Romanian specific market, bank or a certain credit
product.
Database consistency analysis - analyse the
separation from the two classes (GOOD & BAD),
characteristics relevance and other statistical charts.
Our software application: Decider™
Bucharest, 10-February-2004
Scorecard development
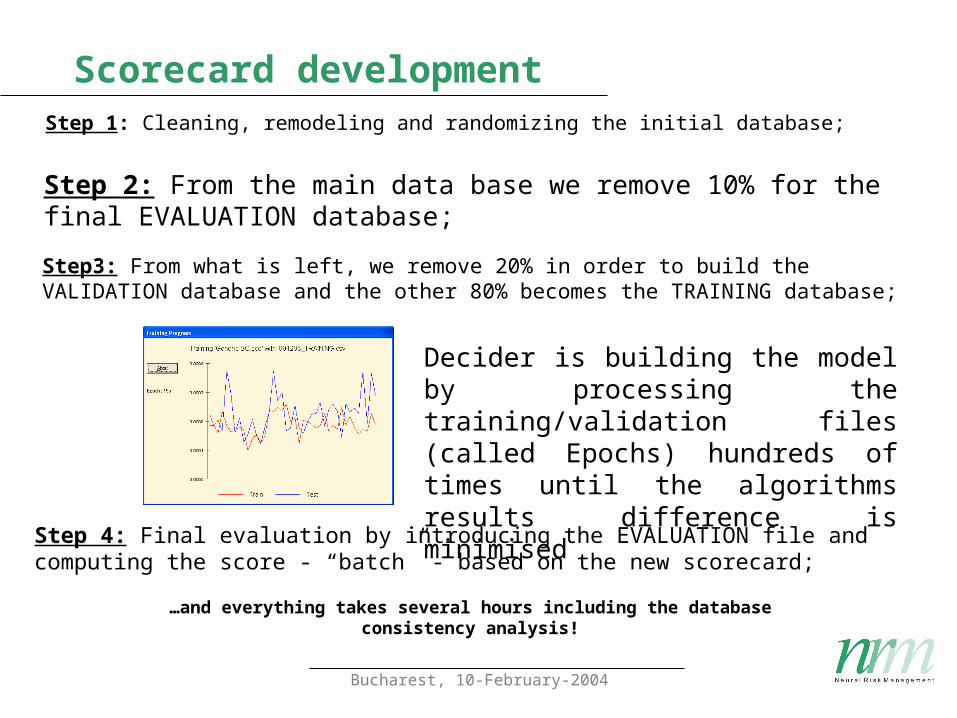
Step 1: Cleaning, remodeling and randomizing the initial database;
Step 2: From the main data base we remove 10% for the final EVALUATION database;
Step3: From what is left, we remove 20% in order to build the VALIDATION database and the other 80% becomes the TRAINING database;
Decider is building the model by processing the training/validation files (called Epochs) hundreds of times until the algorithms results difference is minimised
…and everything takes several hours including the database consistency analysis!
Step 4: Final evaluation by introducing the EVALUATION file and computing the score - “batch” - based on the new scorecard;
Bucharest, 10-February-2004
Database consistency analysis
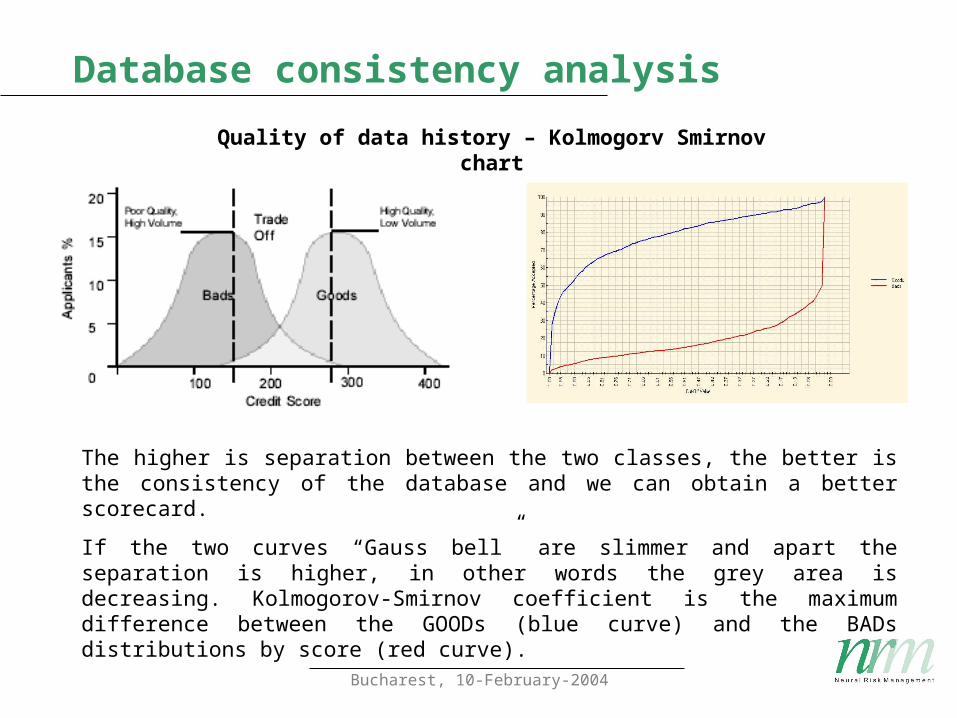
The higher is separation between the two classes, the better is the consistency of the database and we can obtain a better scorecard.
If the two curves “Gauss bell” are slimmer and apart the separation is higher, in other words the grey area is decreasing. Kolmogorov-Smirnov coefficient is the maximum difference between the GOODs (blue curve) and the BADs distributions by score (red curve).
Quality of data history – Kolmogorv Smirnov chart

Bucharest, 10-February-2004
Database consistency analysis
1.0
0.9
0.8
0.7
0.6
0.5
0.4
0.3
0.2
0.1
0.0
-1.00
1.583E6
3.166E6
4.749E6
6.332E6
7.915E6
9.498E6
1.108E7
1.266E7
1.425E7
1.583E7
1.741E7
1.9E7
2.058E7
2.216E7
Propensity
INCOME
Generic SC.sco Sensitivity Analysis "INCOME"Using 091203_TRAINING.csv
08 January 2004 13:58:06Generic SC Version 1.01
Neural Technologies Decider Version 2.56
Sometimes, information like salary, time at work, age, dependants, phone type or others can have no relevance for a certain credit product and we should change them with others.
Decider can analyse also the sensitivity for each of the characteristics propensity to fraud depending on its own values.
Characteristics relevance
Bucharest, 10-February-2004
Database consistency analysis
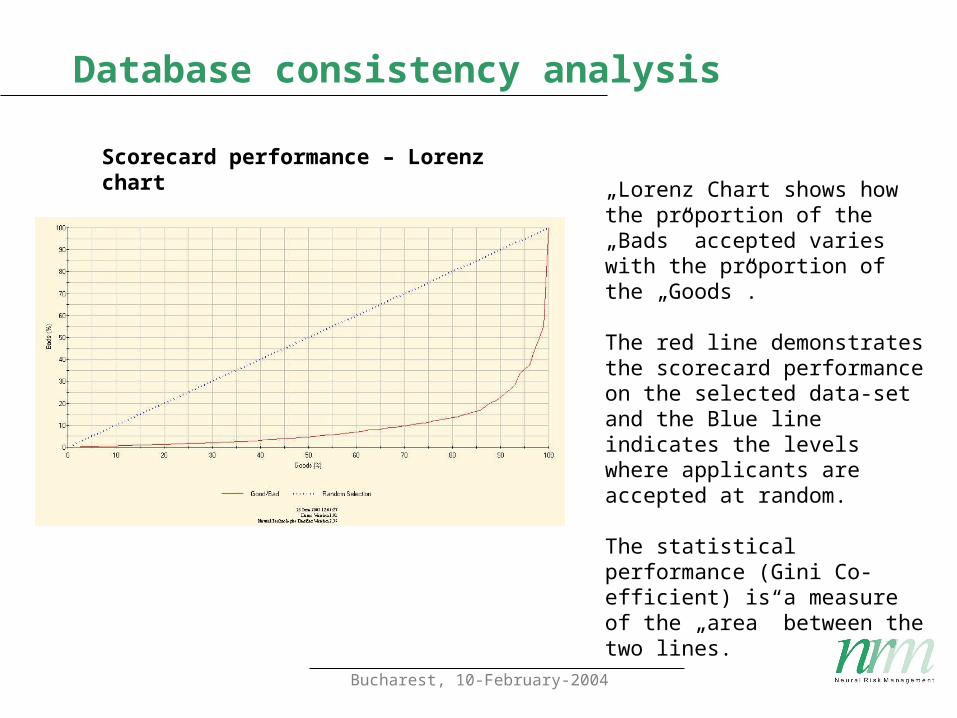
Scorecard performance – Lorenz chart
„Lorenz Chart shows how the proportion of the „Bads” accepted varies with the proportion of the „Goods”.
The red line demonstrates the scorecard performance on the selected data-set and the Blue line indicates the levels where applicants are accepted at random.
The statistical performance (Gini Co-efficient) is a measure of the „area” between the two lines.
Bucharest, 10-February-2004
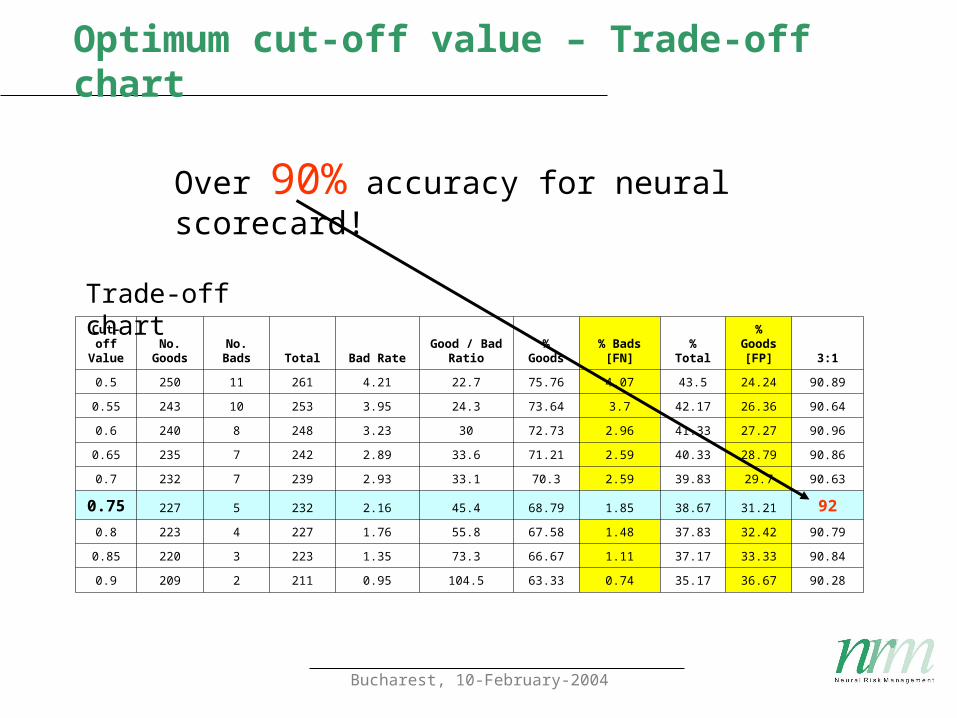
Optimum cut-off value – Trade-off chart
Cut-off Value
No. Goods
No. Bads Total Bad Rate
Good / Bad Ratio
% Goods
% Bads [FN] % Total
% Goods
[FP] 3:1
0.5 250 11 261 4.21 22.7 75.76 4.07 43.5 24.24 90.89
0.55 243 10 253 3.95 24.3 73.64 3.7 42.17 26.36 90.64
0.6 240 8 248 3.23 30 72.73 2.96 41.33 27.27 90.96
0.65 235 7 242 2.89 33.6 71.21 2.59 40.33 28.79 90.86
0.7 232 7 239 2.93 33.1 70.3 2.59 39.83 29.7 90.63
0.75 227 5 232 2.16 45.4 68.79 1.85 38.67 31.21 92
0.8 223 4 227 1.76 55.8 67.58 1.48 37.83 32.42 90.79
0.85 220 3 223 1.35 73.3 66.67 1.11 37.17 33.33 90.84
0.9 209 2 211 0.95 104.5 63.33 0.74 35.17 36.67 90.28
Over 90% accuracy for neural scorecard!
Trade-off chart
Bucharest, 10-February-2004
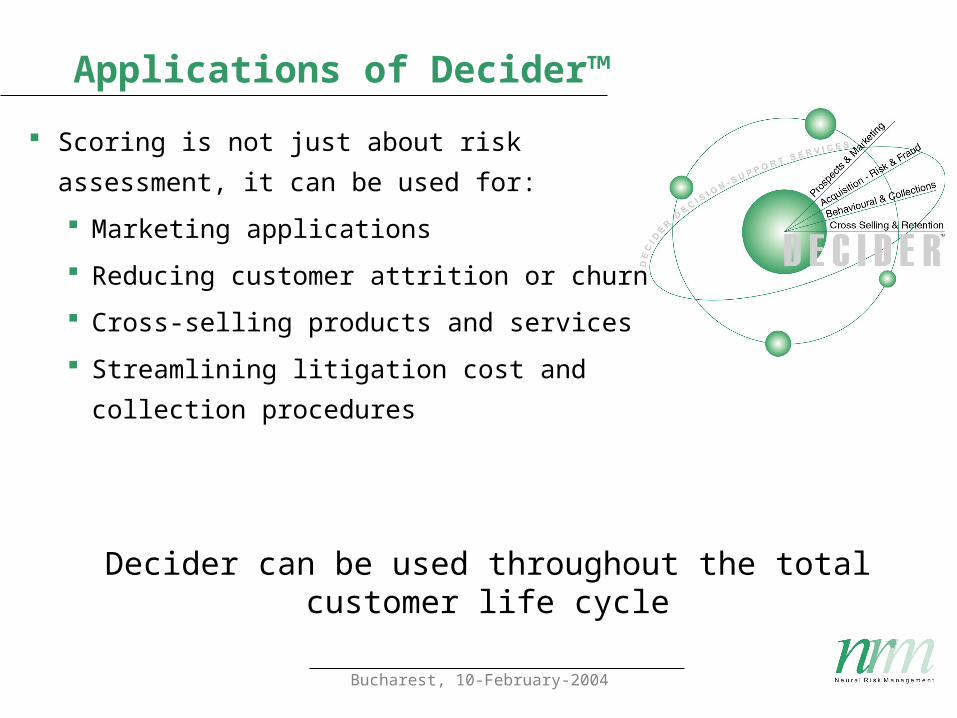
Applications of Decider™
Decider can be used throughout the total customer life cycle
Scoring is not just about risk assessment,
it can be used for:
Marketing applications
Reducing customer attrition or churn
Cross-selling products and services
Streamlining litigation cost and
collection procedures
Bucharest, 10-February-2004
Applications of Decider™
By Industries:
Banks;
Consumer finance companies;
Telecom operators;
Leasing
Insurance
Retailers
Utility companies.
Bucharest, 10-February-2004
Business Benefits of Decider™
Minimum resources for maximum revenue
Identifying profitable customers
Attracting and retaining quality customers
Identifying suitable payment methods for the customer
Minimising bad debt
Improved identification of frauds
Saving marketing effort for worthwhile prospects
Building long term relationships with quality customers