Embed Size (px)
Citation preview

Effects of Bt Cotton in India During the First Five Years of Adoption
Prakash SADASHIVAPPA∗ Department of Agricultural Economics and Social Sciences,
University of Hohenheim, Stuttgart, Germany
Matin QAIM Department of Agricultural Economics and Rural Development,
Georg-August-University of Goettingen, Germany
Contributed Paper prepared for presentation at the
International Association of Agricultural Economists’ 2009 Conference,
Beijing, China, August 16-22, 2009.
Copyright 2009 by Prakash Sadashivappa and Matin Qaim. All rights reserved. Readers
may make verbatim copies of this document for non-commercial purposes by any means,
provided this copyright notice appears on all such copies.
Acknowledgements: The financial support by the German Academic Exchange Service
(DAAD) and the German Research Foundation (DFG) is gratefully acknowledged.
∗ Corresponding author: Phone: + 49 711 459 22602; Fax: + 49 711 459 23762 E-mail: [email protected]
Effects of Bt Cotton in India During the First Five Years of Adoption
Abstract
While previous research has analyzed the impacts of Bt cotton in India, most available studies are based on
one or two years of data only. We analyze the technology’s performance over the first five years of
adoption, using panel data with three rounds of observations. On average, Bt adopting farmers realize
pesticide reductions of about 40%, and yield advantages of 30-40%. Profit gains are in a magnitude of US
$60 per acre. These benefits have been sustainable over time. Farmers’ satisfaction is reflected in a high
willingness to pay for Bt seeds. Nonetheless, in 2006 Indian state governments decided to establish price
caps at levels much lower than what companies had charged before. This intervention has further increased
farmers’ profits, but the impact on aggregate Bt adoption was relatively small. Price controls might have
negative long-term implications, as they can severely hamper private sector incentives to invest in new
technologies.
Key words: Biotechnology, Bt cotton, genetically modified crops, farm survey, India, seed markets,
technology adoption, willingness to pay (WTP)
Introduction
Bt cotton has been one of the first genetically modified (GM) crop technologies with a wide
distribution in developing countries. In India and China, in particular, the area under Bt cotton has
increased sharply over the last couple of years, reaching 25 million acres in 2007 (James, 2007).
Most of the Bt cotton growers in these countries are small-scale farmers; a number of recent
studies has shown that they benefit considerably from adopting the technology in terms of
reductions in pesticide use and higher effective yields (Crost et al., 2007; Bennett et al., 2006;
Qaim et al., 2006; Pray et al., 2002). Nonetheless, there are concerns with respect to the
development of benefits over time. Pest populations might eventually become resistant to Bt,
Sadashivappa and Qaim (2009) 1
especially when refuge strategies are not enforced, as is often the case in smallholder agriculture.
Moreover, secondary pests that are not controlled by Bt might turn into primary pests (e.g., Wang
et al., 2006). Both factors could potentially entail diminishing pesticide savings and yield
advantages over time. In addition, given that most GM crops so far have been commercialized by
private sector multinationals, there are fears that monopolistic market structures might
increasingly prevail. This could lead to excessive prices being charged for Bt seeds, resulting in
lower farm profits and restricted technology access, especially for resource-poor farmers (e.g.,
Lalitha, 2004; Qaim & de Janvry, 2003). Accordingly, some developing country governments
have started to intervene in GM seed pricing (e.g., Fukuda-Parr, 2007; Basu & Qaim, 2007). In
India, for instance, since 2006 state authorities have set official maximum retail prices for Bt
cotton seeds, which are significantly lower than the prices charged by seed companies before. The
broader implications are not yet fully understood.
Our research contributes to the existing literature in two ways. First, we analyze the farm
level agronomic and economic effects of Bt cotton adoption in India over time. While previous
studies for India have analyzed just one or two years of data (Crost et al., 2007; Bennett et al.,
2006; Qaim et al., 2006; Gandhi & Namboodiri, 2006), we use panel data collected in three
survey rounds over a period of five years. Second, we analyze and discuss the role of price
interventions in the market for Bt cotton seeds. Two of the farm survey rounds were conducted
before the government had set maximum retail prices, while the third round was carried out
afterwards.
The rest of this article is organized as follows. The next section provides a broader
background of Bt cotton adoption in India, also discussing the role of black market seeds and the
politics behind the government’s price interventions. Then the farm survey data are described and
Sadashivappa and Qaim (2009) 2
the technology’s impacts on input use and crop productivity analyzed. In a further section, we
estimate farmers’ willingness to pay (WTP) for Bt cotton seeds in the three survey rounds, using a
contingent valuation approach. WTP is an interesting measure to analyze farmers’ level of
satisfaction with the technology. Given rapidly increasing Bt adoption rates in India, we
hypothesize that mean WTP is higher than the actual seed prices charged by companies in the
first years of adoption, and certainly higher than the maximum retail prices established since
2006. The last section concludes and discusses policy implications.
Background
In India, cotton contributes 30% to agricultural gross domestic product (CAI, 2008). With over 20
million acres, the country has the largest cotton area in the world. The area under cotton in India
has grown considerably in recent years. Likewise, yield levels have increased significantly, from
around 120 kg of lint per acre in the early 2000s, to over 200 kg now (Table 1). The Cotton
Advisory Board (CAB) of India estimated an all-time record cotton production of 5.27 million
tons with the area soaring to a record high of 23.8 million acres in 2007-08. As a result, India has
been able to improve its position in world cotton trade from the third largest importer in 2002-03
to the second largest exporter after the US in 2007-08. This significant increase in cotton area and
production in India is attributed to better returns realized by farmers during the last few years,
which are largely due to the introduction and rapid spread of Bt cotton technology (CAI, 2008;
Khadi, Rao, & Singh, 2007).
(Here should appear Table 1)
Sadashivappa and Qaim (2009) 3
The first three Bt cotton hybrids were commercially approved in India in 2002 for central
and southern cotton-growing states (Qaim et al., 2006). The three hybrids had been developed by
the Indian company Mahyco in collaboration with Monsanto under their joint venture Mahyco
Monsanto Biotech Limited (MMBL). Later, MMBL sub-licensed its Bt cotton technology also to
other seed companies in India for incorporation into their own cotton hybrids. A fourth Bt hybrid
was commercialized in 2004 by Rasi Seeds. In 2005, 16 additional Bt hybrids were released,
including some for the northern cotton-growing states of India. Three new Bt cotton events were
sanctioned in 2006 by the Genetic Engineering Approval Committee (GEAC), one of which has
two stacked Bt genes for a broader spectrum of pest control. In the 2007-08 growing season, a
total of 131 different Bt hybrids were grown in India (James, 2007).
Illegal Bt Cotton
Even before the approval of the first official Bt hybrids in 2002, illegal Bt cotton seeds were used
in India. During 2001, the unlicensed Bt cotton hybrid NB-151 of the company NavBharat was
found to be cultivated on over 10,000 acres in the state of Gujarat. After tests, it was found that
this hybrid contained Monsanto’s Cry1Ac gene, yet without a license and without having
undergone the necessary biosafety procedures. Although the GEAC had recommended stringent
action to destroy the crop of NB-151, opposition by farmers prevented this as well as legal
prosecution of NavBharat. As a result, in subsequent years illegal Bt cotton seeds were multiplied
and sold under different names on a growing black market in different states of India. Illegal Bt
seeds were priced between 800 and 1200 Indian rupees (Rs.) per packet of 450 grams (enough to
plant one acre), as compared to a price of Rs. 1600 (US $36.45) for official Bt cotton seeds
(Murugkar, Ramaswami, & Shelar, 2007). In 2004-05, they reached an estimated area of 2
million acres (Pray, Bengali, & Ramaswami, 2005). Since then, the lower price and wider
Sadashivappa and Qaim (2009) 4
availability of legal Bt cotton hybrids has probably contributed to a reduction in the illegal Bt
area, albeit trustworthy statistics are hard to come by. Bennett, Ismael, & Morse (2005) showed
that on average illegal Bt hybrids generate higher profits than conventional cotton hybrids, but
lower profits than legal Bt hybrids.
Government Price Interventions
As mentioned above, until 2006 the price for official Bt cotton seeds in India was around Rs.
1600 per packet of 450 grams. Out of this, Rs. 1250 was charged by MMBL as the “trait value”.
The debate about Bt cotton pricing, which eventually led to the government interventions, started
in late 2005 with the South India Cotton Association urging seed companies to lower their seed
prices. This idea gained popularity among various farmer organizations, which encouraged the
state government of Andhra Pradesh to approach the Monopolies and Restrictive Trade Practices
Commission (MRTPC), claiming that the price charged by MMBL was “exorbitant” and
“unscientific”. In response, MMBL said that its pricing philosophy was based on sharing the
benefits of technologies with farmers. Furthermore, the company clarified that the trait value was
charged to support current products in the market and also fund research for future products (The
Hindu Business Line, 2006a).
The pricing issue took a political turn when the company officials and the state
government sought the intervention and support of the federal government of India. When the
federal ministry of agriculture backed the request to reduce prices, MMBL offered to cut down
the trait value to Rs. 900. However, the government of Andhra Pradesh appealed to lower the trait
value further. This appeal was upheld by MRTPC, directing MMBL to fix a trait value to a
“reasonable level on par with the value Monsanto charged in China and the US” (The Hindu
Business Line, 2006b). The company fought back, arguing that the case did not actually fall under
Sadashivappa and Qaim (2009) 5
the purview of the commission, and it challenged the MRTPC order in the Supreme Court. In the
meantime, even though the case was still pending in court, the government of Andhra Pradesh
issued a directive, mandating seed companies not to sell Bt seeds above Rs. 750 per packet.
Several other important cotton-growing states followed the Andhra Pradesh example. Later, the
Supreme Court reiterated the MRTPC order and directed MMBL to sell Bt cotton seeds at the
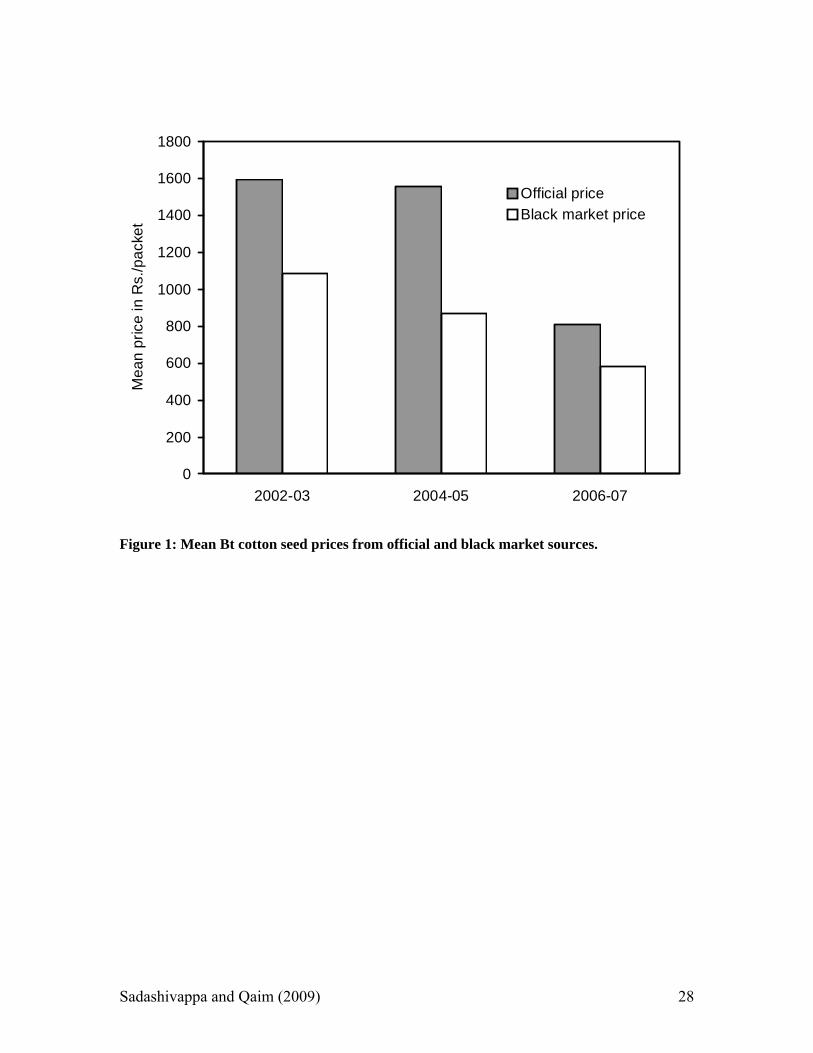
same price as in China. While some legal uncertainty remains, Bt cotton seed prices in India have
dropped significantly since 2006. As Figure 1 demonstrates, the government interventions in the
prices for official Bt seeds also affected the prices charged for illegal seeds in the black market.
(Here should appear Figure 1)
At closer scrutiny, the comparison of seed prices and trait values made by MRTPC
between India, China, and the US turns out to be inappropriate. Apart from the fact that the
agroecological conditions are quite different across countries, Bt cotton technology is
commercialized in open-pollinated varieties (OPVs) in China and the US, while in India it is
incorporated in hybrids, for which seed production is more costly. Moreover, MRTPC made its
price comparison per kg of seeds, although seeding rates vary dramatically. For instance, instead
of the 450 grams of seeds per acre used by hybrid growers in India, Chinese cotton farmers use 6-
8 kg of OPV seeds. Against this background, the Bt trait value in China amounts to an equivalent
of Rs. 1670 per acre (Chandrashekhar, 2006), much higher than the Rs. 1250 initially charged in
India. In the US, a technology fee of Rs. 1405 (US $32) per acre is charged for Bt cotton
(Hubbell, Marra, & Carlson, 2000). And finally, in China Monsanto faces competition through a
public sector Bt cotton technology, which was developed by the Chinese Academy of
Agricultural Sciences and commercialized in some of the states where Monsanto varieties were
also sold (Pray et al., 2002). This certainly restricts the company’s pricing range there, besides the
Sadashivappa and Qaim (2009) 6
fact that many Chinese cotton growers reproduce their own Bt cotton seeds. Therefore, the
government price caps in India appear to be the outcome of a strong political lobbying process,
rather than the result of an objective analysis. Further implications of the price interventions for
technology adoption, impacts, and longer term innovation are discussed below.
Farm Level Effects of Bt Cotton
Data
We now turn to the analysis of the farm level effects of Bt cotton in India over time. For this
purpose we have carried out three rounds of a panel survey of farmers in four cotton-growing
states. The four states are Maharashtra, Karnataka, Andhra Pradesh, and Tamil Nadu, which are
representative of cotton production in central and southern India. The first round of the survey
was carried out in 2002-03, the first season for which Bt cotton hybrids had been officially
commercialized in India. In total, we selected 341 farmers through a stratified random sampling
procedure, covering 10 districts and 58 villages in the four states. As the proportion of Bt
adopters was very small in the first season, we purposely over-sampled them using complete
customer lists of Bt seed sales from which we randomly selected. Hence we generated two
representative sub-samples, one from the population of official Bt adopters, and the other from
the population of non-adopters. (For the analyses, sampling weights are used where appropriate.
Further details of the sampling procedure are explained in Qaim et al., 2006.) The farmers were
interviewed on several aspects of cotton cultivation, including input use and output details. These
data were collected at the plot level. Farmers who cultivated both Bt and conventional cotton on
their farm answered the questions for both alternatives. So the number of plot observations is
somewhat larger than the number of farmers in the sample. Furthermore, we collected detailed
data on general farm, household, and contextual characteristics.
Sadashivappa and Qaim (2009) 7
The second round of the survey was carried out two years later in 2004-05, and the third
round again two years later in 2006-07. In these rounds, we tried to interview the same farmers as
in the first round, using the same questionnaire. However, several farmers from the first round
had migrated, passed away, or could not be met for other reasons. In the second round, we
managed to interview 318 farmers from the original sample (93%), and in the third round 289
(85%). In order to maintain the randomness and increase the sample size, we randomly selected
additional farmers in the same villages, so that the total sample size was 376 and 407 in 2004-05
and 2006-07, respectively.
Adoption Dynamics
Table 2 shows the dynamics of Bt cotton adoption in our sample – for the survey years and also
the seasons in-between. Due to the over-sampling of adopters in 2002-03, the adoption rates
shown are not representative for India as a whole. Nonetheless, it can be seen that adoption has
increased considerably over time, which is consistent with the country-wide data shown in Table
1.
(Here should appear Table 2)
Table 2 shows that a big jump in adoption occurred in 2005-06, where adoption among
sample farmers almost doubled from 44% to 80%. This can be considered as the takeoff phase of
Bt cotton adoption, which, interestingly occurred before the state governments had started to
control maximum retail prices in 2006. Obviously, farmers recognized the technology’s
advantages also before the price caps, so the government interventions were not the main thrust to
push adoption upward. Yet, the table also shows that adoption is not only a one-way process. Half
of all Bt adopters in 2002-03 disadopted the technology again after the season, because they were
Sadashivappa and Qaim (2009) 8
not fully satisfied. Also in subsequent seasons, disadoption occurred, although the share has
declined to 16% in 2006-07. And, many of the disadopters decided to try the technology again
after one or more seasons of break. These patterns suggest that Bt adoption is not an irreversible
decision for farmers. Rather, it is a process where farmers learn whether or not the technology is
suitable for their conditions, and how to properly adjust the use of inputs, especially pesticides.
Qaim et al. (2006) have pointed out that there is spatial variability in Bt cotton impacts, because
levels of pest pressure differ. For farmers in low pest pressure areas, the benefits of Bt are
relatively small, in some cases even smaller than the seed price markup. In those cases, seed price
caps could indeed lead to significant increases in adoption. But impact variability is also due to
germplasm effects: especially in the first years of adoption, Bt was incorporated only in a few
cotton hybrids, which were not suitable for all agroecological conditions. As mentioned above,
the number of Bt cotton hybrids has increased considerably over time.
In terms of farm sizes, Table 2 shows that in the beginning Bt adopters were slightly
larger than non-adopters. But, over the years, the average farm size of adopters has declined,
suggesting that more and more smallholder cotton producers took up Bt technology as well. In
2005-06, the mean farm size of Bt users was reduced to 12 acres, which corresponds to the
overall average in the study regions. Some of the very small cotton producers have not adopted,
so that the average area of non-adopters has declined to around 9 acres. Subramanian and Qaim
(2009) have shown that the indirect advantages of Bt are somewhat lower for smallholders than
for larger farms in India. Nonetheless, there is clear evidence that both small and large cotton
producers benefit considerably from the technology (Qaim, Pray, & Zilberman, 2008).
Sadashivappa and Qaim (2009) 9
Crop Enterprise Budgets
Based on our survey data, the agronomic and economic performance of Bt cotton at the plot level
is shown in Table 3. The results are summarized in Table 4. While the sample contains a few
observations of farmers who have used illegal Bt seeds, most Bt adopters had used official seeds.
In all three seasons that we surveyed, the number of insecticide sprays and insecticide amounts
used were significantly lower on Bt than on conventional plots. The exact reductions vary from
year to year, which is partly due to seasonal variations in pest pressure. In 2002-03 and 2004-05,
insecticide quantities on Bt plots were reduced by approximately 50%. This is consistent with
other studies for India (Bennett et al., 2006; Gandhi & Namboodiri, 2006).
In 2006-07, average reductions were only 21%. Yet, this lower reduction is not due to
increases in insecticide sprays on Bt plots, as one might expect when Bt resistance would emerge
or secondary pests would gain in importance. On the contrary, sprays on Bt plots were further
reduced, but sprays on conventional plots were reduced as well. This might be due to self-
selection of farmers: by 2006-07, farmers who used to apply a lot of insecticides in conventional
cotton had adopted Bt technology, so that the sample of non-adopters now mostly consists of
farmer who spray little anyway, either because of lower pest problems or because of lack of
awareness. Moreover, due to the wide dissemination of Bt cotton over the past 2-3 years, there
seems to be an overall decline in the populations of Bt target pests, especially the American
bollworm (Khadi, Rao, & Singh, 2007). This can be interpreted as a positive externality of Bt
technology for non-adopting farmers. (It could potentially even lead to a free-rider problem,
including technology disadoption among some, although the relatively low Bt seed prices
observed today might prevent this from happening.)
(Here should appear Tables 3 and 4)
Sadashivappa and Qaim (2009) 10
Apart from insecticide reductions, a major effect of Bt cotton in India is a significant
yield advantage due to lower crop losses, as previously predicted by Qaim and Zilberman (2003).
Over the years, average yields were 30-40% higher on Bt than on conventional plots, which is
due to more effective pest control and thus a reduction in crop damage. Again, differences over
the years are largely due to variability in pest pressure. Higher yields and crop revenues are also
the main reason for the significant gains in cotton profits. Profit differences between Bt and
conventional cotton even increased over time, from Rs. 2161 (US $49.23) per acre in 2002-03 to
Rs. 2940 (US $66.97) in 2006-07. These are large benefits for cotton-producing households in
India, many of whom live near or below the poverty line.
What is the role of the government’s seed price interventions in this respect? Tables 3 and
4 demonstrate that Bt seed costs were indeed much lower after the interventions in 2006. In the
initial years of adoption, official Bt seeds were more than three times as expensive as
conventional seeds, while by 2006-07 the average price markup had declined to 68%. Therefore,
the state price controls unquestionably contributed to increasing advantages for farmers, but it
should be stressed that significant benefits also occurred prior to these interventions. In summary,
Bt cotton adoption is associated with remarkable agronomic and economic advantages for farmers
in India, and the observed benefits have been sustainable over the first five years of widespread
technology use.
Net Productivity Effects
In the previous sub-section, we have compared crop performance between Bt and conventional
cotton plots. However, a mere comparison of mean yield levels might lead to a bias, because
other factors that could vary between the plots are not controlled for. This requires an
econometric approach. We specify a Cobb-Douglas production function, where cotton yield per
Sadashivappa and Qaim (2009) 11
acre (expressed in logarithmic terms) is used as dependent variable, and inputs such as fertilizers,
pesticides, labor, and irrigation as independent variables. Moreover, state dummies capture
regional effects. A Bt dummy is included as the treatment variable of particular interest here; this
takes a value of one if the plot was grown with Bt cotton hybrids and zero if conventional hybrids
were used. The production function was estimated separately for the three seasons. The estimated
coefficients for the Bt dummy as well as the derived net yield effects are shown in Table 5 (model
1). The results are similar to the yield differences shown in Table 4, but they are not identical,
which underlines that controlling for differences in input use is important when analyzing the
productivity effects of new technologies.
(Here should appear Table 5)
Another potential problem in impact analysis is a selectivity bias; as technology adoption
is not a random process, there might be farmer or household unobservables, which could lead to
correlation between the Bt variable and the error term. A common way to deal with this problem
is to use an instrumental variable approach or similar two-step estimation procedures. For
instance, Fernandez-Cornejo, Klotz-Ingram, & Jans (2002) estimated a two-step treatment effects
model in their analysis of the farm level effects of herbicide-tolerant soybeans in the US.
Unfortunately, in our context we could not identify a suitable instrument, which is correlated with
Bt adoption but uncorrelated with cotton yield. However, the advantage of our data is that
observations for both Bt and conventional cotton plots are partly available on the same farms.
Adopting farmers in our sample often grew a plot of Bt cotton next to a plot of conventional
cotton, in order to gain more experience with the technology during the early adoption phases.
We used this fact to re-estimate our Cobb-Douglas production functions, but excluding the non-
adopters. Thus, the sample only consists of the Bt and conventional plots of adopting farmers, so
Sadashivappa and Qaim (2009) 12
that the treatment effect cannot be disturbed through differences in unobservables between
adopters and non-adopters. The results of these additional estimates are also shown in Table 5
(model 2). For 2002-03, the net yield effect of Bt cotton is somewhat lower than the one derived
with model 1, while it is higher in 2004-05. The magnitude of the effects is similar to that in
model 1, however, suggesting that a selectivity bias is small and without a clear direction over the
years.
There are also authors that have estimated productivity effects of Bt cotton using a
damage control specification (e.g., Huang et al., 2002; Qaim & de Janvry, 2005; Kuosmanen,
Pemsl, & Wesseler, 2006), as Bt actually leads to a reduction in crop damage rather than an
increase in yield potential. In order to test how sensitive our results are to different model
specifications, we also employed a damage control framework. As in Qaim & Zilberman (2003),
we incorporated the Bt dummy in a logarithmic damage control function. The results of these
non-linear estimates are also shown in Table 5 (model 3). The net yield gains are fairly similar to
the ones derived with the Cobb-Douglas production functions. Hence, we conclude that the
finding of positive and sustainable net yield effects is robust to different model specifications.
Willingness to Pay for Bt Cotton Seeds
A farmer’s decision to adopt a new technology reveals that his or her expected utility derived
from the innovation is bigger than or equal to its price. For Bt cotton in India, widespread
adoption demonstrates that this is the case for the majority of farmers. However, the positive
adoption decision does not reveal the concrete magnitude of the expected utility for an individual
farmer. This might be near to the market price or also well above. In order to better understand
Indian farmers’ valuation of Bt cotton, we estimate the WTP for the technology based on stated
preference data.
Sadashivappa and Qaim (2009) 13

Methodology
We analyze farmers’ WTP for official Bt cotton seeds using a contingent valuation (CV)
dichotomous choice approach. During all three survey rounds, farmers – both adopters and non-
adopters – were asked whether they would use the technology in the next cotton season at a
certain initial price bid, P. If the response was “yes”, no follow-up question was asked, but if the
response was “no”, the same question was asked at a certain lower price bid, PL. Hence, farmers
can be categorized into three possible response groups, namely “yes”, “no-yes”, and “no-no”.
This is called a one-and-one-half-bound dichotomous choice format; Cooper, Hanemann, &
Signorello (2002) showed that this is more efficient than the double-bounded CV method, besides
reducing a potential response bias, as it eliminates the element of surprise of a higher second price
bid. A similar approach was also used by Qaim & de Janvry (2003) to estimate WTP for Bt cotton
seeds in Argentina. In terms of the price bids, in the first two survey rounds, we set the initial
price bid, P, at the prevailing market price for official Bt seeds of Rs. 1600 per packet. Follow-up
price bids, PL, were randomly varied between questionnaires in Rs. 100 intervals between Rs.
200-1500. Due to the price interventions in 2006, in the 2006-07 round, P was randomly varied
between Rs. 1200-1600, and PL between Rs. 600-1100.
We estimate WTP separately for the three seasons using the following log-likelihood
function (Qaim and de Janvry, 2003):
⎥⎦
⎤⎢⎣
⎡⎟⎠⎞
⎜⎝⎛ −
Φ+
∑ ⎥⎦
⎤⎢⎣
⎡⎟⎠⎞
⎜⎝⎛ −
Φ−⎟⎠⎞
⎜⎝⎛ −
Φ+⎥⎦
⎤⎢⎣
⎡⎟⎠⎞
⎜⎝⎛ −
Φ−==
σβ
σβ
σβ
σβ
XPd
XPXPdXPdL
LNN
n
i
LNYY
'ln
''ln'1lnln1
Sadashivappa and Qaim (2009) 14
where dY, dNY, and dNN are dummy variables for the three response groups, X is a vector of farm,
household, and contextual variables expected to influence WTP, and σ is the standard error of
the regression. The estimation coefficients β can directly be interpreted as the marginal effects
of the X variables on WTP. Mean WTP is derived by evaluating the estimated coefficients at
variable mean values.
Estimation Results
The results of estimating the WTP models for the three survey rounds are shown in Table 6. Farm
size, expressed in terms of land area owned, has a positive influence on WTP for Bt cotton seeds,
but the effect is very small and only statistically significant in 2006-07: for every additional acre
of land owned by the farmer, his/her WTP increases by around Rs. 15 per packet. In contrast,
availability of irrigation facilities has no significant influence on WTP. Nor does soil quality
show a clear pattern. Black soils are considered to provide the best growing conditions for cotton,
so farmers possessing such soils might be expected to derive higher utility from Bt technology.
Indeed, their WTP was Rs. 455 higher in 2002-03, but this effect turned insignificant in
subsequent years. Apparently, farmers have realized that Bt technology is advantageous also
under less favorable agroecological conditions.
Input dealers are a very important source of information about new technologies for
farmers in India. This also holds true for Bt cotton. However, since input dealers make a large
share of their profits through pesticide sales, which are reduced through Bt, they were not too
happy with the technology initially (Kambhampati et al., 2005). Partly, input dealers even
contributed to the spread of misinformation about Bt cotton during the early stages. With the
rapid rise of Bt adoption, input dealers now make good profits also through seed sales. So it is not
surprising that those farmers, for whom the input dealer is the major source of information, had a
Sadashivappa and Qaim (2009) 15
significantly higher WTP in 2004-05, but not in 2002-03. In 2006-07 the technology had already
spread so widely that the source of information was not relevant anymore.
(Here should appear Table 6)
In India, cotton is grown in the form of both hybrids and OPVs, although Bt has so far
only been commercialized in hybrids. Some previous OPV growers have switched to hybrids
through Bt adoption. Nonetheless, the results in Table 6 show that farmers, who had already used
hybrids previously, have a significantly higher WTP for Bt cotton. Strikingly, the farmer’s
educational level does not significantly influence WTP, whereas experience with cotton
cultivation has a positive impact. It is not unlikely that farmers with longer cotton experience
have already tried different approaches of pest control, so that Bt is a particularly welcome
alternative. Except for 2002-03, household expenditure, which we use as a proxy for living
standard, had a positive effect on WTP, and this effect was significant in 2004-05. Furthermore,
previous use of Bt cotton influences WTP in a positive way, especially in 2004-05, indicating that
– after an initial learning process – most farmers are now satisfied with their own technological
experience.
The district dummy variables in Table 6 were included to account for possible regional
effects. Many of them are significant, although partly with varying signs over the years. This is
actually not surprising. To some extent, the district dummies capture pest pressure, which can
fluctuate spatially and seasonally. For instance, if bollworm pressure is high in a particular district
and season, farmers’ WTP for Bt seeds will be high too in the next season, and vice versa. In
addition, germplasm effects might play a role (Qaim et al., 2006). As mentioned above, in the
first years of adoption, only a few Bt hybrids were available, which were not very well adapted to
all agroecological conditions in India, so that their performance was different across districts. For
Sadashivappa and Qaim (2009) 16
instance, in 2002-03, negative germplasm effects of Bt hybrids particularly occurred in the state
of Andhra Pradesh. This is reflected in the low WTP for Bt seeds after that season in Guntur,
Kareemnagar, and Warangal districts, all three located in Andhra Pradesh. Especially since 2005,
the number of Bt hybrids commercialized in India has increased considerably, so that problems of
negative germplasm effects became much less severe. Accordingly, regional differences in
farmers’ WTP for Bt seeds have declined in our last survey round, both in terms of coefficient
sizes and significance levels.
Mean WTP
Based on the estimation results, we also derived farmers’ mean WTP for Bt cotton seeds. As Bt
adopters were over-sampled in the beginning of our panel, we used sampling weights for adopters
and non-adopters in all three survey rounds, in order to obtain results which are representative of
the situation in central and southern India. The results are shown in the last row of Table 6. After
the 2002-03 growing season, mean WTP was Rs. 1633 per packet of Bt seeds, which was very
near to the official market price, indicating that many farmers had a general openness to try the
new technology in spite of the fact that Bt seed prices were relatively high. This is consistent with
the increasing adoption rates in subsequent years. After the 2004-05 season, mean WTP even
increased to Rs. 2595. This coincides with the technology’s takeoff phase in India.
In 2006, the government interventions started, fixing Bt seed prices at Rs. 750 per packet.
Even though price caps should not influence farmers’ technology valuation in theory, it appears
that they did lower mean WTP – at least in terms of stated preferences. The explanation is simple:
if farmers know that the price is officially fixed at a certain level, why should they reveal their
true valuation of the technology in a CV survey? Remarkably, however, the mean WTP estimated
for 2006-07 is still much higher than the maximum retail price of Rs. 750. This underlines that the
Sadashivappa and Qaim (2009) 17
benefits perceived by most farmers considerably outweigh the official price; discounting for a
potential response bias in our survey context, the true WTP might still be higher. Our analysis
shows that also at the previous price of Rs. 1600 per packet, Bt adoption rates would only be
slightly lower than they actually are today, still exceeding 50%. This is not to say that Bt demand
is unresponsive to seed price changes, but the price responsiveness decreases at lower price
levels. Strikingly, the low maximum retail price led to a situation where Bt seed demand was
much higher than supply in 2006, and there were incidents of farmers mobbing Bt cotton sales
points, worrying that they might not get a sufficient quantity of seeds (The Hindu Business Line,
2007). Indeed, some farmers in our 2006-07 survey round reported that they had to pay more than
the maximum retail price to obtain Bt seeds, and they were more than willing to do so.
Conclusion
In this article, we have analyzed the field performance of Bt cotton in India over the first five
years of technology adoption. We have used three rounds of a panel data set, which is
representative of the country’s central and southern cotton-growing parts. Bt cotton technology
has proved to be a success story in India, with farmers benefiting from pesticide reductions,
higher effective yields, and significantly higher profits. So far, these advantages have been
sustainable, with no indications of Bt resistance development or the sudden spread of secondary
pests. Even though the diffusion of Bt was a learning process for farmers in the beginning,
aggregate adoption has increased steadily and has reached 65% of the country’s cotton area in
2007-08. This widespread technology adoption has helped in achieving a record cotton harvest in
India, at a time when other cotton-producing countries are rather facing a slowdown in
production. Both small and large-scale cotton farmers in India are now very satisfied with the
innovation, as is reflected in their high WTP for Bt seeds. This situation bodes well for other Bt
Sadashivappa and Qaim (2009) 18
technologies likely to be introduced in India in the near future, such as Bt vegetables (e.g.,
Krishna and Qaim, 2007). Indian authorities are also at the verge of approving the first public
sector Bt cotton OPVs.
Beyond the farm level effects, we have also analyzed the issue of government price
interventions in the cotton seed market. In 2006, Indian state governments had set maximum
retail prices for Bt seeds at Rs. 750 per packet, which is less than half the price charged by seed
companies before. This policy seems to be the outcome of a strong political lobbying process,
rather than the result of an objective analysis of what a “reasonable” price level would be. The
price caps have further increased the profits to farmers, and they probably also contributed to the
declining role of illegal Bt seeds, which were rampant in India until recently. But the impact of
the price controls on aggregate technology adoption is relatively small: the takeoff phase for Bt
cotton in India had already started before 2006, and today’s adoption rates would not be much
lower even without the interventions.
What are potential longer-term implications of the price controls in India? When there is
a minimum protection of intellectual property rights, technology developers always have some
kind of monopoly, which allows them to charge a price higher than the competitive market price.
As this price markup is meant to cover the research investments plus some profits for the
innovator, it acts as an incentive for private companies to develop new technologies. Yet, in the
case of GM seeds, the monopoly is a restricted one, because there are always conventional seeds
as alternative that farmers prefer when GM seed prices become too high (Basu and Qaim, 2007).
Therefore, a company interested in widespread adoption of its GM seeds can only charge a price
that leaves sufficient benefits for farmers. If the government fixes the seed price and trait value at
a much lower arbitrary level, as for Bt cotton in India, farmers’ benefits might further increase in
Sadashivappa and Qaim (2009) 19
the short run, but company revenues shrink and so does the incentive to invest into the
development of new technologies (Lence et al., 2005). Therefore, longer-term innovation rates
and agricultural productivity growth could suffer, especially in a country like India, where the
private sector contribution to crop improvement research has been very important in the recent
past. Even the short run benefits for farmers are reduced by the fact that the price caps led to a
shortage of seed supply, thus increasing effective seed prices – also including the opportunity
costs for those whose demand remained unsatisfied.
Government price controls also tend to create a mentality among farmers that they have a
right to cheap technologies, regardless of the benefits, as is reflected by the drop in Indian
farmers’ WTP for Bt cotton seeds after 2006. This is not to say that government interventions in
seed pricing are always bad. In some cases, such policies might be important to improve the
access of disadvantaged farmers to beneficial new technologies. However, if necessary,
interventions should be implemented in a more targeted way, based on a careful situation
analysis, in order to avoid negative long-term consequences for agricultural innovation.
Sadashivappa and Qaim (2009) 20
References
Basu, A.K., & Qaim, M. (2007). On the Adoption of Genetically Modified Seeds in Developing Countries and the Optimal Types of Government Intervention. American Journal of Agricultural Economics, 89(3), 784-804.
Bennett, R., Ismael, Y., & Morse, S. (2005). Explaining contradictory evidence regarding impacts of genetically modified crops in developing countries: varietal performance of transgenic cotton in India. Journal of Agricultural Science, 143, 35-41.
Bennett, R., Kambhampati, U., Morse, S & Ismael, Y. (2006). Farm-level economic performance of genetically modified cotton in Maharashtra, India. Review of Agricultural Economics, 28(1), 59-71.
CAI (Cotton Association of India). (2008). Cotton statistics and news. (Issue No. 42, 15 January 2008). Available on the World Wide Web: http://www.eica.in.
Chandrashekhar, G. (2006). Are tech fees for Bt cottonseed really high? Available on the World Wide Web: http://www.thehindubusinessline.com/2006/06/04/stories/2006060402670400.htm.
Cooper, J, C., Hanemann, M., & Signorello, G. (2002). One-and-one-half-bound dichotomous choice contingent valuation. The Review of Economics and Statistics, 84(4), 742-750.
Crost, B., Shankar, B., Bennett, R., & Morse, S. (2007). Bias from farmer self-selection in genetically modified crop productivity estimates: evidence from Indian data. Journal of Agricultural Economics, 58(1), 24-36.
Fernandez-Cornejo, J., Klotz-Ingram, C., & Jans, S. (2002). Farm-level effects of adopting herbicide-tolerant soybeans in the U.S.A. Journal of Agricultural and Applied Economics, 34, 149-163.
Fukuda-Parr, S. (2007). Emergence and global spread of GM crops: explaining the role of institutional change. In Fukuda-Parr, S. (Eds.), The gene revolution: GM crops and unequal development (pp 15-35). London, Sterling, VA; Earthscan.
Gandhi, V.P., & Namboodiri, N.V. (2006). The adoption and economics of Bt cotton in India: preliminary results from a study. (Working paper number 2006-09-04). Ahmedabad, India: Indian Institute of Management.
Huang, J., Hu, R., Rozelle, S., Qiao, F., & Pray, C.E. (2002). Transgenic varieties and productivity of smallholder cotton farmers in China. Australian Journal of Agricultural and Resource Economics, 46, 367-387.
Hubbell, B.J., Marra, M.C., & Carlson, G.A. (2000). Estimating the demand for a new technology: Bt cotton and insecticide policies. American Journal of Agricultural Economics, 82, 118-132.
Sadashivappa and Qaim (2009) 21
James, C. (2007). Global status of commercialized biotech/GM crops: 2007 (ISAAA Brief No.37). Ithaca, NY: International Service for the Acquisition of Agri-Biotech Applications.
Kambhampati, U., Morse, S., Bennett, R., & Ismael, Y. (2005). Perceptions of the impacts of genetically modified cotton varieties: a case study of the cotton industry in Gujarat, India. AgBioForum, 8(2&3), 161-171.
Khadi, B.M., Rao, M.R.K., & Singh, M. (2007). Potential to improve lives of ryots, (The Hindu Survey of Indian Agriculture), Chennai, India, The Hindu.
Kuosmanen, T., Pemsl, D., & Wesseler, J. (2006). Specification and estimation of production functions involving damage control inputs: a two-stage, semiparametric approach. American Journal of Agricultural Economics, 88, 499-511.
Krishna, V.V., & Qaim, M. (2007). Estimating the adoption of Bt eggplant in India: Who benefits from public-private partnership? Food Policy, 32, 523-543.
Lalitha, N. (2004). Diffusion of agricultural biotechnology and intellectual property rights: emerging issues in India. Ecological Economics, 49, 187-198.
Lence, S.H., Hayes, D.J., McCunn, A., Smith, S., & Niebur, W.S. (2005). Welfare impacts of intellectual property protection in the seed industry. American Journal of Agricultural Economics, 87(4), 951-968.
Murugkar, M., Ramaswami, B., & Shelar, M. (2007). Competition and monopoly in the Indian cotton seed market. Economic and Political Weekly, 42(37), 3781-3789
Pray, C.E., Bengali, P., & Ramaswami, B. (2005). The cost of biosafety regulations: the Indian experience. Quarterly Journal of International Agriculture, 44, 267–289.
Pray, C.E., Huang, J., Hu, R., & Rozelle, S. (2002). Five years of Bt cotton in China - the benefits continue. The Plant Journal, 31(4), 423-430.
Qaim, M., & de Janvry, A. (2003). Genetically modified crops, corporate pricing strategies and famers’ adoption: the case of Bt cotton in Argentina. American Journal of Agricultural Economics, 85(4), 814-828.
Qaim, M., & Zilberman, D. (2003). Yield effects of genetically modified crops in developing countries. Science, 299, 900-902.
Qaim, M., & de Janvry, A. (2005). Bt cotton and pesticide use in Argentina: economic and environmental effects. Environment and Development Economics, 10, 179-200.
Qaim, M., Pray, C.E., & Zilberman, D. (2008). Economic and Social Considerations in the Adoption of Bt Crops. In J. Romeis, A. Shelton, & G. Kennedy (Eds.). Integration of Insect-Resistant Genetically Modified Crops within IPM Programs. (pp. 329-356). New York: Springer.
Sadashivappa and Qaim (2009) 22

Qaim, M., Subramanian, A., Naik, G., & Zilberman, D. (2006). Adoption of Bt cotton and impact variability: insights from India. Review of Agricultural Economics, 28(1): 48–58.
Subramanian, A., & Qaim, M. (2009). Village-wide effects of agricultural biotechnology: the case of Bt cotton in India. World Development, 37, 256-267.
The Hindu Business Line. (2006a). AP government moves MRTPC against Monsanto on Bt cotton royalty, 3 January. Available on the World Wide Web: http://www.thehindubusinessline.com/2006/01/03/stories/2006010301881200.htm
The Hindu Business Line. (2006b). Bt cotton royalty issue: AP seeks PM’s support, 24 January. Available on the World Wide Web: http://www.thehindubusinessline.com/2006/01/24/stories/2006012401701900.htm
The Hindu Business Line. (2007). Farmers rush for Bt cottonseeds in Andhra Pradesh, 29 May. Available on the World Wide Web: http://www.thehindubusinessline.com/2007/05/29/stories/2007052900791200.htm
Wang, S., Just, D., & Pinstrup-Andersen, P. (2006, July). Tarnishing Silver Bullets: Bt Technology Adoption, Bounded Rationality and the Outbreak of Secondary Pest Infestations in China. Paper presented at the American Agricultural Economics Association Annual Meetings, Long Beach, CA.
Sadashivappa and Qaim (2009) 23
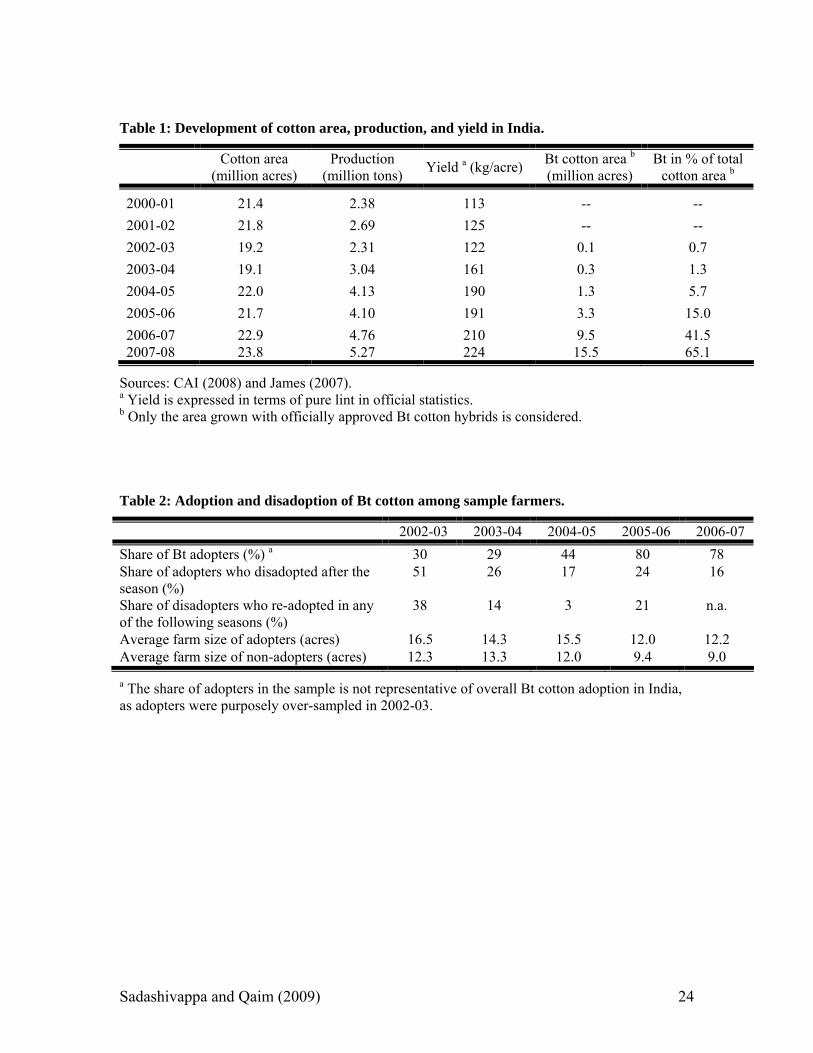
Table 1: Development of cotton area, production, and yield in India.
Cotton area (million acres)
Production (million tons) Yield a (kg/acre) Bt cotton area b
(million acres) Bt in % of total
cotton area b
2000-01 21.4 2.38 113 -- -- 2001-02 21.8 2.69 125 -- -- 2002-03 19.2 2.31 122 0.1 0.7 2003-04 19.1 3.04 161 0.3 1.3 2004-05 22.0 4.13 190 1.3 5.7 2005-06 21.7 4.10 191 3.3 15.0 2006-07 22.9 4.76 210 9.5 41.5 2007-08 23.8 5.27 224 15.5 65.1
Sources: CAI (2008) and James (2007). a Yield is expressed in terms of pure lint in official statistics. b Only the area grown with officially approved Bt cotton hybrids is considered. Table 2: Adoption and disadoption of Bt cotton among sample farmers.
2002-03 2003-04 2004-05 2005-06 2006-07 Share of Bt adopters (%) a 30 29 44 80 78 Share of adopters who disadopted after the season (%)
51 26 17 24 16
Share of disadopters who re-adopted in any of the following seasons (%)
38 14 3 21 n.a.
Average farm size of adopters (acres) 16.5 14.3 15.5 12.0 12.2 Average farm size of non-adopters (acres) 12.3 13.3 12.0 9.4 9.0
a The share of adopters in the sample is not representative of overall Bt cotton adoption in India, as adopters were purposely over-sampled in 2002-03.
Sadashivappa and Qaim (2009) 24
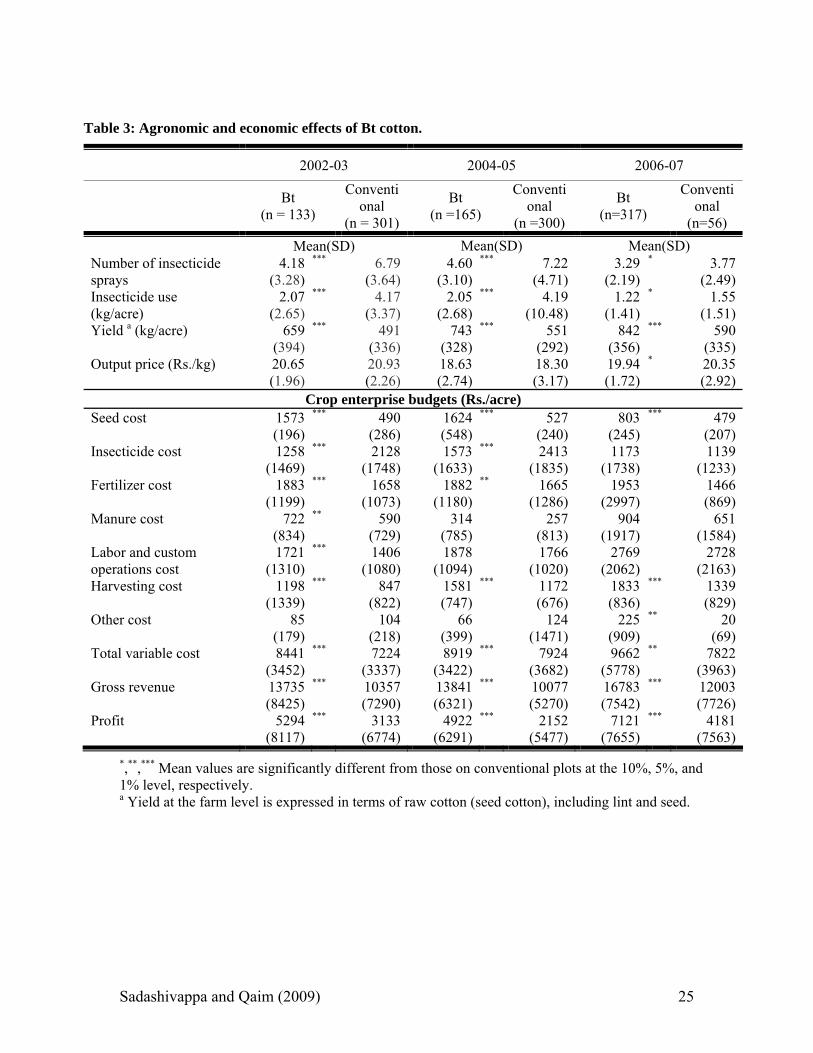
Table 3: Agronomic and economic effects of Bt cotton.
2002-03 2004-05 2006-07
Bt (n = 133)
Conventional
(n = 301)
Bt (n =165)
Conventional
(n =300)
Bt (n=317)
Conventional
(n=56) Mean(SD) Mean(SD) Mean(SD) Number of insecticide sprays
4.18 (3.28)
*** 6.79 (3.64)
4.60 (3.10)
***
7.22
(4.71)3.29
(2.19) * 3.77
(2.49)Insecticide use (kg/acre)
2.07 (2.65)
*** 4.17 (3.37)
2.05 (2.68)
***
4.19
(10.48)1.22
(1.41) * 1.55
(1.51)Yield a (kg/acre) 659
(394) *** 491
(336)743
(328)***
551
(292)842
(356) *** 590
(335)Output price (Rs./kg) 20.65
(1.96) 20.93
(2.26)18.63 (2.74)
18.30 (3.17)
19.94 (1.72)
* 20.35 (2.92)
Crop enterprise budgets (Rs./acre) Seed cost 1573
(196) *** 490
(286) 1624 (548)
***
527
(240)803
(245) *** 479
(207)Insecticide cost 1258
(1469) *** 2128
(1748) 1573
(1633)*** 2413
(1835)1173
(1738) 1139
(1233)Fertilizer cost 1883
(1199) *** 1658
(1073) 1882
(1180)**
1665
(1286)1953
(2997) 1466
(869)Manure cost 722
(834) ** 590
(729) 314
(785)
257
(813)904
(1917) 651
(1584)Labor and custom operations cost
1721 (1310)
*** 1406 (1080)
1878 (1094)
1766
(1020)2769
(2062) 2728
(2163)Harvesting cost 1198
(1339) *** 847
(822) 1581 (747)
***
1172 (676)
1833 (836)
*** 1339 (829)
Other cost 85 (179)
104 (218)
66 (399)
124
(1471)225
(909) ** 20
(69)Total variable cost 8441
(3452) *** 7224
(3337) 8919
(3422)*** 7924
(3682)9662
(5778) ** 7822
(3963)Gross revenue 13735
(8425) *** 10357
(7290) 13841 (6321)
***
10077 (5270)
16783 (7542)
*** 12003 (7726)
Profit 5294 (8117)
*** 3133 (6774)
4922 (6291)
*** 2152 (5477)
7121 (7655)
*** 4181 (7563)
*,**,*** Mean values are significantly different from those on conventional plots at the 10%, 5%, and 1% level, respectively. a Yield at the farm level is expressed in terms of raw cotton (seed cotton), including lint and seed.
Sadashivappa and Qaim (2009) 25
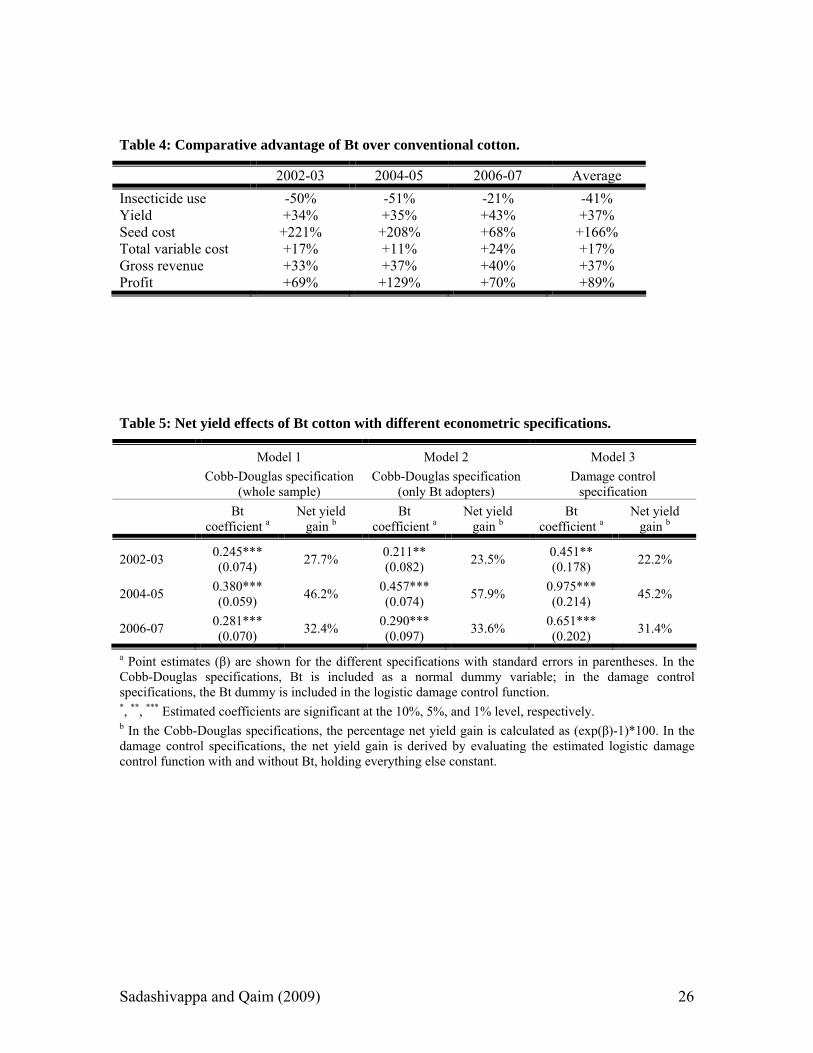
Table 4: Comparative advantage of Bt over conventional cotton.
2002-03 2004-05 2006-07 Average Insecticide use -50% -51% -21% -41% Yield +34% +35% +43% +37% Seed cost +221% +208% +68% +166% Total variable cost +17% +11% +24% +17% Gross revenue +33% +37% +40% +37% Profit +69% +129% +70% +89% Table 5: Net yield effects of Bt cotton with different econometric specifications.
Model 1 Cobb-Douglas specification
(whole sample)
Model 2 Cobb-Douglas specification
(only Bt adopters)
Model 3 Damage control
specification Bt
coefficient a Net yield
gain b Bt
coefficient a Net yield
gain b Bt
coefficient a Net yield
gain b
2002-03 0.245*** (0.074) 27.7% 0.211**
(0.082) 23.5% 0.451** (0.178) 22.2%
2004-05 0.380*** (0.059) 46.2% 0.457***
(0.074) 57.9% 0.975*** (0.214) 45.2%
2006-07 0.281*** (0.070) 32.4% 0.290***
(0.097) 33.6% 0.651*** (0.202) 31.4%
a Point estimates (β) are shown for the different specifications with standard errors in parentheses. In the Cobb-Douglas specifications, Bt is included as a normal dummy variable; in the damage control specifications, the Bt dummy is included in the logistic damage control function. *, **, *** Estimated coefficients are significant at the 10%, 5%, and 1% level, respectively. b In the Cobb-Douglas specifications, the percentage net yield gain is calculated as (exp(β)-1)*100. In the damage control specifications, the net yield gain is derived by evaluating the estimated logistic damage control function with and without Bt, holding everything else constant.
Sadashivappa and Qaim (2009) 26
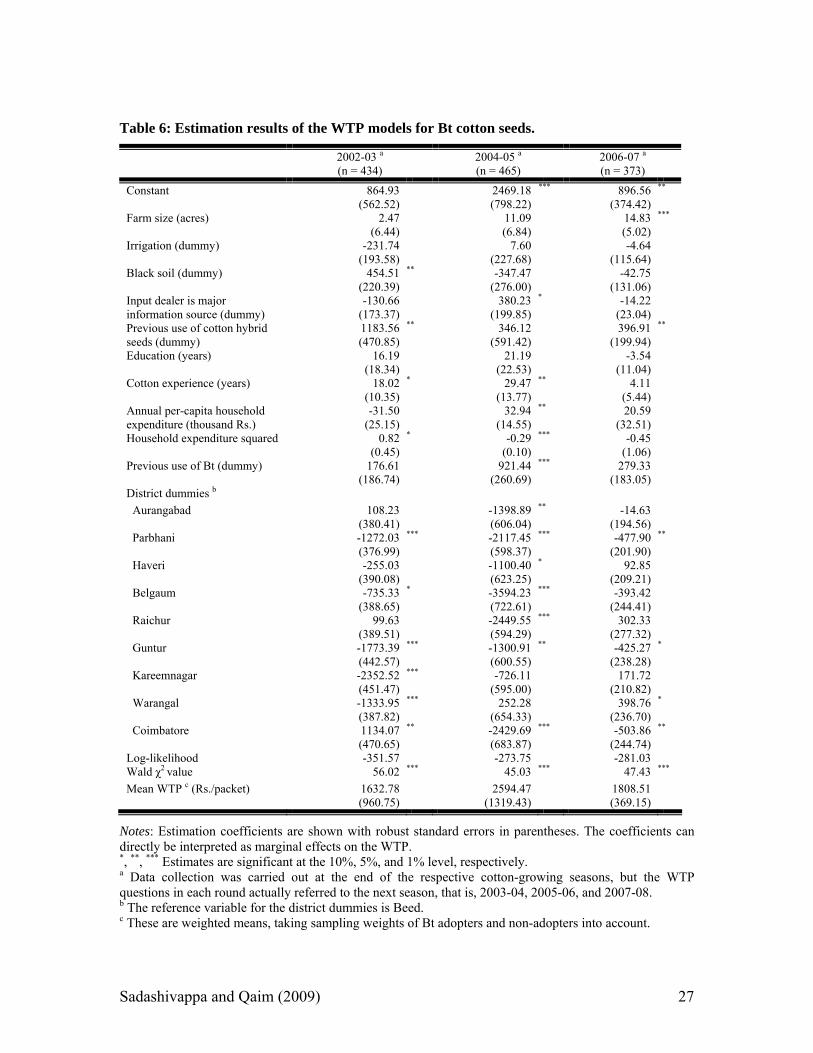
Table 6: Estimation results of the WTP models for Bt cotton seeds.
2002-03 a (n = 434)
2004-05 a (n = 465)
2006-07 a (n = 373)
Constant 864.93 (562.52)
2469.18 (798.22)
*** 896.56 (374.42)
**
Farm size (acres) 2.47 (6.44)
11.09 (6.84)
14.83 (5.02)
***
Irrigation (dummy) -231.74 (193.58)
7.60 (227.68)
-4.64 (115.64)
Black soil (dummy) 454.51 (220.39)
** -347.47 (276.00)
-42.75 (131.06)
Input dealer is major information source (dummy)
-130.66 (173.37)
380.23 (199.85)
* -14.22 (23.04)
Previous use of cotton hybrid seeds (dummy)
1183.56 (470.85)
** 346.12 (591.42)
396.91 (199.94)
**
Education (years) 16.19 (18.34)
21.19 (22.53)
-3.54 (11.04)
Cotton experience (years) 18.02 (10.35)
* 29.47 (13.77)
** 4.11 (5.44)
Annual per-capita household expenditure (thousand Rs.)
-31.50 (25.15)
32.94 (14.55)
** 20.59 (32.51)
Household expenditure squared 0.82 (0.45)
* -0.29 (0.10)
*** -0.45 (1.06)
Previous use of Bt (dummy) 176.61 (186.74)
921.44 (260.69)
*** 279.33 (183.05)
District dummies b
Aurangabad 108.23 (380.41)
-1398.89 (606.04)
** -14.63 (194.56)
Parbhani -1272.03 (376.99)
*** -2117.45 (598.37)
*** -477.90 (201.90)
**
Haveri -255.03 (390.08)
-1100.40 (623.25)
* 92.85 (209.21)
Belgaum -735.33 (388.65)
* -3594.23 (722.61)
*** -393.42 (244.41)
Raichur 99.63 (389.51)
-2449.55 (594.29)
*** 302.33 (277.32)
Guntur -1773.39 (442.57)
*** -1300.91 (600.55)
** -425.27 (238.28)
*
Kareemnagar -2352.52 (451.47)
*** -726.11 (595.00)
171.72 (210.82)
Warangal -1333.95 (387.82)
*** 252.28 (654.33)
398.76 (236.70)
*
Coimbatore 1134.07 (470.65)
** -2429.69 (683.87)
*** -503.86 (244.74)
**
Log-likelihood -351.57 -273.75 -281.03 Wald χ2 value 56.02 *** 45.03 *** 47.43 ***
Mean WTP c (Rs./packet) 1632.78 (960.75)
2594.47 (1319.43)
1808.51 (369.15)
Notes: Estimation coefficients are shown with robust standard errors in parentheses. The coefficients can directly be interpreted as marginal effects on the WTP. *, **, *** Estimates are significant at the 10%, 5%, and 1% level, respectively. a Data collection was carried out at the end of the respective cotton-growing seasons, but the WTP questions in each round actually referred to the next season, that is, 2003-04, 2005-06, and 2007-08. b The reference variable for the district dummies is Beed. c These are weighted means, taking sampling weights of Bt adopters and non-adopters into account.
Sadashivappa and Qaim (2009) 27
0
200
400
600
800
1000
1200
1400
1600
1800
2002-03 2004-05 2006-07
Mea
n pr
ice
in R
s./p
acke
t
Official priceBlack market price
Figure 1: Mean Bt cotton seed prices from official and black market sources.
Sadashivappa and Qaim (2009) 28