Embed Size (px)
Citation preview

1/29/14
1
Salary Market Study January 29, 2014
Achieve Today. Excel Tomorrow. Strategic Plan

1/29/14
2
Effective Leadership
Goal 3: The AISD will recruit and retain the most effective people by rewarding excellence and providing opportunities for continual growth.
Effective Leadership
Strategy: Engage a human resource consultant or consulting firm to review the District’s current salary structure to ensure compensation is properly aligned within the system and to conduct an external market analysis of salaries to ensure the District’s salaries are competitive.

1/29/14
3
Background § More than 10 years since last salary market study § Teachers, Librarians & Nurses
§ 2013-14 beginning teacher salaries increased to $50,000 § Equity adjustments given for teachers with 1 – 20 years
experience § 2013-14 teacher pay is above market average
§ Salary market study § Board directed during budget adoption process that district
contract for a salary market study for all positions
Salary Market Study Report Ann Patton, Sr. Compensation Consultant Texas Association of School Boards
1/29/14
4
Arlington ISD Pay Plan Review
January 29, 2014
Ann R. Patton, CCP Sr. Compensation Consultant
Kim Scambilis
Compensation Consultant
Pay Study Calendar
• September 2013 - Board approval • September 25, 2013 – Initial meeting with
administration • October 8-9. 2013 – Management interviews • December 4, 2013 – Video conference update • December 17, 2013 – Draft review • January 16, 2014 – Video conference • January 23, 2014 – Board Finance Committee • January 29, 2014 – Board presentation

1/29/14
5
Project Activities • Initial planning and data collection • Assess competitive pay levels for common jobs
– Used 2013-14 salary survey data
• Evaluate job assignments and recommend pay classifications
• Build pay range structures • Design implementation plan • Conduct draft review meetings and prepare
final report
Overall Findings
• Previous increases in the teacher pay schedule have caused compression with others in that career path. – Counselor pay schedule is lower than master’s
degree teachers and is slightly regressive • Qualified candidates are rejecting offers due to
salary. • Most managers reported concerns with
administrative support, paraprofessional and manual trades pay.
1/29/14
6
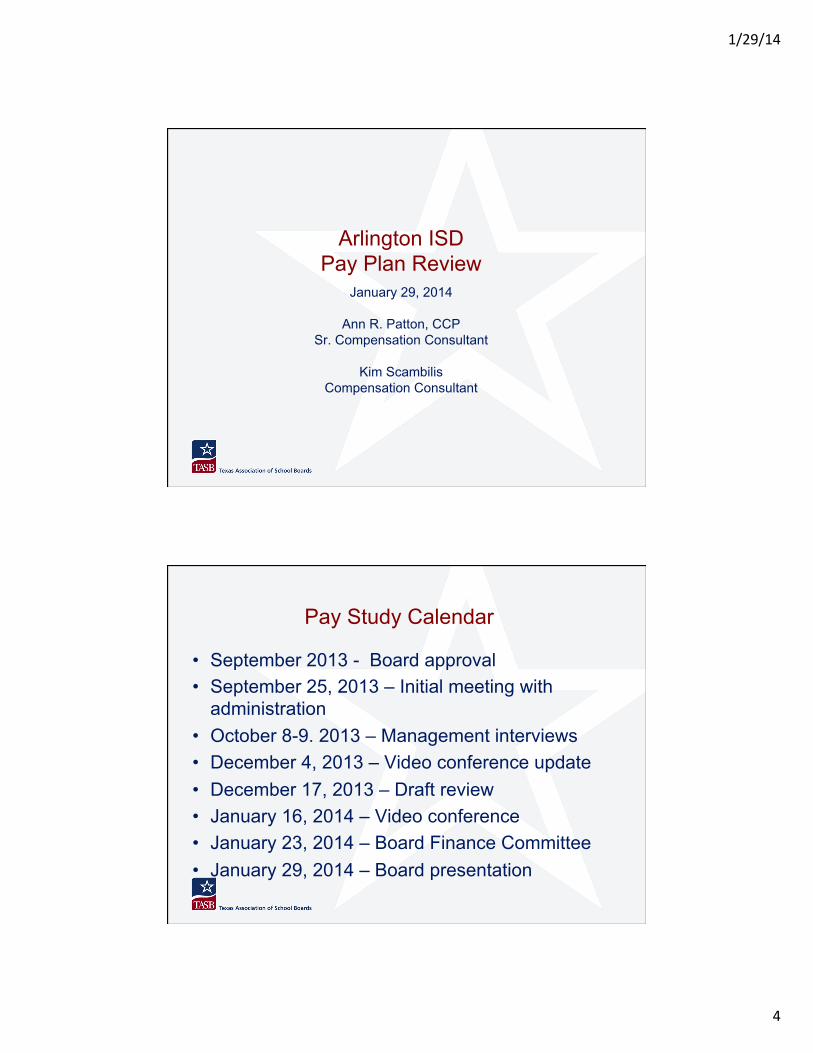
Overall Findings • Degree and licensure stipends are paid to non
exempt staff in lieu of market competitive pay. – Licensure is required for some skilled jobs – Purpose and intent of stipends need to be reevaluated
• Pay schedules have not been reviewed in over 10 years.
• Procedures for calculating offers to new hires, promotions and other employment actions require review.
• Lack of market competitive pay has caused negative morale.
• Time records for non exempt workers are kept at the campus/department instead of central office.
Teacher Market District
Student Enrollment
Number Tch Staff
0-‐Year Salary
5-‐Year Salary
10-‐Year Salary
15-‐Year Salary
20-‐Year Salary
Average Salary
Max Yrs Credit
Last % Increase
1 Hurst-‐Euless-‐Bedford ISD 21,970 1,336 $51,220 $51,276 $53,088 $54,570 $56,989 $55,976 42 2.0%
2 Irving ISD 35,355 2,481 $50,000 $51,700 $52,700 $53,930 $56,836 $53,775 25 2.0%
3 Mansfield ISD 32,869 1,959 $50,000 $51,423 $53,190 $54,393 $57,140 $54,323 30 2.0%
4 Birdvil le ISD 24,136 1,537 $49,000 $51,100 $52,530 $53,730 $55,980 $54,644 25 3.0%
5 Keller ISD 33,804 2,441 $48,500 $50,654 $53,019 $54,569 $56,869 $53,150 30 3.0%
6 Lewisvil le ISD 52,063 3,577 $48,325 $49,950 $50,950 $53,080 $55,732 $53,240 25 3.0%
7 Garland ISD 58,000 3,722 $48,000 $48,560 $50,170 $50,974 $53,566 $51,911 30 3.0%
8 Grapevine-‐Colleyvil le ISD 13,700 868 $47,600 $48,255 $49,289 $50,518 $53,144 $51,840 38 2.0%
9 Grand Prairie ISD 27,708 1,808 $47,500 $49,460 $50,943 $52,380 $54,022 $51,000 42 1.3%
10 Richardson ISD 38,185 2,603 $47,400 $48,900 $50,300 $51,675 $53,050 $50,659 25 5.0%
11 Carrollton-‐Farmers Branch ISD 26,325 1,684 $47,143 $48,171 $50,041 $51,911 $53,781 $51,736 30 2.5%
12 Fort Worth ISD 84,566 5,348 $47,000 $49,894 $52,226 $54,032 $57,646 $53,022 32 4.0%
13 Plano ISD 54,667 3,998 $47,000 $52,442 1.0%
14 Dallas ISD 158,932 9,726 $46,002 $47,839 $51,307 $53,908 $57,316 $52,757 38 2.0%
*Data obtained from district website
Arlington ISD 64,494 4,288 $50,000 $50,560 $52,250 $54,050 $56,850 $53,755 31 3.8%
Median $47,800 $49,894 $51,307 $53,730 $55,980 $52,890 30 2.3%
Comparison to Median 105% 101% 102% 101% 102% 102%Dollar Difference $2,200 $666 $943 $320 $870 $866
Statewide -‐ Enrollment 50,000 and over $47,081 $48,642 $50,457 $52,620 $55,728 $52,140
Comparison to Statewide 106% 104% 104% 103% 102% 103%Dollar Difference $2,919 $1,918 $1,793 $1,430 $1,122 $1,615
AISD
75th %
50th %
25th %
1/29/14
7
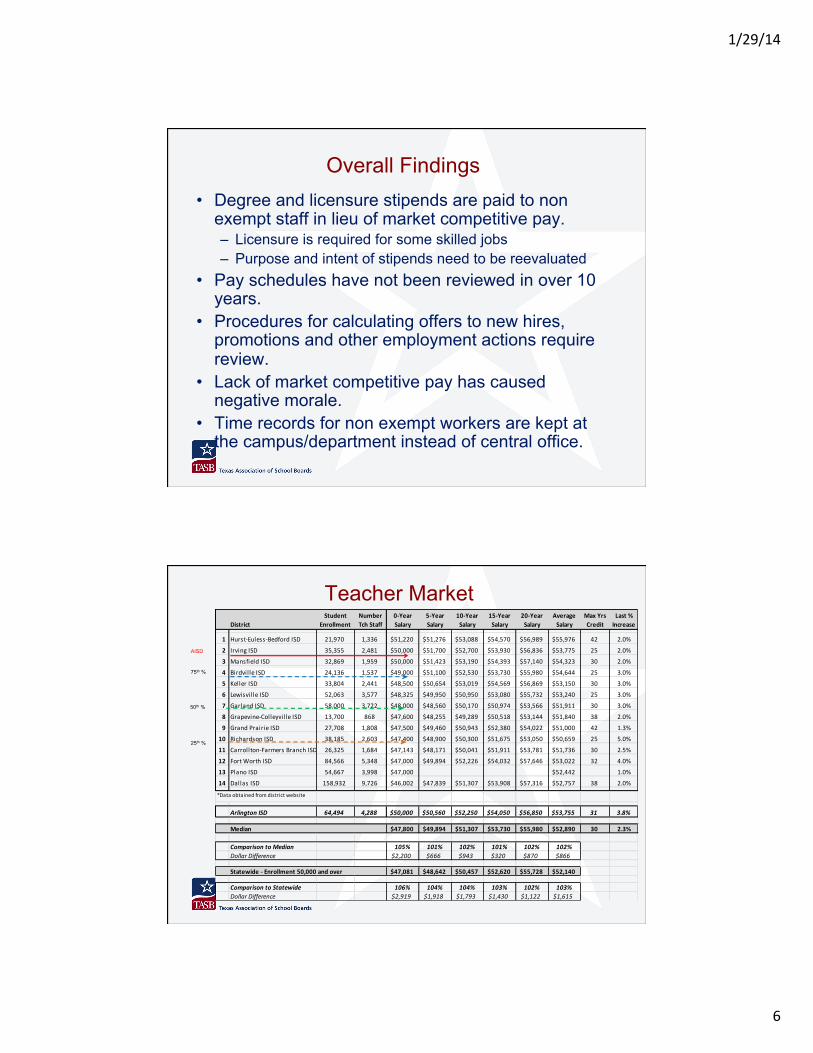
Teacher Stipends District
Student Enrollment
Master's Degree
Subject Area Master's
Secondary Math
Secondary Science Bilingual
Special Education ESL
Foreign Language
1 Dallas ISD 158,932 $3,200 $3,000
2 Fort Worth ISD 84,566 $1,300 $1,800 $1,800 $3,150 $450 $450
3 Garland ISD 58,000 $700 $3,000 $3,000 $3,000 $3,000
4 Plano ISD 54,667 $2,000 $2,700
5 Lewisvil le ISD 52,063 $1,000 $3,000 $2,500
6 Richardson ISD 38,185 $2,000 $2,000 $3,000 $2,000
7 Irving ISD 35,355 $1,000 $1,500 $2,000 $2,000 $3,000 $1,000 $1,200
8 Keller ISD 33,804 $1,000 $3,570 $2,040
9 Mansfield ISD 32,782 $1,000 $3,500
10 Grand Prairie ISD 27,708 $1,000 $1,000 $1,000 $3,000 $1,000
11 Carrollton-‐Farmers Branch ISD 26,325 $1,545 $2,000 $2,000 $3,085 $1,545
12 Birdvil le ISD 24,136 $1,500 $3,000
13 Hurst-‐Euless-‐Bedford ISD 21,970 $3,088 $3,000
14 Grapevine-‐Colleyvil le ISD 13,700 $2,228 $4,000 $1,051 $525
Arlington ISD 64,494 1,500 3,000
Median Stipend 1,300 1,500 2,000 2,000 3,000 1,000 1,200 1,263Average Stipend 1,582 1,500 1,967 1,967 3,143 1,398 1,449 1,263Count 13 1 6 6 14 5 5 2
Statewide -‐ Enrollment 50,000 and overAverage Stipend 1,399 0 2,386 2,386 2,659 1,803 1,387 0Count 16 0 9 9 17 10 10 0Percent of Districts 94% 0% 53% 53% 100% 59% 59% 0%
Teacher Incentives District
Student Enrollment
Campus Assign
Mentor Teacher
National Board Cert
Signing Bonus
Other Incentive
Dept Chair HS
Dept Chair MS
Dept Chair ES
1 Dallas ISD 158,932 600 2,000 2,000 2,000 2,000
2 Fort Worth ISD 84,566
3 Garland ISD 58,000 $500 $750 $500
4 Plano ISD 54,667 450 2,700
5 Lewisvil le ISD 52,063 500 2,000 1,500 800
6 Richardson ISD 38,185 2,000 2,060 1,670
7 Irving ISD 35,355 500 2,000 1,500 1,000
8 Keller ISD 33,804 1,500 2,550 1,530 255
9 Mansfield ISD 32,782 $400 $2,000 $2,000 $900 $1,000
10 Grand Prairie ISD 27,708 500 300 200
11 Carrollton-‐Farmers Branch ISD 26,325 2,060 1,340 720
12 Birdvil le ISD 24,136 500 2,000 500
13 Hurst-‐Euless-‐Bedford ISD 21,970 5,000 5,000 500
14 Grapevine-‐Colleyvil le ISD 13,700 3,000 840 525 525
Arlington ISD 64,494 1,500 1,717 1,091 1,000
Median Stipend N/A 500 N/A 2,000 2,000 2,000 1,420 720Average Stipend N/A 493 N/A 2,000 2,167 2,035 1,439 778Count 0 7 0 2 3 13 12 9
Statewide -‐ Enrollment 50,000 and overAverage Stipend 0 522 1,750 1,861 1,625 2,087 1,331 1,066Count 0 11 4 4 4 16 13 10Percent of Districts 0% 65% 24% 24% 24% 94% 76% 59%

1/29/14
8
0
50
100
150
200
250
300
350
400
450
500
0 1 2 3 4 5 6 7 8 9 10 11 12 13 14 15 16 17 18 19 20 21 22 23 24 25+
Num
ber o
f Tea
cher
s
Years of Experience
Histogram of Teacher Experience
Median Experience = 9.5 Years
0 to 3 Years 74%
4 to 7 Years 14%
8 to 10 Years 4%
11 + Years 8%
Newly Hired Teachers Total Experience Arlington ISD
n= 418 teachers

1/29/14
9
Arlington ISD Arlington ISD2014–15 New Hire Guide for 2014–15 New Hire Guide for
Classroom Teachers, Librarians, and Nurses (RN) Classroom Teachers, Librarians, and Nurses (RN)
Model 1 Model 1
Years Experience
New HireSalary
Base Salary Range
0 $01 $50,000 10-‐Month Salary Range Minimum: $50,0002 $50,0503 $50,100 10-‐Month Salary Range Maximum: $65,3314 $50,1505 $50,200 Continuing teachers will receive a $0 increase6 $50,5607 $50,6108 $50,660 Master's Degree Stipend:9 $51,014 $1,50010 $51,35911 $52,25012 $52,30013 $52,42314 $52,76015 $53,09516 $54,05017 $54,35018 $54,70019 $55,20020 $55,75021 $56,85022 $57,27323 $58,06024 $58,84625 $59,63826 $60,52427 $61,40428 $62,28229 $63,16330 $64,04731+ $64,696
Master's Degree Stipend:$1,500
Salaries listed above are based on 10-‐month employment.
This salary plan is for the 2013-‐14 school year only.It does not represent salaries for future years.
Salary advancement is based on the annual pay raise budgetapproved by the Board of Trustees each year.
Annual salaries are adjusted for work periods longer than 10 months.
Salary advancement is based on an annual pay raise budget approved by the Board of Trustees.
Teachers, Librarians, and Registered Nurses (RN’s) will be paid annual salaries within a pay range.
Salaries are determined on an individual basis based on each person's creditable years of experience and credentials.
Potential Teacher Pay Range - Model Arlington ISD
2014–15 New Hire Guide for Classroom Teachers, Librarians, and Nurses (RN)
Model 1
Base Salary Range
10-‐Month Salary Range Minimum: $50,000
10-‐Month Salary Range Maximum: $ XX,XXX
Master's Degree SFpend: $1,500
Newly hired Teachers, Librarians, and Registered Nurses (RN’s) will be paid
annual salaries within a pay range.
Salaries are determined on an individual basis based on each person's creditable years of experience and credenFals.
Annual salaries are adjusted for work periods longer than 10 months.
Salary advancement is based on an annual pay raise budget approved by the Board of Trustees.
Overall Market Comparison
Job Family Number of Benchmarks
Local Overall Market
Comparison
Statewide Overall Market
Comparison
Administrators 17 96% 96%
Professionals 33 105% 104%
Campus Leadership 7 98% 100%
Technology 13 97% 97%

1/29/14
10
Job Family Number of Benchmarks
Overall Market
Comparison
Administrative Support 26 88%
Educational Aides 7 97%
Manual Trades 22 95%
Overall Market Comparison
Recommendations • Consider implementing a pay range for
classroom teachers, RN’s and librarians. • Eliminate the step schedule for counselors,
classify them in a pay range with other professionals
• Discontinue degree and license stipends for non-exempt job families – Include in base pay for current employees
1/29/14
11
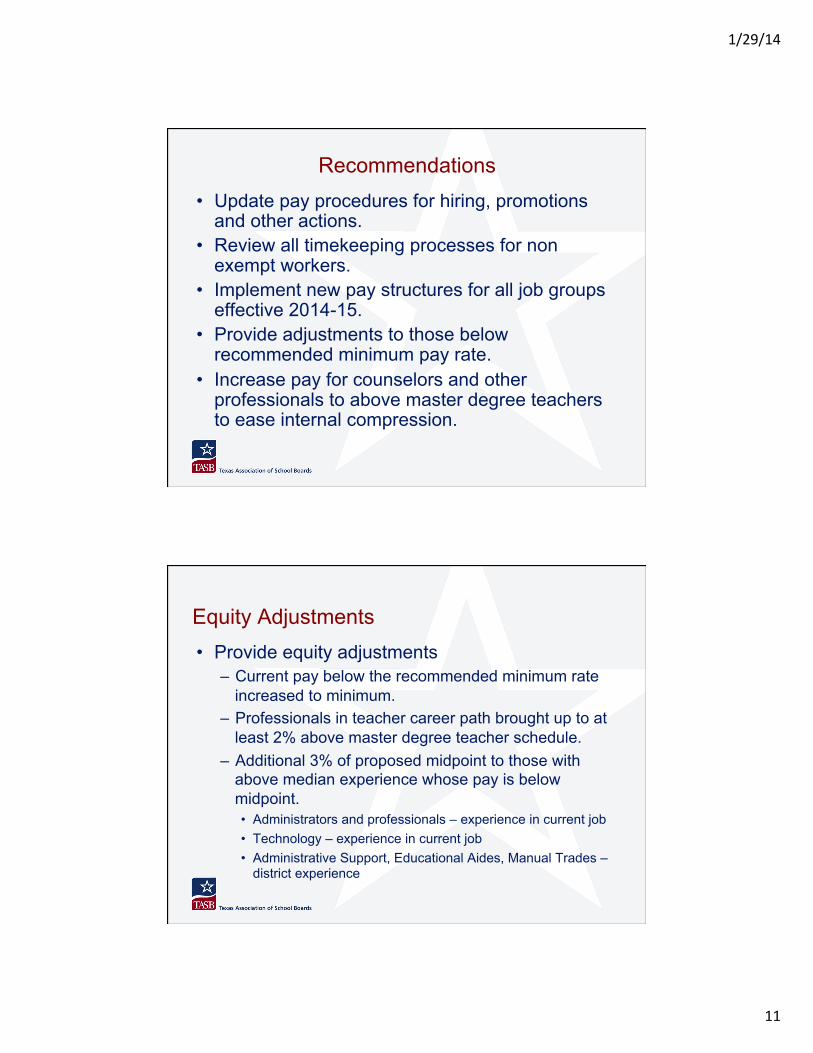
Recommendations • Update pay procedures for hiring, promotions
and other actions. • Review all timekeeping processes for non
exempt workers. • Implement new pay structures for all job groups
effective 2014-15. • Provide adjustments to those below
recommended minimum pay rate. • Increase pay for counselors and other
professionals to above master degree teachers to ease internal compression.
Equity Adjustments • Provide equity adjustments
– Current pay below the recommended minimum rate increased to minimum.
– Professionals in teacher career path brought up to at least 2% above master degree teacher schedule.
– Additional 3% of proposed midpoint to those with above median experience whose pay is below midpoint. • Administrators and professionals – experience in current job • Technology – experience in current job • Administrative Support, Educational Aides, Manual Trades –
district experience
1/29/14
12
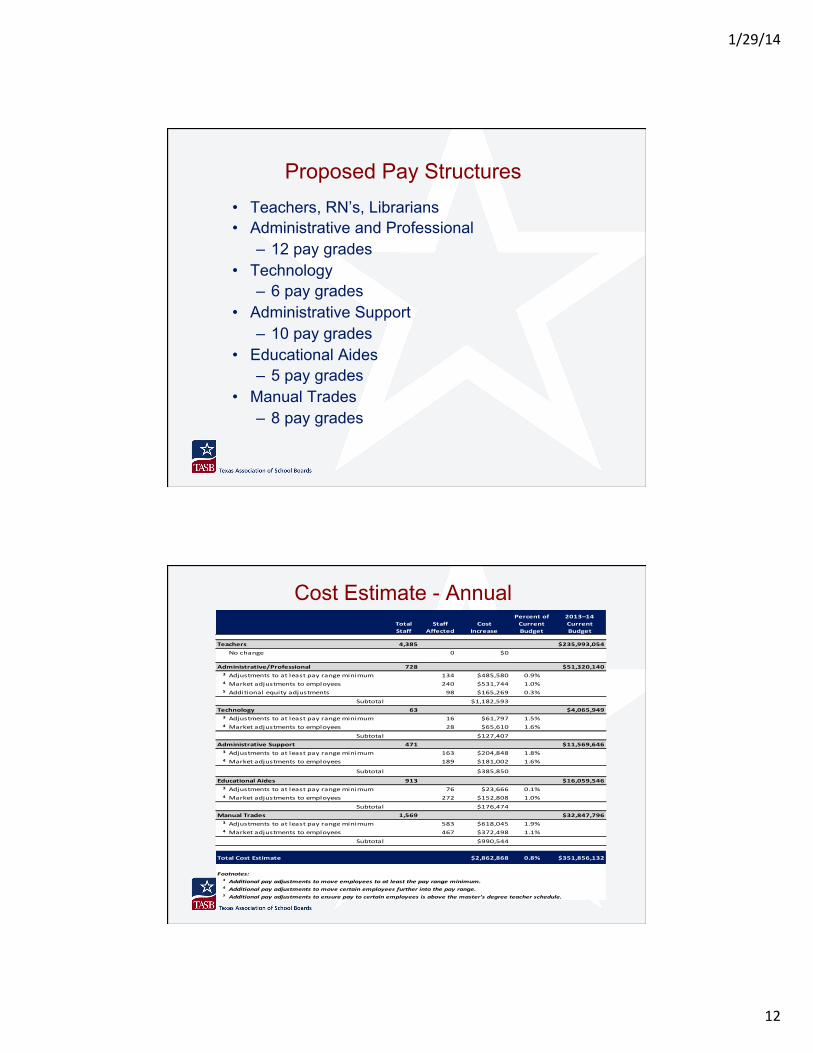
Proposed Pay Structures • Teachers, RN’s, Librarians • Administrative and Professional
– 12 pay grades • Technology
– 6 pay grades • Administrative Support
– 10 pay grades • Educational Aides
– 5 pay grades • Manual Trades
– 8 pay grades
Cost Estimate - Annual TotalStaff
StaffAffected
CostIncrease
Percent ofCurrentBudget
2013–14CurrentBudget
Teachers 4,385 $235,993,054No change 0 $0
Administrative/Professional 728 $51,320,1403 Adjustments to at least pay range minimum 134 $485,580 0.9%4 Market adjustments to employees 240 $531,744 1.0%5 Additional equity adjustments 98 $165,269 0.3%
Subtotal $1,182,593Technology 63 $4,065,9493 Adjustments to at least pay range minimum 16 $61,797 1.5%4 Market adjustments to employees 28 $65,610 1.6%
Subtotal $127,407Administrative Support 471 $11,569,6463 Adjustments to at least pay range minimum 163 $204,848 1.8%4 Market adjustments to employees 189 $181,002 1.6%
Subtotal $385,850
Educational Aides 913 $16,059,5463 Adjustments to at least pay range minimum 76 $23,666 0.1%4 Market adjustments to employees 272 $152,808 1.0%
Subtotal $176,474Manual Trades 1,569 $32,847,7963 Adjustments to at least pay range minimum 583 $618,045 1.9%4 Market adjustments to employees 467 $372,498 1.1%
Subtotal $990,544
Total Cost Estimate $2,862,868 0.8% $351,856,132
Footnotes:3 Additional pay adjustments to move employees to at least the pay range minimum.4 Additional pay adjustments to move certain employees further into the pay range.5 Additional pay adjustments to ensure pay to certain employees is above the master's degree teacher schedule.
1/29/14
13
Summary § TASB recommendations
§ align entire compensation structure to market § align individual positions within AISD salary structure § set foundation for performance-based pay
§ TASB market & equity adjustment cost estimate § estimate only § data review by Administration
§ Board consideration of individual adjustments in TASB’s report based on Administration’s data review
§ Annual compensation structure review
Questions?