Embed Size (px)
Citation preview
1 | P a g e
BSE Ltd. Mobile Pick
Sep 13, 2017
Recommendation
Buy at CMP and add on Dips
Add on dips to
Rs. 948-1023
Target
Rs. 1200
Time Horizon
4 Quarters
Industry
EXCHANGES
CMP
Rs. 1023
Established in 1875, BSE Ltd. (formerly known as Bombay Stock Exchange Ltd.), is Asia’s first Stock Exchange
and World’s largest exchange by number of listed securities. BSE provides an efficient and transparent market for
trading in equity, debt instruments, derivatives, mutual funds. It also has a platform for trading in equities of
small-and-medium enterprises (SME). BSE also provides a host of other services to capital market participants
including risk management, clearing, settlement, market data services and education. BSE also provides
depository services through its arm Central Depository Services Ltd. (CDSL).
We have valued BSE on SOTP basis by assigning fair value of Rs 430 to CDSL (~25% premium to CMP) and 25x
to BSE’s core earnings (ex. CDSL). We recommend BUY on BSE at CMP of Rs 1023 and add on dips to Rs 948 with
TP of Rs 1,200, which includes core BSE value at Rs 1,060 and CDSL stake at Rs 140.
Investment Rationale:
Macro tailwinds: India, the fastest growing economy
The outlook for the Indian economy remains strong. Indian Economy is expected to become the third largest in the world by 2030. The strong growth outlook is driven by a number of factors, such as policy reforms like GST, focus on skill development, Make in India initiative, and close monitoring of inflation, resulting in lower interest rates.
Demonetisation was a significant step towards making India a cashless economy. We expect demonetisation to lead to growth opportunities for exchanges in India, based on factors like (1) Allocation of larger portion of household savings in productive financial assets (2) Adoption of digital payments will lead to greater participation in capital markets, owing to the seamless integration of payment and trading platforms and (3) Drop in interest rates will make capital markets more attractive. Indian exchanges catching up with global peers Prominent exchanges in India like NSE and BSE lag behind global peers in various parameters like Market Cap/GDP ratio, cash turnover velocity and free float etc. However, with the Indian economy growing at swift pace, these criteria are expected to catch up gradually. We believe there is a clear case for growth in cash volumes based on the following factors, which includes (1) Increasing retail participation (2) Huge inflows in MFs (3) Greater penetration of capital market products (4) Use of the Mobile trading platform (5) Plans for divestment (6) increasing free float levels (7) Large number of upcoming IPOs and (8) Rising investor confidence.
FUNDAMENTAL ANALYST
Nisha Shankhala
HDFC Scrip Code BSELTD
BSE Code NA
NSE Code BSE
Bloomberg BSE IN
CMP as on 12 Sep’17 1023
Equity Capital (Rs mn) 107.6
Face Value (Rs) 2
Equity O/S (mn) 53.8
Market Cap (Rs mn) 55079
Book Value (Rs) 495
Avg. 52 Week Vol 329121
52 Week High 1200
52 Week Low 806
Shareholding Pattern (%)
Institutions 31.9
Non Institutions 31.1
Other 37.0
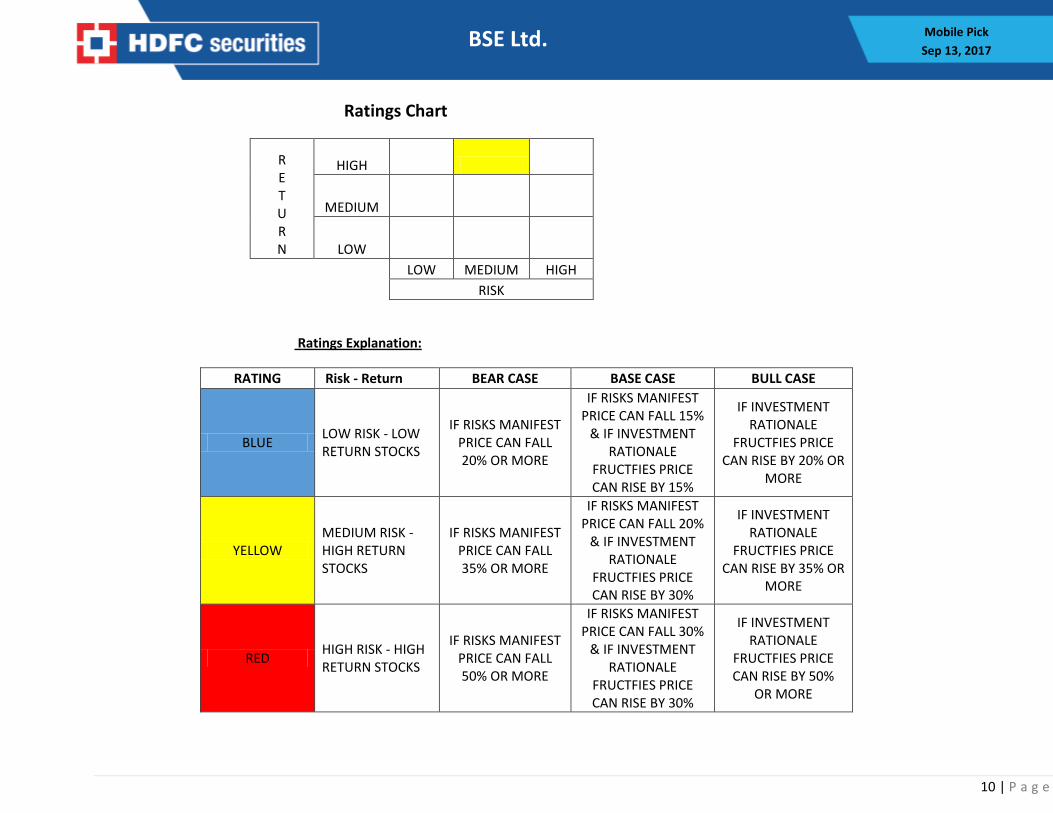
PCG Risk Rating* Yellow
* Refer Rating explanation
2 | P a g e
BSE Ltd. Mobile Pick
Sep 13, 2017
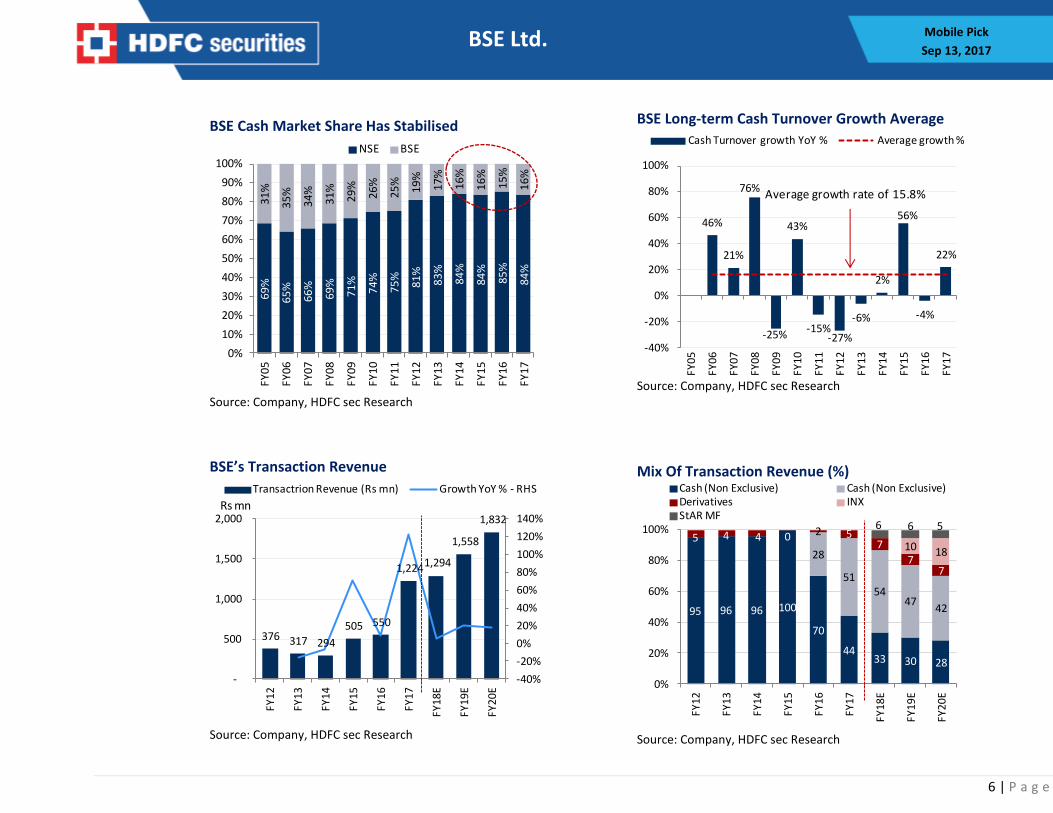
Increase in free float to improve turnover velocity Indian companies have a high promoter holding structure, which leads to lower free float and inferior turnover velocity. Indian listed companies’ free float has increased from ~37% in 2010 to ~46% in 2015, but is still below the levels of developed countries at ~85%. Retail investors constitute only ~13% of stock ownership in India. Number of DeMat accounts in India is less than 10% of the total number of bank accounts which leaves tremendous scope for CDSL and BSE. We believe, with the planned disinvestment of government stake in PSUs, greater number of IPOs, higher retail participation and rising institutional activity can increase further the free float level. BSE: Cash market share stable NSE has dominated the cash and derivative markets. It commands strong market share of ~100% in the derivatives segment, and ~84% in the cash segment. BSE has been losing market share in the cash segment to NSE since 2006, but this has now stabilised in the last 3-4 years. In FY17, BSE had ~16% market share in the cash market (stable at this level for the last four years). BSE has revamped its technology to become the fastest exchange in the world. Management increased focus on generating ways to increase transaction income. BSE has also terminated its efforts to develop the F&O market, where NSE commands a dominant position. Total cash turnover has posted CAGR of 11.4% over FY05 to FY17. BSE/NSE cash turnover increased at CAGR of 5.5/13.2% over FY05 FY17 respectively. In FY17, cash turnover volumes stood at Rs 61tn, which is an all-time high. We expect total cash turnover to post 15% CAGR over FY17-20E. BSE turnover is expected to see strong 17% CAGR due to changed traffic structure (flat fee per trade) for A & B segment stocks. Change in pricing structure to gain market share and attract bulk/block deals BSE has changed the structure of its transaction charges for the equity cash segment from an ‘ad valorem’ basis to ‘per trade’ basis, effective 3-April-17. BSE charged Rs 1 /trade to entities with volumes less than 50k trades per month which it has increased to Rs 1.50/trade from Aug-17(still at discount compared to NSE). BSE has hiked charges across segments (including Listing Fees), which has provided boost to its revenues (especially transaction revenue) in FY17. BSE’s charges were much lower than that of NSE, and the price hikes were largely taken to rationalise the pricing differential. Even after the price hikes, BSE’s charges are at a steep discount to those of NSE.
Figure 1ufuyut
KEY HIGHLIGHTS
Established in 1875, BSE Ltd.,
is Asia’s first Stock Exchange
and World’s largest exchange
by number of listed securities.
BSE has been constantly
innovating and investing in
technology, thus will remain a
valuable franchise.
We see value based on Indian
Macro tailwind, Stable Cash
market share, New &
Attractive pricing structure,
high Conviction-CDSL
business, Huge net cash
(excluding SGF and clearing)
of Rs 30bn (~Rs 567/sh,
~58% of MCap) and High
dividend yield of ~3%.
We have valued BSE on SOTP
basis. We initiate coverage on
BSE with TP of Rs 1,200, which
includes core BSE value at Rs
1,060 and CDSL stake value at Rs 140.
3 | P a g e
BSE Ltd. Mobile Pick
Sep 13, 2017
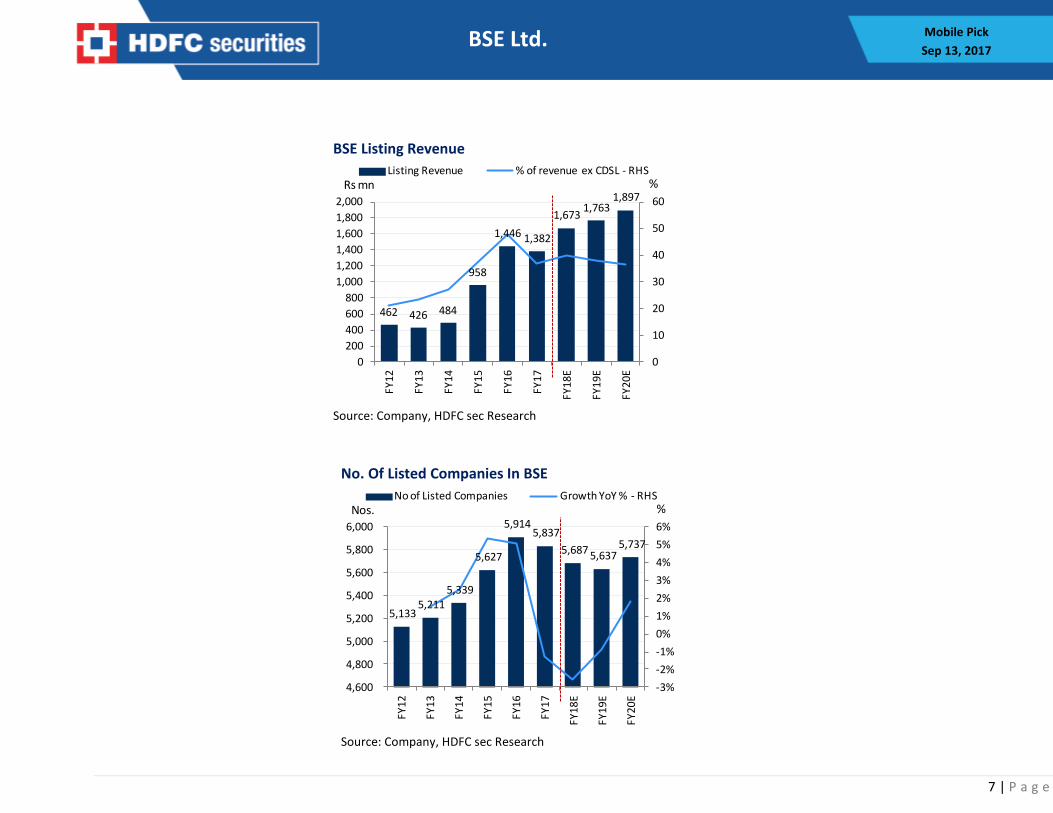
Investments in new platforms StAR MF platform: is an online platform launched by BSE in Dec-2009, the platform allows mutual fund distributors, investment advisors etc. to purchase and redeem mutual fund units on behalf of their clients. BSE’s StAR MF platform has gained immense popularity and has ~80% market share. The number of orders processed on the platform stood at 6.5mn (+98% YoY) in FY17, with a total value of Rs 743bn (+68% YoY). BSE will now monetise the effort, and will charge on a pay-per-use model. International Exchange (INX): BSE launched India’s first International Exchange in Jan-17 at GIFT City in Gujarat. The objective is to attract volumes from global exchanges. BSE has invested Rs 1.15bn and will invest another Rs 4bn over the next 3 years. The company will use the cash proceeds from the CDSL stake sale to fund the INX capex. The company is confident of witnessing a ramp-up in INX volumes, and views it as the next big opportunity. However, we believe it will take at least two to three years for the volume to ramp up. INX will be margin dilutive in FY18 and FY19, and will break-even in FY20E.
CDSL- High Conviction Business The Central Depository Services Ltd (CDSL) is the 2nd largest depository in India, with 44% market share. In June-17 it came up with the IPO. The size of the IPO was Rs 5.24bn and BSE received ~77% of the proceeds (~Rs 4.03bn). Post IPO, BSE holds 24% stake in CDSL. On financial performance front CDSL is very strong. It operates at robust EBITDA margin (increased from 39.4% in FY13 to 54.4% in FY17). EBITDA has witnessed 22% CAGR over FY13-17 and PAT for FY17 stands at Rs 858mn, with EPS of Rs 8.2. CDSL has RoE of 16.1% in FY17, net cash of Rs 5.15bn (15% of market cap), and a dividend yield of 1.1%. We expect CDSL revenue/EBITDA/PAT to increase at CAGR of 19/23/17% over FY17-20E. This business will command higher multiple, and we arrive at fair value of Rs 430 assigning 35x to Sep-19 EPS.
Financial analysis
BSE has diversified revenue stream, which can be broadly classified as (1) Revenue from securities’ services
(51% of revenues ex-CDSL, CAGR of 9.1% over FY12-17) (2) Revenue from services to corporates (42% of
revenue ex-CDSL, CAGR of 15.5% over FY12-17) and (3) Data dissemination revenue (7% of revenue, CAGR
of 3.5 % over FY12-17).
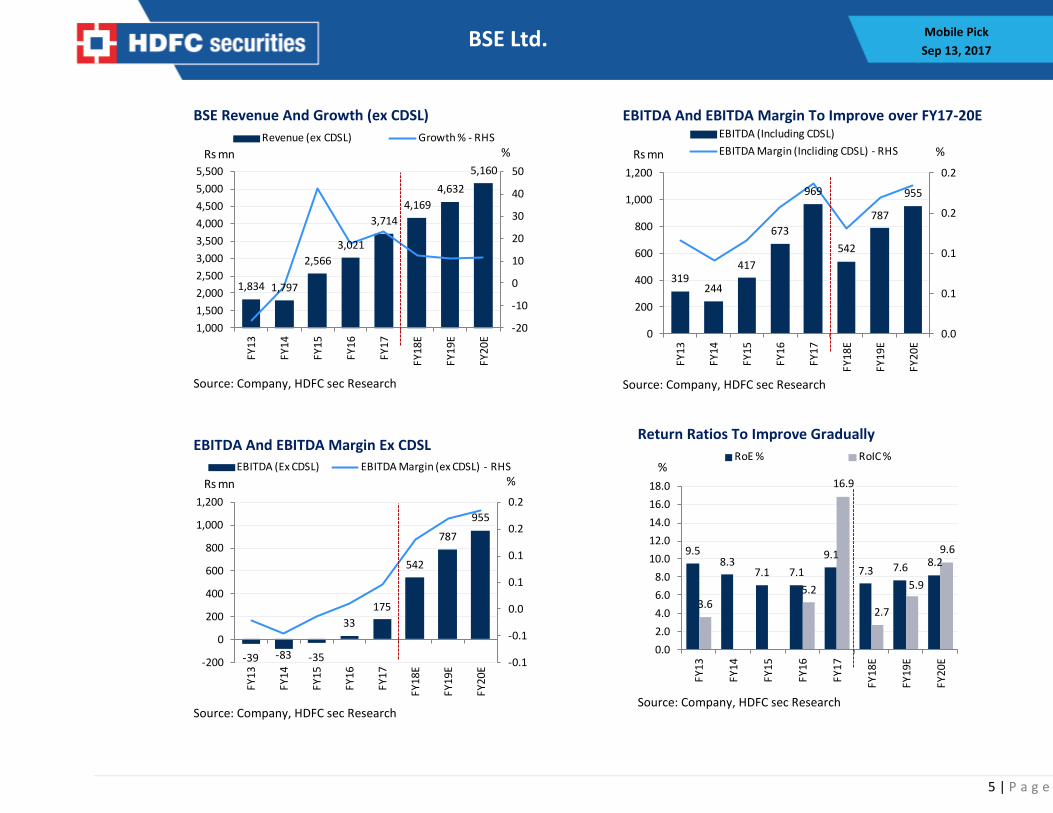
Total revenue ex-CDSL has increased at CAGR of 11% over the last five years, and at 27% over the last three
years to Rs 3.71bn. We expect revenue ex-CDSL to increase at CAGR of 11.6% over FY17-20E. Total revenue
(including CDSL) has seen 10% CAGR over FY12-17 to Rs 5.17bn. We expect PAT (ex-CDSL) to show 15%
CAGR over FY17-20E.
4 | P a g e
BSE Ltd. Mobile Pick
Sep 13, 2017
Risk & Concerns:
Increased Competition from other exchanges, loss of market share
Regulatory delays
Technological risks
Delay in monetization of investments in new platforms like StAR MF and India INX etc.
View & Valuation: BSE has been constantly innovating and investing in technology, thus would continue to remain valuable
franchise. We see value based on Indian Macro tailwind, Stable Cash market share, New & Attractive pricing
structure, high Conviction-CDSL business, Huge net cash (excluding SGF and clearing) of Rs 30bn (~Rs
567/sh, ~58% of MCap) and healthy dividend yield of ~3%.
Moreover NSE listing will drive volume as it has to get listed itself on BSE only and Moreover NSE IPO/listing
on higher valuation may lead to re-rating for BSE also. BSE currently trades at 23.7x FY18E and 21.5x FY19E
EPS (discount of ~2% to the global average).
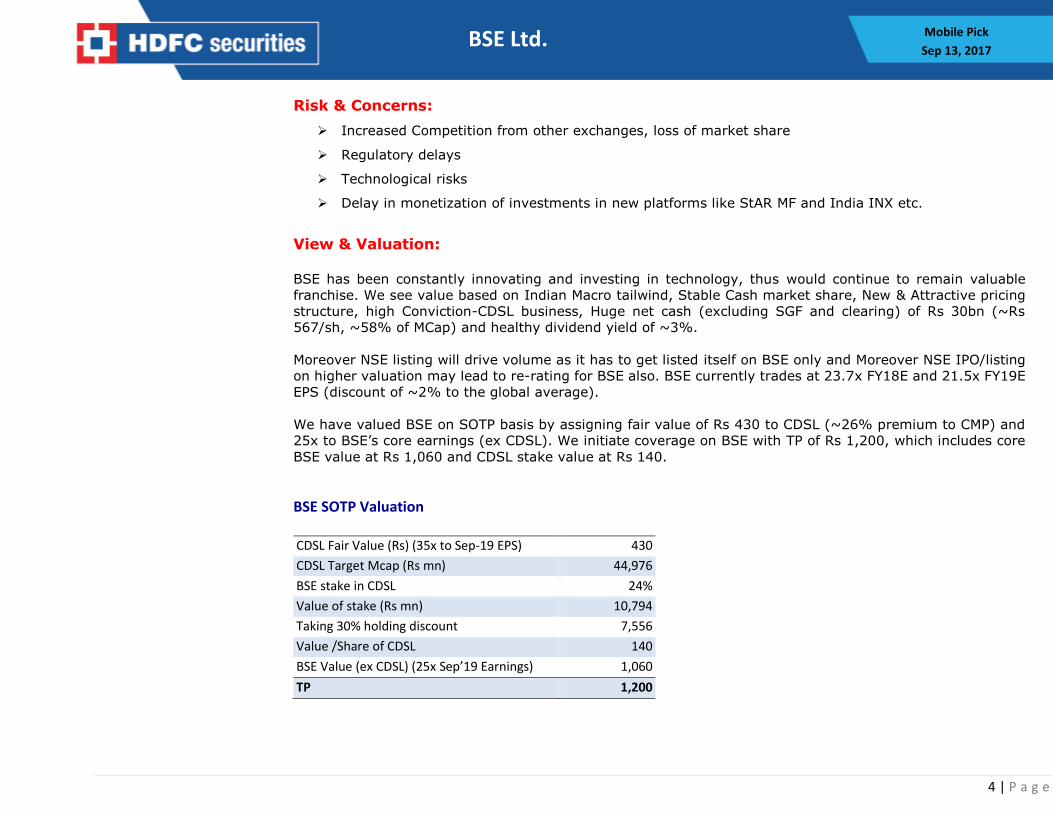
We have valued BSE on SOTP basis by assigning fair value of Rs 430 to CDSL (~26% premium to CMP) and
25x to BSE’s core earnings (ex CDSL). We initiate coverage on BSE with TP of Rs 1,200, which includes core
BSE value at Rs 1,060 and CDSL stake value at Rs 140.
BSE SOTP Valuation CDSL Fair Value (Rs) (35x to Sep-19 EPS) 430
CDSL Target Mcap (Rs mn) 44,976
BSE stake in CDSL 24%
Value of stake (Rs mn) 10,794
Taking 30% holding discount 7,556
Value /Share of CDSL 140
BSE Value (ex CDSL) (25x Sep’19 Earnings) 1,060
TP 1,200
5 | P a g e
BSE Ltd. Mobile Pick
Sep 13, 2017
BSE Revenue And Growth (ex CDSL)
Source: Company, HDFC sec Research
1,834 1,797
2,566
3,021
3,714
4,169
4,632
5,160
-20
-10
0
10
20
30
40
50
1,000
1,500
2,000
2,500
3,000
3,500
4,000
4,500
5,000
5,500
FY1
3
FY1
4
FY15
FY1
6
FY1
7
FY1
8E
FY1
9E
FY2
0E
Revenue (ex CDSL) Growth % - RHS
Rs mn %
EBITDA And EBITDA Margin To Improve over FY17-20E
Source: Company, HDFC sec Research
319244
417
673
969
542
787
955
0.0
0.1
0.1
0.2
0.2
0
200
400
600
800
1,000
1,200
FY13
FY14
FY15
FY16
FY17
FY1
8E
FY1
9E
FY2
0E
EBITDA (Including CDSL)
EBITDA Margin (Incliding CDSL) - RHSRs mn %
EBITDA And EBITDA Margin Ex CDSL
Source: Company, HDFC sec Research
-39 -83 -35
33
175
542
787
955
-0.1
-0.1
0.0
0.1
0.1
0.2
0.2
-200
0
200
400
600
800
1,000
1,200
FY1
3
FY1
4
FY1
5
FY1
6
FY1
7
FY18
E
FY19
E
FY20
EEBITDA (Ex CDSL) EBITDA Margin (ex CDSL) - RHS
Rs mn %
Return Ratios To Improve Gradually
Source: Company, HDFC sec Research
9.58.3
7.1 7.1
9.1
7.3 7.6 8.2
3.65.2
16.9
2.7
5.9
9.6
0.0
2.0
4.0
6.0
8.0
10.0
12.0
14.0
16.0
18.0
FY1
3
FY1
4
FY1
5
FY1
6
FY1
7
FY18
E
FY19
E
FY20
E
RoE % RoIC %%
6 | P a g e
BSE Ltd. Mobile Pick
Sep 13, 2017
BSE Cash Market Share Has Stabilised
Source: Company, HDFC sec Research
69
%
65
%
66
%
69
%
71
%
74
%
75
%
81
%
83
%
84
%
84
%
85
%
84
%
31
%
35
%
34
%
31
%
29
%
26
%
25
%
19
%
17
%
16
%
16
%
15
%
16
%
0%
10%
20%
30%
40%
50%
60%
70%
80%
90%
100%
FY
05
FY
06
FY
07
FY
08
FY
09
FY
10
FY
11
FY
12
FY
13
FY
14
FY
15
FY
16
FY
17
NSE BSE
BSE Long-term Cash Turnover Growth Average
Source: Company, HDFC sec Research
46%
21%
76%
-25%
43%
-15%-27%
-6%
2%
56%
-4%
22%
-40%
-20%
0%
20%
40%
60%
80%
100%
FY0
5
FY0
6
FY0
7
FY0
8
FY0
9
FY1
0
FY1
1
FY12
FY1
3
FY1
4
FY1
5
FY1
6
FY1
7
Cash Turnover growth YoY % Average growth %
Average growth rate of 15.8%
Mix Of Transaction Revenue (%)
Source: Company, HDFC sec Research
95 96 96 100
70
4433 30 28
28
5154
4742
5 4 4 0 2 57
77
10 18
6 6 5
0%
20%
40%
60%
80%
100%
FY1
2
FY1
3
FY1
4
FY1
5
FY1
6
FY1
7
FY18
E
FY1
9E
FY2
0E
Cash (Non Exclusive) Cash (Non Exclusive)Derivatives INXStAR MF
BSE’s Transaction Revenue
Source: Company, HDFC sec Research
376 317 294
505 550
1,224 1,294
1,558
1,832
-40%
-20%
0%
20%
40%
60%
80%
100%
120%
140%
-
500
1,000
1,500
2,000
FY1
2
FY1
3
FY1
4
FY1
5
FY1
6
FY1
7
FY1
8E
FY19
E
FY2
0E
Transactrion Revenue (Rs mn) Growth YoY % - RHS
Rs mn
7 | P a g e
BSE Ltd. Mobile Pick
Sep 13, 2017
BSE Listing Revenue
Source: Company, HDFC sec Research
462 426 484
958
1,446 1,382
1,6731,763
1,897
0
10
20
30
40
50
60
0
200
400
600
800
1,000
1,200
1,400
1,600
1,800
2,000
FY1
2
FY13
FY1
4
FY1
5
FY1
6
FY1
7
FY1
8E
FY1
9E
FY2
0E
Listing Revenue % of revenue ex CDSL - RHSRs mn %
No. Of Listed Companies In BSE
Source: Company, HDFC sec Research
5,133 5,211
5,339
5,627
5,914 5,837
5,687 5,637 5,737
-3%
-2%
-1%
0%
1%
2%
3%
4%
5%
6%
4,600
4,800
5,000
5,200
5,400
5,600
5,800
6,000
FY1
2
FY1
3
FY1
4
FY1
5
FY1
6
FY1
7
FY18
E
FY19
E
FY20
E
No of Listed Companies Growth YoY % - RHSNos. %
8 | P a g e
BSE Ltd. Mobile Pick
Sep 13, 2017
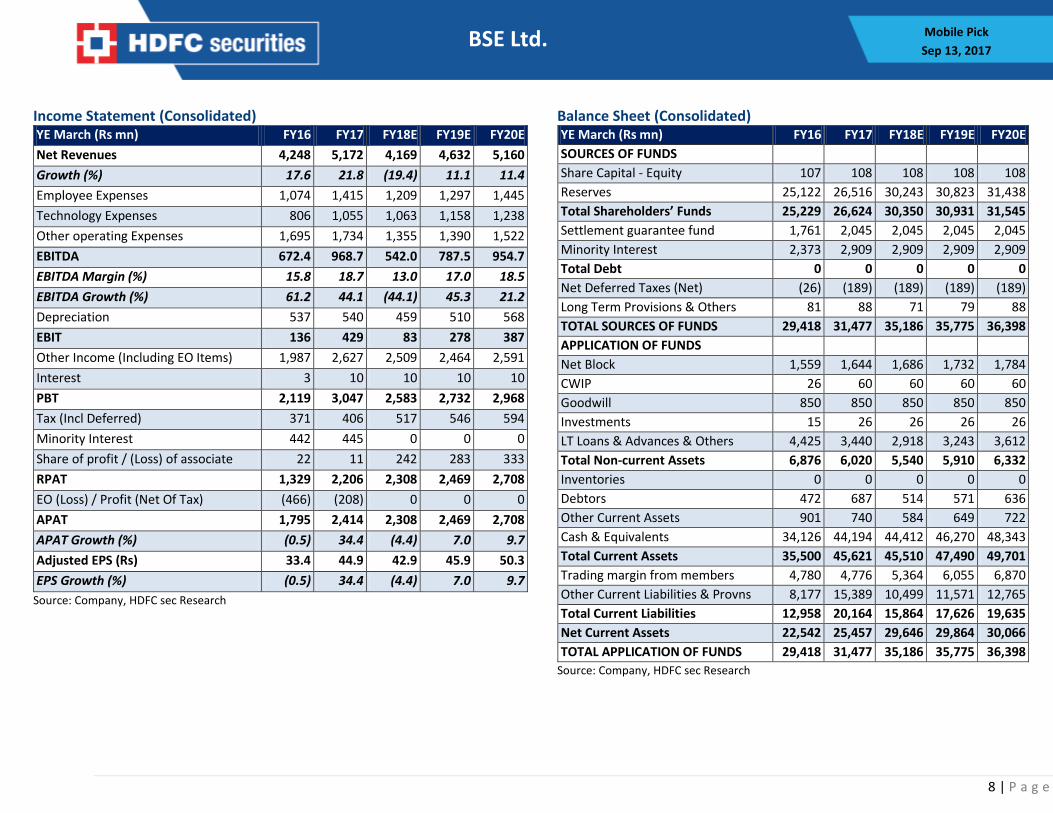
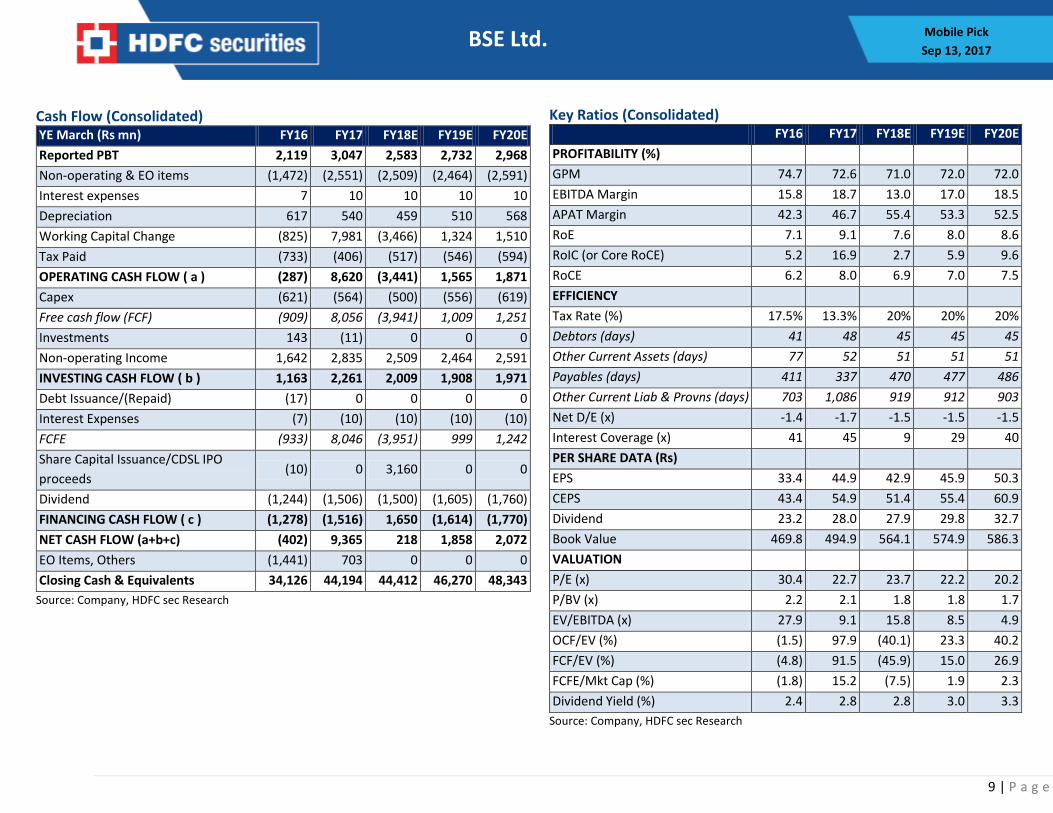
Income Statement (Consolidated) YE March (Rs mn) FY16 FY17 FY18E FY19E FY20E
Net Revenues 4,248 5,172 4,169 4,632 5,160
Growth (%) 17.6 21.8 (19.4) 11.1 11.4
Employee Expenses 1,074 1,415 1,209 1,297 1,445
Technology Expenses 806 1,055 1,063 1,158 1,238
Other operating Expenses 1,695 1,734 1,355 1,390 1,522
EBITDA 672.4 968.7 542.0 787.5 954.7
EBITDA Margin (%) 15.8 18.7 13.0 17.0 18.5
EBITDA Growth (%) 61.2 44.1 (44.1) 45.3 21.2
Depreciation 537 540 459 510 568
EBIT 136 429 83 278 387
Other Income (Including EO Items) 1,987 2,627 2,509 2,464 2,591
Interest 3 10 10 10 10
PBT 2,119 3,047 2,583 2,732 2,968
Tax (Incl Deferred) 371 406 517 546 594
Minority Interest 442 445 0 0 0
Share of profit / (Loss) of associate 22 11 242 283 333
RPAT 1,329 2,206 2,308 2,469 2,708
EO (Loss) / Profit (Net Of Tax) (466) (208) 0 0 0
APAT 1,795 2,414 2,308 2,469 2,708
APAT Growth (%) (0.5) 34.4 (4.4) 7.0 9.7
Adjusted EPS (Rs) 33.4 44.9 42.9 45.9 50.3
EPS Growth (%) (0.5) 34.4 (4.4) 7.0 9.7
Source: Company, HDFC sec Research
Balance Sheet (Consolidated) YE March (Rs mn) FY16 FY17 FY18E FY19E FY20E
SOURCES OF FUNDS
Share Capital - Equity 107 108 108 108 108
Reserves 25,122 26,516 30,243 30,823 31,438
Total Shareholders’ Funds 25,229 26,624 30,350 30,931 31,545
Settlement guarantee fund 1,761 2,045 2,045 2,045 2,045
Minority Interest 2,373 2,909 2,909 2,909 2,909
Total Debt 0 0 0 0 0
Net Deferred Taxes (Net) (26) (189) (189) (189) (189)
Long Term Provisions & Others 81 88 71 79 88
TOTAL SOURCES OF FUNDS 29,418 31,477 35,186 35,775 36,398
APPLICATION OF FUNDS
Net Block 1,559 1,644 1,686 1,732 1,784
CWIP 26 60 60 60 60
Goodwill 850 850 850 850 850
Investments 15 26 26 26 26
LT Loans & Advances & Others 4,425 3,440 2,918 3,243 3,612
Total Non-current Assets 6,876 6,020 5,540 5,910 6,332
Inventories 0 0 0 0 0
Debtors 472 687 514 571 636
Other Current Assets 901 740 584 649 722
Cash & Equivalents 34,126 44,194 44,412 46,270 48,343
Total Current Assets 35,500 45,621 45,510 47,490 49,701
Trading margin from members 4,780 4,776 5,364 6,055 6,870
Other Current Liabilities & Provns 8,177 15,389 10,499 11,571 12,765
Total Current Liabilities 12,958 20,164 15,864 17,626 19,635
Net Current Assets 22,542 25,457 29,646 29,864 30,066
TOTAL APPLICATION OF FUNDS 29,418 31,477 35,186 35,775 36,398
Source: Company, HDFC sec Research
9 | P a g e
BSE Ltd. Mobile Pick
Sep 13, 2017
Key Ratios (Consolidated) FY16 FY17 FY18E FY19E FY20E
PROFITABILITY (%)
GPM 74.7 72.6 71.0 72.0 72.0
EBITDA Margin 15.8 18.7 13.0 17.0 18.5
APAT Margin 42.3 46.7 55.4 53.3 52.5
RoE 7.1 9.1 7.6 8.0 8.6
RoIC (or Core RoCE) 5.2 16.9 2.7 5.9 9.6
RoCE 6.2 8.0 6.9 7.0 7.5
EFFICIENCY
Tax Rate (%) 17.5% 13.3% 20% 20% 20%
Debtors (days) 41 48 45 45 45
Other Current Assets (days) 77 52 51 51 51
Payables (days) 411 337 470 477 486
Other Current Liab & Provns (days) 703 1,086 919 912 903
Net D/E (x) -1.4 -1.7 -1.5 -1.5 -1.5
Interest Coverage (x) 41 45 9 29 40
PER SHARE DATA (Rs)
EPS 33.4 44.9 42.9 45.9 50.3
CEPS 43.4 54.9 51.4 55.4 60.9
Dividend 23.2 28.0 27.9 29.8 32.7
Book Value 469.8 494.9 564.1 574.9 586.3
VALUATION
P/E (x) 30.4 22.7 23.7 22.2 20.2
P/BV (x) 2.2 2.1 1.8 1.8 1.7
EV/EBITDA (x) 27.9 9.1 15.8 8.5 4.9
OCF/EV (%) (1.5) 97.9 (40.1) 23.3 40.2
FCF/EV (%) (4.8) 91.5 (45.9) 15.0 26.9
FCFE/Mkt Cap (%) (1.8) 15.2 (7.5) 1.9 2.3
Dividend Yield (%) 2.4 2.8 2.8 3.0 3.3
Source: Company, HDFC sec Research
Cash Flow (Consolidated) YE March (Rs mn) FY16 FY17 FY18E FY19E FY20E
Reported PBT 2,119 3,047 2,583 2,732 2,968
Non-operating & EO items (1,472) (2,551) (2,509) (2,464) (2,591)
Interest expenses 7 10 10 10 10
Depreciation 617 540 459 510 568
Working Capital Change (825) 7,981 (3,466) 1,324 1,510
Tax Paid (733) (406) (517) (546) (594)
OPERATING CASH FLOW ( a ) (287) 8,620 (3,441) 1,565 1,871
Capex (621) (564) (500) (556) (619)
Free cash flow (FCF) (909) 8,056 (3,941) 1,009 1,251
Investments 143 (11) 0 0 0
Non-operating Income 1,642 2,835 2,509 2,464 2,591
INVESTING CASH FLOW ( b ) 1,163 2,261 2,009 1,908 1,971
Debt Issuance/(Repaid) (17) 0 0 0 0
Interest Expenses (7) (10) (10) (10) (10)
FCFE (933) 8,046 (3,951) 999 1,242
Share Capital Issuance/CDSL IPO
proceeds (10) 0 3,160 0 0
Dividend (1,244) (1,506) (1,500) (1,605) (1,760)
FINANCING CASH FLOW ( c ) (1,278) (1,516) 1,650 (1,614) (1,770)
NET CASH FLOW (a+b+c) (402) 9,365 218 1,858 2,072
EO Items, Others (1,441) 703 0 0 0
Closing Cash & Equivalents 34,126 44,194 44,412 46,270 48,343
Source: Company, HDFC sec Research
10 | P a g e
BSE Ltd. Mobile Pick
Sep 13, 2017
Ratings Chart
R E T U R N
HIGH
MEDIUM
LOW
LOW MEDIUM HIGH
RISK
Ratings Explanation:
RATING Risk - Return BEAR CASE BASE CASE BULL CASE
BLUE LOW RISK - LOW RETURN STOCKS
IF RISKS MANIFEST PRICE CAN FALL 20% OR MORE
IF RISKS MANIFEST PRICE CAN FALL 15%
& IF INVESTMENT RATIONALE
FRUCTFIES PRICE CAN RISE BY 15%
IF INVESTMENT RATIONALE
FRUCTFIES PRICE CAN RISE BY 20% OR
MORE
YELLOW MEDIUM RISK - HIGH RETURN STOCKS
IF RISKS MANIFEST PRICE CAN FALL 35% OR MORE
IF RISKS MANIFEST PRICE CAN FALL 20%
& IF INVESTMENT RATIONALE
FRUCTFIES PRICE CAN RISE BY 30%
IF INVESTMENT RATIONALE
FRUCTFIES PRICE CAN RISE BY 35% OR
MORE
RED HIGH RISK - HIGH RETURN STOCKS
IF RISKS MANIFEST PRICE CAN FALL 50% OR MORE
IF RISKS MANIFEST PRICE CAN FALL 30%
& IF INVESTMENT RATIONALE
FRUCTFIES PRICE CAN RISE BY 30%
IF INVESTMENT RATIONALE
FRUCTFIES PRICE CAN RISE BY 50%
OR MORE
11 | P a g e
BSE Ltd. Mobile Pick
Sep 13, 2017
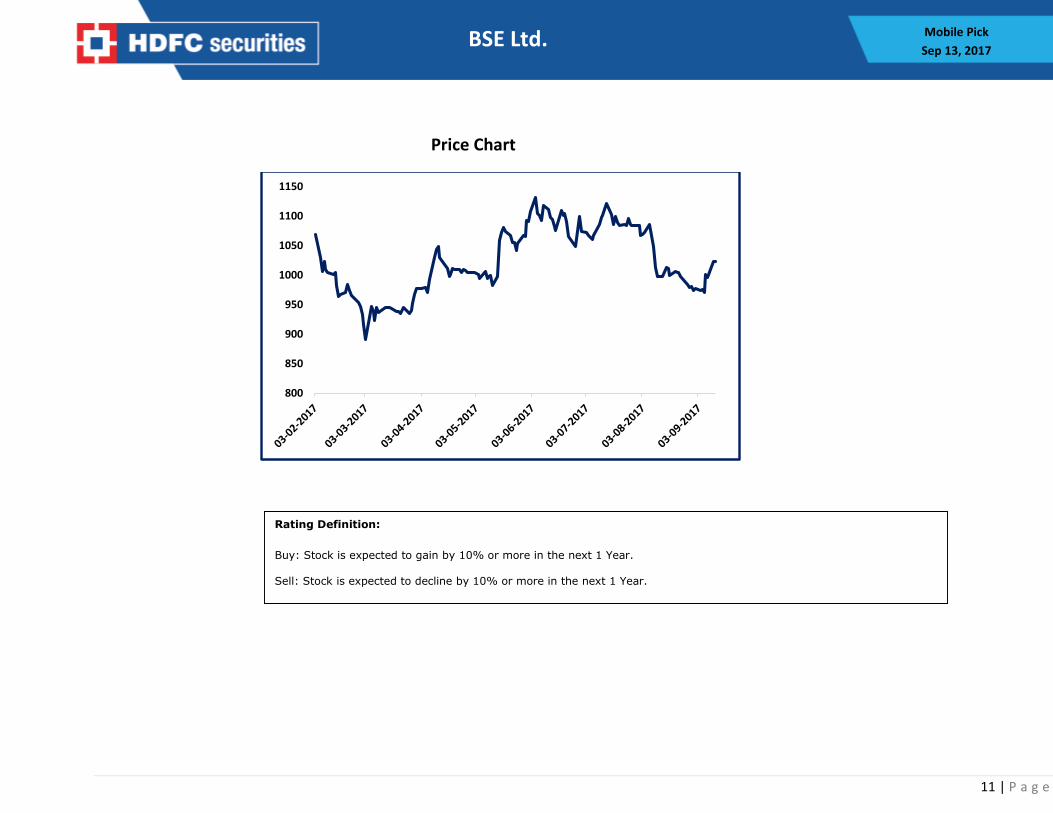
Price Chart
800
850
900
950
1000
1050
1100
1150
Rating Definition:
Buy: Stock is expected to gain by 10% or more in the next 1 Year. Sell: Stock is expected to decline by 10% or more in the next 1 Year.
12 | P a g e
BSE Ltd. Mobile Pick
Sep 13, 2017
Disclosure: I, Nisha Sankhala, MBA, authors and the names subscribed to this report, hereby certify that all of the views expressed in this research report accurately reflect our views about the subject issuer(s) or securities. HSL has no material adverse disciplinary history as on the date of publication of this report. We also certify that no part of our compensation was, is, or will be directly or indirectly related to the specific recommendation(s) or view(s) in this report. Research Analyst or her relative or HDFC Securities Ltd. does not have any financial interest in the subject company. Also Research Analyst or her relative or HDFC Securities Ltd. or its Associate may have beneficial ownership of 1% or more in the subject company at the end of the month immediately preceding the date of publication of the Research Report. Further Research Analyst or his relative or HDFC Securities Ltd. or its associate does not have any material conflict of interest. Any holding in stock –No HDFC Securities Limited (HSL) is a SEBI Registered Research Analyst having registration no. INH000002475. Disclaimer: This report has been prepared by HDFC Securities Ltd and is meant for sole use by the recipient and not for circulation. The information and opinions contained herein have been compiled or arrived at, based upon information obtained in good faith from sources believed to be reliable. Such information has not been independently verified and no guaranty, representation of warranty, express or implied, is made as to its accuracy, completeness or correctness. All such information and opinions are subject to change without notice. This document is for information purposes only. Descriptions of any company or companies or their securities mentioned herein are not intended to be complete and this document is not, and should not be construed as an offer or solicitation of an offer, to buy or sell any securities or other financial instruments. This report is not directed to, or intended for display, downloading, printing, reproducing or for distribution to or use by, any person or entity who is a citizen or resident or located in any locality, state, country or other jurisdiction where such distribution, publication, reproduction, availability or use would be contrary to law or regulation or what would subject HSL or its affiliates to any registration or licensing requirement within such jurisdiction. If this report is inadvertently send or has reached any individual in such country, especially, USA, the same may be ignored and brought to the attention of the sender. This document may not be reproduced, distributed or published for any purposes without prior written approval of HSL. Foreign currencies denominated securities, wherever mentioned, are subject to exchange rate fluctuations, which could have an adverse effect on their value or price, or the income derived from them. In addition, investors in securities such as ADRs, the values of which are influenced by foreign currencies effectively assume currency risk. It should not be considered to be taken as an offer to sell or a solicitation to buy any security. HSL may from time to time solicit from, or perform broking, or other services for, any company mentioned in this mail and/or its attachments. HSL and its affiliated company(ies), their directors and employees may; (a) from time to time, have a long or short position in, and buy or sell the securities of the company(ies) mentioned herein or (b) be engaged in any other transaction involving such securities and earn brokerage or other compensation or act as a market maker in the financial instruments of the company(ies) discussed herein or act as an advisor or lender/borrower to such company(ies) or may have any other potential conflict of interests with respect to any recommendation and other related information and opinions. HSL, its directors, analysts or employees do not take any responsibility, financial or otherwise, of the losses or the damages sustained due to the investments made or any action taken on basis of this report, including but not restricted to, fluctuation in the prices of shares and bonds, changes in the currency rates, diminution in the NAVs, reduction in the dividend or income, etc. HSL and other group companies, its directors, associates, employees may have various positions in any of the stocks, securities and financial instruments dealt in the report, or may make sell or purchase or other deals in these securities from time to time or may deal in other securities of the companies / organizations described in this report. HSL or its associates might have managed or co-managed public offering of securities for the subject company or might have been mandated by the subject company for any other assignment in the past twelve months. HSL or its associates might have received any compensation from the companies mentioned in the report during the period preceding twelve months from t date of this report for services in respect of managing or co-managing public offerings, corporate finance, investment banking or merchant banking, brokerage services or other advisory service in a merger or specific transaction in the normal course of business. HSL or its analysts did not receive any compensation or other benefits from the companies mentioned in the report or third party in connection with preparation of the research report. Accordingly, neither HSL nor Research Analysts have any material conflict of interest at the time of publication of this report. Compensation of our Research Analysts is not based on any specific merchant banking, investment banking or brokerage service transactions. HSL may have issued other reports that are inconsistent with and reach different conclusion from the information presented in this report. Research entity has not been engaged in market making activity for the subject company. Research analyst has not served as an officer, director or employee of the subject company. We have not received any compensation/benefits from the Subject Company or third party in connection with the Research Report.
HDFC securities Limited, I Think Techno Campus, Building - B, "Alpha", Office Floor 8, Near Kanjurmarg Station, Opp. Crompton Greaves, Kanjurmarg (East), Mumbai 400 042 Phone: (022) 3075 3400 Fax: (022) 2496 5066 Compliance Officer: Binkle R. Oza Email: [email protected] Phone: (022) 3045 3600 HDFC Securities Limited, SEBI Reg. No.: NSE-INB/F/E 231109431, BSE-INB/F 011109437, AMFI Reg. No. ARN: 13549, PFRDA Reg. No. POP: 04102015, IRDA Corporate Agent License No.: HDF 2806925/HDF C000222657, SEBI Research Analyst Reg. No.: INH000002475, CIN - U67120MH2000PLC152193 Mutual Funds Investments are subject to market risk. Please read the offer and scheme related documents carefully before investing.