Embed Size (px)
Citation preview

8/13/2019 Bs Trading (1)
http://slidepdf.com/reader/full/bs-trading-1 1/265
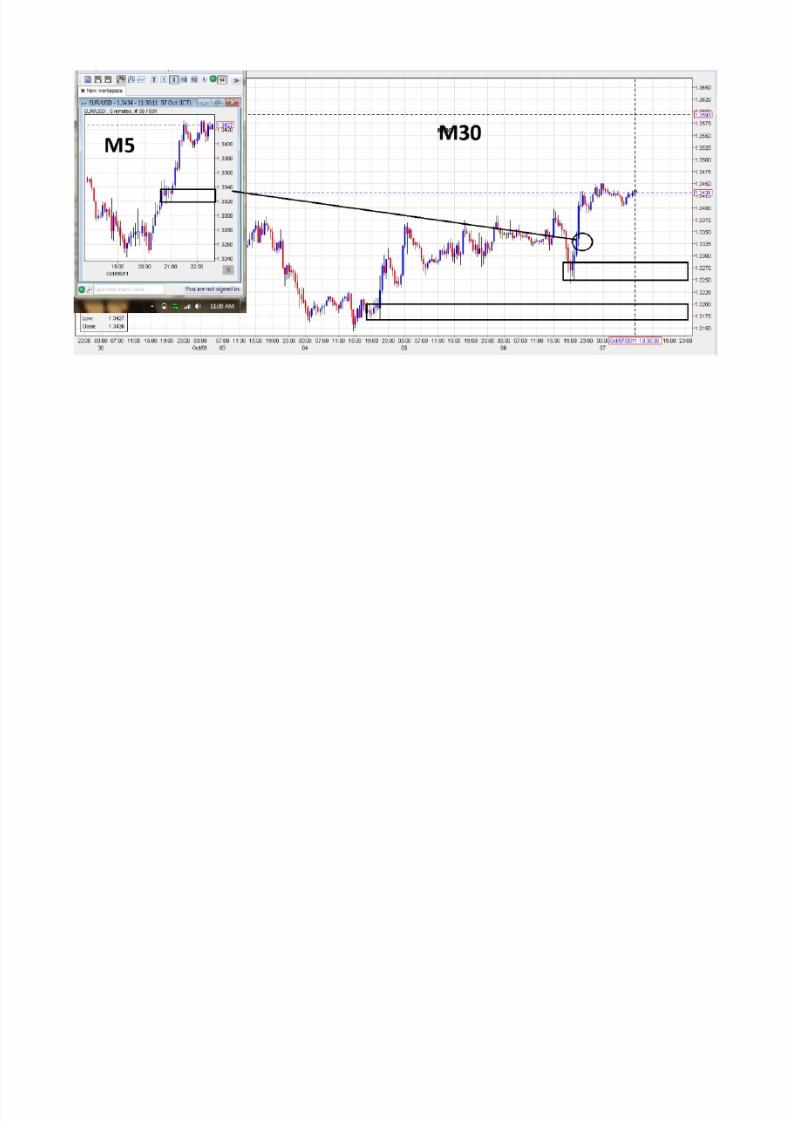
Q: Not sure if you are the right person to ask but lets say you have a supply level and price goes down to demand, then fromdemand to supply again but this time price breaks to the up side from the supply level. Does the supply level become a demandlevel and then what would the TP be?
A: In that case you will find what is called a rally-base-rally that means price came up to the supply level based for a bit (consolidated) then pushed on through. Then when price comes back down from a higher supply level your 2nd tp . it will be ademand level.
It is those moves that can also provide one of the three entries a breakout just as in all most every other strategy a break ofANY line, trend .resistance, supply. what not . A breakout then a retest is the entry. Same here just now we have aunderstandable reason for it . The demand was greater than supply it takes a little while for the demand to completelyoverwhelm supply , hence the base forms then price pushes higher. The stronger price leaves the base ( demand level) themore demand is still left over waiting for price to come back to it providing more supply to get. Just like a buyer waiting formore product to buy when more product shows up and the buyer has lots of money left he again buys it all. If he doesn't havemuch supply can be to great and then push back down. But it is visible on your charts based on velocity how price leaveslevels. very clear.

8/13/2019 Bs Trading (1)
http://slidepdf.com/reader/full/bs-trading-1 2/265

8/13/2019 Bs Trading (1)
http://slidepdf.com/reader/full/bs-trading-1 3/265
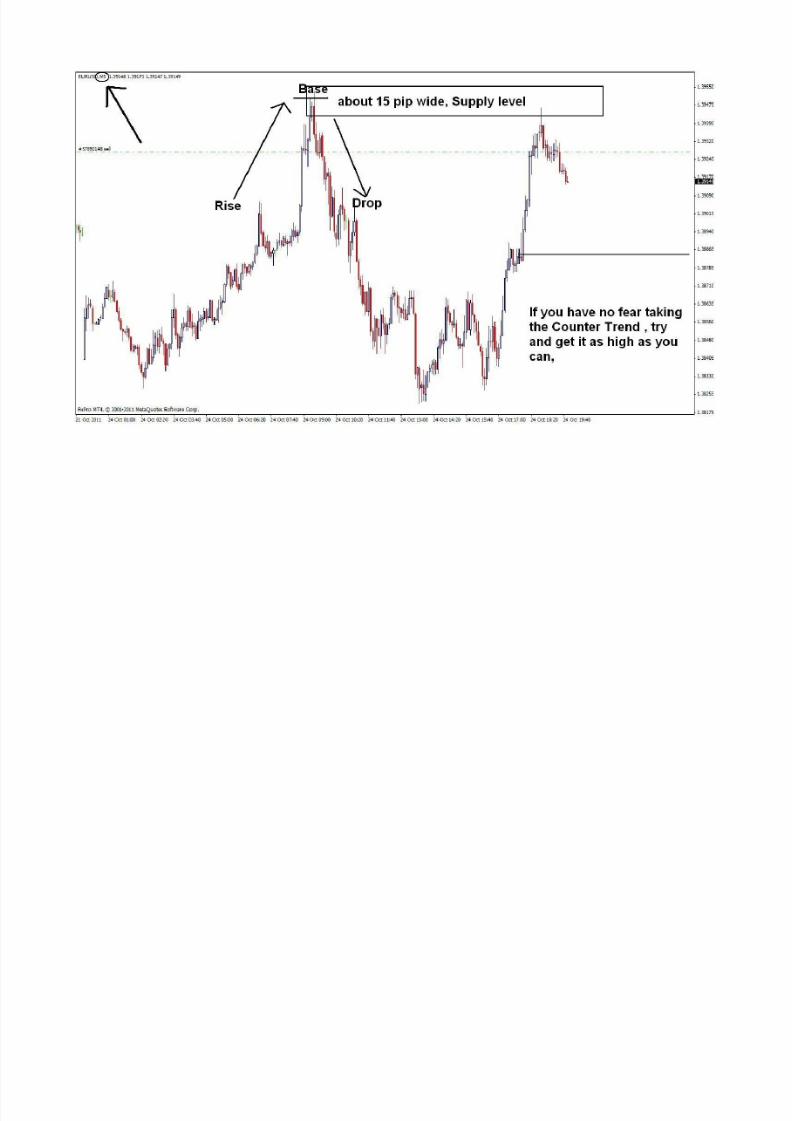
Also see the rally base drop he has marked. Well if you marked this area and went short when it came back this would becounter trend. look to your left and we are making higher highs and lower lows.

8/13/2019 Bs Trading (1)
http://slidepdf.com/reader/full/bs-trading-1 4/265

8/13/2019 Bs Trading (1)
http://slidepdf.com/reader/full/bs-trading-1 5/265

8/13/2019 Bs Trading (1)
http://slidepdf.com/reader/full/bs-trading-1 6/265

8/13/2019 Bs Trading (1)
http://slidepdf.com/reader/full/bs-trading-1 7/265

8/13/2019 Bs Trading (1)
http://slidepdf.com/reader/full/bs-trading-1 8/265

8/13/2019 Bs Trading (1)
http://slidepdf.com/reader/full/bs-trading-1 9/265
8/13/2019 Bs Trading (1)
http://slidepdf.com/reader/full/bs-trading-1 10/265
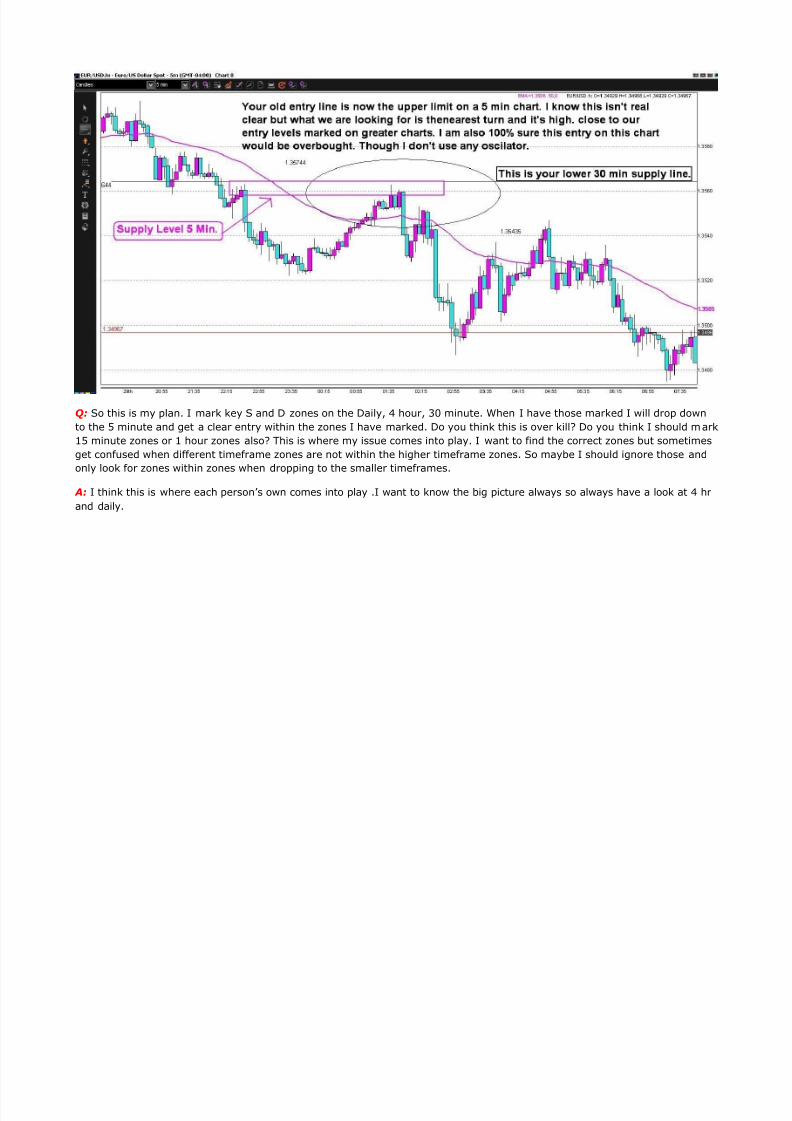
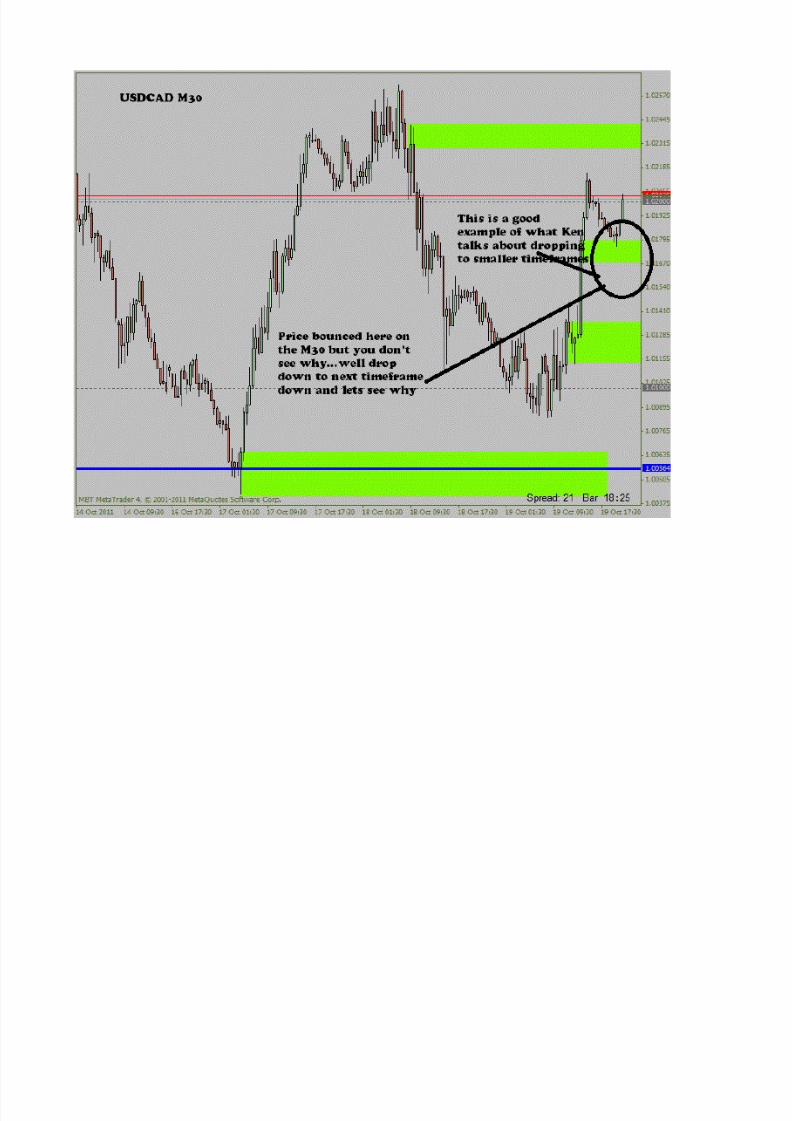
Q: So this is my plan. I mark key S and D zones on the Daily, 4 hour, 30 minute. When I have those marked I will drop downto the 5 minute and get a clear entry within the zones I have marked. Do you think this is over kill? Do you think I should m ark15 minute zones or 1 hour zones also? This is where my issue comes into play. I want to find the correct zones but sometimesget confused when different timeframe zones are not within the higher timeframe zones. So maybe I should ignore those andonly look for zones within zones when dropping to the smaller timeframes.
A: I think this is where each person’s own comes into play .I want to know the big picture always so always have a look at 4 hrand daily.

8/13/2019 Bs Trading (1)
http://slidepdf.com/reader/full/bs-trading-1 11/265
But what I think many are missing is the point that the supply and demand levels. are current pricing action, Like in the pdf thestuff behind the swings has already played out, So any time frame can work you will just have many more with faster charts.and you will have to scale up into longer time frames as you try and find levels that are above or below current swings.
Like on e/u now, say i was trying to spot a new demand level below 1.3360 on my 30 min chart I can't see anything at all. Ithen start to scale up into longer time frames until i can see the next demand level and in this case I had to go all the way to adaily chart.
Yes I could maybe scroll back far enough but then you also loss sight of the overall picture . Your R;R and maybe the distancetraveled from the demand , Once you find the level on your chart then start to zoom in to get the best least risk entries.

8/13/2019 Bs Trading (1)
http://slidepdf.com/reader/full/bs-trading-1 12/265
8/13/2019 Bs Trading (1)
http://slidepdf.com/reader/full/bs-trading-1 13/265
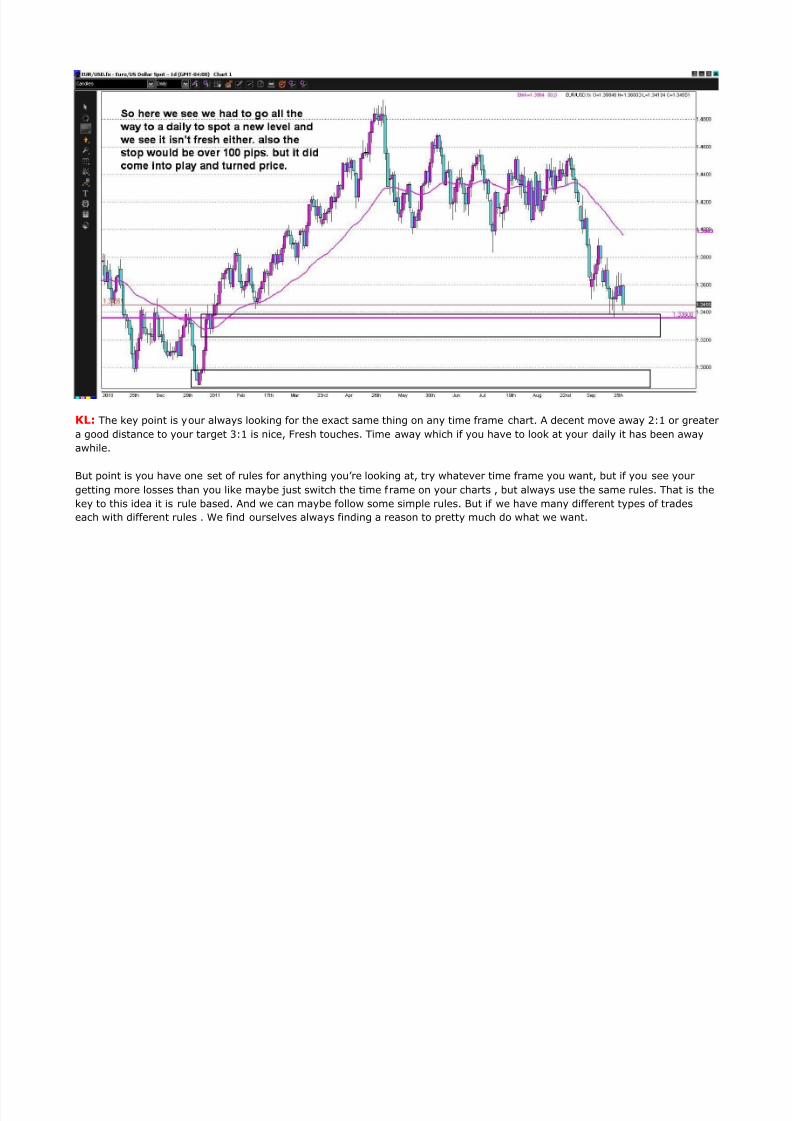
KL: The key point is your always looking for the exact same thing on any time frame chart. A decent move away 2:1 or greatera good distance to your target 3:1 is nice, Fresh touches. Time away which if you have to look at your daily it has been awayawhile.
But point is you have one set of rules for anything you’re looking at, try whatever time frame you want, but if you see yourgetting more losses than you like maybe just switch the time f rame on your charts , but always use the same rules. That is thekey to this idea it is rule based. And we can maybe follow some simple rules. But if we have many different types of tradeseach with different rules . We find ourselves always finding a reason to pretty much do what we want.

8/13/2019 Bs Trading (1)
http://slidepdf.com/reader/full/bs-trading-1 14/265
Plus remember to look at how that fresh touch rejected did it make it into the level or barely outside? Just because it touchesonce doesn't always make it a failure for a second touch . Plus being a old level newer orders may start coming in and reinforcethat demand. Just keep a eye on it and look for fresh levels off your faster charts near or within that level.
Rufus: will also narrow down my entry by reducing the chart.... But it is a two edged sword. I have missed entries by lessthan a pip. (I do a lot of pending entries right now) So at times it is better to make the zone bigger and reduce your positionsize. My rule of thumb is drop no more than two time frames. Sometimes three if my zone is still to wide.
So if S/D is found on a daily chart....I go to 4h and 1h to narrow the zone if need be. If it gets reduced to 50 pips or less(Including my stop distance) and there is 100 or greater pips to the first target. Great. Now if the target is only 80 pips awayand I like the zone, then the 30 min comes into play to get the R/R into proper proportions. It just means that I may not gettagged for an entry.
So 1hr chart S/D I will use 15m and 5m still looking at R/R to help determine the validity of the entry.
KL: One of the key things I look for is not a certain time frame , but which level is the clearest no matter what time it is. Thesame with my trades i don't trade a pair I trade the best entries usually.
I will try and post some ideas . plus the zooming down isn't as much trying to shrink a level it is to get a better entry at timesWITHIN that level,
It isn't so much having the multiple time frame levels marked on your charts. have the bigger ones for the overall picture thenas you search for a entry during price action is when you watch your faster charts for entries that coincide with your largerlevels. so basically pick some great clear levels, Then watch it on your time of choice .
8/13/2019 Bs Trading (1)
http://slidepdf.com/reader/full/bs-trading-1 15/265

8/13/2019 Bs Trading (1)
http://slidepdf.com/reader/full/bs-trading-1 16/265
Rufus: Here is what I was trying to say in too many words...
The steps I go through to pick out a potential zone.
One more thing. The EU is in a strong down trend..IMO.. So if I take this pending order I will more than likely put my entry

8/13/2019 Bs Trading (1)
http://slidepdf.com/reader/full/bs-trading-1 17/265
closer to the "00" say 1.2908 or so. My thinking here is a retest of this psych level, again lowering my risk or at times moreimportantly able to reach my risk reward ratio quicker.

8/13/2019 Bs Trading (1)
http://slidepdf.com/reader/full/bs-trading-1 18/265

8/13/2019 Bs Trading (1)
http://slidepdf.com/reader/full/bs-trading-1 19/265

8/13/2019 Bs Trading (1)
http://slidepdf.com/reader/full/bs-trading-1 20/265
KL: When trading within a strong trend the closer supply levels are sometimes the only ones you can get in at.
Right now e/u is sitting in a demand level on the 4 hr and I have a daily level top line right below it. a confirmation order for along (Which means prices moves down into the demand level and we look for a entry as it exits going back up) might be thesafest play down here or wait for a break and then retest of a swap line.
Remember there is never any hurry better to get a few great trades than to suffer through a bunch of bad ones .

8/13/2019 Bs Trading (1)
http://slidepdf.com/reader/full/bs-trading-1 21/265
8/13/2019 Bs Trading (1)
http://slidepdf.com/reader/full/bs-trading-1 22/265

8/13/2019 Bs Trading (1)
http://slidepdf.com/reader/full/bs-trading-1 23/265

8/13/2019 Bs Trading (1)
http://slidepdf.com/reader/full/bs-trading-1 24/265
8/13/2019 Bs Trading (1)
http://slidepdf.com/reader/full/bs-trading-1 25/265

8/13/2019 Bs Trading (1)
http://slidepdf.com/reader/full/bs-trading-1 26/265

8/13/2019 Bs Trading (1)
http://slidepdf.com/reader/full/bs-trading-1 27/265
GBPUSD 5Min

8/13/2019 Bs Trading (1)
http://slidepdf.com/reader/full/bs-trading-1 28/265
GBPUSD 45Min
8/13/2019 Bs Trading (1)
http://slidepdf.com/reader/full/bs-trading-1 29/265
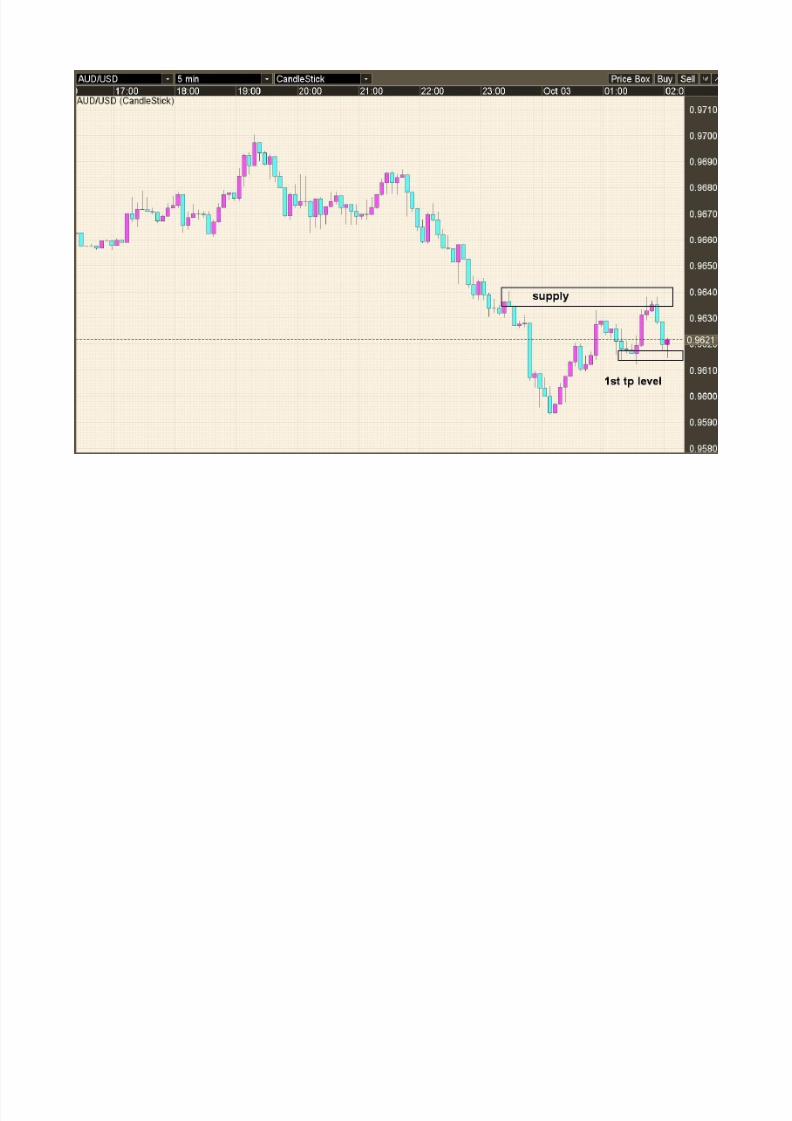
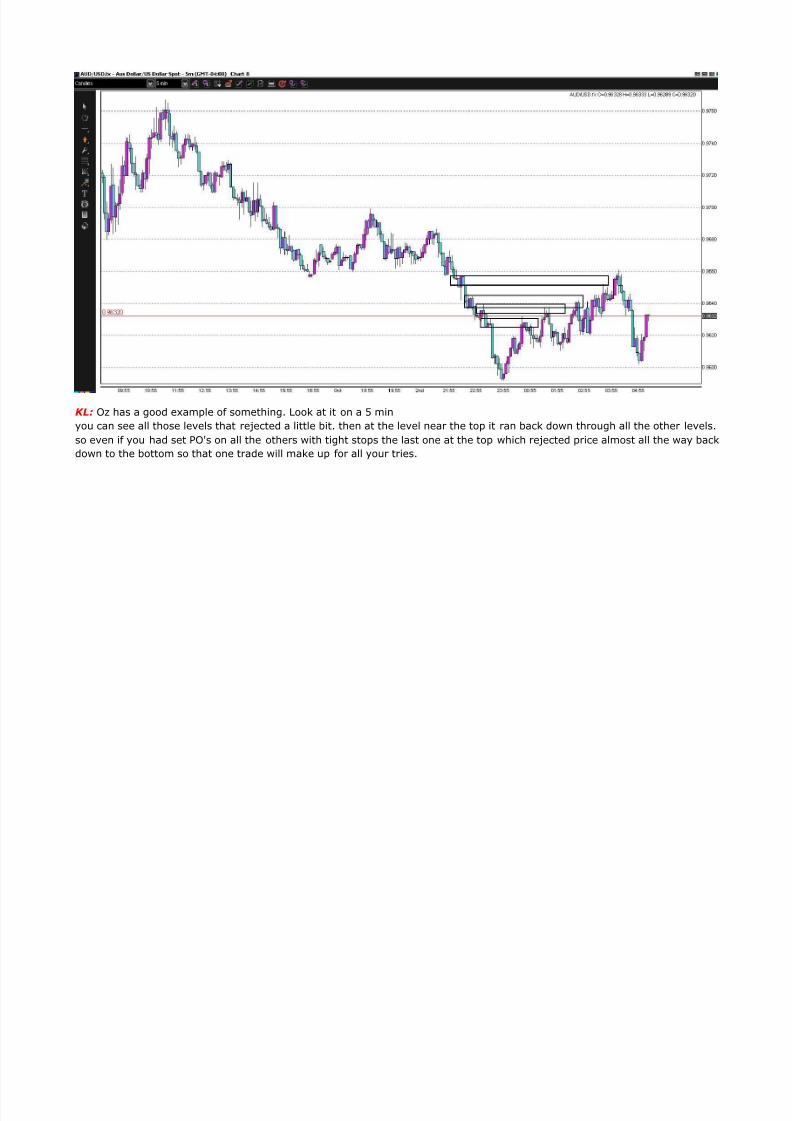
KL: Oz has a good example of something. Look at it on a 5 minyou can see all those levels that rejected a little bit. then at the level near the top it ran back down through all the other levels.so even if you had set PO's on all the others with tight stops the last one at the top which rejected price almost all the way backdown to the bottom so that one trade will make up for all your tries.

8/13/2019 Bs Trading (1)
http://slidepdf.com/reader/full/bs-trading-1 30/265
KL: then look at it on a 15 miin and you can see the fresh level where turned right below it .
8/13/2019 Bs Trading (1)
http://slidepdf.com/reader/full/bs-trading-1 31/265

8/13/2019 Bs Trading (1)
http://slidepdf.com/reader/full/bs-trading-1 32/265

8/13/2019 Bs Trading (1)
http://slidepdf.com/reader/full/bs-trading-1 33/265
Peter E: heres an A-U 15m chart i drew up,
the only trade i like (from yesterday's session) is at the blue arrow : price convincingly breaks out of consolidation and throughdemand, returns to test and finds supply, exit at next demand level (yellow) ........not sure if this is a reliable way to trade, justtesting

8/13/2019 Bs Trading (1)
http://slidepdf.com/reader/full/bs-trading-1 34/265

8/13/2019 Bs Trading (1)
http://slidepdf.com/reader/full/bs-trading-1 35/265

8/13/2019 Bs Trading (1)
http://slidepdf.com/reader/full/bs-trading-1 36/265
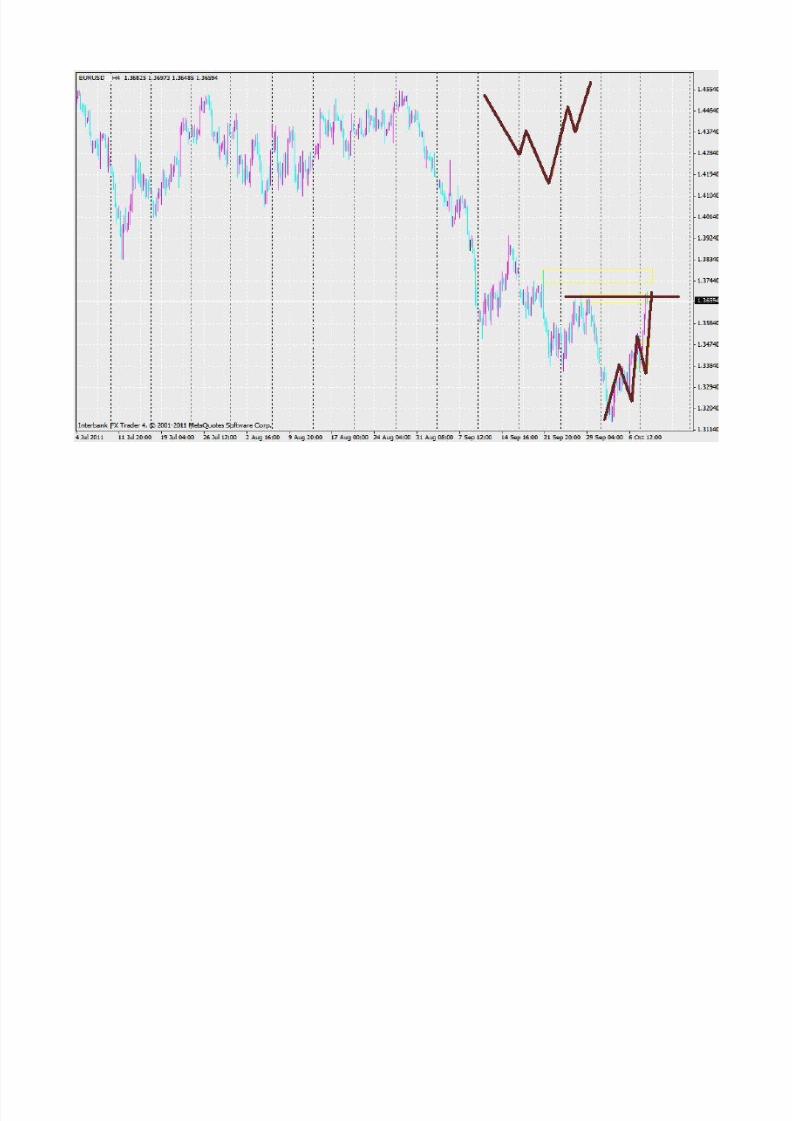
Nawlins : KL got a question. Would you consider the last leg in the yellow circle a fresh supply zone. This is a type of area I stillget confused about. This is the M5 and just practicing this TF. This is the EU also.

8/13/2019 Bs Trading (1)
http://slidepdf.com/reader/full/bs-trading-1 37/265

8/13/2019 Bs Trading (1)
http://slidepdf.com/reader/full/bs-trading-1 38/265
That is basically how the system is explained in the webinars. Pick levels of weekly all the way down to 30 min and then lookfor entries on as fast as a 2 min chart. it is the same with almost all successful systems enter as a scalper and hold like a swingtrader. With this we can see the larger levels and play them that way. the trust factor will come, just mark the entries and tp'son your charts and watch it payout again and againafter awhile you will want to get all those pips.
The thing is that the charts are a breathing living thing , they swell and contract based of global news. The levels you pick thatprice keeps moving away from are then becoming better levels. if the new ones also meet all the requirements they are alsoAA+ levels this is a rule based system . It is a easy matter to spot the levels then grade them with the enhancers which willbecome second nature very fast.
So just mark them all see which ones develop into the better ones and also see which ones you mark playout the way youthought.t is the only way to learn to spot them. just don't forsake your old levels as they will be better the longer and furtherprices moves away from them . First two rules

8/13/2019 Bs Trading (1)
http://slidepdf.com/reader/full/bs-trading-1 39/265

8/13/2019 Bs Trading (1)
http://slidepdf.com/reader/full/bs-trading-1 40/265

8/13/2019 Bs Trading (1)
http://slidepdf.com/reader/full/bs-trading-1 41/265
Keep in mind the swings as well they are your sign of the trends direction .

8/13/2019 Bs Trading (1)
http://slidepdf.com/reader/full/bs-trading-1 42/265
it was the 3rd test not fresh at all . the lower low was kinda of why I still tried the short once again .
8/13/2019 Bs Trading (1)
http://slidepdf.com/reader/full/bs-trading-1 43/265

8/13/2019 Bs Trading (1)
http://slidepdf.com/reader/full/bs-trading-1 44/265
8/13/2019 Bs Trading (1)
http://slidepdf.com/reader/full/bs-trading-1 45/265
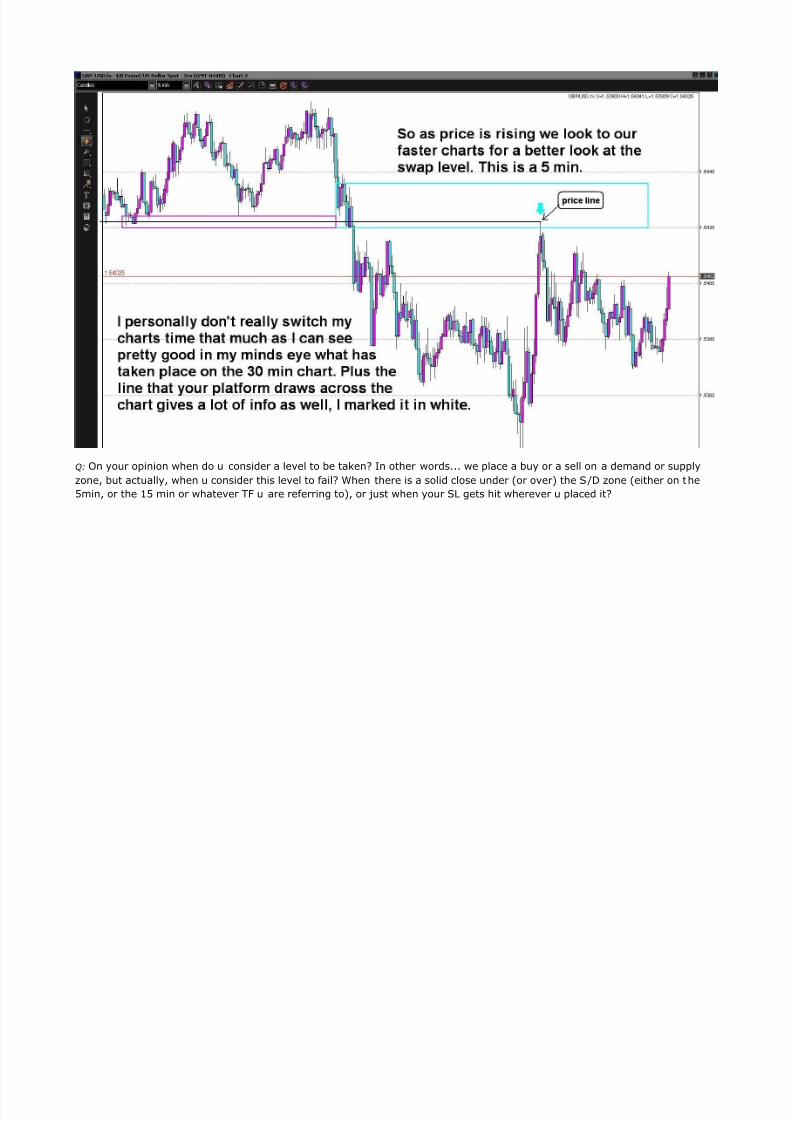
Q: On your opinion when do u consider a level to be taken? In other words... we place a buy or a sell on a demand or supplyzone, but actually, when u consider this level to fail? When there is a solid close under (or over) the S/D zone (either on t he5min, or the 15 min or whatever TF u are referring to), or just when your SL gets hit wherever u placed it?

8/13/2019 Bs Trading (1)
http://slidepdf.com/reader/full/bs-trading-1 46/265
A: At times it doesn't even have to break it to be nonvalid anymore. As we gain expreince picking levels. We can see pricemoving through the stack of orders and we really don't want to be holding a trade when the stakc is depleted and price makesthat fast move that would show us that the swap has taken place.
Luckily it normally takes a few minutes to happen and it is very visible. Just mark your levels and watch Price Action at them
and it will not take long to understand this style of picking areas of interest.
Once a level gets taken out BREAKS OUT just as in any other trading strategy we look for a retest to enter, But again there hasto be orders at that point to make us interested in it .
Q: is it correct to assume that when price is approaching supply or demand level we would want to see a fast feverish PA andnot a slow small candles?does slow PA into a zone have a better chance to actually blow throw a level?
A: Yes big solid candles are great. , The idea is the same as picking levels, The run into a entry level is the same as a movethat forms a level. To pick quality TP's we need a nice swing with no stalling areas . That way our target is very clear.

8/13/2019 Bs Trading (1)
http://slidepdf.com/reader/full/bs-trading-1 47/265

8/13/2019 Bs Trading (1)
http://slidepdf.com/reader/full/bs-trading-1 48/265

8/13/2019 Bs Trading (1)
http://slidepdf.com/reader/full/bs-trading-1 49/265
8/13/2019 Bs Trading (1)
http://slidepdf.com/reader/full/bs-trading-1 50/265

8/13/2019 Bs Trading (1)
http://slidepdf.com/reader/full/bs-trading-1 51/265
Q: see attached EURUSD 30m chart. Is this the correct Supply level zone?

8/13/2019 Bs Trading (1)
http://slidepdf.com/reader/full/bs-trading-1 52/265

8/13/2019 Bs Trading (1)
http://slidepdf.com/reader/full/bs-trading-1 53/265

8/13/2019 Bs Trading (1)
http://slidepdf.com/reader/full/bs-trading-1 54/265

8/13/2019 Bs Trading (1)
http://slidepdf.com/reader/full/bs-trading-1 55/265

8/13/2019 Bs Trading (1)
http://slidepdf.com/reader/full/bs-trading-1 56/265
8/13/2019 Bs Trading (1)
http://slidepdf.com/reader/full/bs-trading-1 57/265
8/13/2019 Bs Trading (1)
http://slidepdf.com/reader/full/bs-trading-1 58/265

8/13/2019 Bs Trading (1)
http://slidepdf.com/reader/full/bs-trading-1 59/265
8/13/2019 Bs Trading (1)
http://slidepdf.com/reader/full/bs-trading-1 60/265
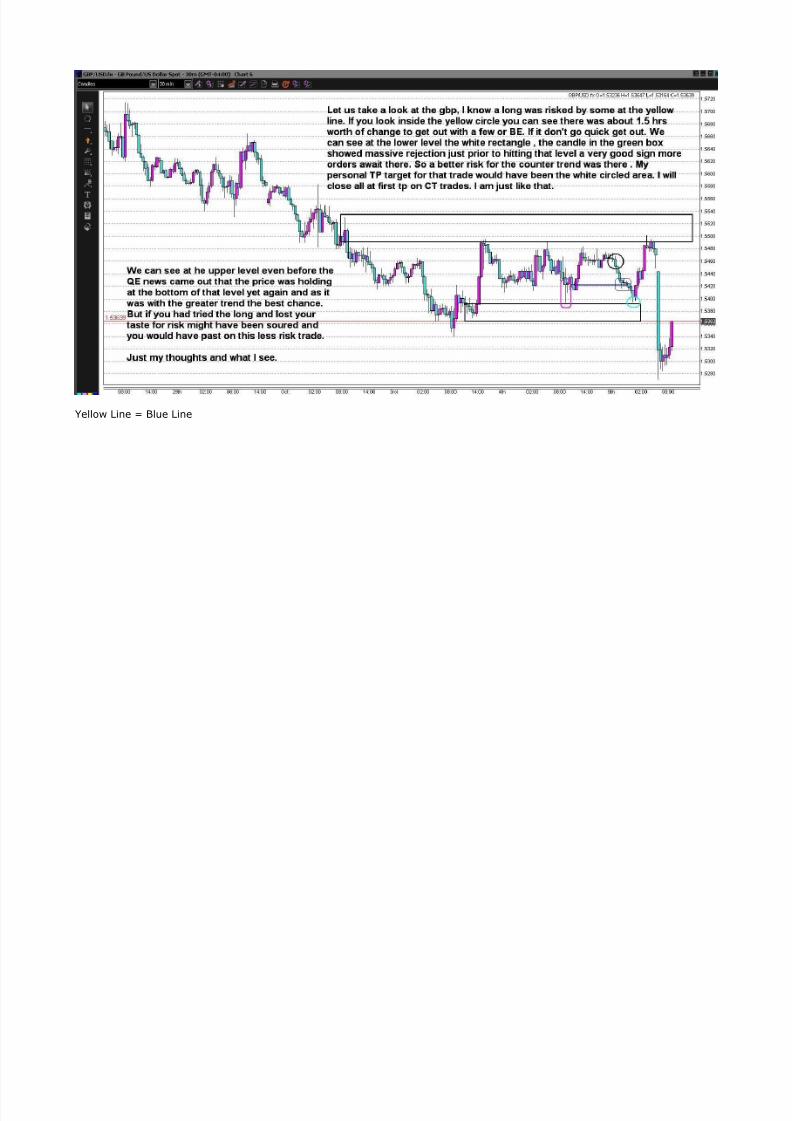
Yellow Line = Blue Line

8/13/2019 Bs Trading (1)
http://slidepdf.com/reader/full/bs-trading-1 61/265
8/13/2019 Bs Trading (1)
http://slidepdf.com/reader/full/bs-trading-1 62/265
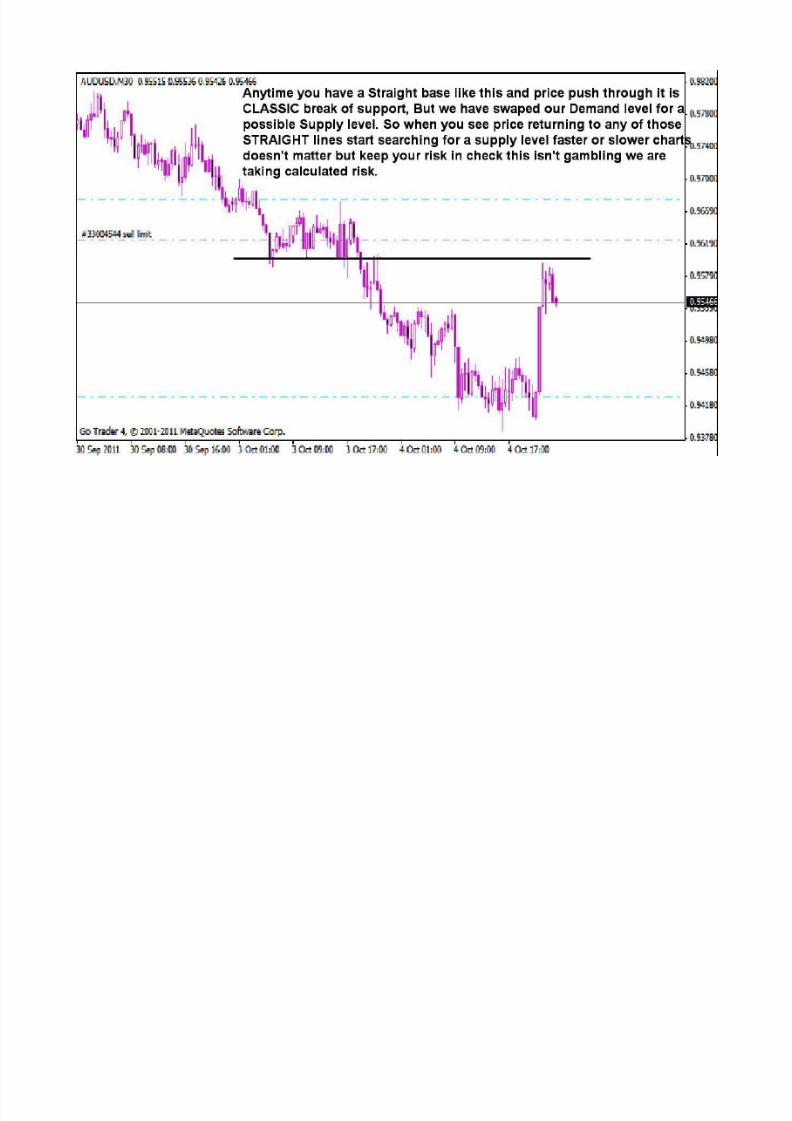
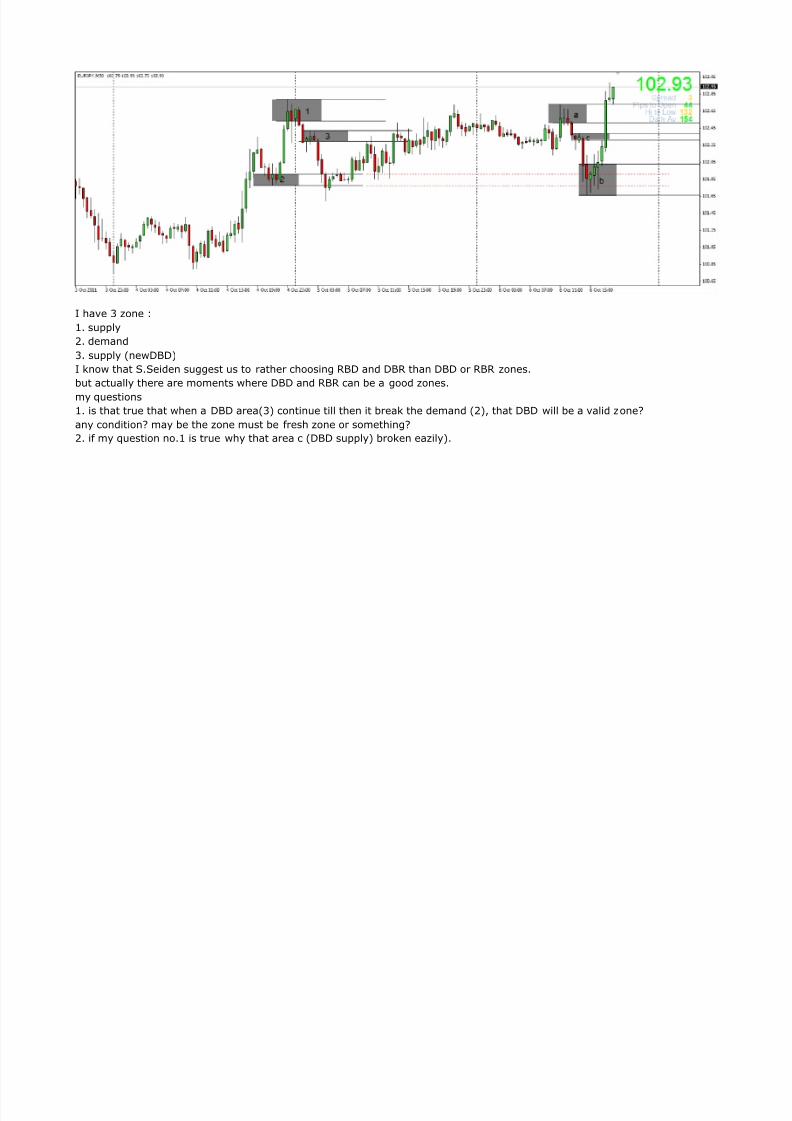
I have 3 zone :1. supply2. demand3. supply (newDBD)I know that S.Seiden suggest us to rather choosing RBD and DBR than DBD or RBR zones.but actually there are moments where DBD and RBR can be a good zones.my questions1. is that true that when a DBD area(3) continue till then it break the demand (2), that DBD will be a valid zone?
any condition? may be the zone must be fresh zone or something?2. if my question no.1 is true why that area c (DBD supply) broken eazily).

8/13/2019 Bs Trading (1)
http://slidepdf.com/reader/full/bs-trading-1 63/265
8/13/2019 Bs Trading (1)
http://slidepdf.com/reader/full/bs-trading-1 64/265

8/13/2019 Bs Trading (1)
http://slidepdf.com/reader/full/bs-trading-1 65/265
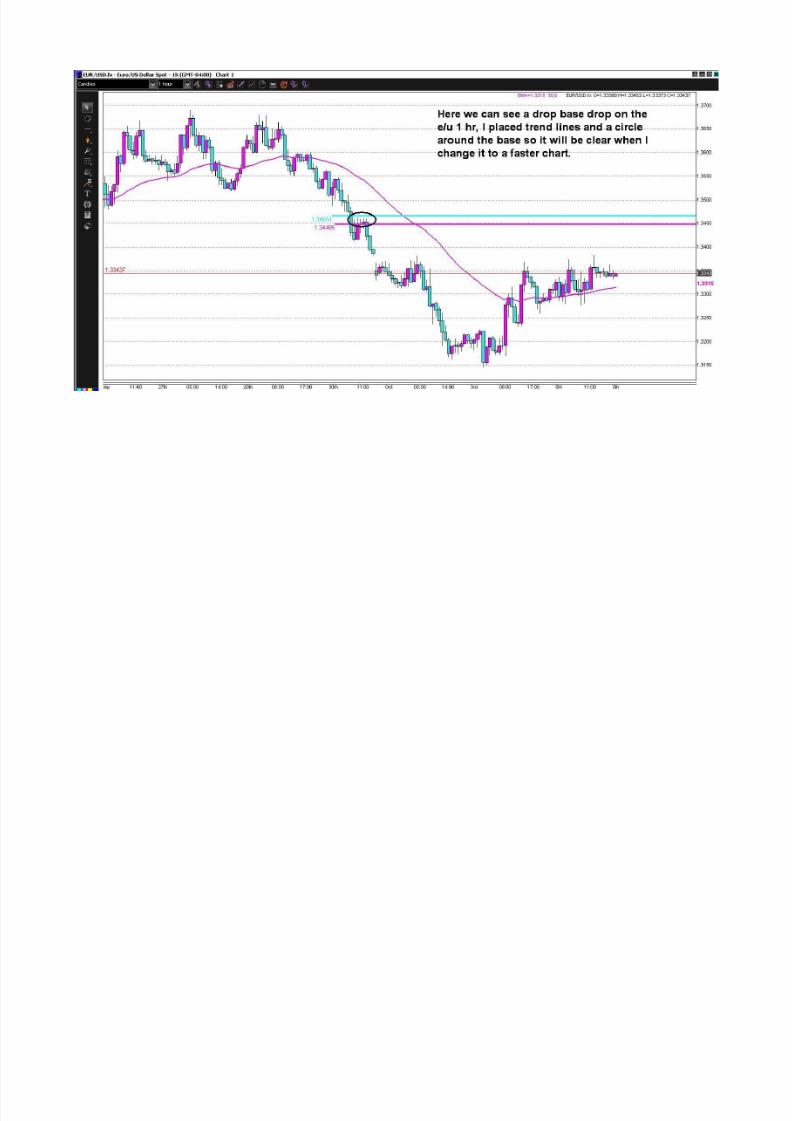
Q: Is this the valid Supply Zone?
A: Yes but would have liked to see it a bit closer to 1.3444
8/13/2019 Bs Trading (1)
http://slidepdf.com/reader/full/bs-trading-1 66/265

8/13/2019 Bs Trading (1)
http://slidepdf.com/reader/full/bs-trading-1 67/265

8/13/2019 Bs Trading (1)
http://slidepdf.com/reader/full/bs-trading-1 68/265
I would put more weight on the lower level, that is the way to look at levels on levels , you can see that the lower level wastested twice before price moved north, So if I placed a PO on anything down here it would be the lower level.
The Thinking behind levels on levels is the fact that if it pushes through the higher level a good deal of supply will have beenused up getting through that demand . So any orders left in the lower level will have more effect on price.
8/13/2019 Bs Trading (1)
http://slidepdf.com/reader/full/bs-trading-1 69/265
8/13/2019 Bs Trading (1)
http://slidepdf.com/reader/full/bs-trading-1 70/265
8/13/2019 Bs Trading (1)
http://slidepdf.com/reader/full/bs-trading-1 71/265
8/13/2019 Bs Trading (1)
http://slidepdf.com/reader/full/bs-trading-1 72/265
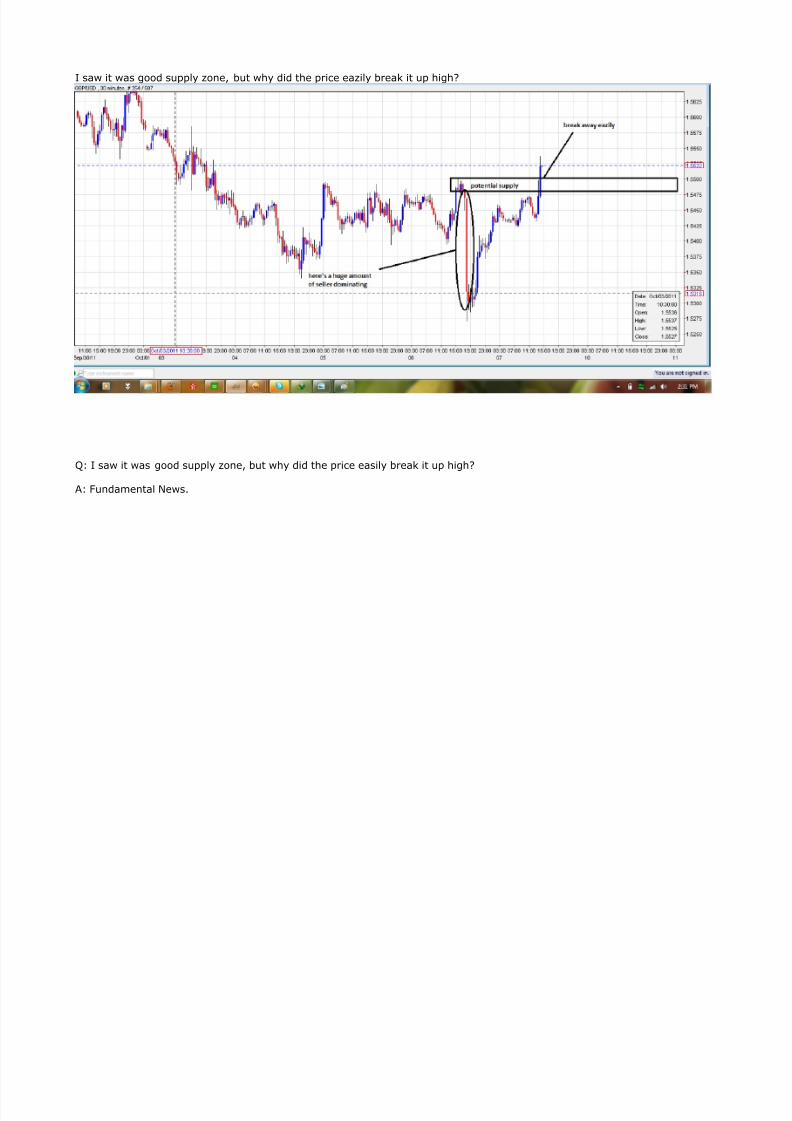
I saw it was good supply zone, but why did the price eazily break it up high?
Q: I saw it was good supply zone, but why did the price easily break it up high?
A: Fundamental News.

8/13/2019 Bs Trading (1)
http://slidepdf.com/reader/full/bs-trading-1 73/265
FxEuPhoria: An important thing or two I want to ad is the take profit levels. The make or break of trading demand and supplyis the discipline to let you winners run to your predetermined take profit level. This is crucial. The other factor is only tradingwhat Ken calls fresh supply/demand levels or first touches, the final factor is trading with a trend, if no trend is visible and themarket is ranging short and long positions are okay to take.

8/13/2019 Bs Trading (1)
http://slidepdf.com/reader/full/bs-trading-1 74/265
A: you can see i t wasn't a breach the high in the level was 1.3462 the high of the wick in the test of it was 1.3463 , This is whywe add a few pips to the high
All that being said just your questioning that retest shows that you can see that this second test went deeper, almost did break

8/13/2019 Bs Trading (1)
http://slidepdf.com/reader/full/bs-trading-1 75/265
and so with the shallow rejection from that level we know it i s not safe anymore. But seeing what you did you could have takenthe scalp grabbed a few and waited for the break or a fresh long off a different demand level
A: FXEUPHORIA
Regarding you supply zone, on the 1hour it does look decent and fresh touch, but, here are my worries:
-Uptrend on 1hour since last monday-4hour pa
The 4 hour pa looks quite disturbing for a short, sure, 4 hour is in an obvious downtrend but recent pa looks like we may see a

8/13/2019 Bs Trading (1)
http://slidepdf.com/reader/full/bs-trading-1 76/265
trend reversal, I outlined my concerns in the chart by drawing what we MIGHT see.
This would be an easy pass for me as with this way of looking at the markets trades are abundant, so wait for the A++ setups.
The demand zones:
I do like them and I am currently watching them. These are bound to give great risk reward profiles and are on my currentwatchlist.

8/13/2019 Bs Trading (1)
http://slidepdf.com/reader/full/bs-trading-1 77/265
8/13/2019 Bs Trading (1)
http://slidepdf.com/reader/full/bs-trading-1 78/265

8/13/2019 Bs Trading (1)
http://slidepdf.com/reader/full/bs-trading-1 79/265

8/13/2019 Bs Trading (1)
http://slidepdf.com/reader/full/bs-trading-1 80/265
8/13/2019 Bs Trading (1)
http://slidepdf.com/reader/full/bs-trading-1 81/265
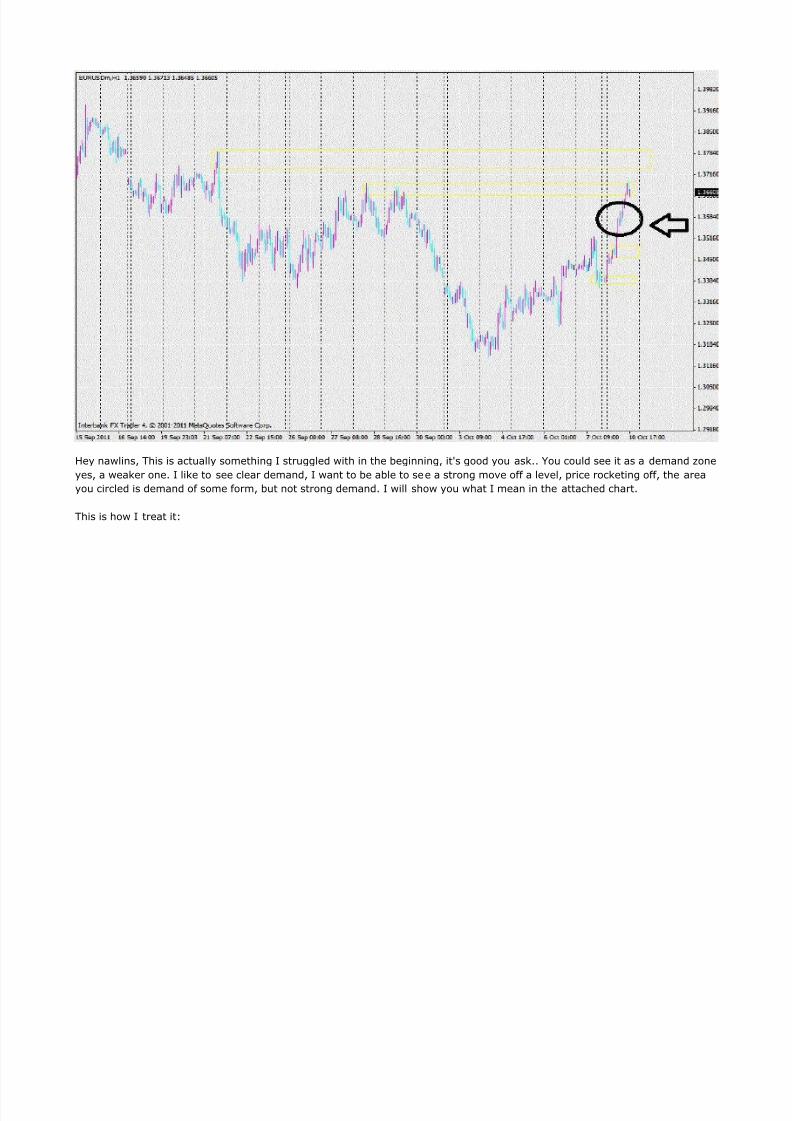
Hey nawlins, This is actually something I struggled with in the beginning, it's good you ask.. You could see it as a demand zoneyes, a weaker one. I like to see clear demand, I want to be able to see a strong move off a level, price rocketing off, the areayou circled is demand of some form, but not strong demand. I will show you what I mean in the attached chart.
This is how I treat it:

8/13/2019 Bs Trading (1)
http://slidepdf.com/reader/full/bs-trading-1 82/265
-Trade the best demand and supply you can find, on 2nd touch. That's it, if I miss some trades it's okay.
-Trade less to make more.
-If you are at all confused about about any levels don't trade them, wait for those you are sure about, if you lose a trade th en
it's only a part of the business.
On to what's going on in my attached chart, I wait for price to enter half way into my supply or demand zone before I enter,This is last weeks AUD/USD. the red circles are the zones I ignored(pay attention to them). I like the demand or supply levelsto be the point of a new swing not in a leg of a continuation.. Hope this chart helps, following the above rules you would havegotten 2 good trades the 2nd one being a home run trade (small risk, big reward).
This is obviously a representation of a perfect week but this should give you the idea.

8/13/2019 Bs Trading (1)
http://slidepdf.com/reader/full/bs-trading-1 83/265
8/13/2019 Bs Trading (1)
http://slidepdf.com/reader/full/bs-trading-1 84/265

8/13/2019 Bs Trading (1)
http://slidepdf.com/reader/full/bs-trading-1 85/265

8/13/2019 Bs Trading (1)
http://slidepdf.com/reader/full/bs-trading-1 86/265
8/13/2019 Bs Trading (1)
http://slidepdf.com/reader/full/bs-trading-1 87/265

8/13/2019 Bs Trading (1)
http://slidepdf.com/reader/full/bs-trading-1 88/265

8/13/2019 Bs Trading (1)
http://slidepdf.com/reader/full/bs-trading-1 89/265

8/13/2019 Bs Trading (1)
http://slidepdf.com/reader/full/bs-trading-1 90/265

8/13/2019 Bs Trading (1)
http://slidepdf.com/reader/full/bs-trading-1 91/265
Supply zone 1 - I like this one as price didn't hang around very long and very quick exit from zone. Would you saythis is a aaa trade setup?

8/13/2019 Bs Trading (1)
http://slidepdf.com/reader/full/bs-trading-1 92/265
Yes with the amount of time it has already spent away it should be very nice. The only thing is that price did tryand retest i but turned a good deal below it.
Supply Zone 2 - would you count this as a supply zone as price did hang around for about 9 candles beforedropping. Do you prefer a quick turn around?
The base is pretty Big lots of candles, The bigger the base the more orders get filled. So may not be much left onprices return . Why a good base is 2 to 5 candles but that is very relative as change the time frame and you canincreas or decrease the amount of candles. You can get a feel for it by just comparing to other areas within thesame chart.
Supply zone 3 - Do you find these mini pullbacks (1 or 2 candles) in a strong move up or down are very reliablezones?
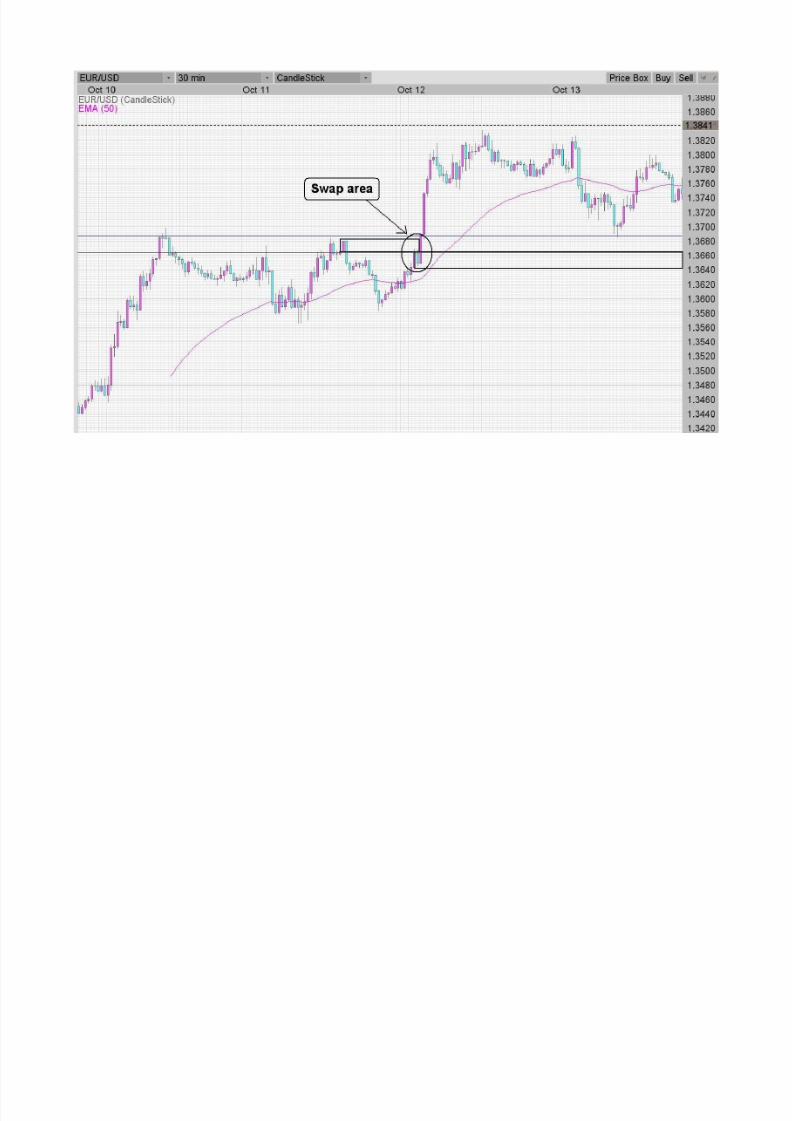
This is a swap level if you draw your entry line across to the right you can see where it swapped from originally. I
personally will try a swap level as they are a common traded idea, Not sure I would use them with PO's unless itwas a swap with a trend. Like almost any level they will reject price and if your present you will have a chance toexit or scalp a few pips.
Supply Zone 4 - This supply zone wasn't actually touched but would you count the close vicinity of the price asgood enough and not use it again in future? Or would you consider it still fresh so use it again in the future?
I see these as a first touch but you can see it didn't move into the level which usually means the level has a gooddeal of orders within it.The current price action did not reject real well from it the last time. So i would want towatch it to enter.
Supply Zone 5 - How would you view this supply zone? Is it part of the one above so as it has beeen touched nolonger count it going forward? Or would you view it as a new fresh zone?
Yes it is a touch of the last 4th level but if price pulls away from it it could be the continuation of the trend. WEhave seen in many trading ideas that small pull backs. Are relativity safe to trade, In EO trading it was the 1 and 5o'clock trades In Ponsi's book he uses a 10 ema .This is no different than that . Last friday we choose the closest level for the continuation turn on the gbp and it

8/13/2019 Bs Trading (1)
http://slidepdf.com/reader/full/bs-trading-1 93/265
was the area price made a 200 pip run from .
Today the OZ trade the retracement wasn't very deep either. You have to work within your risk level and comfortzone. Some look for the very best levels which could be days or weeks apart, I look for daily trades on a bit fasterchart.
I have seen quite a few supply and demand zones broken through so rather than just put an order in place at startof zone, I prefer to watch price as it approaches and once it enters zone watch the price action on a lowertimeframe like 5 min or even better 1 min for confirmation of a reversal.
Yes or as Sam's idea is once price moves into a deep level put a PO to trigger when price leaves in your direction .But as a rule the closer your entry to your stop the better at the very least your loss is less.
Do you think that is a good idea?
See Above
Lastly Dean Guile uses Fibonacci Levels, would you discount any zone that doesn't coincide with a recognisable fiblevel?
I was a big fan of fibs , myself But I don't see the need for them with this trading style plus the less you have toconsider the less you have to doubt. it is very easy to see when your within a fib trading zone and it as will anybasic major trading idea will have it's share of traders adding their orders to help us on our way.
But I don't see much weight for or against them . In the past even with S/R trading the level could be any of manyfib lines so not as accurate as most think and just because it is close we think they are working. I will try and keepmy eye on Supply and Demand and concentrate on these levels instead.
But if they help you to see or trust a trade better , That is your call.The second entry on OZ was between the 50 and 61.8 last night but it was between ?, a good entry for fib tradersbut the level was spot on . ????

8/13/2019 Bs Trading (1)
http://slidepdf.com/reader/full/bs-trading-1 94/265

8/13/2019 Bs Trading (1)
http://slidepdf.com/reader/full/bs-trading-1 95/265

8/13/2019 Bs Trading (1)
http://slidepdf.com/reader/full/bs-trading-1 96/265

8/13/2019 Bs Trading (1)
http://slidepdf.com/reader/full/bs-trading-1 97/265
8/13/2019 Bs Trading (1)
http://slidepdf.com/reader/full/bs-trading-1 98/265

8/13/2019 Bs Trading (1)
http://slidepdf.com/reader/full/bs-trading-1 99/265
Not sure what a level inside a level is ?
Sometimes we can look for levels off a faster chart that may fit inside a level of a slower chart to lower risk .
The chart on eur/usd is showing levels on levels One level above or below another. They are so close that the edges can touch
8/13/2019 Bs Trading (1)
http://slidepdf.com/reader/full/bs-trading-1 100/265
or there is almost no separation .
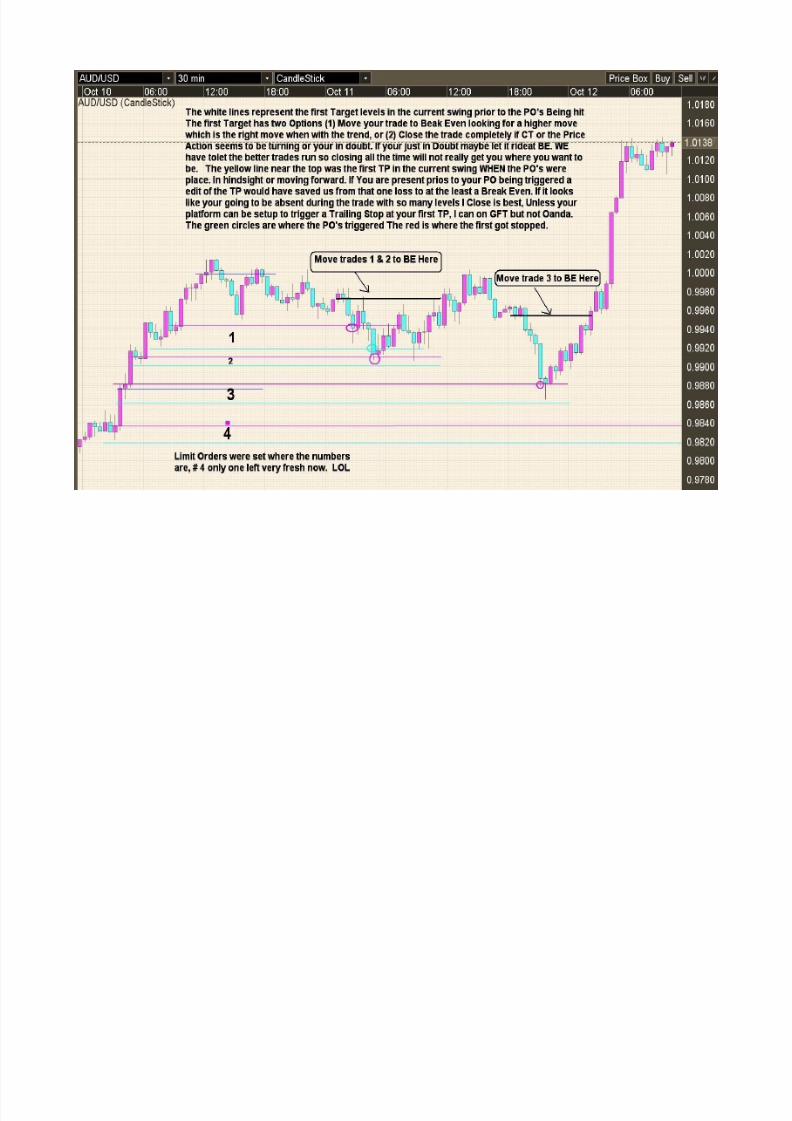
The only one's Sam talks of for Po's is fresh Levels meaning they haven't been touched yet. But PO's can be used for otherreasons as well,
But for a set forget make sure it is a fresh level with a good move away and price has been away a while.
But if you have trigger finger issues like you always tend to enter to soon because your afraid you might miss a trade or youenter to late then don't take it . I am using more Po's at spots That if I was sitting at my computer and waiting for price toreach a level . That way I can have my entry, my STOP and my Profit Target all planned out. So that means I planned the tradeI am just then letting the computer trade that plan. A poor mans EA ,, LOL
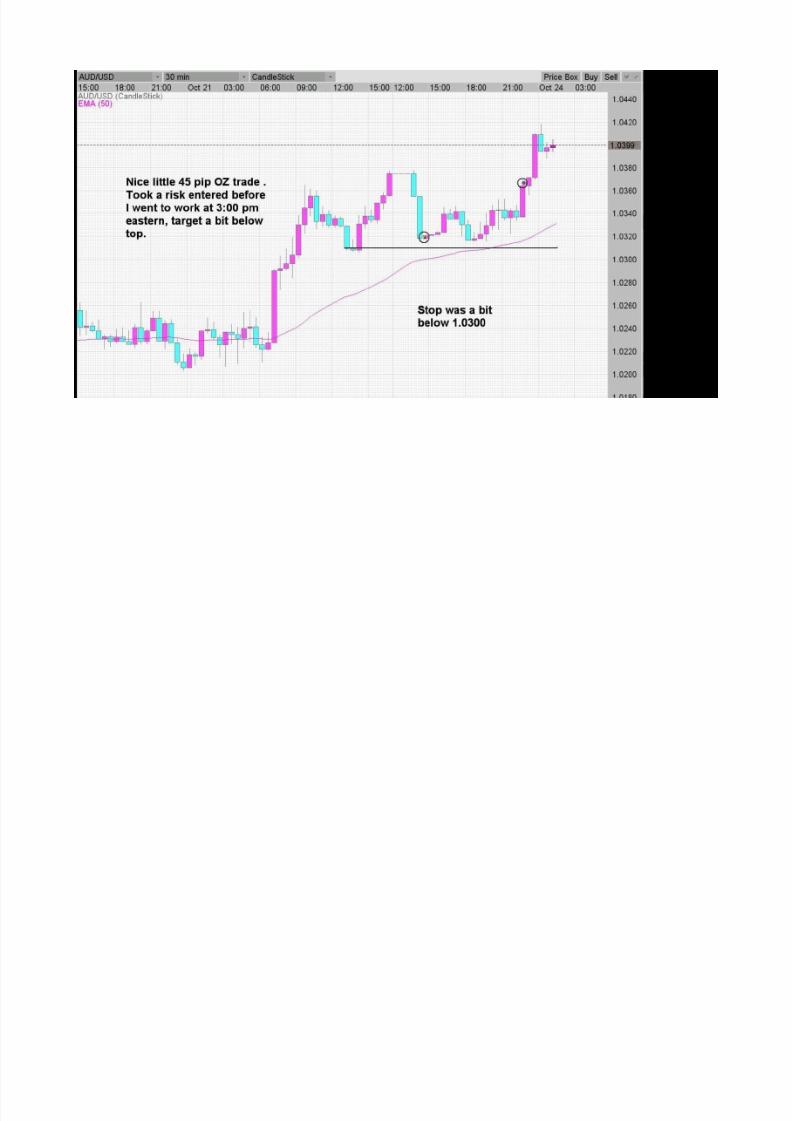
I like the shallow pull backs after a strong move . and have no fear of taking them . if you read back a few pages you can se ewhen I placed those OZ orders , A lot folks were only looking at level 4 as a place to set a Limit Order. I just have found thatthe majority of my 30 min levels are tradeable.
Plus some maybe only looking for 100+ trade where a solid 20 + can make me a happy guy and a 40+ is considered a homer .My weekly goal is only about 150 pips to be a easy 20% increase with a risk I am very happy with. So 30 a day average isgreat. My work for myself is to now make most of it when out playing , using PO's
In most cases the hardest part of trading is the guy sitting in front of your computer. So to eliminate as much of those guysmistakes and also prove to yourselves that your making the right choices . Setting up the trades and then letting them play o utmaybe the best thing you ever do.
But however each of us approach it , never change your plan after you have decided on it. i f you enter manually or by PO. Iwould say let it run it's course the only variable to that would be to protect equity by moving a trade to Break Even if the priceaction starts to show a change.

8/13/2019 Bs Trading (1)
http://slidepdf.com/reader/full/bs-trading-1 101/265

8/13/2019 Bs Trading (1)
http://slidepdf.com/reader/full/bs-trading-1 102/265

8/13/2019 Bs Trading (1)
http://slidepdf.com/reader/full/bs-trading-1 103/265

8/13/2019 Bs Trading (1)
http://slidepdf.com/reader/full/bs-trading-1 104/265
8/13/2019 Bs Trading (1)
http://slidepdf.com/reader/full/bs-trading-1 105/265

8/13/2019 Bs Trading (1)
http://slidepdf.com/reader/full/bs-trading-1 106/265
8/13/2019 Bs Trading (1)
http://slidepdf.com/reader/full/bs-trading-1 107/265

8/13/2019 Bs Trading (1)
http://slidepdf.com/reader/full/bs-trading-1 108/265

8/13/2019 Bs Trading (1)
http://slidepdf.com/reader/full/bs-trading-1 109/265

8/13/2019 Bs Trading (1)
http://slidepdf.com/reader/full/bs-trading-1 110/265
8/13/2019 Bs Trading (1)
http://slidepdf.com/reader/full/bs-trading-1 111/265
8/13/2019 Bs Trading (1)
http://slidepdf.com/reader/full/bs-trading-1 112/265
8/13/2019 Bs Trading (1)
http://slidepdf.com/reader/full/bs-trading-1 113/265
8/13/2019 Bs Trading (1)
http://slidepdf.com/reader/full/bs-trading-1 114/265

8/13/2019 Bs Trading (1)
http://slidepdf.com/reader/full/bs-trading-1 115/265
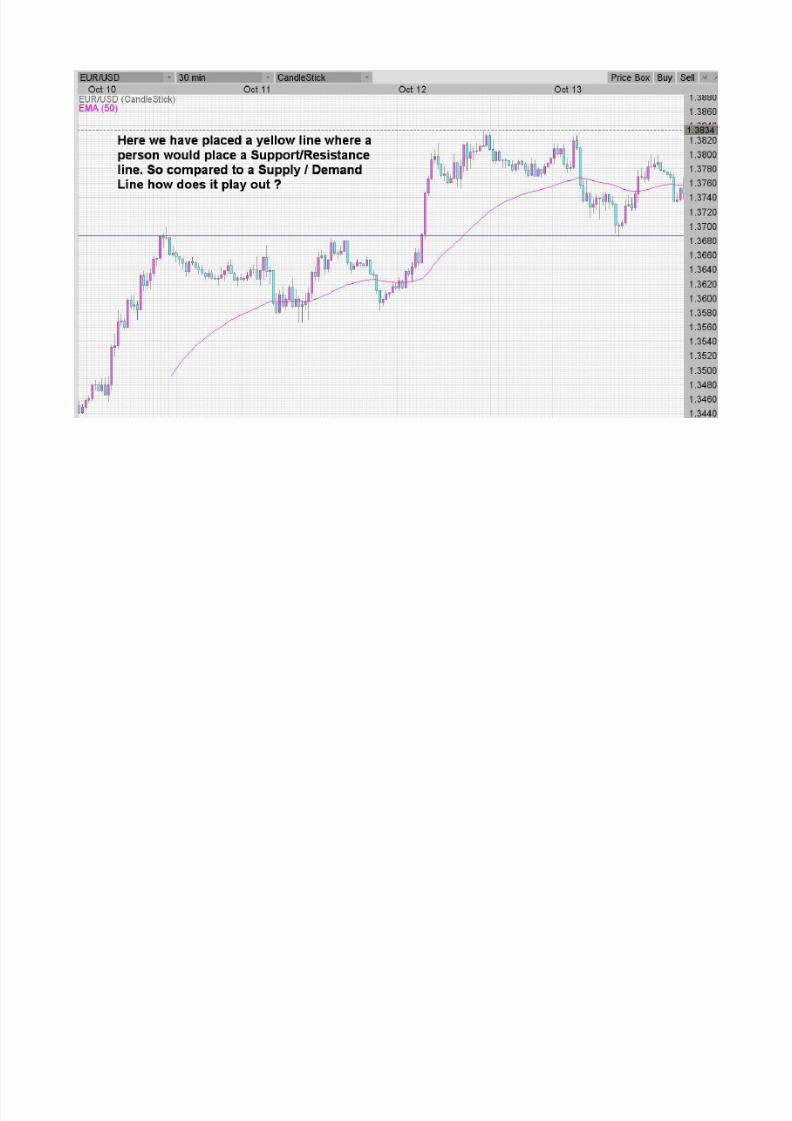
Support / Resistance verse Supply / Demand
8/13/2019 Bs Trading (1)
http://slidepdf.com/reader/full/bs-trading-1 116/265
8/13/2019 Bs Trading (1)
http://slidepdf.com/reader/full/bs-trading-1 117/265

8/13/2019 Bs Trading (1)
http://slidepdf.com/reader/full/bs-trading-1 118/265

8/13/2019 Bs Trading (1)
http://slidepdf.com/reader/full/bs-trading-1 119/265
8/13/2019 Bs Trading (1)
http://slidepdf.com/reader/full/bs-trading-1 120/265

8/13/2019 Bs Trading (1)
http://slidepdf.com/reader/full/bs-trading-1 121/265

8/13/2019 Bs Trading (1)
http://slidepdf.com/reader/full/bs-trading-1 122/265
8/13/2019 Bs Trading (1)
http://slidepdf.com/reader/full/bs-trading-1 123/265

8/13/2019 Bs Trading (1)
http://slidepdf.com/reader/full/bs-trading-1 124/265

8/13/2019 Bs Trading (1)
http://slidepdf.com/reader/full/bs-trading-1 125/265
8/13/2019 Bs Trading (1)
http://slidepdf.com/reader/full/bs-trading-1 126/265

8/13/2019 Bs Trading (1)
http://slidepdf.com/reader/full/bs-trading-1 127/265

8/13/2019 Bs Trading (1)
http://slidepdf.com/reader/full/bs-trading-1 128/265

8/13/2019 Bs Trading (1)
http://slidepdf.com/reader/full/bs-trading-1 129/265

8/13/2019 Bs Trading (1)
http://slidepdf.com/reader/full/bs-trading-1 130/265
8/13/2019 Bs Trading (1)
http://slidepdf.com/reader/full/bs-trading-1 131/265
.
8/13/2019 Bs Trading (1)
http://slidepdf.com/reader/full/bs-trading-1 132/265

8/13/2019 Bs Trading (1)
http://slidepdf.com/reader/full/bs-trading-1 133/265

8/13/2019 Bs Trading (1)
http://slidepdf.com/reader/full/bs-trading-1 134/265

8/13/2019 Bs Trading (1)
http://slidepdf.com/reader/full/bs-trading-1 135/265

8/13/2019 Bs Trading (1)
http://slidepdf.com/reader/full/bs-trading-1 136/265

8/13/2019 Bs Trading (1)
http://slidepdf.com/reader/full/bs-trading-1 137/265
8/13/2019 Bs Trading (1)
http://slidepdf.com/reader/full/bs-trading-1 138/265

8/13/2019 Bs Trading (1)
http://slidepdf.com/reader/full/bs-trading-1 139/265

8/13/2019 Bs Trading (1)
http://slidepdf.com/reader/full/bs-trading-1 140/265

8/13/2019 Bs Trading (1)
http://slidepdf.com/reader/full/bs-trading-1 141/265
I notice almost everyone drawing very wide levels. almost every chart I draw has levels marked on them . These are drawnaccording to Sam teachings. What we are looking for coming out of a level is the last candle crossing by the body of theprevious one.
We can see before that candle makes that move that price has bounced around as orders are processed. It may move up a bitthen down then up. We can't tell how long this movement will take just the fact it is happening. it is visible by certain candlesspinning tops and dojis. A pin shows a one sided move Price moved into this area and the orders were so great that there wasno exchange just a massive push away from this level .
So as you can see where I marked that demand I we are pretty confident there is s till some demand down there because of
that pin. Don't know of any system that doesn't like pins.
A fresh touch that is just short of a level and forms a pin lets us know that we can try a second entry from that level I just

8/13/2019 Bs Trading (1)
http://slidepdf.com/reader/full/bs-trading-1 142/265
A fresh touch that is just short of a level and forms a pin lets us know that we can try a second entry from that level. I justdon't feel like very many are really taking the time to look back and see this levels that have played out. It can show far betterthan I ever could. Plus placing the levels yourself you will trust that more.
I know Sam in the videos liked to say 2 to 5 candles , But I know there was at least one video he came of that a bit saying i t ishard to place a exact number as each chart would have different candle amounts for the same level.
I personal look for a common sense area that can be sorta defined within a a box / rectangle , that is showing that price is ofequilibrium. then a massive move out of the box is my signal to a level. It maybe only one candle but for those I normally haveother information to go on . Like a swap level .
The swap levels have less candles because they have normally been hit many times so there are fewer orders to be absorbedbefore the level fails
8/13/2019 Bs Trading (1)
http://slidepdf.com/reader/full/bs-trading-1 143/265

8/13/2019 Bs Trading (1)
http://slidepdf.com/reader/full/bs-trading-1 144/265

8/13/2019 Bs Trading (1)
http://slidepdf.com/reader/full/bs-trading-1 145/265
Sam does teach rdr and dbd. If I switched time frames on my charts I can make each swap level a rbd or dbr . He uses a 2 minas his primary entry chart trading intra-day. That is his all star entry time chart. If you watch his videos and capture hiscomputer screen and zoom in on it you will find that fast chart on every one.
I just stay on my 30 min. and watch the price action I can see in my minds eye what it would look like on a lot of different timeframes. Longer as well as faster.
It is a choice we each make I would love to just trade tops and bottoms , but to me I am. Just a dif ferent way.
A sideways , (ranging) market is full of tiny tops and bottoms . But very few will take those trades. Just like my entries off

8/13/2019 Bs Trading (1)
http://slidepdf.com/reader/full/bs-trading-1 146/265
y , ( g g) y p y yshallow pulbacks , When a strong trend takes off , because of a bit of unexpected news. That is the way I can personally see toenter that trade safely. When price breaks a top or bottom. the first breakout trade is at a swap level and sam goes overbreakouts a good deal.
I don't have the time right now to go through all 28 videos to find the proof. but it is in there. Guess I should go back throughthem and right a index of there contents. It was only on one of the very last did he ever mention about entries being missed bya few pips. Which was my biggest issue.
8/13/2019 Bs Trading (1)
http://slidepdf.com/reader/full/bs-trading-1 147/265

8/13/2019 Bs Trading (1)
http://slidepdf.com/reader/full/bs-trading-1 148/265

8/13/2019 Bs Trading (1)
http://slidepdf.com/reader/full/bs-trading-1 149/265

8/13/2019 Bs Trading (1)
http://slidepdf.com/reader/full/bs-trading-1 150/265
Here is a chart from Ken. There i s demand in the middle. So its not at a top or bottom. The zone marked in the middle is whatsome call RBR or rally base rally. DBD is drop base drop. With DBD or RBR those areas will not be marked at a top or bottom.Now these levels may form from a top or bottom which we call a swap level.
8/13/2019 Bs Trading (1)
http://slidepdf.com/reader/full/bs-trading-1 151/265

8/13/2019 Bs Trading (1)
http://slidepdf.com/reader/full/bs-trading-1 152/265

8/13/2019 Bs Trading (1)
http://slidepdf.com/reader/full/bs-trading-1 153/265
Ken what about the level I marked on your chart in yellow. To me this is a demand level I like. Good base. But I do have theother areas marked as you do.

8/13/2019 Bs Trading (1)
http://slidepdf.com/reader/full/bs-trading-1 154/265
8/13/2019 Bs Trading (1)
http://slidepdf.com/reader/full/bs-trading-1 155/265
8/13/2019 Bs Trading (1)
http://slidepdf.com/reader/full/bs-trading-1 156/265

8/13/2019 Bs Trading (1)
http://slidepdf.com/reader/full/bs-trading-1 157/265
trying a short form this extreme level. but not a good rejection plus the trend is up on longer charts even a downtrend chart isshowing a almost full retrace of the last swing , so not giving much more time.

8/13/2019 Bs Trading (1)
http://slidepdf.com/reader/full/bs-trading-1 158/265

8/13/2019 Bs Trading (1)
http://slidepdf.com/reader/full/bs-trading-1 159/265
Plus think of this, if your trading with the current trend , that is showing on your preferred trading chart, Even when your wrongthose levels you have chosen have to be broken for you to take a major loss.
Normally if your present and watching you will see your level slowly giving way as the orders you hoped to turn your trade inyour favor are slowly absorbed. So you will have time to exit with less pain.
Those are normally where swap levels are built , Which means a base will be built, Which normally takes a few candles or so.Even one 30 min candle should give you all the information you need to see the level failing.

8/13/2019 Bs Trading (1)
http://slidepdf.com/reader/full/bs-trading-1 160/265
The key to wining is to lose the least if you can learn to lose in a decent fashion you will survive . But if you go down in flamesover and over you may never make it. So learn to see when a trade is failing and get out.
Not aimed at anyone in particular just a thought. Cheers ken
Learn to REALLY SEE PRICE ACTION . Not some weird pattern forming but the action of orders being filled and what thatis going to do to your trade.
The reasons I would not take it are that :
1. I look for a clear single exit from a zone.2 According to Seiden wicky-ness basically means that price has already traded there once and hence it is not a fresh level

8/13/2019 Bs Trading (1)
http://slidepdf.com/reader/full/bs-trading-1 161/265
2. According to Seiden, wicky-ness basically means that price has already traded there once and hence it is not a fresh levelanymore. (Given that there is a zone right under it).3. The reason I would either go down to a lower time frame / ignore it / take the lower level is to reduce the risk. Also, like
Sam says, the deeper you buy in a level you are buying against dumb money that is selling after a steep drop in price.
Lastly, the reason I would ignore it is, the market already gives us plenty of opportunities, i'd rather take the low risk highprobability trade based on zones that I find comfortable with as opposed to a slightly higher risk trade, at the end of the d ay,our number one way to make money is to ensure we dont lose money.
8/13/2019 Bs Trading (1)
http://slidepdf.com/reader/full/bs-trading-1 162/265

8/13/2019 Bs Trading (1)
http://slidepdf.com/reader/full/bs-trading-1 163/265
8/13/2019 Bs Trading (1)
http://slidepdf.com/reader/full/bs-trading-1 164/265
8/13/2019 Bs Trading (1)
http://slidepdf.com/reader/full/bs-trading-1 165/265
8/13/2019 Bs Trading (1)
http://slidepdf.com/reader/full/bs-trading-1 166/265

8/13/2019 Bs Trading (1)
http://slidepdf.com/reader/full/bs-trading-1 167/265

8/13/2019 Bs Trading (1)
http://slidepdf.com/reader/full/bs-trading-1 168/265
8/13/2019 Bs Trading (1)
http://slidepdf.com/reader/full/bs-trading-1 169/265
8/13/2019 Bs Trading (1)
http://slidepdf.com/reader/full/bs-trading-1 170/265

8/13/2019 Bs Trading (1)
http://slidepdf.com/reader/full/bs-trading-1 171/265
8/13/2019 Bs Trading (1)
http://slidepdf.com/reader/full/bs-trading-1 172/265

8/13/2019 Bs Trading (1)
http://slidepdf.com/reader/full/bs-trading-1 173/265
8/13/2019 Bs Trading (1)
http://slidepdf.com/reader/full/bs-trading-1 174/265

8/13/2019 Bs Trading (1)
http://slidepdf.com/reader/full/bs-trading-1 175/265

8/13/2019 Bs Trading (1)
http://slidepdf.com/reader/full/bs-trading-1 176/265
8/13/2019 Bs Trading (1)
http://slidepdf.com/reader/full/bs-trading-1 177/265

8/13/2019 Bs Trading (1)
http://slidepdf.com/reader/full/bs-trading-1 178/265

8/13/2019 Bs Trading (1)
http://slidepdf.com/reader/full/bs-trading-1 179/265
8/13/2019 Bs Trading (1)
http://slidepdf.com/reader/full/bs-trading-1 180/265
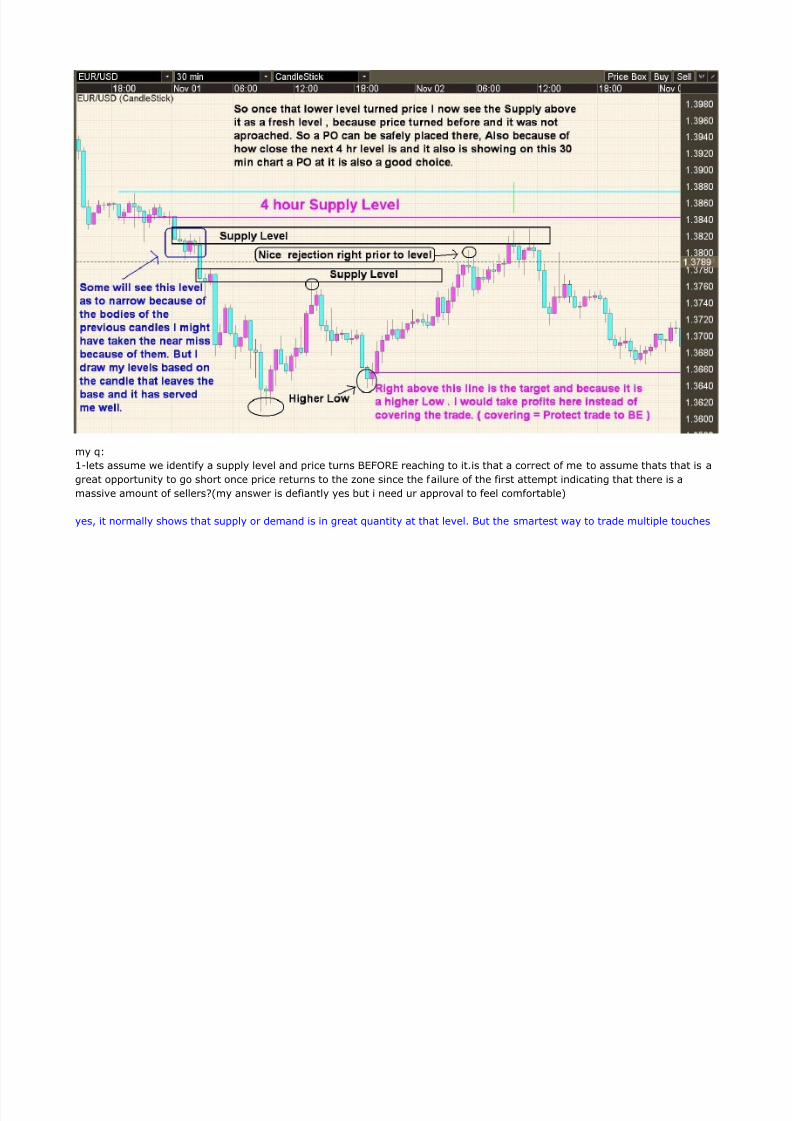
my q:1-lets assume we identify a supply level and price turns BEFORE reaching to it.is that a correct of me to assume thats that is agreat opportunity to go short once price returns to the zone since the failure of the first attempt indicating that there is amassive amount of sellers?(my answer is defiantly yes but i need ur approval to feel comfortable)
yes, it normally shows that supply or demand is in great quantity at that level. But the smartest way to trade multiple touches
is to wait for the turn then enter. even as far as to wait for it to exit the level going in your favor . So if it allows a short pocould be placed below a supply level after price has moved into that level. That is a confirmation entry because price action hasconfirmed the move. it normally is entered manually but it can be easier to do the right thing if you use a po with all theparameters in place, entry , stop and profit taking.

8/13/2019 Bs Trading (1)
http://slidepdf.com/reader/full/bs-trading-1 181/265
2-wicks in a zone-good or bad?what does it mean if we identify a supply zone and than price returns to it but forming upperwicks.are those wicks representing supply consumption or rejection?is there a way to tell?(in real time not after the fact ..lol...)
Each time a level is pierced it is adsorbing some of the orders within that level. At some point those orders will be completelyfilled and the level will collapse. This is OK as it is what is suppose to happen, So many times you see what people will call afailed level. but in reality it only did what is suppose too. Again the way to safely trade them is through confirmation entriesafter it turns.
This would also be a good time to look at other time frame charts. I posted a pin the other day, Then posted a 1 min chart thatshowed with int that pin entry was a perfect level on the 1 minute. The 1 min would allow the complete plan to be planned andall parameters to be in place before you take the trade.
That is key you have heard everywhere ," Plan The Trade , Trade The Plan "
3-again lets assume we are in supply zone.than price revist for the 1st time and than again for the 2nd time only this time priceis reaching deeper into the zone(but NOT breaking it) and forming a higher swing than the first visit BUT does provide somecandle pattern ??????? indicating rejectionreversal.can i still go short?now i know that u gonna say that its not freshanymore but my Q is about the fact that the 2nd visit went higher that 1st visit.if it didnt i would have a Lower High so i wouldfeel more comfortable with short but now price formed a HIgher HIgh in the zone and thats why im confused.
First we don't trade candle patterns. It is a after the fact function . it does show what happened at our level and can showrejection. but at that point it is to late for any good. So now we can look for a confirmation entry or again look at a faste r chartto join the trade.
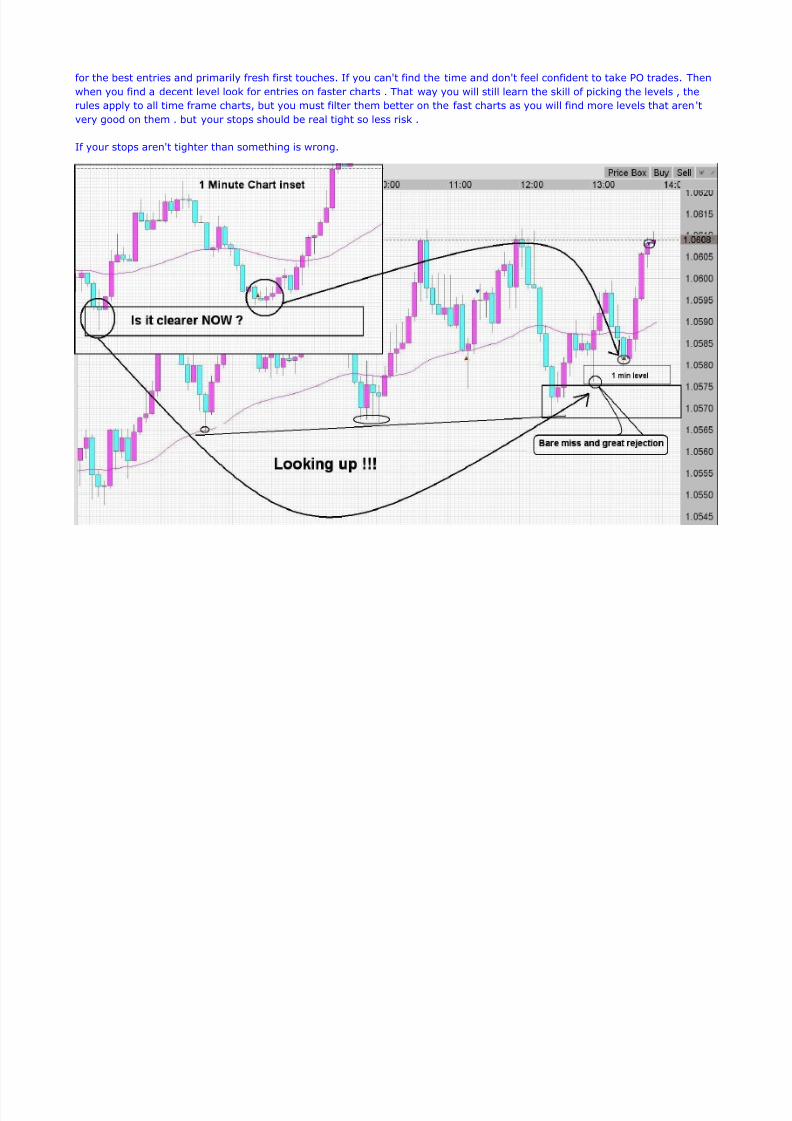
I feel from your questions that your looking for the wrong trades. they all involve second and third touches. We should all look
for the best entries and primarily fresh first touches. If you can't find the time and don't feel confident to take PO trades. Thenwhen you find a decent level look for entries on faster charts . That way you will still learn the skill of picking the levels , therules apply to all time frame charts, but you must filter them better on the fast charts as you will find more levels that aren 'tvery good on them . but your stops should be real tight so less risk .
8/13/2019 Bs Trading (1)
http://slidepdf.com/reader/full/bs-trading-1 182/265
If your stops aren't tighter than something is wrong.

8/13/2019 Bs Trading (1)
http://slidepdf.com/reader/full/bs-trading-1 183/265

8/13/2019 Bs Trading (1)
http://slidepdf.com/reader/full/bs-trading-1 184/265
8/13/2019 Bs Trading (1)
http://slidepdf.com/reader/full/bs-trading-1 185/265
8/13/2019 Bs Trading (1)
http://slidepdf.com/reader/full/bs-trading-1 186/265

8/13/2019 Bs Trading (1)
http://slidepdf.com/reader/full/bs-trading-1 187/265
Always look to the left of your levels if your lines align with a low or h igh to the left it is a second or third touch. and can makewhat look like a good level a risky one.
Also when you look for level look for the higher lows or lower highs as they are the best. even when looking at drop,base,dropor rise,base.rise, the entry will be a lower high or higher low.

8/13/2019 Bs Trading (1)
http://slidepdf.com/reader/full/bs-trading-1 188/265

8/13/2019 Bs Trading (1)
http://slidepdf.com/reader/full/bs-trading-1 189/265

8/13/2019 Bs Trading (1)
http://slidepdf.com/reader/full/bs-trading-1 190/265
8/13/2019 Bs Trading (1)
http://slidepdf.com/reader/full/bs-trading-1 191/265
8/13/2019 Bs Trading (1)
http://slidepdf.com/reader/full/bs-trading-1 192/265

8/13/2019 Bs Trading (1)
http://slidepdf.com/reader/full/bs-trading-1 193/265

8/13/2019 Bs Trading (1)
http://slidepdf.com/reader/full/bs-trading-1 194/265

8/13/2019 Bs Trading (1)
http://slidepdf.com/reader/full/bs-trading-1 195/265

8/13/2019 Bs Trading (1)
http://slidepdf.com/reader/full/bs-trading-1 196/265
8/13/2019 Bs Trading (1)
http://slidepdf.com/reader/full/bs-trading-1 197/265

8/13/2019 Bs Trading (1)
http://slidepdf.com/reader/full/bs-trading-1 198/265
Q: how would u trade stacked levels? for example u are short and u see stacked demand, would you target the lowest one orthe nearest one? or does PA tell you then?
A: If they are close enough you could adjust your trade size to incorporate both .Or the safest trade would to target the highestor lowest level. It also will not get hit all the time but should produce better winners,
The process that makes those better is the fact that at each level a bit of trading currencies takes place . To break through alevel takes some of the person or persons allotted funds to do so. So then at the next level they will have less to trade, So thatlevel may now hold and push price back.
Plus as a general rule these will be f resh levels , So additional players may have come in to strength that last level also

8/13/2019 Bs Trading (1)
http://slidepdf.com/reader/full/bs-trading-1 199/265
Plus as a general rule these will be f resh levels , So additional players may have come in to strength that last level alsobelieving it to be better. Plus look for the one with the best looking base.
In the above charts you can see that the higher supply level is a much more defined level. But you also may notice that pricemissed it by a few. If you scan your charts for these near misses they will show you the best levels. Because when price turn sright before a level it is a very strong one that big money doesn't want to miss.
8/13/2019 Bs Trading (1)
http://slidepdf.com/reader/full/bs-trading-1 200/265

8/13/2019 Bs Trading (1)
http://slidepdf.com/reader/full/bs-trading-1 201/265
8/13/2019 Bs Trading (1)
http://slidepdf.com/reader/full/bs-trading-1 202/265
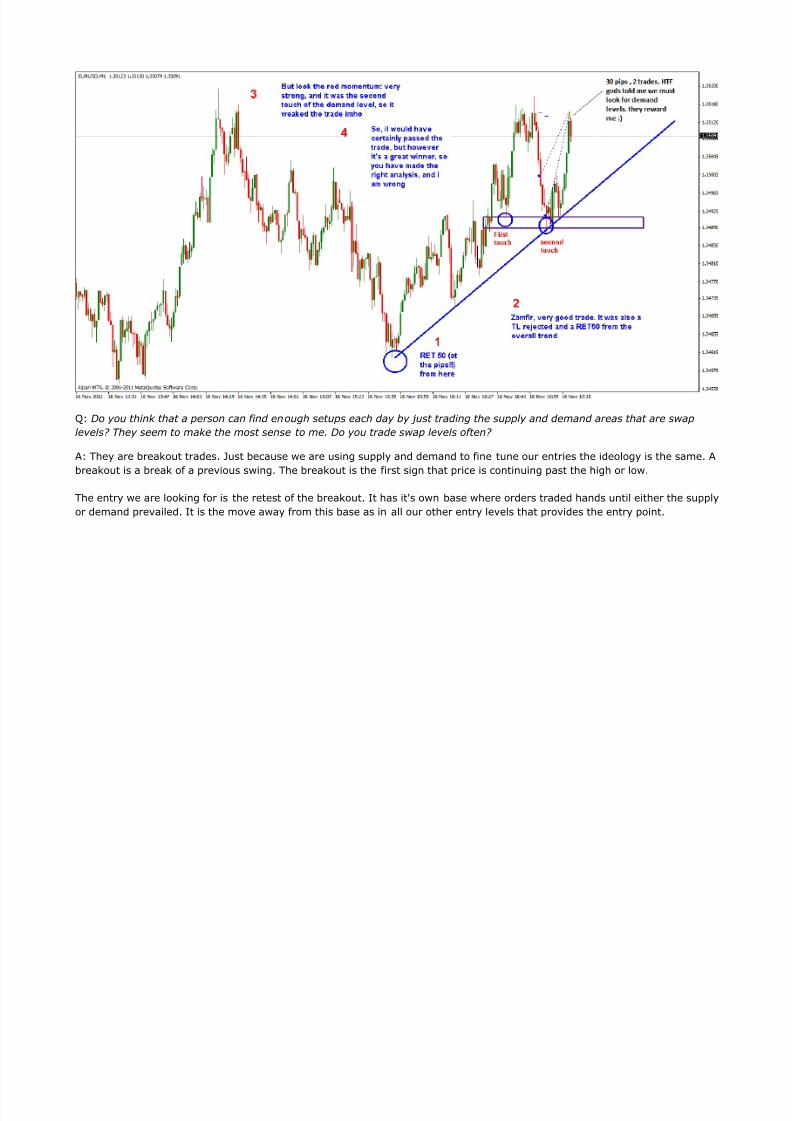
Q: Do you think that a person can find enough setups each day by just trading the supply and demand areas that are swaplevels? They seem to make the most sense to me. Do you trade swap levels often?
A: They are breakout trades. Just because we are using supply and demand to fine tune our entries the ideology is the same. Abreakout is a break of a previous swing. The breakout is the first sign that price is continuing past the high or low.
The entry we are looking for is the retest of the breakout. It has it's own base where orders traded hands until either the supplyor demand prevailed. It is the move away from this base as in all our other entry levels that provides the entry point.
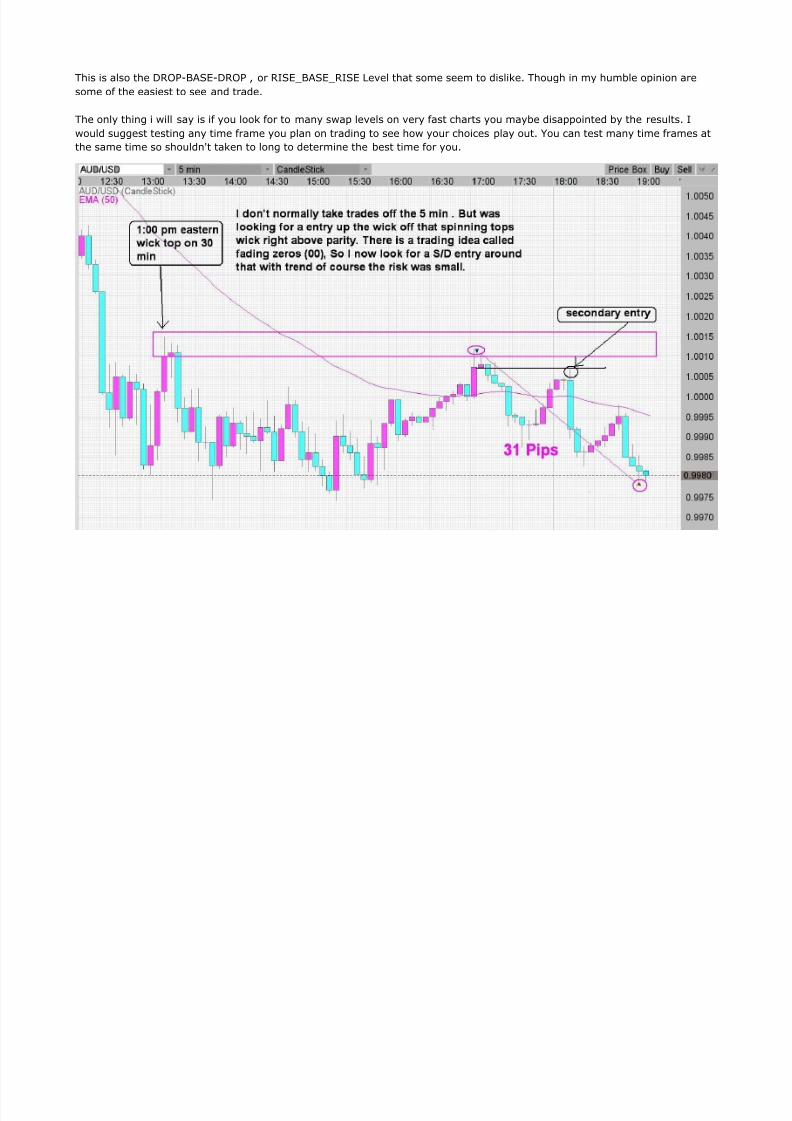
This is also the DROP-BASE-DROP , or RISE_BASE_RISE Level that some seem to dislike. Though in my humble opinion aresome of the easiest to see and trade.
The only thing i will say is if you look for to many swap levels on very fast charts you maybe disappointed by the results. Iwould suggest testing any time frame you plan on trading to see how your choices play out. You can test many time frames atthe same time so shouldn't taken to long to determine the best time for you.
8/13/2019 Bs Trading (1)
http://slidepdf.com/reader/full/bs-trading-1 203/265

8/13/2019 Bs Trading (1)
http://slidepdf.com/reader/full/bs-trading-1 204/265

8/13/2019 Bs Trading (1)
http://slidepdf.com/reader/full/bs-trading-1 205/265

8/13/2019 Bs Trading (1)
http://slidepdf.com/reader/full/bs-trading-1 206/265
ZAMFIR a simple intraday trading mechanism
Step 1: Identify market direction(I use simple trend lines, but you could use PA on HTF also, or any other method that worksfor you). This is key to making any system work!!.Step 2: Identify Supply or demand levels based on the direction of market and set POs.Step 3 : Profit!!!

8/13/2019 Bs Trading (1)
http://slidepdf.com/reader/full/bs-trading-1 207/265

8/13/2019 Bs Trading (1)
http://slidepdf.com/reader/full/bs-trading-1 208/265

8/13/2019 Bs Trading (1)
http://slidepdf.com/reader/full/bs-trading-1 209/265

8/13/2019 Bs Trading (1)
http://slidepdf.com/reader/full/bs-trading-1 210/265

8/13/2019 Bs Trading (1)
http://slidepdf.com/reader/full/bs-trading-1 211/265

8/13/2019 Bs Trading (1)
http://slidepdf.com/reader/full/bs-trading-1 212/265

8/13/2019 Bs Trading (1)
http://slidepdf.com/reader/full/bs-trading-1 213/265

8/13/2019 Bs Trading (1)
http://slidepdf.com/reader/full/bs-trading-1 214/265

8/13/2019 Bs Trading (1)
http://slidepdf.com/reader/full/bs-trading-1 215/265

8/13/2019 Bs Trading (1)
http://slidepdf.com/reader/full/bs-trading-1 216/265
8/13/2019 Bs Trading (1)
http://slidepdf.com/reader/full/bs-trading-1 217/265

8/13/2019 Bs Trading (1)
http://slidepdf.com/reader/full/bs-trading-1 218/265
Q: how would you define a base? How many candles form a base? Is it enough to have two candles to call it a base?
This is where chart time will come into play. I can see a base in as little as One candle as long as it is a 30 min chart, or longer.To me it is more a function of price action and where that action is.
Like a spinning top or doji, at a swap level. That breaks a ols level that is a Rise-base-rise or drop-base-drop. level. I may thenzoom into it on a faster chart to find the REAL exit point where price broke through.
I know in the first videos I watched Sam would say 2 to 5 candles. But he also used a 2 min chart for entries into levels hepicked off longer charts, So 5 2 min candles would only be one 10 min candle. The same can be said of four 30 min is a 2hrcandle.

8/13/2019 Bs Trading (1)
http://slidepdf.com/reader/full/bs-trading-1 219/265
You can apply that till you go nuts. I look for a exit point . it could be one candle , near a or that had turned form another level.then price lingered at it then the exit was clean when price FELL away. To me this is key. I don't like candles that are side byside for a long time as the point is not clear. and then I have trouble placing entry and stop lines.

8/13/2019 Bs Trading (1)
http://slidepdf.com/reader/full/bs-trading-1 220/265
8/13/2019 Bs Trading (1)
http://slidepdf.com/reader/full/bs-trading-1 221/265

8/13/2019 Bs Trading (1)
http://slidepdf.com/reader/full/bs-trading-1 222/265
8/13/2019 Bs Trading (1)
http://slidepdf.com/reader/full/bs-trading-1 223/265

8/13/2019 Bs Trading (1)
http://slidepdf.com/reader/full/bs-trading-1 224/265
8/13/2019 Bs Trading (1)
http://slidepdf.com/reader/full/bs-trading-1 225/265
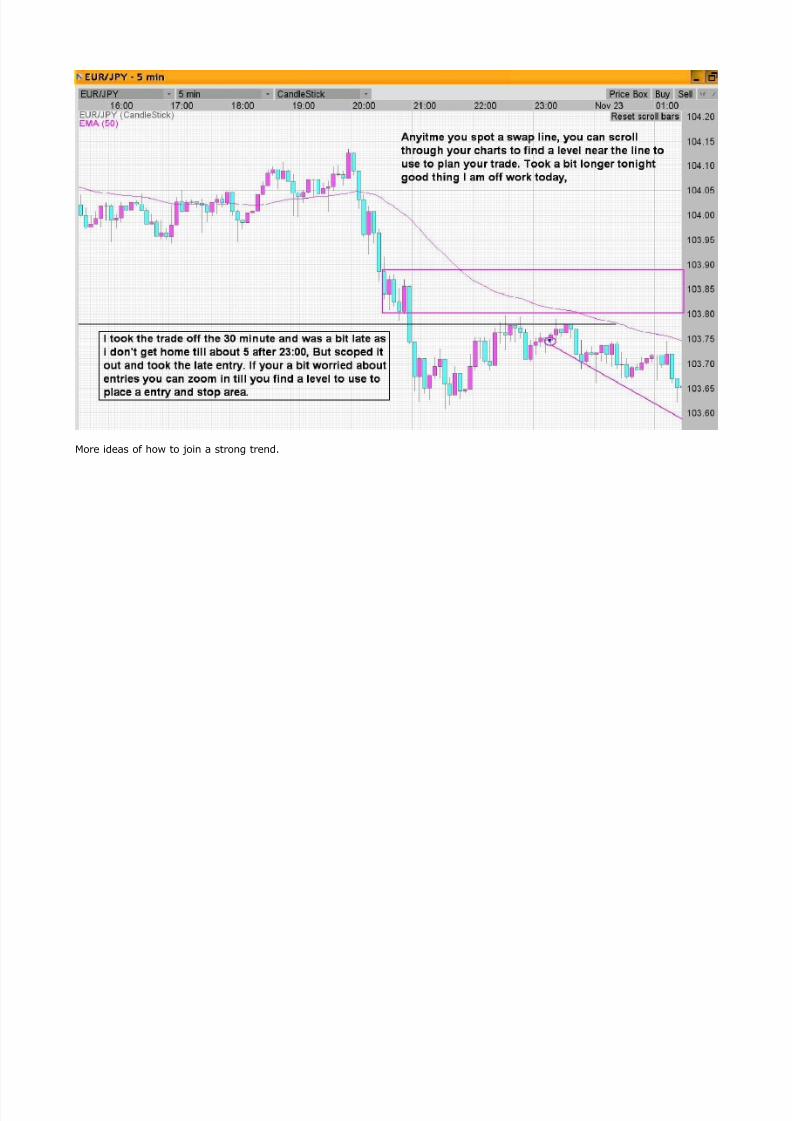
More ideas of how to join a strong trend.
8/13/2019 Bs Trading (1)
http://slidepdf.com/reader/full/bs-trading-1 226/265

8/13/2019 Bs Trading (1)
http://slidepdf.com/reader/full/bs-trading-1 227/265

8/13/2019 Bs Trading (1)
http://slidepdf.com/reader/full/bs-trading-1 228/265
Q: can somebody (K.Lee) elaborate more on how to consider the penetration of the level.50%- to wait could go deeper, or else,
I missing the trades waiting that it would go up/down higher/lower in the level and don’t have or understand the rule basedapproach
A: There are no rules I know of regarding penetration of the levels. The only thought I have is that maybe off a longer timeframe chart, A level found on a faster chart maybe better.

8/13/2019 Bs Trading (1)
http://slidepdf.com/reader/full/bs-trading-1 229/265
The other side to that is the person that because of locale needs more to just pay the rent and basic necessities. A person livingin north Louisiana verses say someone living in Key West, Florida. Which I know something about as I have lived in both andstill live in one.
I could live for ½ or less in Louisiana than Key West, So my need to make more and those risk more would be greatly reduced.In my years of trading I have found that in the overall scheme of trading that when you actually trade a bit more conservativelyyou tend to do better as the choices that need to be made are less difficult to make when your not betting the house. But on
8/13/2019 Bs Trading (1)
http://slidepdf.com/reader/full/bs-trading-1 230/265
the other hand and also what I have personally found that if we don't risk enough we also can find ourselves with a cavalierattitude and let it do what it will, Which in the long term builds bad habits and destroys confidence.
We all will have to find our own level of risk to trade properly and that will allow use the gains we feel are within our goals. Thatwe can mange correctly to build long term solid and responsible managing ethics. One issue at hand is the inability of most t oeven try and manage trading at all. But keep this in mind to become a professional in anything requires record keeping. We canbecome the best traders in the world but if we can't operate within the world's guidelines it will not be long before thegovernment shuts you down for tax issues or other trouble and we find ourselves in worse shape than if we never tried totrade. Any gains will require a donation to our country of choice. But if we don't manage trading as a bussiness we can findourselves at the end of a year oweing more than we have available.
I am not going to cover any of those issues but just trying to drive home the fact. That if you think there is no managementrequired you will find yourself in deep trouble. You can make a million one year spend a truck load then have a massive lossfirst of year and find yourself completely upside down. I would advise that every withdrawal be accompanied with a amount forthe tax man either actually paid as you go or kept in a account with limited access for that purpose.
So we now know that each persons view and actual needs will be a factor in how they perceive and will manage their accounts.So it is hard to set a fast and solid set of rules regarding managing ones money. The difference between a investor and aspeculator also comes into play. A investor looking for modest but steady growth to either maintain or gradually grow a accountwill have differing views than a person looking to become dependent on his trading gains as their only source of income. So I
would suggest that we acknowledge this and not be so fast to judge a persons reasons for their personal choices in riskappetite.
I will just try and give a overall idea or base , from my own experiences. But ultimately the choices are our own because we arethe ones that will have to live with them.
Money Management
This is how we manage our complete account not a single trade . It should have a plan for protecting our equity as well as aplan for when to be able to withdraw. The amount a person decides to start with is more based on availability than a setamount though some brokers have a min set opening balance.I think most are trying to trade with a small beginning balance.

8/13/2019 Bs Trading (1)
http://slidepdf.com/reader/full/bs-trading-1 231/265
You hear a lot from some that trying to even attempt trading without a good size account is unrealistic. I am not of that view Ithink we have a opportunity even from modest beginnings.Before you trade have a idea of what your initial goals are yes we all want to be the next spectacular trader rolling in dough,but if we are starting with modest beginnings I think that will take some time to achieve. Many may start trading mini lotsunder a dollar a pip. So maybe your goal is to get to 2 dollars a pip. Or to a full lot ,10.00 a pip. But on that journey trying andsiphon some money away on good runs to allow yourself to keep going if (when) you have a bad spell. I like using Oanda andthink they are good for beginning traders. There maybe more out there but they are very versatile in the size of lots and easyto manage your account. I personally use a sub-account to park funds from my regular account as a kind of holding area. Justin case of a major melt down.
Try and remove your initial investment as soon as possible maybe removing ½ your gains on good weeks. This way you canalways continue. It is also important to remember to increase your trade size as you go along I do this weekly, but If yourprogressing rapidly you may want to do this even daily. Another feature of Oanda is the ability to set a percentage to trade onevery order this way it automatically increases taking that out of your hands and mind. The less to think about the better. Butalso it will reduce your trades as well a point many don't want to do. They feel they can't make it back quick enough. But if theydon't do this they will find themselves over risking and in a bad spot emotionally. But you need to set rules for this.
When to increase When to decrease, I like a 1 to .5, I increase say at a 100 move if i t moves back 50% I decrease back. This way I am notwaiting to long and digging a deeper hole.
When to withdraw any funds , The first just protect my investment and allow myself to trade another day.When do we need to start collecting taxes, if you start making a monthly withdraw you need to start saving for this I set asi de20% for this purpose. If I make a large withdrawal I will send a check to the IRS as a prepayment. If you should trade badlyand not need it you will get it back as a refund. But you never want to be on the wrong side of the tax man.There are am sure other items some will want to consider but many are personal. One is that you can start a tax f ree accountlike a 401k and use it to trade and only pay taxes on your withdrawals. Because remember you will owe taxes on the equity in
your account as well if it isn't tax differed.
Anyway this is money management and is what you need to due to run a successful trading career in trading. It isn't a lot butneeds to be done. Trading brokerage houses have departments to keep their traders in line. We have to do this for ourselves.Taking losses is part of trading even large losses but if you go into it prepared you can survive and trade again. If you take tocavalier a attitude towards it you may find yourself never reaching any point of success.

8/13/2019 Bs Trading (1)
http://slidepdf.com/reader/full/bs-trading-1 232/265
Next Risk Management.
8/13/2019 Bs Trading (1)
http://slidepdf.com/reader/full/bs-trading-1 233/265

8/13/2019 Bs Trading (1)
http://slidepdf.com/reader/full/bs-trading-1 234/265
8/13/2019 Bs Trading (1)
http://slidepdf.com/reader/full/bs-trading-1 235/265

8/13/2019 Bs Trading (1)
http://slidepdf.com/reader/full/bs-trading-1 236/265

8/13/2019 Bs Trading (1)
http://slidepdf.com/reader/full/bs-trading-1 237/265

8/13/2019 Bs Trading (1)
http://slidepdf.com/reader/full/bs-trading-1 238/265
A confirmation order is normally used on long time frame charts where a big level maybe at . we may not want to place a tradewith a 50 or 100 pip stop so we could wait for the price to turn back and even exit the level in our intended direction those
confirming the move. We can use a faster chart for this as well which can have levels set up for the reversal already in place.
A strong arrival is best because this will give you a clear Target to aim at. If you don't have a clear demand level from whe reprice has left we then don't know our risk reward possibility. If we are trading against the trend we may want to look on afaster chart for these targets. We can have targets off 4 hr or daily charts as well , That do play out but most of the intraday
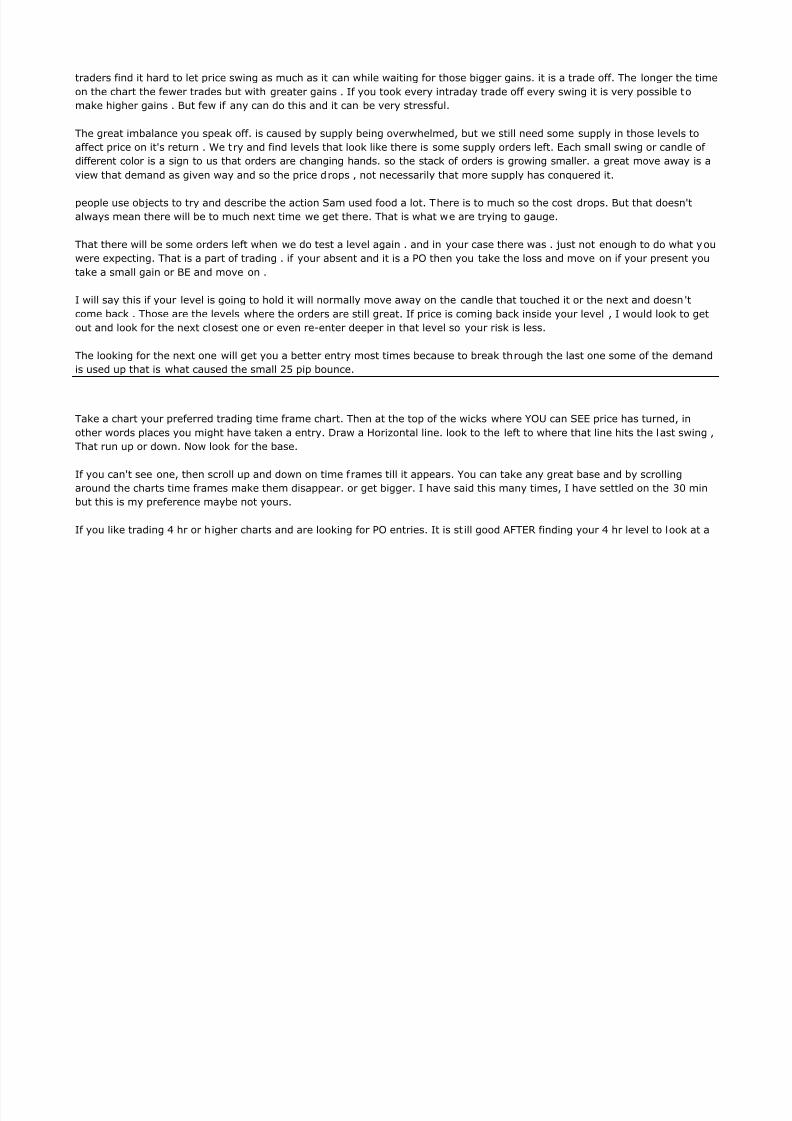
traders find it hard to let price swing as much as it can while waiting for those bigger gains. it is a trade off. The longer the timeon the chart the fewer trades but with greater gains . If you took every intraday trade off every swing it is very possible tomake higher gains . But few if any can do this and it can be very stressful.
The great imbalance you speak off. is caused by supply being overwhelmed, but we still need some supply in those levels toaffect price on it's return . We t ry and find levels that look like there is some supply orders left. Each small swing or candle ofdifferent color is a sign to us that orders are changing hands. so the stack of orders is growing smaller. a great move away is a
i h d d i d h i d il h l h d i
8/13/2019 Bs Trading (1)
http://slidepdf.com/reader/full/bs-trading-1 239/265
view that demand as given way and so the price drops , not necessarily that more supply has conquered it.
people use objects to try and describe the action Sam used food a lot. There is to much so the cost drops. But that doesn'talways mean there will be to much next time we get there. That is what we are trying to gauge.
That there will be some orders left when we do test a level again . and in your case there was . just not enough to do what youwere expecting. That is a part of trading . if your absent and it is a PO then you take the loss and move on if your present youtake a small gain or BE and move on .
I will say this if your level is going to hold it will normally move away on the candle that touched it or the next and doesn 't
come back . Those are the levels where the orders are still great. If price is coming back inside your level , I would look to getout and look for the next closest one or even re-enter deeper in that level so your risk is less.
The looking for the next one will get you a better entry most times because to break through the last one some of the demandis used up that is what caused the small 25 pip bounce.
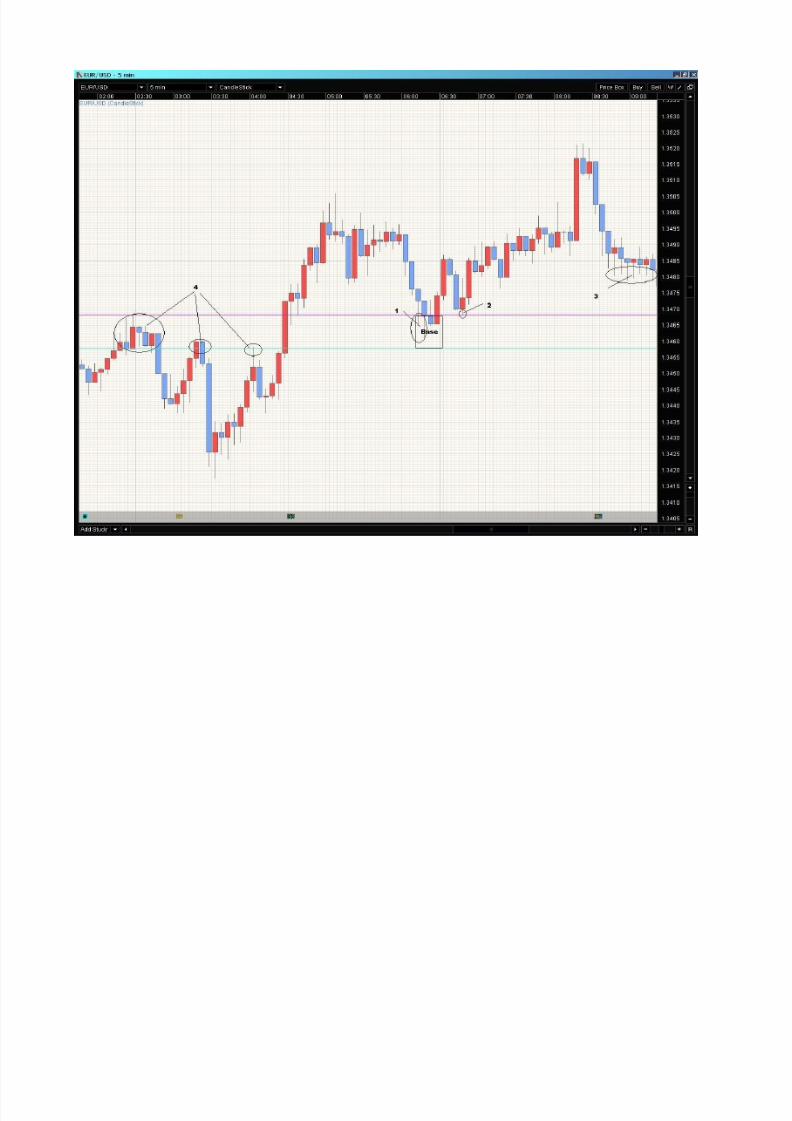
Take a chart your preferred trading time frame chart. Then at the top of the wicks where YOU can SEE price has turned, inother words places you might have taken a entry. Draw a Horizontal line. look to the left to where that line hits the last swing ,That run up or down. Now look for the base.
If you can't see one, then scroll up and down on time f rames till it appears. You can take any great base and by scrollingaround the charts time frames make them disappear. or get bigger. I have said this many times, I have settled on the 30 minbut this is my preference maybe not yours.
If you like trading 4 hr or h igher charts and are looking for PO entries. It is st ill good AFTER finding your 4 hr level to look at a
faster chart when price is nearing your levels for a entry with a smaller stop thus making your risk lower . But always makesure your stop is still in the correct location based on your 4 hr chart or you may find yourself stopped on the faster but thelong term held and then turned, a sad fate indeed.
Hope this helps . I am the one that said tight candles and dojis. But they are f rom different time frames . If I see a doji orspinning top . am looking at what that means as price action not any kind of trading signal. it is showing for that given timeperiod weather it be a 2 hr or 4 hr candle. price was near equilibrium. That is why we have a wick in both directions and a small
l t b d

8/13/2019 Bs Trading (1)
http://slidepdf.com/reader/full/bs-trading-1 240/265
or almost no body.
If I see those on a chart near a place where a level broke (A Swap Level) I will zoom into a faster chart to find the exact pointwhere price became unbalanced and broke the level. hence the name breakout.
Any of this should not be hard, if it is your trying way to hard . Just place some lines at your best guess and see how they work. if they are way off , Look at maybe a different time frame , if they are close exam what you thought you saw and see if the remaybe a small option to make a change .
Sometimes just a widening of the level or moving towards the breakout. or sometimes price will turn near the extremes of the
bases candles, the wicks end.
But the key remains the same . You have to learn to trust what you are doing not anyone else.

8/13/2019 Bs Trading (1)
http://slidepdf.com/reader/full/bs-trading-1 241/265

8/13/2019 Bs Trading (1)
http://slidepdf.com/reader/full/bs-trading-1 242/265

8/13/2019 Bs Trading (1)
http://slidepdf.com/reader/full/bs-trading-1 243/265
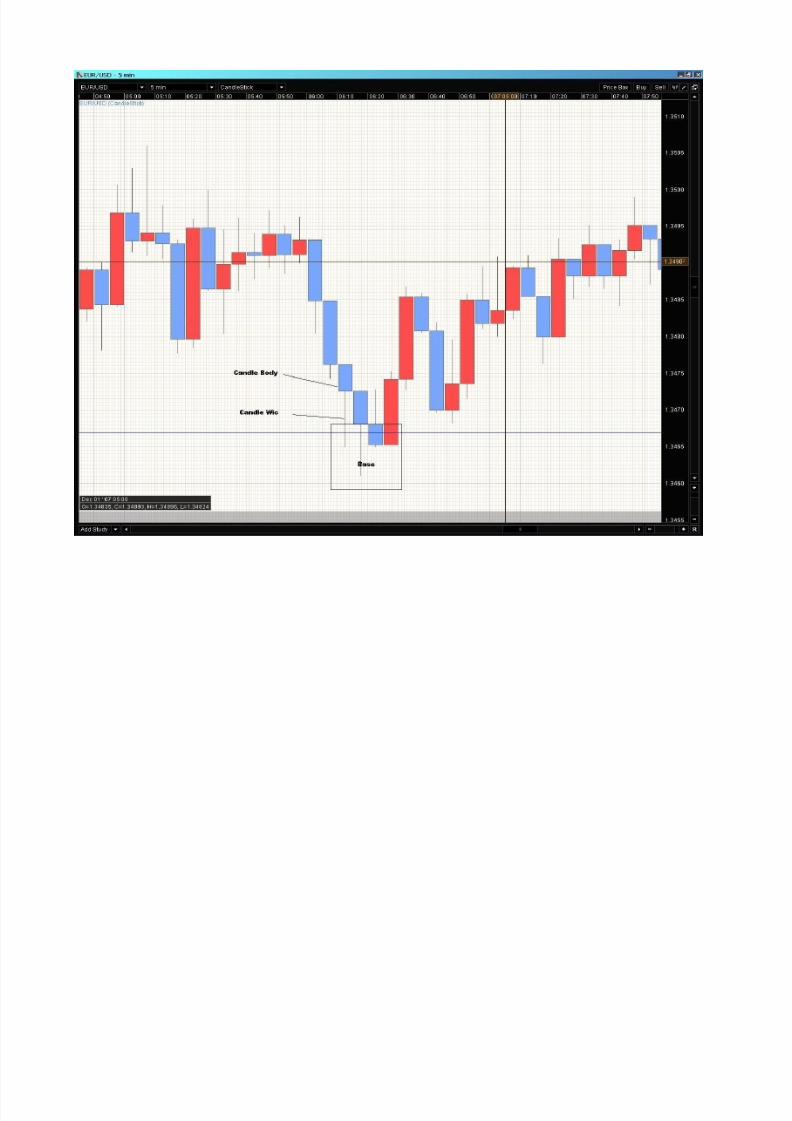
I'll show you why i've chosen this as a base. This is what the chart looked like when i put in the PO.
8/13/2019 Bs Trading (1)
http://slidepdf.com/reader/full/bs-trading-1 244/265
1. Candle wicks are just as much of a movement of price as the body is so when looking at a base i always take them intoaccount. Wick or body, someone’s order has been filled. It's just much better to use bodies because it keeps your profittargets in reach and thats partly why i used that brown body as my level top.
2. Price moved to 1.34682 and then shot up. 1.34682 was the origin of the move and since orders were filled at thatlevel, when price returns it will most likely go deeper. Thats why i've choosen that as the top of the demand level. As isaid earlier i like to keep my levels around 10 pips or more so my stop was 10 pips.

8/13/2019 Bs Trading (1)
http://slidepdf.com/reader/full/bs-trading-1 245/265
3. Lots of buying and selling here. Liquidity is drying up so if and when price leaves that level and heads towards mylevel not only will it most likely not be a strong move but when it returns to that area there most li kely won't be enoughthere to stop it.
4. I saw this while writing this so this is just a bonus. The big circle to the left is the supply that created the drop on the2 little circles. If you follow that level to the right you see how it falls onto my level after price pushed through it tocreate a swap.
I only considered 1 2 and 3 before i set the trade. I only saw 4 as i was writing this.
Edit: Also forgot to mention Higher lows and Higher Highs gave me an upside bias.

8/13/2019 Bs Trading (1)
http://slidepdf.com/reader/full/bs-trading-1 246/265

8/13/2019 Bs Trading (1)
http://slidepdf.com/reader/full/bs-trading-1 247/265
8/13/2019 Bs Trading (1)
http://slidepdf.com/reader/full/bs-trading-1 248/265

8/13/2019 Bs Trading (1)
http://slidepdf.com/reader/full/bs-trading-1 249/265

8/13/2019 Bs Trading (1)
http://slidepdf.com/reader/full/bs-trading-1 250/265
8/13/2019 Bs Trading (1)
http://slidepdf.com/reader/full/bs-trading-1 251/265

8/13/2019 Bs Trading (1)
http://slidepdf.com/reader/full/bs-trading-1 252/265

8/13/2019 Bs Trading (1)
http://slidepdf.com/reader/full/bs-trading-1 253/265

8/13/2019 Bs Trading (1)
http://slidepdf.com/reader/full/bs-trading-1 254/265

8/13/2019 Bs Trading (1)
http://slidepdf.com/reader/full/bs-trading-1 255/265

8/13/2019 Bs Trading (1)
http://slidepdf.com/reader/full/bs-trading-1 256/265
8/13/2019 Bs Trading (1)
http://slidepdf.com/reader/full/bs-trading-1 257/265

8/13/2019 Bs Trading (1)
http://slidepdf.com/reader/full/bs-trading-1 258/265
8/13/2019 Bs Trading (1)
http://slidepdf.com/reader/full/bs-trading-1 259/265

8/13/2019 Bs Trading (1)
http://slidepdf.com/reader/full/bs-trading-1 260/265

8/13/2019 Bs Trading (1)
http://slidepdf.com/reader/full/bs-trading-1 261/265

8/13/2019 Bs Trading (1)
http://slidepdf.com/reader/full/bs-trading-1 262/265
8/13/2019 Bs Trading (1)
http://slidepdf.com/reader/full/bs-trading-1 263/265

8/13/2019 Bs Trading (1)
http://slidepdf.com/reader/full/bs-trading-1 264/265

8/13/2019 Bs Trading (1)
http://slidepdf.com/reader/full/bs-trading-1 265/265