Embed Size (px)
Citation preview
nycfuture.org JUNE 2019
How Tech Start-Ups, Creative Companies, and Makers Are Powering Brooklyn’s Economic Future
BROOKLYN’S GROWING INNOVATION ECONOMY
BROOKLYN’S GROWING INNOVATION ECONOMY is a publication of the Center for an Urban Future. Researched, written, and edited by Jonathan Bowles, Eli Dvorkin, Naomi Sharp, and Charles Shaviro. Additional research by Owen Patterson. Designed by Rachel Wolfe.
This study was made possible by the Brooklyn Navy Yard Development Corporation, Downtown Brooklyn Partnership, Dumbo Improvement District, and Industry City.
Center for an Urban Future (CUF) is a leading New York City–based think tank that generates smart and sustainable public policies to reduce inequality, increase economic mobility, and grow the economy.
General operating support for the Center for an Urban Future has been provided by the Clark Foundation, the Bernard F. and Alva B. Gimbel Foundation, and the Altman Foundation. CUF is also grateful for support from Fisher Brothers Foundation for the Middle Class Jobs Project.
Executive Director: Jonathan BowlesManaging Editor: Eli DvorkinAssociate Editor: Laird GallagherSenior Researcher: Christian González-RiveraResearcher: Naomi SharpJunior Research Fellow: Charles ShaviroCommunications and Policy Associate: Rachel WolfeEvents and Operations Associate: Stephanie Arevalo
Board of Directors: Gifford Miller (Chairman), Michael Connor (Vice Chair), Max Neukirchen (Treasurer), John H. Alschuler, Margaret Anadu, Jonathan Bowles, Russell Dubner, Lisa Gomez, Jalak Jobanputra, Kyle Kimball, David Lebenstein, Eric S. Lee, Monisha Nariani, Andrew Reicher, John Siegal, Stephen Sigmund, Thomas Vecchione, Robert Zimmerman
Cover courtsey of New Lab, photo by Rich Gilligan.
CONTENTS
INTRODUCTION 1
TECH START-UPS 5
CREATIVE COMPANIES 9
INNOVATIVE MANUFACTURERS 13
APPENDIX: BROOKLYN’S INNOVATION ECONOMY 14 BY THE NUMBERS
ENDNOTES 19
INDUSTRY CITY
Data provided by
1
Brooklyn’s Growing Innovation EconomyCenter for an Urban Future
BROOKLYN’S GROWING INNOVATION ECONOMYLike many other urban centers over the past decade, Brooklyn has seen strong job growth in healthcare, retail, restaurants, and education. But Brooklyn’s economy has kicked into higher gear than most other places thanks to the borough’s runaway success in the innovation economy.
As this data brief details, Brooklyn is one of just a handful of regions across the country to capture a significant share of the growth occurring in the innovation economy—a set of indus-tries fueled by technology, creativity, and invention that is driving much of the nation’s high-wage job gains. Over the past decade, Brooklyn has outperformed the rest of New York City in these innovation industries, which have added thousands of well-paying jobs for New Yorkers, helped diversify the borough’s economy, and given Brooklyn an important competitive advan-tage in a part of the economy that is expected to grow significantly in the years ahead.
This analysis by the Center for an Urban Future (CUF) finds that Brooklyn has benefited from sustained growth in all three core areas of the innovation economy: tech start-ups,1 creative companies, and next-generation makers and manufacturers.
Tech Start-Ups
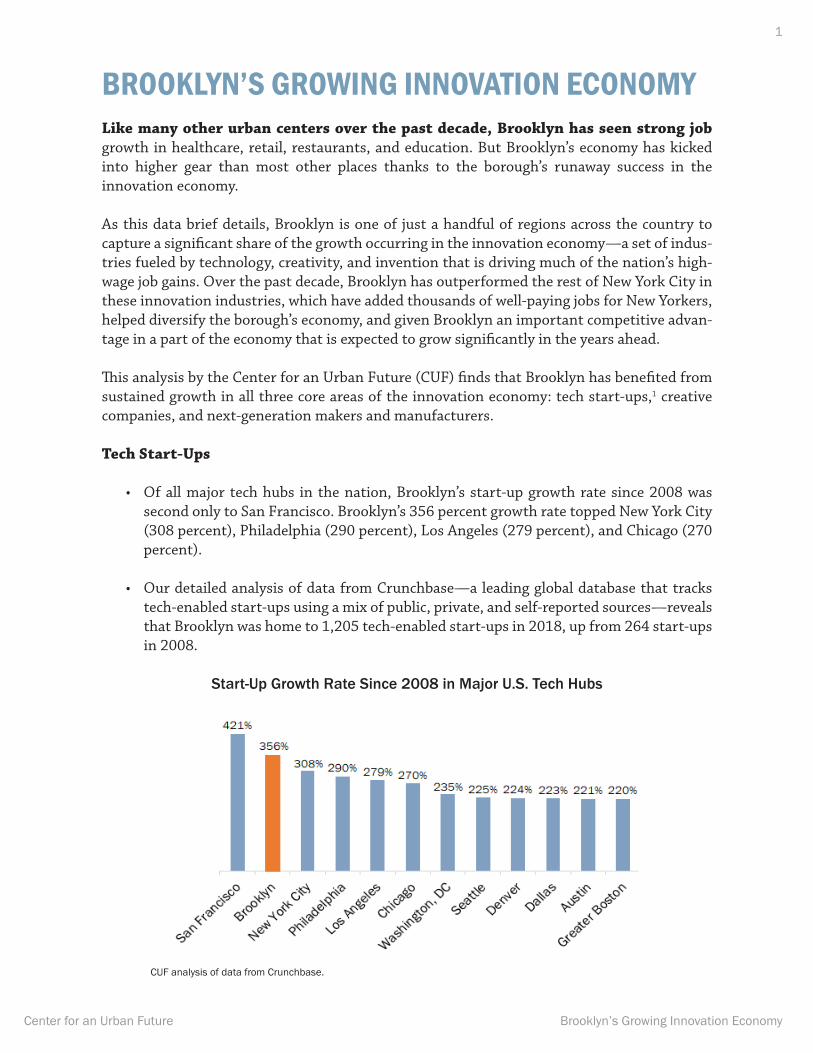
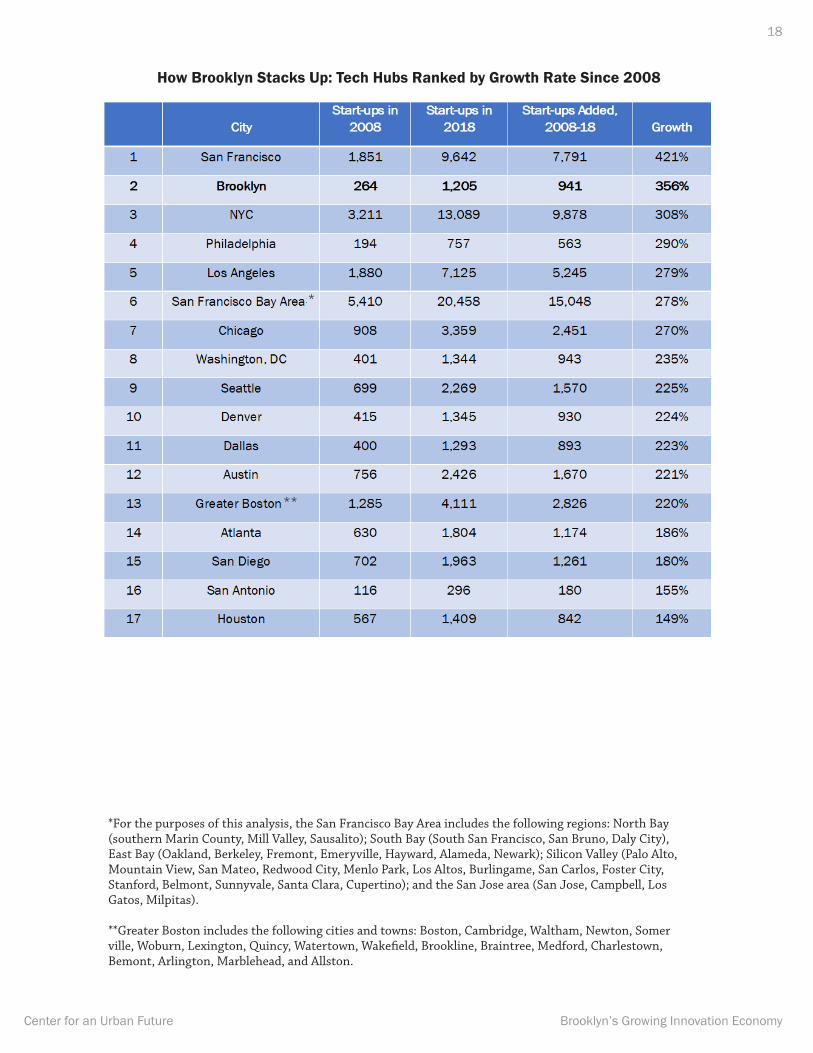
• Of all major tech hubs in the nation, Brooklyn’s start-up growth rate since 2008 was second only to San Francisco. Brooklyn’s 356 percent growth rate topped New York City (308 percent), Philadelphia (290 percent), Los Angeles (279 percent), and Chicago (270 percent).
• Our detailed analysis of data from Crunchbase—a leading global database that tracks tech-enabled start-ups using a mix of public, private, and self-reported sources—reveals that Brooklyn was home to 1,205 tech-enabled start-ups in 2018, up from 264 start-ups in 2008.
Start-Up Growth Rate Since 2008 in Major U.S. Tech Hubs
CUF analysis of data from Crunchbase.
2
Brooklyn’s Growing Innovation EconomyCenter for an Urban Future
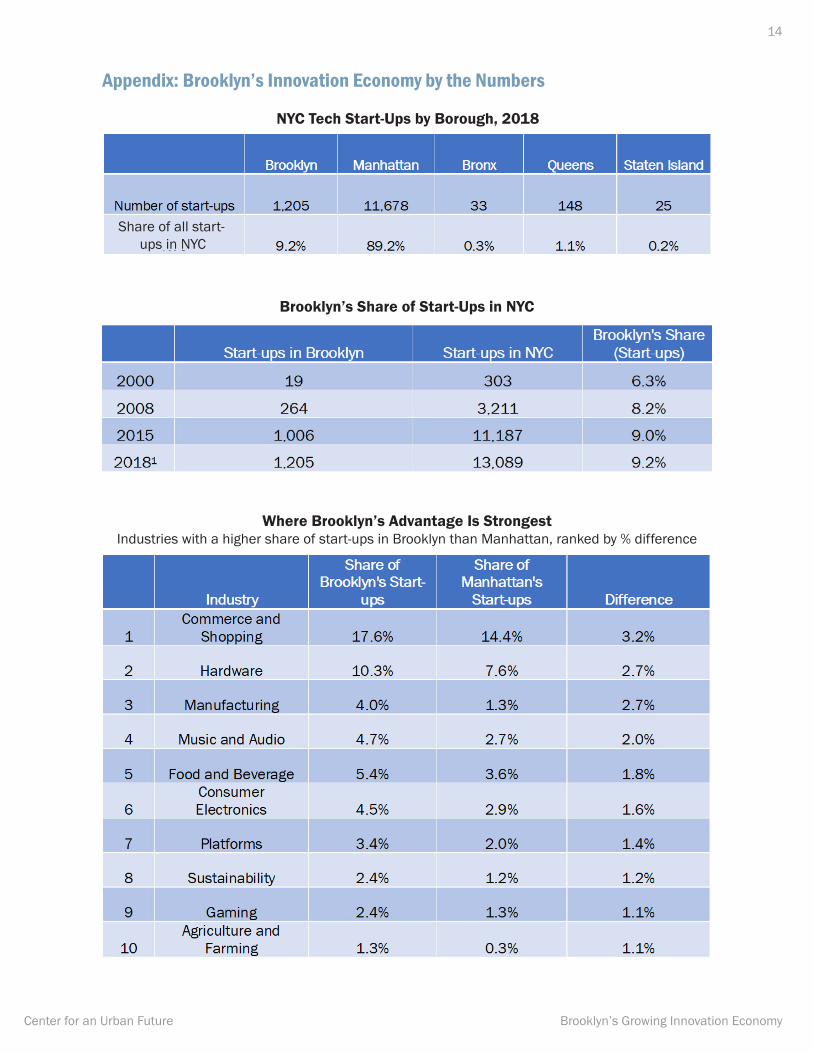
• Brooklyn now has 9.2 percent of New York City’s tech start-ups, up from 6.3 percent in 2000 and a higher share than ever before.
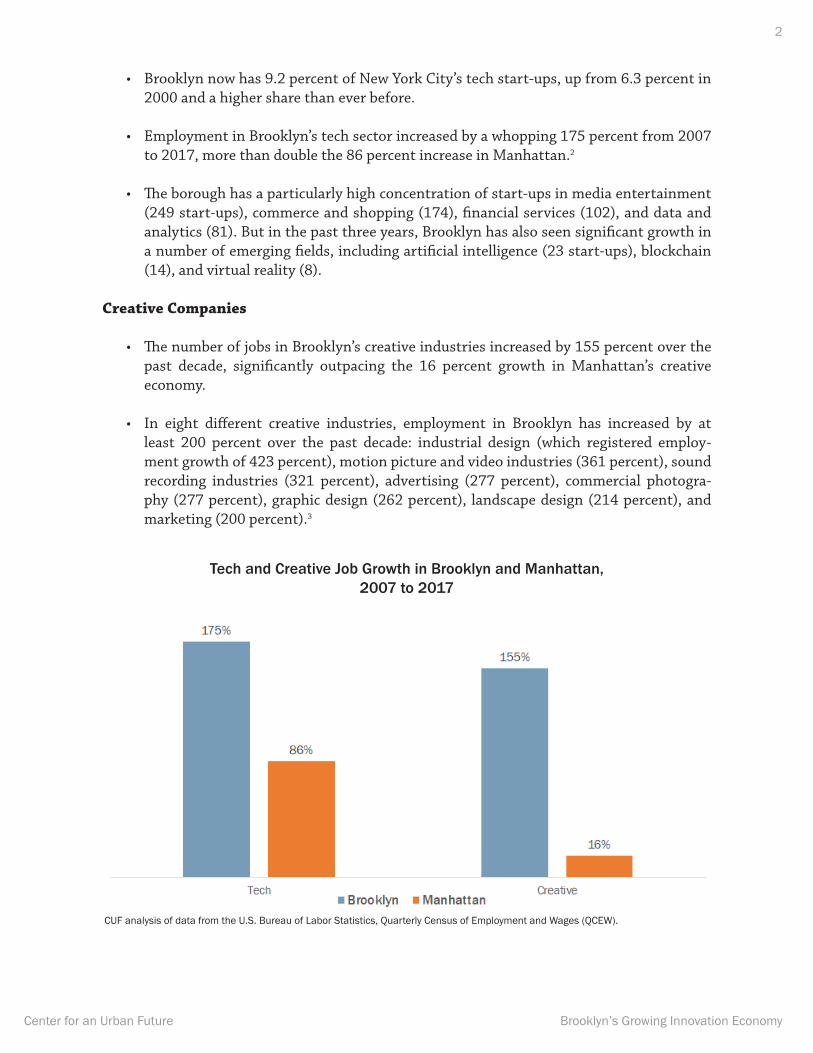
• Employment in Brooklyn’s tech sector increased by a whopping 175 percent from 2007 to 2017, more than double the 86 percent increase in Manhattan.2
• The borough has a particularly high concentration of start-ups in media entertainment (249 start-ups), commerce and shopping (174), financial services (102), and data and analytics (81). But in the past three years, Brooklyn has also seen significant growth in a number of emerging fields, including artificial intelligence (23 start-ups), blockchain (14), and virtual reality (8).
Creative Companies
• The number of jobs in Brooklyn’s creative industries increased by 155 percent over the past decade, significantly outpacing the 16 percent growth in Manhattan’s creative economy.
• In eight different creative industries, employment in Brooklyn has increased by at least 200 percent over the past decade: industrial design (which registered employ-ment growth of 423 percent), motion picture and video industries (361 percent), sound recording industries (321 percent), advertising (277 percent), commercial photogra-phy (277 percent), graphic design (262 percent), landscape design (214 percent), and marketing (200 percent).3
CUF analysis of data from the U.S. Bureau of Labor Statistics, Quarterly Census of Employment and Wages (QCEW).
Tech and Creative Job Growth in Brooklyn and Manhattan, 2007 to 2017
3
Brooklyn’s Growing Innovation EconomyCenter for an Urban Future
• In many creative industries, Brooklyn is home to a significant share of all new jobs cre-ated nationally in recent years. Brooklyn accounted for 5 percent of all fashion and jew-elry design jobs created in the United States between 2007 and 2017. The borough is home to a significant share of all new jobs created nationally in several other creative industries, including film and television (4 percent of all new U.S. jobs), advertising (3 percent), and industrial design (2 percent). And while graphic design jobs declined by 14 percent nationally during the past decade, employment increased by a remarkable 262 percent in Brooklyn.4
Innovative Manufacturers
• Like the rest of the city, Brooklyn has suffered job losses in many traditional manu-facturing subsectors. But the borough has experienced net job gains in several manu-facturing subsectors connected to tech or design, including electrical equipment and appliances manufacturing (which had a net increase of 347 jobs since 2011), jewelry and silverware manufacturing (+218 jobs), ornamental and architectural metal products manufacturing (+110 jobs), furniture and related products manufacturing (+82 jobs), medical equipment and supplies manufacturing (+81 jobs), and machinery manufactur-ing (+21 jobs).5
• There are other clear signs that Brooklyn is seeing growth among makers that fuse tra-ditional manufacturing processes with tech and design. For instance, of the 1,205 tech- enabled start-ups in Brooklyn that we identified through our analysis of the Crunchbase database, 39 were in manufacturing (up from 23 in 2013). Other tech-enabled start-ups in Brooklyn are sprouting in fields with strong connections to manufacturing, including hardware (Brooklyn now has 102 hardware start-ups), food and beverage (53 start-ups), consumer electronics (44), consumer goods (41), clothing and apparel (30 start-ups), and government and military (11). Overall, our analysis of Brooklyn’s tech sector finds a growing advantage over Manhattan in several fields with a connection to manufacturing and the creative industries, including computer hardware, consumer electronics, music and audio, and gaming.
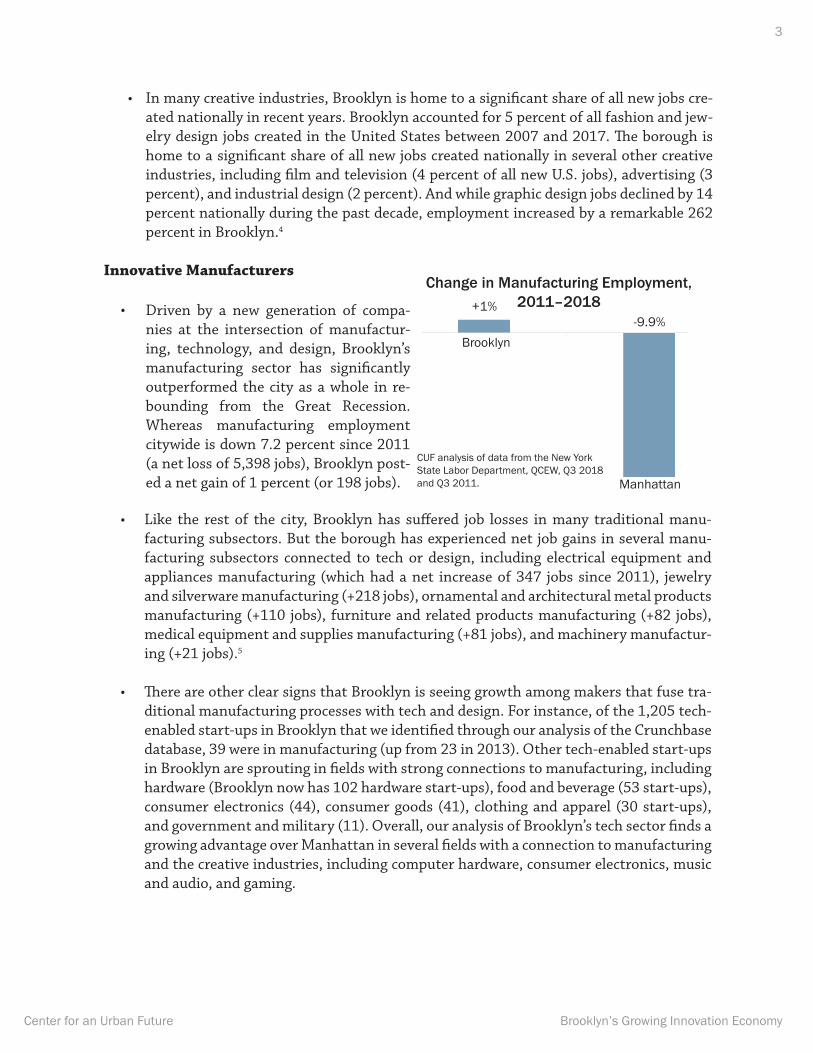
CUF analysis of data from the New York State Labor Department, QCEW, Q3 2018 and Q3 2011.
Change in Manufacturing Employment, 2011–2018
Manhattan
Brooklyn-9.9%
+1%Driven by a new generation of compa-nies at the intersection of manufactur-ing, technology, and design, Brooklyn’s manufacturing sector has significantly outperformed the city as a whole in re-bounding from the Great Recession. Whereas manufacturing employment citywide is down 7.2 percent since 2011 (a net loss of 5,398 jobs), Brooklyn post-ed a net gain of 1 percent (or 198 jobs).
•
4
Brooklyn’s Growing Innovation EconomyCenter for an Urban Future
This data brief—researched and written by the Center for an Urban Future and produced in partnership with Downtown Brooklyn Partnership, Dumbo Improvement District, Brooklyn Navy Yard Development Corporation, and Industry City—is the first publication of a research effort to better understand Brooklyn’s fast-growing innovation economy. The brief provides a new level of data about the size and scope of Brooklyn’s innovation economy and the most com-prehensive assessment to date of the borough’s competitive advantages within the innovation economy. It documents the growth in innovation companies in the borough and also shows which tech, creative, and manufacturing fields have been growing the fastest in Brooklyn and which industries comprise a larger share of Brooklyn’s innovation economy than Manhattan’s.
In the coming weeks, CUF will follow this data brief with a more in-depth analysis explor-ing how to keep the borough’s innovation economy growing and how to ensure that more Brooklyn residents—particularly those from lower-income communities—are able to access the high-quality jobs being created in the borough’s innovation industries.
This new data brief builds on past efforts to quantify and support parts of the innovation economy in Brooklyn, such as the Brooklyn Tech Triangle studies of 2013 and 2015, which focused on the neighborhoods of Dumbo and Downtown Brooklyn, as well as the Brooklyn Navy Yard. The 2015 Brooklyn Tech Triangle report found at least 1,300 innovation firms in the three neighborhoods, employing approximately 17,000 people and generating $5 billion in economic impact each year. As these neighborhoods continue to grow, other clusters have emerged—including the creative campus of Industry City in Sunset Park, which is home to companies in tech, media, design, and other creative industries, as well as dozens of entrepre-neurial makers.6
For this analysis, we consider the innovation economy to include a diverse mix of tech start-ups, creative companies, and next-generation makers and manufacturers. Across Brooklyn, these three core innovation sectors are fueling one another’s growth, producing a fertile envi-ronment for creative ideas to flourish into new businesses. Although operating in a broad array of markets and industries, these Brooklyn companies are linked by a shared use of emerging technology and creative tools to develop, design, and produce innovative new products, appli-cations, platforms, and services.
Brooklyn’s innovation economy companies reflect a broad range of business ideas and oppor-tunities, demonstrating several key strengths of the borough they call home. For instance, Downtown Brooklyn–based Gimlet Media has become a leader in the booming podcast indus-try, which rests on a foundation of both media and ad tech—and the company was recently acquired by Spotify for a reported $230 million. Other fast-growing Brooklyn start-ups in-clude Brooklyn Navy Yard–based Care/of, a personalized wellness company whose successful first product, customized daily vitamin packs, has led to more than $42 million in investment; Downtown Brooklyn–based goTenna, a start-up that produces inexpensive devices to create distributed communications networks without cell service or WiFi; and Dumbo-based Paper-space, a cloud computing platform optimized for machine learning and artificial intelligence. Brooklyn has also given rise to several dozen innovative manufacturers that integrate technol-ogy and design, such as Tailored Industry, an on-demand, high-tech knitwear manufacturer for the e-commerce industry based in the Brooklyn Army Terminal; Radiator Labs, a creator of energy-saving smart radiator covers based in the Brooklyn Navy Yard; and the Industry City–
5
Brooklyn’s Growing Innovation EconomyCenter for an Urban Future
based Keap Candles, a nearly zero-waste, direct-to-consumer scented candle company. Although the innovation economy is growing from Union Square to the South Bronx, Brooklyn has emerged as the fastest-growing hub for innovation industries citywide. According to our analysis of Census data, in just the past two years, the number of Brooklyn residents working in “professional, scientific and technical services” industries increased by 14,569—accounting for 51 percent of the citywide increase. Similarly, 6,327 more Brooklyn residents worked in “information” industries in 2017 compared to 2015, comprising 94 percent of the gain city-wide. Brooklynites also accounted for 30 percent of the citywide growth in people working in arts, entertainment, and recreation. In addition, people living in Brooklyn make up 31 percent of all city residents working in manufacturing.
Among the key findings of our analysis:
Tech Start-Ups
Recent Growth7
• Of all major tech hubs in the nation, Brooklyn’s start-up growth rate since 2008 was second only to San Francisco. Brooklyn’s 356 percent growth rate topped New York City (308 percent), Philadelphia (290 percent), Los Angeles (279 percent), and Chicago (270 percent).8
• In 2018, Brooklyn was home to 1,205 tech-enabled start-ups, according to our analysis of Crunchbase’s start-up database, up from 264 start-ups in 2008.
• Brooklyn now has 9.2 percent of the city’s tech start-ups, up from 6.3 percent in 2000 and a higher share than ever before.
• Though Manhattan boasts the most start-ups of any borough, Brooklyn has nearly six times as many start-ups as Queens, the Bronx, and Staten Island combined.
• Since 2000, at least 441 Brooklyn-based start-ups have received venture capital or angel funding. Brooklyn now has 7.2 percent of all funded start-ups in New York City, up from 4.3 percent of the city’s total in 2000.
• Brooklyn is home to 10 of the 85 funded start-ups founded in New York City in 2018—or 11.76 percent, the borough’s highest-share ever of new, funded start-ups in a single year.
• 84 percent of companies founded in Brooklyn since 2000 were founded in 2008 or later.
• Over the nine years from 2009 to 2017, Brooklyn produced an average of 101 start-ups per year. In the previous nine years—from 2000 to 2008—Brooklyn produced 29 per year.
Industry Breakdown9
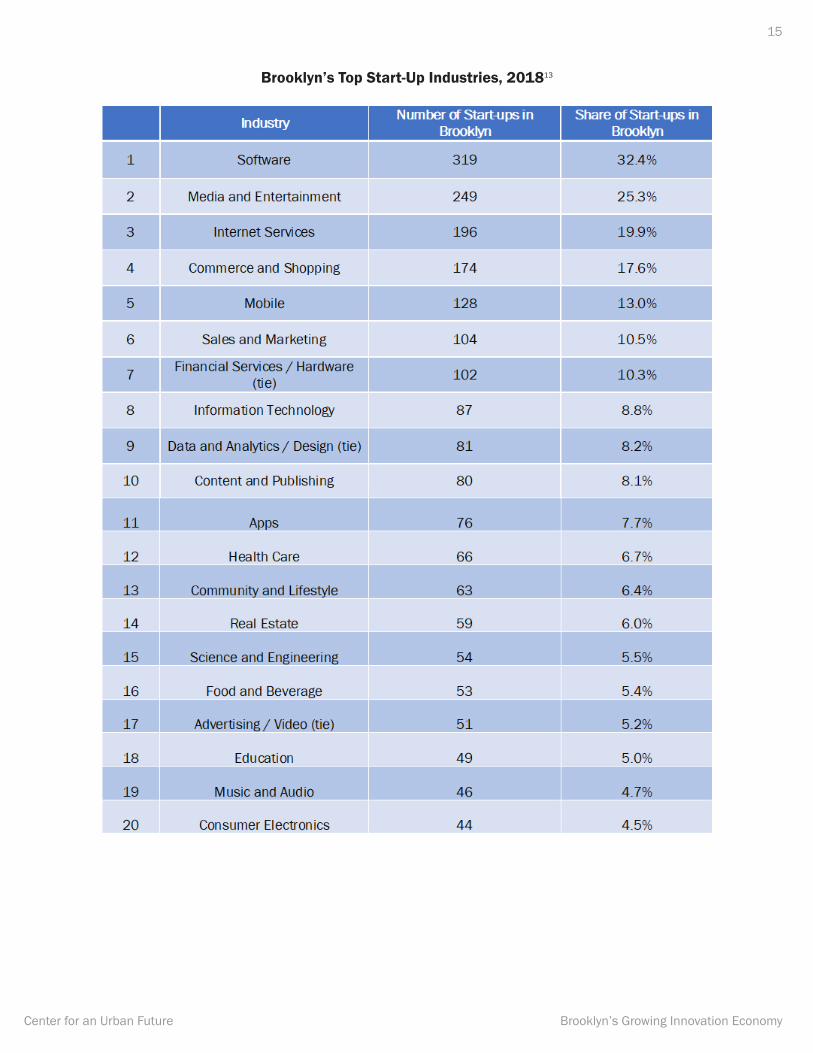
• Nearly a third of all start-ups in Brooklyn (319 companies) produce software. Brooklyn also has numerous start-ups in media and entertainment (249 start-ups), Internet services (196),
6
Brooklyn’s Growing Innovation EconomyCenter for an Urban Future
commerce and shopping (174), mobile (128), sales and marketing (104), hardware (102), financial services (102), data and analytics (81), design (81), content and publishing (80), and apps (76). (Note that start-ups can appear in more than one category, e.g., software and mobile.)
• Other industries well represented in Brooklyn’s start-up ecosystem include healthcare (66 start-ups), community and lifestyle (63), real estate (59), science and engineering (54), food and beverage (53), advertising (51), video (51), education (49), and music and audio (46).
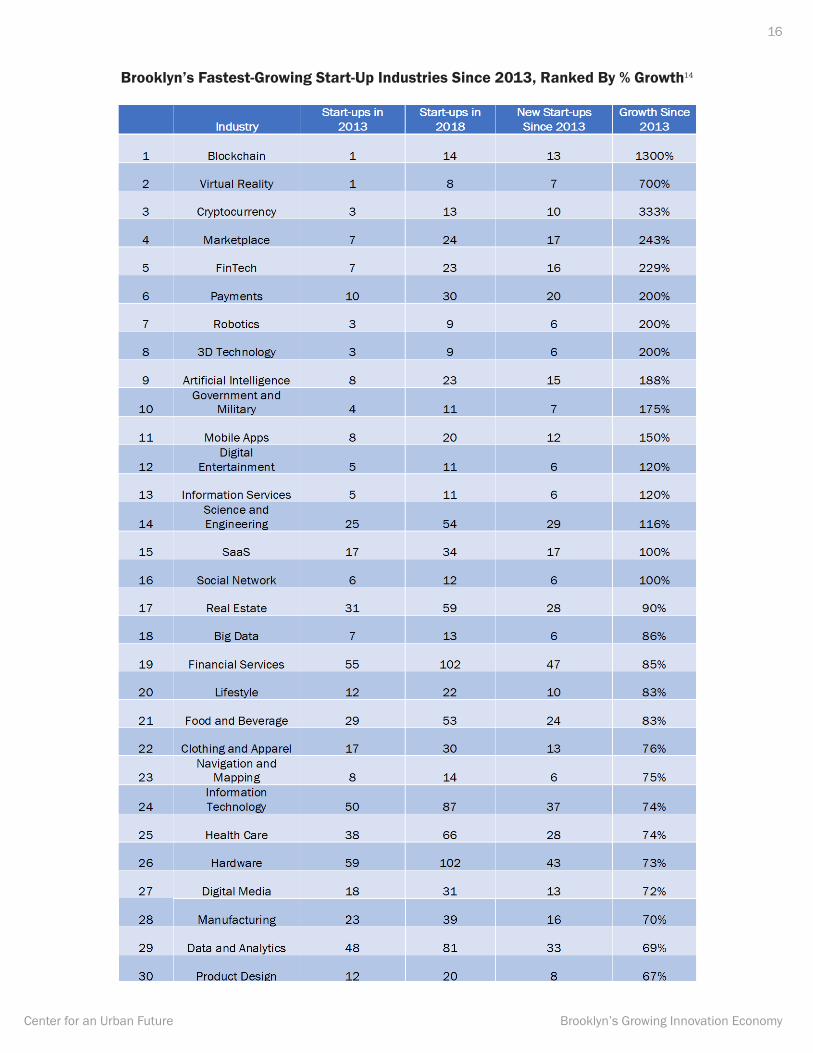
• The 30 fastest-growing industries in Brooklyn since 2013:
1. Blockchain: 1,300 percent growth, from 1 start-up in 2013 to 14 in 2018.
2. Virtual Reality: 700 percent growth, from 1 start-ups in 2013 to 8 in 2018
3. Cryptocurrency: 333 percent growth, from 3 start-ups in 2013 to 13 in 2018
4. Marketplace: 243 percent growth, from 7 start-ups in 2013 to 24 in 2018
5. FinTech: 229 percent growth, from 7 start-ups in 2013 to 23 in 2018
6. Payments: 200 percent growth, from 10 start-ups in 2013 to 30 in 2018
7. Robotics: 200 percent growth, from 3 start-ups in 2013 to 9 in 2018
8. 3D Technology: 200 percent growth, from 3 start-ups in 2013 to 9 in 2018
9. Artificial Intelligence: 188 percent growth, from 8 start-ups in 2013 to 23 in 2018
10. Government and Military: 175 percent growth, from 4 start-ups in 2013 to 11 in 2018
11. Mobile Apps: 150 percent growth, from 8 start-ups in 2013 to 20 in 2018
12. Digital Entertainment: 120 percent growth, from 5 start-ups in 2013 to 11 in 2018
13. Information Services: 120 percent growth, from 5 start-ups in 2013 to 11 in 2018
14. Science and Engineering: 116 percent growth, from 25 start-ups in 2013 to 54 in 2018
15. Software-as-a-Service: 100 percent growth, from 17 start-ups in 2013 to 34 in 2018
16. Social Network: 100 percent growth, from 6 start-ups in 2013 to 12 in 2018
17. Real Estate: 90 percent growth, from 31 start-ups in 2013 to 59 in 2018
18. Big Data: 86 percent growth, from 7 start-ups in 2013 to 13 in 2018
19. Financial Services: 85 percent growth, from 55 start-ups in 2013 to 102 in 2018
20. Lifestyle: 83 percent growth, from 12 start-ups in 2013 to 22 in 2018
21. Food and Beverage: 83 percent growth, from 29 start-ups in 2013 to 53 in 2018
22. Clothing and Apparel: 76 percent growth, from 17 start-ups in 2013 to 30 in 2018
23. Navigation and Mapping: 75 percent growth, from 8 start-ups in 2013 to 14 in 2018
24. Information Technology: 74 percent growth, from 50 start-ups in 2013 to 87 in 2018
25. Health Care: 74 percent growth, from 38 start-ups in 2013 to 66 in 2018
26. Hardware: 73 percent growth, from 59 start-ups in 2013 to 102 in 2018
27. Digital Media: 72 percent growth, from 18 start-ups in 2013 to 31 in 2018
28. Manufacturing: 70 percent growth, from 23 start-ups in 2013 to 39 in 2018
29. Data and Analytics: 69 percent growth, from 48 start-ups in 2013 to 81 in 2018
30. Product Design: 67 percent growth, from 12 start-ups in 2013 to 20 in 2018
7
Brooklyn’s Growing Innovation EconomyCenter for an Urban Future
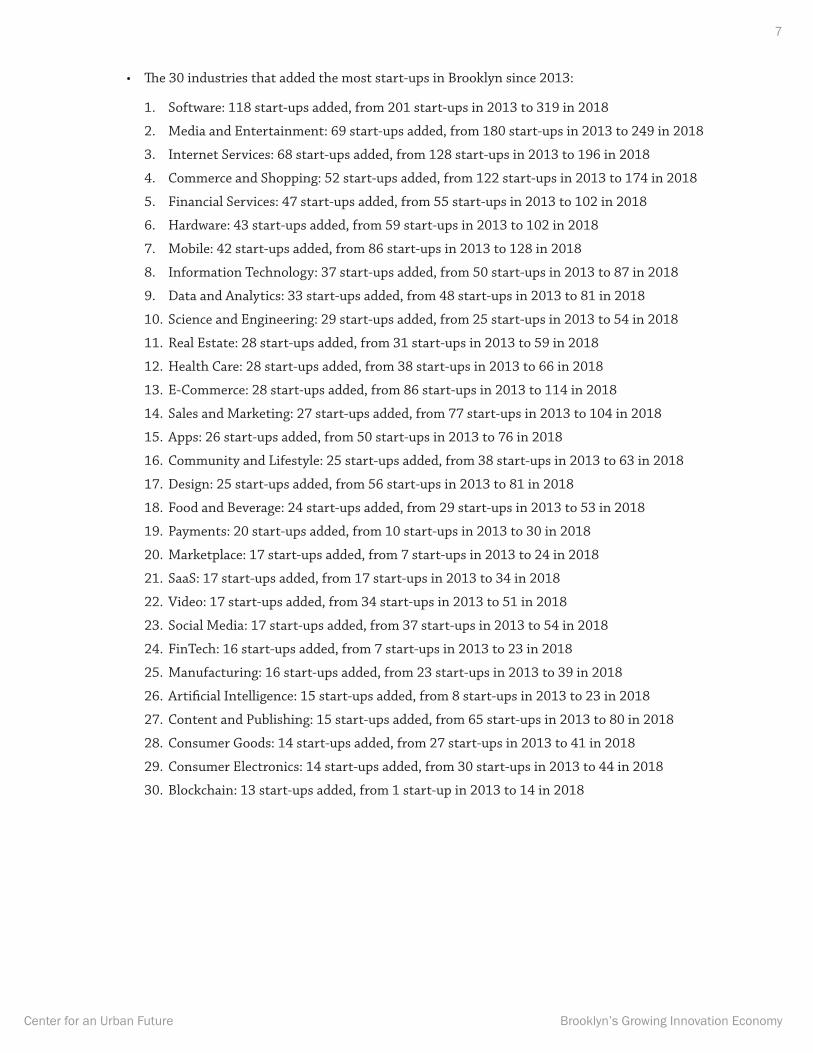
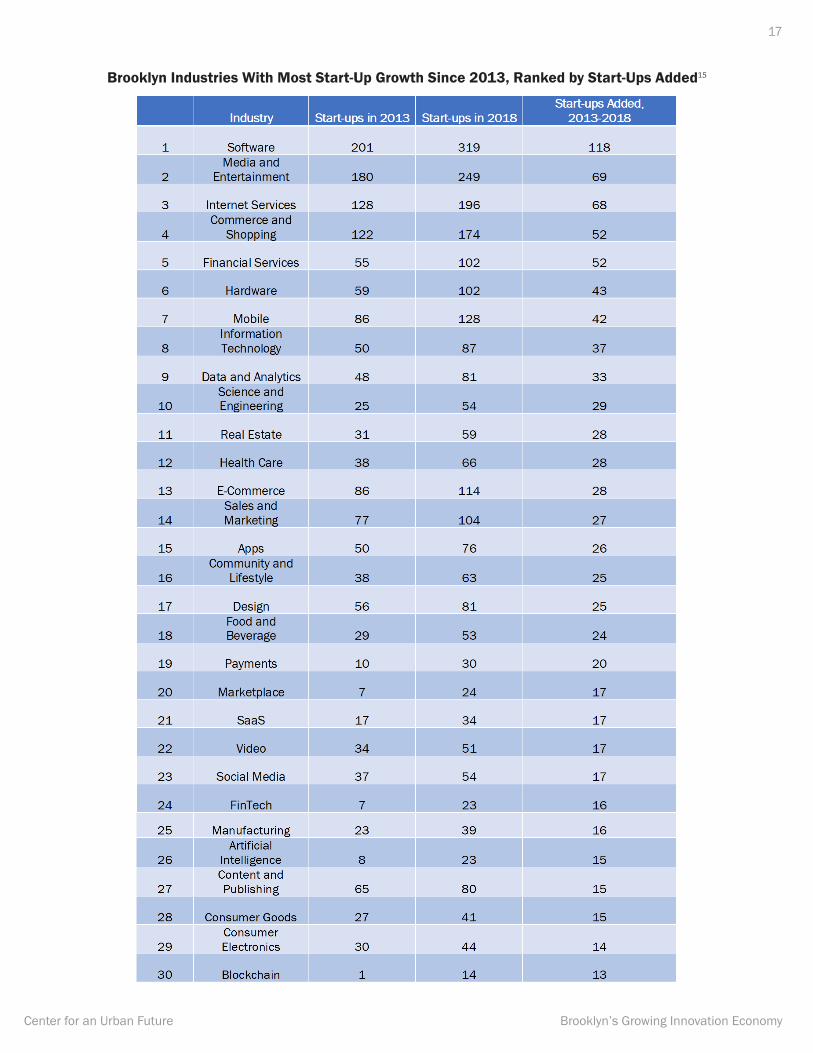
• The 30 industries that added the most start-ups in Brooklyn since 2013:
1. Software: 118 start-ups added, from 201 start-ups in 2013 to 319 in 2018
2. Media and Entertainment: 69 start-ups added, from 180 start-ups in 2013 to 249 in 2018
3. Internet Services: 68 start-ups added, from 128 start-ups in 2013 to 196 in 2018
4. Commerce and Shopping: 52 start-ups added, from 122 start-ups in 2013 to 174 in 2018
5. Financial Services: 47 start-ups added, from 55 start-ups in 2013 to 102 in 2018
6. Hardware: 43 start-ups added, from 59 start-ups in 2013 to 102 in 2018
7. Mobile: 42 start-ups added, from 86 start-ups in 2013 to 128 in 2018
8. Information Technology: 37 start-ups added, from 50 start-ups in 2013 to 87 in 2018
9. Data and Analytics: 33 start-ups added, from 48 start-ups in 2013 to 81 in 2018
10. Science and Engineering: 29 start-ups added, from 25 start-ups in 2013 to 54 in 2018
11. Real Estate: 28 start-ups added, from 31 start-ups in 2013 to 59 in 2018
12. Health Care: 28 start-ups added, from 38 start-ups in 2013 to 66 in 2018
13. E-Commerce: 28 start-ups added, from 86 start-ups in 2013 to 114 in 2018
14. Sales and Marketing: 27 start-ups added, from 77 start-ups in 2013 to 104 in 2018
15. Apps: 26 start-ups added, from 50 start-ups in 2013 to 76 in 2018
16. Community and Lifestyle: 25 start-ups added, from 38 start-ups in 2013 to 63 in 2018
17. Design: 25 start-ups added, from 56 start-ups in 2013 to 81 in 2018
18. Food and Beverage: 24 start-ups added, from 29 start-ups in 2013 to 53 in 2018
19. Payments: 20 start-ups added, from 10 start-ups in 2013 to 30 in 2018
20. Marketplace: 17 start-ups added, from 7 start-ups in 2013 to 24 in 2018
21. SaaS: 17 start-ups added, from 17 start-ups in 2013 to 34 in 2018
22. Video: 17 start-ups added, from 34 start-ups in 2013 to 51 in 2018
23. Social Media: 17 start-ups added, from 37 start-ups in 2013 to 54 in 2018
24. FinTech: 16 start-ups added, from 7 start-ups in 2013 to 23 in 2018
25. Manufacturing: 16 start-ups added, from 23 start-ups in 2013 to 39 in 2018
26. Artificial Intelligence: 15 start-ups added, from 8 start-ups in 2013 to 23 in 2018
27. Content and Publishing: 15 start-ups added, from 65 start-ups in 2013 to 80 in 2018
28. Consumer Goods: 14 start-ups added, from 27 start-ups in 2013 to 41 in 2018
29. Consumer Electronics: 14 start-ups added, from 30 start-ups in 2013 to 44 in 2018
30. Blockchain: 13 start-ups added, from 1 start-up in 2013 to 14 in 2018
8
Brooklyn’s Growing Innovation EconomyCenter for an Urban Future
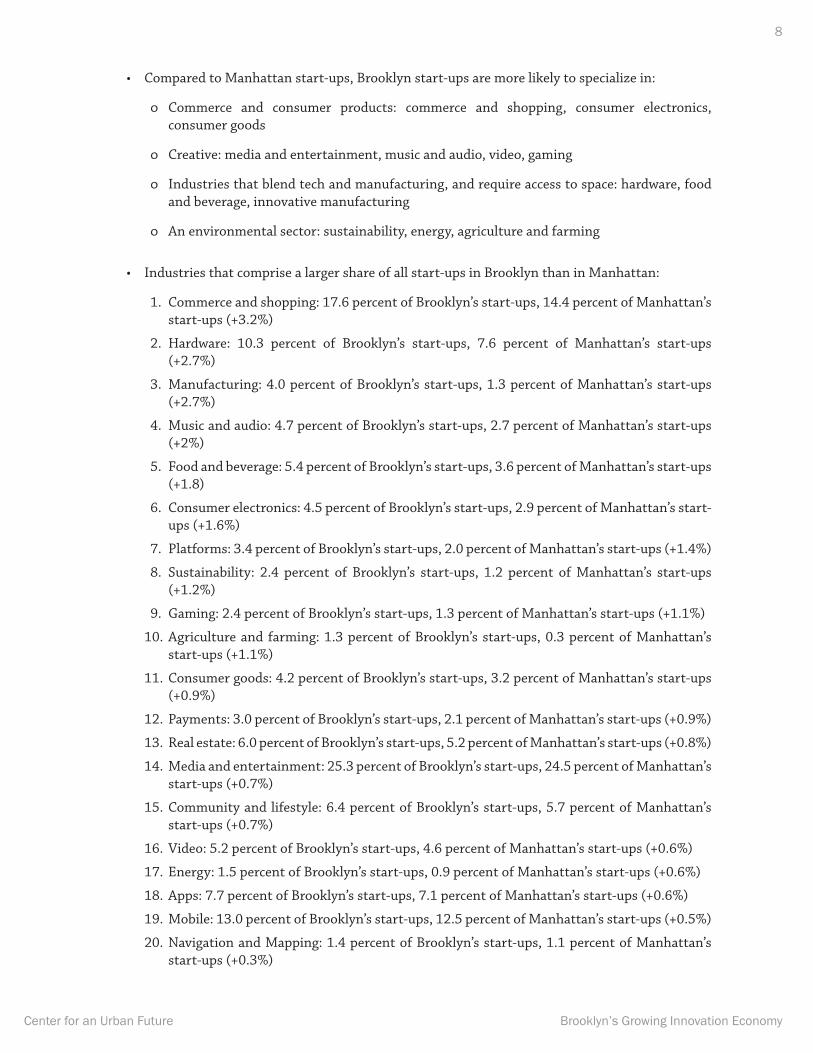
• Compared to Manhattan start-ups, Brooklyn start-ups are more likely to specialize in:
ű Commerce and consumer products: commerce and shopping, consumer electronics, consumer goods
ű Creative: media and entertainment, music and audio, video, gaming
ű Industries that blend tech and manufacturing, and require access to space: hardware, food and beverage, innovative manufacturing
ű An environmental sector: sustainability, energy, agriculture and farming
• Industries that comprise a larger share of all start-ups in Brooklyn than in Manhattan:
1. Commerce and shopping: 17.6 percent of Brooklyn’s start-ups, 14.4 percent of Manhattan’s start-ups (+3.2%)
2. Hardware: 10.3 percent of Brooklyn’s start-ups, 7.6 percent of Manhattan’s start-ups (+2.7%)
3. Manufacturing: 4.0 percent of Brooklyn’s start-ups, 1.3 percent of Manhattan’s start-ups (+2.7%)
4. Music and audio: 4.7 percent of Brooklyn’s start-ups, 2.7 percent of Manhattan’s start-ups (+2%)
5. Food and beverage: 5.4 percent of Brooklyn’s start-ups, 3.6 percent of Manhattan’s start-ups (+1.8)
6. Consumer electronics: 4.5 percent of Brooklyn’s start-ups, 2.9 percent of Manhattan’s start- ups (+1.6%)
7. Platforms: 3.4 percent of Brooklyn’s start-ups, 2.0 percent of Manhattan’s start-ups (+1.4%)
8. Sustainability: 2.4 percent of Brooklyn’s start-ups, 1.2 percent of Manhattan’s start-ups (+1.2%)
9. Gaming: 2.4 percent of Brooklyn’s start-ups, 1.3 percent of Manhattan’s start-ups (+1.1%)
10. Agriculture and farming: 1.3 percent of Brooklyn’s start-ups, 0.3 percent of Manhattan’s start-ups (+1.1%)
11. Consumer goods: 4.2 percent of Brooklyn’s start-ups, 3.2 percent of Manhattan’s start-ups (+0.9%)
12. Payments: 3.0 percent of Brooklyn’s start-ups, 2.1 percent of Manhattan’s start-ups (+0.9%)
13. Real estate: 6.0 percent of Brooklyn’s start-ups, 5.2 percent of Manhattan’s start-ups (+0.8%)
14. Media and entertainment: 25.3 percent of Brooklyn’s start-ups, 24.5 percent of Manhattan’s start-ups (+0.7%)
15. Community and lifestyle: 6.4 percent of Brooklyn’s start-ups, 5.7 percent of Manhattan’s start-ups (+0.7%)
16. Video: 5.2 percent of Brooklyn’s start-ups, 4.6 percent of Manhattan’s start-ups (+0.6%)
17. Energy: 1.5 percent of Brooklyn’s start-ups, 0.9 percent of Manhattan’s start-ups (+0.6%)
18. Apps: 7.7 percent of Brooklyn’s start-ups, 7.1 percent of Manhattan’s start-ups (+0.6%)
19. Mobile: 13.0 percent of Brooklyn’s start-ups, 12.5 percent of Manhattan’s start-ups (+0.5%)
20. Navigation and Mapping: 1.4 percent of Brooklyn’s start-ups, 1.1 percent of Manhattan’s start-ups (+0.3%)
9
Brooklyn’s Growing Innovation EconomyCenter for an Urban Future
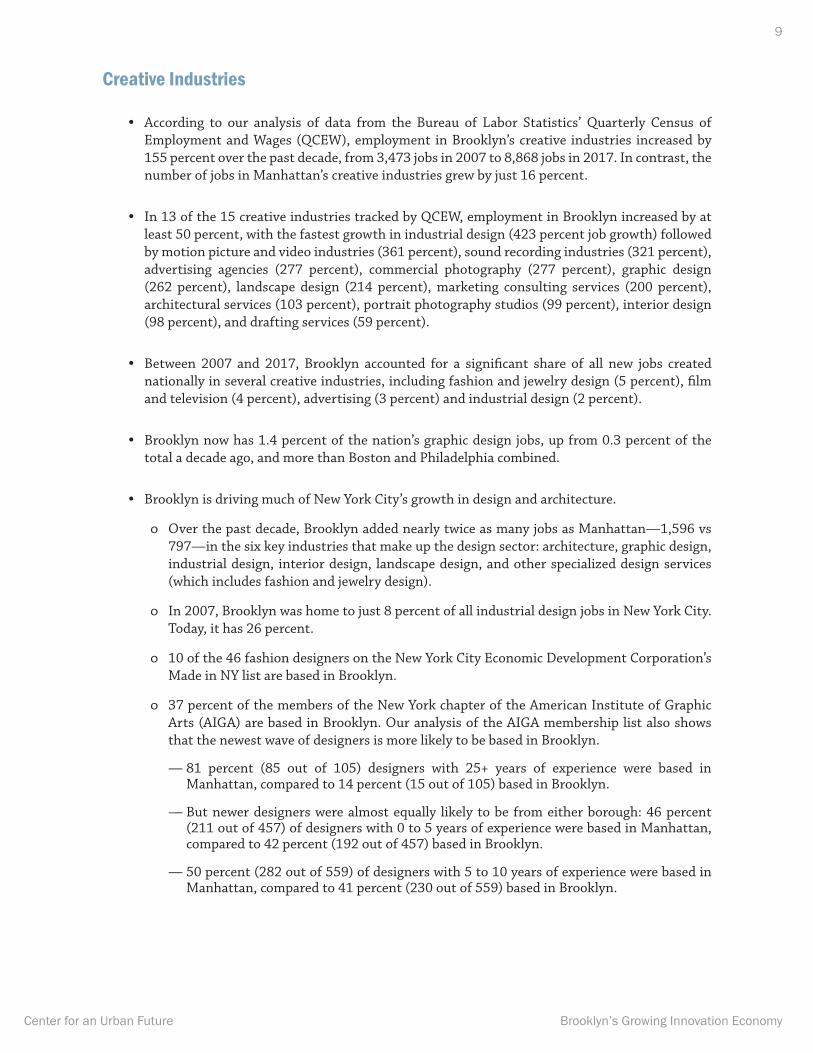
Creative Industries
• According to our analysis of data from the Bureau of Labor Statistics’ Quarterly Census of Employment and Wages (QCEW), employment in Brooklyn’s creative industries increased by 155 percent over the past decade, from 3,473 jobs in 2007 to 8,868 jobs in 2017. In contrast, the number of jobs in Manhattan’s creative industries grew by just 16 percent.
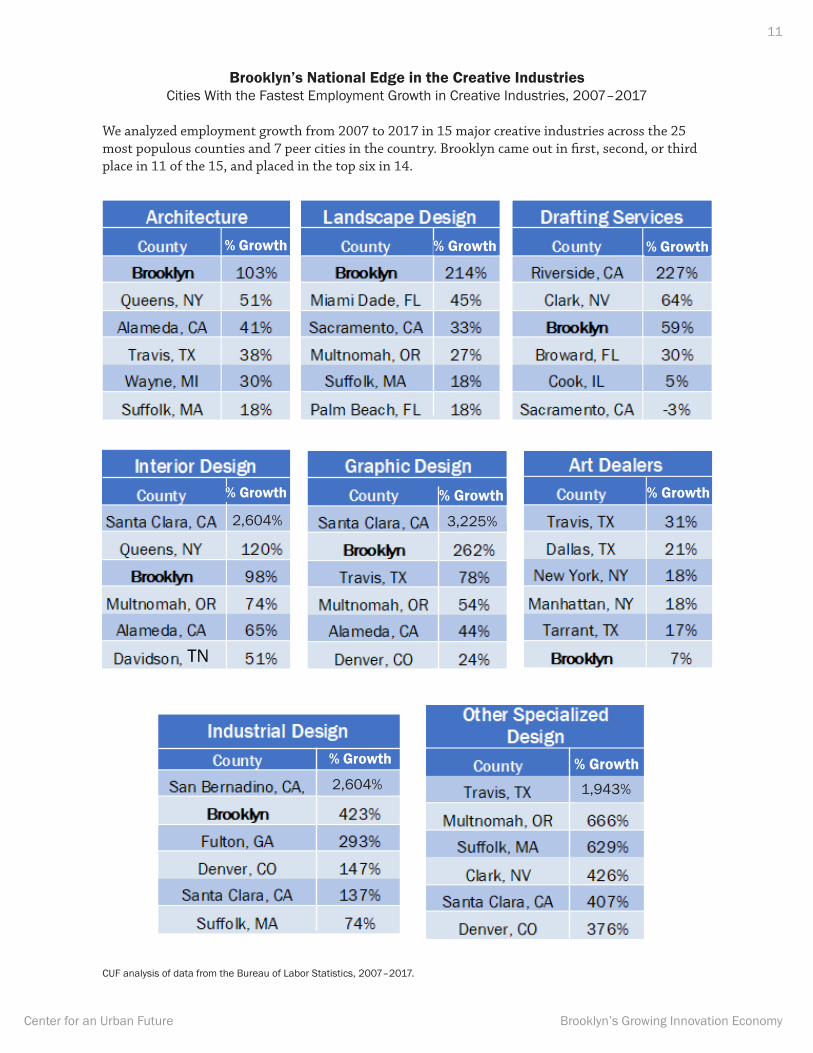
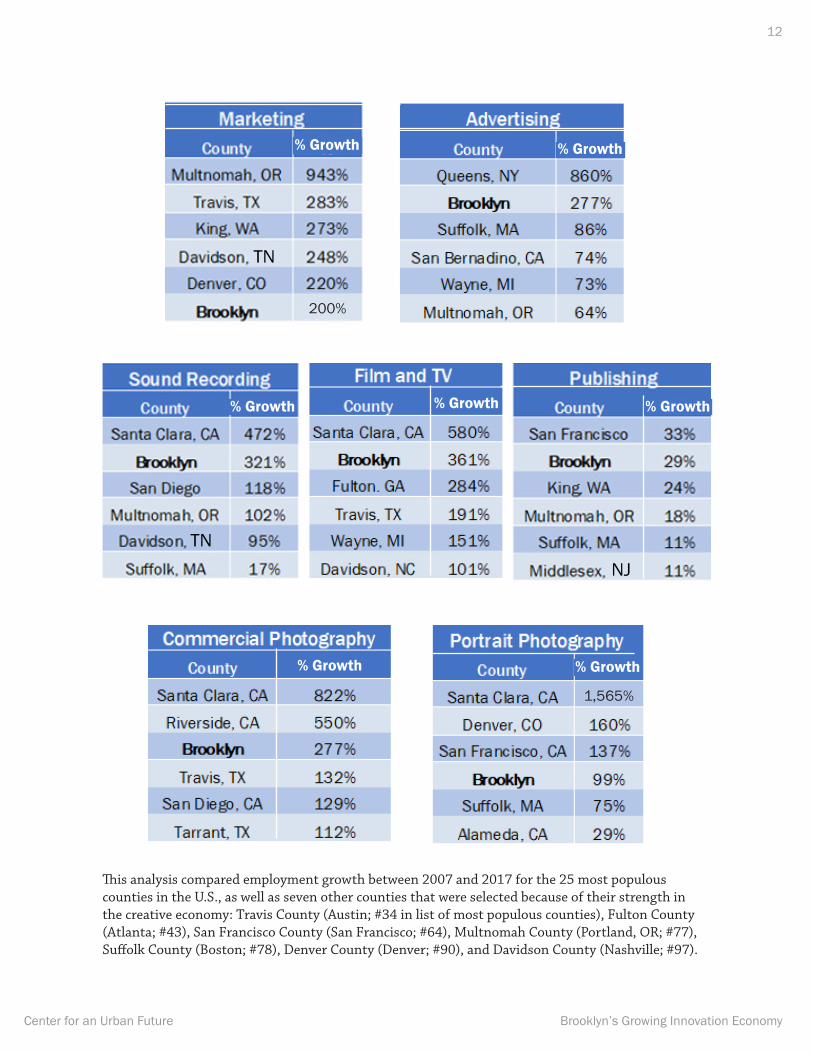
• In 13 of the 15 creative industries tracked by QCEW, employment in Brooklyn increased by at least 50 percent, with the fastest growth in industrial design (423 percent job growth) followed by motion picture and video industries (361 percent), sound recording industries (321 percent), advertising agencies (277 percent), commercial photography (277 percent), graphic design (262 percent), landscape design (214 percent), marketing consulting services (200 percent), architectural services (103 percent), portrait photography studios (99 percent), interior design (98 percent), and drafting services (59 percent).
• Between 2007 and 2017, Brooklyn accounted for a significant share of all new jobs created nationally in several creative industries, including fashion and jewelry design (5 percent), film and television (4 percent), advertising (3 percent) and industrial design (2 percent).
• Brooklyn now has 1.4 percent of the nation’s graphic design jobs, up from 0.3 percent of the total a decade ago, and more than Boston and Philadelphia combined.
• Brooklyn is driving much of New York City’s growth in design and architecture.
ű Over the past decade, Brooklyn added nearly twice as many jobs as Manhattan—1,596 vs 797—in the six key industries that make up the design sector: architecture, graphic design, industrial design, interior design, landscape design, and other specialized design services (which includes fashion and jewelry design).
ű In 2007, Brooklyn was home to just 8 percent of all industrial design jobs in New York City. Today, it has 26 percent.
ű 10 of the 46 fashion designers on the New York City Economic Development Corporation’s Made in NY list are based in Brooklyn.
ű 37 percent of the members of the New York chapter of the American Institute of Graphic Arts (AIGA) are based in Brooklyn. Our analysis of the AIGA membership list also shows that the newest wave of designers is more likely to be based in Brooklyn.
— 81 percent (85 out of 105) designers with 25+ years of experience were based in Manhattan, compared to 14 percent (15 out of 105) based in Brooklyn.
— But newer designers were almost equally likely to be from either borough: 46 percent (211 out of 457) of designers with 0 to 5 years of experience were based in Manhattan, compared to 42 percent (192 out of 457) based in Brooklyn.
— 50 percent (282 out of 559) of designers with 5 to 10 years of experience were based in Manhattan, compared to 41 percent (230 out of 559) based in Brooklyn.
10
Brooklyn’s Growing Innovation EconomyCenter for an Urban Future
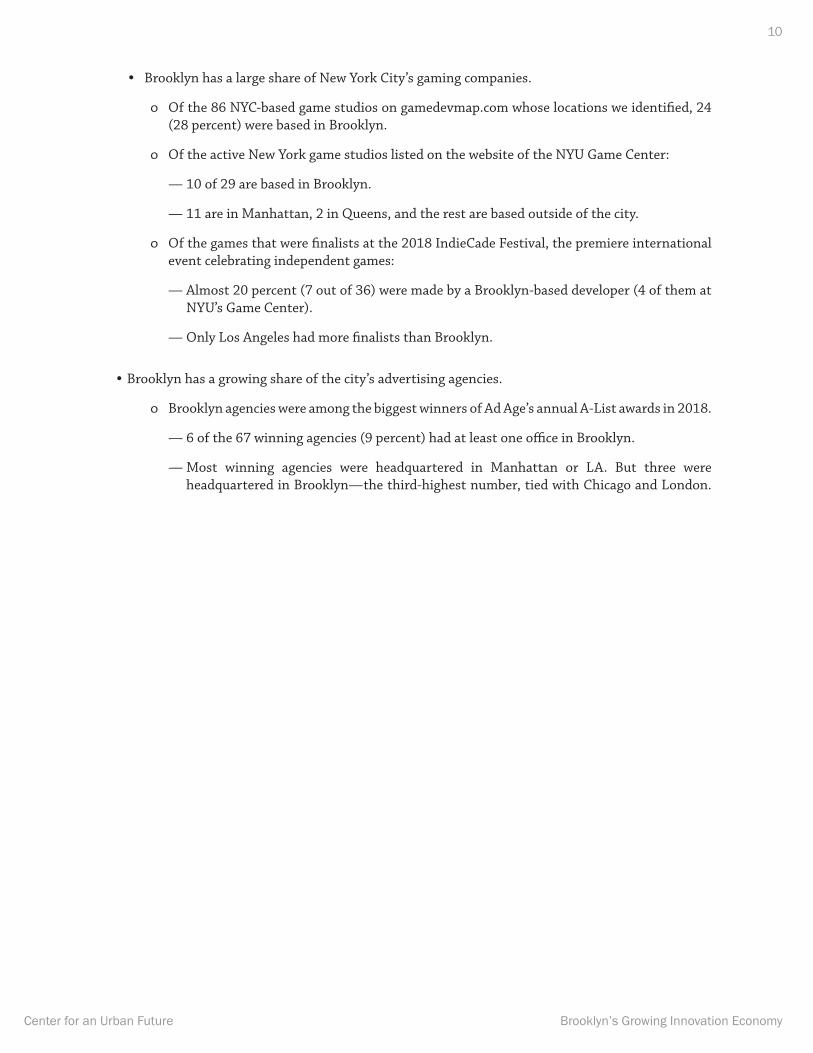
• Brooklyn has a large share of New York City’s gaming companies.
ű Of the 86 NYC-based game studios on gamedevmap.com whose locations we identified, 24 (28 percent) were based in Brooklyn.
ű Of the active New York game studios listed on the website of the NYU Game Center:
— 10 of 29 are based in Brooklyn.
— 11 are in Manhattan, 2 in Queens, and the rest are based outside of the city.
ű Of the games that were finalists at the 2018 IndieCade Festival, the premiere international event celebrating independent games:
— Almost 20 percent (7 out of 36) were made by a Brooklyn-based developer (4 of them at NYU’s Game Center).
— Only Los Angeles had more finalists than Brooklyn.
• Brooklyn has a growing share of the city’s advertising agencies.
ű Brooklyn agencies were among the biggest winners of Ad Age’s annual A-List awards in 2018.
— 6 of the 67 winning agencies (9 percent) had at least one office in Brooklyn.
— Most winning agencies were headquartered in Manhattan or LA. But three were headquartered in Brooklyn—the third-highest number, tied with Chicago and London.
11
Brooklyn’s Growing Innovation EconomyCenter for an Urban Future
Brooklyn’s National Edge in the Creative IndustriesCities With the Fastest Employment Growth in Creative Industries, 2007–2017
We analyzed employment growth from 2007 to 2017 in 15 major creative industries across the 25 most populous counties and 7 peer cities in the country. Brooklyn came out in first, second, or third place in 11 of the 15, and placed in the top six in 14.
CUF analysis of data from the Bureau of Labor Statistics, 2007–2017.
TN
% Growth
% Growth% Growth% Growth
% Growth % Growth % Growth
% Growth
2,604% 1,943%
3,225%2,604%
12
Brooklyn’s Growing Innovation EconomyCenter for an Urban Future
This analysis compared employment growth between 2007 and 2017 for the 25 most populous counties in the U.S., as well as seven other counties that were selected because of their strength in the creative economy: Travis County (Austin; #34 in list of most populous counties), Fulton County (Atlanta; #43), San Francisco County (San Francisco; #64), Multnomah County (Portland, OR; #77), Suffolk County (Boston; #78), Denver County (Denver; #90), and Davidson County (Nashville; #97).
TN
TN
NJ
% Growth % Growth
% Growth% Growth% Growth
% Growth % Growth
1,565%
200%
13
Brooklyn’s Growing Innovation EconomyCenter for an Urban Future
Innovative Manufacturers
• Manufacturing employment in Brooklyn declined by 16 percent over the past decade, from 23,498 to 19,741. However, Brooklyn’s share of all manufacturing jobs in the city grew from 24.7 percent to 28.4 percent.10
• Since the end of the Great Recession, Brooklyn’s manufacturing employment has rebounded slightly, growing from a low of 19,543 in 2011 to 19,741 in 2018, a 1 percent increase. Staten Island is the only other borough to report an increase in manufacturing employment since 2011.11
• Brooklyn’s manufacturing employment is showing growth in another notable area: employees with a bachelor’s degree or higher. Employment for workers with at least a bachelor’s degree increased from 4,621 in 2008 to 5,129 in 2018—an 11 percent increase. However, 75 percent of Brooklyn’s manufacturing jobs are held by workers without a bachelor’s degree.12
• Where there is growth in Brooklyn’s manufacturing sector, much of it is driven by companies at the intersection of manufacturing and technology, or manufacturing and design.
ű Employment in the “electrical equipment and appliances” manufacturing subsector nearly doubled in Brooklyn between 2008 and 2018. Brooklyn was the only borough to register employment growth in this sector.
ű Electrical equipment and appliances is one of just four manufacturing subsectors—out of 19 total—to experience employment growth in Brooklyn between 2008 and 2018. The others are food manufacturing, beverage manufacturing, and primary metal manufacturing.
• Our analysis of Crunchbase’s start-up database reveals that a growing number of the borough’s 1,205 tech-enabled start-ups are in manufacturing or a field that frequently engages in manufacturing. Brooklyn has:
ű 39 manufacturing start-ups, a 70 percent increase from 2013 (when there were 23).
ű 102 hardware start-ups.
ű 53 food and beverage start-ups
ű 30 clothing and apparel start-ups
ű 11 government and military start-ups
ű 41 consumer goods start-ups
ű 44 consumer electronics start-ups
• A much greater share of Brooklyn’s tech start-ups are in these manufacturing fields.
ű 4 percent of Brooklyn tech start-ups are in manufacturing, compared to just 1.3 percent of Manhattan start-ups
ű 10.3 percent of Brooklyn tech start-ups are in hardware, compared to 7.6 percent in Manhattan.
14
Brooklyn’s Growing Innovation EconomyCenter for an Urban Future
Appendix: Brooklyn’s Innovation Economy by the Numbers
NYC Tech Start-Ups by Borough, 2018
Brooklyn’s Share of Start-Ups in NYC
Where Brooklyn’s Advantage Is StrongestIndustries with a higher share of start-ups in Brooklyn than Manhattan, ranked by % difference
Share of all start-ups in NYC
15
Brooklyn’s Growing Innovation EconomyCenter for an Urban Future
Brooklyn’s Top Start-Up Industries, 201813
16
Brooklyn’s Growing Innovation EconomyCenter for an Urban Future
Brooklyn’s Fastest-Growing Start-Up Industries Since 2013, Ranked By % Growth14
17
Brooklyn’s Growing Innovation EconomyCenter for an Urban Future
Brooklyn Industries With Most Start-Up Growth Since 2013, Ranked by Start-Ups Added15
18
Brooklyn’s Growing Innovation EconomyCenter for an Urban Future
How Brooklyn Stacks Up: Tech Hubs Ranked by Growth Rate Since 2008
*For the purposes of this analysis, the San Francisco Bay Area includes the following regions: North Bay (southern Marin County, Mill Valley, Sausalito); South Bay (South San Francisco, San Bruno, Daly City), East Bay (Oakland, Berkeley, Fremont, Emeryville, Hayward, Alameda, Newark); Silicon Valley (Palo Alto,Mountain View, San Mateo, Redwood City, Menlo Park, Los Altos, Burlingame, San Carlos, Foster City, Stanford, Belmont, Sunnyvale, Santa Clara, Cupertino); and the San Jose area (San Jose, Campbell, Los Gatos, Milpitas).
**Greater Boston includes the following cities and towns: Boston, Cambridge, Waltham, Newton, Somerville, Woburn, Lexington, Quincy, Watertown, Wakefield, Brookline, Braintree, Medford, Charlestown,Bemont, Arlington, Marblehead, and Allston.
*
**
19
Brooklyn’s Growing Innovation EconomyCenter for an Urban Future
Endnotes
1. For this purpose of this analysis, a start-up is a company in the Crunchbase data founded in the year 2000 or later that was in operation in the given years. For example, the 2008 figures only include start-ups that were listed as active/operating in 2008. Likewise, the 2018 figures only include start-ups that were listed as active/operating in 2018. If a start-up was operating in 2008 but closed by 2018, then it would be included in the 2008 totals and excluded from the 2018 totals. Companies that were acquired and are still operating are included in our analysis.
2. CUF analysis of data from the U.S. Bureau of Labor Statistics, Quarterly Census of Employment and Wages (QCEW), 2007–2017. Tech employment is defined by a tally of the following tech subsectors: electronic shopping, internet publishing and web search portals, computer systems design and related services, data pro-cessing, hosting and related services, software publishers (5112) and scientific research and development services.
3. CUF analysis of data from the U.S. Bureau of Labor Statistics, Quarterly Census of Employment and Wages (QCEW), 2007–2017.
4. Ibid.
5. CUF analysis of data from the New York State Department of Labor, QCEW, Q3 2018 and Q3 2011.
6. CUF analysis of Brooklyn Tech Triangle studies of 2013 and 2015.
7. CUF analysis of data from Crunchbase.
8. At the time of publication, Crunchbase was still acquiring and processing data for 2018, so the final figures are likely to increase slightly for the most recent year.
9. CUF analysis of data from Crunchbase.
10. CUF analysis of data from the New York State Labor Department, QCEW, Q3 2018 and Q3 2008.
11. Ibid.
12. CUF analysis of data from the U.S. Census, Quarterly Workforce Indicators. This is the most recent data available to analyze job growth by educational attainment.
13. Crunchbase tags all start-ups with one or more industry categories and subcategories. These categories are used to analyze the relative share and growth of various industries and sub-industries. Because a compa-ny can receive more than one tag (e.g., mobile and payments), the total of all industries by share adds up tomore than 100 percent.
14. The analysis of fastest-growing industries includes all major industry categories and subcategories tagged in the Crunchbase dataset. Where a Crunchbase subcategory is the same as an industry (e.g., “artificial intel-ligence”), the larger industry total is used. This analysis includes only categories that added six or more start-ups since 2013.
15. The analysis of industries that have added the most start-ups since 2013 excludes three categories: “Con-sumer,” which does not appear in the Crunchbase data dictionary; and “Internet” and “Computer,” which are too general to connote a specific industry or sub-industry.
Brooklyn’s Growing Innovation Economy is a publication of the Center for an Urban Future. Researched, written, and edited by Jonathan Bowles, Eli Dvorkin, Naomi Sharp, and Charles Sha-viro. Additional research by Owen Patterson. Designed by Rachel Wolfe.