Embed Size (px)
Citation preview


British Geological Survey
TECHNICAL REPORT WC/94/5 5 Overseas Geology Series
A COMPARISON OF HIGH AND LOW DENSITY GEOCHEMICAL SAMPLING IN ZIMBABWE : APPLICATION TO ENVIRONMENTAL STUDIES J RIDGWAY, R C JONES & K B GREALLY
A Report prepared for the Overseas Development Administration under the ODNBGS Technology Development and Research Programme, Project 9 1/16
ODA chs:$carion : Su bsec tor: Gcoscicncc Theme: G2 - Identify and amelioratc mineral-related and other gcochemical toxic hamrds Project title: Enviranmcntal gcochemical mapping Reference number: K5547
Biblwpaphic referenu! : Ridgway J and others 1994. A comparison of high and low density gcochcmical sampling in Zimbabwe : application to environmental studies HGS 'Technical Report W'(:/94/55
K~ywordc : Zimbabwe; gcochcmistry; sathpliny density; strcain scdiincnts; soils; cnvironment
Fmnr cower illuururwn : Soil sampling for soil/stream sediment comparison study
0 NEKC 1994
Keyworth, Nottingham, British Geological Survey, 1994

EXECUTIVE SUMMARY
Regional geochemical surveying based on the collection and analysis of sediment samples from streams with small drainage basins (c l0 km’) has been shown in several studies, largely in temperate regions, to provide valuable information for environmental purposes as well as being an important mineral exploration tool. In particular, geochemistry can help delineate regions where trace element excesses or deficiencies might have adverse effects on human, animal or crop health. This report describes two studies designed to examine specific aspects of environmental geochemistry in the seasonally wet/dry climate of the Harare region of Zimbabwe. The work was carried out as part of a wider study of the application of regional geochemical mapping to environmental problems (Project R5547, 9 1/16, Environmental Geochemical Mapping) funded by the Overseas Development Administration as part of the UK programme of aid to the developing countries and carried out under the ODABGS Technology Development and Research Programme.
The first study addressed the premise that the value of drainage geochemical data for environmental studies depends on there being a positive correlation between drainage and soil geochemistry. The relationship between soil and drainage geochemistry in areas with relatively high background levels of trace elements such as Cu, Pb, Zn, Ni and CO has been examined in other investigations forming part of Project R5547 and the work in Zimbabwe concentrated on this relationship in an area of low trace element levels. A drainage basin of 2-3 km2 developed on granitic gneisses was chosen for the study. The subsistence farming in the basin meant that the chemistry of the soils was unlikely to have been affected by large scale additions of fertilisers or animal feed supplements.
The results showed that the correlation between soil and stream sediment geochemistry generally was good for the fine ( ~ 1 7 7 p m ) fractions of the two media, but less satisfactory for the coarser (<2 mm) fraction, although the low trace element levels expected from the granite gneiss terrain were still evident in both soil and sediment. This feature is probably related to the winnowing of fine, trace element bearing particles from the stream sediment during periods when the normally dry streams are flowing. This leads to a dilution of the trace element content which can be reduced by the selection of a narrower particle size range. It is concluded that stream sediments are a suitable sampling medium for environmental studies because they provide a reliable indicator of trace element concentrations in soils, which are of particular interest to agronomists and others, while being quicker and cheaper to collect for any given area.
The second study examined whether the time and costs of regional geochemical surveying for environmental purposes can be reduced by sampling streams with large catchment areas. This has clear advantages for developing countries, especially for those where geological mapping is not well advanced. The Harare region was sampled at a relatively high density of 1 sample per 2.7 km’ in a geochemical survey carried out between 1982 and 1986. Sixteen sites from this survey were resampled and the respective stored samples were retrieved and reanalysed with the new samples. Samples were also taken from larger, streamdrivers with drainage basins of between 45 and 135 kni’ to give low density coverage of the area.
Absolute concentration levels in original and new analyses on stored samples were substantially different. However, good correlation was shown between the two datasets
I
(Pearson correlation coefficients of >0.9 except for Pb, >0.8) and also between original analyses and analyses of new samples from resampled sites (all ~ 0 . 8 ) . Patterns of variation were thus similar and indicated that analytical differences arising from the analyses being carried out in different laboratories using slightly different methodologies, and sampling errors due, for instance, to temporal variation, were unlikely to have a large influence on any comparison based on correlation between the original high density and new low density surveys.
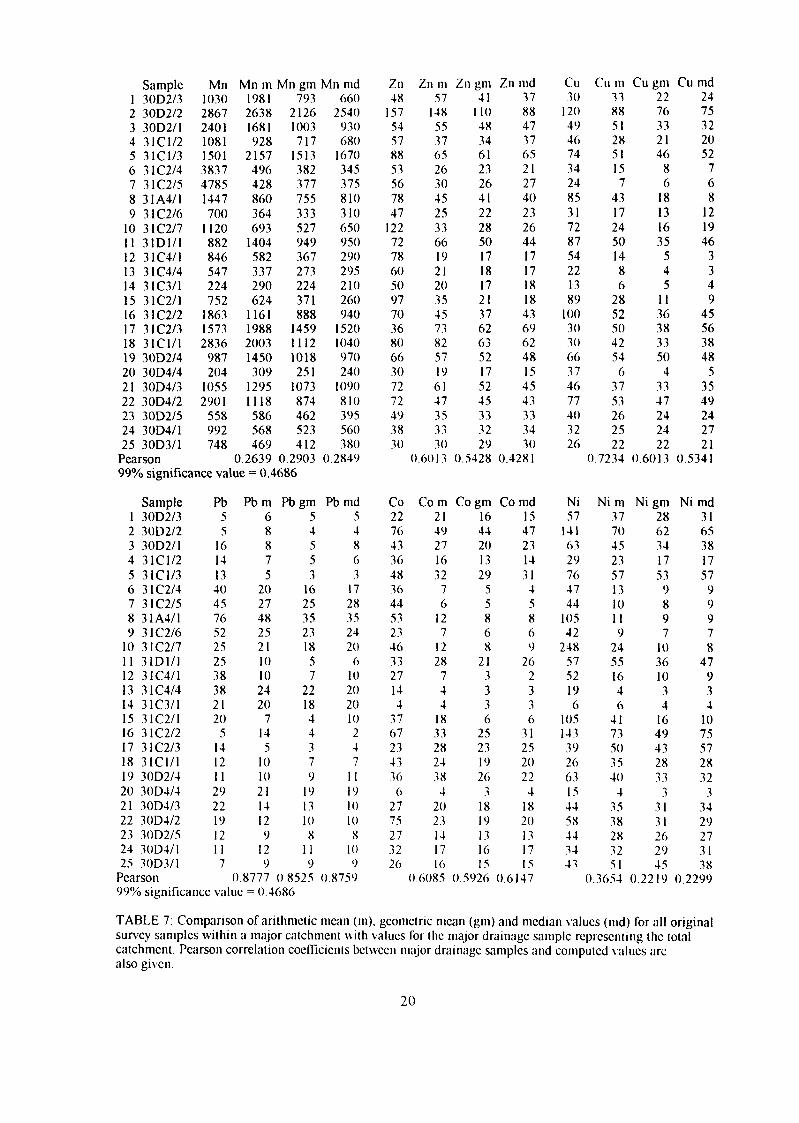
If low density sampling is to be of value, the results of low density geochemical surveys should display similar patterns of variation to those of high density surveys. For each large catchment basin represented by a drainage sample, estimates of the overall composition of the catchment were calculated by computing the arithmetic and geometric means and median value of the samples collected during the original high density survey. The absolute concentration levels in the original high and later low density survey were expected to be different because of the differences found between original analyses and new analyses from resampled sites. However, the correlation between estimates of the overall basin geochemistry and the geochemistry of the samples from high order drainage channels needs to be good if samples from high order streams are to be of use in regional geochemical surveys. Thus the drainage basins having the higher average composition, as calculated from low order stream samples, should also display the higher levels in the survey based on high order streams.
The results of the study demonstrate that the correlation between the geochemistry of high order stream samples and estimates of average concentrations for the large catchment basins is generally poor (Mn: 0.26-0.29, Zn: 0.43-0.60, Cu: 0.53-0.72, Pb: 0.85-0.88, CO: 0.59-0.61, Ni: 0.22-0.37). It is particularly bad for Mn and Ni, where the correlation coefficients are not significant at the 99% level. This poor level of correlation casts doubts on the usefulness of low density geochemical surveys based on the sampling of high order streams or rivers. The reasons for the poor correlation are not clear, but one important factor is undoubtably the inhomogeneity in the geology of the large drainage basins. Rock types which are present in only small quantities overall in a large basin can have a significant influence on the chemical composition of the representative stream sediment sample if they occur close to the sample site. Small drainage basins have more uniform geology and are thus less affected by such factors. Samples from the large (45 to 135 km’) drainage basins used in this study did not yield data which matched the higher density survey results and so cannot be used to provide useful and reliable data for regional environmental geochemical surveys. Further work might reveal an optimum catchment size for low density geochemical reconnaissance programmes.

EXECUTIVE SUMMARY
CONTENIS
1
INTRODUCTION i
PROJECT OBJECTIVES
POTENTIAL BENEFITS . . . . . . . . . . . . . . . . . . . . . . . . . .
THE STUDY AREA
2
COMPARISON OF DRAINAGE SEDIMENT AND SOIL AS SAMPLING MEDIA
FOR ENVIRONMENTAL GEOCHEMICAL SURVEYS. . . . . . . . . . . . . . . . 4
Study area . . . . . . . . . . . . . . . . . . . . . . . . . . . . . . . . . . . . . . . . . . . . . . 4
Field methods . . . . . . . . . . . . . 5
Stream sediments . . . . . 6
Soils . . . . . . . . . . . . . . . . . . . . , . . . . . . . . . . . . . . . . . . . . . . . 7
Analytical methods . . . . . . . . . . . . . . . 7
Results . . . . . . . . . . . . . . . . . . . . . . . . . . . . . . . . . . . . . . . . . . . . . . . . . 8
. . . . . . . . . . . . . . . , . , . , . . 8
9
9
.
. . . . . . . . . . . . . . . . . . . . . . . .
. . . . . . . . . . . . . . . . . . . . . . . . . . . . .
, . , . . .
. . . . . . . , . . . . . . . . . . . . . . , . .
<2 mni material . . . . . . , . . . . . . . .
4 7 7 p m material . . . . . . . . . . . . . . . . . . . , . . , . . . . . . . . . . . . . ,
Conclusions . . . . . . . . . . . . . . . . . . . . . . . . . . . . . . . , , . . . . , . . , . . .
ASSESSMENT OF THE RELATIVE USEFULNESS OF HIGH AND LOW
DENSITY GEOCHEMICAL SAMPLING FOR THE PRODUCTION OF
ENVIRONMENTAL GEOCHEMICAL MAPS. . . 9
Field methods . . . . . . . . . , . . . . . . . . . . . . . . . . , . . . . . . . . 10
Analytical methods . . . . . . . . . 1 1
. . . . . . . . . , . . . . . , I 1 Results . . . . . . . . . . . . . . . . .
. . . . . . . . . , . , . . . . . , .
. . , . . . . . . . . . . . . . , . . . . . . . . . . , . .
1 ) Test I : Comparison between original analyses and reanalysis of
splits of original samples . . . . . . . . . . . . . . . . . . . I I
2) l es t 2: Comparison of originnl and iicw analyses o f stored sample

splits with analyses of new samples collected from the original
sample sites . . . . . . . . . . . . . . . . . . . . . . . . . . . . . . . . . . . . 1 I
3) Test 3: Comparison between analyses of samples from high order
streams and computed values for the drainage basins based on
the original sampling and analysis . . . . . . . . . . . . . . . . . . . . . 14
SUMMARY AND DISCUSSION . . . . . . . . . . . . . . . . . . . . . . . . . . . . . . . . . . . 23
CONCLUSIONS AND RECOMMENDATIONS . . . . . . . . . . . . . . . . . . . . . . . . . . . 24
ACKNOWLEDGEMENTS . . . . . . . . . . . . . . . . . . . . . . . . . . . . . . . . . . . . . . . . . . 25
REFERENCES . . . . . . . . . . . . . . . . . . . . . . . . . . . . . . . . . . . . . . . . . . . . . . . . . . 25
APPENDIX 1 : Tabulated data for the soilhtream sediment comparison . . . . . . . . . . . 29
APPENDIX 2: Tabulated data for the original geochemical survey using low order
streams . . . . . . . . . . . . . . . . . . . . . . . . . . . . . . . . . . . . . . . . . . . . . . . . . . 31
FIG U RES
FIGURE 1 : Simplified geology of the study area . . . . . . . . . . . . . . . . . . . . . . . . . 5
FIGURE 2: Sketch map of drainage basin used for the soil/stream sediment
comparison, showing sample locations. . . . . . . . . . . . . . . . . . . . . . . . . . . . . 6
FIGURE 3 : Drainage map of the Harare area showing major drainage basins
sampled and sample numbers. Locations of original samples from low order
streams are also shown. The area boundary is the same as for FIGURE 1 . . , . 10
FIGURE 4a: Scatter plots of arithmetic mean (average) element values for low
order stream samples against the high order stream sample representing the
whole drainage basin; Mn, Zn and Cu. . . . . . . . . . . . . . . . . . . . . . . . . . . . I6
FIGURE 4b: Scatter plots of arithmetic mean (average) element values for low
order stream samples against the high order stream sample representing the
whole drainage basin; Pb, C O and Ni . . . . . . . . . . . . . . . . . . . . . . . . . . . . . . 17

TABLES
TABLE 1 : Comparison of determined and recommended values for international
. . . . r.eference. materials . . . . . . . . . . . . . . . . . . . . . . . . . . . . . . . . . . . . . . . . . . . . 7
TABLE 2: Comparison of mean values for soils and stream sediments . . . . . . . . . . . . . 8
TABLE . 3 : .Values far.arigina1 .determ.inations,. ceanalysed . splits and resampled.sites . . . . 12
TABLE 4: As for TABLE 3 but with recalculated figures for resampled sites . . . . . . . . . . . . 13
TABLE 5: As for TABLE 3 but with accurately located sites only . . . . . . . . . . . . . . . . 18
TABLE 6: Comparison of replicate samples from large catchment . areas . . . . . . . . . . . . 19
TABLE 7: Comparison of arithmetic mean, geometric mean and median values for
original samples with major drainage samples . . . . . . . . . . . . . . . . . . . . . . . . . 20
TABLE 8: Numbers of samples in major drainage basins according to bedrock and
lithological unit at the sample site . . . . . . . . . . . . . . . . . . . . . . . . . . . . . . . . . . 21
TABLE 9: Breakdown of major drainage basins by lithological unit and rock .type- . . . . 22

INTRODUCTION
The investigatlon reported here is part of a wider study of the application of regional
geochemical mapping to environmental problems (Project R5547, 91/16, Environmental
Geochemical Mapping) funded by the Overseas Development Administration as part of the
U K programme of aid to the developing countries and carried out under the ODABGS
Technology Development and Research Programme Field studies were conducted in
Zimbabwe, where the work was supported by the Geological Survey Department of the
Ministry of Mines
Although geochemical mapping based on the collection and chemical analysis of drainage
sediments (normally at relatively high densities of I sample per 1-5 km?) was initially used
for mineral exploration purposes, it is increasingly recognised that the techniques can be used
to provide data that are valuable for environmental studies, with particular importance in the
fields of human, animal and crop health (Aggett e / al., 1988; British Geological Survey, 1990.
1991, 1992; Plant and Moore, 1979; Plant, 1983; Plant and Stevenson, 1985; Thornton, 1983;
Webb and Atkinson, 1965). The value of drainage geochemical data for many environmental
studies depends on the relationship between drainage and soil geochemistry. Appleton and
Greally ( I 992) discuss the stream sediment-soil relationship in a report describing work which
also forms part of Project RSS47 and conclude that there is a broad correlation between soil
and stream sediment geochemistry and that regional drainage geochemical maps compare well
with soil maps for identifying areas where trace element deficiencies or excesses may occur.
Stream sediment-soil relationships have been investigated in the course of the present study
to help confirm this correlation in the Zimbabwean environment.
Many parts of the earth's land surface, particularly in the developing countries, have not been
covered by regional geochemical surveys and the cost-effective provision of the important
data stemming from such surveys is seen as a high priority by geoscientists throughout the
world To this end, Project 259 of the International Geological Correlation Programme (IGCP
259, now continuing as IGCP 360, International Geocheniical Mapping), has been concerned
with promoting regional geochemical mapping and establishing guidelines for the surveying
of unmapped regions The costs and time necessary for geocheniical surveying would be
I

reduced if it could be demonstrated that low-density sampling was capable of producing data
which were broadly compatible with those provided by the relatively high density surveys
through which the links with environmental factors were established. Ridgway cl al. (1991)
and Fordyce et al. ( 1 993) showed that the mathematical simulation of low density sampling
by the reduction of data from high density drainage sediment surveys (based on collection
from low order streams) could yield meaningful geochemical patterns at densities as low as
1 sample per 500 km2. The major part of the present study is concerned with examining
whether the collection and analysis of samples from high order streamshivers, with drainage
basins of between 50 and 150 km’, would similarly give rise to geochemical results which
were comparable with those from a previous high density survey. The findings have relevance
for all developing countries where geochemical survey coverage is incomplete and also
provide an input to IGCP 360.
PROJECT OBJECTIVES
The study reported here addressed two specific objectives of Project RSS47:
1 ) The comparison of drainage sediment and soil as sampling media for environmental
geochemical surveys.
Assessment of the relative usefulness of high and low density geochemical sampling
for environmental geochemistry purposes
2)
Objective 1 had been largely met by the work reported in Appleton and Greally (1 992) and
the present study, designed to complement the earlier work, was confined to the examination
of soil-stream sediment relationships in a small drainage basin where concentrations of CO,
Cu, Mn, Ni, Pb and Zn were expected to be low because of the granitic gneiss bedrock.
objective 2 was met by comparing the chemical composition of high order drainage samples
from the Harare area of Zimbabwe, representing drainage basins of 50-150 km2, with an
average composition for each basin calculated from low order stream samples collected during
an original high density geochemical survey Because chemical analyses were to be
performed in a different laboratory to that of the original survey and temporal variations in
2

stream sediment geochemistry have been recorded in the study region (Ridgway and Dunkley,
1988), the investigation addressed three particular topics
1 ) Comparison between original analyses and reanalysis of splits of original samples
stored in the Geological Survey Department, Zimbabwe, to assess the compatibility
of the original and new analytical results.
Comparison of both original and new analyses of stored sample splits with analyses
of new samples collected from the original sample sites to assess the importance of
temporal variations.
Comparison between analyses of samples from high order streams, representing large
drainage basins, and calculated average values for the drainage basins based on the
original sampling and analysis to assess the relationship between low and high density
sampling programmes.
2)
3 )
Field work in Zimbabwe took place in September and October 1992
POTENTIAL BENEFlTS
Mineral (trace element) deficiencies or imbalances in soils and forages are thought to be
responsible for low production and reproduction problems among grazing livestock in many
developing countries (McDowell e( al., 1983). Although extreme cases of trace element
deficiency or toxicity are often easily diagnosed from clinical or pathological characteristics,
the recognition of sub-clinical cases must rely on chemical and biological analyses. Similarly,
humans living for long periods in one area with a diet based primarily on locally produced
food and water, a situations which can be common in developing countries, may also suffer
from trace element deficiencies or excesses with similar difficulties of diagnosis. Trace
element related production problems are also recorded for crops (Thornton, 1983).
The identification of areas where trace element imbalances are a potential problem is clearly
beneficial, allowing remedial or preventative measures to be taken as necessary, and
permitting informed planning for development Recognition of areas with sub-clinical mineral
imbalance problenis in grazing livestock has generally been carried out through mapping soil,
3

forage, animal tissue or animal fluid compositions, techniques which are not only expensive,
but also may be impractical for the mapping of large areas (Appleton and Greally, 1992)
Appleton and Ridgway ( 1 993) discuss the application of regional geochemical mapplng in
developing countries to environmental studies and the value of high density stream sediment
survey data in the recognition of regions where trace element deficiencies might occur has
been demonstrated by Fordyce and Appleton ( 1 994) Stream sediment surveys are a cost-
effective means of delineating geochemical patterns of environmental significance but their
value would be enhanced i f i t could be shown that rapid, low density sampling programmes
also produce useful information
THESTUDY AREA
The Harare region of Zimbabwe, between latitudes 17"30'S and 18"OO'S and longitudes
30'45'E and 31°30'E, was selected for the study Covering 4400 km', the area had been
previously sampled at an average density of 1 sample per 2.7 km' in a geochemical survey
carried out between 1982 and 1986 (Dunkley, 1987). Access is good and there is strong
geochemical contrast between the volcano-sedimentary rocks of the Harare Greenstone Belt
and the surrounding granites and granitic gneisses (Fig I ) . The earlier geochemical survey was
based on the <I77 pm fraction of stream sediments, analysed for C O , Cu, Li, Mn, Ni, Pb and
Zn by atomic absorption spectrometry following digestion with hot concentrated hydrochloric
acid for one hour. Approximately 40% of the samples were also analysed by XRF for As, Ba,
Sn, Ta and W.
COMPARISON OF DRAINAGE SEDIMENT AND SOIL AS SAMPLING MEDIA FOR
ENVIRONMENTAL GEOCHEMICAL SURVEYS.
Study mea
A drainage basin having an area of 2-3 km', in an area underlain by granitic gneisses, was
chosen for the investigation (Fig 2) Farming in the basin is not intense and the soils are
unlikely to have been affected by large scale additions of fertilisers or anirnal feed
supplements
4

1 7
Field methods
The basin contains two stream sediment sites sampled as part of the original high density
survey These sites were resampled, one additional site and a site representing the full 2-3 km2
of the basin were also sampled Sol1 samples were taken along the interfluves, a total
1 ,- Pro r e r o z o I c rn a f i c I n t ru s iv e s
Z S e l b v 'Matrc Igneous E v e n t -Fol iated Torial i te - Granodiorite 1 Sesornbl -Suite c 2 68-2 62 Gd) and in jec t ion ynelsses
- ~ . Late G r ~ n i t e s I C h i l i m a n r i Sui te c 2 6 Gal
I
U Harare: ci ty centre
Passstord Format ion ( fe ls ic 1 ; m e t a v o l c J n i c s ) + Mt Harnpden , ! l F o r m a t i o n r rnetasediments)
! ' ' A r c t u r u s Formntion. 1 'metabasa l ts I ' ' i - - l 1:::::::Ilron # . . . I M a s k Formation: i:.:::::/ fetsic rnetavolcanlcs
kl Hara re
Bel t b Greenstone
0 5 1 0 1 5 10 2 5 K m I I
D G n e i s s l c basement

of 24 sites being chosen to give a relatively even coverage of the flatter lying part of the
catchment (Fig 2) Hillslopes, where soils are very th in and the potential for agricultural use
very limited, were not sampled Soils are generally shallow with a poorly developed profile
and over much of the area sampled had been tilled for subsistence agriculture
- Road
Soil sample
,
I \ I I \ I \
.
1 k m I
9
N
t M
17 :{,5'
Streani sedinr enls
Streams in the area were dry at the time of resampling and sieving was carried out in the field
using nylon sieve cloth held in a wooden frame Two types of sample were taken at each site,
one of <2 mm material and the other of < I77 pm sediment A t the site representing the whole
6

drainage basin (CI/SS/I, Fig. 2), two samples of c l 7 7 pm sediment were collected as a
check on reproducibility. Each sample was collected by making up a composite of sub-
samples from 5-10 sites along a 10-20 m stretch of the stream bed centred on the nominal
sample location.
Soils
Soils were also sieved in the field, two size fractions "eing collected using the same
equipment as for stream sediments. At each sample location five sub-samples were taken and
composited to make one full sample, The sub-samples were collected from a central site and
four other sites, each at a distance of 5 m from the central site and forming the corners of a
square. A small pit was dug at each site, 20-30 cm deep, and material collected from B
horizon soil, although in most cases distinct horizons were difficult to recognise.
Analytical methods
Both soil and stream sediment samples were analysed in the BGS laboratories by ICP-AES
for CO, Cu, Fe, Mn, N I , Pb and Zn after digestion for one hour i n hot concentrated
hydrochloric acid A comparison of analytical results and recommended values (RV) for three
reference materials is given in Table 1 and shows the good agreement between the two sets
of data Detection limits for the analytical method also are shown in Table I
("6/6) Mn Fc Zn cu Pb C O Ni GXR 3 24366 20.05% 230 1s IS 63 64 RV 22308 10.000/0 207 18 IS 43 60
GXR 5 RV
GXR 6 RV
Det. Limit
247 3,24?4 310 3.39%"
226 6.24% 007 S.S8%
I 0.0002(%
47 3 74 <I0 27 66 49 3 54 21 30 75
JS 78 I l l 18 28 18 66 101 I4 27
5 2 I0 3 3
TABLE 1 : Comparison of dcrerniincd and rcconinicndcd valucs (RV) for intcniniional rcfcrcncc materials (Polls ct al. 1092).
7

Results
In Table 2 element concentrations in stream sediments 21 12R, 21 12RM, 21 13R and CI/SS/l
are compared with mean soil values for subsets of soils which are considered to lie within the
respective catchment areas. The full dataset i s tabulated in Appendix I . In computing mean
values, concentrations below the detection limit have been given a value of half the detection
limit.
<2mm soil mean for wholc basin <2mm CI/SS/I
<2mm soil mcan for 2 1 12R <2mm 2112R
<2mm soil mean for 2 1 13R <2mm 2 I 13R
< I77 mic. soil mean for whole basin <I77 mic. CI/SS/IA <I77 mic. Cl/SS/IB
<I77 mic. soil mean for 21 12R <I77 mic. 21 12R
<I77 mic. soil nican for 21 12RM 1177 mic. 21 12RM
<I77 niic. soil mcan for 21 13R <I77 mic. 21 13R
29 1 66
276 63
38 I 96
5 5-1 27 I 31 I
550 1 1 1
596 I86
830 155
Mn Fc Zn cu Pb CO Ni No. 0 81% 14 6 12 5 12 24 0.35%
0.72% 0.2 3 !A0
0.87% 0.68%
1 . 3 3 O / O
I .88% 1.85%
1.24% 0.38%
1.39?4" 1 .JO'%,
1.55% 1.52%
5
14 5
15 17
25 28 29
25 I 1
27 23
30 39
3 <I0
5 12 2 <I0
5 14 6 14
8 27 7 27 7 30
8 29 3 21
9 29 6 31
9 35 13 46
<3
4 <3
6 2
9 7 4
8 4
1 0 J
12 6
4 1
8 I I 234 1
39 3 9 1
14 24 13 I 9 1
15 1 1 S I
15 17 9 1
14 3 13 1
TABLE 2: Comparison of nican valucs for within-catchnicnt soils with values for thc cquivalcnt stream sediment. Values in ppm esccpt for Fe.
2 nini mater'ral
Values for Mn and Fe are significantly lower in the stream sediments than in the soils for
CI/SS/I and 21 12R This is generally reflected in the other elements with the exception of
N I in 21 IR which is extremely high Although Mn and Fe are also lower in stream sediment
2 I 13R, the differences from the soil values for other elements are not pronounced Again N I
is an exception, but in this case the soil value is higher The explanation for these differences
8

may be that the soils contain a higher proportion of very fine-grained material than the stream
sediments. In the latter, fine material will have been washed out at times of stream flow.
Coatings of Mn and Fe oxides on the surfaces of clay minerals and silt particles are known
to scavenge other metals (Watters, 1983) and thus sediments with low fines contents will have
correspondingly low metal values. The large variations in Ni content are more difficult to
explain and require investigation beyond the scope of this study.
-1 77 pni matenal
The selection of a narrower size range through sieving eliminates most of the effects of
natural processes and overall there I S much closer agreement between the data for soils and
stream sediments in this size fraction Manganese concentrations are consistently lower in the
stream sediments, but Fe values are variable Given the degree of analytical variation to be
expected at the relatively low concentrations recorded, i t can reasonably be said that for CO,
Cu, NI, Pb and Zn there i s close correspondence between the soil and stream sediment
datasets
Conclusions
In the <I77 pm material the geochemistry of stream sediments compares well with that of
soils and for this terrain type stream sediments could be used with confidence as a sampling
medium for environmental studies. The correspondence between soil and stream sediment
geochemistry is less good in the <2mm fraction but both reflect the low trace element
concentrations to be expected from an area underlain by granitic gneisses.
ASSESSMENT OF THE RELATIVE USEFULNESS OF HIGH A N D LOW DENSITY
GEOCHEMICAL SAMPLING FOR THE PRODUCTION OF ENVIRONMENTAL
GEOCHEMICAL MAPS.
For this part of the investigation, the Harare region was divided into drainage basins with
catchment areas of SO to I00 km' using I :250 000 and I :SO 000 topographic niaps. I n practice
the area of the basins varied between approximately 45 and 135 km' (Fig. 3 ) and because of
the drainage pattern large tracts of the region were not included within basins of this size.

Field methods
Samples were collected from the major streams at the exit point from the selected catchment
basins. The general techniques and equipment used were the same as described in the previous
section. Stream conditions varied and some samples were wet sieved on site, some dry sieved,
and some collected in bulk for later drying and sieving in the laboratory. No attempt was
made in this investigation to determine the effects of different sample collection and sieving
methods, but earlier work in NE Zimbabwe (Ridgway, 1983) showed that differences in
chemistry between wet and dry sieved samples were minimal. Only c l 7 7 pm material was
taken and each sample was collected by making up a composite from I O - 15 sites along a 50
m reach of river bed spanning the nominal sample location. At 6 locations the samples were
collected in triplicate and at a seventh location duplicate samples were taken.
I

Sixteen sites from the earlier high density survey were resampled and the corresponding
stored sample splits retrieved from the sample archive in the Geological Survey Department,
Harare.
Analytical methods
After drying and disaggregation as necessary, all samples and sub-samples were analysed
using the same methodology as for the soil-stream sediment comparison study already
described .
Results
For comparison purposes all concentrations below the detection limit have been assigned a
nominal value of half the detection limit.
1) Test I : Comparison betiv een original analyses and reanalysis of splils of original santples
Table 3 shows the results analysis of original samples during the previous survey (0) and
reanalysis of these samples in the present study (ra) along with Pearson product-moment
correlation coefficients (o/ra). Although absolute values vary considerably the correlation is
generally good, only Pb having a Pearson coefficient of less than 0.9. The lower correlation
coefficient for Pb reflects the low concentration of this element which means that
determinations must be carried out near the detection limit, thus leading to poor precision in
the results (Thompson and Howarth, 1973). Having established that the agreement between
the original and new analytical data is good, i t is thus reasonable to examine how analysis of
replicate samples from the original sites compares with the original data.
2) Test 2: ('oniparison of original and new anc11ysc.s of stored sample splits \ Y ith nncI1y.sc.s of
new satnplcs collected.frotti the otiginal saniplc siles
Table 3 again shows the Pearson coefficients for this comparison. Results for resampled sites
are designated as rs. The level of correspondence is markedly lower than for Test I , and is
particularly poor for Zn. Pearson correlation coefficients (ohs) are less than 0.9 for all
elements except Mn and Pb. Results are very similar for the comparison between reanalysed
splits and recollected samples (rdrs). The discrepancy between the original data and those for
the resampling exercise could be attributed to temporal variations Ridgway and Dunkley

0 0 0 0 0 0 0 0 0 0 0 0 0 0 0 0 0 C ~ N b o o m o o o w o m o o ~ ~ m O N ” m N w N m r . m m - z z z .--U-*
0 m o - 5 m O Z 0
m w 0
r, *z 0
VIm
1 2

0
L e 5 e,
0 *
0
2 CA
2 3 e s s
e e E
0
CA L C
e
0
.-
.E 8 U m
0
CA 0
CA .-
B - P E a 2 L
E 5 e a 0 0 a 0
B a 9 c dJ
L L .d
m 5
v)
2
E r3 C N
0
m u t
LL
c e 2 C
N
0 z I 1
C 2
13

( 1988) suggest that seasonal variations may be compensated for by using correction factors
based on element-Fe oxide ratios and an attempt to do this is shown in Table 4. In Table 4,
combined totals of Fe and Mn in original samples and replicate samples recollected from the
original sites have been used to adjust the concentration levels for the replicate samples. This
results in an improvement in correlation coefficients between original and replicate values for
Zn, in particular, and CO, but gives no improvement for Cu, and Ni, and much poorer
correlation for Pb. The discrepancies, however, could also relate to difficulties in relocating
the original sites. At several of the sites the stream channel was poorly defined and may have
been disturbed by agricultural practices, while at one location a dam had been built upstream
of the original sampling point. If only data for sites where there was a well defined stream
channel are considered (Table 5 ) , the correlation coefficients improve dramatically with only
Zn having a Pearson coefficient (ohs) of less than 0.9. This indicates that temporal variations
are of lesser importance than accurate resampling in accounting for discrepancies between
original and replicate sampling datasets and suggests that geochemical patterns arising from
the original survey and a new survey would be very similar, even when absolute values differ.
3) Test 3: Comparison betw een analyses of satnplcs froin high order strcattr s and cottr pirted
valrres for the drainage basins based on the original sampling and analysis
Given that there is compatibility, at least in a relative sense, between the original survey
results and those from the resampling exercise, the outcome of this third test can now be
examined.
Data for replicate sampling on the same day in the major streams (Table 6) demonstrate that
the sampling methodology is sound and provides reproduceable results. In Table 7, the
analytical results from samples collected at the mouth of each large catchment basin are
compared with the arithmetic mean, geometric mean and median of all the samples from low
order streams within that basin. Pearson correlation coefficients show that the arithmetic mean
performs as well as, or better than, the geometric mean or median as a measure of the overall
composition of the drainage basin. The coefficients are, with the exception of that between
major drainage sample and arithmetic mean Pb, lower than the correlation coefficients
between original and recollected samples from low order streams shown in Table 5 . In the
cases of Mn and Ni the correlations are very poor, the recorded coefficients not being
14

significant at the 99% level. The implication is that, in the Harare area, either samples from
high order streams are not truly representative of the geochemistry of the upstream catchment
area, or mean values of the low order stream samples are not representative of the drainage
basin as a whole.
The reasons for the poor correlation between the chemistry of samples from high order
streams and measures of the overall geochemistry of samples from low order streams are not
clear. Plots of major stream sample against arithmetic mean for individual elements (Fig. 4
a and b) show that some major basins persistently plot off the main trend (e.g. 6, 7, 8, 10, 12,
16 and 18). Tables 8 and 9 summarise the geology of the 25 drainage basins studied in terms
of major rock types and formations. There is no obvious common factor linking the most
aberrant basins (6, 7, 8, 10, 12, 16 and 18). Basin 10, at 45 km ’, is one of the smallest
sampled, while basin 6 is the largest at approximately 135 km’. Basins 7 and 8 have a
relatively simple geological make-up, each containing only 2 rock types, whereas 6 and 18
are more complex with a variety of rock types and formations within their confines. Other
basins of simple (e.g. 13 and 21) or complex (e.g. I and 5 ) geology lie on the general trend
defined by scatter plots of, for instance, high order stream sample against mean value of low
order stream samples from the same drainage basin (Fig. 4 a and b).
In the case of basins 7 and 10 an examination of the geological map of the region shows that
the high order stream sample site lies on a rock type which is of relatively minor importance
in the basin as a whole, but which probably makes a major contribution to the composition
of the sediment at that site. The bedrock in both basins is predominantly of granitic
composition, but the sample sites lie on more basic lithologies producing, for example, a Ni
value for basin 10 of 248 ppm against mean, geometric mean and median values for the
whole basin of 24, 10 and 8 ppm respectively (Table 7). This discrepancy is far higher than
can be accounted for by differences in the analytical method and must arise from the local
lithological influence. Such a simple explanation cannot be advanced for the other aberrant
basins where a variety of factors may have influenced the situation (Hawkes, 1976; Rose ci
al., 1979). Careful choice of sample site on the basis of geology might help overcome this
type of problem, but would not help i n areas of poor geological knowledge.

I 3000 00
250000 ~
. 200000 1
I I
5 8
I . 18
a8 20 8 1500 00
1000 00
0)
m 23 1 lrn'822
' 8 . ..: m
. 7 m 6 500 00 .. 000 1
0
160 00
140 00
120 00
6 10000 0 F 8000 3 6000
40 00
20 00
0 00 00
90 00
80 00
70 00
6000 0 a8 5000 (71
4000 ' 3000
20 00
10 00
0 00 00
1 , - , - +---.+-
500 1000 1500 2000 2500 3000 3500 4000 4500 SO00
Bulk Mn
.
18 .. .. 8
1 , - - + - .- -+---+-- 1
200 400 8 0 0 800 1000 1200 1400 160.0 Bulk Zn
.
. .
1 1 - + +-------l
20 0 40 0 60 0 80 0 1000 1200 1400
Bulk Cu
I6

50 on 4 5 00
40 00
35 00 n n 3000 0 p 25 00
4 P 2000
15 00
m 8
w-• I R . w
8
I 2 G - I I I 1000 ,
500 ~
0 0 0 I I , . , _. --. 0 10 20 30 40 50 60 70 00
m 8 I 0 L.
I -
Bulk Pb
50 00
45 00
3000 0 p 2500 e g 2000
15 00
10 00
5 00
8
20
I 8 8
m 8 L
w 8 .
10 m-
- a 8 w
m -
a
19
1 t I - * - - 000 1
0 0 1 0 0 200 300 4 0 0 5 0 0 600 700 Bulk CO
80 00
70 00
60 00
5 5000
20 00
10 00
L
12 - 8 +- 6
* 80.0
' 10
f I - + ' 8 m. 0 00
50 0 100 0 150 0 200 0 250 0 0 0 Bulk NI
FIGlJIIE 411: Scattcr plots of arithmetic niciln (a\ criigc) clcnicnt values for low order strciini samples against
thc high ordcr strcani sample rcprcscnting thc whole droinugc \xisin: l'h, CO and N I .
1 7


6 31C2/4 7 31c2/5 8 31A4/1 9 31C2/6
10 31C2/7 11 31Dl/ l 12 31C4/1 13 31C4/4 14 31C3/1 15 31c2/1 16 31C2/2 17 31C2/3 18 31Cl/ l 19 30D214 20 30D4/4 21 30D4/3 22 30D4/2 23 3OD215 24 30D4/1 25 30D3/1
3837 496 4785 428 1447 860 700 364
I120 693 882 1404 846 582 547 337 224 290 752 624
1863 1161 1573 1988 2836 2003
987 1450 204 309
1055 1295 2901 1118
558 586 992 568 748 469
Samplc Mn Mn m Mn gm Mn md 1 30D2/3 1030 1981 793 660 2 30D2/2 2867 2638 2126 2540 3 30D2/1 2401 1681 1003 930 4 31C1/2 1081 928 717 680 5 31C1/3 1501 2157 1513 1670
382 345 377 375 755 810 333 310 527 650 949 950 367 290 273 295 224 210 371 260 888 940 459 1520 112 1040 018 970 251 240 073 I090 874 810 462 395 523 560 412 380
Pearson 0.2639 0.2903 0.2849 99% significance value = 0.4686
Sample 1 30D2/3 2 30D2/2 3 30D2/1 4 31c1/2 5 31c1/3 6 31C2/4 7 3 IC2/5 8 31A4/1 9 31C2/6
10 31C2/7 1 1 31Dl/ l 12 31C4/1 13 31C4/4 14 31c3/1 15 31C2/1 16 31C2/2 17 31C2/3 18 31Cl/ l 19 30D2/4 20 30D4/4 21 30D4/3 22 30D4/2 23 30D2/5 24 3ODJ/l 25 30DY1
Pcarson
Pb P b m Pbgm 5 6
I6 8 14 7 13 5 40 20 45 27 76 48 52 25 25 21 25 1 0 38 10 38 24 21 2 0 20 7
5 I4 I4 5 12 10 1 1 10 29 21 22 I4 19 12 12 9 I 1 12 7 9
5 8 5 4 5 5 3
I6 25 35 23 18 5 7
22 18 4 4 3 7 9
19 13 10 8
1 1 9
Pb md 5 4 8 6 3
17
35 24 20 6
10 20 2 0 10 2 4 7
I I I9 I 0 I 0 8
I0 0
28
0.8777 0.8525 0.8750 99Y0 significancc value = 0.4686
Zn Zn 111 Zn gni Zn nid 48 57
157 I48 54 5 5 57 37 88 65 53 26 56 30 78 45 47 25
122 33 72 66 78 19 60 21 so 20 97 35 70 45 36 73 80 82 66 57 30 I9 72 61 72 47 49 35 38 33 30 30
41 I 1 0 48 34 61 23 26 41 22 28 50 17 18 17 21 37 62 63 52 17 52 45 33 32 29
37 88 47 37 65 21 27 40 23 26 44 17 17 18 18 43 69 62 48 15 45 43 3 3 34 3 0
CO 22 76 43 36 48 36 44 53 23 46 33 27 14 4
37 67 23 43 36 6
27 75 2 1 32 26
0.60 13 0.5428 0.428 I
C o m Cogm Comd 21 16 49 44 27 20 I6 13 32 29
7 5 6 5
12 8 7 6
12 8 28 21
7 3 4 3 4 3
18 6 33 25 28 23 24 I 0 3% 26 4 3
20 18 23 I9 I4 13 17 16 I6 15
15 47 23 14 31
4 5 8 6 0
2 0 2 3 3 6
31 25 20 22 4
I8 20 13 17 I5
0.6085 0.5926 0.6 147
CU 30
I20 49 4 0 74 34 24 85 31 72 87 54 22 13 89
100 30 30 66 37 46 77 40 32 26
Cu in Cu gni Cu md - 33 22 88 76 51 33 28 21 5 1 46 15 8 7 6
43 18 17 13 24 16 50 35 14 5 8 4 6 5
28 I 1 52 36 50 38 42 33 54 50 6 4
37 33 53 47 26 24 25 24 22 22
24 75 32 2 0 52
7 6 8
12 19 46
3 3 4 9
45 56 38 48
5 35 49 24 27 21
0.7234 0.6013 0.5341
Ni NI m 57 37 I41 70 63 45 29 23 76 57 47 I3 44 10
105 1 1 42 9
248 24 57 5 5 52 16 19 4 6 6
105 41 143 73 39 50 26 35 63 40 I5 4 44 35 58 38 44 28 34 32 4.7 5 1
Nigm Ni md 28 31 62 65 34 38 17 17 53 57 9 9 8 9 9 9 7 7
1 0 8 36 47 10 9 3 3 4 4
16 1 0 49 75 43 57 28 28 33 32
3 3 3 1 34 3 1 20 26 27 20 31 45 38
0.3654 0.22 19 0.2299
TABLE 7 Comparison of arithnictic nicaii (in). gconictric nican (gm) and nicdian valucs (md) for a l l original survcy samples wllhm a major catchment u ith valucs for thc major drainagc saniplc rcprcscntlng thc total catchmcnt Pcarson corrclation coefficients bctwecn niqlor drainagc samplcs mid conipulcd \ alues arc also glvcn
20

Make-uD of catchments by lithological unit Catchmknt AF CT HF 1 30D2/3 9 7 3 2 30D2/2 27 1 1 1 3 30D2/1 14 0 1 4 31C1/2 10 1 0 5 31C1/3 64 I 0 6 31C2/4 1 32 0 7 31C2/5 0 35 0 8 31A4/1 0 14 0 9 31C2/6 3 10 0 10 31C2/7 2 2 0 1 1 31Dl/l 4 1 0 12 31C4/1 6 3 0 13 31C4/4 0 5 0 14 31C3/1 0 30 0 15 31C2/1 21 4 0 16 31C2/2 49 2 0 17 31C2/3 18 0 4 18 31Cl/ l 18 4 5 19 30D2/4 5 0 10 20 30D4/4 0 10 0 2 1 30D4/3 0 0 7 22 30D412 0 0 1 23 30D2/5 0 0 1 24 30D4/1 0 3 1 25 30D3/1 0 1 0 Total 251 166 44 Make-up of catchments bv bedrock Catchmcnt I 30D2/3 2 30D2/2 3 30D2/1 4 3IC1/2 5 31c1/3 6 31C2/4 7 31C2/5 8 31A4/1 9 31C2/6 10 31C2/7 1 1 31Dl/ l 12 31c4/1 13 31c4/4 14 31C3/1 15 31C2/1 16 31C2/2 17 31C2/3 18 31Cl/ l 19 30D2/4 20 30D4/4 21 30D4/3 22 30D4/2 23 30D2/5 24 30D4/I 25 30D3/1 Total
FP 0 0 2 0 5 0 0 0 0 0 0 0 0 0 0 0 0 0 0 0 2 3 0 0 0 12
f V 39 9 25 3
I I 0 5 0 0 0 7 0 0 0 1 0 17 27 0 0 3 4 6 2 6
165
GN 1 0 3 0 0 1 0 0 0 0 14 1 13 1 0 0 0 0 0 0 0 0 0 0 0 34
IM 1 8 25 3 12 0 5 0 0 0 0 0 0 0 0 0 0 0 0 0 1 0 0 0 0
5 5
GR 7 1 0 I 1
3 0 35 9 I 0 I 1 2 5
3 0 4 2 0 4 0 10 0 0 0 3 I
I57
PF 38
I 0 0 0 0 0 0 0 0 7 0 0 0 I 0 17 29
1 0 3 8 6 3 6
120
GT 2 0 3 33 9 16 0 0 1 8 0 13 0 3
23 9 6 7 3 0 0 3
21 3 I
164
SE 6 2 0 0 0 0 0 0 0 0 0 0 0 0 0 0 4 0 0 0 0 0 0 0 0 12
MD 0 0 0 7 5 4 0 5 0 I 1 1 0 0 0 0 0 I 1 I 0 1 4 0 1 0
42
ST 3 0 6 40 1 1 19 0 0 1 8 15 14 13 4 23 9 6 7 3 0 0 3
21 3 1
2 10
MI 6 2 0 0 0 0 0 0 0 0 0 0 0 0 0 0 4 0 0 0 0 0 0 0 0 12
TE 0 0 2 0 7 0 0 0 0 0 0 0 0 0 0 0 0 0 0 0 2 3 0 0 0 14
MV 9 27 14 10 64
1 0 0 3 2 4 6 0 0 21 49 18 9 5 0 0 0 0 0 0
242
PH 3 1 1 1 0 0 0 0 0 0 0 0 0 0 0 0 0 4 5 10 0 7 I 1 1 0 44
Total 67 5 0 48 54 95 52 40 14 14 12 27 23 18 34 49 60 49 63 19 10 13 15 28 I 0
872
Total 67 50 48 54 95 52 40 14 14 12 27 23 18 34 49 60 49 63 19 1 0 13 15 28 I 0 x
872
8
TABLE 8: Numbcrs of samples in major drainagc basins according to bedrock and lithological unit at thc saniplc site. Scc TABLE 9 for lithological unit and bcdrock codcs.
21

Basin 1
Unit Rock Basin Unit PF FV 2 IM AF MV AF HF PH HF SE MI CT CT GR SE ST GT PF ST GN IM FV
Rock Basin Unit Rock Basin Unit Rock Basin Unit FV 3 IM FV 4 ST MD 5 AF MV ST GN ST GT IM PH TE FP IM FV ST GR ST GT A€ MV ST MI AF MV CT GR CT FV HF PH IM
TE TE
Rock MV FV MD GT GR MD FP MD
Basin Unit Rock Basin Unit Rock Basin Unit Rock Basin Unit Rock Basin Unit Rock 6 ST MD 7 CT GR 8 CT GR 9 CT GR 10 CT MD
CT GR IM FV CT MD ST GT ST GT AF MV CT GR CT MD
AF MV AF MV ST GT ST GN
Basin Unit Rock Basin Unit Rock Basin Unit Rock Basin Unit Rock Basin Unit Rock 1 1 CT GR 12 ST GT 13 ST GN 14 CT GR 15 CT GR
AF MV AF MV CT GR ST GT ST GT PF FV ST GN ST GN PF FV ST GN CT GR AF MV ST MD CT MD
Basin Unit Rock Basin Unit Rock Basin Unit 16 CT GR 17 PF FV 18 HF
AF MV SE MI PF ST GT AF MV PF
ST GT AF HF PH CT
AF ST
Rock Basin Unit Rock Basin Unit Rock PH 19 HF PH 20 CT GR FV PF MD MD AF MV MV ST GT GR MD GT
Basin Unit Rock Basin Unit Rock Basin Unit Rock Basin Unit Rock Basin Unit Rock 21 TE FP 22 TE FP 23 PF FV 24 ST GT 25 ST GT
HF PH PF MD ST GT HF PH HF PH PF FV ST GT HF PH PF MD PF MD IM FV HF PH PF FV PF FV PF MD PF FV CT GR CT GR
Lithological Unit Rock Tqpc
Chilimazi-type Intrusions CT Sesombi-type intrusions ST Teviotdalc Event TE Selby Event SE Passaford Forniation PF Mt Hampdcn Formation HF Arcturus Formation AF Iron Mask Forniation IM
Dolerite Granite Granodiorite-Tonalite Gneiss and Migmatite Felsic Porphyries Mafic Intrusives Felsic Volcanics Phyllitcs Mdic Volcanics
MD GR GT GN FP MI FV PH MV
TABLE 9: Breakdown of major drainagc basins bv litliological unit and rock typc
22

SUMMARY A N D DISCUSSION
From the foregoing, it can be concluded that:
1 ) For granitic terrains, stream sediments from low order streams are reasonably representative
of the soils of their catchment basins, at least where the soils are relatively undisturbed by
agricultural practices. There is reason to believe that the same will hold true for other bedrock
lithologies as has been demonstrated by Appleton CI al. (1992)
2) In the Harare area, the drainage pattern is such that the sampling of drainage basins with
areas of 45-135 km' leads to an uneven distribution of sample sites and leaves large tracts of
land not represented by a geochemical sample (Fig. 3) . This situation will occur almost
anywhere if samples from high order streams draining large catchments are used as the basis
for a geochemical survey.
3) Within the drainage basin size range given under (2), the geochemistry of a sample from
a high order stream is not always representative of the overall chemistry of the upstream
catchment area as measured by the mean, geometric mean or median of samples from low
order streams within the basin.
Although it was not possible in the course of this investigation to determine the optimum size
of drainage basin for a meaningful low density survey, the results are similar to those of
previous workers. Garrett and Nichol ( 1967) conducted a regional geochemical reconnaissance
survey of eastern Sierra Leone at a mean density of 1 stream sediment sample per 180 km'
but used catchment basins of only up to 40 kin'. They considered that samples from this size
of basin "had a composition related to the material within the catchment area" and also found
that there was marked similiarity between stream sediment and soil geochemistry. In Zambia,
Armour-Brown and Nichol ( 1 970) found that stream sediment samples from catchments of
up to 26 km' displayed a more constant relationship to the geochemistry of the upstream
catchment area than those from larger basins Moreover, i t was not possible to obtain an
adequate sample density from drainages with large catchments Similarly, Reedmaii and Gould
(1970) were able to recognise meaningful geocheniical patterns using a density of 1 sample
23

per 195 km' based on sampling drainage basrns of 26 km' They conclude by posing the
question of how the results of taking samples from major rivers with upstream catchments of
195 km' would compare with their findings The present study suggests that such sampling
of major rivers would not give useful results All the studies mentioned above refer to African
terrains, but the findings are supported by the work of Baldock ( 1 977), who successfully
located porphyry copper deposits in the Peruvian Andes using a sample density of 1 per 25
km2 and suggested that at least in areas of active erosion, reconnaissance geochemistry might
rely on sampling medium sized (3rd and 4th order) streams
The results of this study suggest that there are no short cuts to the provision of reliable
regional geochemical data. Sampling of low order streams with small catchment areas will
provide a more even distribution of sample sites and more complete coverage than sampling
high order channels. Small basins are more likely to be lithologically homogeneous than large
basins and the geochemical samples are thus more likely to be truly representative of the
upstream catchment. As far as possible the size of catchment and sampling density should be
chosen to reflect the scale of lithological change. Large areas of homogeneous geology can
be sampled at a lower density than more complex regions. Collecting from smaller basins will
lead to larger numbers of samples and the effects of aberrant results on the dataset, whether
through sampling or analytical error, are therefore diminished. Small streams also are
physically easier to sample than large ones, particularly in regions where flow is perennial.
CONCLUS IONS A N D RECOMMENDATIONS
1) The sampling of low order streams provides geochemical data which are closely related
to the geochemistry of undisturbed soils in the catchment basement.
2) The geochemistry of sediment samples from high order streams with drainage basins of
over 45 km' may not be representative of the overall chemistry of the upstream catchment
area.
3 ) Regional geochemical surveys for environmental or exploration purposes should be based
on as low an order of stream as possible. I t is recommended that, unless further studies
24

establish the validity of sampling larger catchments, the drainage basin size should not exceed
25 km:.
4) Wide-spaced sampling for international geochemical mapping should not be based on high
order streams with large drainage basins. More reliable results will be obtained from evenly
distributed samples from basins of less than 25 km'.
ACKNOWLEDGEMENTS
The cooperation and assistance of Dr J.L. Orpen, then Director of the Geological Survey
Department, Harare, and his Deputy Director, Mr S. Ncube, are gratefully acknowledged.
Assistance in Zimbabwe was also received from Drs P. Lowenstein, M. Armstrong, P. Frey
and P. Pitfield. Mr 0. Chihotu was an invaluable help in the field along with Mr B. Dick
Comment and criticism from Drs J.D Appleton and J.W. Baldock helped improve the text of
the report. Funding for the investigation came from the Overseas Development Administration
of the Britsh Foreign and Commonwealth Office.
REFERENCES
AGGETT P J , MILLS C F, PLANT J A , SIMPSON P R , STEVENSON A , DINGWALL-
FORDYCE I and HALLIDAY C F 1988 A study of environmental geochemistry and health
in north east Scotland In Geocheniistry and Health Proceedings of the Second International
,SyYniposiiitti (ed I Thornton), pp 8 1-9 1 , Science Reviews Ltd , Northwood, England
APPLETON J.D. and GREALLY K.B. 1992. Environmental Geochemistry R&D Project: a
comparison of the trace element geochemistry of drainage sediments and soils in eastern
Bolivia. British Geological Sirrvey Technical I(eix)tl WCl92167.
APPLETON J.D. and RIDGWAY J. 1993. Regional geochemical mapping in developing
countries and its application to environmental studies. Appl. (;cochcm Suppl. Issue No. 2,
103-1 10.

ARMOUR-BROWN A . and NICHOL I 1970 Regional geochemical reconnaissance and the
location of metallogenic provinces /<con. Geol , 65, 3 12-330.
BALDOCK J. W. 1977. Low-density geochemical reconnaissance in Peru to delineate
individual mineral deposits. 'l'rans. lnstn Min. Metall. (Sec/. B : A p p l . earth .x i . ) , 86, B63-72.
BRITISH GEOLOGICAL SURVEY 1990 Negional (kochemical A tlas: A e y l l . Keyworth,
Nottingham. Brit i sh Geological Survey .
BRITISH GEOLOGICAL SURVEY 199 1 , Regional Geochemistty of the East Gmmpian
A rea. Keyworth, Nottingham: British Geological Survey
BRITISH GEOLOGICAL SURVEY 1992. Kegional Geochenristry of the Lake District and
adjacent areas. Keyworth, Nottingham: British Geological Survey.
DUNKLEY P.N. 1987. A regional drainage geochemical exploration survey of the Harare
area, Zimbabwe. Hritish Geological Strwey I'cchnical Report MPl07l10.
FORDYCE F.M. and APPLETON J.D. 1994. Draft report on stream sediment, soil and forage
chemistry as indicators of cattle mineral status in north-east Zimbabwe British (;eological
Sirwey Technical I<eport WCl9413R.
FORDYCE F.M., GREEN P.M. and SIMPSON P.R. 1993. Simulation of regional
geochemical survey maps at variable sample density. J (;eochetn. l:'xplor., 49, 161 - 175.
GARRETT R G and NICHOL I 1967 Regional geochemical reconnaissance in eastern Sierra
Leone 'l'rans Instn Min Metall (Sect H A p p l cnrth s c i ) , 7 6 , B97- 1 I2
HAWKES H.E. 1976. The downstream dilution of stream sediment anomalies. .I. (;cochent.
h'xplor. 6 , 345-358.
MCDOWELL L.R., CONRAD J H , ELLlS G L and LOOSLI J K (1983) Mrncra1.s for
26

grazing nmiinanls in rropical regions. Bulletin Dept. Animal Science, University of Florida;
Gainesville, Florida.
PLANT J.A. ( 1 983) Regional geochemical maps of the United Kingdom; environmental and
economic applications. The Mercian (;eologi.s~ (Nolfingham), 9, 75-87.
PLANT J.A. and MOORE P.J. (1979) Regional geochemical mapping and interpretation in
Britain. Phil. Trans. Roy. Soc. Lond. B288, 95-1 12.
PLANT J A and STEVENSON, A G (1985) Regional geochemistry and its role in
epidemiological studies In Trace tilements in M a n and Animals ‘I’IiMA 5 (eds C F Mills,
I Bremner and J K Chesters), pp 900-906 Commonwealth Agricultural Bureaux, Farnham
Royal, UK
POTTS P.J., TINDLE A.G. and WEBB P.C. 1992. Geochemical Reference Material
Conryositions. CRC Press: London.
REEDMAN A.J. and GOULD D. 1970. Low sample-density stream sediment surveys in
geochemical propspecting: an example from northeast Uganda. ’I’rans. Insrn Min. Merall.
(Sec!. R: A p p l . earth sci . ) , 79, B246-248.
RIDGWAY J. 1983. IGS Zimbabwe project Geochemical exploration - results of an
orientation survey and organisation of the sampling programme. IGS Overseas Division report
83/14, 68p.
RIDGWAY J. and DUNKLEY P.N. 1988. Temporal variations in the trace element content
of stream sediments. examples from Zimbabwe App1. Gcochem ., 3, 609-62 I
RIDGWAY J., APPLETON J.D. and GREALLY K.B. 1991. Variations in regional
geochemical patterns - effects of site selection and data-processing algorithms. 7’ran.s. Insin
Min. Mclall. (Sec!. H : A p p l . earlh x i . ) , 100, B 122- 129.
27

ROSE A.W., HAWKES H.E. and WEBB J.S. 1979. (;eochenii.srry in Mineral Exxploralion.
Academic Press: London.
THOMPSON M. and HOWARTH R.J. 1973. The rapid estimation and control of precision
by duplicate determinations. A nalysr, 98, 153- I60
THORNTON I. ( 1 983). Geochemistry applied to agriculture. In Thornton, I . (Ed.), Applied
Environmental Geochemistty. (p. 23 1-266). London: Academic Press.
WATTERS R.A. 1983. Geochemical exploration for uranium and other metals in tropical and
subtropical environments using heavy mineral concentrates. J Geochem. /<xp/or., 19, 103- 124.
WEBB J.S., & ATKINSON W. J. (1965) Regional geochemical reconnaissance applied to
some agricultural problems. Nulirre (Idondon), 208, 1056.
28

APPENDIX 1 : Tabulated data for the soil/stream sediment comparison
Element values are in ppm except for Fe, which is in weight %
29

Appendix 1
Sample Mn Fc z I1 c 11 Pb C O Ni 207 0,63?4) <2mm 1
<2mm 2 <2mm 3 <2mm 4 <2mm 5 <2mm 6 <2mm 7 <2mm 8 <2mm 9 <2mm 10 <2mm 1 1 <2mm 12 <2mm 13 <2mm 14 <2mm 15 <2mm 16 <2mm 17 <2mm 18 <2mm 19 <2mm 20 <2mm 21 <2mm 22 <2mm 23 <2mm 24
<177mic. 1 <177mic. 2 <177niic. 3 < 177mic. 4 <177mic. 5 < 177mic. 6 < 177mic. 7 < 177mic. 8 < 177mic. 9 <177mic. 1 0 <177mic. 11 <177mic. 12 <177mic. 13 <177mic. 14 < 177niic. I5 <177mic. 16 <177mic. 17 <177mic. 18 <177mic. I9 < I77mic. 20 < I77mic. 2 1 < 177mic. 22 <177niic. 23 <177mic. 24
<2mm CI/SS/I <2mm 2112R <2mm 2 1 13R <I77 niic CI/SS/IA < I77 mic C 1/SS/ 1 B < I77 mic 2 1 12R < 177 niic 2 1 12RM <I77 mic 21 13R
I69 345 I91 172 230 346 453 49 1 544
350
230 209 126 173 239 5 13 229
388 22 1 225
325 339 578
35 1
729 1182 799
1069 82 1 734 722 523 397 237 445 515 956
262 5 16 322 326
66 63 96
27 1 311 I l l I86 IS5
398
383
158
388
384
3 x6
0.60% ( ) , 98%) 0.69%) O,S6%> 1.73%
0.79% 1.59% 0.86% I .06%
0.62% 0.540/0 0.79o/u 0.50% 0.40% 0.74% 0.86YO 0.51%
1.02% 0.67% 0.55%
0.96% I .06% 1.37% 1 .16% 0.92o/u 2.92?40 I .52% 1.76% 2.24% 1.62% 1.73Y" I .43% 1.01%
I ,36% 0.75% 0 , O( 1 x 1
I .-I 3% 1 .4 7% 0.79% 1 . 5 9% I .2 2%
0.78"o
0 . 3 5% 0 . 2 3'%l
0. 68'%
I .x5'::> 0.3806 1,-+0?4) I . 5 2 (%,
o.ns%
o.xo%
I .on%
1.07%
o,nm1
I . xr%,
9 12 I 0 12 8
27 I4 1 1 23 14 15 15 I 0 8
I9 15 8
I4 16 I0 25 I9 9 6
16 2 1 28 21 15 50 27 3 5 43 32 24 3 3 20 I5 13 22 I8 29 26 I I 37 20 I4 I5
5 5
17 2% 2 0 I I 2 ; 7 0
4 4 S 4 4
I I 5 6
1 1 5 6 4 5 4 5 5 3 3 7 3
10 I I 5 3
4 5 7 6 6
18
12 18 1 1 10 8 7 5 8 5 5
I I I 1 4
I3 7 3 3
3 2 6 7 1
6 13
x
S 5
12 5 S
14 14 I6 23 I8 5
23 12 10 IS 15 5 5
26 5
22 13 I 0 5
IS I 0 28 20 I9 32 29 47 42
37 44 22 I9 3 0 17 17 22 43 1 1 38 23 I6 13
< I 0 <I0
I-+ 27 3 0 21 3 1 46
48
2 2 6 2 2 9 5 7 6 5 7 5 6 2 2 5 5 4 7 2 4
10 4 3
6 5 9 8 6
14 I 0 18 14 12 13
12 9 5 4
I I 7
I8 4 7
12 7 2
<3 ( 3
2 7 4
.r3 4 6
n
4 4 0 5 4
19 I 0 0
9 7 6
5 7
I 0 7 8 0 7
12 6
17 12 5 2
0 7 9 6 9
3 3 10 23 18 17 15 1 1 13 I 0 12 8
13 4 0 18 7
17 I I 6 7
4 2.34
0 13 9 5 0
13
n
3 0

U
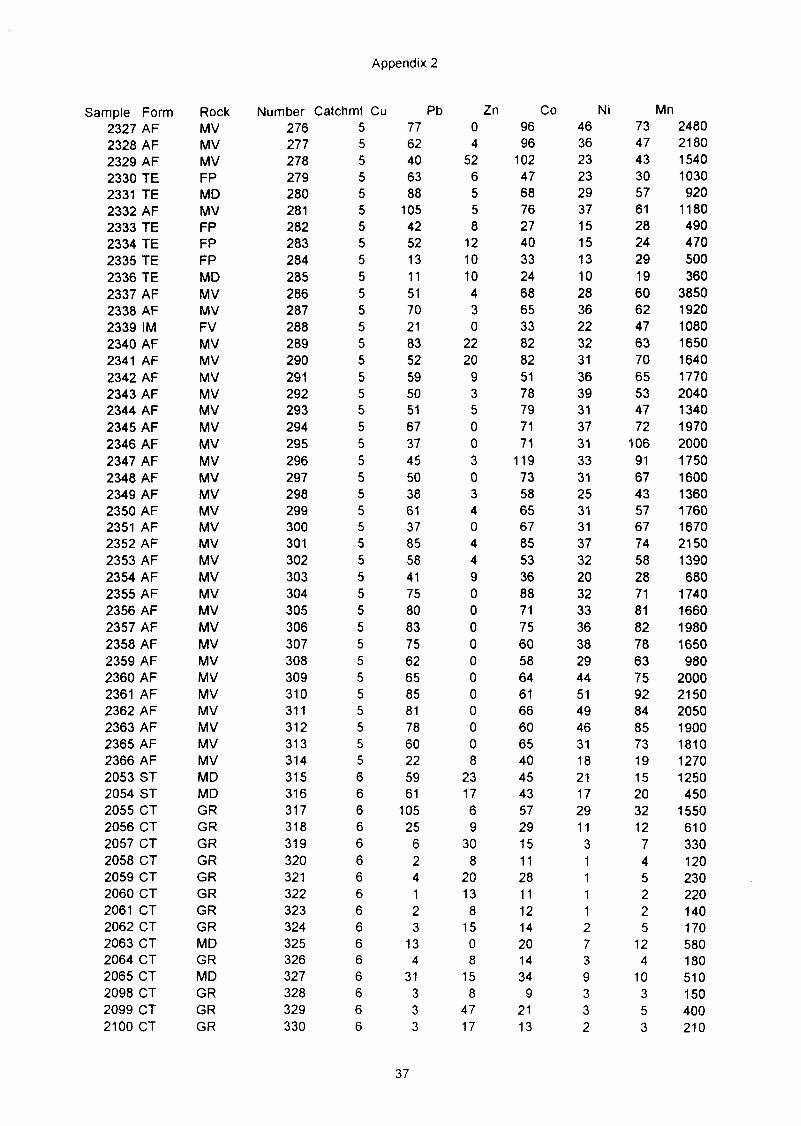
APPENDIX 2: Tabulated data for the original geochemical survey using low order streams
See TABLE 9 for key to codes for FORM = Lithological Unit and ROCK = Rock Type
Catchmt = catchment number shown in TABLE 7. Element values are in ppm.
3 1

Sample Form 1141 PF 1156 AF 1157 AF 1158 PF 1159 PF 1160 PF 1162 HF 1163 PF 1164 PF 1196 PF 1197 PF 1198 PF 1199 PF 1200 PF 1201 PF 1202 HF 1203 SE 1204 SE 1205 PF 1206 PF 1207 PF 1208 PF 1209 PF 1210 SE 1214 CT 1215 CT 1216 PF 1217 PF 1218 PF 1219 PF 1220 AF 1221 AF 1222 CT 1223 CT 1224 AF 1225 AF 1226 AF 1227 AF 1228 AF 1229 CT 1230 CT 1246 PF 1247 PF 1248 PF 1249 PF 1250 PF 1251 PF 1252 PF 1253 PF 1254 PF 1255 CT 1263 ST 1265 ST 1266 ST 1267 PF
Rock FV MV MV FV FV FV PH FV FV FV FV FV FV FV FV PH MI MI FV FV FV FV FV MI GR GR FV FV FV FV MV MV GR GR MV MV MV MV MV GR GR FV FV FV FV FV FV FV FV FV GR GT GT GN FV
Appendix 2
Number Catchmt Cu Pb 1 2 3 4 5 6 7 8 9 10 1 1 12 13 14 15 16 17 18 19 20 21 22 23 24 25 26 27 28 29 30 31 32 33 34 35 36 37 38 39 40 41 42 43 44 45 46 47 48 49 50 51 52 53 54 55
1 1 1 1 1 1 1 1 1 1 1 1 1 1 1 1 I 1 1 1 1 1 1 1 1 1 1 1 1 1 1 1 1 1 1 1 1 1 1 1 1 1 1 1 1 1 1 1 1 1 1 1 1 1 1
17 3 19 1 1 14 29 23 31 23 70 170 7 66 46 22 75 71 48 19 14 25 23 31 60 19 9
105 25 115 18 29 36 10 24 70 25 5 12 38 6 12 30 22 30 12 5 28 4 8 8 4 14 3
1 1 5
Zn 13 6 2 3 3 5 3
1 1 4 0 46 4 10 7 8 3 2 0 5 13 8 8 10 0 12 12 5 4 0 4 0 0 0 3
1 1 8 3 0 0 13 7 18 9 3 6 5 10 6 9 8 5 10 3 6 3
CO 52 15 20 23 14 77 52 46 32 81 192 41 110 63 36 70 72 48 29 25 124 220 70 62 21 18 35 32 39 30 27 34 21 36 54 25 19 18 44 23 15 45 37 43 29 19 43 16 19 17 14 36 13 24 16
Ni 8 3 15 10 13 20 22 25 21 59 14 6 27 37 9 34 41 38 32 18 17 12 22 81 10 9 27 15 52 1 1 18 54 9 12 40 8 4 7 20 7 5 48 40 24 9 6 21 4 6 7 4 9 5 14 7
1 1 7 16 18 20 35 45 102 72 100 14 6 36 40 21 88 85 57 34 32 21 24 50 81 20 17 93 19 174 28 45 43 14 32 75 16 9
1 1 38 1 1 8 37 45 32 18 12 42 9 12 6 8
35 12 35 12
Mn 270 120 630 71 0 800 1110 2200 1100 1000 1630 730 61 0 1550 4500 41 0 2900 1140 81 00 13400 1400 440 470 360
27300 500 380 880 700 1380 440 460 91 00 320 41 0 1580 340 220 300 21 0 240 140 1750 1830 1340 870 450 1620 250 430 290 140 340 140 900 280
32

Sample Form 1268 PF 1339 SE 1340 SE 1341 HF 1342 PF 1343 PF 1344 PF 1345 PF 1356 SE 1357 PF 1358 PF 1370 IM 1038 IM 1039 IM 1045 AF 1046 AF 1068 AF 1069 AF 1070 AF 1071 IM 1072 AF 1073 AF 1074 AF 1075 HF 1076 AF 1077 IM 1078 IM 1080 AF 1081 AF 1087 AF 1088 AF 1089 HF 1090 AF 1102 AF 1104 IM 1105 IM 1106 HF 1107 HF 1109 CT 1110 HF 1111 SE 1112 AF 1113 AF 1114 AF 1115 AF 1116 AF 1140 PF 1194 HF 1195 SE 1346 AF 1347 AF 1348 AF 1349 HF 1350 HF 1351 HF
Rock FV MI MI PH FV FV FV FV MI FV FV FV FV FV MV MV MV MV MV FV MV MV MV PH MV FV FV MV MV MV MV PH MV MV FV FV PH PH GR PH MI MV MV MV MV MV FV PH MI MV MV MV PH PH PH
Appendix 2
Number Catchmt Cu Pb 56 57 58 59 60 61 62 63 64 65 66 67 68 69 70 71 72 73 74 75 76 77 78 79 80 81 82 83 84 85 86 87 88 89 90 91 92 93 94 95 96 97 98 99
100 101 102 103 104 105 106 107 108 109 110
1 1 1 1 1 1 1 1 1 1 1 1 2 2 2 2 2 2 2 2 2 2 2 2 2 2 2 2 2 2 2 2 2 2 2 2 2 2 2 2 2 2 2 2 2 2 2 2 2 2 2 2 2 2 2
13 61 56 66 41 33 22 35 51 58 61 25
170 134 107 111 110 63 53 76 57 48 33 97 32 70 68 98
120 108 92 42 60 57 57 58 43 75 56 55 75 67
161 235
95 100 30 60 62
290 113 105 21 0 150 81
33
4 0 0
14 10 10 6 7 4 5 5 6
32 3 2 0 0 0 0 4 0 3 4 0
12 0 6 0 0 0 0 7 3 0 3
29 9
12 5 9 4 0
15 35
0 0
16 0 8
45 0 0
57 13 5
Zn CO 29 91 65
235 173 100 74 64 69
172 236 50
380 124 82 77 70 72 74
143 108 63 47 71 57 90
106 68 85 72 79 65
121 81 75
245 103 168 73 75
142 112 290 81 0 70
116 92 62
142 850 125 91
265 530 21 0
Ni 9
34 33 12 12 15 17 14 42 39 45 15 88 69 57 55 70 47 54 65 34 42 20 65 39 30 44 44 66 55 32 23 30 34 35 24 24 37 46 20 47 67
105 67 25 54 12
100 72 85 63 68 50 51 65
25 80 86 28 31 50 20 29 54 46 34 20 89
141 89 94
100 77
280 49 82 47 26 29 80 59 36 65 78
100 79 35 71 64 58 46 29 95 58 35 60 56 89 83 75 81 15 59 42 97
110 111 57 57 64
Mn 560
1200 1230 360 320 270 800 620
5300 2320
18000 660
3920 3300 2530 2670 2550 1100 4250 4400 3650 91 0 770
1630 2800 870
3150 1980 31 50 2360 1120 1430 2800 2900 2800 5200 1480 1660 31 00 620
1750 12300 61 00 21 50 820
471 0 31 0
1080 3200 31 10 31 70 31 50 1390 2820 3830

Sample Form 1352 AF 1353 AF 1354 AF 1355 AF 1368 HF 1369 HF 1374 IM 1001 IM 1002 IM 1003 IM 1011 IM 1012 ST 1013 TE 1014 TE 1015 IM 1016 IM 1017 ST 1018 ST 1019 ST 1020 IM 1021 IM 1022 ST 1023 IM 1024 IM 1025 IM 1026 IM 1027 IM 1028 IM 1029 IM 1034 AF 1035 AF 1036 AF 1037 HF 1047 AF 1048 IM 1049 IM 1050 AF 1051 AF 1052 ST 1053 AF 1054 AF 1055 AF 1056 AF 1057 AF 1058 AF 1059 AF 1060 AF 1061 IM 1062 IM 1063 IM 1064 IM 1065 IM 1066 IM 1337 IM 1338 IM
Rock MV MV MV MV PH PH FV FV FV FV FV GN FP FP FV FV GN GT GT FV FV GT FV FV FV FV FV FV FV MV MV MV PH MV FV FV MV MV GN MV MV MV MV MV MV MV MV FV FV FV FV FV FV FV FV
Appendix 2
Number Catchmt Cu Pb 1 1 1 112 113 114 115 116 117 118 119 120 121 122 123 124 125 126 127 128 129 130 131 132 133 134 135 136 137 138 139 140 141 142 143 144 145 146 147 148 149 150 151 152 153 154 155 156 157 158 159 160 161 162 163 164 165
2 2 2 2 2 2 2 3 3 3 3 3 3 3 3 3 3 3 3 3 3 3 3 3 3 3 3 3 3 3 3 3 3 3 3 3 3 3 3 3 3 3 3 3 3 3 3 3 3 3 3 3 3 3 3
90 62 84 101 36 34 21 24 56 56 205 34 26 29 23 17 13 7 5 93 24 6
1 1 18 7 17 14 13 1 1 64 50 19 90 183 45 50 90 125 100 85 80 85 95 100 92 71 100 35 20 9 13 16 14 83 19
34
7 7 0 0 7 8 8 10 8 0 0 7 15 30 21 10 21 10 13 3 6 16 7 9 8 9 8 9 9 0 0 30 0 0 15 6 8 0 0 0 0 3 4 0 19 0 0 13 9 5 7 5 7 8 10
Zn CO Ni 150 106 77 84 57 56 80 34 52 67 82 42 42 44 44 32 28 15 23 54 54 27 22 40 18 34 36 33 30 67 67 48 79 75 54 51 61 66 96 87 92 110 130 95 145 75 84 45 41 20 32 33 36 60 38
45 37 60 53 26 23 10 17 41 36 39 22 14 9 18 23 7 3 4 24 25 6 14 16 3 8 8 7 7 57 66 23 45 36 25 26 48 44 41 71 40 42 61 52 40 46 53 22 1 1 7 9 10 1 1 39 10
Mn 67 57 77 82 37 36 14 32 55 68 65 37 24 23 39 29 13 8 3 36 47 7 22 42 8 27 21 19 15 54 65 28 41 68 35 43 62 81 74 200 57 71 161 82 54 58 67 38 28 10 16 19 21 41 22
21 00 2380 2800 2390 1070 1820 350 460 371 0 1980 1470 1140 71 0 31 0 580 830 320 110 430 1070 1350 690 830 81 0 340 200 200 420 400 51 50 151 00 1030 2490 4900 640 2550 2070 2200 1800 2450 2520 2000 2450 3400 1880 3050 21 00 750 620 390 270 440 41 0 1150 500

Sample Form 2218 ST 2219 ST 2220 ST 2221 ST 2222 ST 2223 ST 2224 ST 2225 ST 2226 ST 2257 ST 2258 ST 2260 ST 2261 ST 2262 ST 2263 ST 2264 ST 2265 ST 2266 ST 2267 ST 2268 ST 2269 ST 2270 ST 2271 ST 2272 ST 2273 ST 2274 ST 2275 ST 2276 ST 2277 ST 2278 ST 2279 ST 2280 ST 2281 ST 2282 ST 2283 ST 2284 ST 2285 ST 2286 ST 2287 ST 2288 ST 2289 IM 2290 IM 2291 IM 2292 AF 2293 AF 2294 AF 2295 AF 2296 CT 2297 AF 2298 AF 2299 AF 2300 AF 2301 AF 2302 AF 1030 AF
Rock MD GT MD GT GT GT GT GT GT MD MD GT GT GT GT GT GT GT GT GT MD GT GT MD MD GT GT GT GT GT GT GT GT GT GT GT GT GT GT GT FV FV FV MV MV MV MV GR MV MV MV MV MV MV MV
Appendix 2
Number Catchmt Cu Pb 166 167 168 169 170 171 172 173 174 175 176 177 178 179 180 181 182 183 184 185 186 187 188 189 190 191 192 193 194 195 196 197 198 199 200 201 202 203 204 205 206 207 208 209 21 0 21 1 21 2 21 3 214 21 5 216 21 7 218 21 9 220
4 4 4 4 4 4 4 4 4 4 4 4 4 4 4 4 4 4 4 4 4 4 4 4 4 4 4 4 4 4 4 4 4 4 4 4 4 4 4 4 4 4 4 4 4 4 4 4 4 4 4 4 4 4 5
92 53
105 19 22 18 12 26 28 20 17 56 14 30 12 18 5
32 49 53 60 11 14 9
11 20 38 32 36 23 23 7 6 5
11 7 6
18 15 20 50 49 36 15 54 17 24 11 4
11 28 55 37 58 53
35
Zn 0
10 8 4 8
12 10 20 17 5 3 3 3 3 0 4 4 3 6 4 4
14 15 16 7 8 7 6 7 4
24 12 15 13 21 16 10 10 10 6 4 7 8 0 3 0 0 0 0 0 0 0 0 0 0
CO 55 51 61 31 49 45 29 46 57 35 26 53 23 30 23 30 20 41 41 41 42 41 27 21 21 40 47 34 46 29 41 26 27 27 40 30 20 33 31 36 44 50 64 20 60 20 37 18 8
22 43 61 47 61
110
Ni 17 20 32 12 16 15 7
11 21
9 11 40
7 13 6 9 4
15 17 16 16 9 3 8 4
15 20 18 20 16 19 4 5 4 5 6 7
13 11 15 25 41 43
7 41
7 23
9 4 9
23 32 46 50 52
38 23 33 11 17 21 15 16 25 6
11 16 3 8 5 6 3
10 11 11 14 11 5
12 7
25 50 46 53 34 31
5 5 4 5 8 9
32 27 45 62 51 55 19 53 19 36 30 12 14 33 49 49 61 50
Mn 650
1180 1710 700
1210 950 350 700
1310 1000 81 0
1760 550 700 430 550 390
1050 1140 820
1110 730 330 650 330 580 650 450 660 730 860 360 380 400 420 400 350 420 390 500 930
3300 4500 260
21 20 220
1660 300 180 580
1460 1900 2650 1410 1960

Sample Form 1031 AF 1032 AF 1033 IM 2216 ST 2217 ST 2227 IM 2228 ST 2229 ST 2230 ST 2231 CT 2232 IM 2233 ST 2234 ST 2235 ST 2236 IM 2237 ST 2238 ST 2239 ST 2240 IM 2241 IM 2242 IM 2243 IM 2244 IM 2245 AF 2246 AF 2247 AF 2248 AF 2249 IM 2250 AF 2251 AF 2252 AF 2253 AF 2254 AF 2255 AF 2256 AF 2303 IM 2304 AF 2305 AF 2306 AF 2307 AF 2308 AF 2309 AF 2310 AF 2311 AF 2312 AF 2313 AF 2314 AF 2315 AF 2316 AF 2317 AF 2322 TE 2323 AF 2324 AF 2325 AF 2326 AF
Rock MV MV FV MD GT FV GT GT GT GR FV MD GT GT FV GT GT GT FV FV FV FV FV MV MV MV MV MD MV MV MV MV MV MV MV FV MV MV MV MV MV MV MV MV MV MV MV MV MV MV FP MV MV MV MV
Appendix 2
Number Catchmt Cu Pb 22 1 222 223 224 225 226 227 228 229 230 231 232 233 234 235 236 237 238 239 240 24 1 242 243 244 24 5 246 247 248 249 250 251 252 253 254 255 256 257 258 259 260 261 262 263 264 265 266
, 267 268 269 270 271 272 273 2 74 275
5 5 5 5 5 5 5 5 5 5 5 5 5 5 5 5 5 5 5 5 5 5 5 5 5 5 5 5 5 5 5 5 5 5 5 5 5 5 5 5 5 5 5 5 5 5 5 5 5 5 5 5 5 5 5
56 62 19 97 29 38 18 34 27 16 20 58 9 26 26 41 26 28 29 54 54 25 57 42 54 54 59 37 83 76 75 34 44 61 54 21 61 43 80 71 68 30 43 60 37 44 39 52 69 33 50 56 35 82 24
36
Zn 0 0 29 8 5 5 14 7 7 5 3 6 0 0 0 0 0 0 0 15 3 0 3 3 0 6 0 0 0 3
1 1 4 5 0 0 3 7 26 16 16 6 0 9 0 7 0 0 0 3 0 9 3 5 7 0
93 85 44 38 33 50 42 46 43 36 46 68 21 49 43 26 37 30 39 58 69 39 70 53 94 90 96 74 90 86 102 58 96 74 73 32 52 58 81 126 88 63 77 88 59 61 92 76 76 45 60 78 75 57 49
CO Ni 45 30 22 25 16 35 5 17 18 1 1 19 27 8 27 28 17 17 15 22 42 33 18 29 33 43 37 44 20 41 49 44 23 25 32 30 20 35 61 55 39 45 33 40 31 29 21 33 37 57 86 54 40 29 54 44
56 56 26 34 36 60 14 44 35 33 51 50 26 82 51 64 50 62 65 66 42 29 40 42 56 54 55 21 80 78 79 39 47 63 57 43 69 66 91 66 75 34 52 55 32 63 38 90 65 58 39 84 81 105 35
Mn 2120 630 1020 860 870 2060 420 780 930 420 670 1960 260 860 1000 550 630 630 890 3470 1830 680 1850 1920 2360 1950 3300 1640 21 30 2200 2650 970 470 1740 1820 890 1370 1280 371 0 271 0 2580 4420 4750 1930 3850 750 1660 890 3920 37500 8700 21 00 1660 3470 4290
Sample Form 2327 AF 2328 AF 2329 AF 2330 TE 2331 TE 2332 AF 2333 TE 2334 TE 2335 TE 2336 TE 2337 A F 2338 AF 2339 IM 2340 AF 2341 AF 2342 AF 2343 AF 2344 AF 2345 AF 2346 AF 2347 AF 2348 AF 2349 AF 2350 AF 2351 AF 2352 AF 2353 AF 2354 A F 2355 AF 2356 AF 2357 AF 2358 AF 2359 AF 2360 AF 2361 AF 2362 AF 2363 AF 2365 AF 2366 AF 2053 ST 2054 ST 2055 CT 2056 CT 2057 CT 2058 CT 2059 CT 2060 CT 2061 CT 2062 CT 2063 CT 2064 CT 2065 CT 2098 CT 2099 CT 2100 CT
Rock MV MV MV FP MD MV FP FP FP MO MV MV FV MV MV MV MV MV MV MV MV MV MV MV MV MV MV MV MV MV MV MV MV MV MV MV MV MV MV MD MD GR GR GR GR GR GR GR GR MD GR MD GR GR GR
Appendix 2
Number Catchmt Cu Pb 276 277 278 279 280 28 1 282 283 284 285 286 287 288 289 290 29 1 292 293 294 295 296 297 298 299 300 30 1 302 303 304 305 306 307 308 309 31 0 31 1 31 2 31 3 314 31 5 31 6 31 7 31 8 31 9 320 32 1 322 323 324 325 326 327 328 329 330
5 5 5 5 5 5 5 5 5 5 5 5 5 5 5 5 5 5 5 5 5 5 5 5 5 5 5 5 5 5 5 5 5 5 5 5 5 5 5 6 6 6 6 6 6 6 6 6 6 6 6 6 6 6 6
77 62 40 63 88
105 42 52 13 11 51 70 21 83 52 59 50 51 67 37 45 50 38 61 37 85 58 41 75 80 83 75 62 65 85 81 78 60 22 59 61
105 25 6 2 4 1 2 3
13 4
31 3 3 3
37
0 4
52 6 5 5 8
12 10 10 4 3 0
22 20
9 3 5 0 0 3 0 3 4 0 4 4 9 0 0 0 0 0 0 0 0 0 0 8
23 17 6 9
30 8
20 13 8
15 0 8
15 8
47 17
Zn CO 96 96
102 47 68 76 27 40 33 24 68 65 33 82 82 51 78 79 71 71
119 73 58 65 67 85 53 36 88 71 75 60 58 64 61 66 60 65 40 45 43 57 29 15 11 28 11 12 14 20 14 34 9
21 13
Ni 46 36 23 23 29 37 15 15 13 10 28 36 22 32 31 36 39 31 37 31 33 31 25 31 31 37 32 20 32 33 36 38 29 44 51 49 46 31 18 21 17 29 11 3 1 1 1 1 2 7 3 9 3 3 2
73 47 43 30 57 61 28 24 29 19 60 62 47 63 70 65 53 47 72
106 91 67 43 57 67 74 58 28 71 81 82 78 63 75 92 84 85 73 19 15 20 32 12 7 4 5 2 2 5
12 4
10 3 5 3
Mn 2480 21 80 1540 1030 920
1180 490 470 500 360
3850 1920 1080 1650 1640 1770 2040 1340 1970 2000 1750 1600 1360 1760 1670 21 50 1390 680
1740 1660 1980 1650 980
2000 21 50 2050 1900 1810 1270 1250 450
1550 61 0 330 120 230 220 140 170 580 180 51 0 150 400 21 0

Sample Form 2101 CT 2102 AF 2103 CT 2105 CT 2401 ST 2402 ST 2403 ST 2404 ST 2405 CT 2406 CT 2407 CT 2408 CT 2409 CT 2410 ST 2411 ST 2412 CT 2413 CT 2414 CT 2415 CT 2416 CT 2418 CT 2419 ST 2420 ST 2421 ST 2422 CT 2423 ST 2424 ST 2425 ST 2426 ST 2427 ST 2428 ST 2429 ST 2430 ST 2438 CT 2439 CT 2440 CT 2106 CT 2107 CT 2108 CT 2109 CT 2110 CT 2111 CT 2112 CT 2113 CT 2114 CT 2115 IM 2116 CT 2117 CT 2118 CT 2119 CT 2120 CT 2121 CT 2122 CT 2123 CT 2124 CT
Rock GR MV GR GR GT GT GT GT GR GR GR GR GR GT GT GR GR GR GR GR GR GT GT GT GR GT GT GN GT GT GT GT GT GR GR GR GR GR GR GR GR GR GR GR GR FV GR GR GR GR GR GR GR GR GR
Appendix 2
Number Catchmt Cu Pb 331 332 333 334 335 336 337 338 339 340 34 1 342 343 344 345 346 347 348 349 350 351 352 353 354 355 356 357 358 359 360 36 I 362 363 364 365 366 367 368 369 370 371 372 373 374 375 376 377 378 379 380 381 382 383 384 385
6 6 6 6 6 6 6 6 6 6 6 6 6 6 6 6 6 6 6 6 6 6 6 6 6 6 6 6 6 6 6 6 6 6 6 6 7 7 7 7 7 7 7 7 7 7 7 7 7 7 7 7 7 7 7
5 61 46 6 5 8
17 19 20
5 6 6 6 4
18 5 4 2 6 5 4 9 9 9
13 10 7
10 9 7 4
28 35 8
12 10 14 7 8 1 3 3 2 4 4 7 2 2 7 6 3 6 9 2 9
Zn 60
3 22 35 16 15 16 11 8
20 16 16 15 14 21 12 12 12 20 25 28 23 27 10 24 13 18 19 20 20 13 17 20 80 40 71 29 31 32 9
17 28 10 10 23 37 47 19 26 39 33 36 33 14 53
CO 21 51 61 34 31 40 43 16 14 19 20 22 17 14 32 16 15 13 21 19 21 44 30 14 19 15 22 12 34 39 19 34 60 44 25 30 37 33 24 8
16 9
10 26
133 38 23 19 24 24 23 39 51 14 41
Ni 2
28 39 3 4 4 7 4 8 4 3 4 4 2
15 3 4 2 6 3 2 7 9 3 7 5 5 4 8
10 3
15 26 4 7 8 8 5 4 2 3 4 2 4 2 5 2 3 5 3 3
10 7 2 4
4 55 43
9 6 6 9
15 19 6 6 7
10 6
19 5 4 2 6 5 7
30 23
9 16 13 14 10 23 16 9
39 41 7
10 10 22 10 4 2 5 8 2
13 3 7 3 4 9 6 5
11 11 5
12
Mn 380 920
2210 280 380 380 530 230 230 260 280 370 31 0 21 0 680 240 270 360
1080 370 270 420 540 21 0 320 230 250 230 470
1480 320 420
2000 81 0 31 0 420 41 0 330 320 130 250 220 140 21 0 300 450 51 0 230 320 420 330
1040 94 0 160 380
38

Sample Form 2125 CT 2126 CT 2127 CT 2128 CT 2417 CT 2628 CT 2629 CT 2630 CT 2631 CT 2632 CT 2633 CT 2634 IM 2635 IM 2636 IM 2637 IM 2638 CT 2639 CT 2640 CT 2641 CT 2642 CT 2643 CT 2622 CT 2623 CT 2649 CT 2650 CT 2651 CT 2652 CT 2653 CT 2654 CT 2691 CT 2692 CT 2693 CT 2694 CT 2695 CT 2696 CT 2442 CT 2452 ST 2453 AF 2454 AF 2455 AF 2614 CT 2615 CT 2616 CT 2617 CT 2618 CT 2619 CT 2620 CT 2621 CT 2670 CT 2678 CT 2679 ST 2680 ST 2681 ST 2682 ST 2683 ST
Rock GR GR GR GR GR GR GR GR GR GR GR FV FV FV FV GR GR GR GR GR GR GR GR MD MD GR MD GR GR GR GR GR MD MD GR GR GT MV MV MV GR GR GR GR GR GR GR GR GR MD GT GT GT GT GT
Appendix 2
Number Catchmt Cu Pb 386 387
389 390 39 1 392 393 394 395 396 397 398 399 400 40 1 402 403 404 405 406 407 408 409 41 0 41 1 412 41 3 414 41 5 416 41 7 41 8 41 9 420 421 422 423 424 425 426 427 428 429 430 431 432 433 434 435 4 36 437 438 439 440
3aa
7 7 7 7 7 7 7 7 7 7 7 7 7 7 7 7 7 7 7 7 7 8 8 8 8 8 8 8 8 8 8
8 8 8 9 9 9 9 9 9 9 9 9 9 9 9 9 9 10 10 10 10 10 10
a
16 6 9 3 14 12 14 6 6 14 6 9 6 5 4 5 5 5 8 17 8 5 9
147 66 61 121 6 6 6 4 7 90 70 4 5 66 1 1 5 24 15 23 13 9 5 14 6 10 36 72 33 37 31 1 1 5
Zn 31 15 35 21 12 46 17 18 25 28 10 15 28 47 45 38 28 36 25 16 31 40 50 9 29 26 22 65 230 35 23 40 38 23 35 13 10 15 26 14 19 17 23 25 26 37 27 50 51 12 18 33 25 44 12
CO 27 19 30 17 20 41 29 24 32 29 14 41 23 30 31 31 20 28 27 50 34 26 37 70 47 88 60 29 43 29 23 33 62 54 24 14 46 17 7 24 21 20 21 24 20 26 24 35 44 75 35 41 32 27 14
Ni 6 4 7 2 5 7 13 6 10 16 9 14 6 6 5 6 5 5 8 15 6 6 10 32 24 22 25 3 3 5 1 4 19 17 2 1 21 7 8
1 1 6 6 6 4 4 7 6 6 9 24 13 10 8 3 2
15 12 13 6 13 12 22 1 1 6 13 13 25 8 7 6 5 8 6
1 1 52 10 6 7 28 12 13 22 6 4 14 6 6 14 1 1 4 2 16 1 1 2 31 5 5 4 6 4 8 7 12 15 10 10 4 5 6 4
Mn 290 220 550 150 380 860 750 530 760 850 330 500 360 370 390 61 0 360 520 310 460 480 530 820 1330 1250 880 1130 420 800 680 220 730 1500 1400 350 21 0 950 280 420 31 0 240 260 280 21 0 360 31 0 530 340 390 140 840 990 540 260 250
39

Sample Form 2684 CT 2685 ST 2686 ST 2688 AF 2689 AF 2690 ST 2582 CT 2583 AF 2584 AF 2587 PF 2588 PF 2589 PF 2590 AF 2591 ST 2592 ST 2593 ST 2594 PF 2595 ST 2596 AF 2597 PF 2598 ST 2599 ST 2600 ST 2601 ST 2602 PF 2603 PF 2607 ST 2608 ST 2609 ST 2610 ST 2611 ST 2612 ST 2613 ST 2811 ST 2812 ST 2813 ST 2814 ST 2815 ST 2816 ST 2817 ST 2818 AF 2819 AF 2820 AF 2821 AF 2822 AF 2823 AF 2824 ST 2829 ST 2830 CT 2831 CT 2832 ST 2833 ST 2834 ST 2835 ST 2836 CT
Rock GR GT GT MV MV GT GR MV MV FV FV FV MV GN GN GN FV GN MV FV GN GN GN GN FV FV GN MD GN GN GN GN GN GT GT GT GT GT GT GT MV MV MV MV MV MV GT GN GR MD GT GT GT GT GR
Appendix 2
Number Catchmt Cu Pb 44 1 442 443 444 445 446 447 448 449 450 451 452 453 454 455 456 457 458 459 460 46 1 462 463 464 465 466 467 468 469 470 471 472 473 474 475 4 76 477 478 479 480 481 482 483 484
486 487 488 489 490 491 492 493 494 495
485
10 10 10 10 10 10 11 11 11 11 11 11 11 11 11 11 11 11 11 11 11 11 11 11 11 11 11 11 11 11 11 11 11 12 12 12 12 12 12 12 12 12 12 12 12 12 12 12 12 12 12 12 12 12 12
4 3
12 25 45 9
46 46 79
112 139 105 120 34 53 16 66 46 37 48 45 13 34 61 41 81 5
76 12 5 8
24 5 2 2 2 1 1 4 2
35 22 56 30 41 25 6 3
70 3 2 5 1 1 2
40
Zn 30 10 20 6
19 24 17 0 0 0 0 0 0 0 6 8 0 6 6 5
18 29 12 14 6
15 20 0
22 14 22 26 22 10 10 20 10 10 10 10 0 0 0 0 0
10 10 10 0
20 20 20 20 20 20
CO 23
9 19 24 69 23 40 44 88
138 247 163 93 40 40 18 69 53 83 71 64 23 35 44 66
175 19 43 24 22 17 26 34 12 12 18 8 7
13 11 28 26 33 30 25 20 12 11 63 20
8 19 16 17 21
Ni 2 3 5
31 33 11 47 44 47 50 73 56 60 26 30 12 52 32 12 26 20
7 13 30 24 43 4
27 9 4 6 8 7 2 2 2 1 1 0 1
24 18 19 11 21 22 3 1
16 1 2 3 2 2 3
3 3
24 100 97 17 90
1 06 91 84
160 76 92 47 61 22
130 55 34 47 42 11 39 50 60 91 6
30 9 5
25 8 3
12 11 6 5 5 6 5
51 34 41 32 50 24 13 3 6 4 9
14 7 8
12
Mn 350 150 170
1500 1360 760
1650 2600 1810 4540 3800 21 00 21 00 950
1260 430
3550 21 00
500 920 420 270 280 920 880
2850 230
1330 560 230 280 260
1100 440 190 230
70 90
160 180
1100 980
1150 930
2020 1100 180 150
21 00 650 130 430 330 270 290

Sample Form 2843 ST 2710 ST 2711 ST 2712 ST 2713 ST 2714 ST 2715 CT 2716 CT 2717 CT 2718 CT 2724 ST 2725 ST 2729 ST 2730 ST 2731 CT 2765 ST 2766 ST 2767 ST 2768 ST 1780 CT 1781 CT 1782 ST 1783 CT 1784 ST 1785 CT 1786 CT 1787 CT 1788 CT 1789 ST 1790 CT 1791 CT 1800 CT 1801 CT 1802 CT 1803 CT 1804 CT 1805 CT 1806 CT 1807 CT 1808 CT 1809 CT 1810 CT 1811 CT 1812 CT 1813 CT 1828 CT 1829 CT 1830 CT 1831 CT 2837 CT 2838 CT 2839 ST 2840 CT 1775 CT 1776 CT
Rock GT GN GN GN GN GN GR GR GR GR GN GN GN GN GR GN GN GN GN GR GR GT GR GT GR GR GR GR GT GR GR GR GR GR GR GR GR GR GR GR GR GR GR GR GR GR GR GR GR GR GR GN GR GR GR
Appendix 2
Number Catchmt Cu Pb 496 497 498 499 500 50 1 502 503 504 505 506 507 508 509 51 0 51 1 512 51 3 51 4 516 51 7 51 8 51 9 520 521 522 523 524 525 526 527 528 529 530 531 532 533 534 535 536 537 538 539 540 54 1 542 543 544 54 5 546 54 7 548 549 550 551
12 13 13 13 13 13 13 13 13 13 13 13 13 13 13 13 13 13 13 15 15 15 15 15 15 15 15 15 15 15 15 15 15 15 15 15 15 15 15 15 15 15 15 15 15 15 15 15 15 15 15 15 15 16 16
3 4 2 3 8 2
31 6 3
48 2 6 3 3
11 3 1 0 2
11 24 4
11 4
16 5 2 4 4 4 4 4
16 11 5 5
11 2 7 4 4
11 4 2 6 2 4 3 4 1 1 6 2
10 4
Zn 10 20 20 30 30 50 20 20 40 30 10 20 20 20 20 20 20 10 30 30 11 25 24
7 22 13 14 12 11 12 21 24 21 30 28 23 12 11 30 14 17 15 20 17 20 24 15 20 45 30 10 20 30 33 28
11 10 10 19 43 18 41 21 33 52 8
15 14 12 20 16 15 12 21 17 31 14 21 18 24 67 18 25 9
19 12 17 25 25 15 22 29 14 19 13 26 47 18 11 17 15 17 19 34
7 4 7 8
26 13
CO Ni 1 2 2 2 5 2 9 3 3
19 4 6 4 5 7 3 1 1 1 5 8 1 6 3 7 3 1 3 2 2 6 4 9 6 5 4 8 2 4 6 6 2 2 1 3 1 1 5 3 1 0 2 0 6 1
2 1 0 2 5 0
10 2 2
11 2
13 3 2 0 4 3 4 4 6
16 4 8 8
11 4 1 4 2 3 3 5
22 8 8 6 6 2 2 6 4 3 4 2
11 2 2 7 3 2 3 6 3 9 5
Mn 21 0 80
100 300 800 300 670 320 400 730 120 190 130 21 0 51 0 290 21 0 21 0 500 300 380 200 330 160 520
2080 280 230 160 21 0 270 130 240 21 0 170 31 0 340 31 0 350 200 330 190 190 60 80
120 160 360 480 200 100 90
130 31 0 180
41

Sample Form 1777 CT 1778 CT 1779 ST 2578 AF 2579 PF 2580 AF 2581 AF 2844 ST 2845 ST 2846 ST 2847 ST 2848 ST 2849 ST 2850 ST 2851 AF 2852 ST 2853 ST 2859 ST 2860 ST 2861 ST 2862 ST 2863 ST 2864 ST 2865 ST 2912 AF 2913 AF 2916 AF 2917 AF 2918 AF 2919 AF 2920 AF 2921 AF 2922 AF 2923 AF 2924 AF 2931 AF 2938 AF 2939 ST 2940 ST 2941 ST 2942 ST 2943 AF 2944 AF 2976 AF 2977 AF 2978 ST 2979 ST 1741 CT 1742 CT 1743 AF 1744 AF 1745 AF 1746 AF 1747 ST 1758 ST
Rock GR GR GT MV FV MV MV GT GT GT GT GT GT GT MV GT GT GT GT GT GT GT GT GT MV MV MV MV MV MV MV MV MV MV MV MV MV GT GT GT GT MV MV MV MV GT GT GR GR MV MV MV MV GT GT
Appendix 2
Number Catchmt Cu Pb 552 553 554 555 556 557 558 559 560 56 1 562 563 564 565 566 567 568 569 570 571 572 573 574 575 5 76 577 578 579 580 58 1 582 583 584 585 586 587 588 589 590 591 592 593 594 595 596 597 598 599 600 60 1 602 603 604 605 606
16 16 16 16 16 16 16 16 16 16 16 16 16 16 16 16 16 16 16 16 16 16 16 16 16 16 16 16 16 16 16 16 16 16 16 16 16 16 16 16 16 16 16 16 16 16 16 17 17 17 17 17 17 17 17
4 8 3
20 26 11 61 2 3 2 5 3 9 4
42 3 2 3 4 1 4 2 3 2
93 73 96 26 70 68 74 76 81 26 53
154 9
12 8
10 2
24 73 86 16 2 0
21 13 13 12 28 86 3
14
42
Zn 12 19 12 9 0 0 0
10 10 10 10 10 10 10 0
10 10 10 20 10 20 20 10 10 0 0 0 0
10 0 0 0 0 0 0 0 0 0
10 0
10 10 0 0 0
10 10 7
13 12 11 23 4
15 9
CO 15 14 12 30 39 22 44 11 13 9
15 14 12 5
21 10 6 5
23 11 21 8 8 7
71 60 74 37
354 58 53 47 28 27 44
177 13 14 16 17 10 27 53 49 18 19 11 41 32 29 28 75 54 15 17
Ni 1 2 2
15 67 10 38
1 1 0 2 1 1 0 9 0 1 1 2 0 1 1 1 2
32 51 68 26 45 36 37 66 50 34 70 53 7 5 6 7 4
18 40 32 11 0 0
11 5 6 7
25 35 4
22
3 4 4
38 54 24 96 2 7 4 7 5
11 6
45 2 3 3 4 3
12 7 4 2
75 93
106 57
128 80
174 104 88 93
130 150 10 3 8
11 4
34 100 103 88 4 3
20 3
10 8
30 88 4
18
Mn 250 160 260 820
1640 570 91 0 21 0 180 160 100 230 80 80
31 0 200 100 70
260 240 21 0 150 110 21 0
1290 1840 2400
720 1500 1160 1330 2050 1540 1150 2000 1300 31 0 240 200 200 170 670
1000 940 330 180 70
600 450 340 500
1610 1310 170 800

Sample Form 1759 A F 1761 ST 1762 ST 1763 ST 1764 ST 1765 ST 1766 ST 1767 ST 1768 A F 1769 AF 1770 AF 1771 A F 1772 A F 1773 A F 1774 A F 2570 A F 2571 A F 2925 A F 2926 A F 2927 A F 2928 A F 2929 A F 2930 A F 2932 A F 2933 A F 2934 A F 2935 A F 2936 A F 2937 A F 2945 A F 2946 AF 2947 AF 2948 A F 2949 AF 2950 AF 2951 AF 2952 A F 2953 A F 2954 A F 2955 AF 2956 AF 2957 A F 2958 A F 2959 A F 2960 A F 2961 AF 2962 A F 2963 A F 2964 A F 2965 AF 2966 AF 2967 A F 1717 PF 1718 SE 1719 PF
Rock MV GT GT GT GT GT GT GT MV MV MV MV MV MV MV MV MV MV MV MV MV MV MV MV MV MV MV MV MV MV MV MV MV MV MV MV MV MV MV MV MV MV MV MV MV MV MV MV MV MV MV MV FV MI FV
Appendix 2
Number Catchmt Cu Pb 607 608 609 61 0 61 1 61 2 61 3 614 61 5 616 61 7 61 8 61 9 620 62 1 622 623 624 625 626 627 628 629 630 631 632 633 634 635 636 637 638 639 640 64 1 642 643 644 645 646 64 7 648 649 650 651 652 653
* 654 655 656 657 658 659 660 66 1
17 17 17 17 17 17 17 17 17 17 17 17 17 17 17 17 17 17 17 17 17 17 17 17 17 17 17 17 17 17 17 17 17 17 17 17 17 17 17 17 17 17 17 17 17 17 17 17 17 17 17 17 18 18 18
58 7
15 22 9 9
12 16
110 83
115 26 12 19 23 47 63 27 75 43 42 54
139 57 41 52 59 88 21 36 40
102 20
115 74
102 63 50
105 77
123 110 107 102 41 12 57
112 7 2
47 98 42 65 31
43
Zn 0 4 8
16 7 8 7 5 3 3 5
13 17 18 8 0
107 0
130 20 70
260 0 0 0
10 0 0 0 0 0 0 0 0 0 0 0 0 0 0 0 0 0 0 0
10 0 0
10 0 0 0 6 7 0
CO 49 19 12 25 23 15 19 17 55 45 60 20 12 19 22 33 64 23
195 58 74
102 82 37 28 49 44 54 23 26 30 84 19 78 61 65 48 46 60 54 63 57 62 49 37 25 36 54 25 11 63 55
100 168 88
Ni 35 11 10 14 13 7
12 13 42 58 31 17 10 18 13 33 39 23 88 35 41 18 75 26 37 30 42 50 21 15 36 43 22 43 90 89 63 36 45 31 58 61 60 57 40 12 31 73 4 4
23 65 39 29 89
61 12 17 27
8 17 14 22 97
173 149 41 23 33 33 63 84 51
183 68 94
120 85
110 250
97 125 100 68 95
188 96 49 96
110 127 95 82
102 91
136 104 81
100 60 13 65
127 6 4
38 134 62 45 62
Mn 21 50
370 300 400
31 0 710 420
1710 880 620 380 800 470
1400 2900 1080 1840 1300 520 240
2900 560 800
1430 1150 1620 650 320
1000 1000 500
1170 3020 2900 2050 830
1500 1320 2300 2400 21 50 2110
680 300
1040 2400 690
90 1050 2450 1850 1750 5200
a60
1 a30

Sample Form 1720 SE 1721 AF 1722 AF 1730 PF 1731 PF 1732 PF 1733 PF 1734 PF 1735 PF 1736 AF 1737 AF 1749 ST 1750 ST 1751 ST 1752 ST 1753 ST 1754 ST 1755 AF 1756 AF 1757 AF 1760 AF 2018 HF 2019 SE 2020 PF 2021 PF 2022 SE 2023 AF 2024 AF 2025 AF 2026 AF 2027 AF 2028 AF 2029 HF 2030 PF 2031 PF 2032 PF 2555 PF 2556 PF 2557 PF 2558 PF 2559 HF 2560 HF 2968 AF 2969 AF 2970 AF 2971 AF 1704 HF 1705 PF 1706 PF 1707 PF 1708 PF 1709 PF 1710 PF 1711 PF 1712 PF
Rock MI MV MV FV FV FV FV FV FV MV MV GT GT GT GT GT GT MV MV MV MV PH MI FV FV MI MV MV MV MV MV MV PH FV FV FV FV FV FV FV PH PH MV MV MV MV PH FV MD FV FV FV MD FV FV
Appendix 2
Number Catchmt Cu Pb 662 663 664 665 666 667 668 669 670 671 672 673 674 675 676 677 678 679 680 68 1 682 683 684 685 686 687 688 689 690 69 1 692 693 694 695 696 697 698 699 700 701 702 703 704 705 706 707 708 709 71 0 71 1 71 2 71 3 714 71 5 71 6
18 18 18 18 18 18 18 18 18 18 18 18 18 18 18 18 18 18 18 18 18 18 18 18 18 18 18 18 18 18 18 18 18 18 18 18 18 18 18 18 18 18 18 18 18 18 19 19 19 19 19 19 19 19 19
75 84 37 12 15 25 14 7
11 14 15 2
25 13 14 15 17 82 47 80 68 17 49 31 29 68 68 71
120 65 56 90 78 67 73 29 36 69 62 62 75 68 95 71 99 85 44 43 53 11 22 29 54 17 30
44
7 0 0 7 9 7 2
15 26 0 6 7
12 8
18 6 8 0 4 0 0 7 5
11 12 5 0 0 0 0 0 8 0 4 8 0
10 9 0 0 0 0 0 0 0 0
84 11 7 5 9 5
10 8
10
Zn CO Ni 196 105 100 31 56 53 32 28 25 21 19 31 46 31 72 37 21
110 62 89 35 42
146 83 78
115 76 85
142 69 61
160 93 84
108 42 31
106 75 56 76 56 54 55 54 74
200 81
125 28 64
106 57 38 62
27 20 21 6
10 13 11 9 4 8
10 30 20 11 20 14 10 38 20 31 24 14 25 17 14 26 30 29 35 28 27 27 21 14 22 19 26 26 79 32 43 44 58 39 60
120 77 24 33 7
29 38 25 10 17
60 59 38 15 23 30 14 18 23 18 18 25 30 18 31 21 18 67 44 69 60 23 60 56 34 51 64 58 73 63 67 58 61 55 57 25 34 61 82 68 76 76 95 69
117 92 76 30 26 10 27 25 23 15 22
Mn 1070 1240 1160 5600 2750 1410 1320 1220 150 250 31 0
1650 1000 520
1150 920 230
2500 1220 2900
950 530
1040 1380 1110 1290 2600 1960 2200 1840 2020 1620 1640 840
1810 1790 1520 1600 9200 1500 2300 1510 2400 2300 2700
10400 35000 1100 2040 490
1570 1530 1620 480 790

Sample Form 1713 PF 1714 HF 1715 PF 1716 PF 1723 PF 1724 PF 1725 AF 1726 AF 1727 PF 1728 CT 1729 PF 1738 CT 1739 CT 1740 CT 2001 AF 2002 AF 2003 AF 2004 AF 2005 AF 2006 AF 2007 AF 2008 HF 2009 HF 2010 PF 2011 PF 2012 PF 2013 PF 2014 PF 2015 PF 2016 PF 2017 PF 2066 PF 2067 PF 2068 PF 2069 PF 2070 PF 2071 HF 2072 PF 2073 ST 2074 ST 2075 ST 2076 ST 2077 ST 2078 AF 2079 AF 2080 AF 2081 AF 2082 AF 2083 AF 2084 ST 2085 ST 2086 AF 2087 AF 2088 AF 1183 HF
Rock FV PH FV FV FV FV MV MV FV GR FV GR GR GR MV MD MO MD MO MD MO PH PH FV FV FV FV FV FV FV FV FV FV FV FV FV PH FV GT GT GT GT GT MD MD MD MV MV MV GT GT MV MV MV PH
Appendix 2
Number Catchmt Cu Pb 71 7 718 719 720 72 1 722 723 724 725 726 727 728 729 730 731 732 733 734 735 736 737 738 739 740 74 1 742 743 744 745 746 747 748 749 7 50 751 752 753 754 755 7 56 757 758 759 760 761 762 763 764 765 766 767 768 769 770 77 1
19 19 19 19 19 19 19 19 19 19 19 19 19 19 19 19 19 19 19 19 19 19 19 19 19 19 19 19 19 19 19 19 19 19 19 19 19 19 19 19 19 19 19 19 19 19 19 19 19 19 19 19 19 19 20
35 90 45 42 20 17 48 38 21 12 12 9
60 9
71 33 81 52 23 49 30 18 14 9
35 20 11 10 12 12 23 24 17 59 41 11 55
115 53 46 24 52 41 49 57 73 95 81 81
113 26 92 97
110 39
45
4 10 8 5
14 7 7
22 15 23 16 24 21 19 6 6 0 4 6 0 0 6 5 4 0
10 3 4 4 4 8 7 0 2 4 4
10 16 7
22 15 10 8 9 7
12 18 8
18 36 3
10 6 5 7
Zn CO 71
206 95 96 37 51
196 95 31 32 38 30 30 25 91 74 65
219 47 57 56 39 30 20 75 45 30 21 33 36 45 60 43 46 34 21
146 173 42
530 36 68
225 65 84 85
102 82 85
108 44 77
114 92 37
Ni 20 44 35 52 15 34 31 17 13 6 8 8
15 5
25 27 90 18 13 52 19 8 5 9
20 14 9 5
14 8
10 10 15 27 13 8
15 30 21 20 6
20 30 19 34 38 33 36 25 37 15 45 72 41 19
32 68 48 69 28 28 39 42 14 10 11 6
19 9
32 26 36 26 27 24 14 13 6 7
63 28 25
7 30 13 42 39 22 28 17 10 31 60 16 34 6
49 46 48 44 61 79 78 57 65 69 71
100 87 31
Mn 690
3100 2950 870
1440 2950 2350 1970 680
1760 570 740 350 340 440 920
6500 1200 1270
13000 1980 530 380
1100 1580 1490 440 320 640 920 590 530
1020 1180 590 420 360 820 600
1120 390 770
2700 1120 1640 1940 1400 1820 620
1040 770
2600 3200 860 970

Sample Form 1184 HF 1185 PF 1186 HF 1187 HF 1188 HF 1189 HF 1335 HF 1336 HF 2318 AF 2319 ST 2320 ST 2321 ST 2364 AF 2367 AF 2368 AF 2369 AF 2370 HF 2371 HF 1866 CT 1867 CT 1868 CT 1870 CT 1872 CT 1873 CT 1874 CT 1875 CT 1876 CT 1877 CT 1502 TE 1521 HF 1522 HF 1523 PF 1524 PF 1525 IM 1526 TE 1527 HF 1528 HF 1552 PF 1701 HF 1702 HF 1703 HF 1503 TE 1504 PF 1505 PF 1506 PF 1546 ST 1547 ST 1548 ST 1549 HF 1550 PF 1551 PF 1554 PF 1555 PF 1635 PF 1636 TE
Rock PH MD PH PH PH PH PH PH MV GT GT GT MV MV MV MV PH PH GR GR GR GR GR GR GR GR GR GR FP PH PH FV FV FV FP PH PH MD PH PH PH FP MD MD MD GT GT GT PH FV FV FV FV MD FP
Appendix 2
Number Catchmt Cu Pb 772 773 774 775 776 777 778 779 780 781 782 783 784 785 786 787 788 789 790 791 792 793 794 795 796 797 798 799 800 80 1 802 803 804 805 806 807 808 809 81 0 81 1 812 81 3 81 4 81 5 816 81 7 81 8 81 9 820 821 822 823 824 825 826
20 20 20 20 20 20 20 20 20 20 20 20 20 20 20 20 20 20 21 21 21 21 21 21 21 21 21 21 22 22 22 22 22 22 22 22 22 22 22 22 22 23 23 23 23 23 23 23 23 23 23 23 23 23 23
69 45 26 70 37 90 48
101 64 48 22 36 62 50 41 47 58 66
7 4 2 5 1 3
13 11 11 2
51 36 23 30 61 71 51 23 26 35 52 14 13 69 38 71
107 16 77 38 28 49 46 22 29 50 59
46
Zn 24 11 11 4 0
18 4
13 9 8
13 12 14 9 5
14 10 12 25 19 12 18 6
17 35 30 32 15 8
37 23 13 22 9
10 9
12 7 8
18 10 9
21 7
11 27 27 11 6
10 9 4 8 6
11
70 58 31 48 62
116 41
114 41 39 23 34 60 43 34 83 82 66 31 13 10 13 9
17 35 32 21 11 44
159 76 59 75 43 45 26
118 26 40 53 25 43 52 42 73 30 31 52 34 55 39 40 71 38 48
CO Ni Mn 168 45 13 18
165 41 21 26 29 22 9
14 33 17 18 11 24 36 6 1 2 3 1 5 5 6 5 3
27 28 18 21 40 20 22 13 18 15 10 16 8
22 45 41 20 7 5
17 11 30 25 16 18 21 16
105 49 21 35 50 69 23 67 19 25 12 16 71 28 14 32 35 53
5 1 2 3 2 3 7
10 7 3
41 40 28 84 53 20 40 28 34 12 36 18 17 31
150 34 56 15 23 31 25 28 46 14 22 23 29
8400 1440 520 450
3700 820
1060 31 0
1300 930 630 640
1450 980
1210 660 640
1440 800 21 0 120 110 110 390 230 510 360 250
2200 2200 1600 670
1400 930 890 640
2200 1090 34 0
2340 340 940
1780 2760 420 680 100 81 0 460
1830 1680 810 670
1140 720

Sample Form 1637 TE 1310 PF 1311 ST 1312 ST 1313 ST 1314 ST 1315 ST 1316 PF 1317 ST 1318 ST 1319 ST 1320 ST 1321 PF 1322 ST 1323 PF 1324 ST 1325 ST 1327 ST 1328 ST 1329 ST 1507 PF 1508 HF 1509 ST 1510 ST 1511 ST 1515 ST 1516 ST 1517 ST 1519 PF 1512 ST 1513 ST 1514 HF 1518 ST 1537 PF 1538 PF 1539 PF 1540 CT 1541 CT 1542 CT 1529 PF 1530 PF 1531 ST 1532 CT 1533 PF 1534 PF 1535 PF 1536 PF
Rock FP FV GT GT GT GT GT FV GT GT GT GT FV GT FV GT GT GT GT GT FV PH GT GT GT GT GT GT FV GT GT PH GT MD FV FV GR GR GR FV FV GT GR FV FV FV FV
Appendix 2
Number Catchmt Cu Pb 827 828 829 830 831 832 833 834 835 836 837 838 839 840 84 1 842 84 3 844 845 846 847 848 849 850 851 852 853 854 855 856 857 858 859 860 86 1 862 86 3 864 865 866 867 868 869 870 871 872 873
23 24 24 24 24 24 24 24 24 24 24 24 24 24 24 24 24 24 24 24 24 24 24 24 24 24 24 24 24 25 25 25 25 25 25 25 25 25 25 26 26 26 26 26 26 26 26
93 24 20 25 25 40 13 15 23 31 18 26 17 15 16 24 17 14 21 20 60 56 28 31 33 30 12 24 51 28 16 31 26 22 29 28 14 24 28 28 14 18 21 19 20 30 29
Zn 11 0
11 10 8 9 5 6 7 9 8 7 7 8 7 5 6 8
16 38 6 8
14 15 9 8 7 7 7
17 15 9
17 6 6 9
21 8
10 8 9 8
10 9 5
11 10
CO 59 33 24 34 31 59 27 30 47 50 36 30 35 25 30 33 29 28 35 26 66 44 40 40 36 29 17 19 49 38 22 44 29 31 26 37 25 37 43 27 24 25 29 31 33 31 38
Ni 45 12 13 12 11 27 10 15 11 15 10 12 10 10 10 13 20 8
10 28 40 17 19 13 14 16 7 4
17 11 16 26 11 18 13 20 8
26 18 15 14 14 10 17 18 14 25
46 23 24 34 31 60 17 26 29 29 20 43 29 22 20 22 22 16 24 25 40 37 27 27 36 29 14 13 45 20 21 56 37 23 32 29
9 47 48 73 31 45 27 30 30 65
110
Mn 1970 520 41 0 360 520
1110 320 840 420 360 320 350 360 200 230 380 830 290 300
1630 2480 710 960 41 0 320 630 210 110 840 61 0 51 0 920 360 830 51 0 630 270 770 270 430 350 350 220 41 0 490 300
1200
47