Embed Size (px)
Citation preview

BRITISH COLUMBIA FAMILY MAINTENANCE
ENFORCEMENT PROGRAM
2015-2016
November 2016 2015-2016 Annual Report
2015–2016 Annual Report
Page 1
Contents
FOREWORD ..................................................................................................................... 2
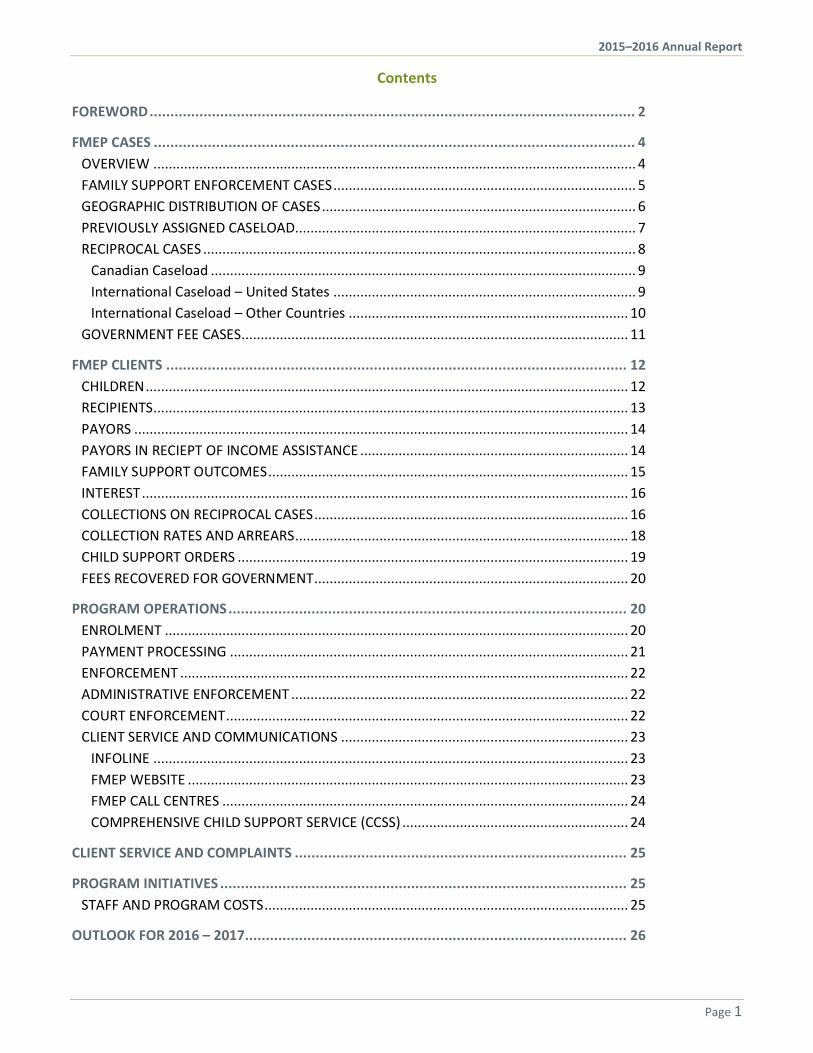
FMEP CASES .................................................................................................................... 4 OVERVIEW .............................................................................................................................. 4 FAMILY SUPPORT ENFORCEMENT CASES ............................................................................... 5 GEOGRAPHIC DISTRIBUTION OF CASES .................................................................................. 6 PREVIOUSLY ASSIGNED CASELOAD ......................................................................................... 7 RECIPROCAL CASES ................................................................................................................. 8
Canadian Caseload ............................................................................................................... 9 International Caseload – United States ............................................................................... 9 International Caseload – Other Countries ......................................................................... 10
GOVERNMENT FEE CASES ..................................................................................................... 11
FMEP CLIENTS ............................................................................................................... 12 CHILDREN .............................................................................................................................. 12 RECIPIENTS ............................................................................................................................ 13 PAYORS ................................................................................................................................. 14 PAYORS IN RECIEPT OF INCOME ASSISTANCE ...................................................................... 14 FAMILY SUPPORT OUTCOMES .............................................................................................. 15 INTEREST ............................................................................................................................... 16 COLLECTIONS ON RECIPROCAL CASES .................................................................................. 16 COLLECTION RATES AND ARREARS ....................................................................................... 18 CHILD SUPPORT ORDERS ...................................................................................................... 19 FEES RECOVERED FOR GOVERNMENT .................................................................................. 20
PROGRAM OPERATIONS ................................................................................................ 20 ENROLMENT ......................................................................................................................... 20 PAYMENT PROCESSING ........................................................................................................ 21 ENFORCEMENT ..................................................................................................................... 22 ADMINISTRATIVE ENFORCEMENT ........................................................................................ 22 COURT ENFORCEMENT ......................................................................................................... 22 CLIENT SERVICE AND COMMUNICATIONS ........................................................................... 23
INFOLINE ............................................................................................................................ 23 FMEP WEBSITE ................................................................................................................... 23 FMEP CALL CENTRES .......................................................................................................... 24 COMPREHENSIVE CHILD SUPPORT SERVICE (CCSS) ........................................................... 24
CLIENT SERVICE AND COMPLAINTS ................................................................................ 25
PROGRAM INITIATIVES .................................................................................................. 25 STAFF AND PROGRAM COSTS ............................................................................................... 25
OUTLOOK FOR 2016 – 2017 ............................................................................................ 26
2015–2016 Annual Report
Page 2
FOREWORD This year’s annual report looks at FMEP from three perspectives – across the province, across borders and across age groups of children. Although the total caseload is dropping slightly, support payments continue to positively impact families across the province. The chart on page 14 shows where the more than 38,000 payors live in BC - representing many communities within the province, and supporting their families whether they live across-town, across the province or outside of BC. Charts on pages 9, 10 and 11 illustrate the distribution of funds throughout Canada, the US and our other international partners. In 2015/16, more total funds were paid than in any previous year. The benefits of almost $211 million are many, from safe housing and good nutrition through to participation in community activities and, for a growing number of BC youth, completion of educational opportunities. As can be seen in the chart on page 12, older teens and young adults are being supported to get the ‘good start’ that is necessary for future success. As payments increase, so does the use of modern banking tools. More payors are using electronic banking to make payments, with fewer paper cheques exchanging hands. The disbursement to recipients has changed dramatically over the past five years with direct deposit becoming the accepted method for payments, offering safe, secure and certainty of receipt of funds. Technology can improve many processes and offer great benefits in our everyday lives. But, for some activities, it will never replace people. The connection between ‘tech’ and ‘touch’ is essential to ensure that people understand the various processes that impact their lives and those of their children. Over a quarter of a million calls to the InfoLine are made each year and the FMEP interactive website receives over one million hits annually. While these forms of communication are important, so are the 250,000 person-to-person telephone conversations that take place, as well as the in-person services offered by outreach workers. Whether families live in the same community or are separated by distance throughout BC, Canada or across international borders, FMEP can help to ensure that financial obligations are met for the benefit of children. Chris Beresford Director of Maintenance Enforcement
2015–2016 Annual Report
Page 3
HIGHIGHTS OF THE 2015-2016 YEAR Highlights for the year include:
Caseload
• The FMEP caseload continues to decease, as it has every year since 2007/2008. There has been a 9.2 percent decrease in the total caseload over the past ten years.
• The caseload reduction has been driven by a decrease in new cases enrolling in the FMEP – not by an acceleration in cases leaving the program.
• In 2014-2015, a significant change in policy by the Ministry of Social Development and Social Innovation led to a decrease in the number of cases being enrolled by that ministry.
• One in five cases in the FMEP caseload involve a parent living outside BC. Most of these cases involve a parent living elsewhere in Canada.
• Alberta continues to be the biggest reciprocal partner for the BC FMEP.
Payments
• Despite the decreasing caseload, the total amount of maintenance collected and disbursed by the FMEP exceeded the amount collected in any previous year.
• Almost $211 million was collected in 2015–2016, an increase of just over $650,000 from the previous year.
• In 2015-2016, 81 percent of FMEP cases received payments and more than 31 percent of cases were fully paid (meaning all the maintenance owed was paid in full, including any arrears).
Clients
• Over 58,000 children are entitled to child support through the FMEP. Twenty-seven percent of these children are over the age of majority, but continue to be entitled to child support because they are in school or otherwise still dependent upon their parents.
• The percentage of paying parents on income assistance continues to increase, with over 13 percent of payors receiving income assistance from the government.
Operations
• 43,000 payments per month were processed by the FMEP, with the majority of the incoming payments now being made electronically. Similarly, over 83 percent of the outgoing funds were deposited directly to client bank accounts. Cheques now account for less than 15 percent of outgoing payments.
• Administrative (non-court) enforcement continues to be the most frequent type of enforcement with garnishment of bank accounts, wages and other monetary sources of funds being the most common.
• The introduction of a completely rebuilt website resulted in a significant increase in web usage as a means of obtaining and providing information to the FMEP.
2015–2016 Annual Report
Page 4
FMEP CASES This section provides an overview of the FMEP caseload – the number of cases enrolled where those cases are located, and a breakdown of the cases by type. We also discuss the caseload composition by type – whether the cases involve parents who reside outside British Columbia and whether the cases are government fee-only cases.
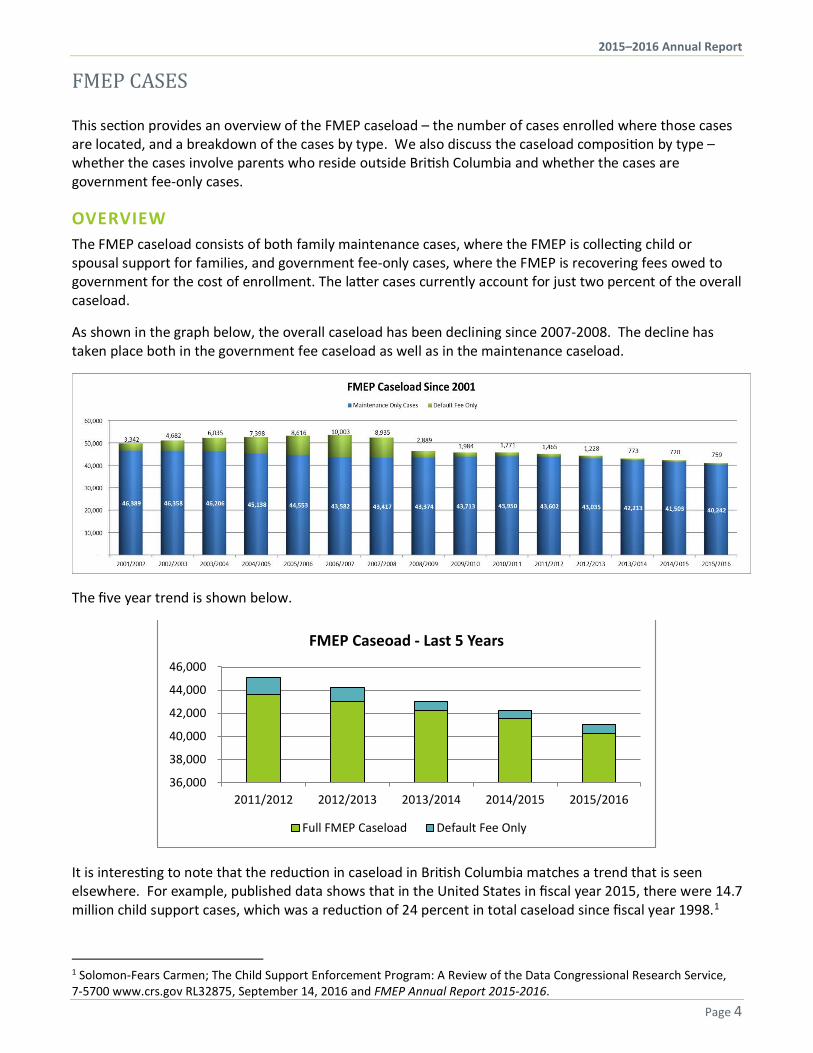
OVERVIEW The FMEP caseload consists of both family maintenance cases, where the FMEP is collecting child or spousal support for families, and government fee-only cases, where the FMEP is recovering fees owed to government for the cost of enrollment. The latter cases currently account for just two percent of the overall caseload.
As shown in the graph below, the overall caseload has been declining since 2007-2008. The decline has taken place both in the government fee caseload as well as in the maintenance caseload.
The five year trend is shown below.
It is interesting to note that the reduction in caseload in British Columbia matches a trend that is seen elsewhere. For example, published data shows that in the United States in fiscal year 2015, there were 14.7 million child support cases, which was a reduction of 24 percent in total caseload since fiscal year 1998.1
1 Solomon-Fears Carmen; The Child Support Enforcement Program: A Review of the Data Congressional Research Service, 7-5700 www.crs.gov RL32875, September 14, 2016 and FMEP Annual Report 2015-2016.
36,000
38,000
40,000
42,000
44,000
46,000
2011/2012 2012/2013 2013/2014 2014/2015 2015/2016
FMEP Caseoad - Last 5 Years
Full FMEP Caseload Default Fee Only
2015–2016 Annual Report
Page 5
FAMILY SUPPORT ENFORCEMENT CASES
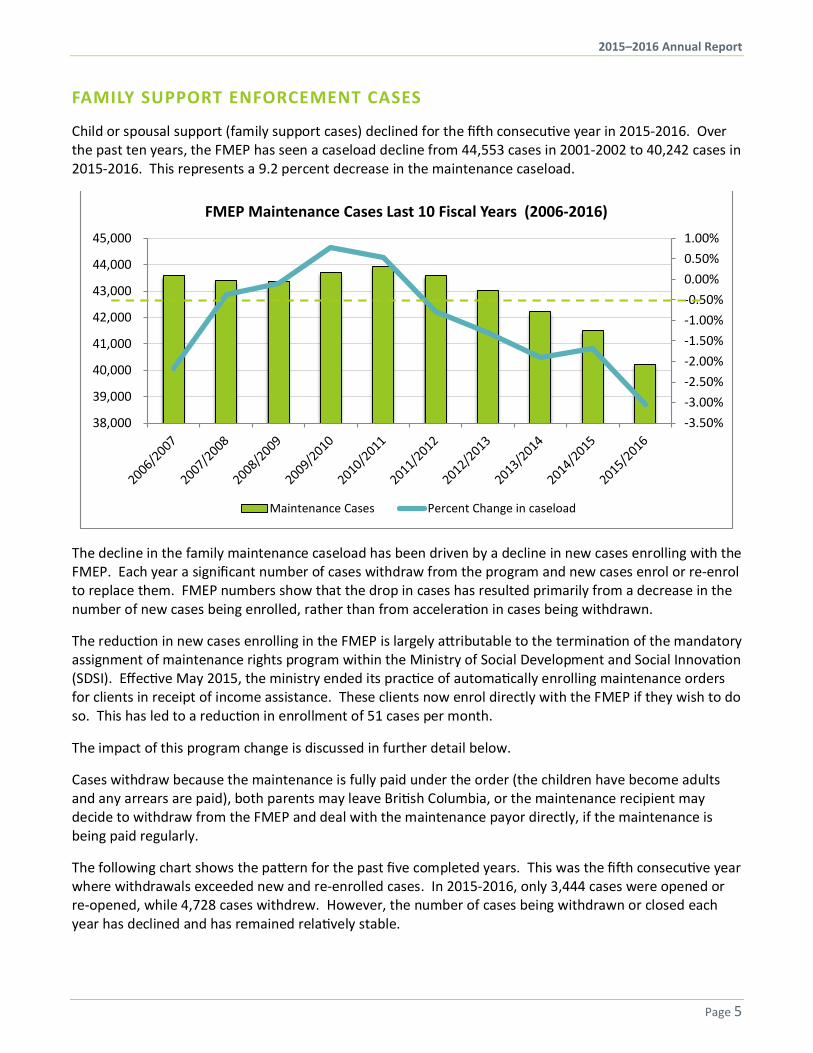
Child or spousal support (family support cases) declined for the fifth consecutive year in 2015-2016. Over the past ten years, the FMEP has seen a caseload decline from 44,553 cases in 2001-2002 to 40,242 cases in 2015-2016. This represents a 9.2 percent decrease in the maintenance caseload.
The decline in the family maintenance caseload has been driven by a decline in new cases enrolling with the FMEP. Each year a significant number of cases withdraw from the program and new cases enrol or re-enrol to replace them. FMEP numbers show that the drop in cases has resulted primarily from a decrease in the number of new cases being enrolled, rather than from acceleration in cases being withdrawn.
The reduction in new cases enrolling in the FMEP is largely attributable to the termination of the mandatory assignment of maintenance rights program within the Ministry of Social Development and Social Innovation (SDSI). Effective May 2015, the ministry ended its practice of automatically enrolling maintenance orders for clients in receipt of income assistance. These clients now enrol directly with the FMEP if they wish to do so. This has led to a reduction in enrollment of 51 cases per month.
The impact of this program change is discussed in further detail below.
Cases withdraw because the maintenance is fully paid under the order (the children have become adults and any arrears are paid), both parents may leave British Columbia, or the maintenance recipient may decide to withdraw from the FMEP and deal with the maintenance payor directly, if the maintenance is being paid regularly.
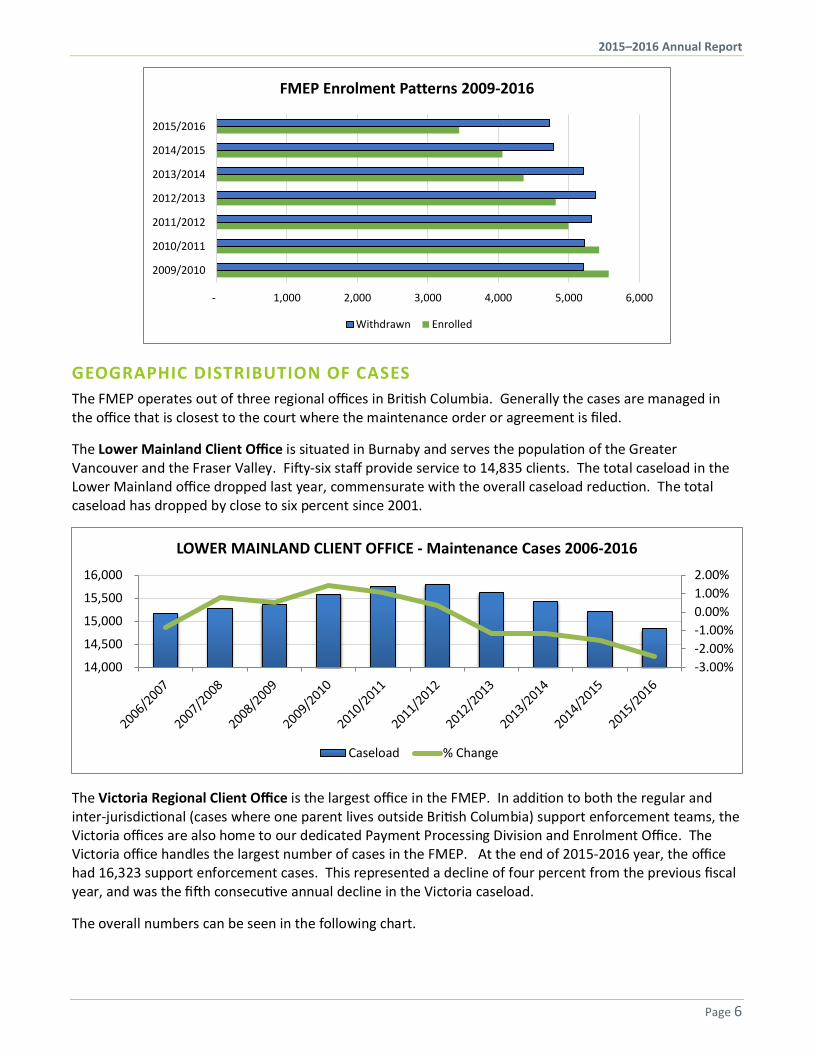
The following chart shows the pattern for the past five completed years. This was the fifth consecutive year where withdrawals exceeded new and re-enrolled cases. In 2015-2016, only 3,444 cases were opened or re-opened, while 4,728 cases withdrew. However, the number of cases being withdrawn or closed each year has declined and has remained relatively stable.
-3.50%-3.00%-2.50%-2.00%-1.50%-1.00%-0.50%0.00%0.50%1.00%
38,000
39,000
40,000
41,000
42,000
43,000
44,000
45,000
FMEP Maintenance Cases Last 10 Fiscal Years (2006-2016)
Maintenance Cases Percent Change in caseload
2015–2016 Annual Report
Page 6
GEOGRAPHIC DISTRIBUTION OF CASES The FMEP operates out of three regional offices in British Columbia. Generally the cases are managed in the office that is closest to the court where the maintenance order or agreement is filed.
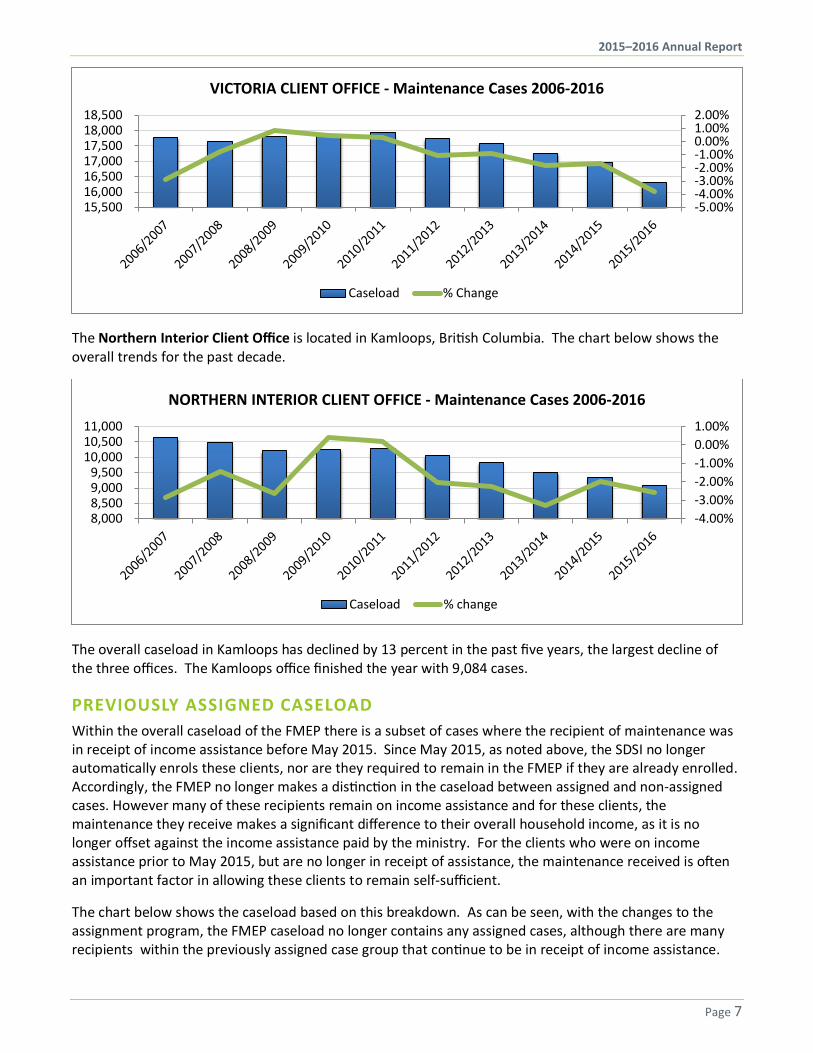
The Lower Mainland Client Office is situated in Burnaby and serves the population of the Greater Vancouver and the Fraser Valley. Fifty-six staff provide service to 14,835 clients. The total caseload in the Lower Mainland office dropped last year, commensurate with the overall caseload reduction. The total caseload has dropped by close to six percent since 2001.
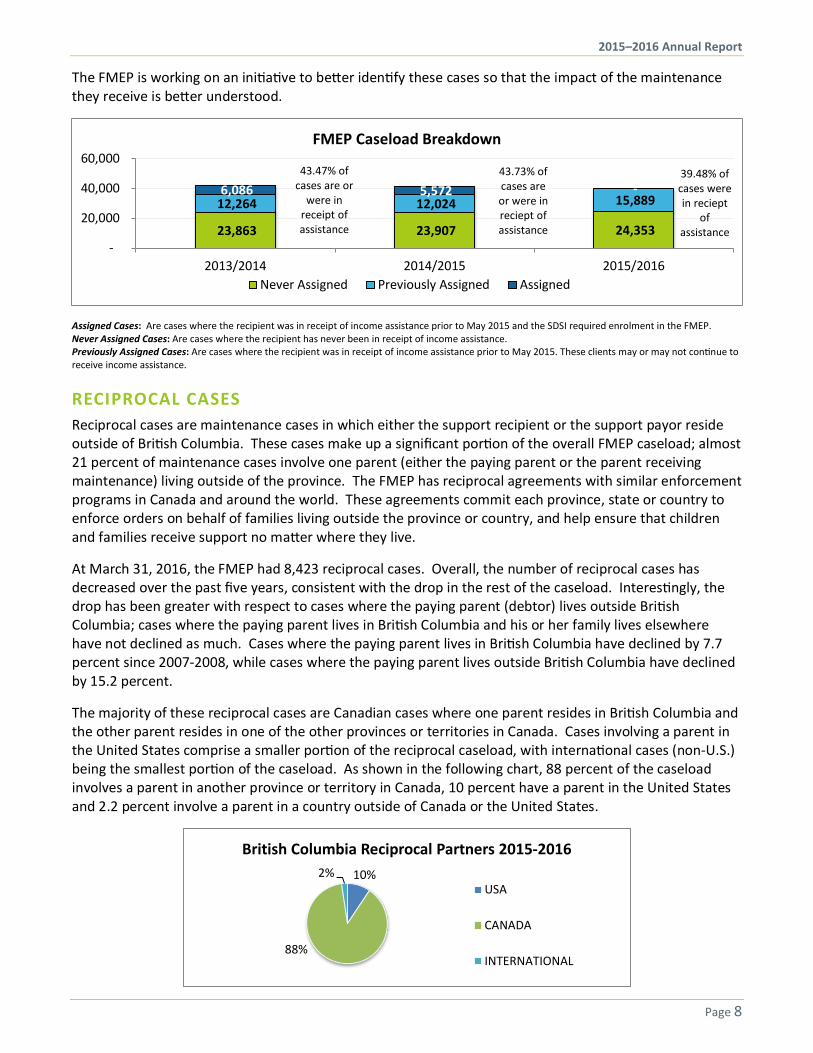
The Victoria Regional Client Office is the largest office in the FMEP. In addition to both the regular and inter-jurisdictional (cases where one parent lives outside British Columbia) support enforcement teams, the Victoria offices are also home to our dedicated Payment Processing Division and Enrolment Office. The Victoria office handles the largest number of cases in the FMEP. At the end of 2015-2016 year, the office had 16,323 support enforcement cases. This represented a decline of four percent from the previous fiscal year, and was the fifth consecutive annual decline in the Victoria caseload.
The overall numbers can be seen in the following chart.
- 1,000 2,000 3,000 4,000 5,000 6,000
2009/2010
2010/2011
2011/2012
2012/2013
2013/2014
2014/2015
2015/2016
FMEP Enrolment Patterns 2009-2016
Withdrawn Enrolled
-3.00%-2.00%-1.00%0.00%1.00%2.00%
14,000
14,500
15,000
15,500
16,000
LOWER MAINLAND CLIENT OFFICE - Maintenance Cases 2006-2016
Caseload % Change
2015–2016 Annual Report
Page 7
The Northern Interior Client Office is located in Kamloops, British Columbia. The chart below shows the overall trends for the past decade.
The overall caseload in Kamloops has declined by 13 percent in the past five years, the largest decline of the three offices. The Kamloops office finished the year with 9,084 cases.
PREVIOUSLY ASSIGNED CASELOAD Within the overall caseload of the FMEP there is a subset of cases where the recipient of maintenance was in receipt of income assistance before May 2015. Since May 2015, as noted above, the SDSI no longer automatically enrols these clients, nor are they required to remain in the FMEP if they are already enrolled. Accordingly, the FMEP no longer makes a distinction in the caseload between assigned and non-assigned cases. However many of these recipients remain on income assistance and for these clients, the maintenance they receive makes a significant difference to their overall household income, as it is no longer offset against the income assistance paid by the ministry. For the clients who were on income assistance prior to May 2015, but are no longer in receipt of assistance, the maintenance received is often an important factor in allowing these clients to remain self-sufficient.
The chart below shows the caseload based on this breakdown. As can be seen, with the changes to the assignment program, the FMEP caseload no longer contains any assigned cases, although there are many recipients within the previously assigned case group that continue to be in receipt of income assistance.
-5.00%-4.00%-3.00%-2.00%-1.00%0.00%1.00%2.00%
15,500 16,000 16,500 17,000 17,500 18,000 18,500
VICTORIA CLIENT OFFICE - Maintenance Cases 2006-2016
Caseload % Change
-4.00%-3.00%-2.00%-1.00%0.00%1.00%
8,000 8,500 9,000 9,500
10,000 10,500 11,000
NORTHERN INTERIOR CLIENT OFFICE - Maintenance Cases 2006-2016
Caseload % change
2015–2016 Annual Report
Page 8
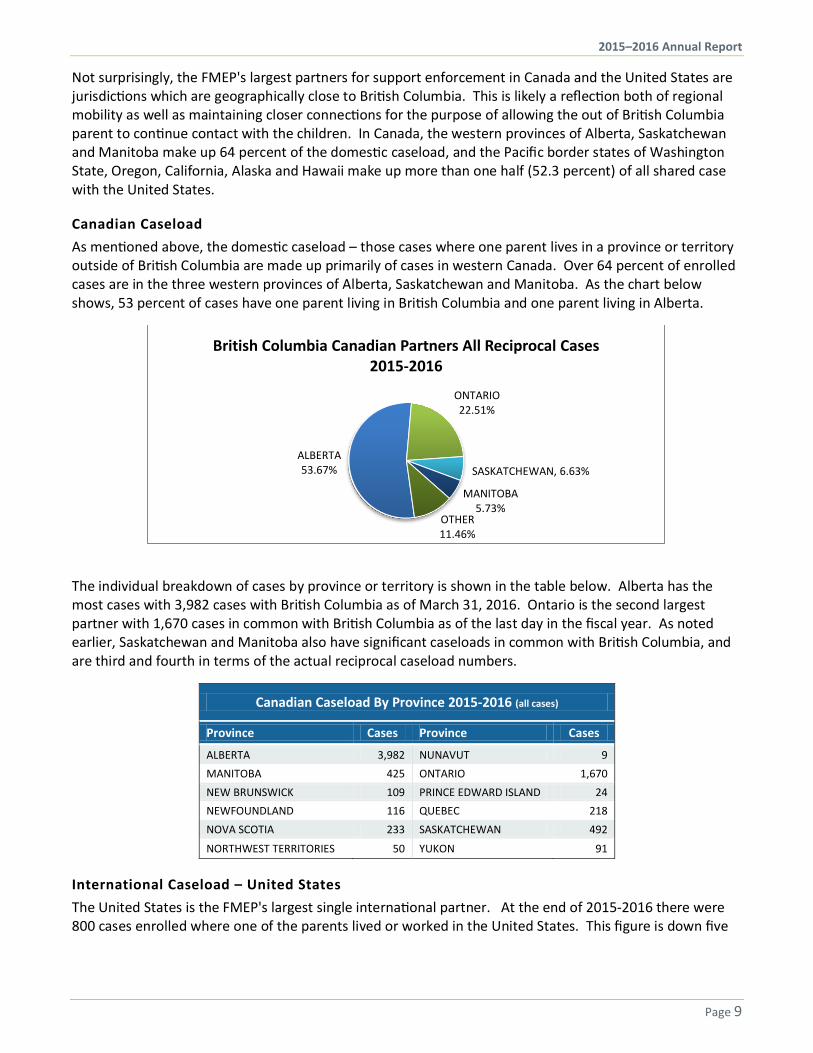
The FMEP is working on an initiative to better identify these cases so that the impact of the maintenance they receive is better understood.
Assigned Cases: Are cases where the recipient was in receipt of income assistance prior to May 2015 and the SDSI required enrolment in the FMEP. Never Assigned Cases: Are cases where the recipient has never been in receipt of income assistance. Previously Assigned Cases: Are cases where the recipient was in receipt of income assistance prior to May 2015. These clients may or may not continue to receive income assistance.
RECIPROCAL CASES Reciprocal cases are maintenance cases in which either the support recipient or the support payor reside outside of British Columbia. These cases make up a significant portion of the overall FMEP caseload; almost 21 percent of maintenance cases involve one parent (either the paying parent or the parent receiving maintenance) living outside of the province. The FMEP has reciprocal agreements with similar enforcement programs in Canada and around the world. These agreements commit each province, state or country to enforce orders on behalf of families living outside the province or country, and help ensure that children and families receive support no matter where they live.
At March 31, 2016, the FMEP had 8,423 reciprocal cases. Overall, the number of reciprocal cases has decreased over the past five years, consistent with the drop in the rest of the caseload. Interestingly, the drop has been greater with respect to cases where the paying parent (debtor) lives outside British Columbia; cases where the paying parent lives in British Columbia and his or her family lives elsewhere have not declined as much. Cases where the paying parent lives in British Columbia have declined by 7.7 percent since 2007-2008, while cases where the paying parent lives outside British Columbia have declined by 15.2 percent.
The majority of these reciprocal cases are Canadian cases where one parent resides in British Columbia and the other parent resides in one of the other provinces or territories in Canada. Cases involving a parent in the United States comprise a smaller portion of the reciprocal caseload, with international cases (non-U.S.) being the smallest portion of the caseload. As shown in the following chart, 88 percent of the caseload involves a parent in another province or territory in Canada, 10 percent have a parent in the United States and 2.2 percent involve a parent in a country outside of Canada or the United States.
23,863 23,907 24,353
12,264 12,024 15,889 6,086 5,572 -
-
20,000
40,000
60,000
2013/2014 2014/2015 2015/2016
FMEP Caseload Breakdown
Never Assigned Previously Assigned Assigned
43.47% of cases are or
were in receipt of assistance
43.73% of cases are or were in reciept of assistance
39.48% of cases werein reciept
of assistance
10%
88%
2%
British Columbia Reciprocal Partners 2015-2016
USA
CANADA
INTERNATIONAL
2015–2016 Annual Report
Page 9
Not surprisingly, the FMEP's largest partners for support enforcement in Canada and the United States are jurisdictions which are geographically close to British Columbia. This is likely a reflection both of regional mobility as well as maintaining closer connections for the purpose of allowing the out of British Columbia parent to continue contact with the children. In Canada, the western provinces of Alberta, Saskatchewan and Manitoba make up 64 percent of the domestic caseload, and the Pacific border states of Washington State, Oregon, California, Alaska and Hawaii make up more than one half (52.3 percent) of all shared case with the United States.
Canadian Caseload As mentioned above, the domestic caseload – those cases where one parent lives in a province or territory outside of British Columbia are made up primarily of cases in western Canada. Over 64 percent of enrolled cases are in the three western provinces of Alberta, Saskatchewan and Manitoba. As the chart below shows, 53 percent of cases have one parent living in British Columbia and one parent living in Alberta.
The individual breakdown of cases by province or territory is shown in the table below. Alberta has the most cases with 3,982 cases with British Columbia as of March 31, 2016. Ontario is the second largest partner with 1,670 cases in common with British Columbia as of the last day in the fiscal year. As noted earlier, Saskatchewan and Manitoba also have significant caseloads in common with British Columbia, and are third and fourth in terms of the actual reciprocal caseload numbers.
Canadian Caseload By Province 2015-2016 (all cases)
Province Cases Province Cases
ALBERTA 3,982 NUNAVUT 9 MANITOBA 425 ONTARIO 1,670 NEW BRUNSWICK 109 PRINCE EDWARD ISLAND 24 NEWFOUNDLAND 116 QUEBEC 218 NOVA SCOTIA 233 SASKATCHEWAN 492
NORTHWEST TERRITORIES 50 YUKON 91
International Caseload – United States The United States is the FMEP's largest single international partner. At the end of 2015-2016 there were 800 cases enrolled where one of the parents lived or worked in the United States. This figure is down five
ALBERTA53.67%
ONTARIO22.51%
SASKATCHEWAN, 6.63%
MANITOBA5.73%
OTHER11.46%
British Columbia Canadian Partners All Reciprocal Cases 2015-2016
2015–2016 Annual Report
Page 10
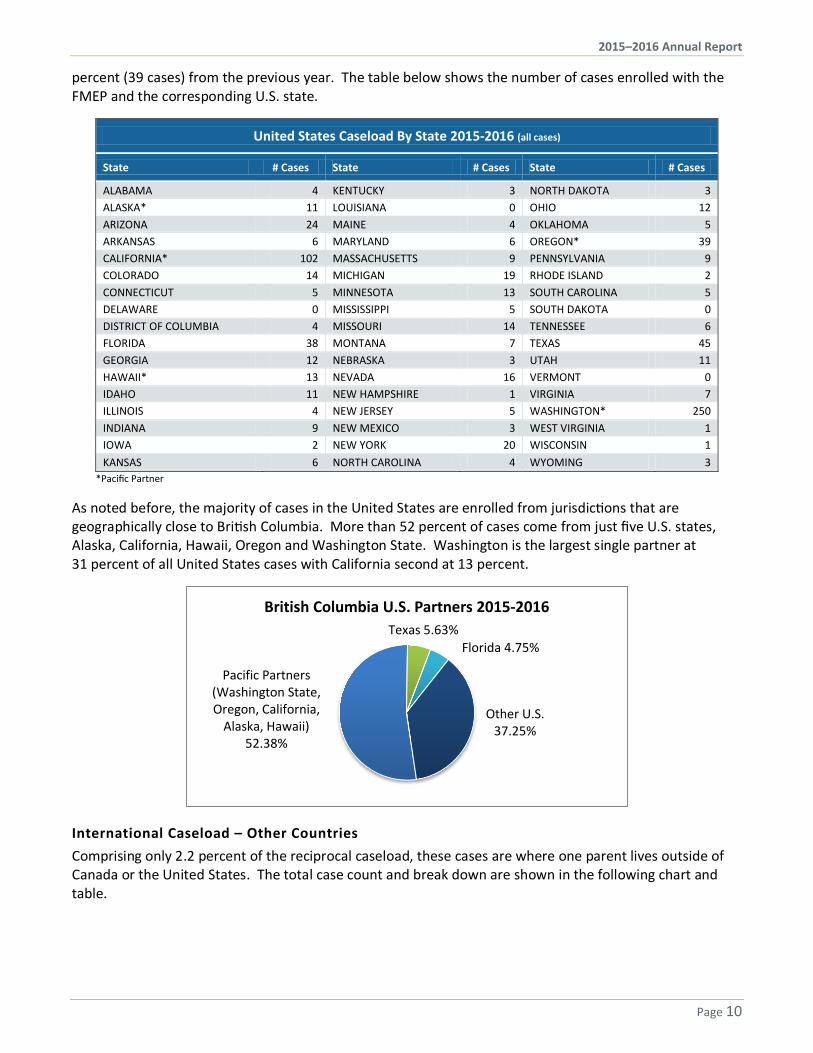
percent (39 cases) from the previous year. The table below shows the number of cases enrolled with the FMEP and the corresponding U.S. state.
United States Caseload By State 2015-2016 (all cases)
State # Cases State # Cases State # Cases
ALABAMA 4 KENTUCKY 3 NORTH DAKOTA 3 ALASKA* 11 LOUISIANA 0 OHIO 12 ARIZONA 24 MAINE 4 OKLAHOMA 5 ARKANSAS 6 MARYLAND 6 OREGON* 39 CALIFORNIA* 102 MASSACHUSETTS 9 PENNSYLVANIA 9 COLORADO 14 MICHIGAN 19 RHODE ISLAND 2 CONNECTICUT 5 MINNESOTA 13 SOUTH CAROLINA 5 DELAWARE 0 MISSISSIPPI 5 SOUTH DAKOTA 0 DISTRICT OF COLUMBIA 4 MISSOURI 14 TENNESSEE 6 FLORIDA 38 MONTANA 7 TEXAS 45 GEORGIA 12 NEBRASKA 3 UTAH 11 HAWAII* 13 NEVADA 16 VERMONT 0 IDAHO 11 NEW HAMPSHIRE 1 VIRGINIA 7 ILLINOIS 4 NEW JERSEY 5 WASHINGTON* 250 INDIANA 9 NEW MEXICO 3 WEST VIRGINIA 1 IOWA 2 NEW YORK 20 WISCONSIN 1 KANSAS 6 NORTH CAROLINA 4 WYOMING 3
*Pacific Partner
As noted before, the majority of cases in the United States are enrolled from jurisdictions that are geographically close to British Columbia. More than 52 percent of cases come from just five U.S. states, Alaska, California, Hawaii, Oregon and Washington State. Washington is the largest single partner at 31 percent of all United States cases with California second at 13 percent.
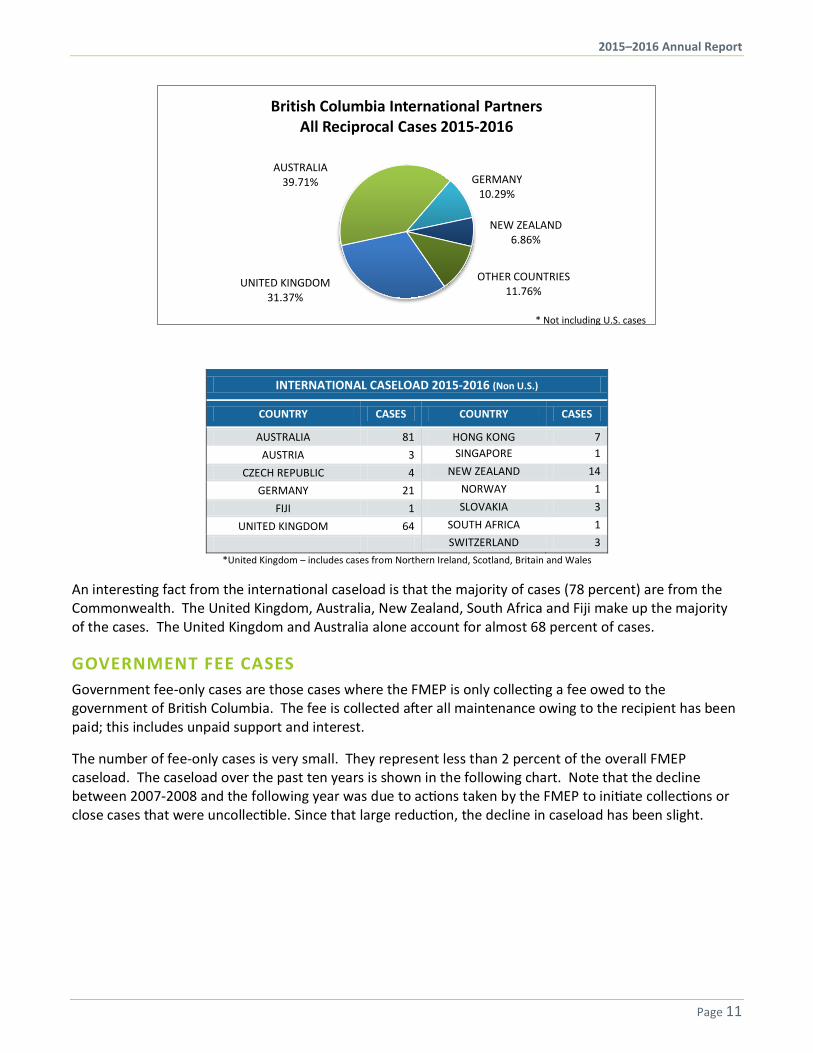
International Caseload – Other Countries Comprising only 2.2 percent of the reciprocal caseload, these cases are where one parent lives outside of Canada or the United States. The total case count and break down are shown in the following chart and table.
Pacific Partners (Washington State, Oregon, California,
Alaska, Hawaii)52.38%
Texas 5.63%Florida 4.75%
Other U.S. 37.25%
British Columbia U.S. Partners 2015-2016
2015–2016 Annual Report
Page 11
INTERNATIONAL CASELOAD 2015-2016 (Non U.S.)
COUNTRY CASES COUNTRY CASES
AUSTRALIA 81 HONG KONG 7 AUSTRIA 3 SINGAPORE 1
CZECH REPUBLIC 4 NEW ZEALAND 14
GERMANY 21 NORWAY 1
FIJI 1 SLOVAKIA 3
UNITED KINGDOM 64 SOUTH AFRICA 1
SWITZERLAND 3 *United Kingdom – includes cases from Northern Ireland, Scotland, Britain and Wales
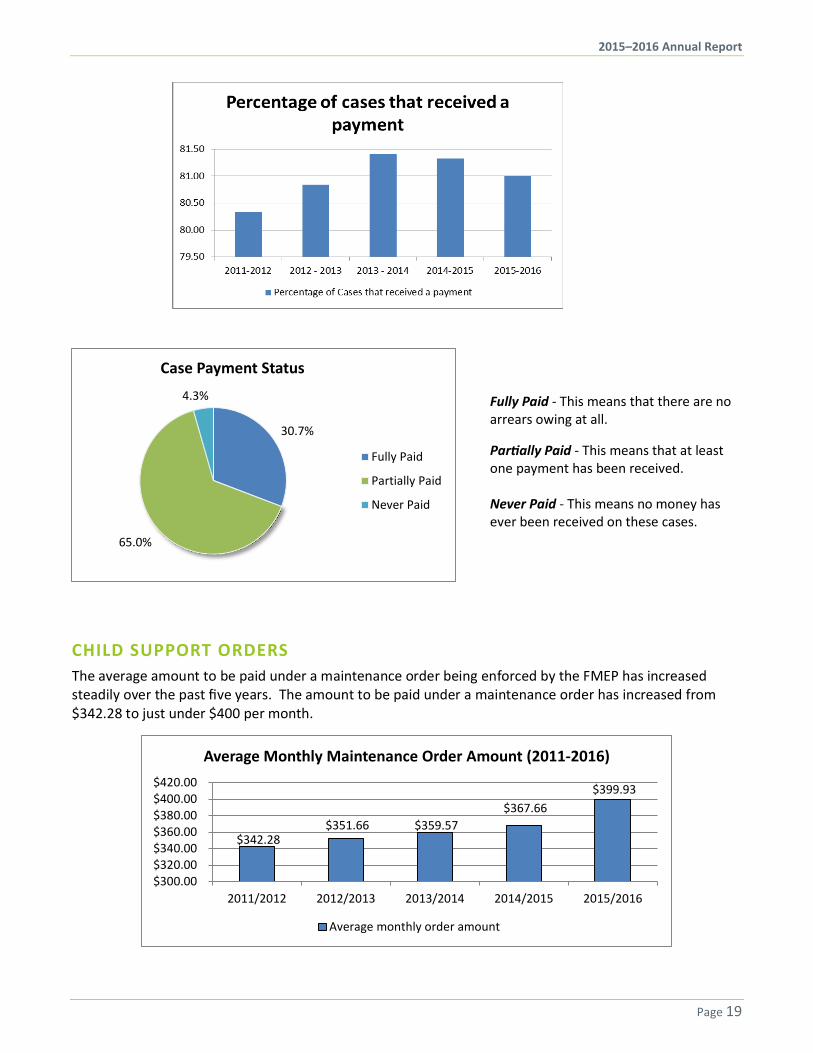
An interesting fact from the international caseload is that the majority of cases (78 percent) are from the Commonwealth. The United Kingdom, Australia, New Zealand, South Africa and Fiji make up the majority of the cases. The United Kingdom and Australia alone account for almost 68 percent of cases.
GOVERNMENT FEE CASES Government fee-only cases are those cases where the FMEP is only collecting a fee owed to the government of British Columbia. The fee is collected after all maintenance owing to the recipient has been paid; this includes unpaid support and interest.
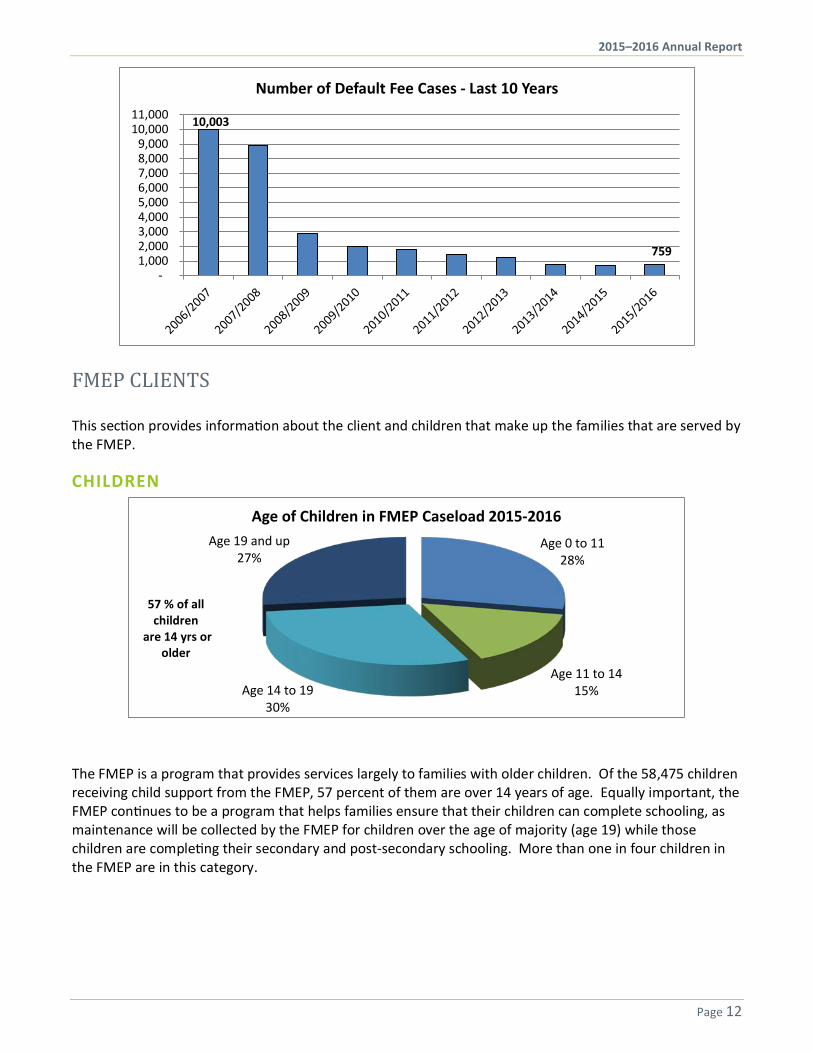
The number of fee-only cases is very small. They represent less than 2 percent of the overall FMEP caseload. The caseload over the past ten years is shown in the following chart. Note that the decline between 2007-2008 and the following year was due to actions taken by the FMEP to initiate collections or close cases that were uncollectible. Since that large reduction, the decline in caseload has been slight.
UNITED KINGDOM31.37%
AUSTRALIA39.71% GERMANY
10.29%
NEW ZEALAND6.86%
OTHER COUNTRIES11.76%
British Columbia International PartnersAll Reciprocal Cases 2015-2016
* Not including U.S. cases
2015–2016 Annual Report
Page 12
FMEP CLIENTS This section provides information about the client and children that make up the families that are served by the FMEP.
CHILDREN
The FMEP is a program that provides services largely to families with older children. Of the 58,475 children receiving child support from the FMEP, 57 percent of them are over 14 years of age. Equally important, the FMEP continues to be a program that helps families ensure that their children can complete schooling, as maintenance will be collected by the FMEP for children over the age of majority (age 19) while those children are completing their secondary and post-secondary schooling. More than one in four children in the FMEP are in this category.
10,003
759
- 1,000 2,000 3,000 4,000 5,000 6,000 7,000 8,000 9,000
10,000 11,000
Number of Default Fee Cases - Last 10 Years
Age 0 to 1128%
Age 11 to 1415%Age 14 to 19
30%
Age 19 and up27%
Age of Children in FMEP Caseload 2015-2016
57 % of all children
are 14 yrs or older
2015–2016 Annual Report
Page 13
PERCENTAGE OF BRITISH COLUMBIA CHILDREN ENROLLED IN THE FMEP 2015-2016
2016 BC Census Data
FMEP Enrolment
Figures
Percentage of Children
Enrolled in FMEP
2016 BC Census Data
FMEP Enrolment
Figures
Percentage of Children
Enrolled in FMEP
Child 0 - 24 1,292,986 53,502 4.13% 12 years 46,322 2,863 6.18% 0 years 44,614 13 0.03% 13 years 46,579 2,872 6.17% 1 year 45,176 124 0.27% 14 years 46,797 3,156 6.74% 2 years 44,966 351 0.78% 15 years 48,910 3,231 6.61% 3 years 45,710 627 1.37% 16 years 51,733 3,581 6.92% 4 years 45,400 942 2.07% 17 years 53,693 3,718 6.92% 5 years 45,684 1,235 2.70% 18 years 56,592 3,812 6.74% 6 years 46,548 1,597 3.43% 19 years 61,630 3,187 5.17% 7 years 47,335 1,882 3.98% 20 years 65,695 2,896 4.41% 8 years 47,443 2,176 4.59% 21 years 66,448 2,544 3.83% 9 years 46,905 2,350 5.01% 22 years 65,537 2,033 3.10%
10 years 46,120 2,464 5.34% 23 years 65,050 1,740 2.67% 11 years 45,928 2,596 5.65% 24 years 64,155 1,512 2.36%
Source: Statistics Canada. Table 051-0001 - Estimates of population, by age group and sex for July 1, Canada, provinces and territories, annual (persons unless otherwise noted), CANSIM (database accessed: 2016-11-22) and FMEP Annual Report 2015-2016.
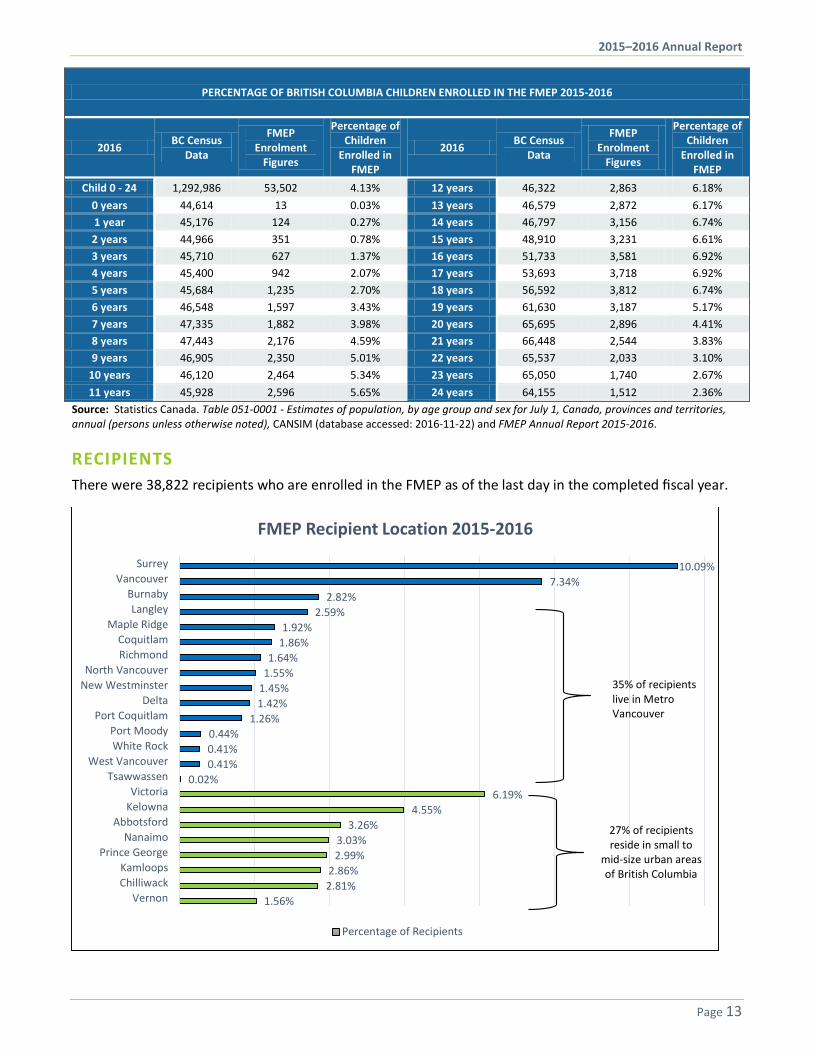
RECIPIENTS There were 38,822 recipients who are enrolled in the FMEP as of the last day in the completed fiscal year.
10.09%7.34%
2.82%2.59%
1.92%1.86%
1.64%1.55%
1.45%1.42%
1.26%0.44%0.41%0.41%
0.02%6.19%
4.55%3.26%
3.03%2.99%
2.86%2.81%
1.56%
SurreyVancouver
BurnabyLangley
Maple RidgeCoquitlamRichmond
North VancouverNew Westminster
DeltaPort Coquitlam
Port MoodyWhite Rock
West VancouverTsawwassen
VictoriaKelowna
AbbotsfordNanaimo
Prince GeorgeKamloopsChilliwack
Vernon
FMEP Recipient Location 2015-2016
Percentage of Recipients
35% of recipients live in Metro Vancouver
27% of recipients reside in small to
mid-size urban areas of British Columbia
2015–2016 Annual Report
Page 14
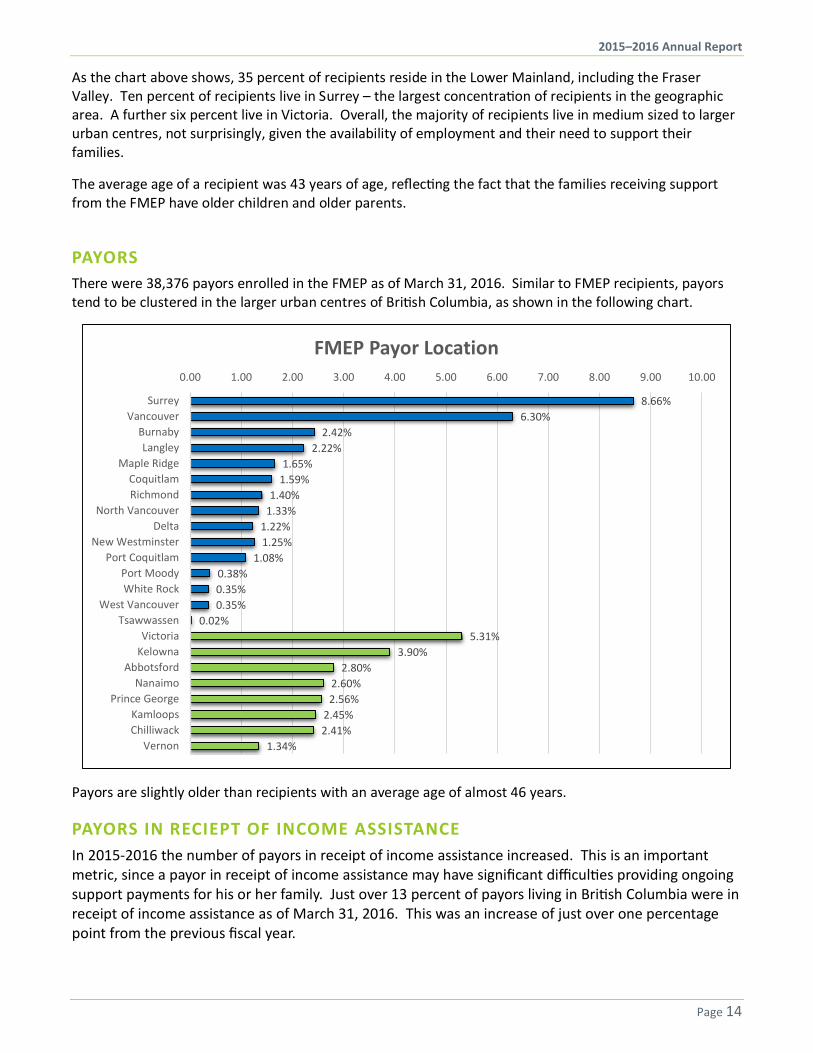
As the chart above shows, 35 percent of recipients reside in the Lower Mainland, including the Fraser Valley. Ten percent of recipients live in Surrey – the largest concentration of recipients in the geographic area. A further six percent live in Victoria. Overall, the majority of recipients live in medium sized to larger urban centres, not surprisingly, given the availability of employment and their need to support their families.
The average age of a recipient was 43 years of age, reflecting the fact that the families receiving support from the FMEP have older children and older parents.
PAYORS There were 38,376 payors enrolled in the FMEP as of March 31, 2016. Similar to FMEP recipients, payors tend to be clustered in the larger urban centres of British Columbia, as shown in the following chart.
Payors are slightly older than recipients with an average age of almost 46 years.
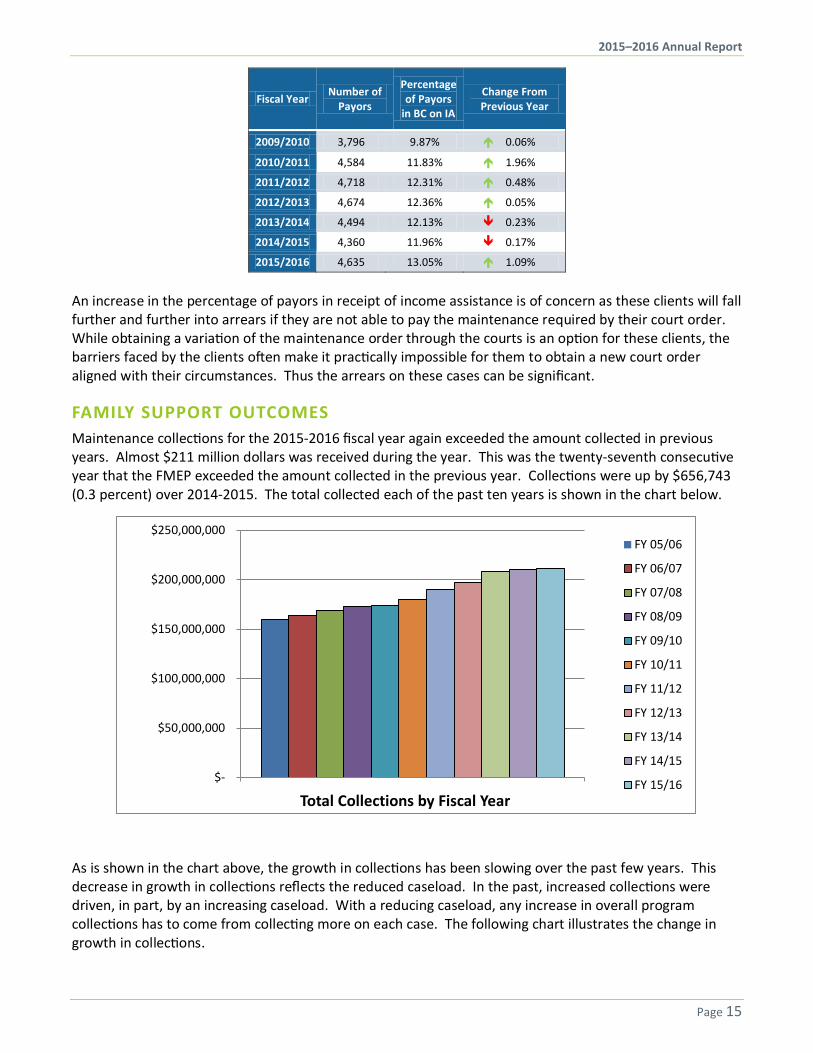
PAYORS IN RECIEPT OF INCOME ASSISTANCE In 2015-2016 the number of payors in receipt of income assistance increased. This is an important metric, since a payor in receipt of income assistance may have significant difficulties providing ongoing support payments for his or her family. Just over 13 percent of payors living in British Columbia were in receipt of income assistance as of March 31, 2016. This was an increase of just over one percentage point from the previous fiscal year.
8.66%6.30%
2.42%2.22%
1.65%1.59%
1.40%1.33%
1.22%1.25%
1.08%0.38%0.35%0.35%
0.02%5.31%
3.90%2.80%
2.60%2.56%
2.45%2.41%
1.34%
0.00 1.00 2.00 3.00 4.00 5.00 6.00 7.00 8.00 9.00 10.00
SurreyVancouver
BurnabyLangley
Maple RidgeCoquitlamRichmond
North VancouverDelta
New WestminsterPort Coquitlam
Port MoodyWhite Rock
West VancouverTsawwassen
VictoriaKelowna
AbbotsfordNanaimo
Prince GeorgeKamloopsChilliwack
Vernon
FMEP Payor Location
2015–2016 Annual Report
Page 15
Fiscal Year Number of Payors
Percentage of Payors
in BC on IA
Change From Previous Year
2009/2010 3,796 9.87% 0.06%
2010/2011 4,584 11.83% 1.96%
2011/2012 4,718 12.31% 0.48%
2012/2013 4,674 12.36% 0.05%
2013/2014 4,494 12.13% 0.23%
2014/2015 4,360 11.96% 0.17%
2015/2016 4,635 13.05% 1.09%
An increase in the percentage of payors in receipt of income assistance is of concern as these clients will fall further and further into arrears if they are not able to pay the maintenance required by their court order. While obtaining a variation of the maintenance order through the courts is an option for these clients, the barriers faced by the clients often make it practically impossible for them to obtain a new court order aligned with their circumstances. Thus the arrears on these cases can be significant.
FAMILY SUPPORT OUTCOMES Maintenance collections for the 2015-2016 fiscal year again exceeded the amount collected in previous years. Almost $211 million dollars was received during the year. This was the twenty-seventh consecutive year that the FMEP exceeded the amount collected in the previous year. Collections were up by $656,743 (0.3 percent) over 2014-2015. The total collected each of the past ten years is shown in the chart below.
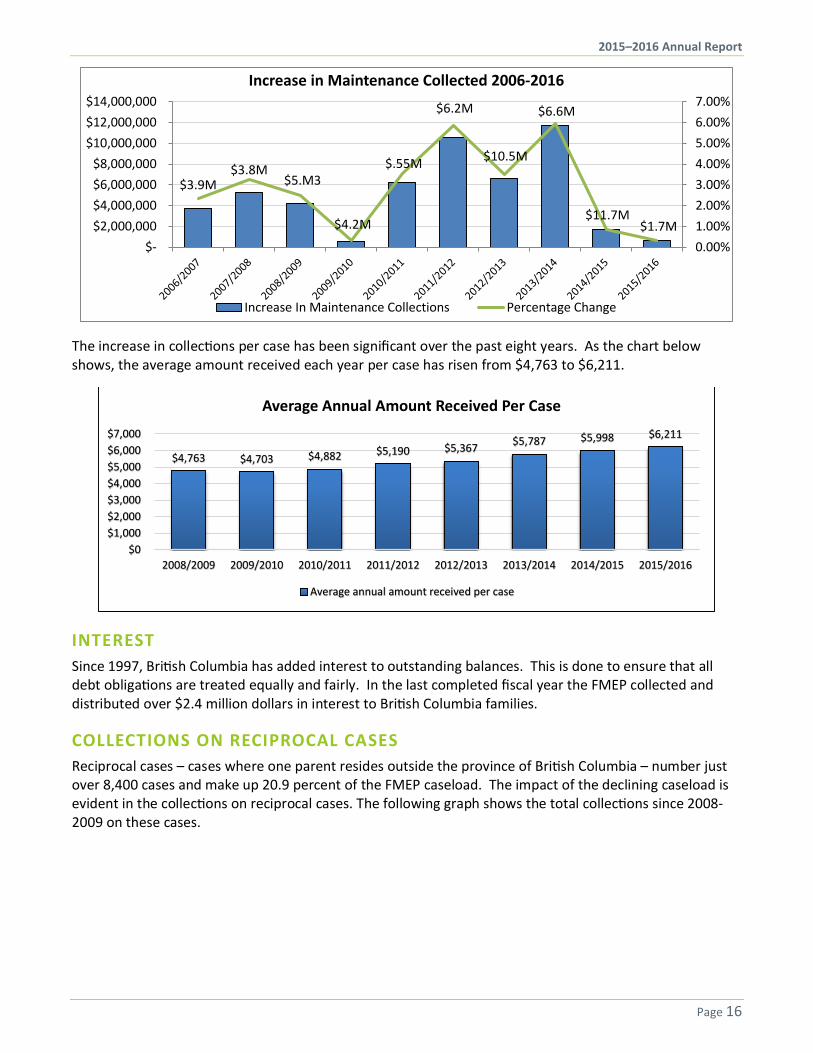
As is shown in the chart above, the growth in collections has been slowing over the past few years. This decrease in growth in collections reflects the reduced caseload. In the past, increased collections were driven, in part, by an increasing caseload. With a reducing caseload, any increase in overall program collections has to come from collecting more on each case. The following chart illustrates the change in growth in collections.
$-
$50,000,000
$100,000,000
$150,000,000
$200,000,000
$250,000,000
Total Collections by Fiscal Year
FY 05/06
FY 06/07
FY 07/08
FY 08/09
FY 09/10
FY 10/11
FY 11/12
FY 12/13
FY 13/14
FY 14/15
FY 15/16
2015–2016 Annual Report
Page 16
The increase in collections per case has been significant over the past eight years. As the chart below shows, the average amount received each year per case has risen from $4,763 to $6,211.
INTEREST Since 1997, British Columbia has added interest to outstanding balances. This is done to ensure that all debt obligations are treated equally and fairly. In the last completed fiscal year the FMEP collected and distributed over $2.4 million dollars in interest to British Columbia families.
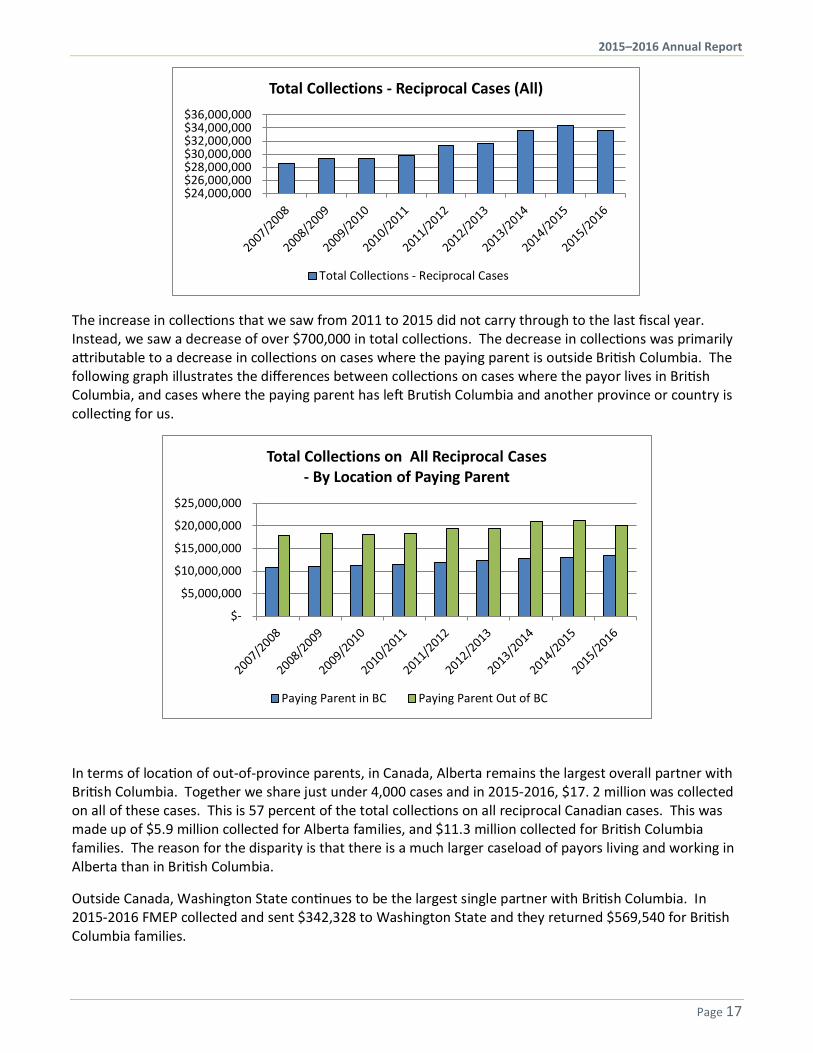
COLLECTIONS ON RECIPROCAL CASES Reciprocal cases – cases where one parent resides outside the province of British Columbia – number just over 8,400 cases and make up 20.9 percent of the FMEP caseload. The impact of the declining caseload is evident in the collections on reciprocal cases. The following graph shows the total collections since 2008-2009 on these cases.
$3.9M$3.8M
$5.M3
$4.2M
$.55M
$6.2M
$10.5M
$6.6M
$11.7M $1.7M
0.00%1.00%2.00%3.00%4.00%5.00%6.00%7.00%
$- $2,000,000 $4,000,000 $6,000,000 $8,000,000
$10,000,000 $12,000,000 $14,000,000
Increase in Maintenance Collected 2006-2016
Increase In Maintenance Collections Percentage Change
$4,763 $4,703 $4,882 $5,190 $5,367 $5,787 $5,998 $6,211
$0$1,000$2,000$3,000$4,000$5,000$6,000$7,000
2008/2009 2009/2010 2010/2011 2011/2012 2012/2013 2013/2014 2014/2015 2015/2016
Average Annual Amount Received Per Case
Average annual amount received per case
2015–2016 Annual Report
Page 17
The increase in collections that we saw from 2011 to 2015 did not carry through to the last fiscal year. Instead, we saw a decrease of over $700,000 in total collections. The decrease in collections was primarily attributable to a decrease in collections on cases where the paying parent is outside British Columbia. The following graph illustrates the differences between collections on cases where the payor lives in British Columbia, and cases where the paying parent has left Brutish Columbia and another province or country is collecting for us.
In terms of location of out-of-province parents, in Canada, Alberta remains the largest overall partner with British Columbia. Together we share just under 4,000 cases and in 2015-2016, $17. 2 million was collected on all of these cases. This is 57 percent of the total collections on all reciprocal Canadian cases. This was made up of $5.9 million collected for Alberta families, and $11.3 million collected for British Columbia families. The reason for the disparity is that there is a much larger caseload of payors living and working in Alberta than in British Columbia.
Outside Canada, Washington State continues to be the largest single partner with British Columbia. In 2015-2016 FMEP collected and sent $342,328 to Washington State and they returned $569,540 for British Columbia families.
$24,000,000 $26,000,000 $28,000,000 $30,000,000 $32,000,000 $34,000,000 $36,000,000
Total Collections - Reciprocal Cases (All)
Total Collections - Reciprocal Cases
$-
$5,000,000
$10,000,000
$15,000,000
$20,000,000
$25,000,000
Total Collections on All Reciprocal Cases- By Location of Paying Parent
Paying Parent in BC Paying Parent Out of BC
2015–2016 Annual Report
Page 18
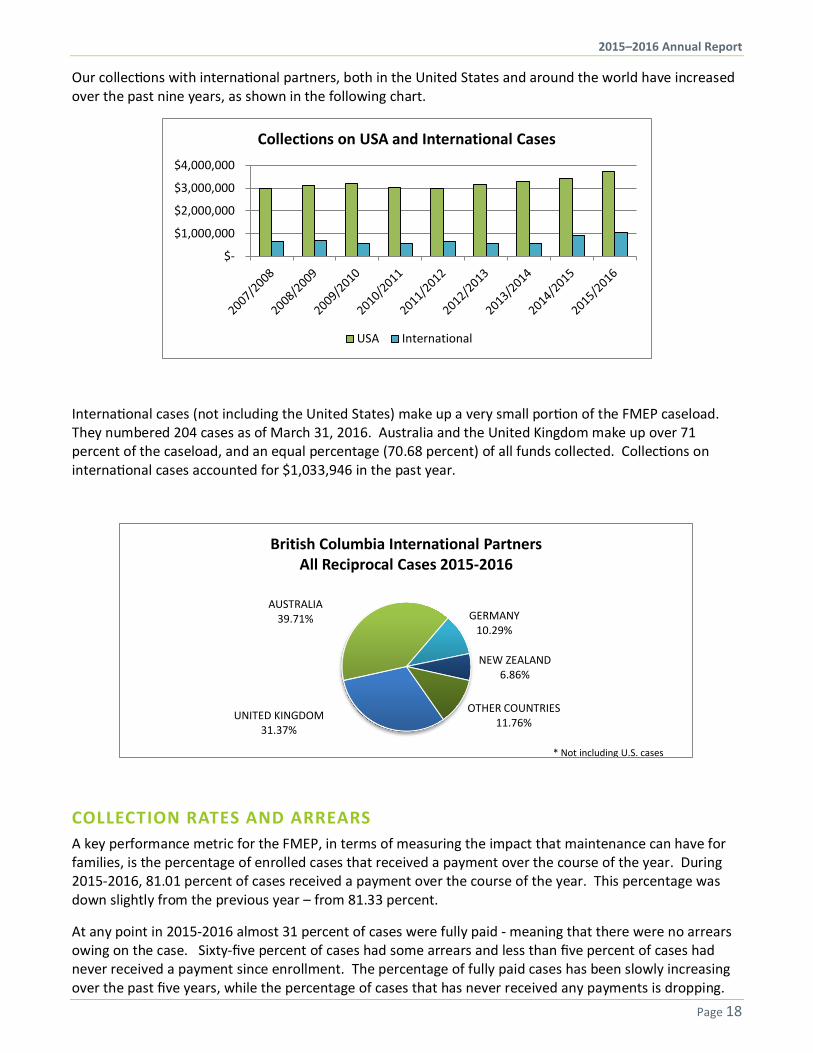
Our collections with international partners, both in the United States and around the world have increased over the past nine years, as shown in the following chart.
International cases (not including the United States) make up a very small portion of the FMEP caseload. They numbered 204 cases as of March 31, 2016. Australia and the United Kingdom make up over 71 percent of the caseload, and an equal percentage (70.68 percent) of all funds collected. Collections on international cases accounted for $1,033,946 in the past year.
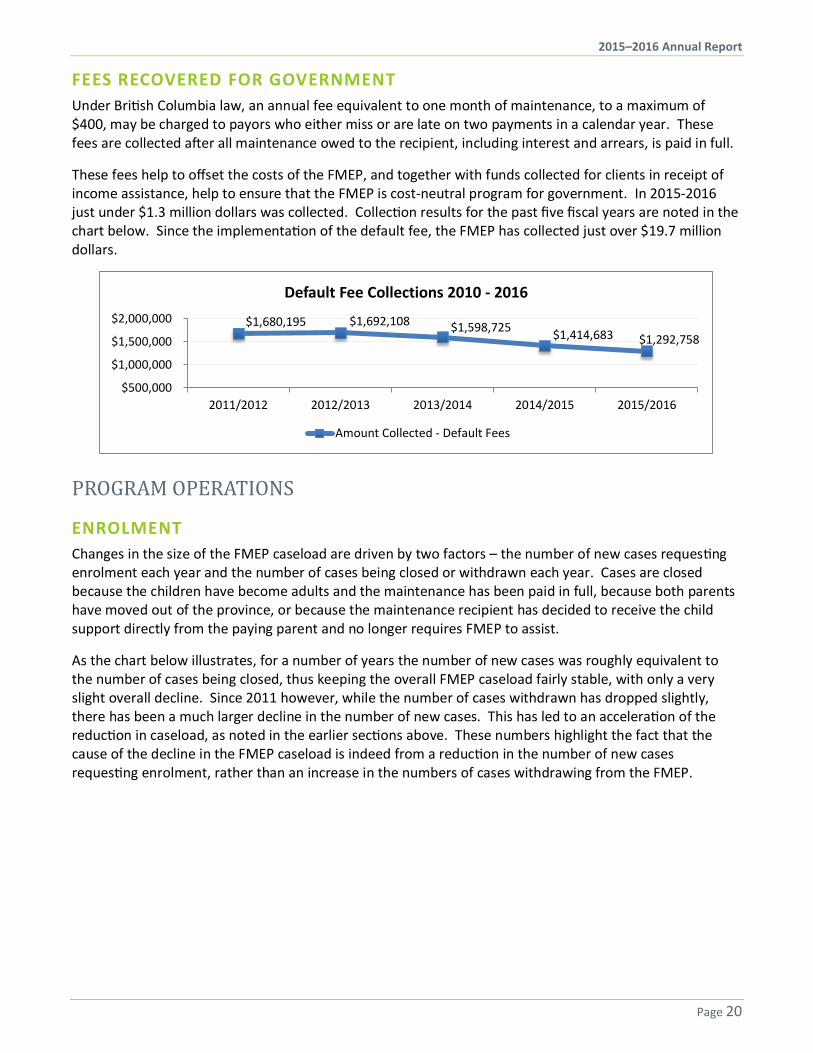
COLLECTION RATES AND ARREARS A key performance metric for the FMEP, in terms of measuring the impact that maintenance can have for families, is the percentage of enrolled cases that received a payment over the course of the year. During 2015-2016, 81.01 percent of cases received a payment over the course of the year. This percentage was down slightly from the previous year – from 81.33 percent.
At any point in 2015-2016 almost 31 percent of cases were fully paid - meaning that there were no arrears owing on the case. Sixty-five percent of cases had some arrears and less than five percent of cases had never received a payment since enrollment. The percentage of fully paid cases has been slowly increasing over the past five years, while the percentage of cases that has never received any payments is dropping.
$-
$1,000,000
$2,000,000
$3,000,000
$4,000,000
Collections on USA and International Cases
USA International
UNITED KINGDOM31.37%
AUSTRALIA39.71% GERMANY
10.29%
NEW ZEALAND6.86%
OTHER COUNTRIES11.76%
British Columbia International PartnersAll Reciprocal Cases 2015-2016
* Not including U.S. cases
2015–2016 Annual Report
Page 19
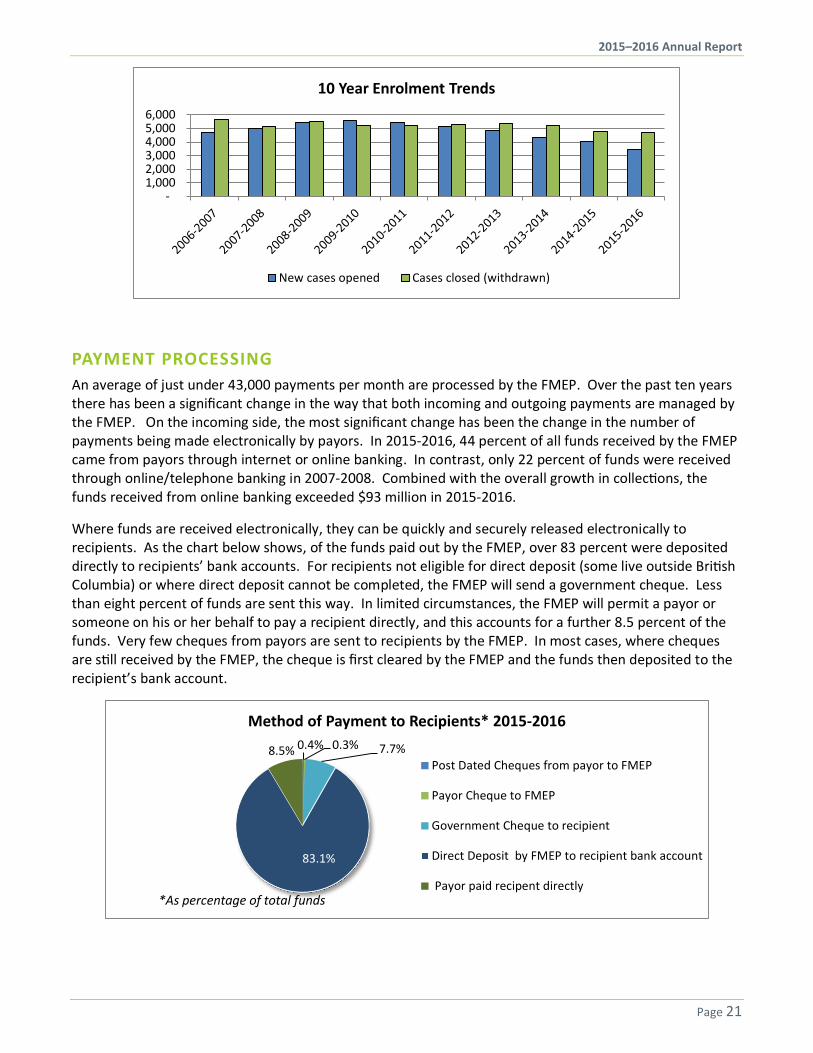
CHILD SUPPORT ORDERS The average amount to be paid under a maintenance order being enforced by the FMEP has increased steadily over the past five years. The amount to be paid under a maintenance order has increased from $342.28 to just under $400 per month.
30.7%
65.0%
4.3%
Case Payment Status
Fully Paid
Partially Paid
Never Paid
$342.28 $351.66 $359.57
$367.66 $399.93
$300.00 $320.00 $340.00 $360.00 $380.00 $400.00 $420.00
2011/2012 2012/2013 2013/2014 2014/2015 2015/2016
Average Monthly Maintenance Order Amount (2011-2016)
Average monthly order amount
Fully Paid - This means that there are no arrears owing at all.
Partially Paid - This means that at least one payment has been received.
Never Paid - This means no money has ever been received on these cases.
2015–2016 Annual Report
Page 20
FEES RECOVERED FOR GOVERNMENT Under British Columbia law, an annual fee equivalent to one month of maintenance, to a maximum of $400, may be charged to payors who either miss or are late on two payments in a calendar year. These fees are collected after all maintenance owed to the recipient, including interest and arrears, is paid in full.
These fees help to offset the costs of the FMEP, and together with funds collected for clients in receipt of income assistance, help to ensure that the FMEP is cost-neutral program for government. In 2015-2016 just under $1.3 million dollars was collected. Collection results for the past five fiscal years are noted in the chart below. Since the implementation of the default fee, the FMEP has collected just over $19.7 million dollars.
PROGRAM OPERATIONS
ENROLMENT Changes in the size of the FMEP caseload are driven by two factors – the number of new cases requesting enrolment each year and the number of cases being closed or withdrawn each year. Cases are closed because the children have become adults and the maintenance has been paid in full, because both parents have moved out of the province, or because the maintenance recipient has decided to receive the child support directly from the paying parent and no longer requires FMEP to assist.
As the chart below illustrates, for a number of years the number of new cases was roughly equivalent to the number of cases being closed, thus keeping the overall FMEP caseload fairly stable, with only a very slight overall decline. Since 2011 however, while the number of cases withdrawn has dropped slightly, there has been a much larger decline in the number of new cases. This has led to an acceleration of the reduction in caseload, as noted in the earlier sections above. These numbers highlight the fact that the cause of the decline in the FMEP caseload is indeed from a reduction in the number of new cases requesting enrolment, rather than an increase in the numbers of cases withdrawing from the FMEP.
$1,680,195 $1,692,108 $1,598,725 $1,414,683 $1,292,758
$500,000
$1,000,000
$1,500,000
$2,000,000
2011/2012 2012/2013 2013/2014 2014/2015 2015/2016
Default Fee Collections 2010 - 2016
Amount Collected - Default Fees
2015–2016 Annual Report
Page 21
PAYMENT PROCESSING An average of just under 43,000 payments per month are processed by the FMEP. Over the past ten years there has been a significant change in the way that both incoming and outgoing payments are managed by the FMEP. On the incoming side, the most significant change has been the change in the number of payments being made electronically by payors. In 2015-2016, 44 percent of all funds received by the FMEP came from payors through internet or online banking. In contrast, only 22 percent of funds were received through online/telephone banking in 2007-2008. Combined with the overall growth in collections, the funds received from online banking exceeded $93 million in 2015-2016.
Where funds are received electronically, they can be quickly and securely released electronically to recipients. As the chart below shows, of the funds paid out by the FMEP, over 83 percent were deposited directly to recipients’ bank accounts. For recipients not eligible for direct deposit (some live outside British Columbia) or where direct deposit cannot be completed, the FMEP will send a government cheque. Less than eight percent of funds are sent this way. In limited circumstances, the FMEP will permit a payor or someone on his or her behalf to pay a recipient directly, and this accounts for a further 8.5 percent of the funds. Very few cheques from payors are sent to recipients by the FMEP. In most cases, where cheques are still received by the FMEP, the cheque is first cleared by the FMEP and the funds then deposited to the recipient’s bank account.
- 1,000 2,000 3,000 4,000 5,000 6,000
10 Year Enrolment Trends
New cases opened Cases closed (withdrawn)
0.4% 0.3% 7.7%
83.1%
8.5%
Method of Payment to Recipients* 2015-2016
Post Dated Cheques from payor to FMEP
Payor Cheque to FMEP
Government Cheque to recipient
Direct Deposit by FMEP to recipient bank account
Payor paid recipent directly*As percentage of total funds
2015–2016 Annual Report
Page 22
ENFORCEMENT Where maintenance payments are not made voluntarily, the FMEP will issue various types of enforcement to collect the unpaid maintenance. Court enforcement (taking a payor to court to explain why payments are not being made) is generally only used as a last resort. In most cases the unpaid maintenance can be recovered using non-court processes such as the interception of wages or other types of payments, or through the restriction of licenses and privileges, such as a passport denial, or driving license restriction.
ADMINISTRATIVE ENFORCEMENT The FMEP always attempts to make a voluntary payment arrangement with payors. Negotiation on payment of ongoing maintenance and the arrears is a cornerstone of the client centric focus of the FMEP. However some payors refuse to pay and when this occurs, the FMEP will initiate administrative enforcement actions, as necessary, to collect the unpaid maintenance.
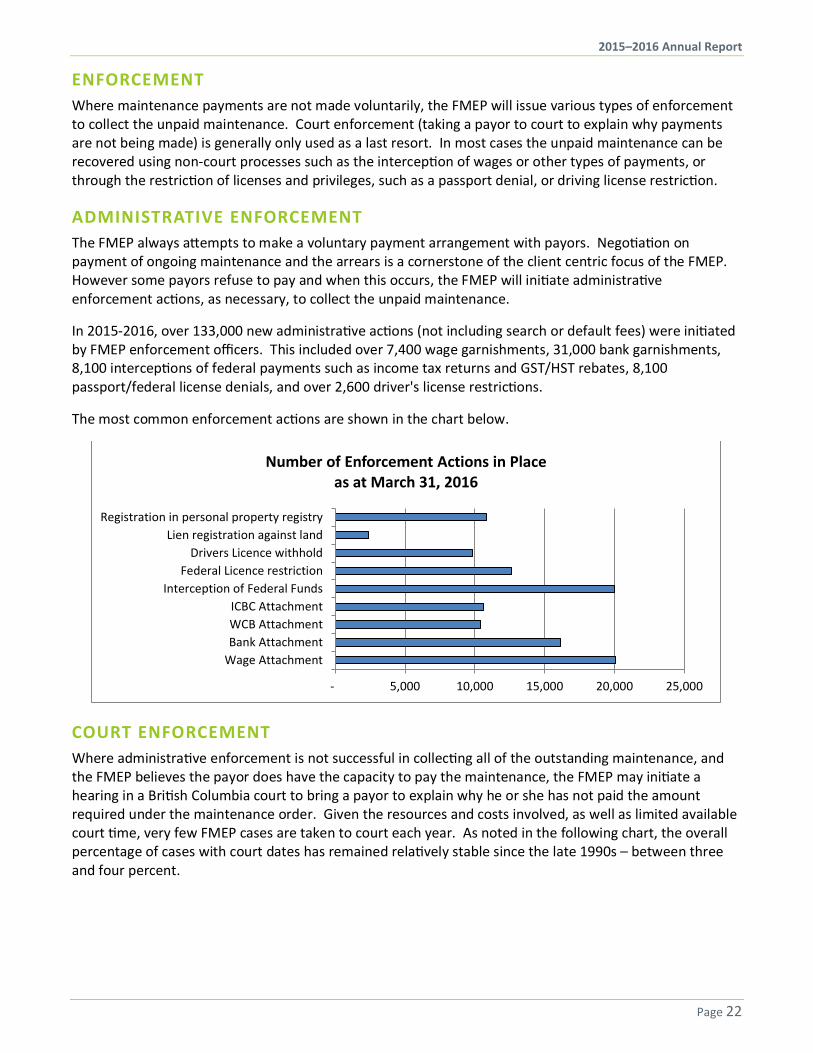
In 2015-2016, over 133,000 new administrative actions (not including search or default fees) were initiated by FMEP enforcement officers. This included over 7,400 wage garnishments, 31,000 bank garnishments, 8,100 interceptions of federal payments such as income tax returns and GST/HST rebates, 8,100 passport/federal license denials, and over 2,600 driver's license restrictions.
The most common enforcement actions are shown in the chart below.
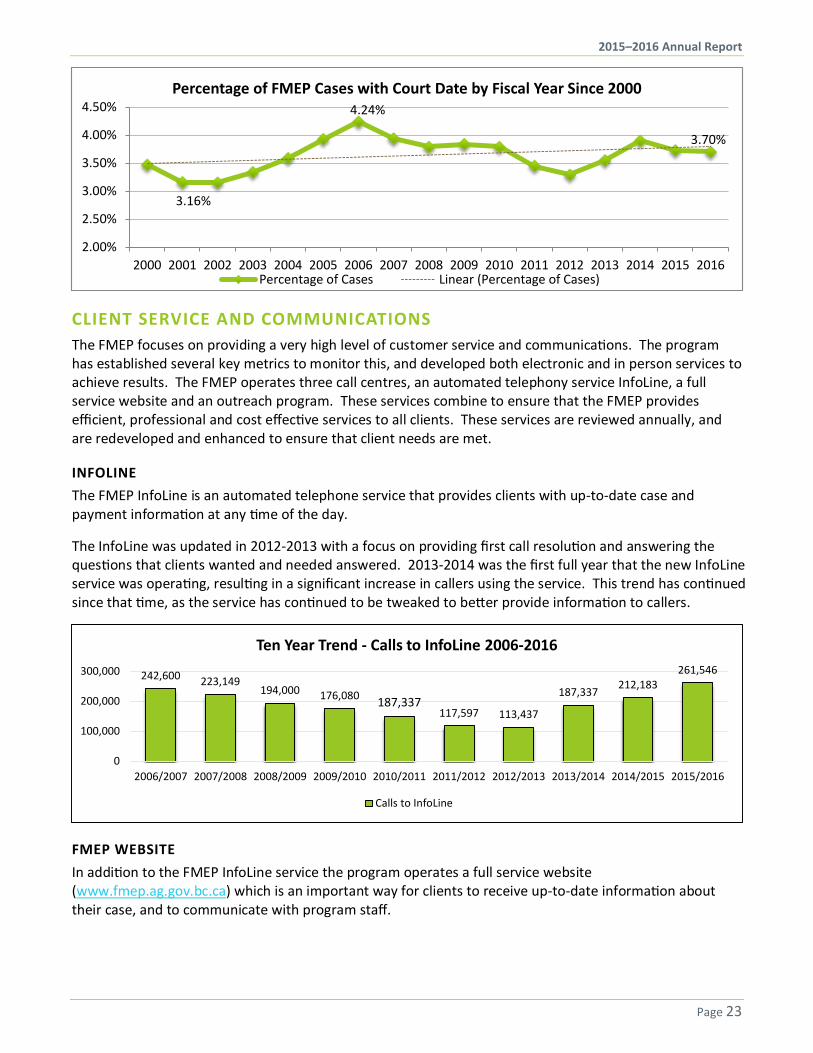
COURT ENFORCEMENT Where administrative enforcement is not successful in collecting all of the outstanding maintenance, and the FMEP believes the payor does have the capacity to pay the maintenance, the FMEP may initiate a hearing in a British Columbia court to bring a payor to explain why he or she has not paid the amount required under the maintenance order. Given the resources and costs involved, as well as limited available court time, very few FMEP cases are taken to court each year. As noted in the following chart, the overall percentage of cases with court dates has remained relatively stable since the late 1990s – between three and four percent.
- 5,000 10,000 15,000 20,000 25,000
Wage AttachmentBank AttachmentWCB AttachmentICBC Attachment
Interception of Federal FundsFederal Licence restriction
Drivers Licence withholdLien registration against land
Registration in personal property registry
Number of Enforcement Actions in Placeas at March 31, 2016
2015–2016 Annual Report
Page 23
CLIENT SERVICE AND COMMUNICATIONS The FMEP focuses on providing a very high level of customer service and communications. The program has established several key metrics to monitor this, and developed both electronic and in person services to achieve results. The FMEP operates three call centres, an automated telephony service InfoLine, a full service website and an outreach program. These services combine to ensure that the FMEP provides efficient, professional and cost effective services to all clients. These services are reviewed annually, and are redeveloped and enhanced to ensure that client needs are met.
INFOLINE The FMEP InfoLine is an automated telephone service that provides clients with up-to-date case and payment information at any time of the day.
The InfoLine was updated in 2012-2013 with a focus on providing first call resolution and answering the questions that clients wanted and needed answered. 2013-2014 was the first full year that the new InfoLine service was operating, resulting in a significant increase in callers using the service. This trend has continued since that time, as the service has continued to be tweaked to better provide information to callers.
FMEP WEBSITE In addition to the FMEP InfoLine service the program operates a full service website (www.fmep.ag.gov.bc.ca) which is an important way for clients to receive up-to-date information about their case, and to communicate with program staff.
3.16%
4.24%
3.70%
2.00%
2.50%
3.00%
3.50%
4.00%
4.50%
2000 2001 2002 2003 2004 2005 2006 2007 2008 2009 2010 2011 2012 2013 2014 2015 2016
Percentage of FMEP Cases with Court Date by Fiscal Year Since 2000
Percentage of Cases Linear (Percentage of Cases)
242,600 223,149194,000 176,080 187,337
117,597 113,437
187,337 212,183261,546
0
100,000
200,000
300,000
2006/2007 2007/2008 2008/2009 2009/2010 2010/2011 2011/2012 2012/2013 2013/2014 2014/2015 2015/2016
Ten Year Trend - Calls to InfoLine 2006-2016
Calls to InfoLine
2015–2016 Annual Report
Page 24
The FMEP website was completely rebuilt in 2014-2015 and the new website went live in May 2015. The new website offers clients and other stakeholders, such as employers, a range of new features including the ability to sign in once, using a web account, to access multiple cases. The redesigned website also provides the FMEP with a secure, modern platform upon which to build new functionality, such as the ability to provide documents electronically to the FMEP, a feature that was added in mid-2016.
In 2015-2016, an average of 11,458 unique visitors (clients, employers, enforcement officers from other enforcement programs) used the FMEP website each month. Recipients account for the largest number of FMEP website users – 21 percent of recipients used the website regularly in 2015-2016. The website was also used very regularly by clients and others to send messages to the FMEP. Over 14,600 e-messages were sent to the FMEP through the website.
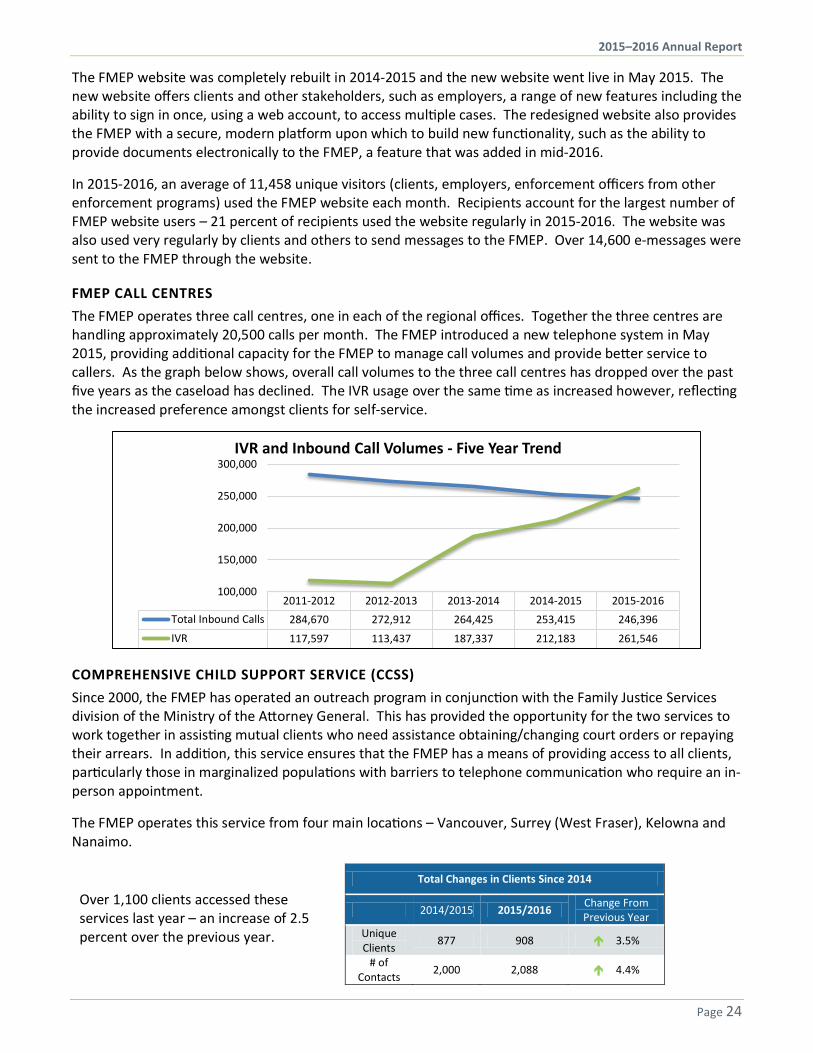
FMEP CALL CENTRES The FMEP operates three call centres, one in each of the regional offices. Together the three centres are handling approximately 20,500 calls per month. The FMEP introduced a new telephone system in May 2015, providing additional capacity for the FMEP to manage call volumes and provide better service to callers. As the graph below shows, overall call volumes to the three call centres has dropped over the past five years as the caseload has declined. The IVR usage over the same time as increased however, reflecting the increased preference amongst clients for self-service.
COMPREHENSIVE CHILD SUPPORT SERVICE (CCSS) Since 2000, the FMEP has operated an outreach program in conjunction with the Family Justice Services division of the Ministry of the Attorney General. This has provided the opportunity for the two services to work together in assisting mutual clients who need assistance obtaining/changing court orders or repaying their arrears. In addition, this service ensures that the FMEP has a means of providing access to all clients, particularly those in marginalized populations with barriers to telephone communication who require an in-person appointment.
The FMEP operates this service from four main locations – Vancouver, Surrey (West Fraser), Kelowna and Nanaimo.
Total Changes in Clients Since 2014
2014/2015 2015/2016 Change From Previous Year
Unique Clients 877 908 3.5%
# of Contacts 2,000 2,088 4.4%
2011-2012 2012-2013 2013-2014 2014-2015 2015-2016Total Inbound Calls 284,670 272,912 264,425 253,415 246,396IVR 117,597 113,437 187,337 212,183 261,546
100,000
150,000
200,000
250,000
300,000IVR and Inbound Call Volumes - Five Year Trend
Over 1,100 clients accessed these services last year – an increase of 2.5 percent over the previous year.
2015–2016 Annual Report
Page 25
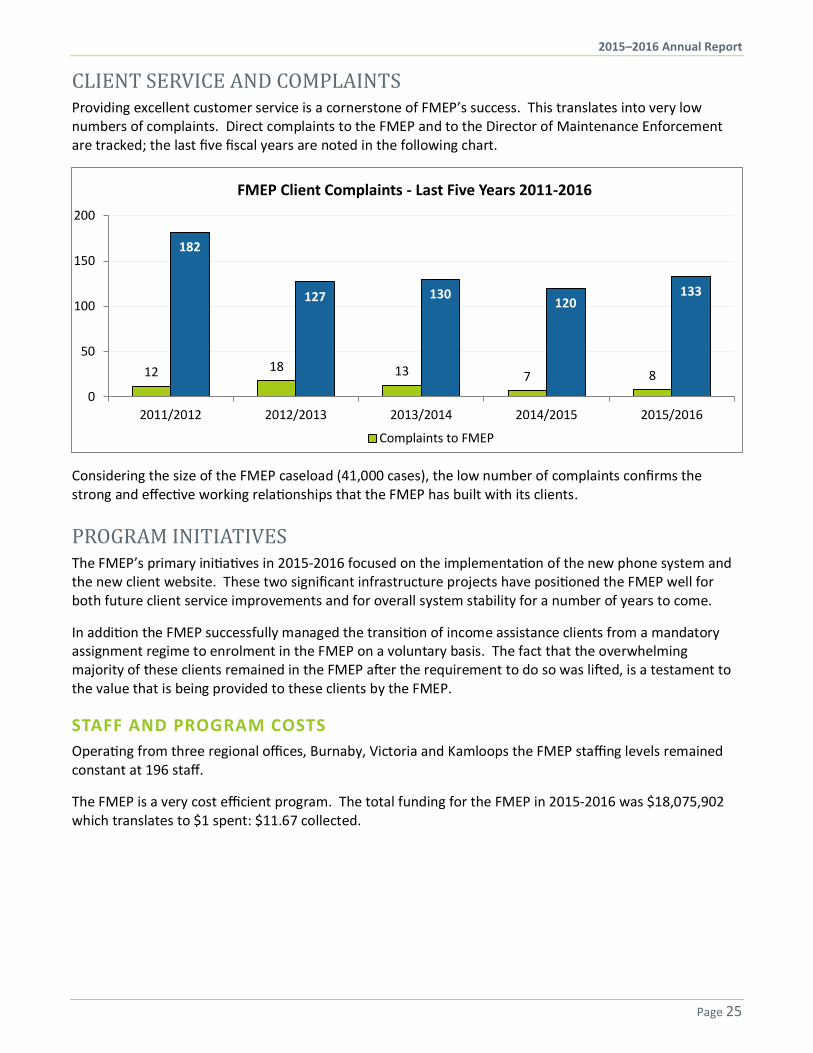
CLIENT SERVICE AND COMPLAINTS Providing excellent customer service is a cornerstone of FMEP’s success. This translates into very low numbers of complaints. Direct complaints to the FMEP and to the Director of Maintenance Enforcement are tracked; the last five fiscal years are noted in the following chart.
Considering the size of the FMEP caseload (41,000 cases), the low number of complaints confirms the strong and effective working relationships that the FMEP has built with its clients.
PROGRAM INITIATIVES The FMEP’s primary initiatives in 2015-2016 focused on the implementation of the new phone system and the new client website. These two significant infrastructure projects have positioned the FMEP well for both future client service improvements and for overall system stability for a number of years to come.
In addition the FMEP successfully managed the transition of income assistance clients from a mandatory assignment regime to enrolment in the FMEP on a voluntary basis. The fact that the overwhelming majority of these clients remained in the FMEP after the requirement to do so was lifted, is a testament to the value that is being provided to these clients by the FMEP.
STAFF AND PROGRAM COSTS Operating from three regional offices, Burnaby, Victoria and Kamloops the FMEP staffing levels remained constant at 196 staff.
The FMEP is a very cost efficient program. The total funding for the FMEP in 2015-2016 was $18,075,902 which translates to $1 spent: $11.67 collected.
12 18 13 7 8
182
127 130120
133
0
50
100
150
200
2011/2012 2012/2013 2013/2014 2014/2015 2015/2016
FMEP Client Complaints - Last Five Years 2011-2016
Complaints to FMEP
2015–2016 Annual Report
Page 26
OUTLOOK FOR 2016 – 2017
We are expecting to see a continued decline in cases over the upcoming year. In this respect, as noted above, British Columbia’s FMEP is experiencing a trend similar to that experienced by child support programs across North America.
With deceasing caseloads however, comes the opportunity to provide higher levels of service, increased capacity to provide innovative services to all FMEP stakeholders, and the time to provide individualized attention to clients where possible.
Over the upcoming year, the FMEP will focus on building new functionality into the client website and on providing new services to our employer partners, in particular with respect to electronic payment options. We will also be reaching out to community organizations and others, not just to ensure that all parents who need assistance with child and family support are aware of the FMEP, but also to find out what we could do to make the FMEP more relevant and more accessible to families in British Columbia.