Embed Size (px)
DESCRIPTION
Math in context with interesting interactive image
Citation preview
Algebra
AlgebraRules!
Mathematics in Context is a comprehensive curriculum for the middle grades. It was developed in 1991 through 1997 in collaboration with the Wisconsin Centerfor Education Research, School of Education, University of Wisconsin-Madison andthe Freudenthal Institute at the University of Utrecht, The Netherlands, with thesupport of the National Science Foundation Grant No. 9054928.
This unit is a new unit prepared as a part of the revision of the curriculum carriedout in 2003 through 2005, with the support of the National Science FoundationGrant No. ESI 0137414.
National Science FoundationOpinions expressed are those of the authors and not necessarily those of the Foundation.
Kindt, M., Dekker, T., and Burrill, G. (2006). Algebra rules. In Wisconsin Centerfor Education Research & Freudenthal Institute (Eds.), Mathematics in Context.Chicago: Encyclopædia Britannica, Inc.
Copyright © 2006 Encyclopædia Britannica, Inc.
All rights reserved.Printed in the United States of America.
This work is protected under current U.S. copyright laws, and the performance,display, and other applicable uses of it are governed by those laws. Any uses not in conformity with the U.S. copyright statute are prohibited without our expresswritten permission, including but not limited to duplication, adaptation, andtransmission by television or other devices or processes. For more informationregarding a license, write Encyclopædia Britannica, Inc., 331 North LaSalle Street, Chicago, Illinois 60610.
ISBN 0-03-038574-1
1 2 3 4 5 6 073 09 08 07 06 05
The Mathematics in Context Development TeamDevelopment 2003–2005
The revised version of Algebra Rules was developed by Martin Kindt and Truus Dekker. It was adapted for use in American schools by Gail Burrill.
Wisconsin Center for Education Freudenthal Institute StaffResearch Staff
Thomas A. Romberg David C. Webb Jan de Lange Truus DekkerDirector Coordinator Director Coordinator
Gail Burrill Margaret A. Pligge Mieke Abels Monica WijersEditorial Coordinator Editorial Coordinator Content Coordinator Content Coordinator
Project Staff
Sarah Ailts Margaret R. Meyer Arthur Bakker Nathalie KuijpersBeth R. Cole Anne Park Peter Boon Huub Nilwik Erin Hazlett Bryna Rappaport Els Feijs Sonia PalhaTeri Hedges Kathleen A. Steele Dédé de Haan Nanda QuerelleKaren Hoiberg Ana C. Stephens Martin Kindt Martin van ReeuwijkCarrie Johnson Candace UlmerJean Krusi Jill VettrusElaine McGrath
(c) 2006 Encyclopædia Britannica, Inc. Mathematics in Contextand the Mathematics in Context Logo are registered trademarks of Encyclopædia Britannica, Inc.
Cover photo credits: (all) © Corbis
Illustrations3, 8 James Alexander; 7 Rich Stergulz; 42 James Alexander
Photographs12 Library of Congress, Washington, D.C.; 13 Victoria Smith/HRW; 15 (left to right) HRW Photo; © Corbis; 25 © Corbis; 26 ComstockImages/Alamy; 33 Victoria Smith/HRW; 36 © PhotoDisc/Getty Images;51 © Bettmann/Corbis; 58 Brand X Pictures
Contents
Contents v
Letter to the Student vi
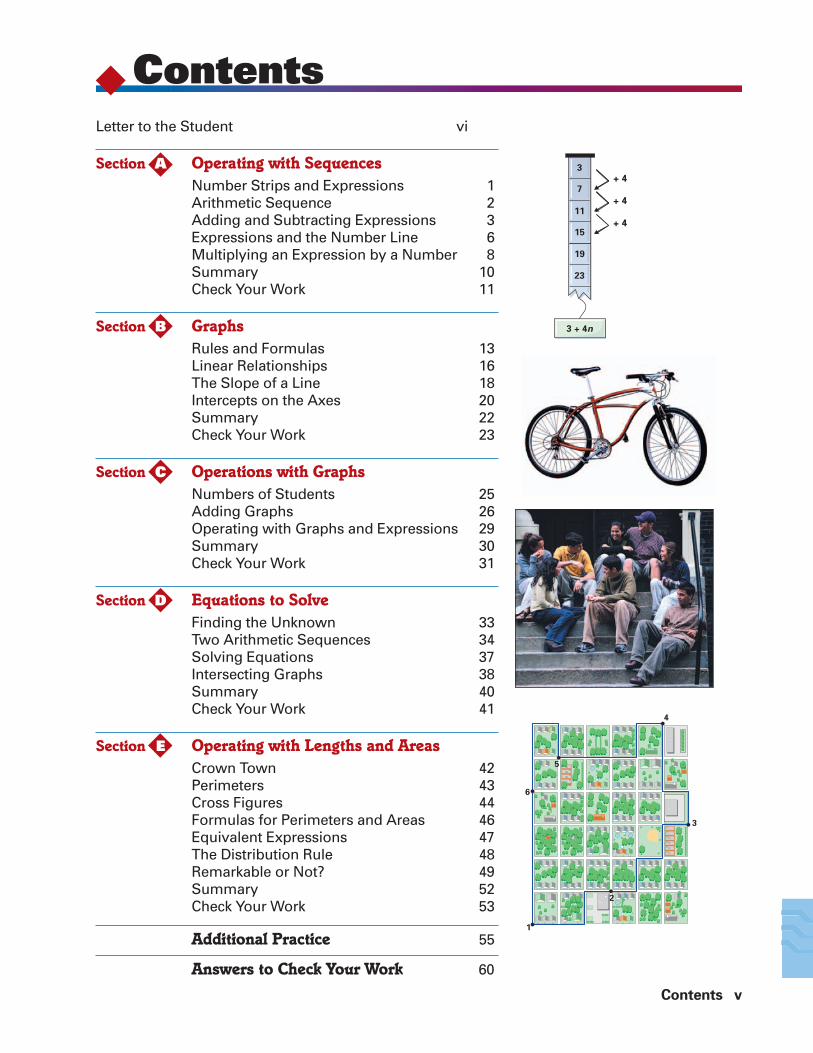
Section A Operating with SequencesNumber Strips and Expressions 1Arithmetic Sequence 2Adding and Subtracting Expressions 3Expressions and the Number Line 6Multiplying an Expression by a Number 8Summary 10Check Your Work 11
Section B GraphsRules and Formulas 13Linear Relationships 16The Slope of a Line 18Intercepts on the Axes 20Summary 22Check Your Work 23
Section C Operations with GraphsNumbers of Students 25Adding Graphs 26Operating with Graphs and Expressions 29Summary 30Check Your Work 31
Section D Equations to SolveFinding the Unknown 33Two Arithmetic Sequences 34Solving Equations 37Intersecting Graphs 38Summary 40Check Your Work 41
Section E Operating with Lengths and AreasCrown Town 42Perimeters 43Cross Figures 44Formulas for Perimeters and Areas 46Equivalent Expressions 47The Distribution Rule 48Remarkable or Not? 49Summary 52Check Your Work 53
Additional Practice 55
Answers to Check Your Work 60
1
2
3
4
5
6
3
7
11
15
19
23
3 + 4n
+ 4
+ 4
+ 4
vi Algebra Rules
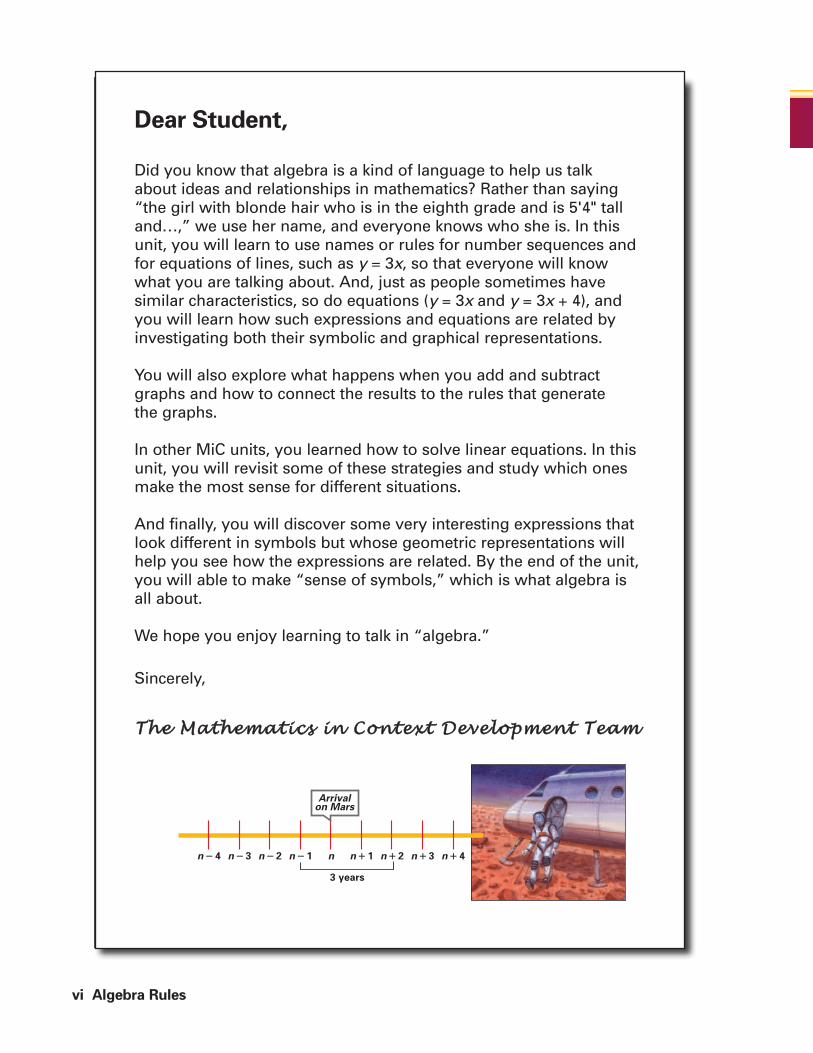
Dear Student,
Did you know that algebra is a kind of language to help us talk about ideas and relationships in mathematics? Rather than saying“the girl with blonde hair who is in the eighth grade and is 5'4" talland…,” we use her name, and everyone knows who she is. In thisunit, you will learn to use names or rules for number sequences andfor equations of lines, such as y = 3x, so that everyone will knowwhat you are talking about. And, just as people sometimes havesimilar characteristics, so do equations (y = 3x and y = 3x + 4), andyou will learn how such expressions and equations are related byinvestigating both their symbolic and graphical representations.
You will also explore what happens when you add and subtractgraphs and how to connect the results to the rules that generate the graphs.
In other MiC units, you learned how to solve linear equations. In thisunit, you will revisit some of these strategies and study which onesmake the most sense for different situations.
And finally, you will discover some very interesting expressions thatlook different in symbols but whose geometric representations willhelp you see how the expressions are related. By the end of the unit,you will able to make “sense of symbols,” which is what algebra isall about.
We hope you enjoy learning to talk in “algebra.”
Sincerely,
TThhee MMaatthheemmaattiiccss iinn CCoonntteexxtt DDeevveellooppmmeenntt TTeeaamm
n � 4 n � 3 n � 2 n � 1 n n � 1 n � 2 n � 3 n � 4
Arrivalon Mars
3 years
AOperating with Sequences
Number Strips and Expressions
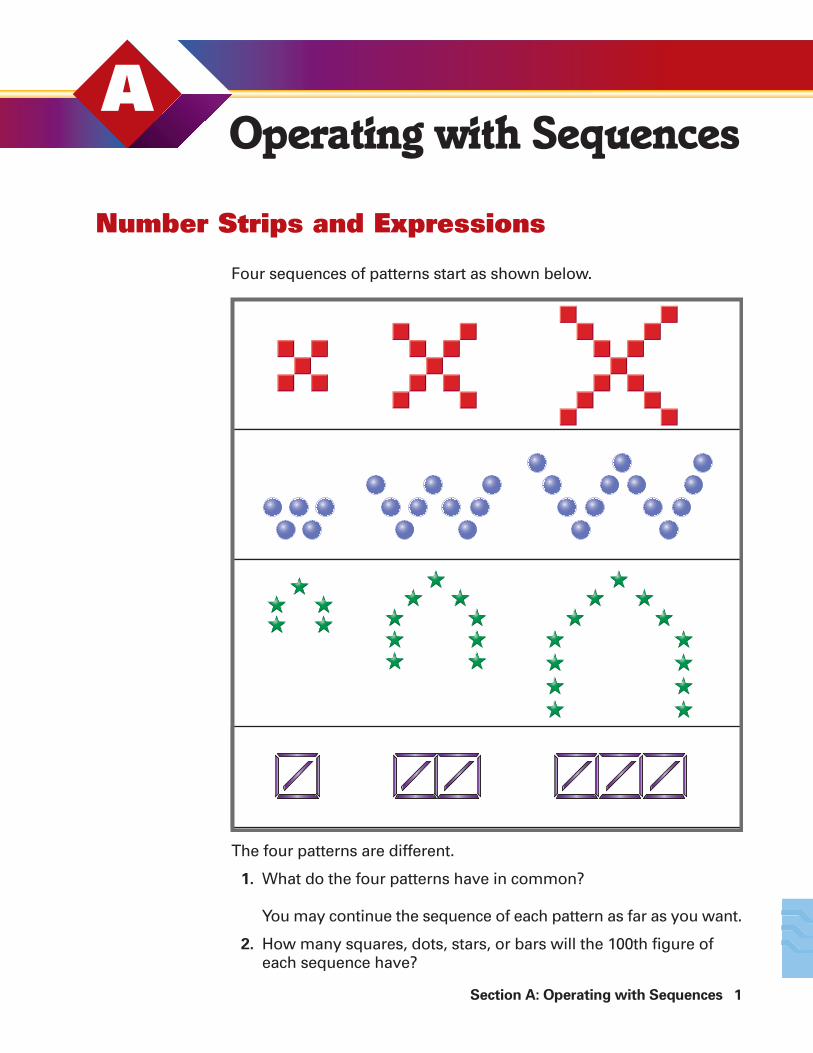
Four sequences of patterns start as shown below.
Section A: Operating with Sequences 1
The four patterns are different.
1. What do the four patterns have in common?
You may continue the sequence of each pattern as far as you want.
2. How many squares, dots, stars, or bars will the 100th figure ofeach sequence have?
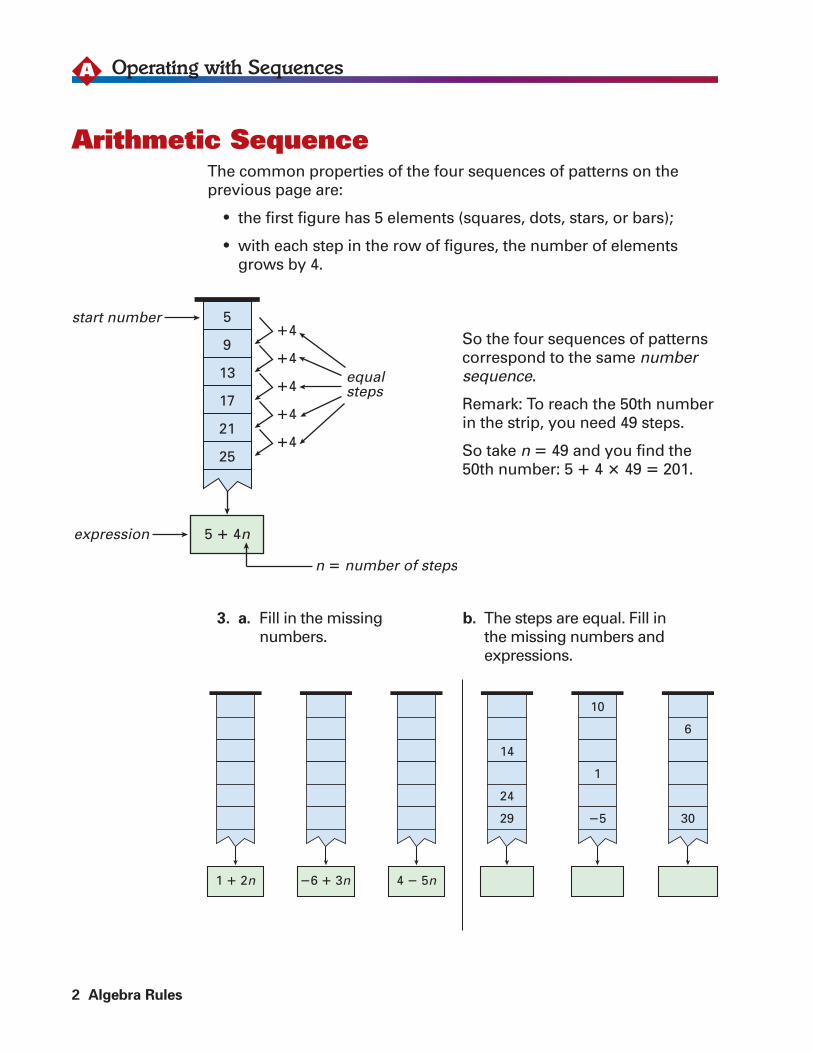
The common properties of the four sequences of patterns on the previous page are:
• the first figure has 5 elements (squares, dots, stars, or bars);
• with each step in the row of figures, the number of elementsgrows by 4.
2 Algebra Rules
Operating with SequencesA
Arithmetic Sequence
5�4
�4
�4equalsteps
�4
�4
9
13
17
21
25
5 � 4nexpression
start number
n � number of steps
3. a. Fill in the missing b. The steps are equal. Fill in numbers. the missing numbers and
expressions.
So the four sequences of patternscorrespond to the same numbersequence.
Remark: To reach the 50th numberin the strip, you need 49 steps.
So take n � 49 and you find the50th number: 5 � 4 � 49 � 201.
14
24
29
10
1
�5
6
30
1 � 2n �6 � 3n 4 � 5n
Section A: Operating with Sequences 3
AOperating with Sequences
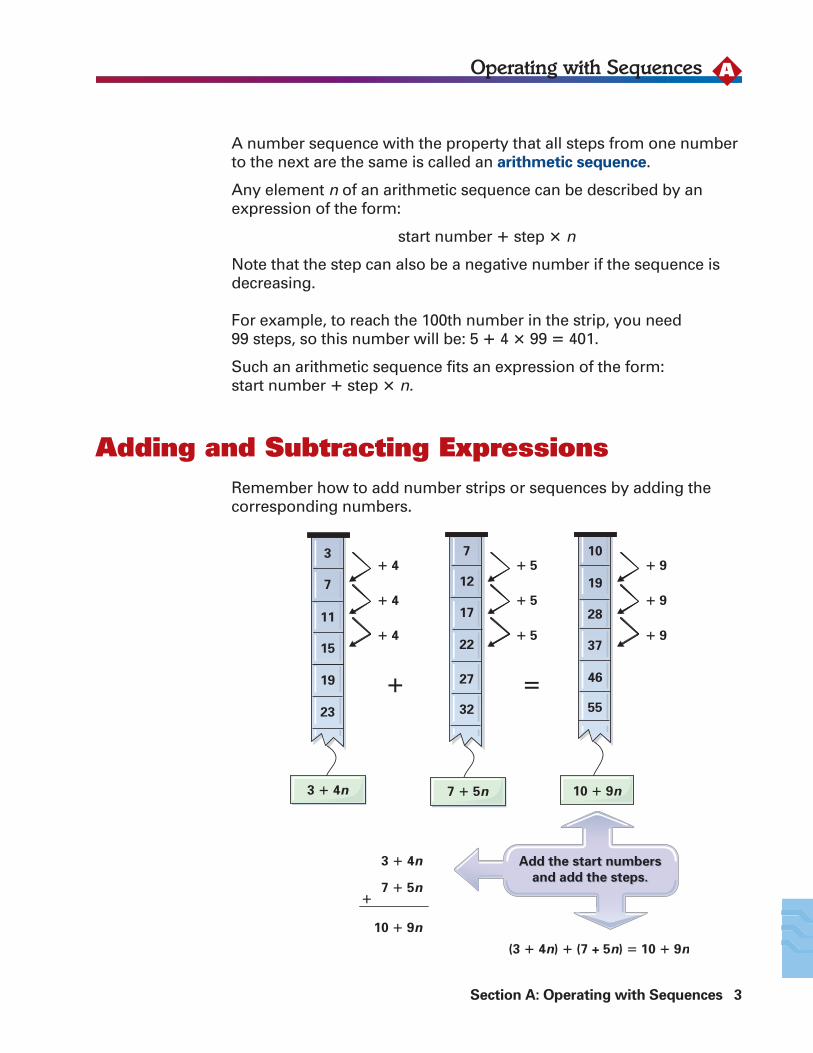
A number sequence with the property that all steps from one numberto the next are the same is called an arithmetic sequence.
Any element n of an arithmetic sequence can be described by anexpression of the form:
start number � step � n
Note that the step can also be a negative number if the sequence isdecreasing.
For example, to reach the 100th number in the strip, you need 99 steps, so this number will be: 5 � 4 � 99 � 401.
Such an arithmetic sequence fits an expression of the form: start number � step � n.
Remember how to add number strips or sequences by adding thecorresponding numbers.
Adding and Subtracting Expressions
� �
7
12
17
22
32
27
3
7
11
15
19
23
3 � 4n 7 � 5n
10
19
28
37
46
55
10 � 9n
� 4
� 4
� 4
� 5
� 5
� 5
� 9
� 9
� 9
3 � 4n
7 � 5n�
10 � 9n
(3 � 4n) � (7 + 5n) � 10 � 9n
Add the start numbers
and add the steps.
Add the start numbers
and add the steps.
4 Algebra Rules
Operating with SequencesA
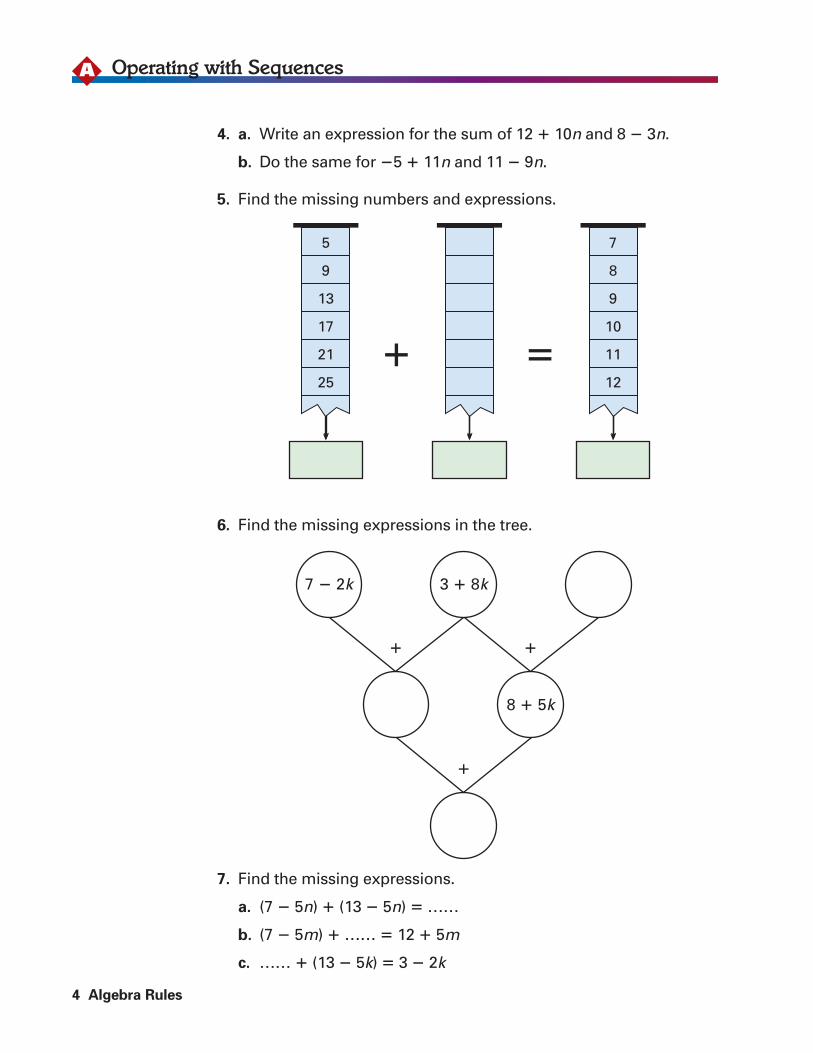
7. Find the missing expressions.
a. (7 � 5n) � (13 � 5n) � ……
b. (7 � 5m) � …… � 12 � 5m
c. …… � (13 � 5k) � 3 � 2k
5
9
13
17
21
25� �
7
8
9
10
11
12
4. a. Write an expression for the sum of 12 � 10n and 8 � 3n.
b. Do the same for �5 � 11n and 11 � 9n.
5. Find the missing numbers and expressions.
6. Find the missing expressions in the tree.
7 � 2k 3 � 8k
8 � 5k
�
�
�
AOperating with Sequences
Section A: Operating with Sequences 5
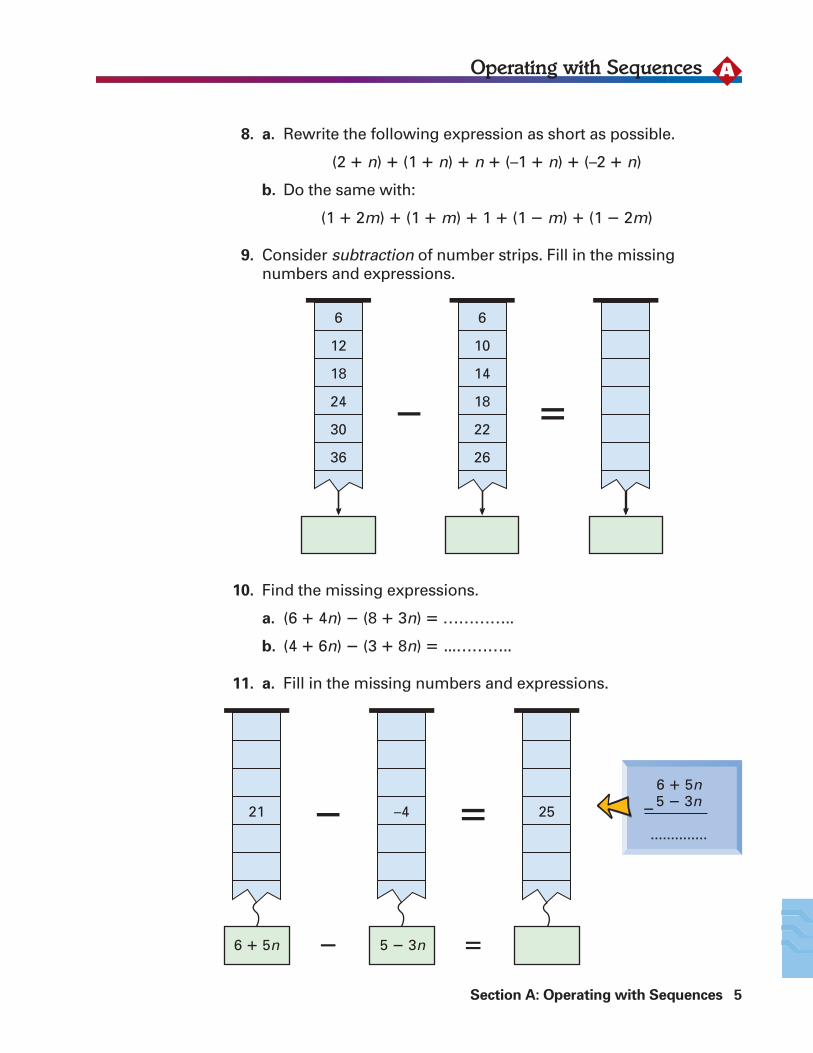
8. a. Rewrite the following expression as short as possible.
(2 � n) � (1 � n) � n � (–1 � n) � (–2 � n)
b. Do the same with:
(1 � 2m) � (1 � m) � 1 � (1 � m) � (1 � 2m)
9. Consider subtraction of number strips. Fill in the missingnumbers and expressions.
10. Find the missing expressions.
a. (6 � 4n) � (8 � 3n) � …………..
b. (4 � 6n) � (3 � 8n) � ...………..
11. a. Fill in the missing numbers and expressions.
6
12
18
24
30
36
�
6
10
14
18
22
26
�
�
�
21
6 � 5n
�
�
–4 25
5 � 3n
6 � 5n5 � 3n
..............
�
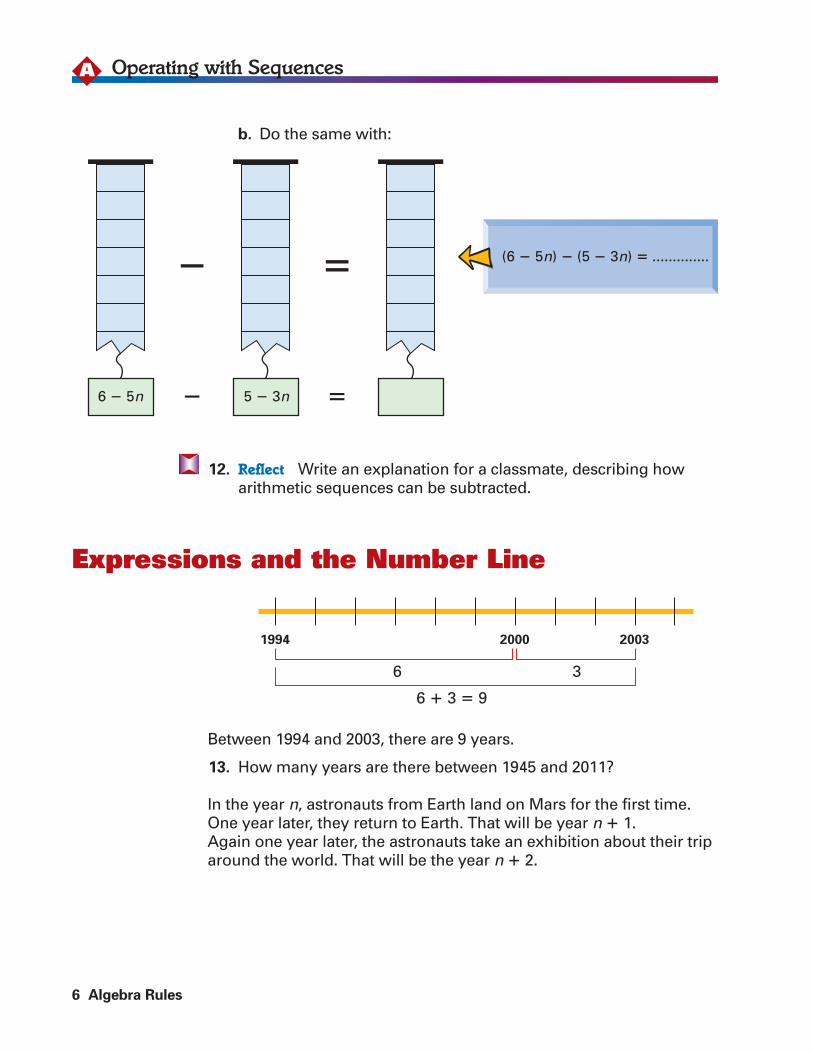
b. Do the same with:
12. Reflect Write an explanation for a classmate, describing howarithmetic sequences can be subtracted.
Between 1994 and 2003, there are 9 years.
13. How many years are there between 1945 and 2011?
In the year n, astronauts from Earth land on Mars for the first time.One year later, they return to Earth. That will be year n � 1. Again one year later, the astronauts take an exhibition about their triparound the world. That will be the year n � 2.
6 Algebra Rules
Operating with SequencesA
1994 2000
6 � 3 � 9
6 3
2003
Expressions and the Number Line
�
�6 � 5n
�
�5 � 3n
(6 � 5n) � (5 � 3n) � ..............
2n � 2 2n 2n � 2 even
AOperating with Sequences
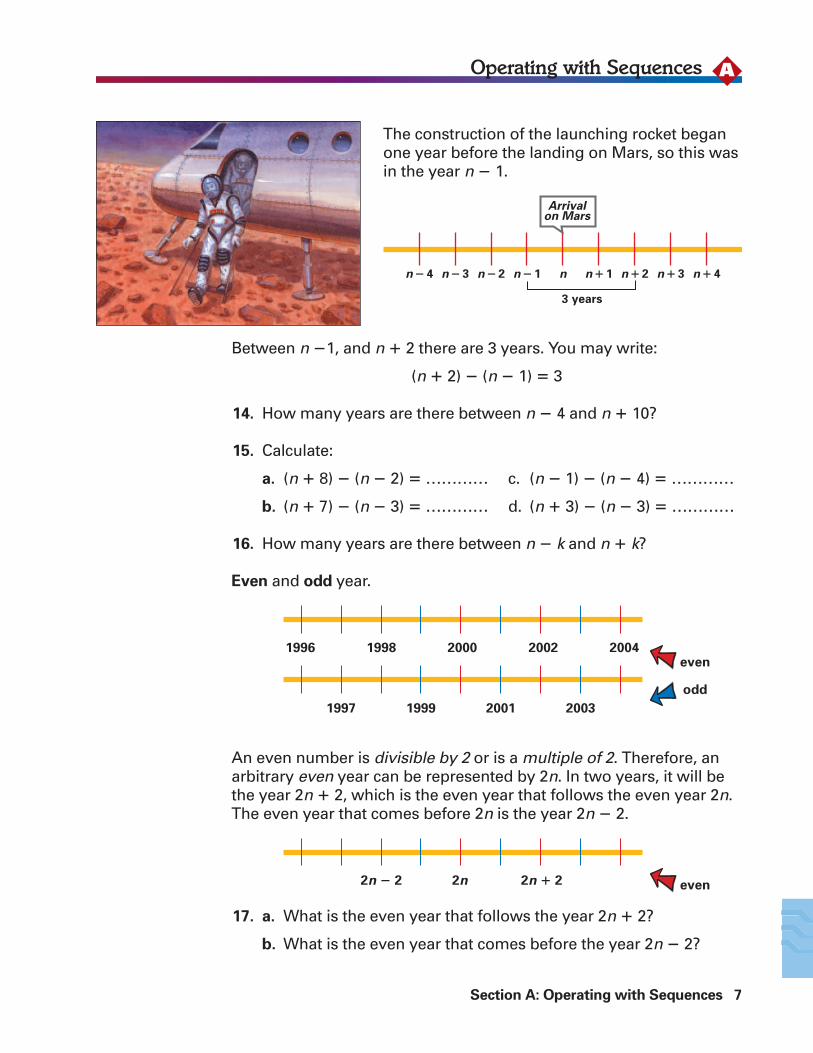
The construction of the launching rocket beganone year before the landing on Mars, so this wasin the year n � 1.
Section A: Operating with Sequences 7
1996 1998 2000 2002 2004even
1997 1999 2001 2003
odd
Between n �1, and n � 2 there are 3 years. You may write:
(n � 2) � (n � 1) � 3
14. How many years are there between n � 4 and n � 10?
15. Calculate:
a. (n � 8) � (n � 2) � ………… c. (n � 1) � (n � 4) � …………
b. (n � 7) � (n � 3) � ………… d. (n � 3) � (n � 3) � …………
16. How many years are there between n � k and n � k?
Even and odd year.
An even number is divisible by 2 or is a multiple of 2. Therefore, anarbitrary even year can be represented by 2n. In two years, it will bethe year 2n � 2, which is the even year that follows the even year 2n.The even year that comes before 2n is the year 2n � 2.
17. a. What is the even year that follows the year 2n � 2?
b. What is the even year that comes before the year 2n � 2?
n � 4 n � 3 n � 2 n � 1 n n � 1 n � 2 n � 3 n � 4
Arrivalon Mars
3 years
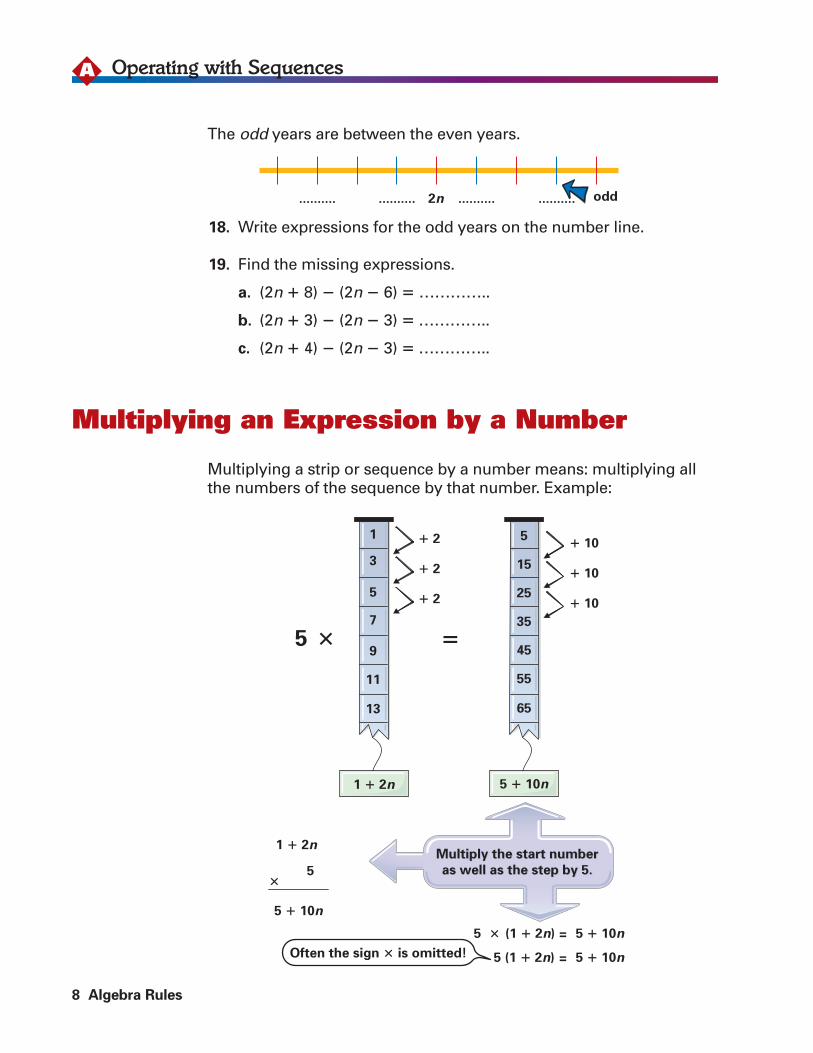
The odd years are between the even years.
18. Write expressions for the odd years on the number line.
19. Find the missing expressions.
a. (2n � 8) � (2n � 6) � …………..
b. (2n � 3) � (2n � 3) � …………..
c. (2n � 4) � (2n � 3) � …………..
Multiplying a strip or sequence by a number means: multiplying allthe numbers of the sequence by that number. Example:
8 Algebra Rules
Operating with SequencesA
.......... .......... .................... 2n odd
Multiplying an Expression by a Number
�
1
3
5
7
9
11
13
5 �
5
15
25
35
45
55
65
� 2
� 2
� 2
� 10
� 10
� 10
5 � (1 � 2n) = 5 � 10n
1 � 2n
5�
5 � 10n
5 (1 � 2n) = 5 � 10n
Multiply the start number
as well as the step by 5.
Multiply the start number
as well as the step by 5.
Often the sign � is omitted!
1 � 2n 5 � 10n
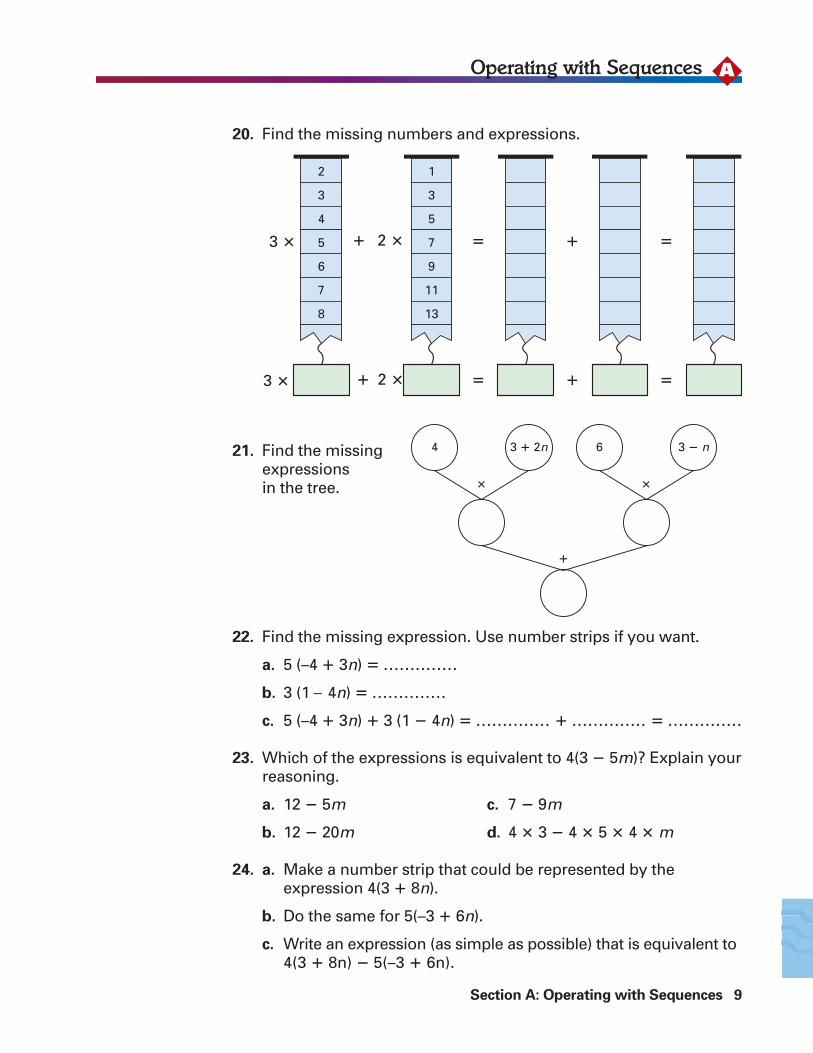
20. Find the missing numbers and expressions.
21. Find the missing expressions in the tree.
22. Find the missing expression. Use number strips if you want.
a. 5 (–4 � 3n) � ..............
b. 3 (1 – 4n) � ..............
c. 5 (–4 � 3n) � 3 (1 � 4n) � .............. � .............. � ..............
23. Which of the expressions is equivalent to 4(3 � 5m)? Explain yourreasoning.
a. 12 � 5m c. 7 � 9m
b. 12 � 20m d. 4 � 3 � 4 � 5 � 4 � m
24. a. Make a number strip that could be represented by the expression 4(3 � 8n).
b. Do the same for 5(–3 � 6n).
c. Write an expression (as simple as possible) that is equivalent to4(3 � 8n) � 5(–3 � 6n).
Section A: Operating with Sequences 9
AOperating with Sequences
� 2 �
2
3
4
5 3 �
� 2 �3 �
6
7
8
�
�
1
3
5
7
9
11
13
�
�
�
�
4 3 � 2n
�
6 3 � n
�
�
10 Algebra Rules
Operating with SequencesA
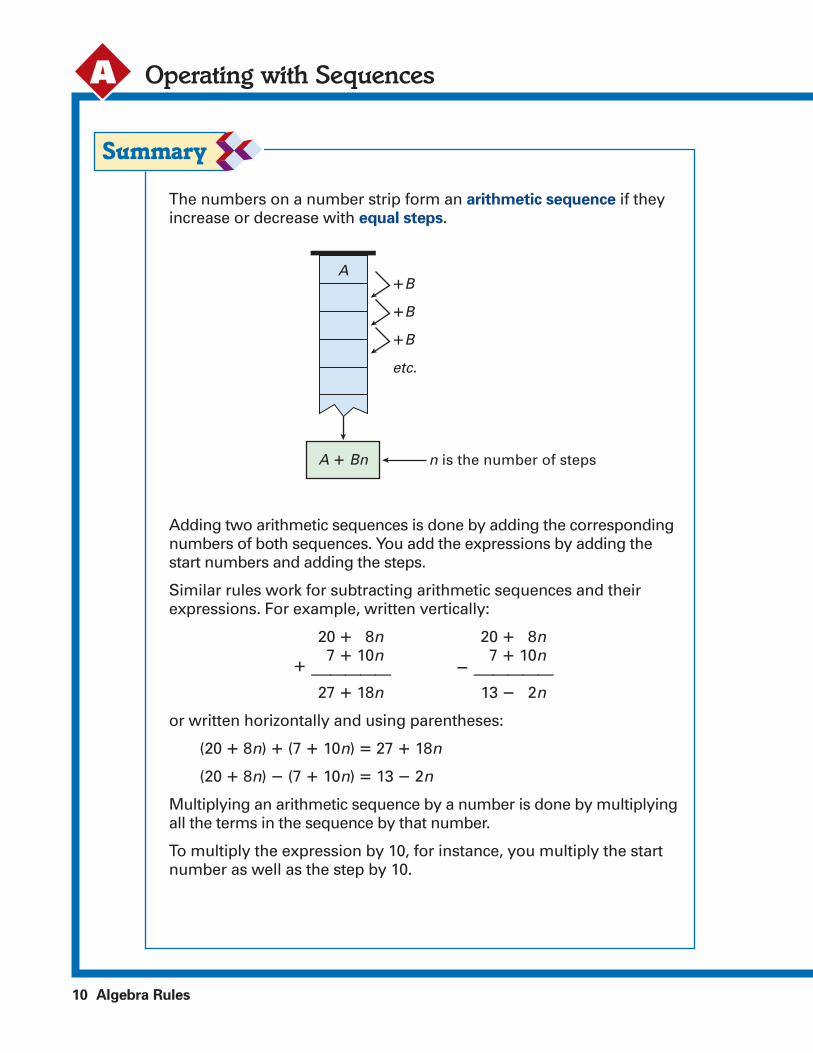
The numbers on a number strip form an arithmetic sequence if theyincrease or decrease with equal steps.
Adding two arithmetic sequences is done by adding the correspondingnumbers of both sequences. You add the expressions by adding thestart numbers and adding the steps.
Similar rules work for subtracting arithmetic sequences and theirexpressions. For example, written vertically:
20 � 8n 20 � 8n7 � 10n 7 � 10n
� -————— � -—————27 � 18n 13 � 2n
or written horizontally and using parentheses:
(20 � 8n) � (7 � 10n) � 27 � 18n
(20 � 8n) � (7 � 10n) � 13 � 2n
Multiplying an arithmetic sequence by a number is done by multiplyingall the terms in the sequence by that number.
To multiply the expression by 10, for instance, you multiply the startnumber as well as the step by 10.
A�B
�B
�B
etc.
A � Bn n is the number of steps
Section A: Operating with Sequences 11
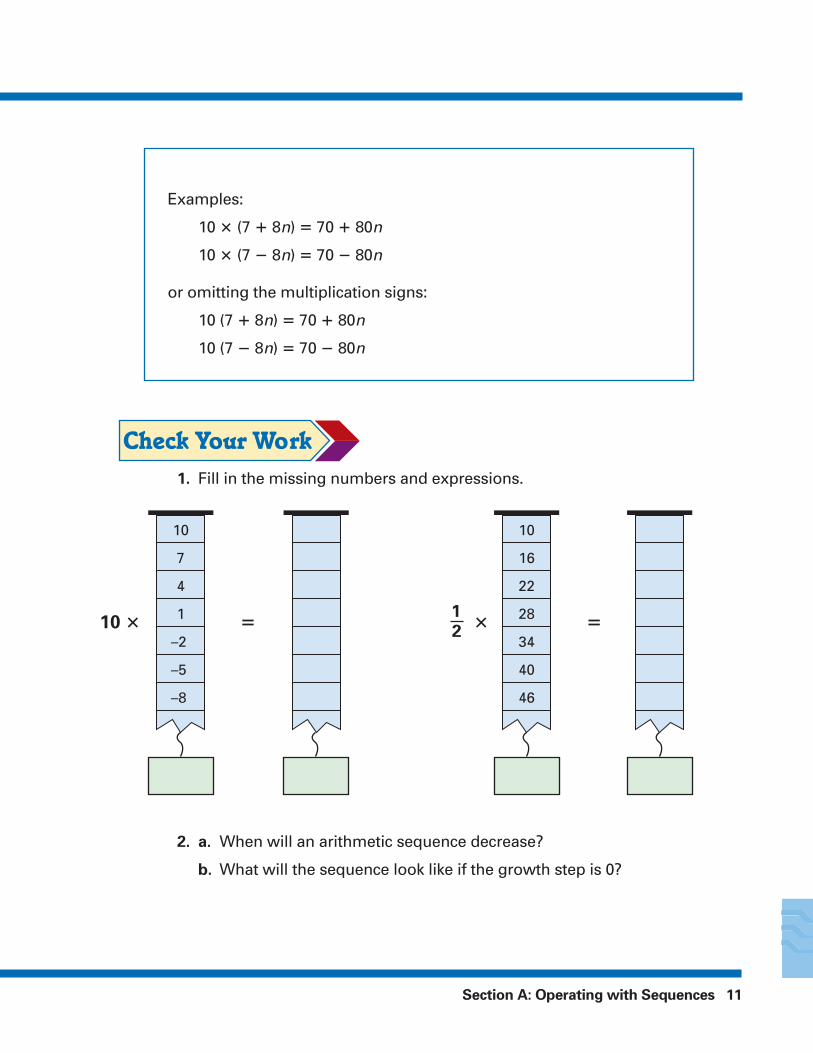
Examples:
10 � (7 � 8n) � 70 � 80n
10 � (7 � 8n) � 70 � 80n
or omitting the multiplication signs:
10 (7 � 8n) � 70 � 80n
10 (7 � 8n) � 70 � 80n
1. Fill in the missing numbers and expressions.
2. a. When will an arithmetic sequence decrease?
b. What will the sequence look like if the growth step is 0?
�10 � �
10
7
4
1
–2
–5
–8
�1
2
10
16
22
28
34
40
46
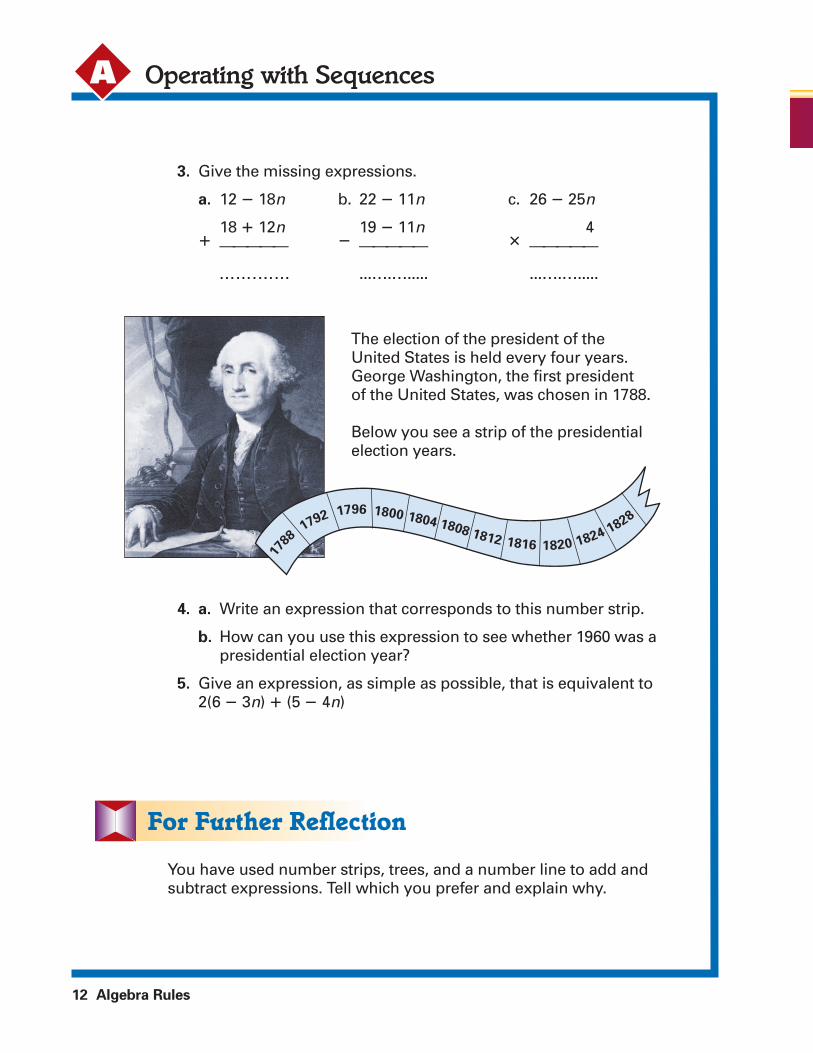
The election of the president of theUnited States is held every four years.George Washington, the first presidentof the United States, was chosen in 1788.
Below you see a strip of the presidentialelection years.
12 Algebra Rules
Operating with Sequences
3. Give the missing expressions.
a. 12 � 18n b. 22 � 11n c. 26 � 25n
18 � 12n 19 � 11n 4� ————— � ————— � —————
...….…... ...….…..... ...….….....
A
17
881792 1796 1800 1804 1808 1812 1816 1820 1824 1828
4. a. Write an expression that corresponds to this number strip.
b. How can you use this expression to see whether 1960 was apresidential election year?
5. Give an expression, as simple as possible, that is equivalent to2(6 � 3n) � (5 � 4n)
You have used number strips, trees, and a number line to add andsubtract expressions. Tell which you prefer and explain why.
Section B: Graphs 13
BGraphs
Rules and Formulas
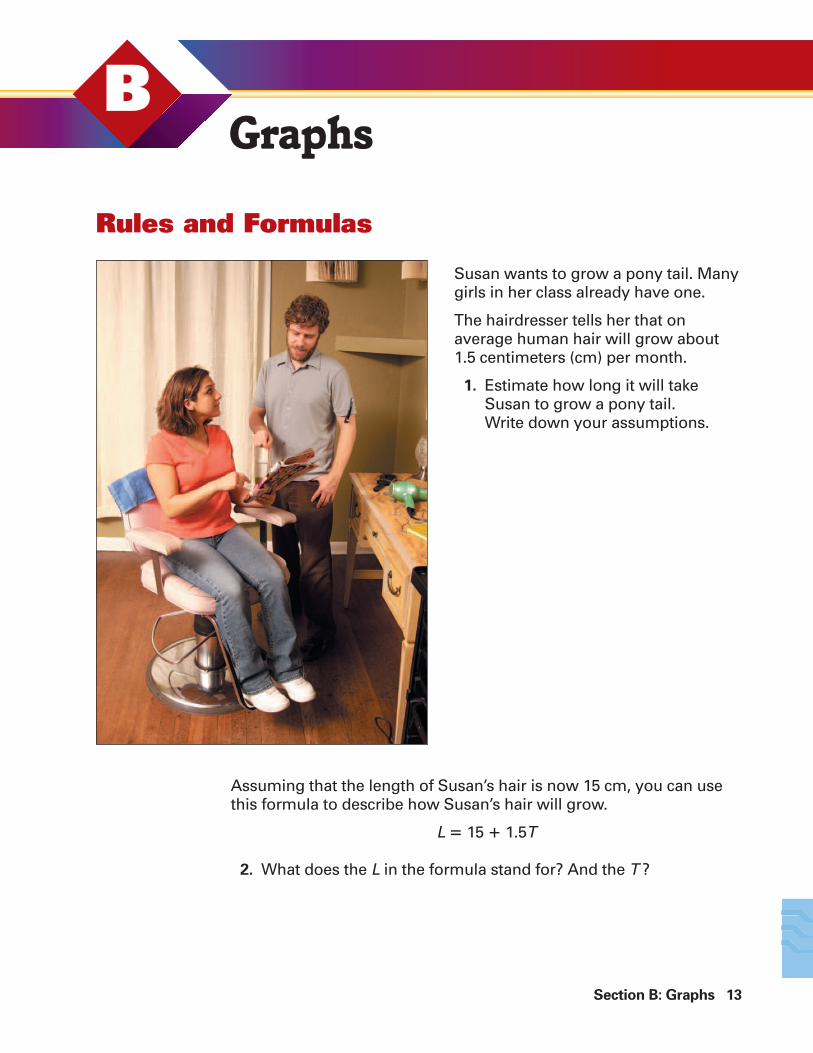
Susan wants to grow a pony tail. Manygirls in her class already have one.
The hairdresser tells her that onaverage human hair will grow about1.5 centimeters (cm) per month.
1. Estimate how long it will takeSusan to grow a pony tail. Write down your assumptions.
Assuming that the length of Susan’s hair is now 15 cm, you can usethis formula to describe how Susan’s hair will grow.
L � 15 � 1.5T
2. What does the L in the formula stand for? And the T ?

14 Algebra Rules
GraphsB
c. What will happen if you continue the graph? How do youknow this? What will it look like in the table?
4. Reflect The formula used is a simplified model for hair growth. In reality, do you think hair will keep growing 1.5 cm per monthover a very long period?
10
5
10
15
20
25
30
L (
in c
m)
T (in months)
2 3 4 5 6 7 8 9 10
3. a. Use Student Activity Sheet 1 to complete the table that fits theformula L � 15 � 1.5T.
b. Use Student Activity Sheet 1 and the table you made to drawthe graph that fits the formula L � 15 � 1.5T.
T (in months) 0 1 2 3 4 5 ....
L (in cm) 30
Section B: Graphs 15
BGraphs
Here are some different formulas.
(1) number of kilometers � 1.6 � number of miles
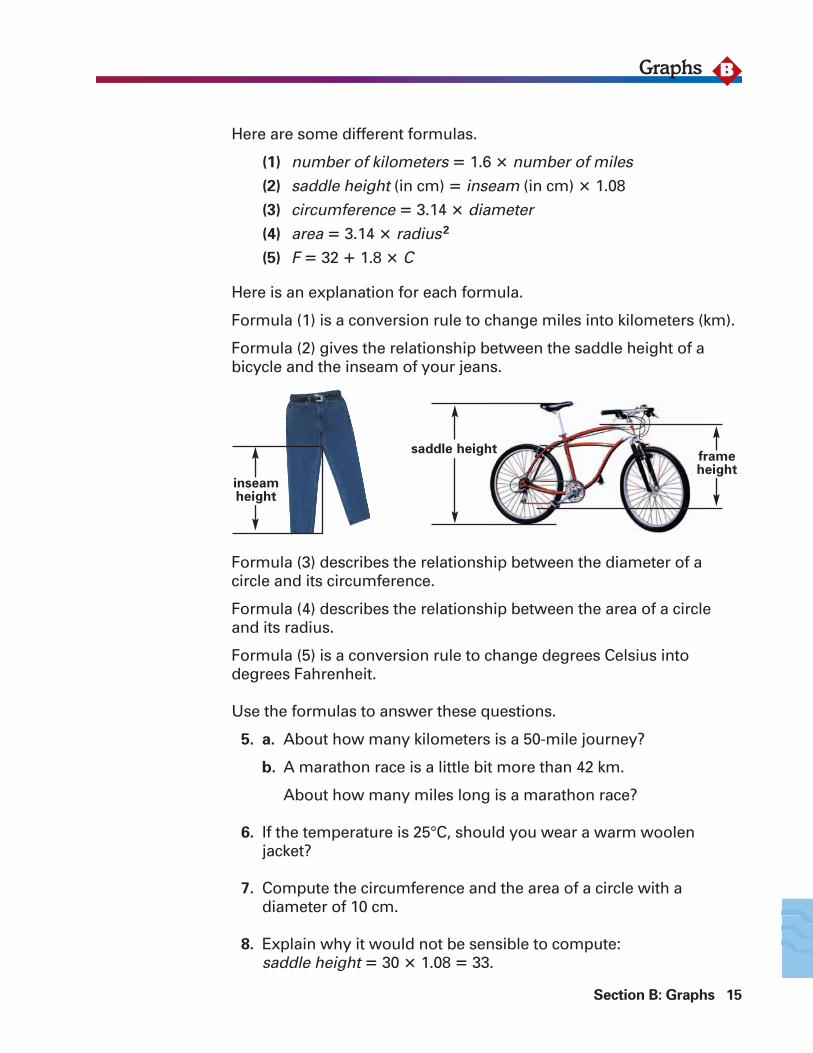
(2) saddle height (in cm) � inseam (in cm) � 1.08
(3) circumference � 3.14 � diameter
(4) area � 3.14 � radius2
(5) F � 32 � 1.8 � C
Here is an explanation for each formula.
Formula (1) is a conversion rule to change miles into kilometers (km).
Formula (2) gives the relationship between the saddle height of abicycle and the inseam of your jeans.
Formula (3) describes the relationship between the diameter of acircle and its circumference.
Formula (4) describes the relationship between the area of a circleand its radius.
Formula (5) is a conversion rule to change degrees Celsius intodegrees Fahrenheit.
Use the formulas to answer these questions.
5. a. About how many kilometers is a 50-mile journey?
b. A marathon race is a little bit more than 42 km.
About how many miles long is a marathon race?
6. If the temperature is 25°C, should you wear a warm woolenjacket?
7. Compute the circumference and the area of a circle with a diameter of 10 cm.
8. Explain why it would not be sensible to compute: saddle height � 30 � 1.08 � 33.
frameheight
inseamheight
saddle height
16 Algebra Rules
GraphsB
Linear Relationships
–5
–5
5
5
0
y
x
You can abbreviate rules and formulas using symbols instead ofwords as is done in formula (5). For instance a short version offormula (1) is: K � 1.6 � M.
9. a. Rewrite formulas (2), (3) and (4) in a shortened way.
b. One formula is mathematically different from the others.Which one do you think it is and why?
If we just look at a formula or a graph and we are not interested in thecontext it represents, we can use a general form.
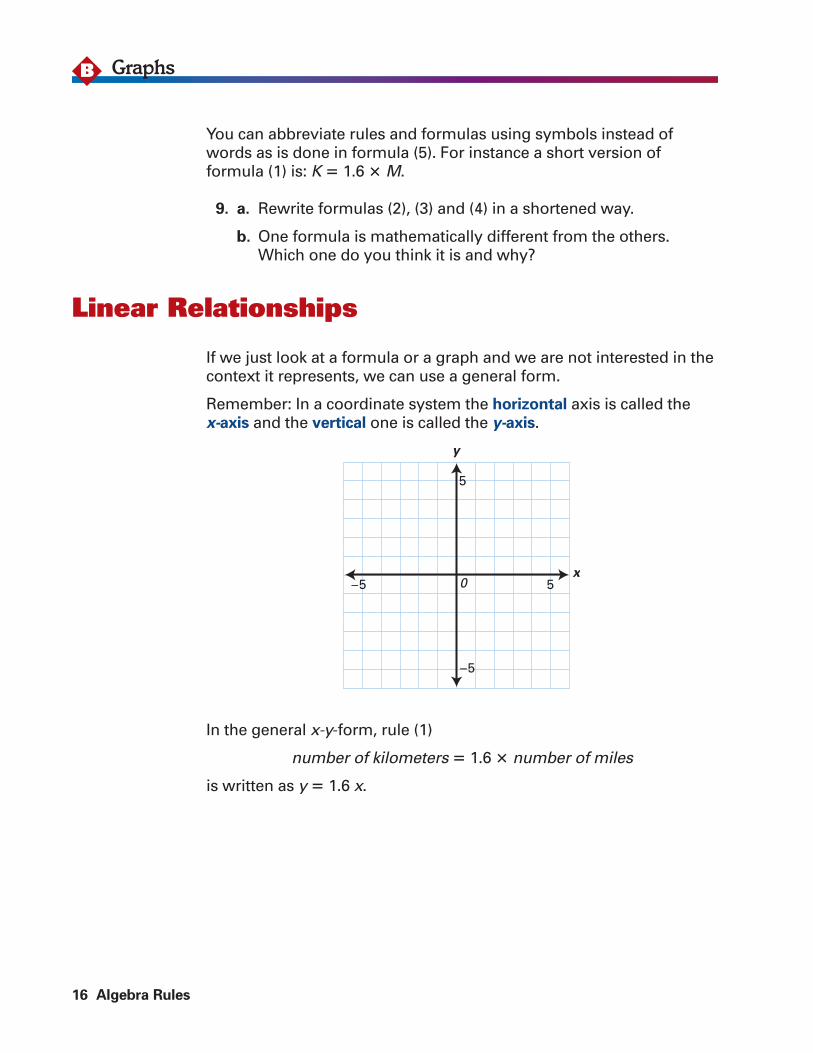
Remember: In a coordinate system the horizontal axis is called thex-axis and the vertical one is called the y-axis.
In the general x-y-form, rule (1)
number of kilometers � 1.6 � number of miles
is written as y � 1.6 x.
Section B: Graphs 17
BGraphs
10. Rewrite the formulas (2), (3), (4), and (5) in the general form,using the symbols x and y.
The four formulas (1), (2), (3), and (5) represent relationships of thesame kind. These are called linear relationships. Graphs representinglinear relationships will always be straight lines.
11. Use Student Activity Sheet 1 to make a graph of the relationshipbetween the area and the radius of a circle. Is this relationshiplinear? Why or why not?
The formula corresponding to a straight line is known as an equation
of the line.
Look at the equation y � –4 � 2x.
12. a. Complete the table and draw a graph. Be sure to use both positive and negative numbers in your coordinate system.
b. This is another equation: y � 2(x � 2).
Do you think the corresponding graph will be different fromthe graph of y � –4 � 2x ? Explain your answer.
c. Reflect Suppose that the line representing the formula y � 1.6x is drawn in the same coordinate system. Is this linesteeper or less steep than the graph of y � –4 � 2x ? Explainhow you know.
x y
–2 –8
–1
0
1
2
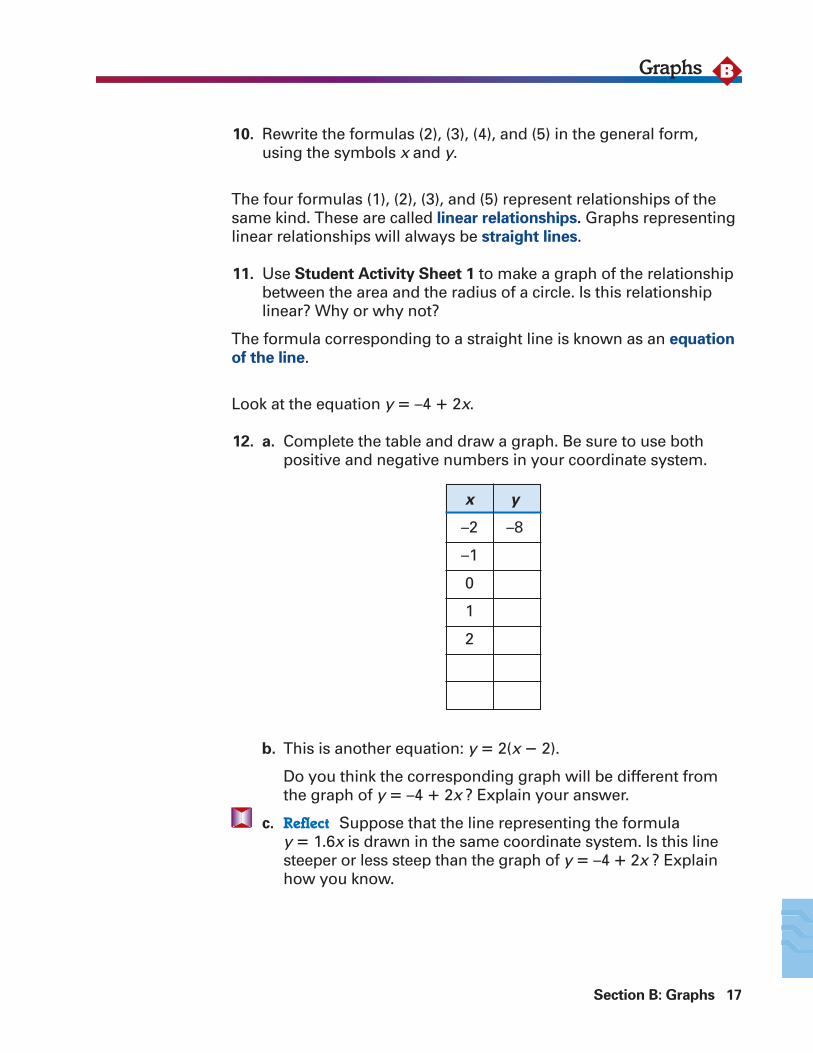
13. Each graph shows two linear relationships. How are these alike?How are they different?
18 Algebra Rules
GraphsB
y
x
(1)
O
4
–4
5–5
y
x
(2)
y = 4 + 1.5xy = 1.5x
y = 1.5x
–5 O 5
–20
20y = 20 + 1.5x
x
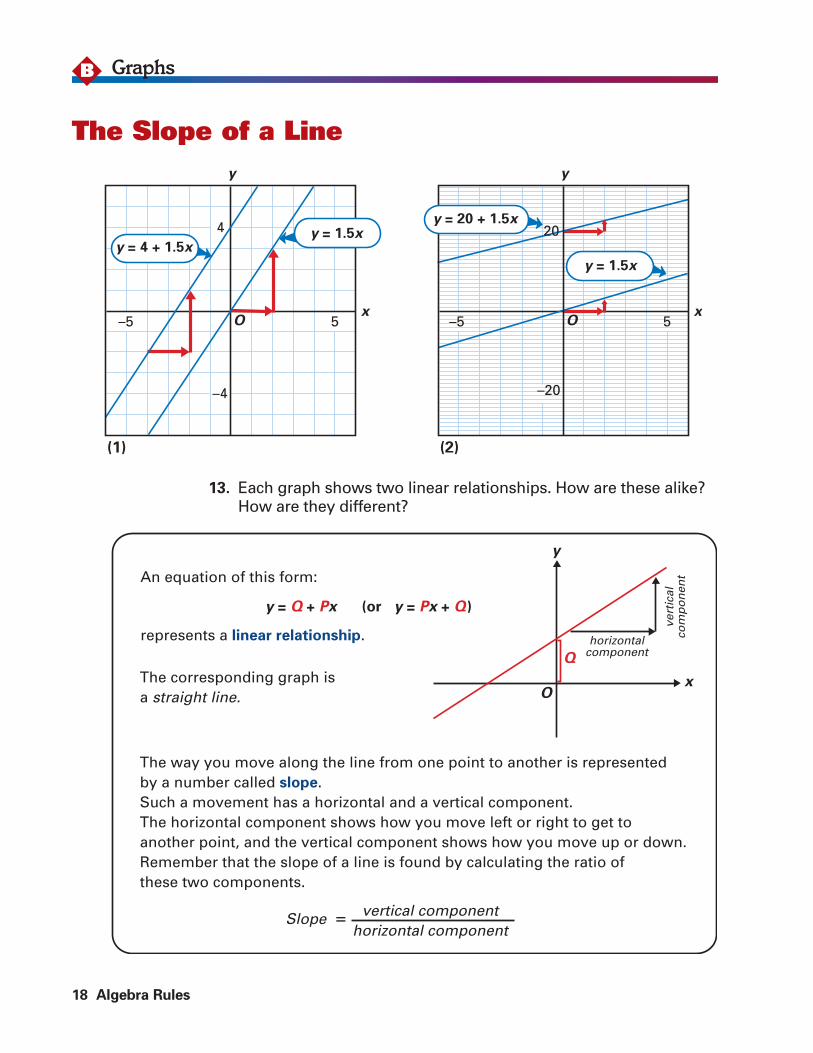
An equation of this form:
horizontalcomponent
represents a linear relationship.
The corresponding graph isa straight line.
Slope � vertical componenthorizontal component
The way you move along the line from one point to another is representedby a number called slope.Such a movement has a horizontal and a vertical component.The horizontal component shows how you move left or right to get toanother point, and the vertical component shows how you move up or down.Remember that the slope of a line is found by calculating the ratio ofthese two components.
y = Q + Px (or y = Px + Q )
vert
ical
com
po
nen
t
y
Q
O
The Slope of a Line
14. a. What is the slope of each of the lines in picture (1) on theprevious page? In picture (2)?
b. Suppose you were going to draw a line in picture (2) that wasmidway between the two lines in the graph. Give the equationfor your line.
15. Patty wants to draw the graph for the equation y � 20 � 1.5x inpicture (1). Why is this not a very good plan?
To draw the graphs of y � 1.5x and y � 20 � 1.5x in one picture, youcan use a coordinate system with different scales on the two axes.This is shown in picture (2). The lines in (2) have the same slope asthe lines in (1), although they look less steep in the picture!
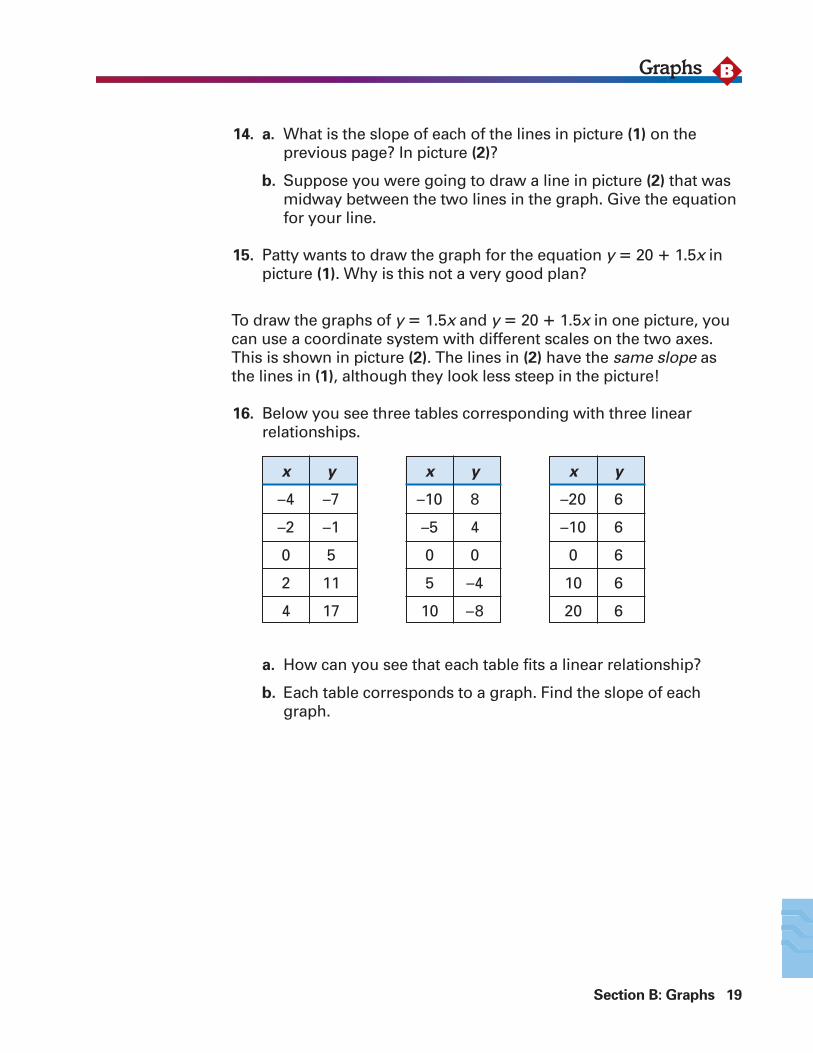
16. Below you see three tables corresponding with three linear relationships.
a. How can you see that each table fits a linear relationship?
b. Each table corresponds to a graph. Find the slope of eachgraph.
Section B: Graphs 19
BGraphs
x y
–4 –7
–2 –1
0 5
2 11
4 17
x y
–10 8
–5 4
0 0
5 –4
10 –8
x y
–20 6
–10 6
0 6
10 6
20 6
17. a. Draw and label a line that intersects the y-axis at (0, 3) and thathas a slope of 1��3.
b. Do the same for the line going through (0, 3) but with a slopeof �1��3.
c. Describe how the two lines seem to be related.
d. At what points do the lines intersect the x-axis?
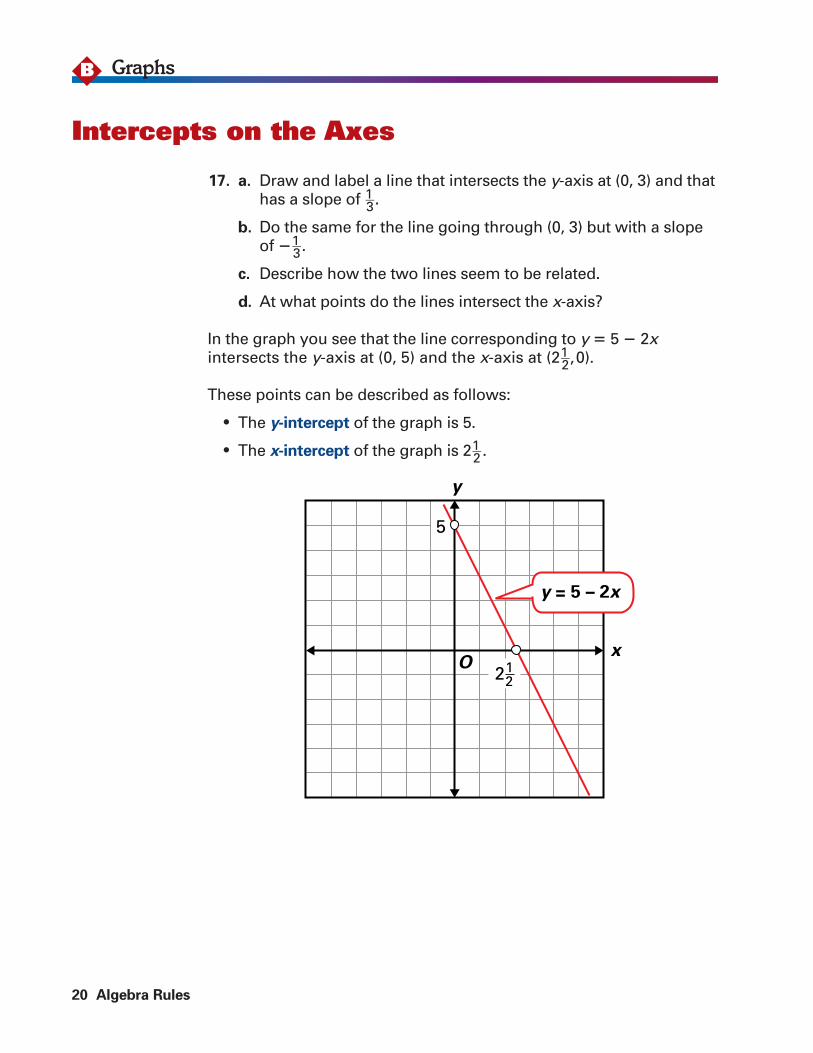
In the graph you see that the line corresponding to y � 5 � 2xintersects the y-axis at (0, 5) and the x-axis at (21��2,0).
20 Algebra Rules
GraphsB
y = 5 – 2x
y
xO
5
212
Intercepts on the Axes
These points can be described as follows:
• The y-intercept of the graph is 5.
• The x-intercept of the graph is 21��2 .
19. Determine the slope, the y-intercept, and the x-intercept of thegraphs corresponding to the following equations. Explain howyou did each problem.
a. y � 5 � 2x c. y � 4x � 6
b. y � 4 � 8x d. y � �11��2 x � 41��2
20. Find an equation of the straight line
a. with y-intercept 1 and slope 2;
b. with x-intercept 2 and slope 1;
c. with x-intercept 2 and y-intercept 1.
Explain what you did to find the equation in each case.
21. a. A line has slope 8 and y-intercept 320. Determine the x-intercept.
b. Another line has slope �8 and x-intercept 5. Determine the y-intercept.
Section B: Graphs 21
BGraphs
y
xO
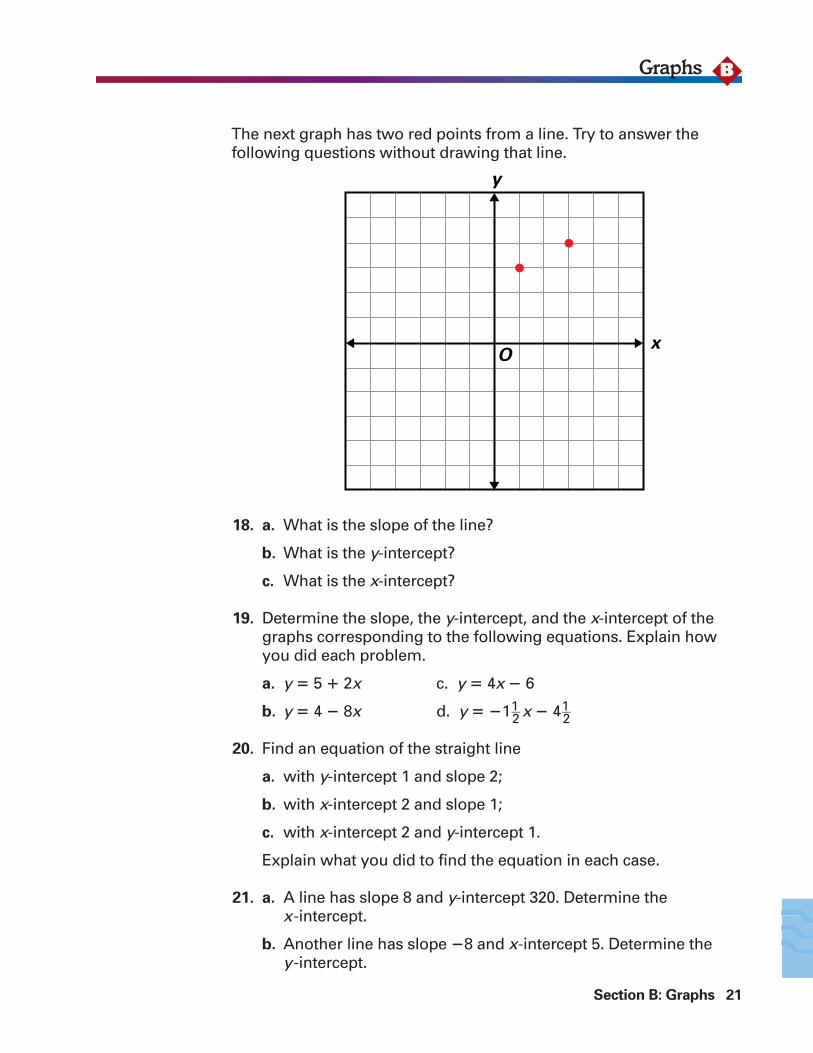
The next graph has two red points from a line. Try to answer the following questions without drawing that line.
18. a. What is the slope of the line?
b. What is the y-intercept?
c. What is the x-intercept?
22 Algebra Rules
GraphsB
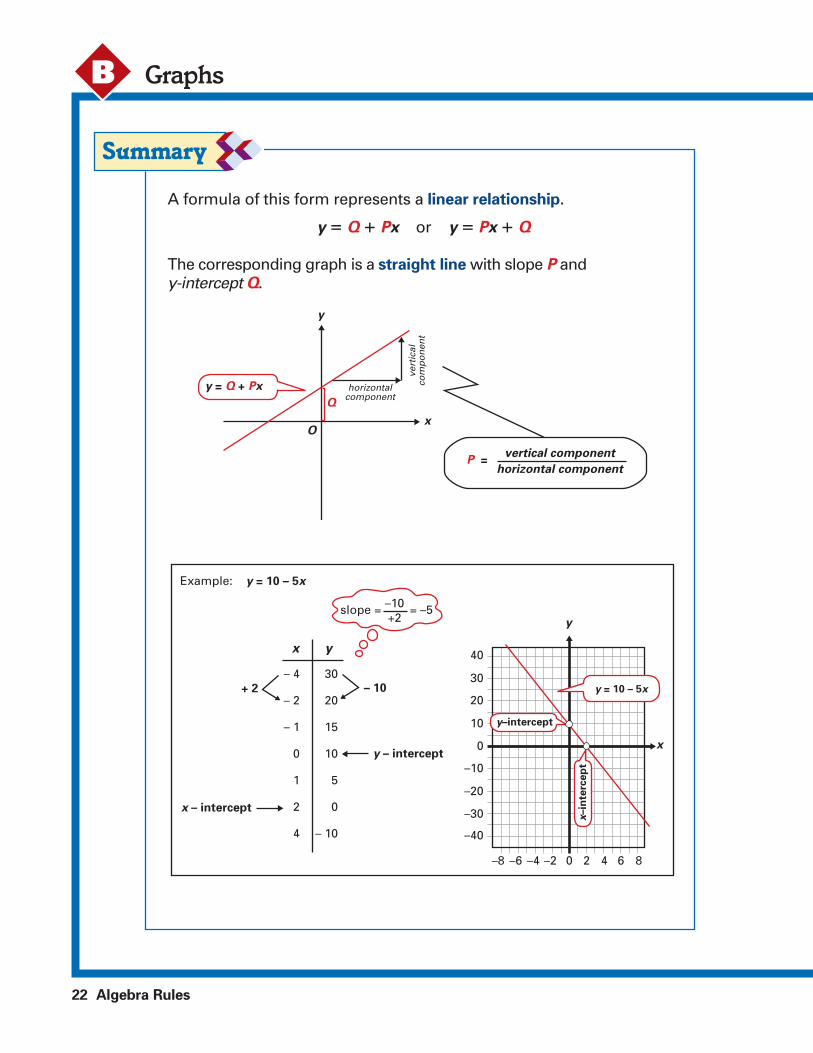
A formula of this form represents a linear relationship.
y � Q � Px or y � Px � Q
The corresponding graph is a straight line with slope P andy-intercept Q.
horizontalcomponent
vert
ical
com
po
nen
tx
y
O
Q
y = Q + Px
P =vertical component
horizontal component
y – intercept
x – intercept
– 10
Example: y = 10 – 5x
slope = = –5–10+2
+ 2
–40
–8 –6 –4 –2 0 2 4 6 8
–30
–20
–10
0
10
20
30
40
y–intercept
x–in
terc
ep
t
y = 10 – 5x
x
y
x y
– 4
– 2
– 1
0
1
2
4
30
20
15
10
5
0
– 10
Section B: Graphs 23
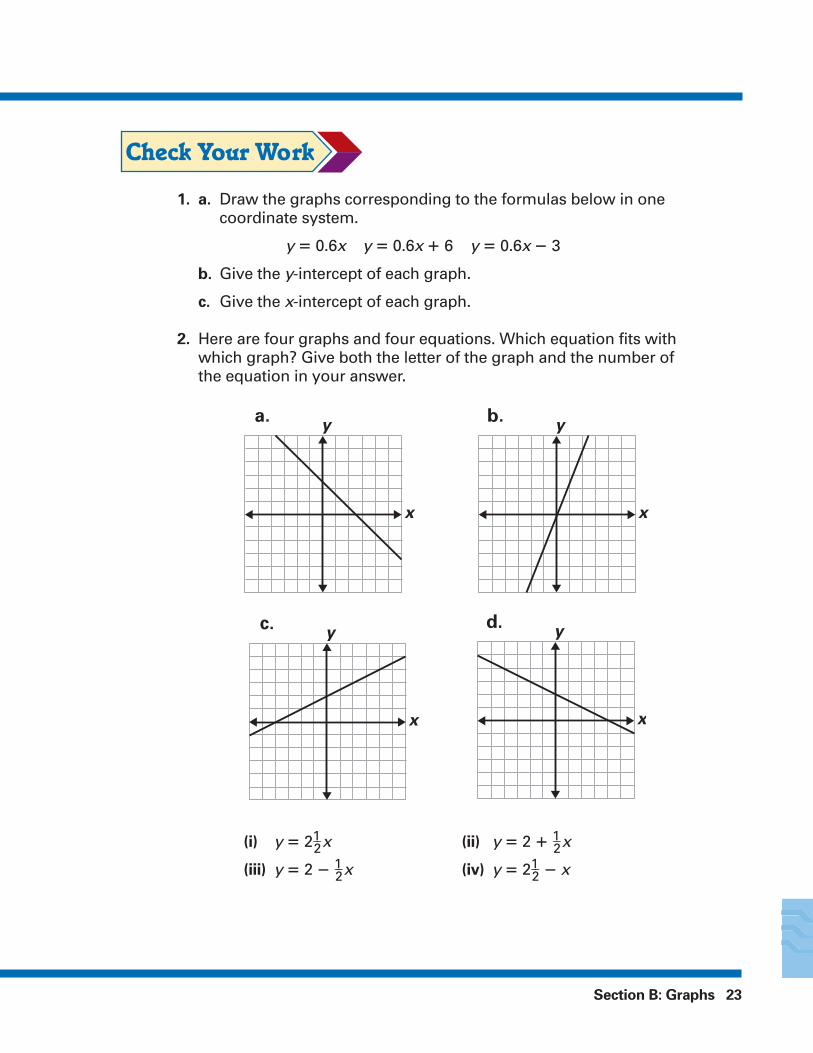
1. a. Draw the graphs corresponding to the formulas below in onecoordinate system.
y � 0.6x y � 0.6x � 6 y � 0.6x � 3
b. Give the y-intercept of each graph.
c. Give the x-intercept of each graph.
2. Here are four graphs and four equations. Which equation fits withwhich graph? Give both the letter of the graph and the number ofthe equation in your answer.
(i) y � 21��2x (ii) y � 2 � 1��2x
(iii) y � 2 � 1��2x (iv) y � 21��2 � x
ya.
x
yb.
x
yc.
x
yd.
x
24 Algebra Rules
Graphs
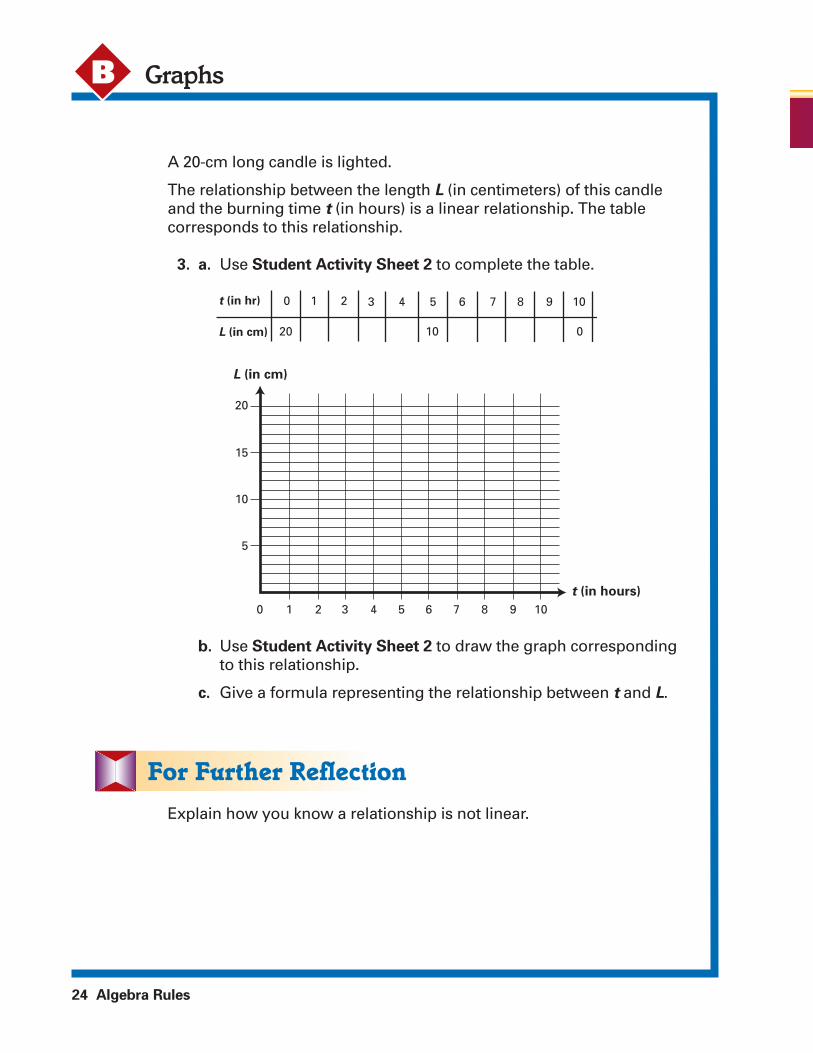
A 20-cm long candle is lighted.
The relationship between the length L (in centimeters) of this candleand the burning time t (in hours) is a linear relationship. The table corresponds to this relationship.
3. a. Use Student Activity Sheet 2 to complete the table.
b. Use Student Activity Sheet 2 to draw the graph correspondingto this relationship.
c. Give a formula representing the relationship between t and L.
Explain how you know a relationship is not linear.
B
10
5
10
15
20
L (in cm)
t (in hours)
2 3 4 5 6 7 8 9 10
t (in hr) 0
20 10 0
1 2 3 4 5 6 7 8 9 10
L (in cm)
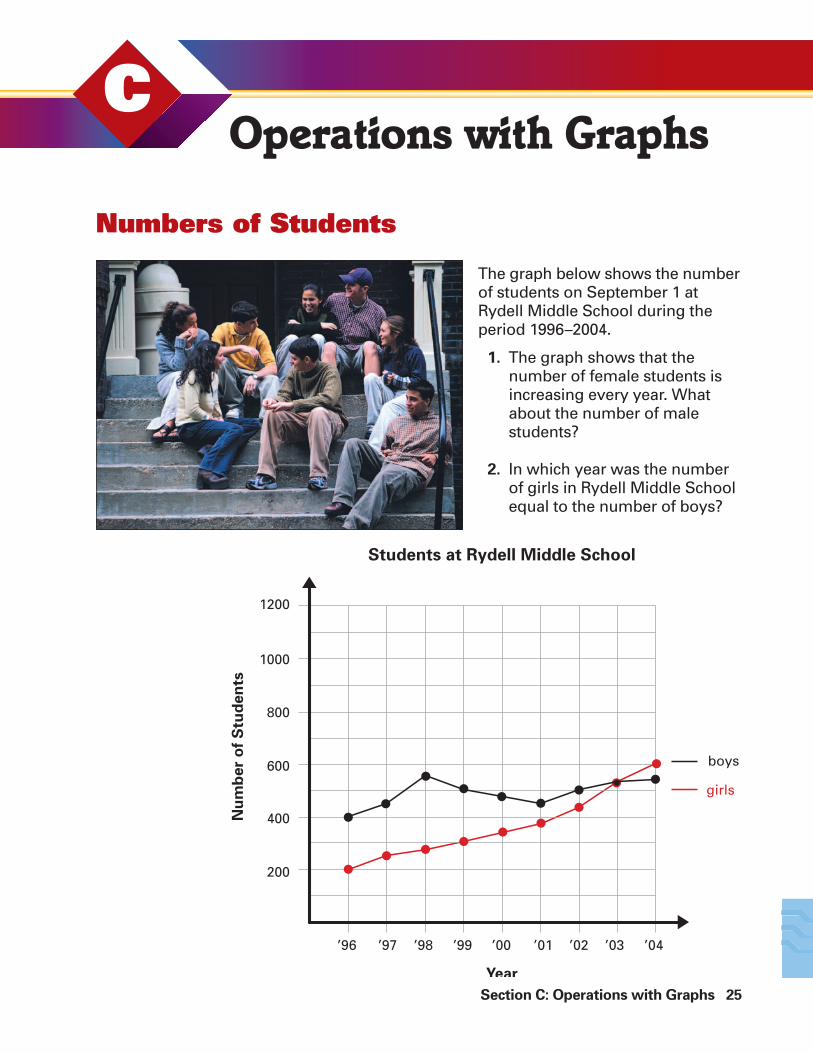
The graph below shows the numberof students on September 1 atRydell Middle School during theperiod 1996–2004.
1. The graph shows that thenumber of female students isincreasing every year. Whatabout the number of male students?
2. In which year was the numberof girls in Rydell Middle Schoolequal to the number of boys?
Section C: Operations with Graphs 25
COperations with Graphs
Numbers of Students
200
’96 ’97 ’98 ’01 ’02 ’03 ’04’99 ’00
boys
girls
Year
Students at Rydell Middle School
Nu
mb
er
of
Stu
de
nts
400
600
800
1000
1200
3. a. Use Student Activity Sheet 2 to graph the total number of students in Rydell Middle School.
b. Label the graph of the number of girls with G and that of thenumber of boys with B.
c. How can you label the graph of the total number of studentsusing the letters G and B?
26 Algebra Rules
Operations with GraphsC
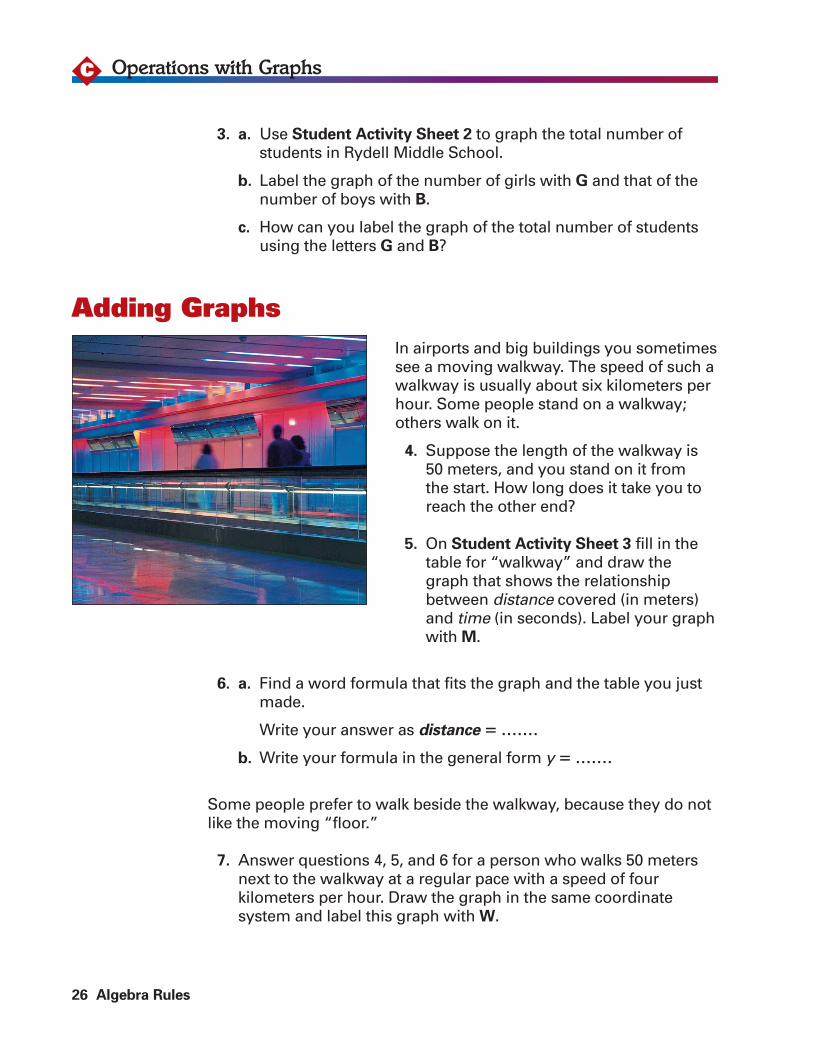
Adding GraphsIn airports and big buildings you sometimessee a moving walkway. The speed of such a walkway is usually about six kilometers perhour. Some people stand on a walkway;others walk on it.
4. Suppose the length of the walkway is50 meters, and you stand on it from the start. How long does it take you toreach the other end?
5. On Student Activity Sheet 3 fill in thetable for “walkway” and draw thegraph that shows the relationshipbetween distance covered (in meters)and time (in seconds). Label your graph with M.
6. a. Find a word formula that fits the graph and the table you justmade.
Write your answer as distance � .......
b. Write your formula in the general form y � .......
Some people prefer to walk beside the walkway, because they do notlike the moving “floor.”
7. Answer questions 4, 5, and 6 for a person who walks 50 metersnext to the walkway at a regular pace with a speed of four kilometers per hour. Draw the graph in the same coordinatesystem and label this graph with W.
8. a. Now add the two graphs to make a new one, labeled M � W.You may use the last part of the table on Student Activity
Sheet 3 if you want to.
b. Give a formula that fits the graph M � W.
c. What does the new graph M � W represent?
d. What is the slope of each of the lines M, W, and M � W?What does the slope tell you about the speed?
In the following exercises, it is not necessary to know what the graphsrepresent.
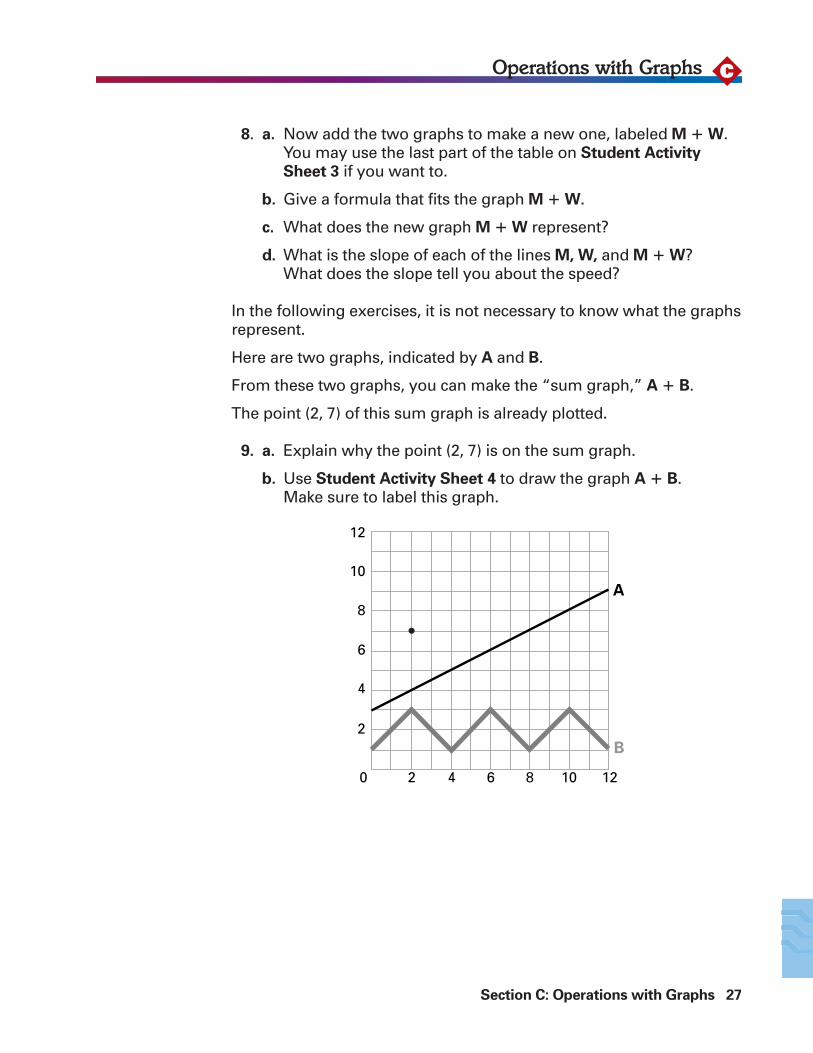
Here are two graphs, indicated by A and B.
From these two graphs, you can make the “sum graph,” A � B.
The point (2, 7) of this sum graph is already plotted.
9. a. Explain why the point (2, 7) is on the sum graph.
b. Use Student Activity Sheet 4 to draw the graph A � B. Make sure to label this graph.
Section C: Operations with Graphs 27
COperations with Graphs
0 2 4 6 8 10 12
A
B
2
4
6
8
10
12
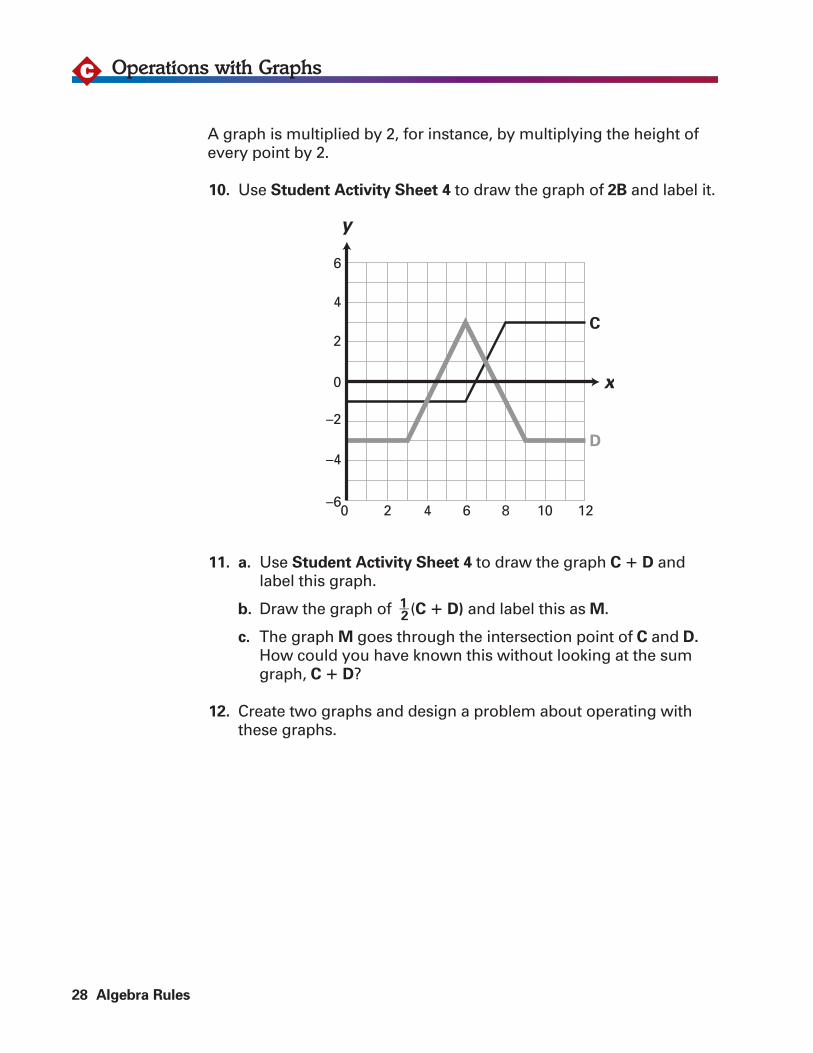
A graph is multiplied by 2, for instance, by multiplying the height ofevery point by 2.
10. Use Student Activity Sheet 4 to draw the graph of 2B and label it.
11. a. Use Student Activity Sheet 4 to draw the graph C � D andlabel this graph.
b. Draw the graph of 1��2 (C � D) and label this as M.
c. The graph M goes through the intersection point of C and D.
How could you have known this without looking at the sumgraph, C � D?
12. Create two graphs and design a problem about operating withthese graphs.
28 Algebra Rules
Operations with GraphsC
0 2 4 6 8 10 12
C
D–4
–6
–2
0
2
4
6
x
y
Section C: Operations with Graphs 29
COperations with Graphs
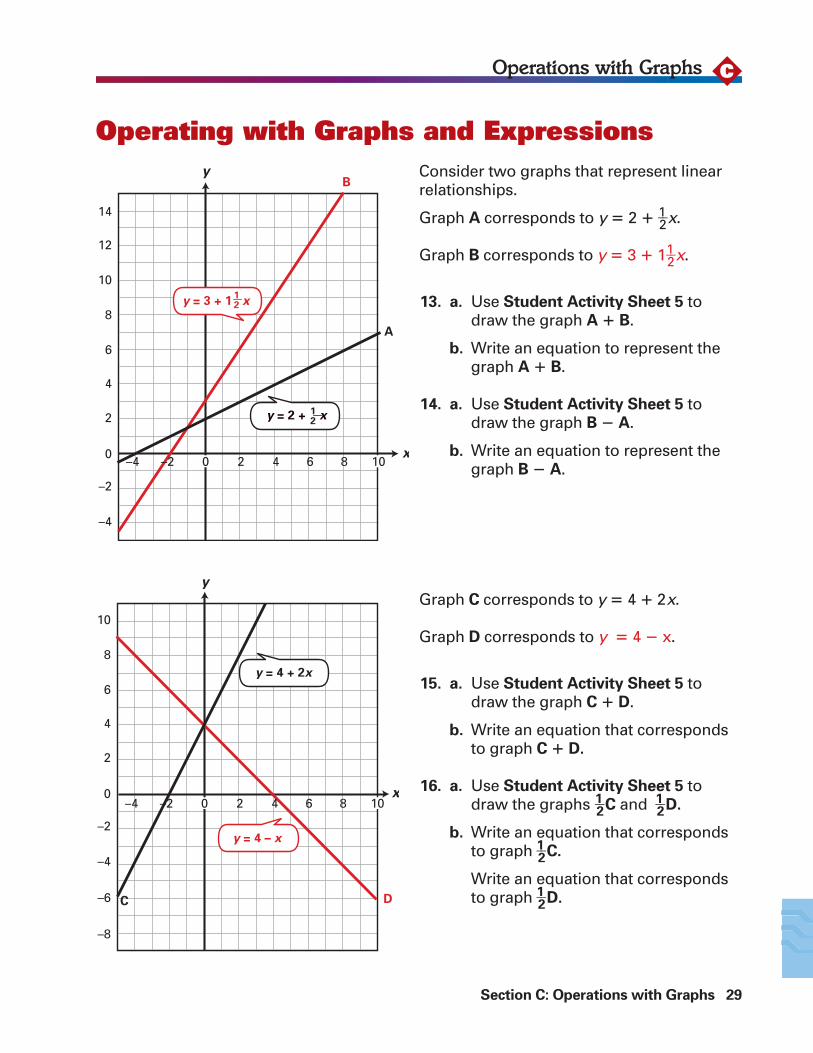
Consider two graphs that represent linearrelationships.
Graph A corresponds to y � 2 � 1��2x.
Graph B corresponds to y � 3 � 11��2x.
13. a. Use Student Activity Sheet 5 todraw the graph A � B.
b. Write an equation to represent thegraph A � B.
14. a. Use Student Activity Sheet 5 todraw the graph B � A.
b. Write an equation to represent thegraph B � A.
Graph C corresponds to y � 4 � 2x.
Graph D corresponds to y � 4 � x.
15. a. Use Student Activity Sheet 5 todraw the graph C � D.
b. Write an equation that correspondsto graph C � D.
16. a. Use Student Activity Sheet 5 todraw the graphs 1��2C and 1��2D.
b. Write an equation that correspondsto graph 1��2C.
Write an equation that correspondsto graph 1��2D.
Operating with Graphs and Expressionsy
A
B
x
y = 3 + 1 x12
y = 2 + x12
–2–4 2 4 6 8
–4
–2
0
2
4
6
8
10
12
14
0 10
y
DC
x
y = 4 – x
y = 4 + 2x
–2–4 2 4 6 8
–4
–6
–8
–2
0
2
4
6
8
10
0 10
30 Algebra Rules
Operations with Graphs
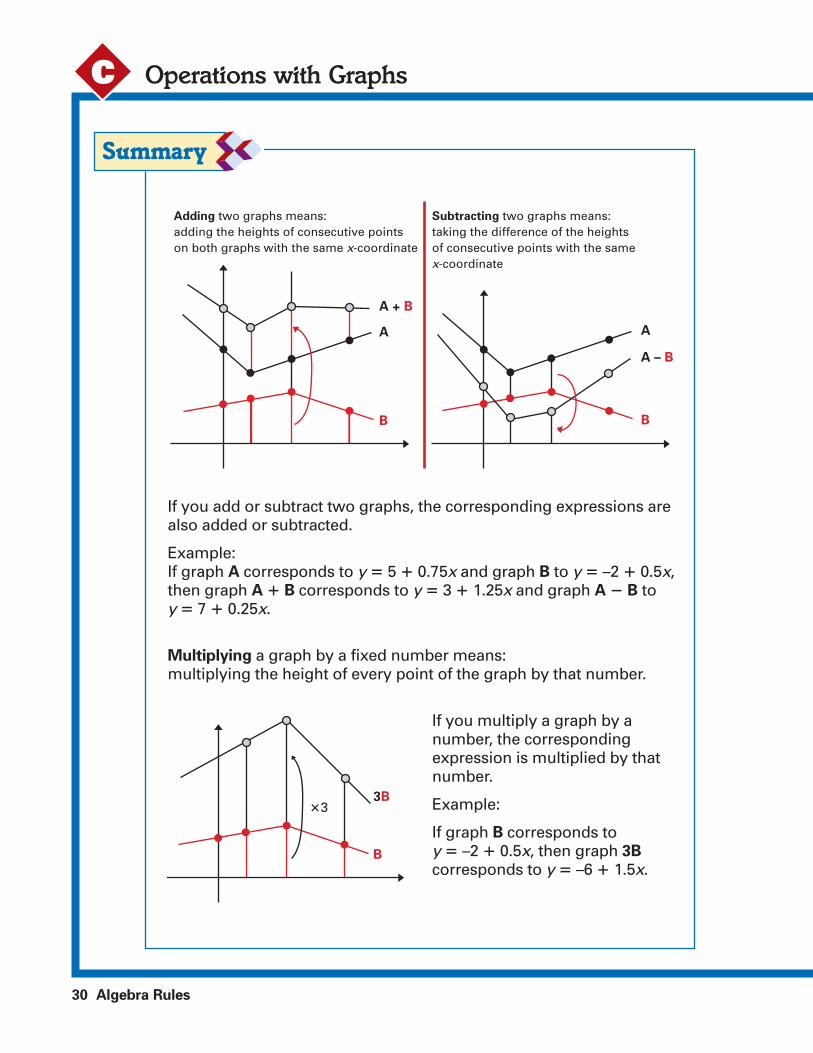
If you add or subtract two graphs, the corresponding expressions arealso added or subtracted.
Example:If graph A corresponds to y � 5 � 0.75x and graph B to y � –2 � 0.5x,then graph A � B corresponds to y � 3 � 1.25x and graph A � B to y � 7 � 0.25x.
Multiplying a graph by a fixed number means: multiplying the height of every point of the graph by that number.
C
A + B
A – B
A A
B B
Adding two graphs means:adding the heights of consecutive pointson both graphs with the same x-coordinate
Subtracting two graphs means:taking the difference of the heights of consecutive points with the samex-coordinate
B
3B�3
If you multiply a graph by anumber, the correspondingexpression is multiplied by thatnumber.
Example:
If graph B corresponds to y � –2 � 0.5x, then graph 3B
corresponds to y � –6 � 1.5x.
Section C: Operations with Graphs 31
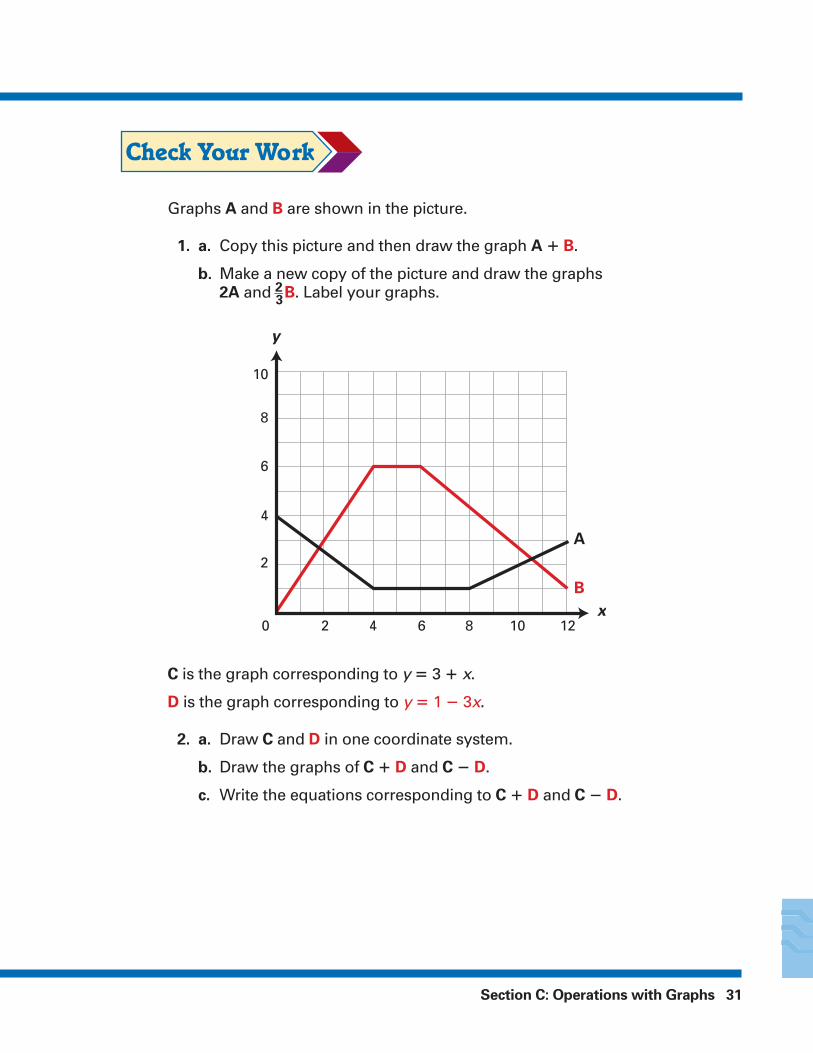
Graphs A and B are shown in the picture.
1. a. Copy this picture and then draw the graph A � B.
b. Make a new copy of the picture and draw the graphs 2A and 2��
3B. Label your graphs.
C is the graph corresponding to y � 3 � x.
D is the graph corresponding to y � 1 � 3x.
2. a. Draw C and D in one coordinate system.
b. Draw the graphs of C � D and C � D.
c. Write the equations corresponding to C � D and C � D.
0 2 4 6 8 10 12
A
B
2
4
6
8
10
y
x
32 Algebra Rules
Operations with Graphs
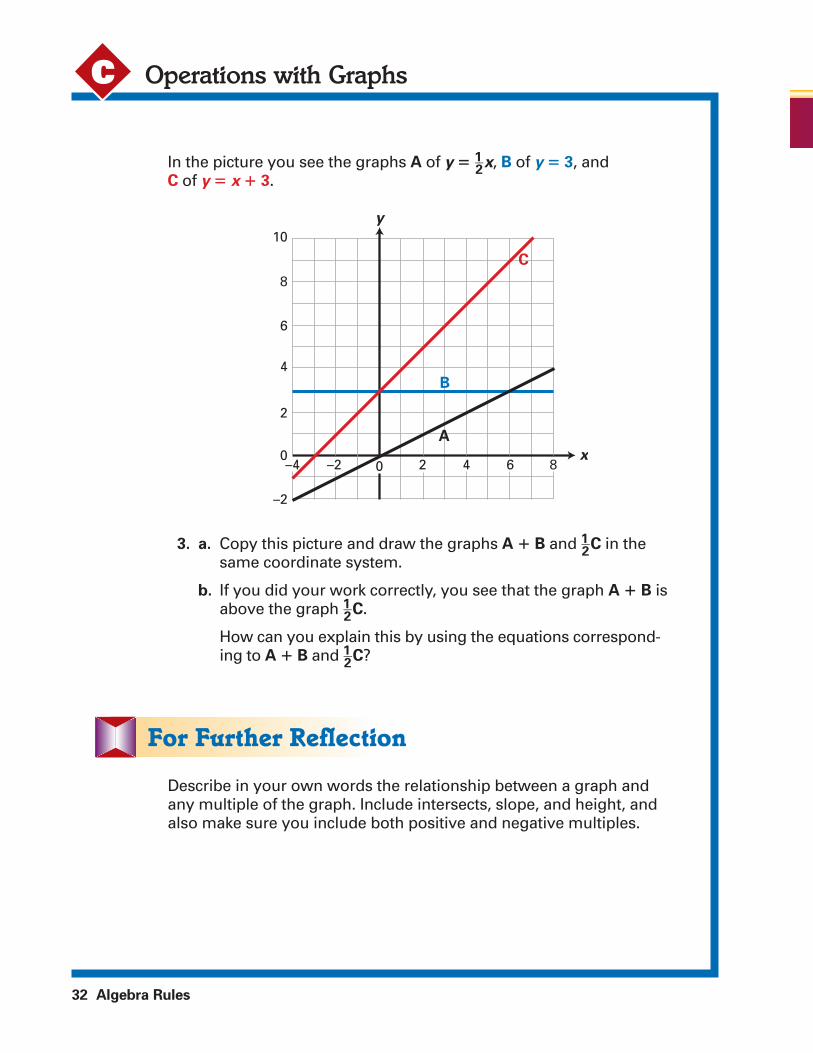
In the picture you see the graphs A of y � 1��2x, B of y � 3, and
C of y � x � 3.
3. a. Copy this picture and draw the graphs A � B and 1��2C in the
same coordinate system.
b. If you did your work correctly, you see that the graph A � B isabove the graph 1��
2C.
How can you explain this by using the equations correspond-ing to A � B and 1��
2C?
Describe in your own words the relationship between a graph andany multiple of the graph. Include intersects, slope, and height, andalso make sure you include both positive and negative multiples.
C
0
–2
–4 –2 0 2 4 6 8
A
2
4
6
8
10
C
B
x
y
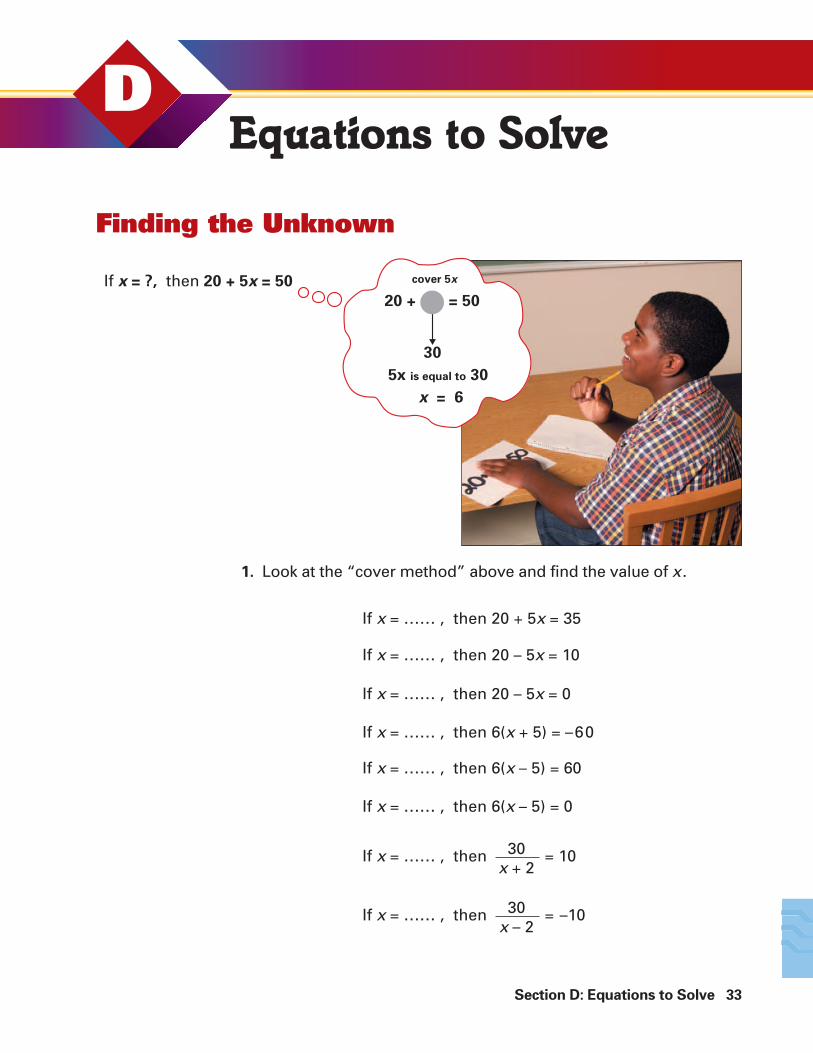
1. Look at the “cover method” above and find the value of x .
Section D: Equations to Solve 33
DEquations to Solve
Finding the Unknown
If x = …… , then 20 + 5x = 35
If x = …… , then 20 – 5x = 10
If x = …… , then 20 – 5x = 0
If x = …… , then 6(x + 5) = –60
If x = …… , then 6(x – 5) = 60
If x = …… , then 6(x – 5) = 0
If x = …… , then = 1030x + 2
If x = …… , then = –1030x – 2
cover 5x
20 +
30
5x is equal to 30
If x = ?, then 20 + 5x = 50
= 50
x = 6
3
2a + 1
5(d + 10) = 80
2(10 + 5f ) = 120
a + b + c + d + e + f + g + h = 60
83 + g = 10
= 1
+ = 1
= 5
= 2 12
= 1 14
1 +1c
1h
78
4 +10e
b + 1
2
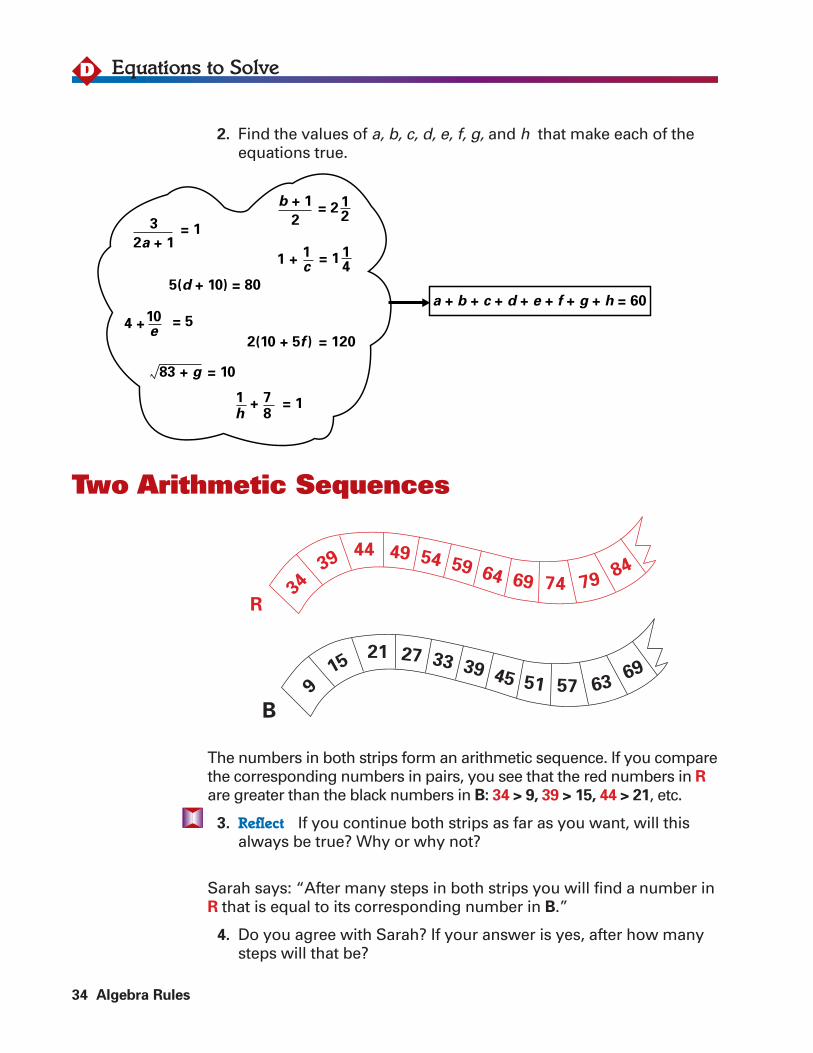
2. Find the values of a, b, c, d, e, f, g, and h that make each of the equations true.
The numbers in both strips form an arithmetic sequence. If you comparethe corresponding numbers in pairs, you see that the red numbers in Rare greater than the black numbers in B: 34 > 9, 39 > 15, 44 > 21, etc.
3. Reflect If you continue both strips as far as you want, will thisalways be true? Why or why not?
Sarah says: “After many steps in both strips you will find a number inR that is equal to its corresponding number in B.”
4. Do you agree with Sarah? If your answer is yes, after how manysteps will that be?
34 Algebra Rules
Equations to SolveD
Two Arithmetic Sequences
3439
44 49 54 59 64 69 74 7984
R
915
21 27 33 39 45 51 57 6369
B
R – B
Section D: Equations to Solve 35
DEquations to Solve
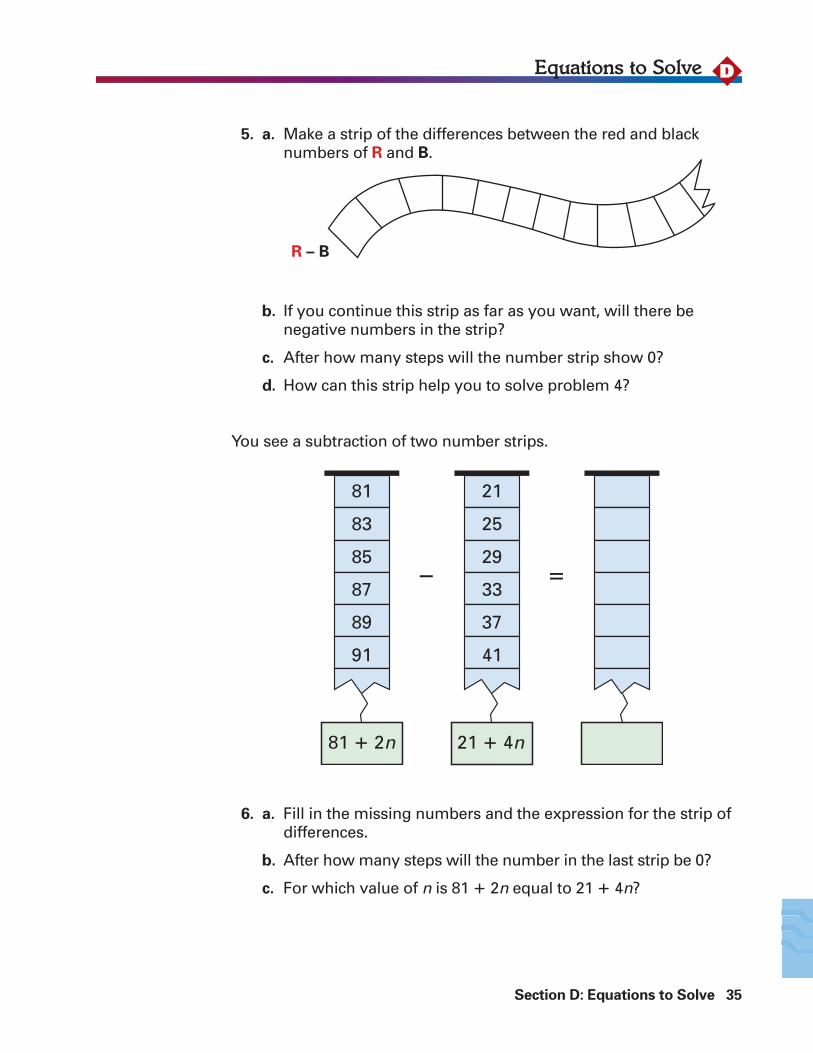
5. a. Make a strip of the differences between the red and blacknumbers of R and B.
b. If you continue this strip as far as you want, will there be negative numbers in the strip?
c. After how many steps will the number strip show 0?
d. How can this strip help you to solve problem 4?
You see a subtraction of two number strips.
6. a. Fill in the missing numbers and the expression for the strip ofdifferences.
b. After how many steps will the number in the last strip be 0?
c. For which value of n is 81 � 2n equal to 21 � 4n?
81 � 2n 21 � 4n
81
83
85
87
89
91
21
25
29
33
37
41
� �
36 Algebra Rules
Equations to SolveD
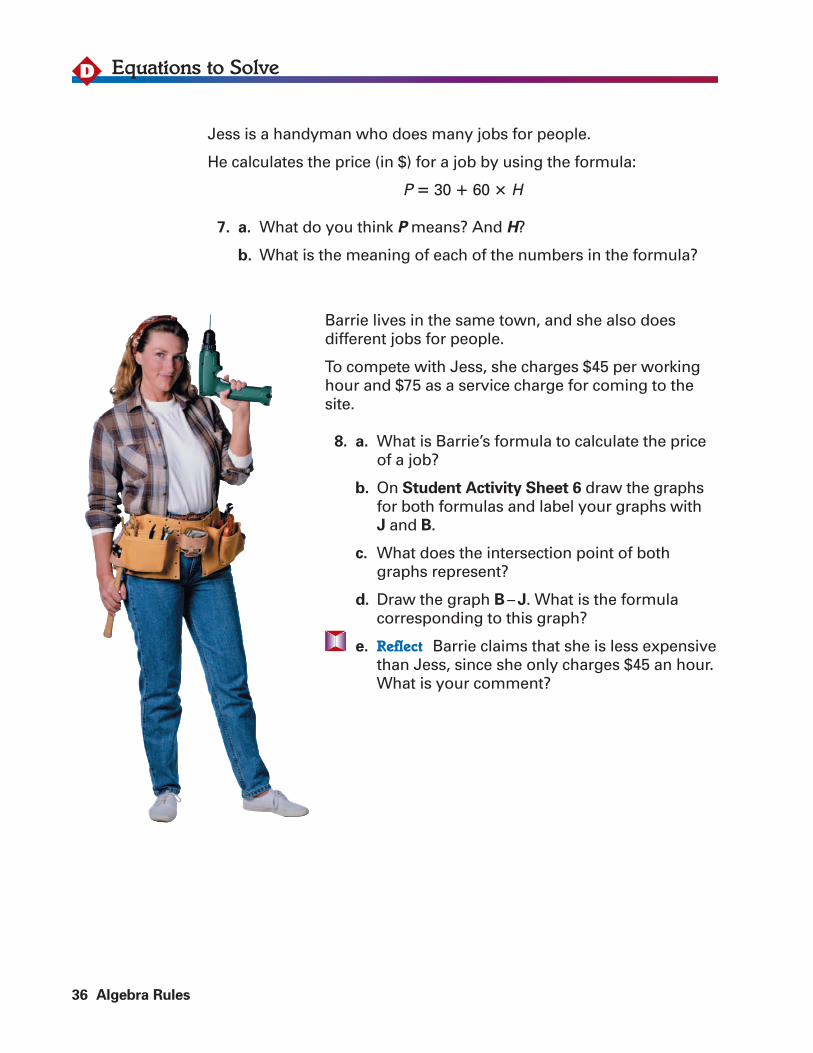
Jess is a handyman who does many jobs for people.
He calculates the price (in $) for a job by using the formula:
P � 30 � 60 � H
7. a. What do you think P means? And H?
b. What is the meaning of each of the numbers in the formula?
Barrie lives in the same town, and she also does different jobs for people.
To compete with Jess, she charges $45 per workinghour and $75 as a service charge for coming to thesite.
8. a. What is Barrie’s formula to calculate the priceof a job?
b. On Student Activity Sheet 6 draw the graphsfor both formulas and label your graphs with J and B.
c. What does the intersection point of bothgraphs represent?
d. Draw the graph B – J. What is the formula corresponding to this graph?
e. Reflect Barrie claims that she is less expensivethan Jess, since she only charges $45 an hour.What is your comment?
Section D: Equations to Solve 37
DEquations to Solve
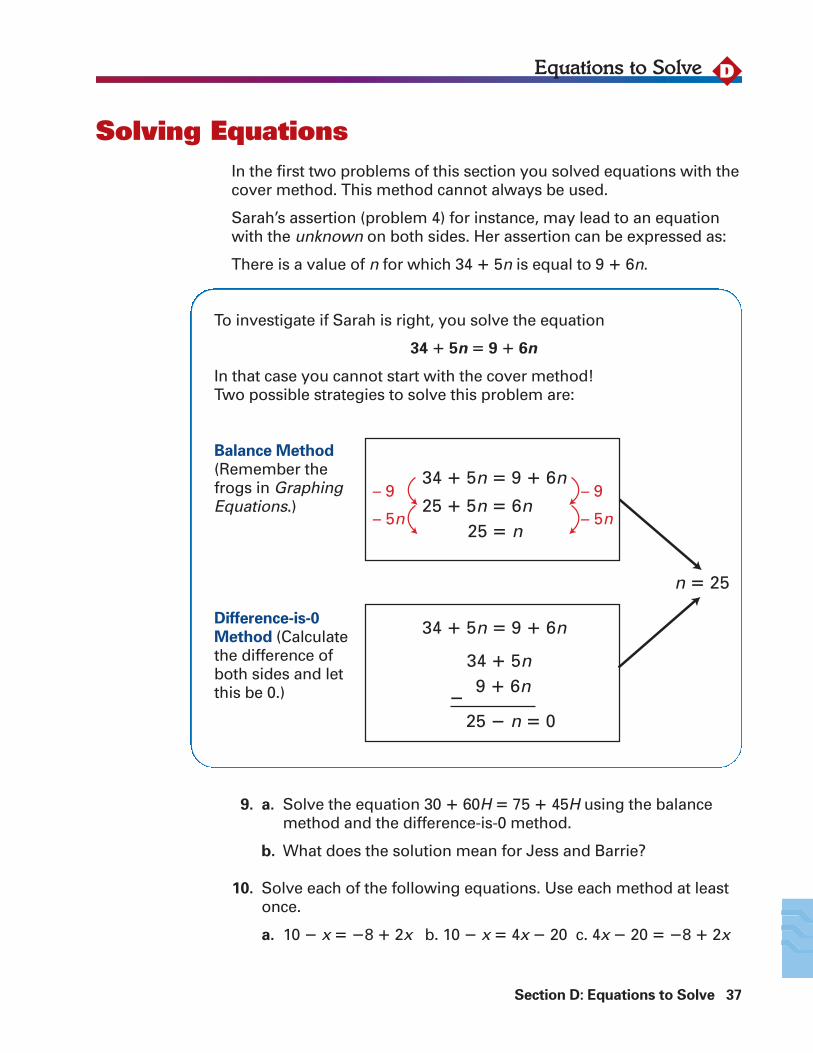
In the first two problems of this section you solved equations with thecover method. This method cannot always be used.
Sarah’s assertion (problem 4) for instance, may lead to an equationwith the unknown on both sides. Her assertion can be expressed as:
There is a value of n for which 34 � 5n is equal to 9 � 6n.
Solving Equations
Balance Method
(Remember thefrogs in GraphingEquations.)
Difference-is-0
Method (Calculatethe difference ofboth sides and letthis be 0.)
9. a. Solve the equation 30 � 60H � 75 � 45H using the balancemethod and the difference-is-0 method.
b. What does the solution mean for Jess and Barrie?
10. Solve each of the following equations. Use each method at leastonce.
a. 10 � x � �8 � 2x b. 10 � x � 4x � 20 c. 4x � 20 � �8 � 2x
To investigate if Sarah is right, you solve the equation
34 � 5n � 9 � 6n
In that case you cannot start with the cover method!Two possible strategies to solve this problem are:
34 � 5n � 9 � 6n
25 � 5n � 6n25 � n
n � 25
– 9
– 5n
– 9
– 5n
34 � 5n � 9 � 6n
34 � 5n9 � 6n
�
25 � n � 0
11. Create an equation with the unknown on both sides. The solutionhas to be equal to your age.
12. Reflect What happens if you use the difference-is-0 method to solve:
3 � 5p � 5p
What conclusion can you make?
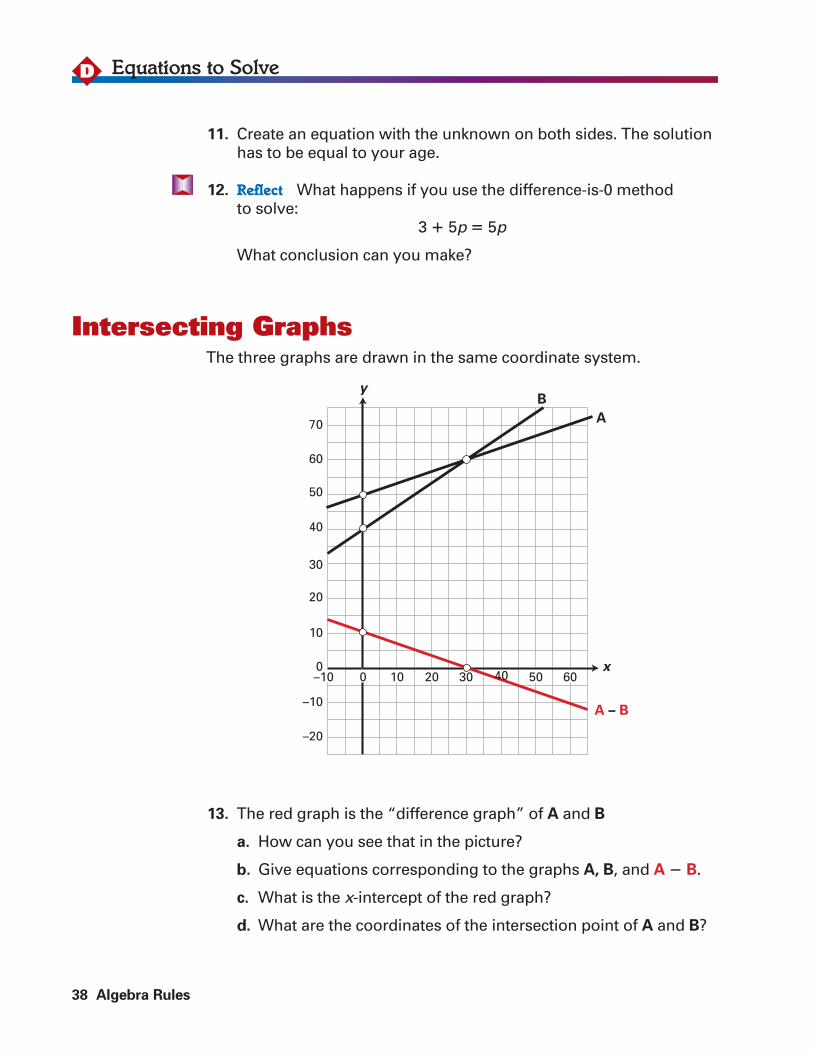
The three graphs are drawn in the same coordinate system.
13. The red graph is the “difference graph” of A and B
a. How can you see that in the picture?
b. Give equations corresponding to the graphs A, B, and A � B.
c. What is the x-intercept of the red graph?
d. What are the coordinates of the intersection point of A and B?
38 Algebra Rules
Equations to SolveD
Intersecting Graphs
–20
–10
–10 0 10 20 30 50 600
10
20
30
40
50
60
70
y
x
A
A – B
B
40
DEquations to Solve
14. a. In one coordinate system, draw the lines corresponding to theequations:
y � 32 � 4x and y � 8(6 � x)
b. Calculate the slope, the y-intercept, and the x-intercept of bothlines.
c. The two lines have an intersection point. Find the coordinatesof this point.
15. a. Use Student Activity Sheet 6 and draw the graphs corresponding to
y � 2 � 4x and y � �6 � 3x
b. Should the graphs intersect if the grid is extended far enough?
If you think yes, calculate the intersection point.
If you think no, explain why you are sure they will neverintersect.
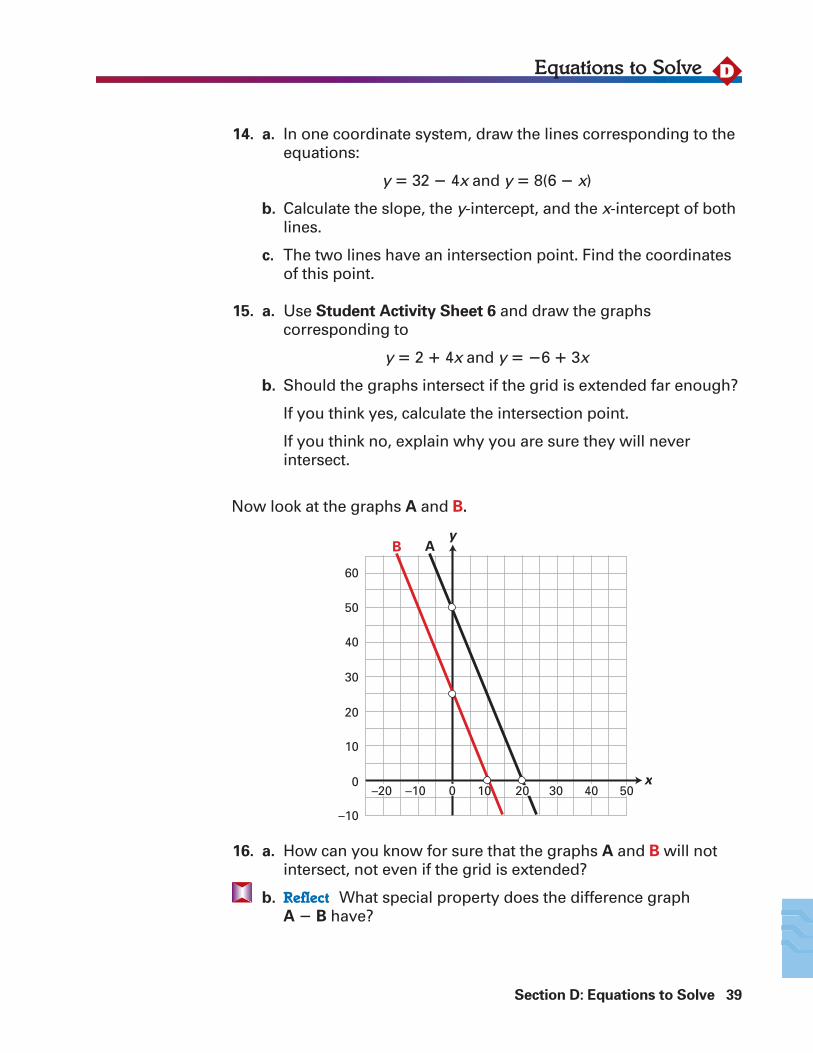
Now look at the graphs A and B.
16. a. How can you know for sure that the graphs A and B will notintersect, not even if the grid is extended?
b. Reflect What special property does the difference graph A � B have?
Section D: Equations to Solve 39
–10
0
10
20
30
40
50
60
B
x
yA
–20 –10 0 10 20 30 40 50
40 Algebra Rules
Equations to solve
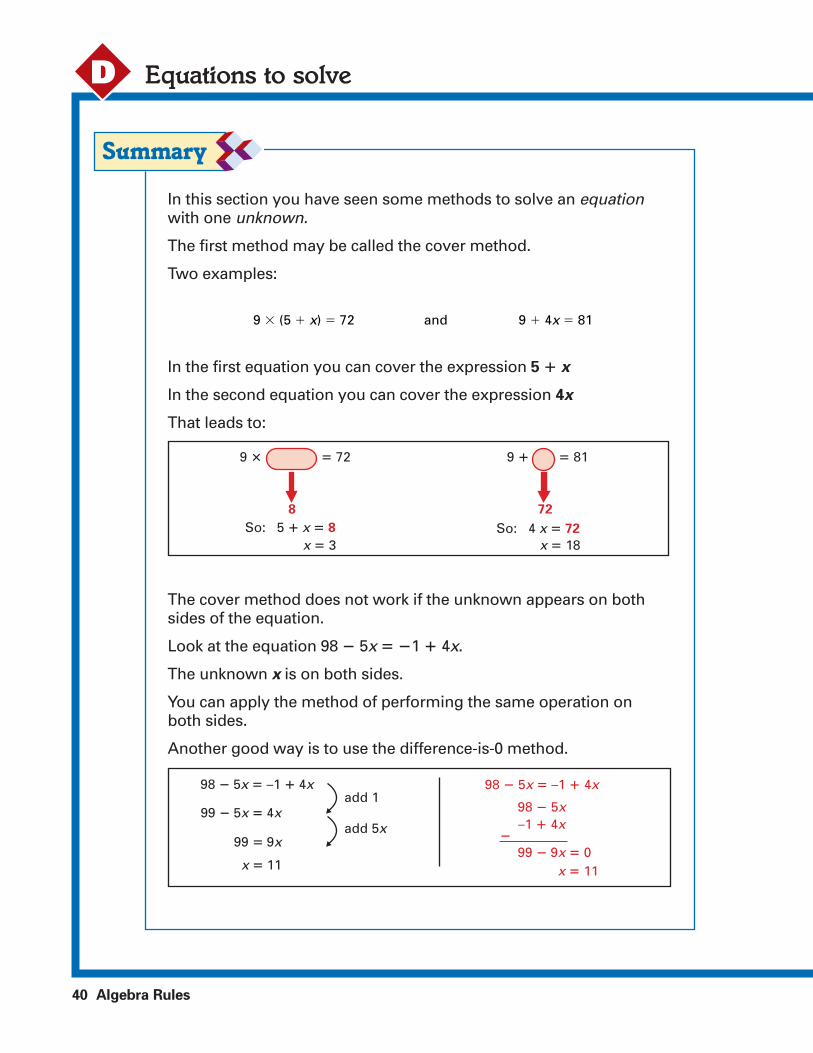
In this section you have seen some methods to solve an equationwith one unknown.
The first method may be called the cover method.
Two examples:
In the first equation you can cover the expression 5 � x
In the second equation you can cover the expression 4x
That leads to:
The cover method does not work if the unknown appears on bothsides of the equation.
Look at the equation 98 � 5x � �1 � 4x.
The unknown x is on both sides.
You can apply the method of performing the same operation on both sides.
Another good way is to use the difference-is-0 method.
D
9 � (5 � x) � 72 9 � 4x � 81and
9 � � 72
So: 5 � x � 88 72
So: 4 x � 72
x � 3 x � 18
9 � � 81
98 � 5x � –1 � 4x add 1
add 5x
98 � 5x � –1 � 4x
99 � 9x � 0x � 11
�
98 � 5x –1 � 4x
99 � 5x � 4x
99 � 9x
x � 11
Section D: Equations to solve 41
You can find the intersection point of two graphs by solving an equation.
Example:
The graphs with equations y � 300 � 65x and y � 150 � 80x have anintersection point because the slopes are different.
The x-coordinate of the intersection point is found by solving:
300 � 65x � 150 � 80x or 150 � 15x � 0
The solution is x � 10, and the intersection point is (10, 950).
1. Solve the following equations with the cover method.
a. 99 � 2x � 100 c. 99�2x � 11
b. 9(x � 4) � 99 d. x � 9��4 � 25
2. Design an equation that can be solved using the difference-is-0method.
3. a. Draw the graphs corresponding to y � 7 � 3x and y � 2x � 1in one coordinate system.
b. Calculate the x-coordinate of the intersection point for thegraphs.
4. Do the graphs of y � 40 � 8x and y � 8(x � 7) have an intersectionpoint? Why or why not?
Is it possible to have two different lines that intersect at more thanone point? Explain.
42 Algebra Rules
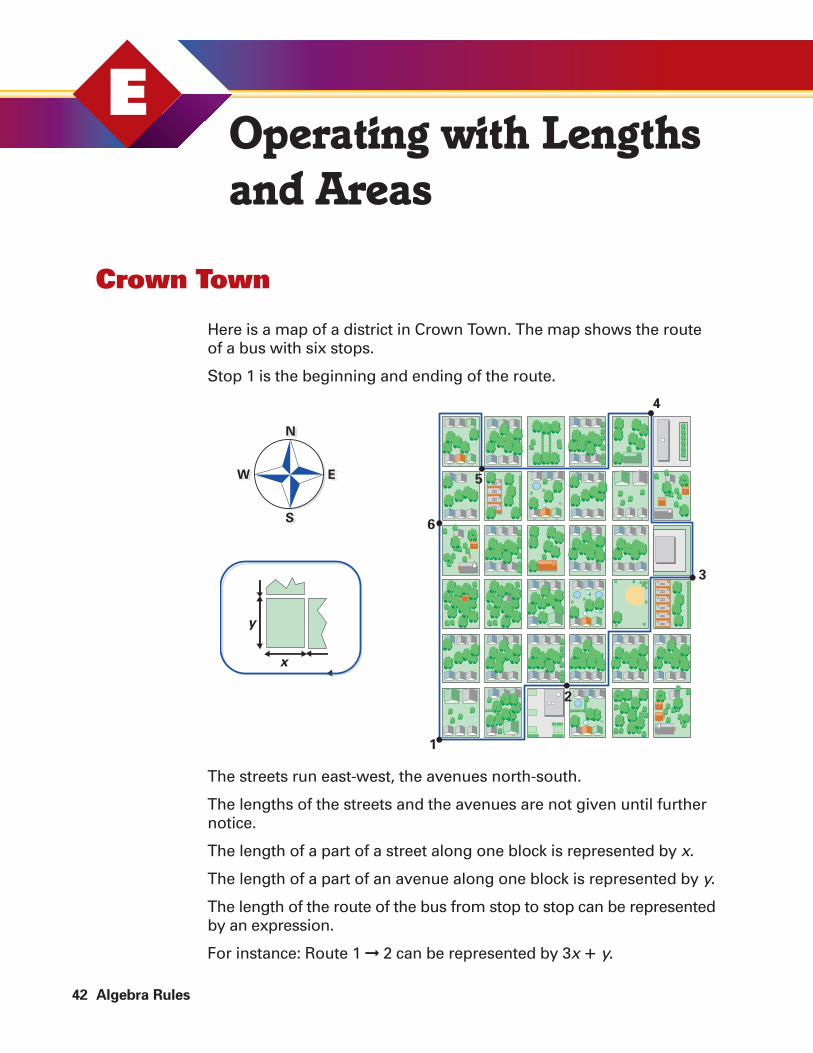
Here is a map of a district in Crown Town. The map shows the routeof a bus with six stops.
Stop 1 is the beginning and ending of the route.
The streets run east-west, the avenues north-south.
The lengths of the streets and the avenues are not given until furthernotice.
The length of a part of a street along one block is represented by x.
The length of a part of an avenue along one block is represented by y.
The length of the route of the bus from stop to stop can be representedby an expression.
For instance: Route 1 ➞ 2 can be represented by 3x � y.
EOperating with Lengthsand Areas
Crown Town
1
2
3
4
5
6
x
y
S
EW
N
S
EW
N
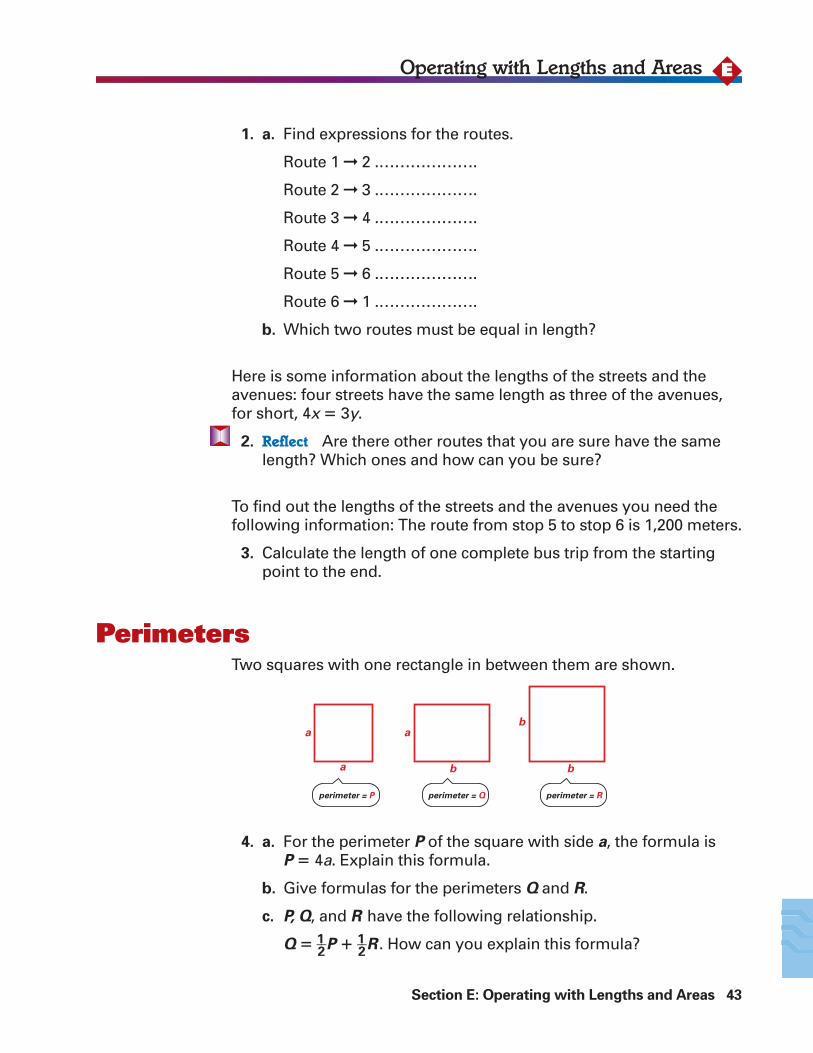
1. a. Find expressions for the routes.
Route 1 ➞ 2 .……………….
Route 2 ➞ 3 .……………….
Route 3 ➞ 4 .……………….
Route 4 ➞ 5 .……………….
Route 5 ➞ 6 .……………….
Route 6 ➞ 1 .……………….
b. Which two routes must be equal in length?
Here is some information about the lengths of the streets and theavenues: four streets have the same length as three of the avenues,for short, 4x � 3y.
2. Reflect Are there other routes that you are sure have the samelength? Which ones and how can you be sure?
To find out the lengths of the streets and the avenues you need thefollowing information: The route from stop 5 to stop 6 is 1,200 meters.
3. Calculate the length of one complete bus trip from the startingpoint to the end.
Two squares with one rectangle in between them are shown.
4. a. For the perimeter P of the square with side a, the formula is P � 4a. Explain this formula.
b. Give formulas for the perimeters Q and R.
c. P, Q, and R have the following relationship.
Q � 1��2P � 1��2R . How can you explain this formula?
Section E: Operating with Lengths and Areas 43
EOperating with Lengths and Areas
a
a
ab
bb
perimeter = P perimeter = Q perimeter = R
Perimeters
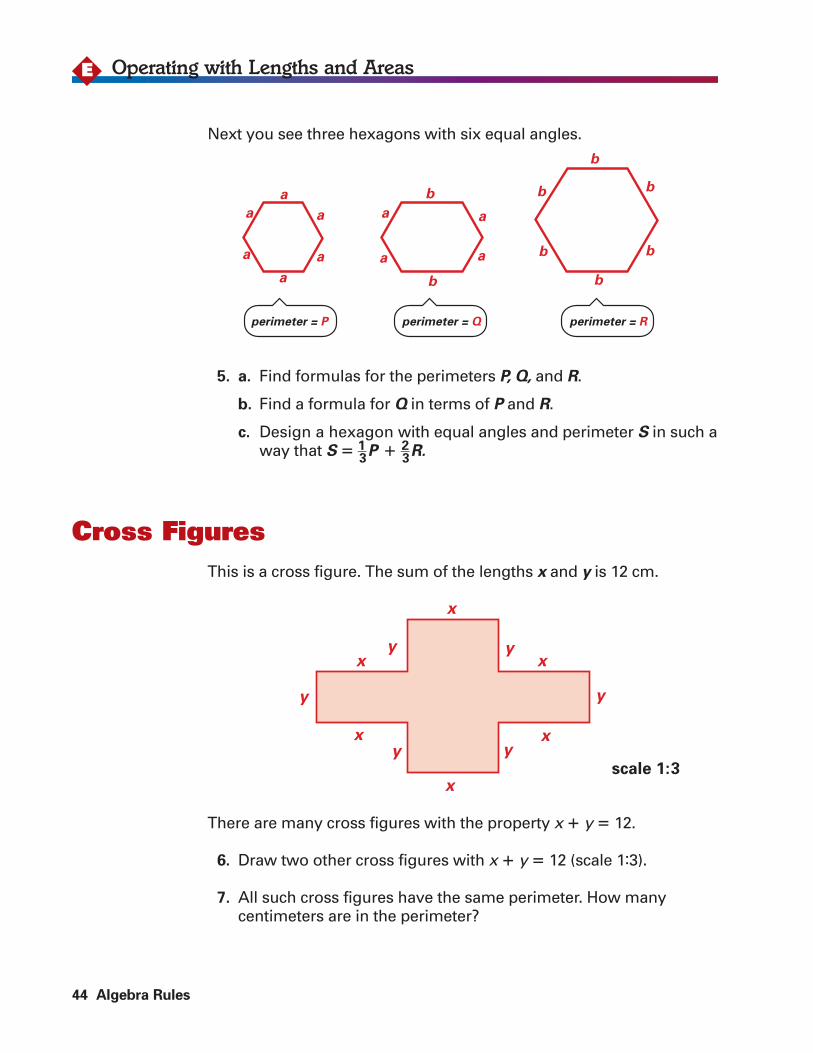
Next you see three hexagons with six equal angles.
5. a. Find formulas for the perimeters P, Q, and R.
b. Find a formula for Q in terms of P and R.
c. Design a hexagon with equal angles and perimeter S in such away that S � 1��
3P � 2��
3R.
This is a cross figure. The sum of the lengths x and y is 12 cm.
There are many cross figures with the property x � y � 12.
6. Draw two other cross figures with x � y � 12 (scale 1:3).
7. All such cross figures have the same perimeter. How many centimeters are in the perimeter?
44 Algebra Rules
Operating with Lengths and AreasE
a
a
a
a
a a
a a
a
b b
b
b
b
b
b
b
a
perimeter = P perimeter = Q perimeter = R
y
x
x
x
x
x
x
y
y y
y
y
scale 1:3
Cross Figures
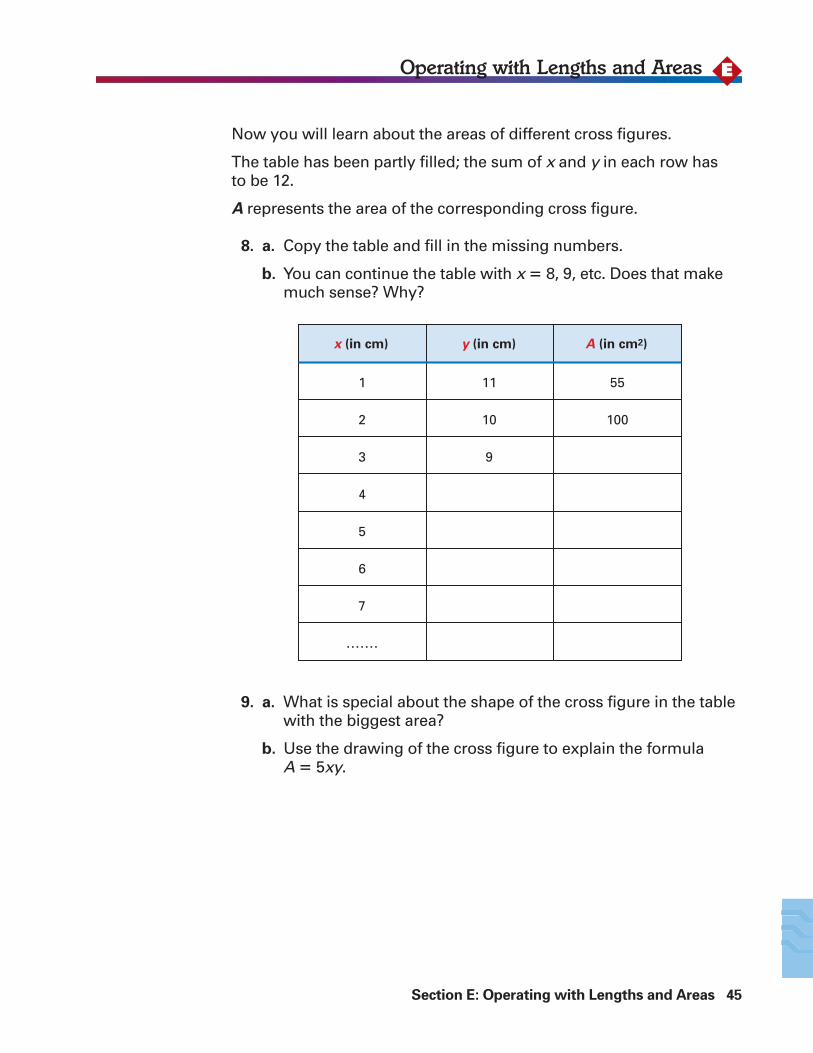
Now you will learn about the areas of different cross figures.
The table has been partly filled; the sum of x and y in each row has to be 12.
A represents the area of the corresponding cross figure.
8. a. Copy the table and fill in the missing numbers.
b. You can continue the table with x � 8, 9, etc. Does that makemuch sense? Why?
9. a. What is special about the shape of the cross figure in the tablewith the biggest area?
b. Use the drawing of the cross figure to explain the formula A � 5xy.
Section E: Operating with Lengths and Areas 45
EOperating with Lengths and Areas
x (in cm) y (in cm) A (in cm2)
1
2
3
4
5
6
7
.......
11
10
9
55
100
i
iii iv
v vi
vii
ii
a
x
x
r
y
z
z
x
r
q
q
yy
3a
3b
a
a a a
a
a
a
a
ab
b
b
a
P = …..
A = …..
P = …..
A = …..
P = …..
A = …..
P = …..
A = …..
P = …..
A = …..
P = …..
A = …..
P = …..
A = x2– y
2
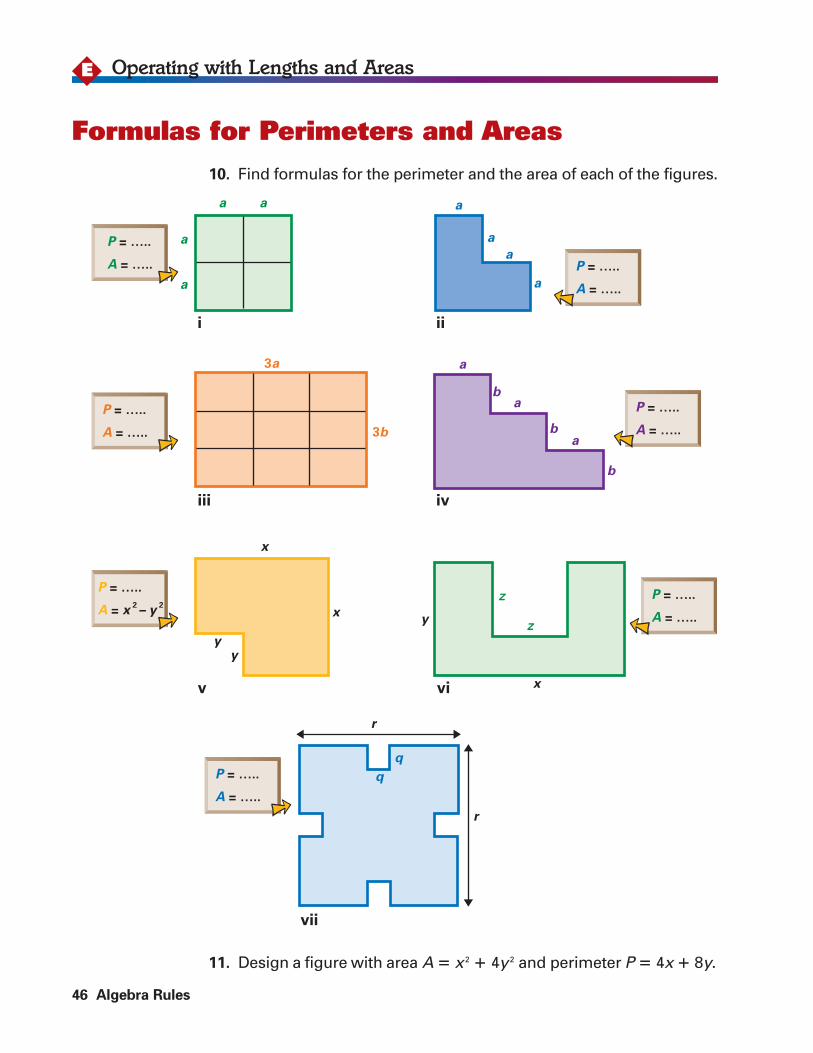
10. Find formulas for the perimeter and the area of each of the figures.
11. Design a figure with area A � x 2 � 4y 2 and perimeter P � 4x � 8y.
46 Algebra Rules
Operating with Lengths and AreasE
Formulas for Perimeters and Areas
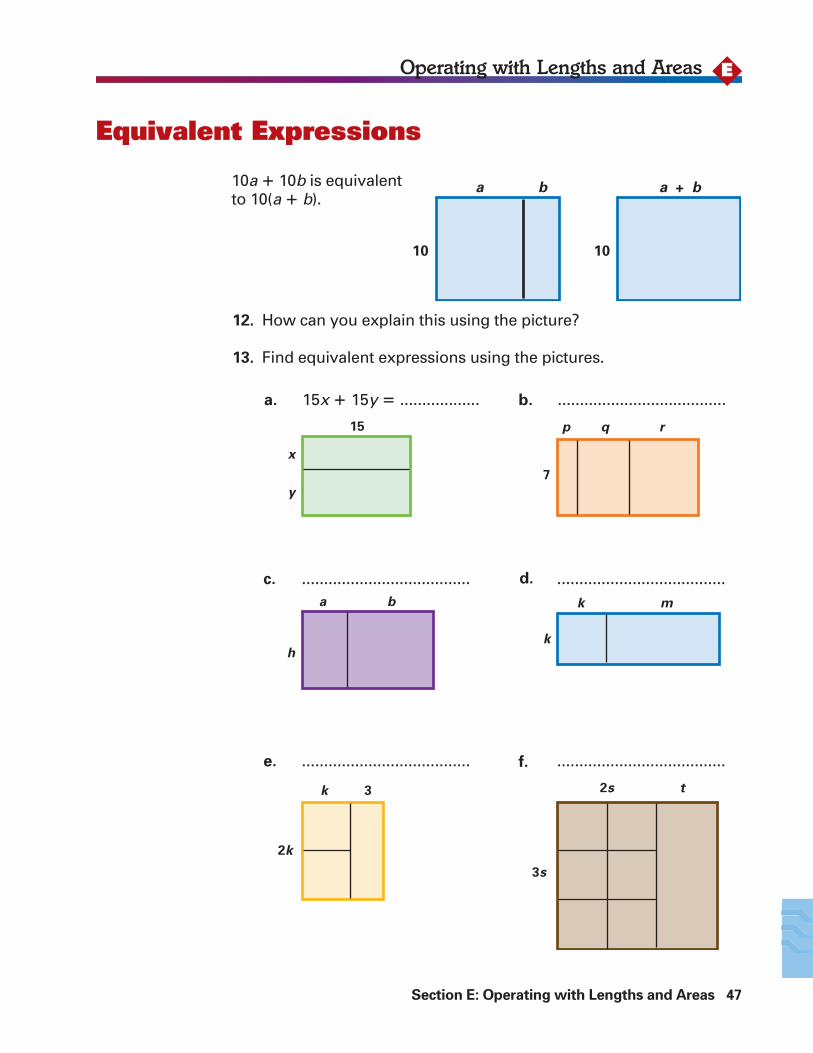
10a � 10b is equivalent to 10(a � b).
12. How can you explain this using the picture?
13. Find equivalent expressions using the pictures.
Section E: Operating with Lengths and Areas 47
EOperating with Lengths and Areas
Equivalent Expressions
10 10
a b a + b
a. b.
c.
15
7
d.
e. f.
x
a
h
k 3
k
k m
2s
3s
2k
t
b
p q r
y
15x � 15y � .................. ......................................
...................................... ......................................
...................................... ......................................
14. Draw a picture to demonstrate that the expressions are equivalent.
a. a(k � m � n) and ak � am � an
b. 3(2x � y) and 6x � 3y
15. Calculate ax � ay if a � 25 and x � y � 12.
16. Right or wrong? Explain your answer.
a. 6(a � 5b) � 6a � 5b c. p(q � 8) � pq � 8p
b. 6(x � 5y) � 6x � 30y d. uw � vw � (u � v)w
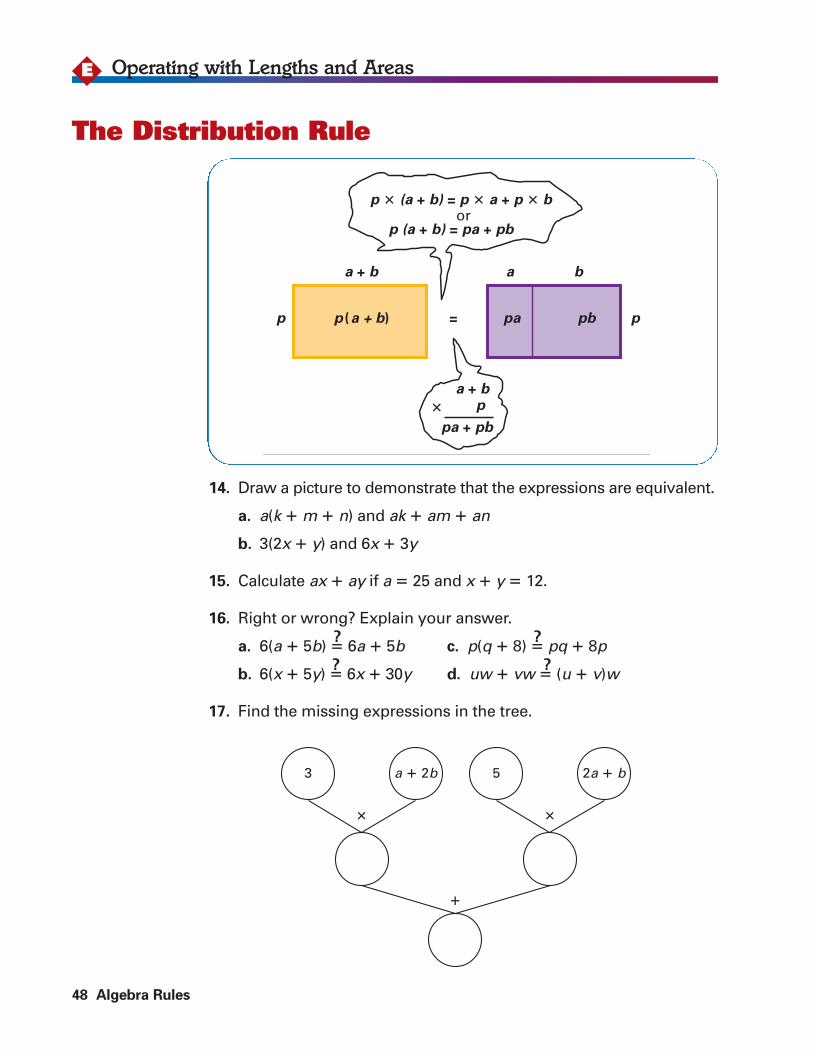
17. Find the missing expressions in the tree.
48 Algebra Rules
Operating with Lengths and AreasE
The Distribution Rule
3 a � 2b
�
5 2a � b
�
�
? ?
? ?
p � (a + b) = p � a + p � b
�
p (a + b) = pa + pb
a + b
a + bp
pa + pb
a
p p (a + b) pa pb p=
b
or
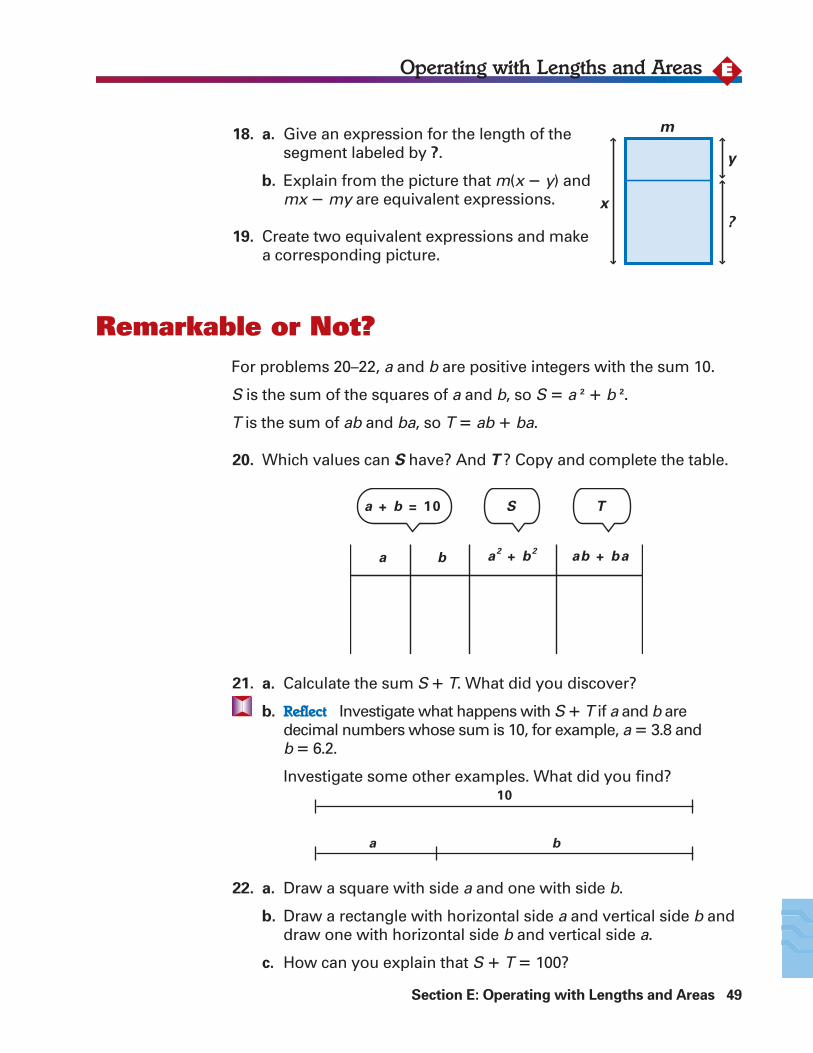
18. a. Give an expression for the length of thesegment labeled by ?.
b. Explain from the picture that m(x � y) andmx � my are equivalent expressions.
19. Create two equivalent expressions and makea corresponding picture.
Section E: Operating with Lengths and Areas 49
EOperating with Lengths and Areas
x
m
y
?
Remarkable or Not?For problems 20–22, a and b are positive integers with the sum 10.
S is the sum of the squares of a and b, so S � a 2 � b 2.
T is the sum of ab and ba, so T � ab � ba.
20. Which values can S have? And T ? Copy and complete the table.
21. a. Calculate the sum S � T. What did you discover?
b. Reflect Investigate what happens with S � T if a and b aredecimal numbers whose sum is 10, for example, a � 3.8 and b � 6.2.
Investigate some other examples. What did you find?
22. a. Draw a square with side a and one with side b.
b. Draw a rectangle with horizontal side a and vertical side b anddraw one with horizontal side b and vertical side a.
c. How can you explain that S � T � 100?
a + b = 10
a2 + b
2ab + ba
S
a b
T
a b
10
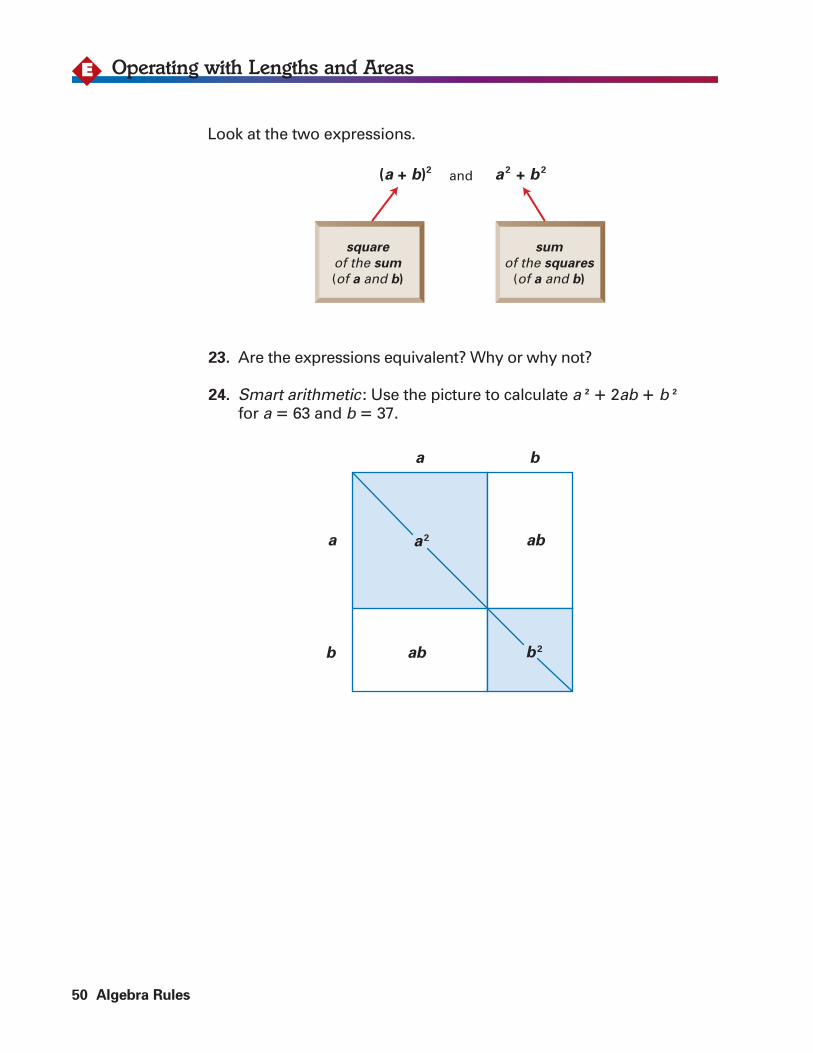
Look at the two expressions.
23. Are the expressions equivalent? Why or why not?
24. Smart arithmetic : Use the picture to calculate a 2 � 2ab � b 2
for a � 63 and b � 37.
50 Algebra Rules
Operating with Lengths and AreasE
(a + b)2 a 2 + b 2and
square
of the sum
(of a and b)
sum
of the squares
(of a and b)
a
a a 2
b ab
ab
b
b 2
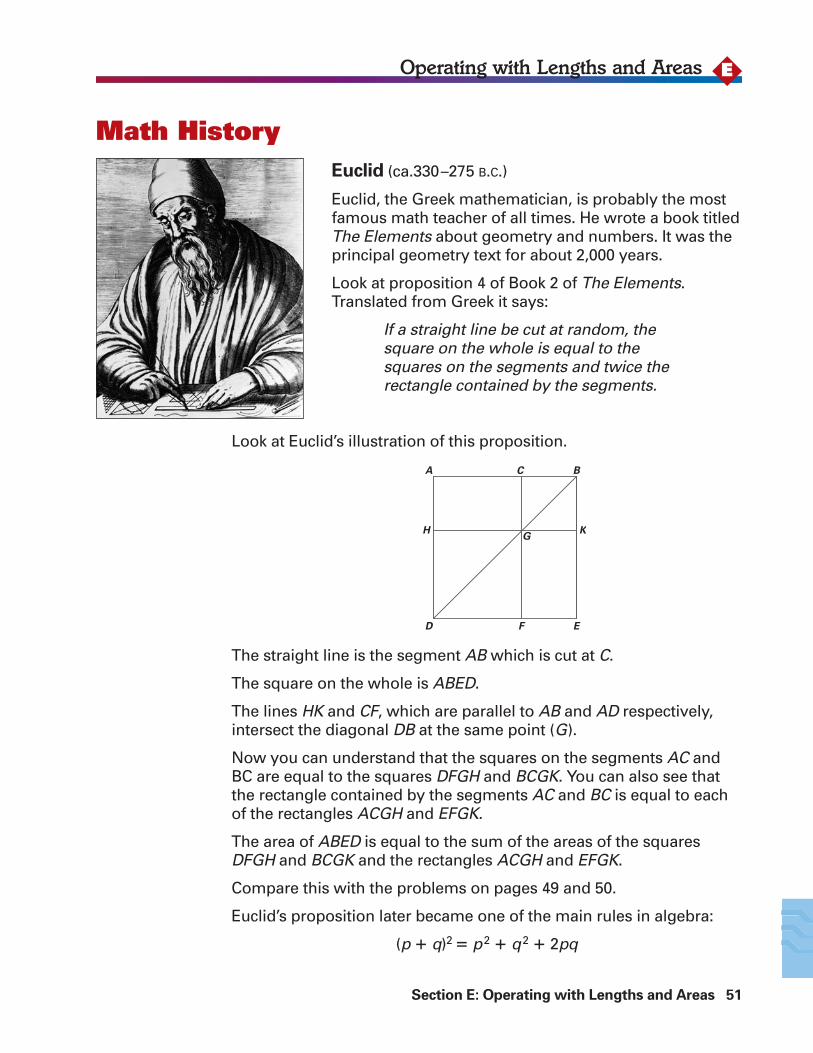
Euclid (ca.330–275 B.C.)
Euclid, the Greek mathematician, is probably the mostfamous math teacher of all times. He wrote a book titledThe Elements about geometry and numbers. It was theprincipal geometry text for about 2,000 years.
Look at proposition 4 of Book 2 of The Elements.Translated from Greek it says:
If a straight line be cut at random, thesquare on the whole is equal to thesquares on the segments and twice therectangle contained by the segments.
Section E: Operating with Lengths and Areas 51
EOperating with Lengths and Areas
Math History
Look at Euclid’s illustration of this proposition.
The straight line is the segment AB which is cut at C.
The square on the whole is ABED.
The lines HK and CF, which are parallel to AB and AD respectively,intersect the diagonal DB at the same point (G).
Now you can understand that the squares on the segments AC andBC are equal to the squares DFGH and BCGK. You can also see thatthe rectangle contained by the segments AC and BC is equal to eachof the rectangles ACGH and EFGK.
The area of ABED is equal to the sum of the areas of the squaresDFGH and BCGK and the rectangles ACGH and EFGK.
Compare this with the problems on pages 49 and 50.
Euclid’s proposition later became one of the main rules in algebra:
(p � q)2 � p2 � q2 � 2pq
A
H KG
D F E
C B
52 Algebra Rules
Operating with Lengths and Areas
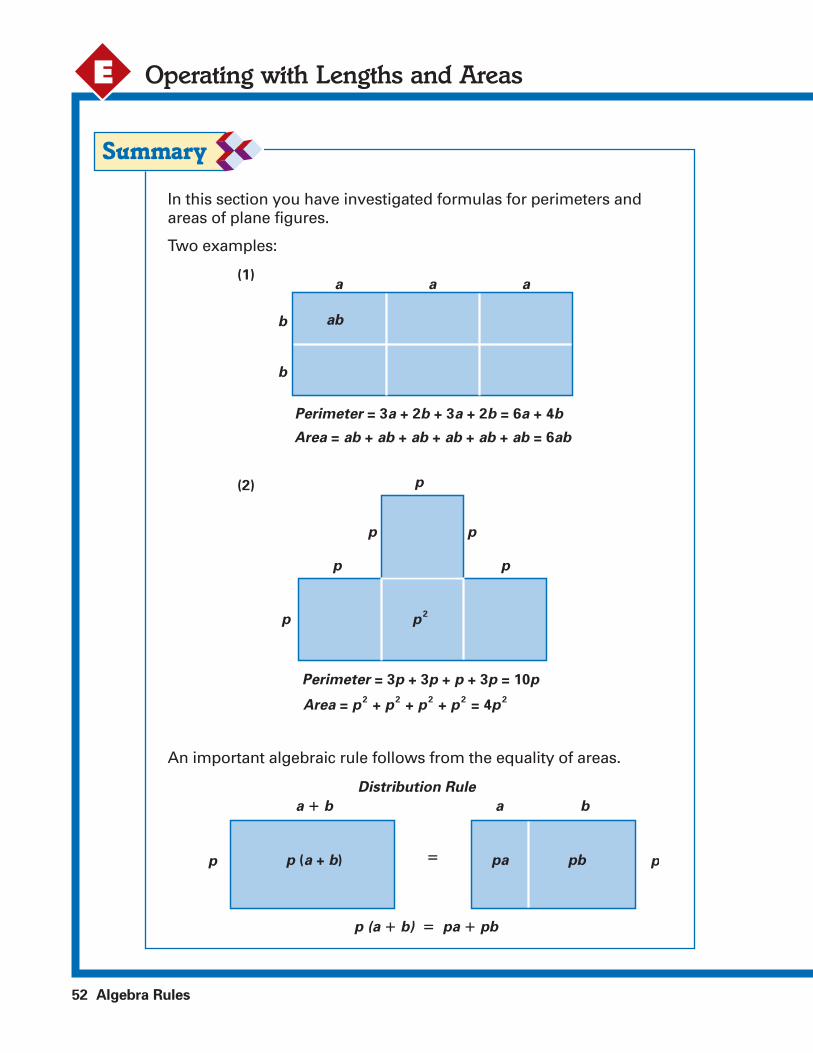
In this section you have investigated formulas for perimeters andareas of plane figures.
Two examples:
An important algebraic rule follows from the equality of areas.
E
ab
p2
Perimeter = 3a + 2b + 3a + 2b = 6a + 4b
Perimeter = 3p + 3p + p + 3p = 10p
Area = p2 + p
2 + p
2 + p
2 = 4p
2
Area = ab + ab + ab + ab + ab + ab = 6ab
a
b
b
(1)
(2) p
p p
pp
p
a a
Distribution Rule
p (a � b) � pa � pb
p (a + b) pa pb
a � b a b
p � p
Section E: Operating with Lengths and Areas 53
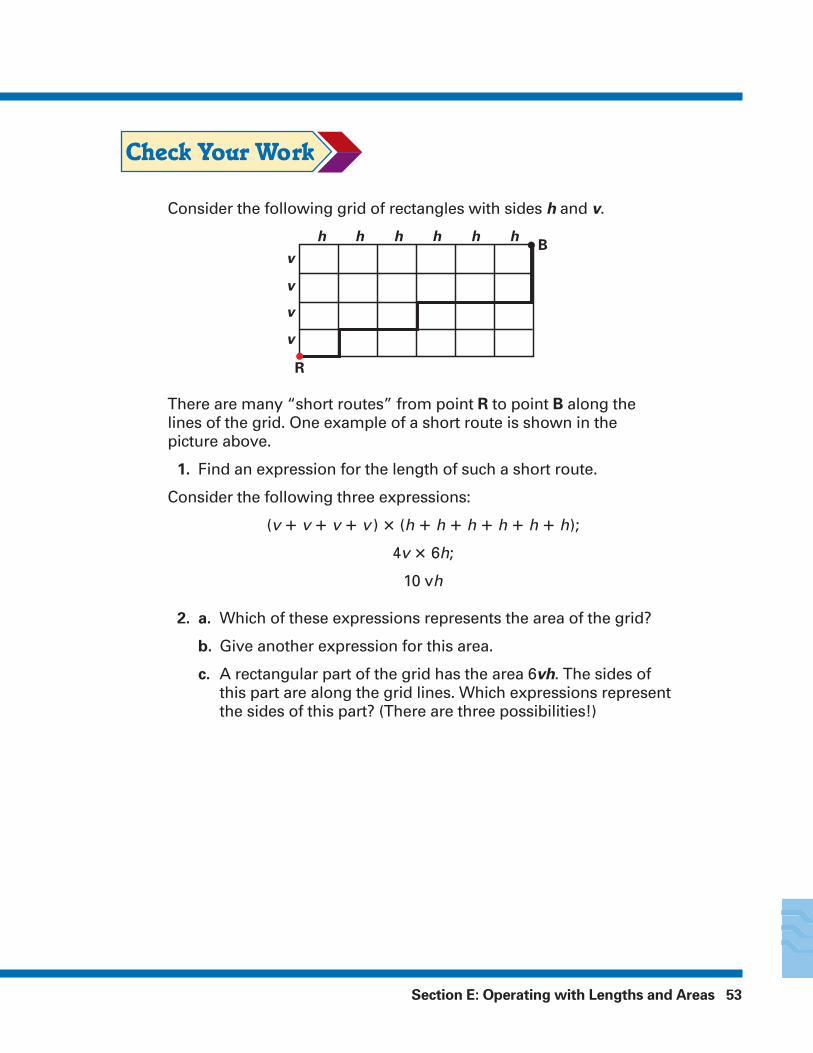
Consider the following grid of rectangles with sides h and v.
There are many “short routes” from point R to point B along the lines of the grid. One example of a short route is shown in the picture above.
1. Find an expression for the length of such a short route.
Consider the following three expressions:
(v � v � v � v ) � (h � h � h � h � h � h);
4v � 6h;
10 vh
2. a. Which of these expressions represents the area of the grid?
b. Give another expression for this area.
c. A rectangular part of the grid has the area 6vh. The sides ofthis part are along the grid lines. Which expressions representthe sides of this part? (There are three possibilities!)
h
v
v
v
v
R
Bh h h h h
54 Algebra Rules
Operating with Lengths and Areas
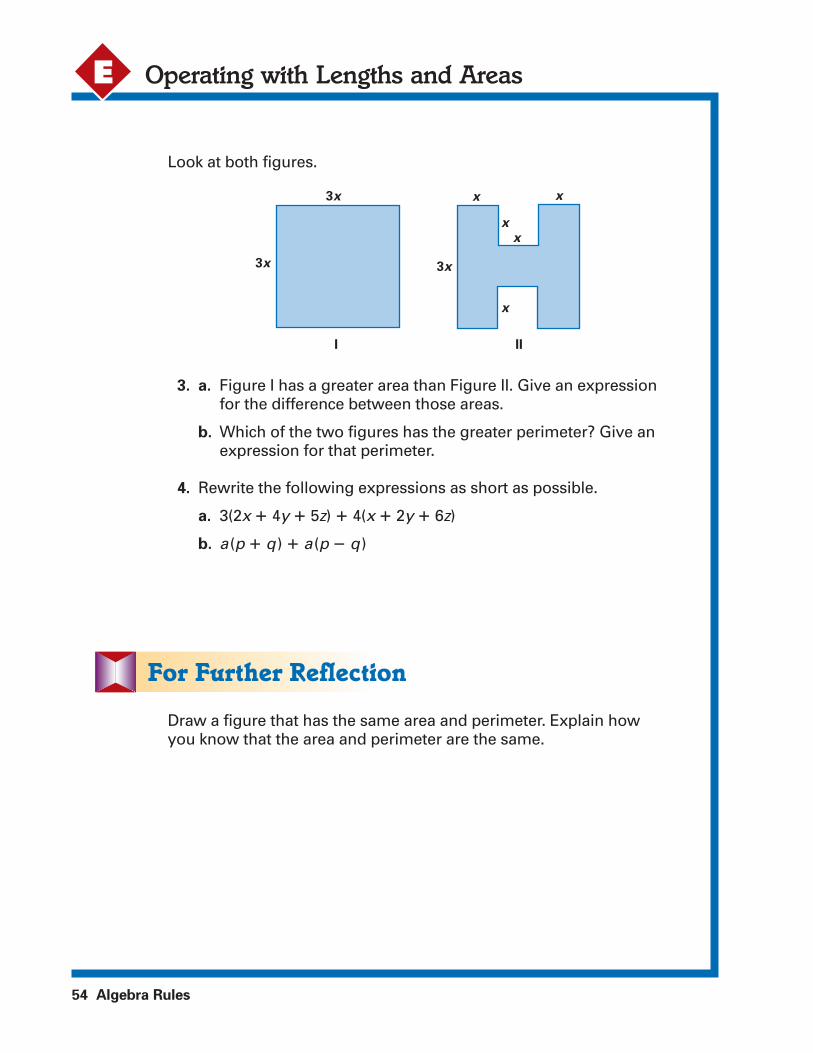
Look at both figures.
3. a. Figure I has a greater area than Figure II. Give an expressionfor the difference between those areas.
b. Which of the two figures has the greater perimeter? Give anexpression for that perimeter.
4. Rewrite the following expressions as short as possible.
a. 3(2x � 4y � 5z) � 4(x � 2y � 6z)
b. a(p � q) � a(p � q)
E
3x
I II
3x
3x
x
x
x
x
x
Draw a figure that has the same area and perimeter. Explain how you know that the area and perimeter are the same.
Additional Practice 55
Additional Practice
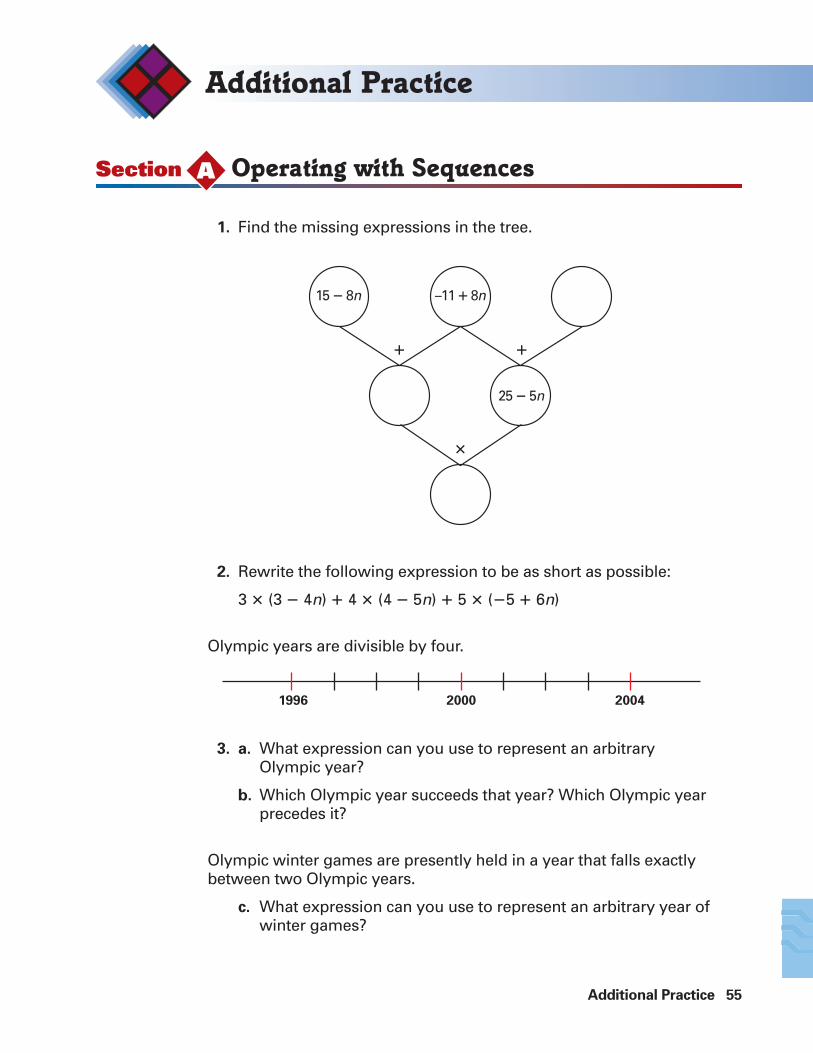
1. Find the missing expressions in the tree.
2. Rewrite the following expression to be as short as possible:
3 � (3 � 4n) � 4 � (4 � 5n) � 5 � (�5 � 6n)
Olympic years are divisible by four.
3. a. What expression can you use to represent an arbitraryOlympic year?
b. Which Olympic year succeeds that year? Which Olympic year precedes it?
Olympic winter games are presently held in a year that falls exactlybetween two Olympic years.
c. What expression can you use to represent an arbitrary year ofwinter games?
15 � 8n
25 � 5n
–11 � 8n
�
�
�
1996 2000 2004
Section Operating with SequencesA
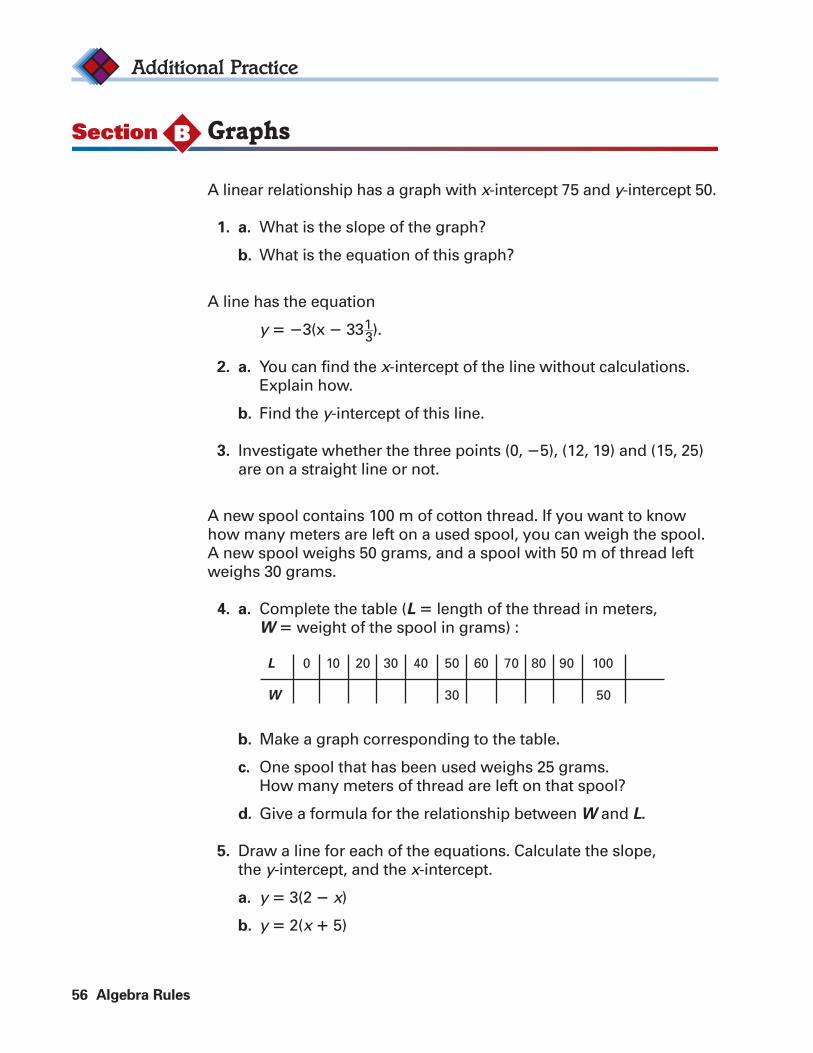
A linear relationship has a graph with x-intercept 75 and y-intercept 50.
1. a. What is the slope of the graph?
b. What is the equation of this graph?
A line has the equation
y � �3(x � 331��3).
2. a. You can find the x-intercept of the line without calculations.Explain how.
b. Find the y-intercept of this line.
3. Investigate whether the three points (0, �5), (12, 19) and (15, 25)are on a straight line or not.
A new spool contains 100 m of cotton thread. If you want to knowhow many meters are left on a used spool, you can weigh the spool.A new spool weighs 50 grams, and a spool with 50 m of thread leftweighs 30 grams.
4. a. Complete the table (L � length of the thread in meters, W � weight of the spool in grams) :
b. Make a graph corresponding to the table.
c. One spool that has been used weighs 25 grams. How many meters of thread are left on that spool?
d. Give a formula for the relationship between W and L.
5. Draw a line for each of the equations. Calculate the slope, the y-intercept, and the x-intercept.
a. y � 3(2 � x)
b. y � 2(x � 5)
56 Algebra Rules
Additional Practice
Section GraphsB
L
W
0 10 20 30 40 50
30 50
60 70 80 90 100
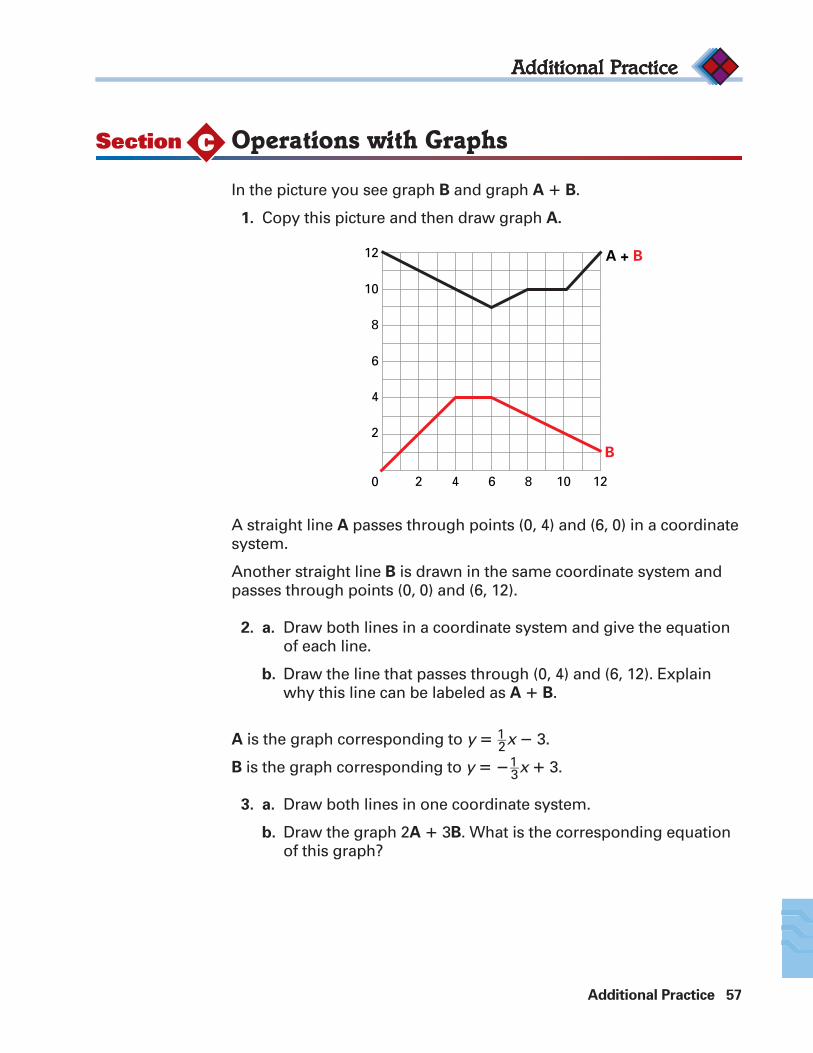
In the picture you see graph B and graph A � B.
1. Copy this picture and then draw graph A.
A straight line A passes through points (0, 4) and (6, 0) in a coordinatesystem.
Another straight line B is drawn in the same coordinate system andpasses through points (0, 0) and (6, 12).
2. a. Draw both lines in a coordinate system and give the equationof each line.
b. Draw the line that passes through (0, 4) and (6, 12). Explainwhy this line can be labeled as A � B.
A is the graph corresponding to y � 1��2x � 3.
B is the graph corresponding to y � �1��3x � 3.
3. a. Draw both lines in one coordinate system.
b. Draw the graph 2A � 3B. What is the corresponding equationof this graph?
Additional Practice 57
Additional PracticeAdditional Practice
Section Operations with GraphsC
0
2
4
6
8
10
12 A + B
B
2 4 6 8 10 12
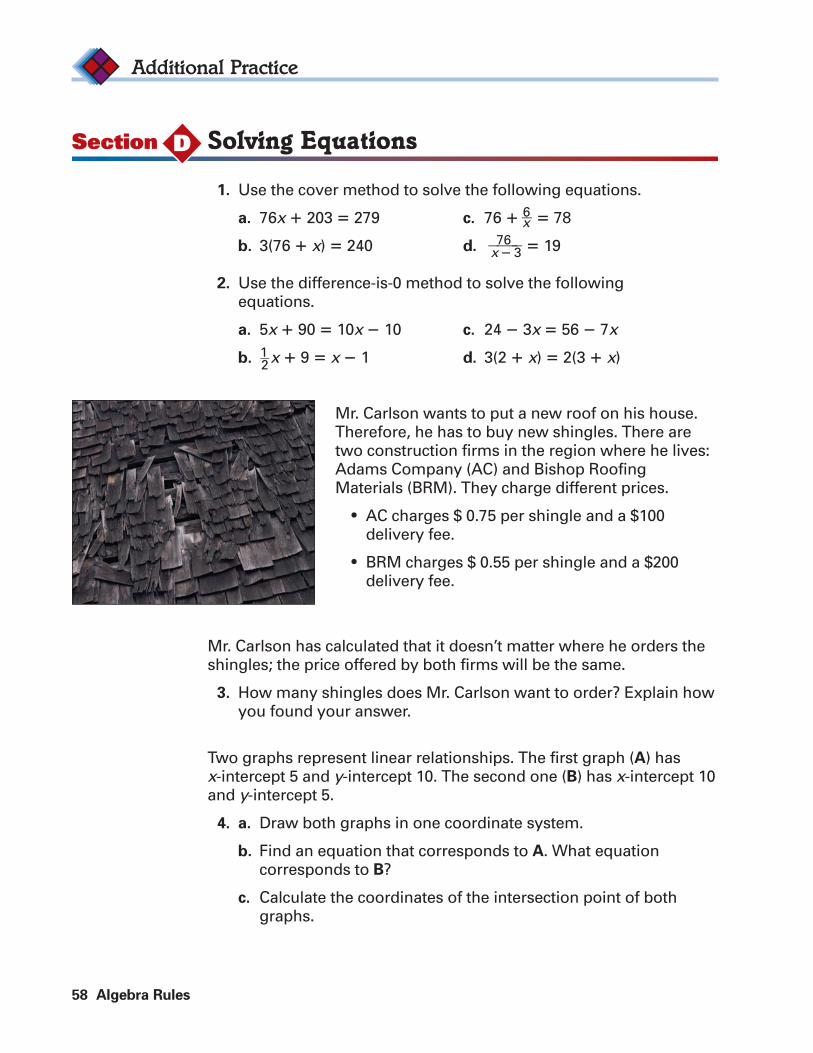
1. Use the cover method to solve the following equations.
a. 76x � 203 � 279 c. 76 � 6��x � 78
b. 3(76 � x) � 240 d. ��76����x � 3�� � 19
2. Use the difference-is-0 method to solve the following equations.
a. 5x � 90 � 10x � 10 c. 24 � 3x � 56 � 7x
b. 1��2x � 9 � x � 1 d. 3(2 � x) � 2(3 � x)
58 Algebra Rules
Additional Practice
Section Solving EquationsD
Mr. Carlson wants to put a new roof on his house.Therefore, he has to buy new shingles. There aretwo construction firms in the region where he lives:Adams Company (AC) and Bishop RoofingMaterials (BRM). They charge different prices.
• AC charges $ 0.75 per shingle and a $100 delivery fee.
• BRM charges $ 0.55 per shingle and a $200delivery fee.
Mr. Carlson has calculated that it doesn’t matter where he orders theshingles; the price offered by both firms will be the same.
3. How many shingles does Mr. Carlson want to order? Explain howyou found your answer.
Two graphs represent linear relationships. The first graph (A) has x-intercept 5 and y-intercept 10. The second one (B) has x-intercept 10and y-intercept 5.
4. a. Draw both graphs in one coordinate system.
b. Find an equation that corresponds to A. What equation corresponds to B?
c. Calculate the coordinates of the intersection point of bothgraphs.
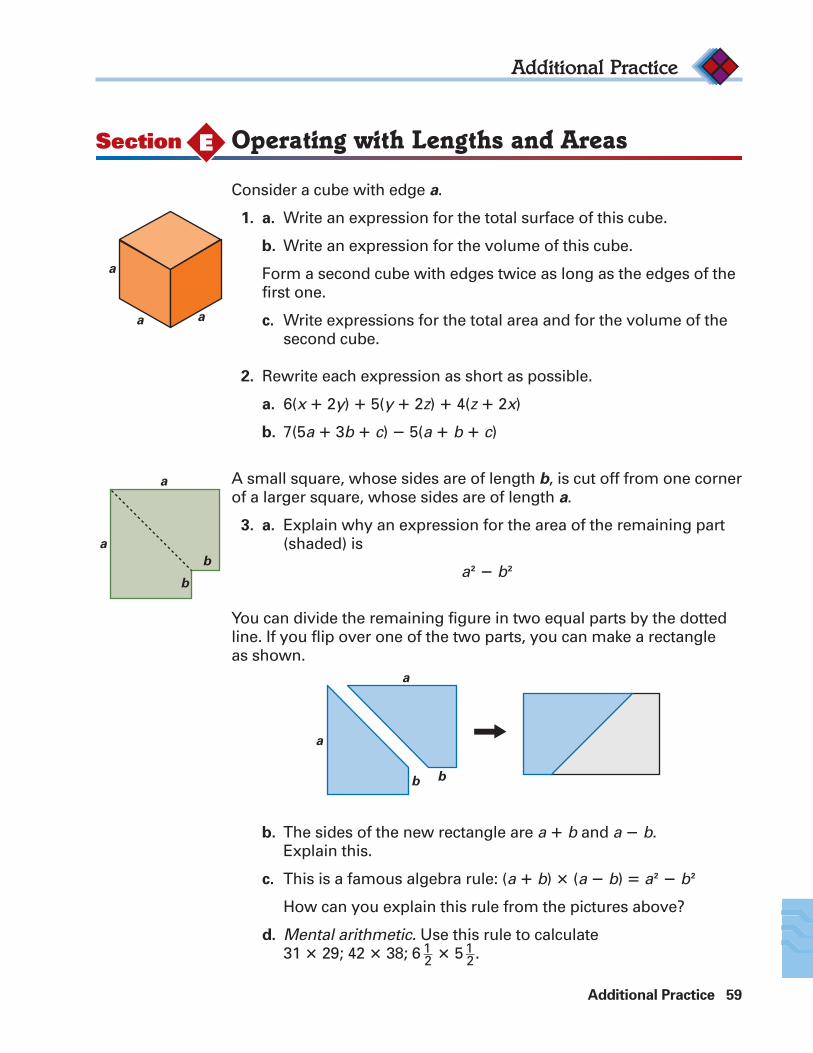
Consider a cube with edge a.
1. a. Write an expression for the total surface of this cube.
b. Write an expression for the volume of this cube.
Form a second cube with edges twice as long as the edges of thefirst one.
c. Write expressions for the total area and for the volume of thesecond cube.
2. Rewrite each expression as short as possible.
a. 6(x � 2y) � 5(y � 2z) � 4(z � 2x)
b. 7(5a � 3b � c) � 5(a � b � c)
A small square, whose sides are of length b, is cut off from one cornerof a larger square, whose sides are of length a.
3. a. Explain why an expression for the area of the remaining part(shaded) is
a2 � b2
You can divide the remaining figure in two equal parts by the dottedline. If you flip over one of the two parts, you can make a rectangle as shown.
b. The sides of the new rectangle are a � b and a � b. Explain this.
c. This is a famous algebra rule: (a � b) � (a � b) � a2 � b2
How can you explain this rule from the pictures above?
d. Mental arithmetic. Use this rule to calculate 31 � 29; 42 � 38; 6 1��2 � 5 1��2.
Additional Practice 59
Additional Practice
Section Operating with Lengths and AreasE
a
a a
a
a
b
b
a
a
b b
1.
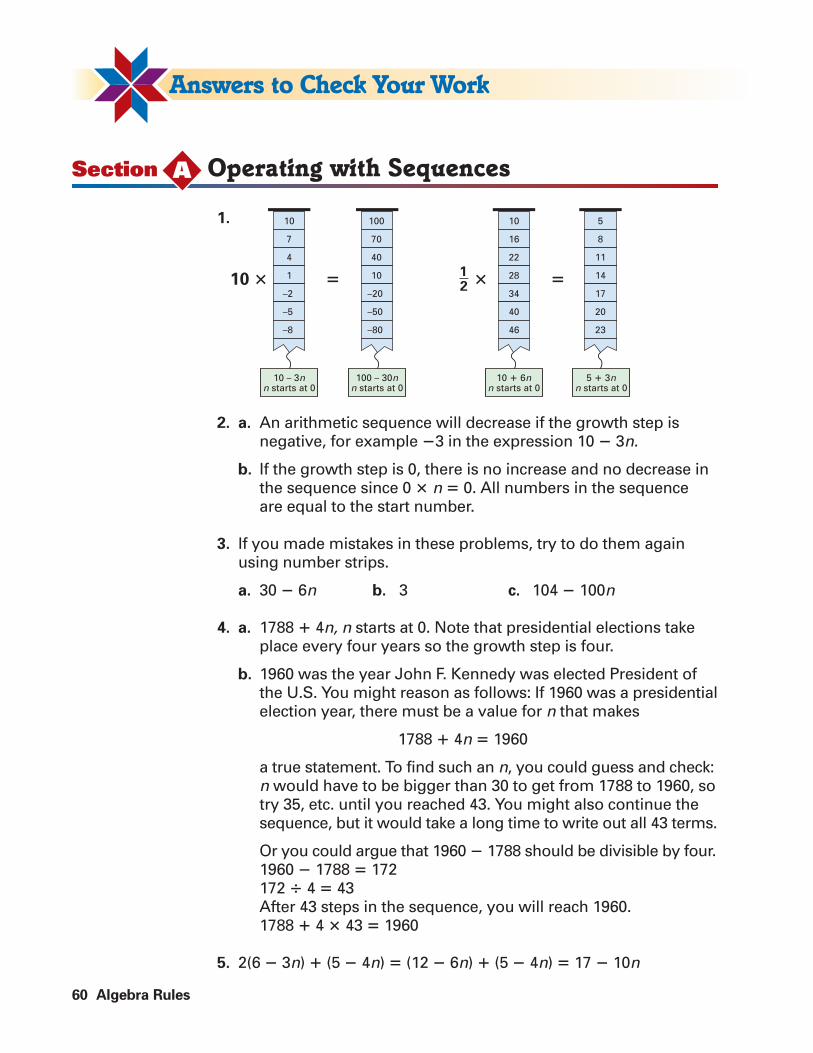
2. a. An arithmetic sequence will decrease if the growth step is negative, for example �3 in the expression 10 � 3n.
b. If the growth step is 0, there is no increase and no decrease inthe sequence since 0 � n � 0. All numbers in the sequence are equal to the start number.
3. If you made mistakes in these problems, try to do them againusing number strips.
a. 30 � 6n b. 3 c. 104 � 100n
4. a. 1788 � 4n, n starts at 0. Note that presidential elections takeplace every four years so the growth step is four.
b. 1960 was the year John F. Kennedy was elected President ofthe U.S. You might reason as follows: If 1960 was a presidentialelection year, there must be a value for n that makes
1788 � 4n � 1960
a true statement. To find such an n, you could guess and check:n would have to be bigger than 30 to get from 1788 to 1960, sotry 35, etc. until you reached 43. You might also continue thesequence, but it would take a long time to write out all 43 terms.
Or you could argue that 1960 � 1788 should be divisible by four.1960 � 1788 � 172172 � 4 � 43After 43 steps in the sequence, you will reach 1960.1788 � 4 � 43 � 1960
5. 2(6 � 3n) � (5 � 4n) � (12 � 6n) � (5 � 4n) � 17 � 10n
60 Algebra Rules
Section Operating with SequencesA
�10 � �
10
10 – 3nn starts at 0
100 – 30nn starts at 0
10 � 6nn starts at 0
5 � 3nn starts at 0
7
4
1
–2
–5
–8
�1 2
10
16
22
28
34
40
46
100
70
40
10
–20
–50
–80
5
8
11
14
17
20
23
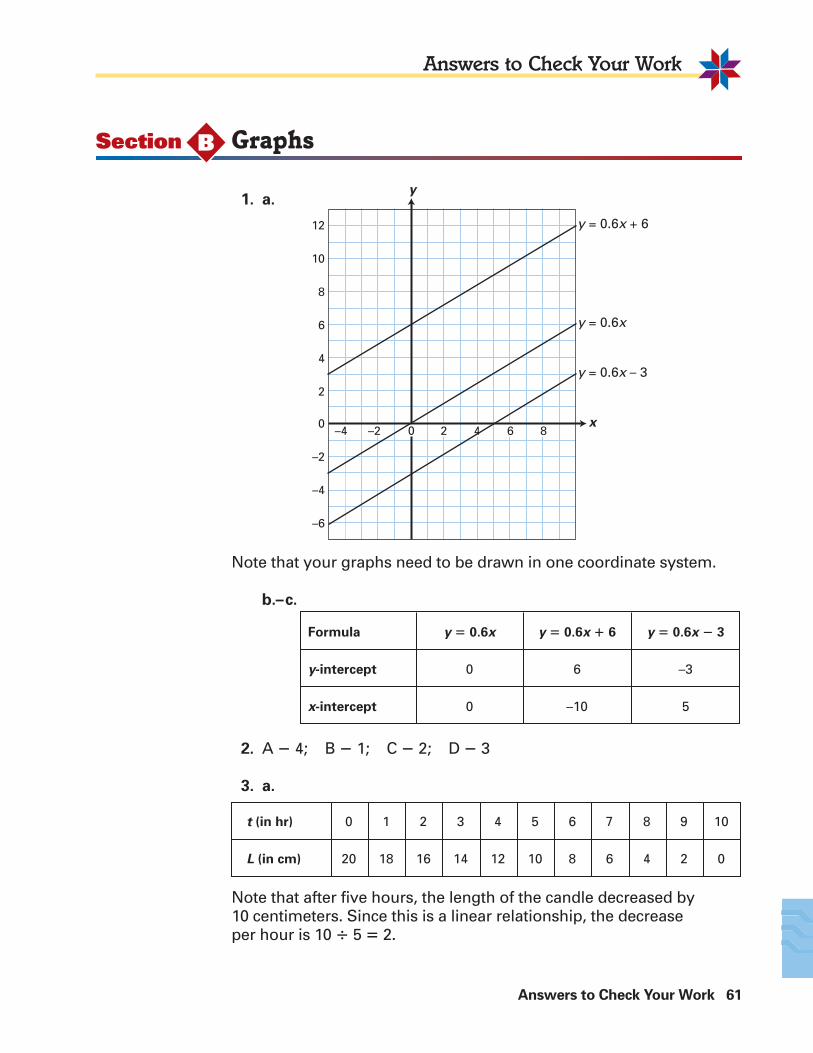
1. a.
Note that your graphs need to be drawn in one coordinate system.
b.–c.
2. A � 4; B � 1; C � 2; D � 3
3. a.
Note that after five hours, the length of the candle decreased by 10 centimeters. Since this is a linear relationship, the decrease per hour is 10 � 5 � 2.
Answers to Check Your Work 61
Answers to Check Your Work
Section GraphsB
y = 0.6x + 6
y = 0.6x
x
y
y = 0.6x – 3
–6
–4
–2
0
2
4
6
8
10
12
0–2–4 2 4 6 8
Formula
y-intercept
x-intercept
y � 0.6x
0
0
y � 0.6x � 6
6
–10
y � 0.6x � 3
–3
5
t (in hr)
L (in cm)
0
20
1
18
2
16
3
14
4
12
5
10
6
8
7
6
8
4
9
2
10
0
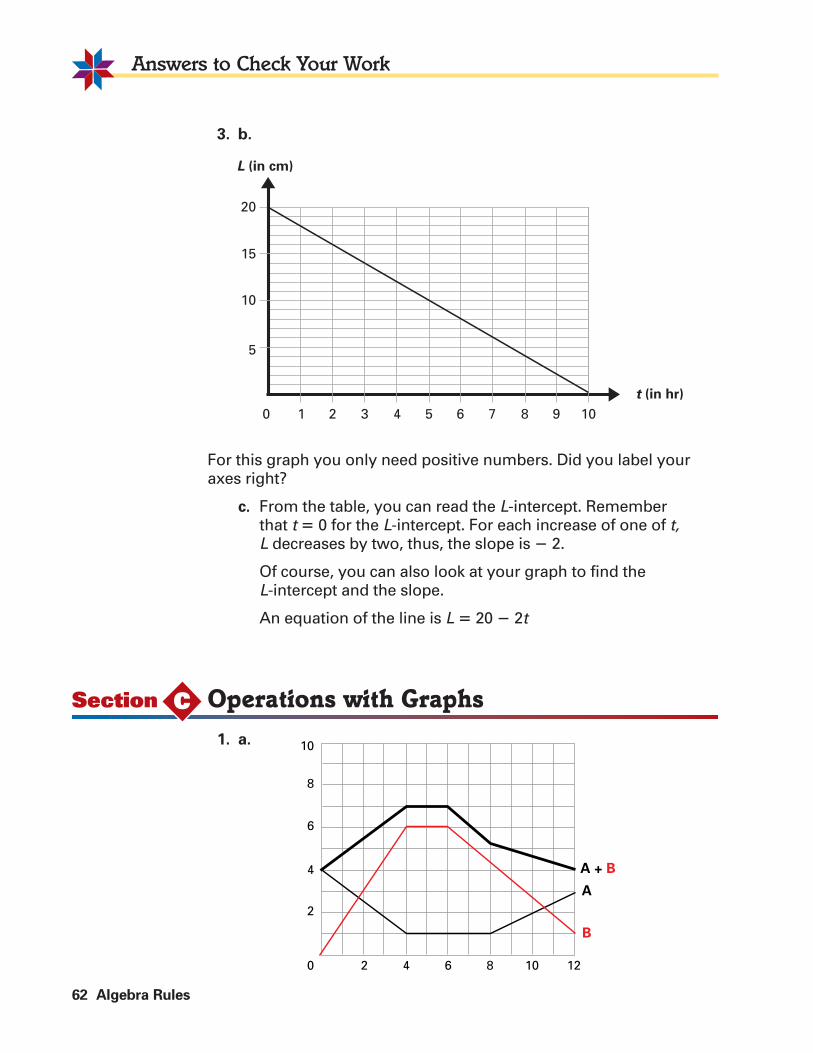
3. b.
For this graph you only need positive numbers. Did you label youraxes right?
c. From the table, you can read the L-intercept. Remember that t � 0 for the L-intercept. For each increase of one of t, L decreases by two, thus, the slope is � 2.
Of course, you can also look at your graph to find the L-intercept and the slope.
An equation of the line is L � 20 � 2t
1. a.
62 Algebra Rules
Answers to Check Your Work
5
10
15
20
0 1 2 3 4 5 6 7 8 9 10
L (in cm)
t (in hr)
Section Operations with GraphsC
0 2 4 6 8 10 12
B
A
A + B
2
4
6
8
10
b.
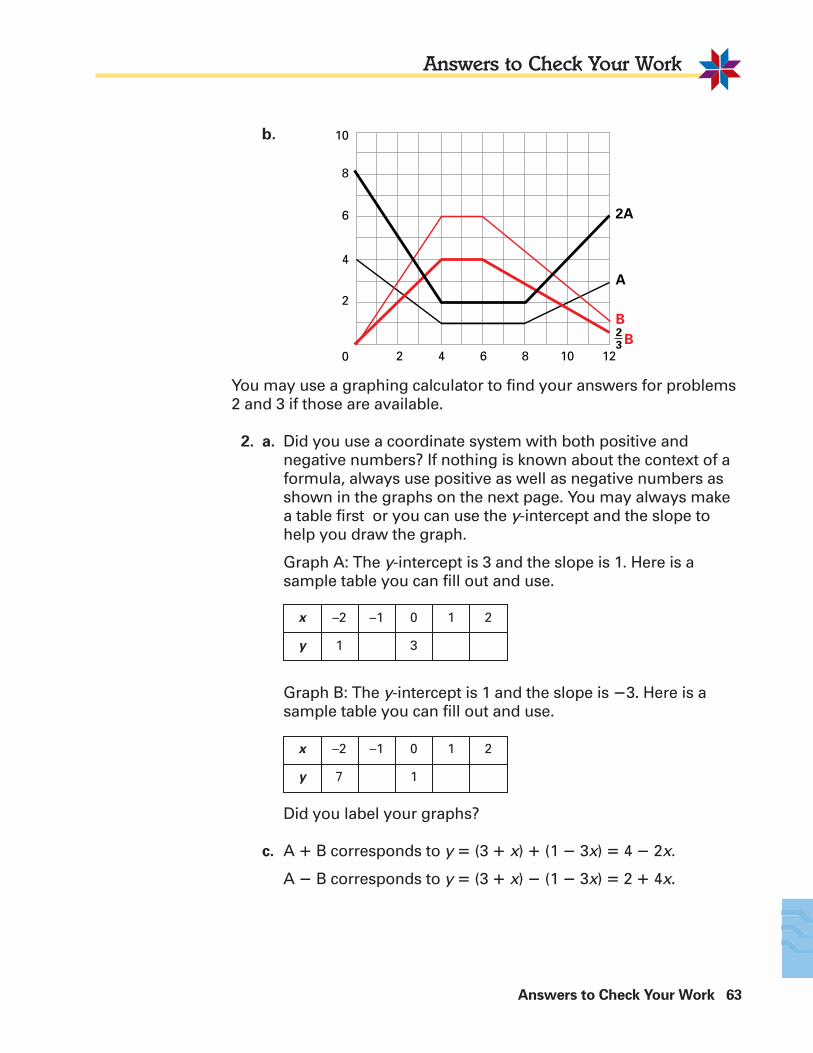
You may use a graphing calculator to find your answers for problems2 and 3 if those are available.
2. a. Did you use a coordinate system with both positive andnegative numbers? If nothing is known about the context of aformula, always use positive as well as negative numbers asshown in the graphs on the next page. You may always makea table first or you can use the y-intercept and the slope tohelp you draw the graph.
Graph A: The y-intercept is 3 and the slope is 1. Here is asample table you can fill out and use.
Graph B: The y-intercept is 1 and the slope is �3. Here is asample table you can fill out and use.
Did you label your graphs?
c. A � B corresponds to y � (3 � x) � (1 � 3x) � 4 � 2x.
A � B corresponds to y � (3 � x) � (1 � 3x) � 2 � 4x.
Answers to Check Your Work 63
Answers to Check Your Work
0
B
B
A
23
2A
2
4
6
8
10
2 4 6 8 10 12
x
y
–2
1
–1 0
3
1 2
x
y
–2
7
–1 0
1
1 2
64 Algebra Rules
Answers to Check Your Work
Section Equations to SolveD
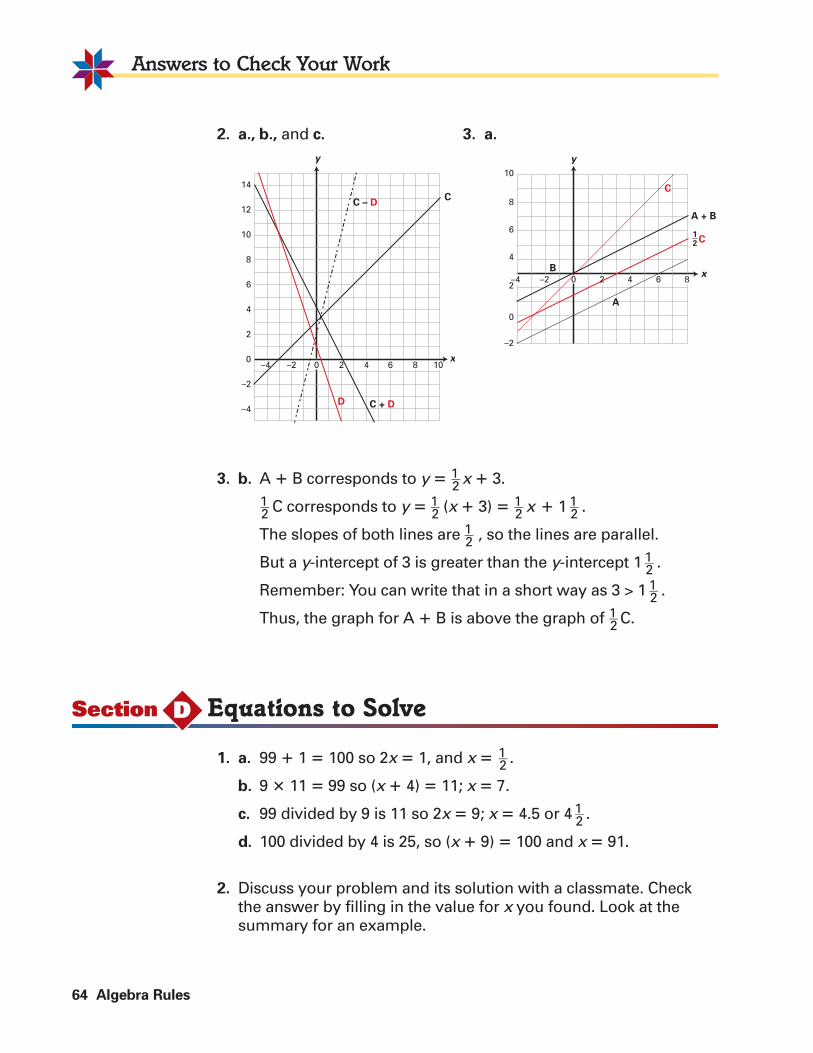
2. a., b., and c. 3. a.
3. b. A � B corresponds to y � 1��2 x � 3.1��2 C corresponds to y � 1��2 (x � 3) � 1��2 x � 1 1��2 .
The slopes of both lines are 1��2 , so the lines are parallel.
But a y-intercept of 3 is greater than the y-intercept 1 1��2 .
Remember: You can write that in a short way as 3 > 1 1��2 .
Thus, the graph for A � B is above the graph of 1��2 C.
1. a. 99 � 1 � 100 so 2x � 1, and x � 1��2 .
b. 9 � 11 � 99 so (x � 4) � 11; x � 7.
c. 99 divided by 9 is 11 so 2x � 9; x � 4.5 or 4 1��2 .
d. 100 divided by 4 is 25, so (x � 9) � 100 and x � 91.
2. Discuss your problem and its solution with a classmate. Checkthe answer by filling in the value for x you found. Look at thesummary for an example.
x
C
y
D
C – D
C + D
0–2–4 2 4 6 8 100
–2
–4
2
4
6
8
10
12
14
–2
–4 –2 0 4 6 8
0
2
4
6
8
10
C
A
x
y
B
A + B
C12
2
Answers to Check Your Work 65
Answers to Check Your Work
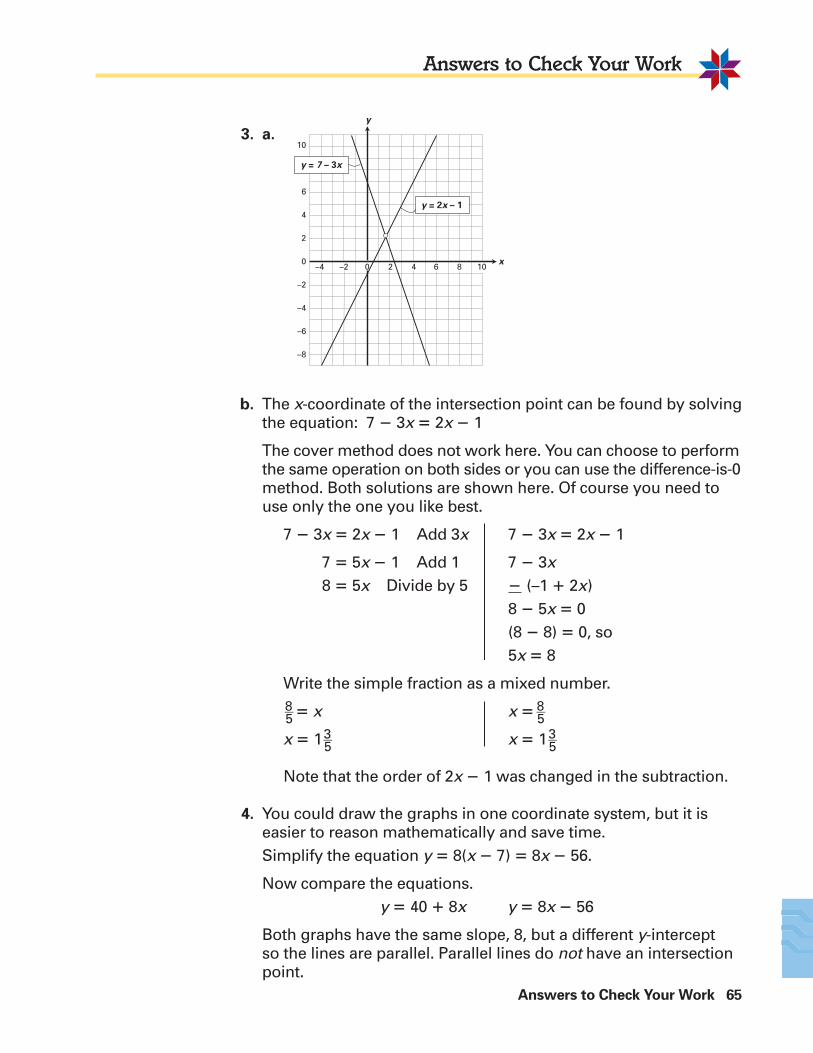
3. a.
b. The x-coordinate of the intersection point can be found by solvingthe equation: 7 � 3x � 2x � 1
The cover method does not work here. You can choose to performthe same operation on both sides or you can use the difference-is-0method. Both solutions are shown here. Of course you need touse only the one you like best.
7 � 3x � 2x � 1 Add 3x 7 � 3x � 2x � 1
7 � 5x � 1 Add 1 7 � 3x8 � 5x Divide by 5 � (–1 � 2x)
8 � 5x � 0(8 � 8) � 0, so5x � 8
Write the simple fraction as a mixed number.8��5 � x x � 8��5
x � 13��5 x � 13��5
Note that the order of 2x � 1 was changed in the subtraction.
4. You could draw the graphs in one coordinate system, but it iseasier to reason mathematically and save time.Simplify the equation y � 8(x � 7) � 8x � 56.
Now compare the equations.y � 40 � 8x y � 8x � 56
Both graphs have the same slope, 8, but a different y-intercept so the lines are parallel. Parallel lines do not have an intersectionpoint.
x
y
y = 7 – 3x
y = 2x – 1
0–2–4 2 4 6 8 100
–2
–4
–6
–8
2
4
6
10
1. All “short routes” have the same length: 4v � 6h.
2. a. (v � v � v � v) x (h � h � h � h � h � h) and 4v � 6hrepresent the area of the grid. 10vh does not represent the area, since 4 and 6 are added instead of multiplied.
b. An expression for the area is 24vh. Note that each small rectangle in the grid has an area of vh.
c. You need six small rectangles. Possibilities are: length 6h and width v ; 6h � v � 6hv or 6vh (note that vh � hv)orlength 3h and width 2v ; 2v � 3h � 6vhorlength 3v and width 2h; 3v � 2h � 6vh
3. a. Figure I has area (3x)(3x) � 9x 2.Figure II has area (3x)(x) � (x)(x) � (3x)(x) �3x 2 � x 2� 3x2 � 7x 2.Difference between area I and area II: 9x 2 � 7x 2 � 2x2.
Another way you may have reasoned is:Observe that the cut-out sections in figure II will be the difference in the areas. The area of each of these sections is x 2, so the difference is 2x2.
b. Figure II has the largest perimeter:
3x � x � x � x � x � x � 3x � x � x � x � x � x � 16x
Figure I has a perimeter of 4 � 3x � 12x.
4. a. 3(2x � 4y � 5z) � 4(x � 2y � 6z) � (use the distributive property)
6x � 12y � 15z � 4x � 8y � 24z � (add corresponding variables)
10x � 20y � 39z
b. a(p � q) � a(p � q) �
ap � aq � ap � aq �
2ap
66 Algebra Rules
Answers to Check Your Work
Section Operating with Lengths and AreasE