Embed Size (px)
Citation preview
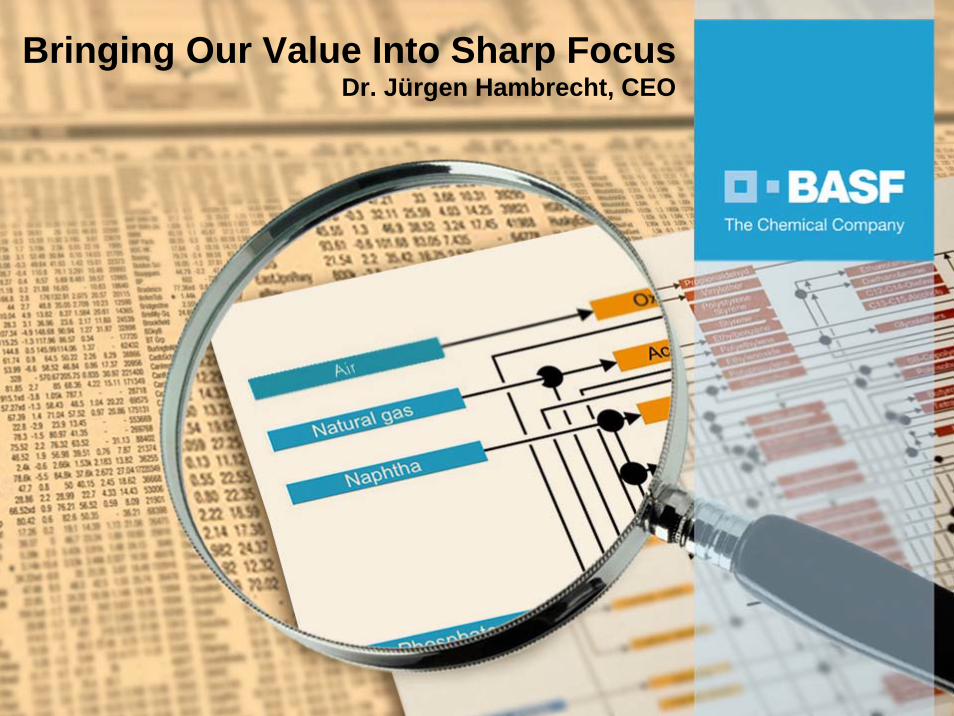
Bringing Our Value Into Sharp FocusDr. Jürgen Hambrecht, CEO

2
Volume growth in %
Growing above chemical market*
BASF European Chemicals**(excl. BASF)
US Chemicals***
* Excluding pharma** European peers: Akzo Nobel, Bayer, Ciba, Clariant, Degussa, DSM, Rhodia, Syngenta*** US peers: Dow, PPG, DuPont, Rohm and HaasSource: Company reports
-3
-1
1
3
5
7
9
2001 2002 2003 2004 2005 1st half 2006
3
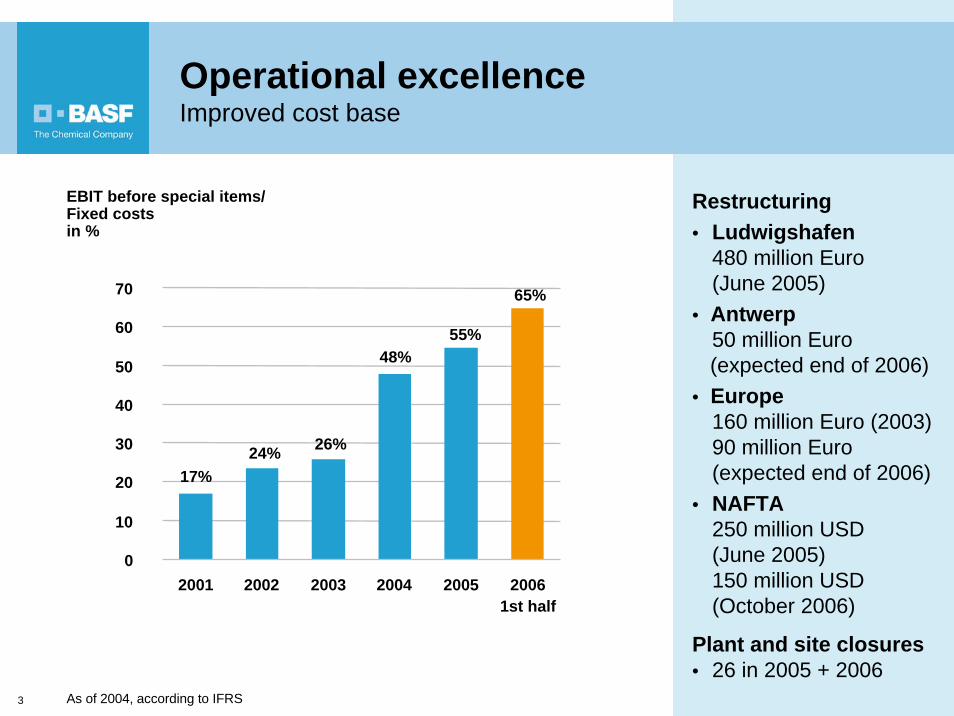
Operational excellenceImproved cost base
Restructuring• Ludwigshafen
480 million Euro (June 2005)
• Antwerp50 million Euro (expected end of 2006)
• Europe160 million Euro (2003)90 million Euro (expected end of 2006)
• NAFTA250 million USD (June 2005)150 million USD(October 2006)
Plant and site closures• 26 in 2005 + 2006
65%
55%48%
26%24%17%
0
10
20
30
40
50
60
70
2001 2002 2003 2004 2005 20061st half
EBIT before special items/Fixed costs in %
As of 2004, according to IFRS

4
Active portfolio management Selected transactions, 2001 to 2006
Acquisitions
• Custom Synthesis (Orgamol)
• Oil&Gas (Dutch gas activities)
• Electronic Chemicals(Merck Electronic Chemicals)
• Engineering Plastics• Catalysts/Pigments
(Engelhard)
• Construction Chemicals (Degussa)
• Water-based Resins(Johnson Polymer)
• Plant Biotechnoloy(CropDesign)
Divestitures
• Pharmaceuticals • Fibers• Printing Systems• BASELL• Polystyrene US• Generic
Agrochemicals(e.g. MicroFlo)
8 billion Euro(Sales)
5 billion Euro(Sales)
Portfolio managed towards higher returns and reduced cyclicality
Partnerships• Total: NAFTA Region
Olefin Complex• Shell: Ellba• Gazprom: Wingas,
Achimgaz, YushnoRusskoye, Nord Stream
• Sinopec (China)• Solvin
BASFCore
Businesses

5
Growth potential
Earningsstability
High
HighLow
Reasons for divestitures
Low profitability:• Generic Agchem• Polystyrene NAFTA• Fibers• Polyolefins (Basell)
Insufficient market position:• Printing Systems• Pharmaceuticals
Active portfolio management Selected transactions, 2001 to 2006
Low
AcquisitionsDivestitures
Printing Systems
Polyolefins (Basell)
Marketing
PharmaceuticalsOil & Gas (NL) CropDesignCatalysts/PigmentsConstruction ChemicalsEngineering PlasticsWater-based ResinsCustom SynthesisElectronic Chemicals
Generic Agchem(MicroFlo, etc.)
Polystyrene NAFTAFibers
6
The Chemical Company=
Intelligent Diversification
6

7
On track to value
ROCE in %
4.0%
8.8%
9.9%
17.2%
18.4%
0
5
10
15
20
2001 2002 2003 2004 2005
As of 2004, according to IFRS
Premium on cost of capital in million Euro
-2,554
1,9822,354
-579 -593
2001 2002 2003 2004 2005-3,000
-2,000
-1,000
1,000
2,000
3,000
0

8
Reduced volatilityEBIT* margin 2001–2005
0%
5%
10%
0% 5% 10% 15% 20%EBIT* margin (in %)
EBIT
* mar
gin
vola
tility
(in
%)
BASF
Degussa CC
Oil & GasEngelhard
ChemicalsAgriculture** & NutritionPerformance
Products
Plastics
* Based on EBIT before special items excluding non-compensable oil-taxes** Higher volatility due to integration of acquisitions and restructuring

9
02001 2002 2003 2004 2005 1st half 2006
5
10
15
EBIT margin* excluding non-compensable oil-taxesin %
BASF
Best Peers
Worst Peers
BASF achieves best in class
* Based on EBIT after special items
10
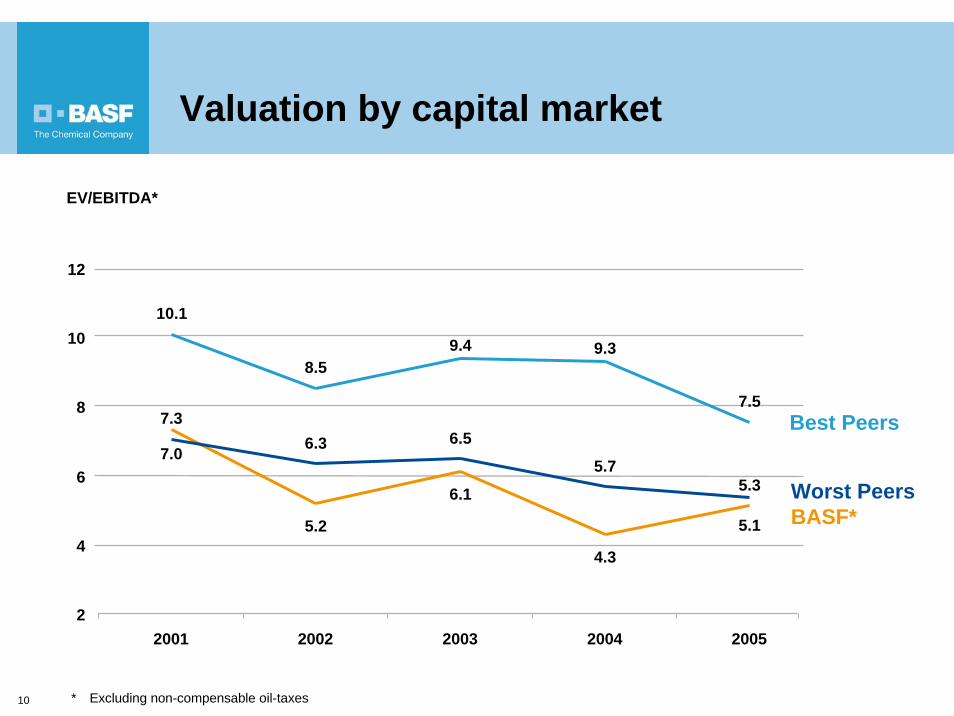
7.0
5.2
6.1
4.3
5.1
10.1
8.59.4 9.3
7.57.3
6.3 6.5
5.75.3
4
6
8
10
Best Peers
Worst Peers
22001 2002 2003 2004 2005
12
Valuation by capital market
EV/EBITDA*
* Excluding non-compensable oil-taxes
BASF*

11
On track to profitable growth
11

12
Our target:We will grow sales
on average 2% per year above chemical market
12
Estimated chemical market growth excl. pharma 2007–2009 = 3.3%

13
More than half of strategic business units are targeted for expansion.
Cash flow will predominantly be invested in SBUs targeted for growth.
Strategic positioning of business units
2003
1Divest
Maintain market positionReposition
36
2006
ExpandExpand moderately
35
5
32
34
50-100% cash to beused for growth
<50% cash to be used for remaining businesses
no cash to be used

14
35%
21%11%
13%
20%
• 6,800 employees in R&D (2005)
• Over 1,300 R&D co-operations worldwide
• Split of R&D expenditures (2005):- 650 million Euro
product innovation- 410 million Euro
process innovation, corporate-financed research
• Corporate-financed research:- Exploratory research - Research for growth
clustersTotal R&D expenditures 2005: 1.06 billion Euro+ 20% in 2006: 1.28 billion Euro
ChemicalsCorporate-financed research
PerformanceProducts
Agricultural Products & Nutrition
Plastics
We innovate for growth

15
Product innovation –Targeted sales from pipeline
Targeted annual sales from product innovations*: 2010: 4 billion Euro p.a.2015: 5 billion Euro p.a. thereof 10–20% annual top-line growth
160 430 120No. of projects
* New or improved products or new applications, max. 5 years on market
Lab phase &Proof of concept
Business cases Pilot phase & Launch

16
Business model
Process innovation
Product innovation
Biology
Chemistry
Physics
EnergyManagement Nano-
technology
RawMaterial Change
WhiteBiotechnology
PlantBiotechnology
Targeted annual sales from growth clusters2010: 500–1,000 million Euro2015: 2,000–4,000 million Euro
Focus on five growth clusters
• R&D expenditures for growth clusters approx. 850 million Euro from 2006–2008
• In 2006, approx. 30% funded by divisions, 70% corporate funded
• First projects out of growth clusters to come to market by 2007

17
Growing through investmentsPlanned investments 2006–2010
Plastics
Oil & Gas*
Others(e.g. infrastructure, R&D)
8.2 billion Euro*
13 %
8 %
25 %
17 %
16 %
Agriculture &Nutrition
Performance Products
21 %Chemicals
By segments
Germany
Asia
Site alternatives to be checked16 %
16 %
14 %
19 % NAFTA
Europe (excl. Germany)*
35 %
By regions
8.2 billion Euro*
* Excluding investments in Nord Stream and Yuzhno Russkoye

18
Capex discipline
Capex strategy –past and future• Capex below
depreciation • Capacity creep• Optimized asset
strategy- innovations- partnerships
In billion Euro Depreciaton
Capex*
* Capital expenditures in intangible assets, property, plant and equipment
** IFRS figures
02001 2002 2003 2004** 2005**
3
2.5
2
1.5
1
0.5
19
Growing through acquisitions
Our goal is to acquire profitable businesses that
• Generate above average industry growth
• Are innovation driven
• Offer a special value proposition to customers
• Reduce earnings cyclicality
• Meet our financial criteria
- Minimum discount rate: 9% applied on earnings after taxDepending on country risk additional return requirements
- Accretive to EPS by year 3 at the latest

20
Growing through acquisitions
Stand-aloneΔ% y-o-y
Sales Δ% Q3’06
EBIT* Δ% Q3’06
Remarks
Engelhard 23
10
12
14 • Catalyst business up due to demand growth in all segments
• APT business up due to strong paper coatings business
• Material Services up due to higher volumes and metal prices
Johnson Polymer 12
• Above market performance • Admixture Systems up due to strong volume growth
in Europe and Middle East• Construction Systems up mainly due to strong
volume growth in Europe and the Americas
• Sales and EBIT up due to strong volume growth in Printing & Packaging in Europe and price increases in North America
ConstructionChemicals
12
* Before special items
21
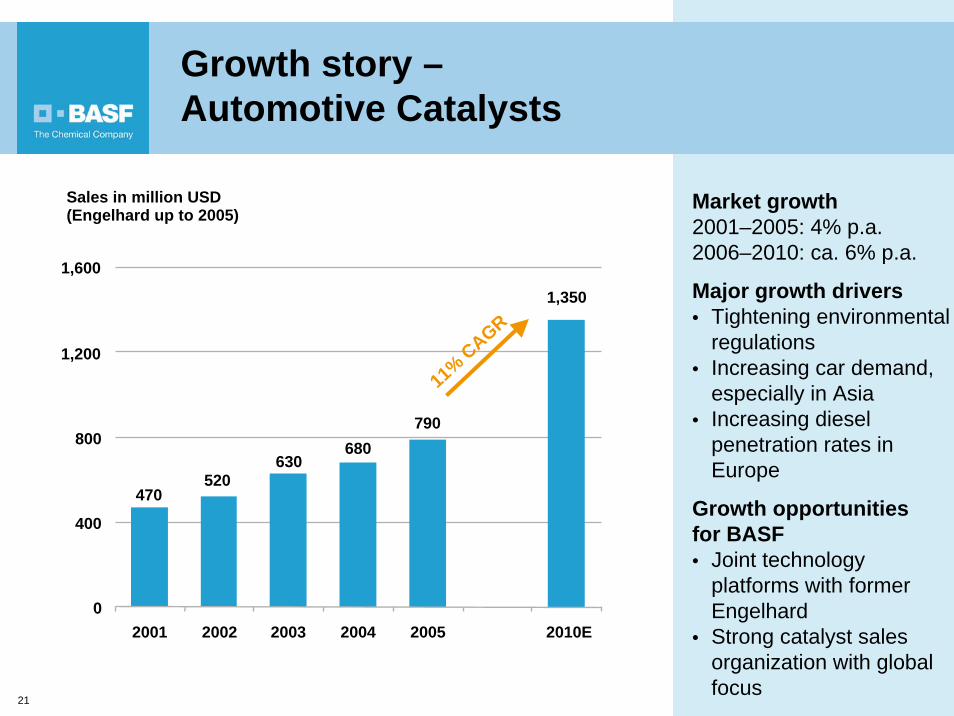
Growth story –Automotive Catalysts
Market growth2001–2005: 4% p.a.2006–2010: ca. 6% p.a.
Major growth drivers• Tightening environmental
regulations• Increasing car demand,
especially in Asia• Increasing diesel
penetration rates in Europe
Growth opportunities for BASF• Joint technology
platforms with former Engelhard
• Strong catalyst sales organization with global focus
Sales in million USD(Engelhard up to 2005)
470520
630680
790
1,350
0
400
800
2001 2002 2003 2004 2005 2010E
11% CAGR
1,200
1,600

22
Growth story –Adhesives & Construction Polymers
Market growth2001–2005: ca. 5% p.a.2006–2010: ca. 4% p.a.
Major growth drivers• Chemical solutions for
intelligent construction material
• Adhesives substitute mechanical fixing
Growth opportunitiesfor BASF• Provide solutions for
stricter environmental policies (e.g. low VOC)
• Strong presence of BASF in all regions to support globalization of our customers
BASF sales in million Euro
1,500
950900850800
0
400
800
2001 2002 2003 2004 2005 2010E
6% CAGR1,600
1,200 1,100

23
Growth story Oil & Gas
Growth in oil demand worldwide2001–2005: ca. 1.6% p.a.2006–2010: ca. 1.5% p.a.
Growth in gas demand in the European Union2001–2005: ca. 2.4% p.a.2006–2010: ca. 2.7% p.a.
Growth opportunities for BASF• Step up exploration• Acquisitions• Partnerships• “Gas for Europe”-
Strategy
~140
112109104
9393
2001 2002 2003 2004 2005 2010E0
50
100
150
Productionin million boe
5% CAGR

24
Business excellence
24

25
The Verbund
• Integrated production• Secured raw material supply• Common infrastructure• Combined logistics• Integral research platforms• Integral customer interaction
Benefits• Highly efficient production = cost leadership • Resource efficiency and waste reduction = leadership in sustainability• Integral knowledge management = leadership in innovations (>1,000 patents p.a.)• Customer orientation = supplier of choice
Agro-Chemicals& Nutrition
Plastics & Performance
ChemicalsIntermediatesBase
ChemicalsOil &Gas
The BASF Verbund-Concept
26
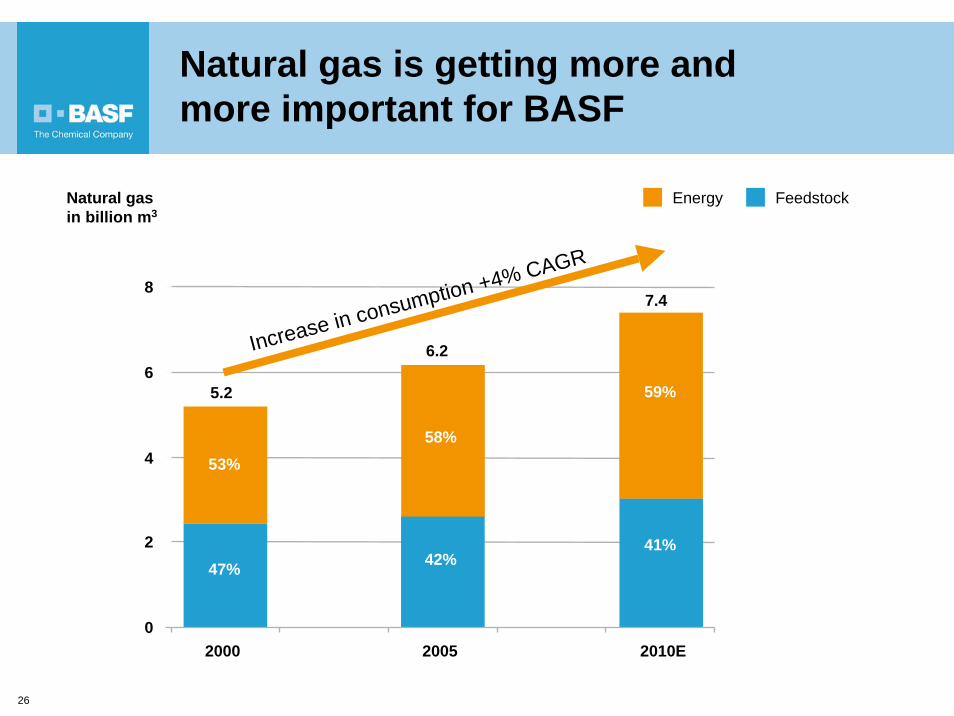
Natural gas is getting more and more important for BASF
Natural gasin billion m3
FeedstockEnergy
5.2
6.2
7.4
53%
47%
58%
42%
59%
41%
0
2
4
6
8
2000 2005 2010E
Increase in consumption +4% CAGR

27
Natural Gas
Methylformiate
Formamide
Formic Acid
HCN Value Chain
Methanol**
Butanediol
THF/Poly-THF
PBT (incl. Ecoflex)
PVP
Acetylene
Syn-Gas(Armgas)
POM
ResinsUrea
** In Ludwigshafen methanol is also produced in co-production with ammonia
Nitric Acid
Ammonia
Amines
Fertilizers
Nitrogen Oxide*
* For Caprolactam (part of the Polyamid value chain)
Simplified example from the Ludwigshafen site
Value chains driven by natural gas as feedstock
Melamine
Formaldehyde

28
Global efficiency improvement program
One-timecost
Write downs
Savingsfrom 2008
13030
160
270 160Process Optimization – 140Total 270 300
Site / Plant Restructuring
Million Euro
• 70% of savings already by 2007• Approximately 60% of one-time cost and write downs already recorded in EBIT
as of September 30, 2006

29
Synergies from acquisitions
Million Euro
Stand-alone sales 2005
Integration cost*
Synergiesby 2010
Remarks
Engelhard 3,897**
1,968
310**
Total 6,175 200 290
100 • Integration cost mainly in 2006 and 2007 • 50% of savings to be realized by 2007• 80% of savings to be realized by 2008• Includes 40 million Euro of growth synergies
160
100
Johnson Polymer
25 • Integration cost mainly in 2006 and 2007 • 60% of savings to be realized by 2007• 90% of savings to be realized by 2008• Includes 10 million Euro of growth synergies
• Integration cost mainly in 2006 and 2007 • 35% of savings to be realized by 2007• 70% of savings to be realized by 2008• Includes 30 million Euro of growth synergies
30
ConstructionChemicals
75
* Excluding use of step-up on inventory and capex ** Euro = 1.1797 USD as of Dec 30, 2005
Synergies > 4% of sales

30
Returning cash to shareholders
30

31
0.00
0.40
0.80
1.20
1.60
2.00
1996 1997 1998 1999 2000 2001 2002 2003 2004 2005
Dividend in Euro per share
Dividend Special dividend
+10% p.a.
• Increased dividend in 8 of the last 10 years
• 2005 dividend increaseof 18% to 2.00 Euro per share
• Dividend yield of 3.1% in 2005*
• Objective: To further increase dividend
* Based on the share price of December 31, 2005
Ambitious dividend policy

32
Continuous share buyback program
In million Euro • 22 % of shares outstandingbought back for 6.2 billion Euro from 1999 to first nine months 2006
• 500 million Euro program announced in February completed end of October 2006
• Further share buyback of 500 million Euro announced in November 2006
808
256
700
1,300
500 500
726
1,435
0
500
1,000
1,500
2,000
1999 2000 2001 2002 2003 2004 2005 Q1-Q32006

33
Bringing our value into sharp focus
• Consistent year-on-year financial and operational delivery
• Portfolio reshaped toward faster growing and less cyclical businesses
• Innovations and acquisitions drive profitable growth even faster
• Business excellence through intelligent and efficient value chain management
• Strong return orientation

34
![ECOFLEX PARA JOAQUIM - PINHALENSERua Honório Soares, 80 Espírito Santo do Pinhal - SP - Brasil CEP 13.990-000 Fone [19] 3651-9200 Fax [19] 3651-9204 ECOFLEX-1 ECOFLEX-2 ECOFLEX-4](https://img.pdfslide.us/doc/110x75/5fa7aff2cec8d905fc6302cd/ecoflex-para-joaquim-pinhalense-rua-honrio-soares-80-esprito-santo-do-pinhal.jpg)