Embed Size (px)
Citation preview
Applying Natural Capital thinking for
sustainable biomass utilisation
Prof. Richard Murphy
Centre for Environment & Sustainability,
University of Surrey, UK [email protected]
www.surrey.ac.uk/ces
Newton Bhabha Fund Researcher Links Workshop 23-27 October 2017
CSIR-Indian Institute of Petroleum (IIP), Dehradun, India
Aims
• Brief introduction
• Natural Capital ‘thinking’ and its use in the
county of Surrey, England
• Natural Capital assets for sustainable products,
ecosystem services and green infrastructure
• Concluding remarks
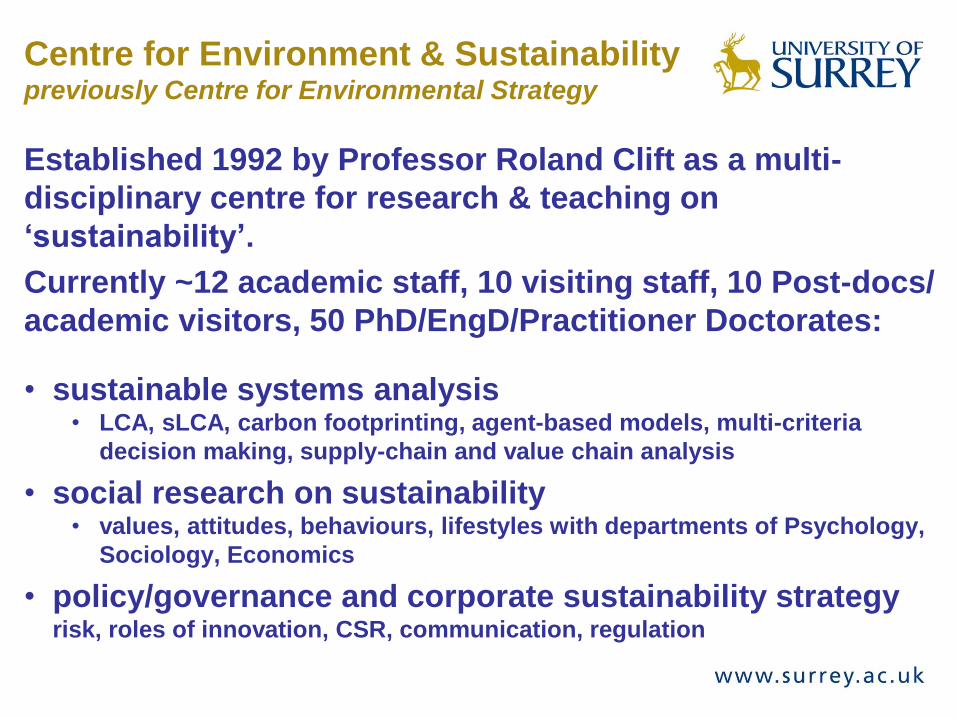
Centre for Environment & Sustainabilitypreviously Centre for Environmental Strategy
Established 1992 by Professor Roland Clift as a multi-
disciplinary centre for research & teaching on
‘sustainability’.
Currently ~12 academic staff, 10 visiting staff, 10 Post-docs/
academic visitors, 50 PhD/EngD/Practitioner Doctorates:
• sustainable systems analysis • LCA, sLCA, carbon footprinting, agent-based models, multi-criteria
decision making, supply-chain and value chain analysis
• social research on sustainability• values, attitudes, behaviours, lifestyles with departments of Psychology,
Sociology, Economics
• policy/governance and corporate sustainability strategy risk, roles of innovation, CSR, communication, regulation
Prof Richard Murphy, Centre for Environmental Strategy (CES)
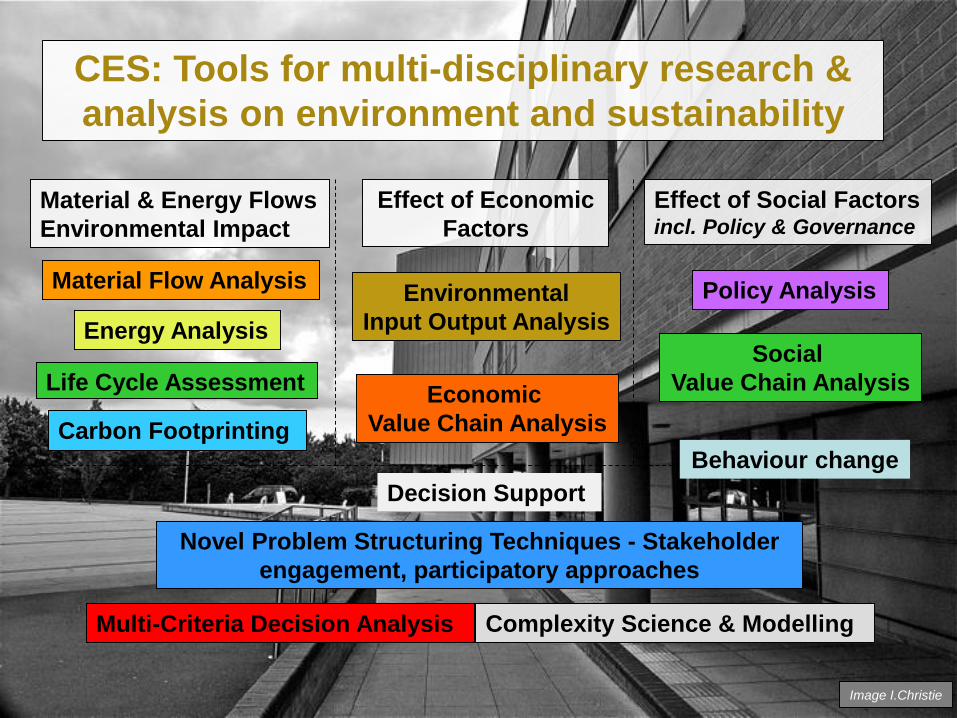
CES: Tools for multi-disciplinary research &
analysis on environment and sustainability
Effect of Social Factors incl. Policy & Governance
Material & Energy Flows
Environmental Impact
Effect of Economic
Factors
Decision Support
Material Flow Analysis
Life Cycle Assessment
Carbon Footprinting
Environmental
Input Output Analysis
Economic
Value Chain Analysis
Policy Analysis
Social
Value Chain Analysis
Novel Problem Structuring Techniques - Stakeholder
engagement, participatory approaches
Multi-Criteria Decision Analysis Complexity Science & Modelling
Energy Analysis
Image I.Christie
Behaviour change
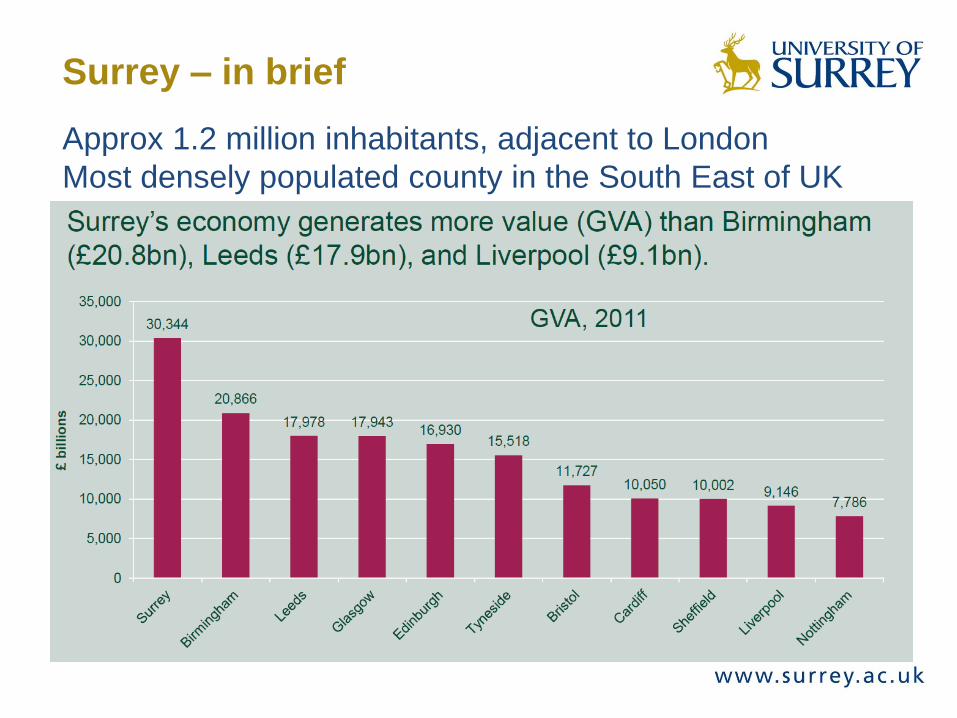
Surrey – in brief
Approx 1.2 million inhabitants, adjacent to London
Most densely populated county in the South East of UK
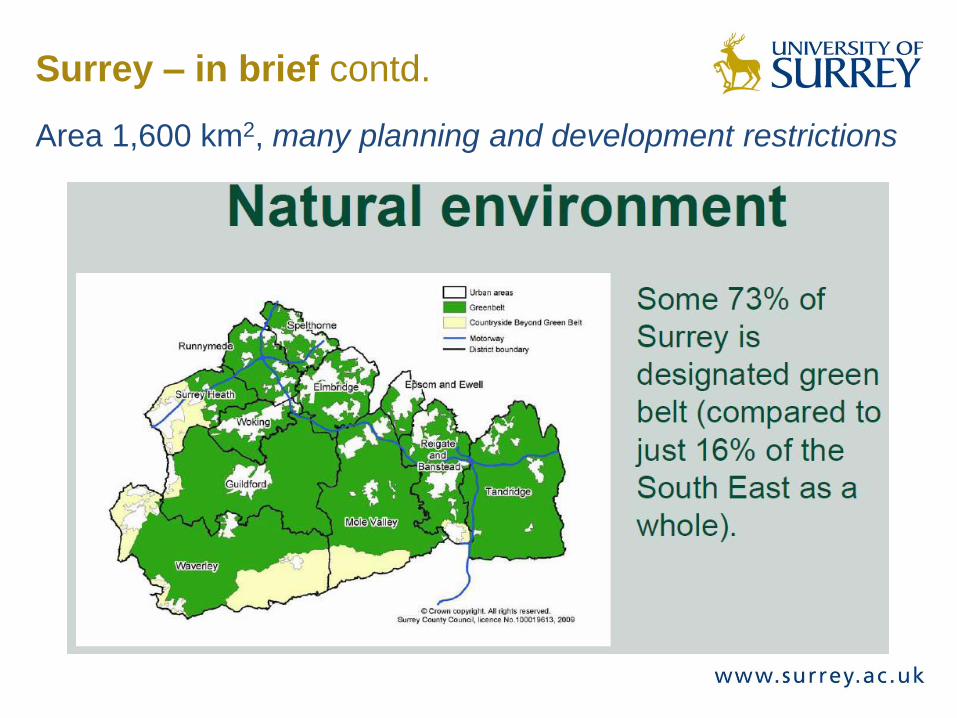
Surrey – in brief contd.
Area 1,600 km2, many planning and development restrictions
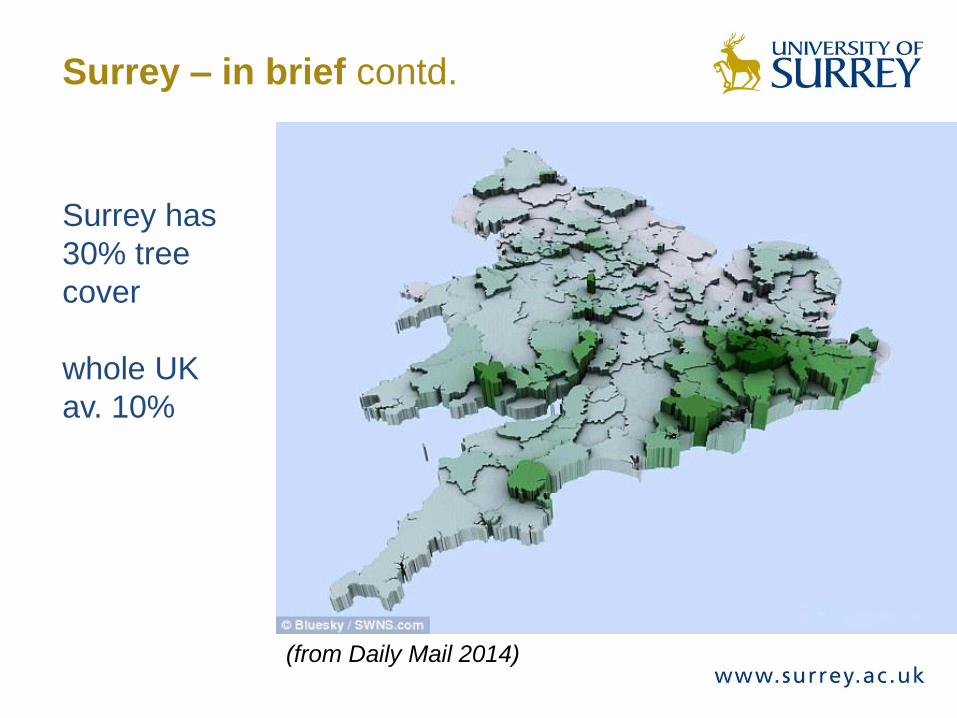
Surrey – in brief contd.
Surrey has
30% tree
cover
whole UK
av. 10%
(from Daily Mail 2014)
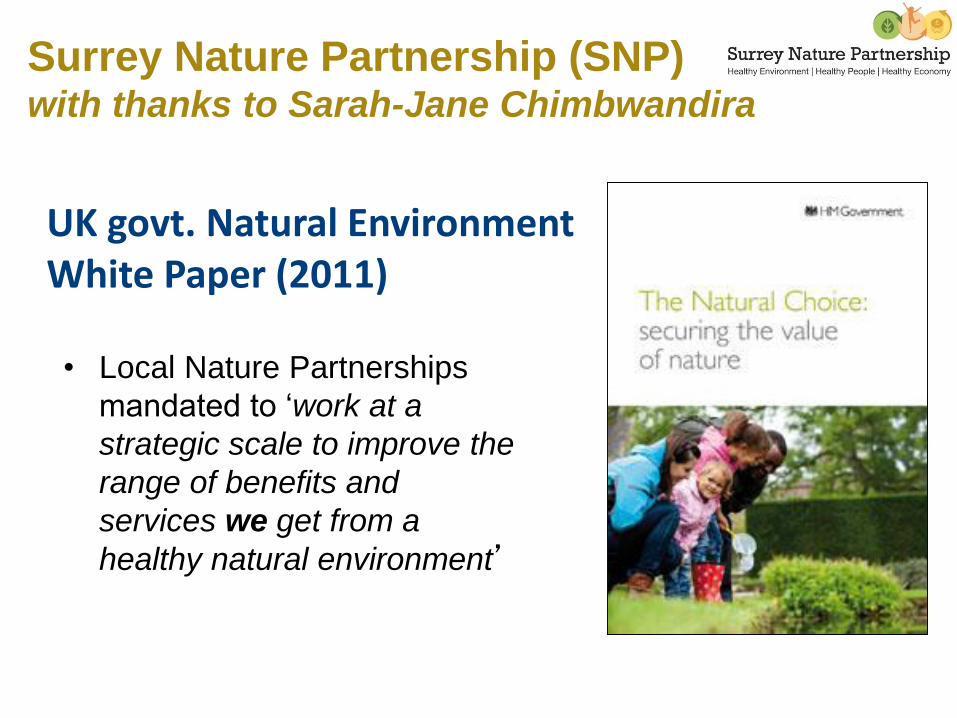
• Local Nature Partnerships
mandated to ‘work at a
strategic scale to improve the
range of benefits and
services we get from a
healthy natural environment’
Surrey Nature Partnership (SNP) with thanks to Sarah-Jane Chimbwandira
UK govt. Natural Environment White Paper (2011)
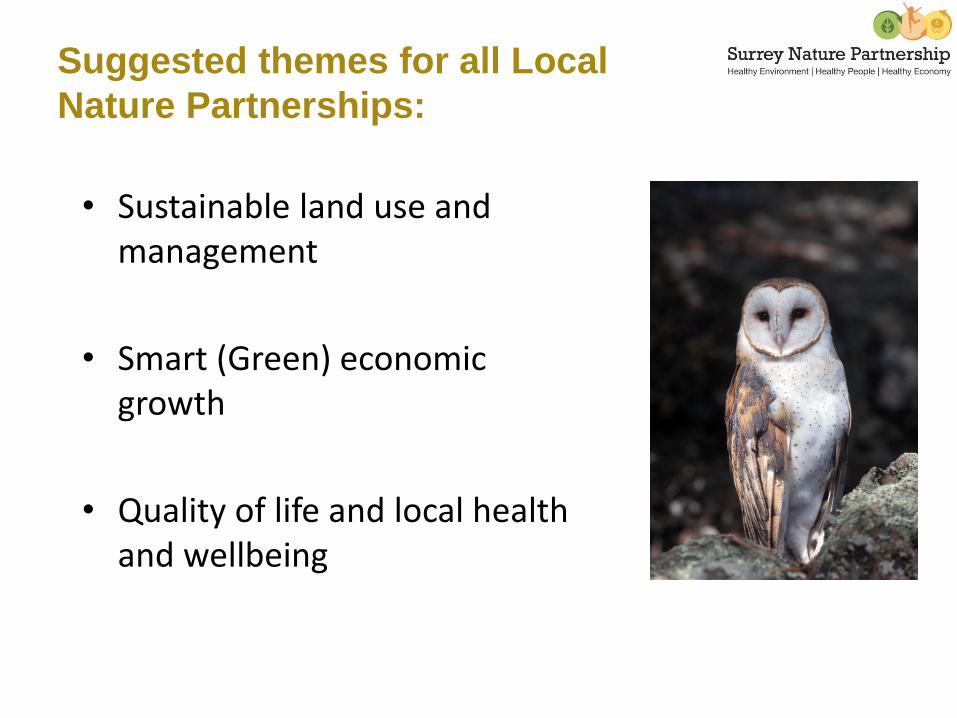
• Sustainable land use and management
• Smart (Green) economic growth
• Quality of life and local health and wellbeing
SWT, Heather Angel
Suggested themes for all Local
Nature Partnerships:
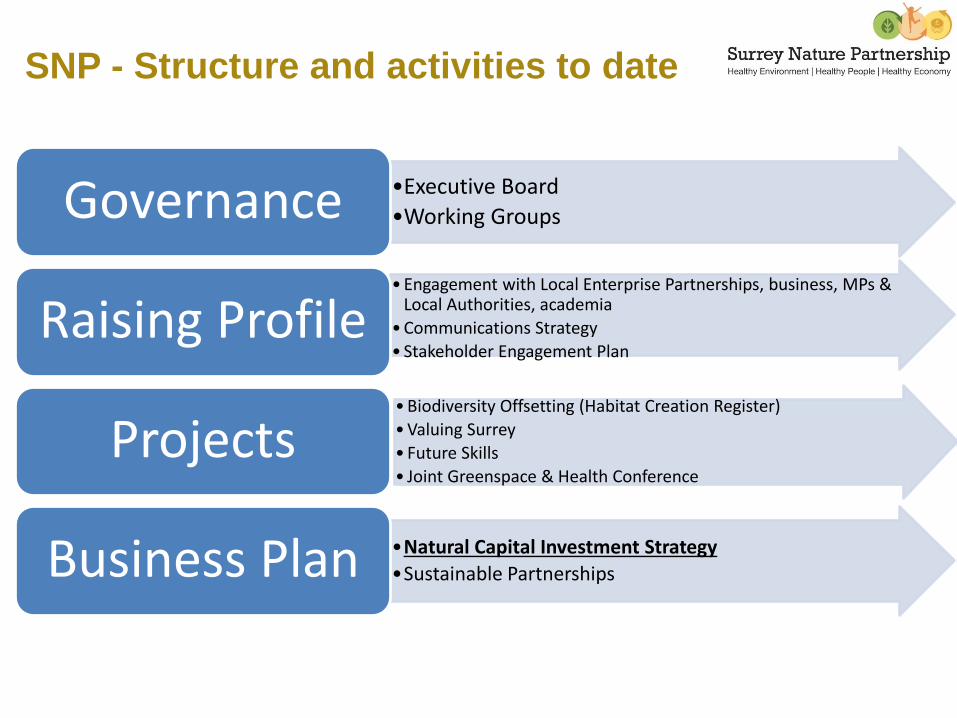
SNP - Structure and activities to date
•Executive Board
•Working GroupsGovernance
• Engagement with Local Enterprise Partnerships, business, MPs & Local Authorities, academia
• Communications Strategy
• Stakeholder Engagement PlanRaising Profile
• Biodiversity Offsetting (Habitat Creation Register)
• Valuing Surrey
• Future Skills
• Joint Greenspace & Health Conference
Projects
•Natural Capital Investment Strategy
•Sustainable PartnershipsBusiness Plan

Natural Capital thinking
Latest TweetsLatest Tweets
Natural Capital thinking
• Natural Capital is an asset
• Natural Capital = elements of nature (soil,
water, air, land) which directly or indirectly
provide value or benefits to people
• Natural Capital assets can be renewable (e.g.
forests) or non-renewable (e.g. fossil oil)
see:the Natural Capital Coalition http://naturalcapitalcoalition.org/
UK Govt’s. Natural Capital Committee
https://www.gov.uk/government/groups/natural-capital-committee
Latest TweetsLatest Tweets
Natural Capital thinking contd.
• Renewable Natural Capital assets, such as
ecosystems, habitats and species, will continue
to provide their ecoservices for free and
indefinitely so long as they are not driven to a
point where they can no longer reproduce
themselves
• Science is now beginning to provide knowledge
to identify biophysical thresholds and
resilience levels and safe limits for renewable
Natural Capital assets to remain sustainable
Latest TweetsLatest Tweets
Natural Capital thinking contd.
• Renewable Natural Capital assets can be
recognised as being ‘at risk’ and actions taken
to improve the stock of such assets
• Prioritising which Natural Capital assets should
be tackled urgently can be done by cost benefit
analysis with recognition that improvement to
the system as a whole is sought
• This satisfies the concept of the “aggregate
natural capital rule” as presented in Dieter
Helm’s ‘Natural Capital: valuing the Planet’
Latest TweetsLatest Tweets
Natural Capital thinking contd.
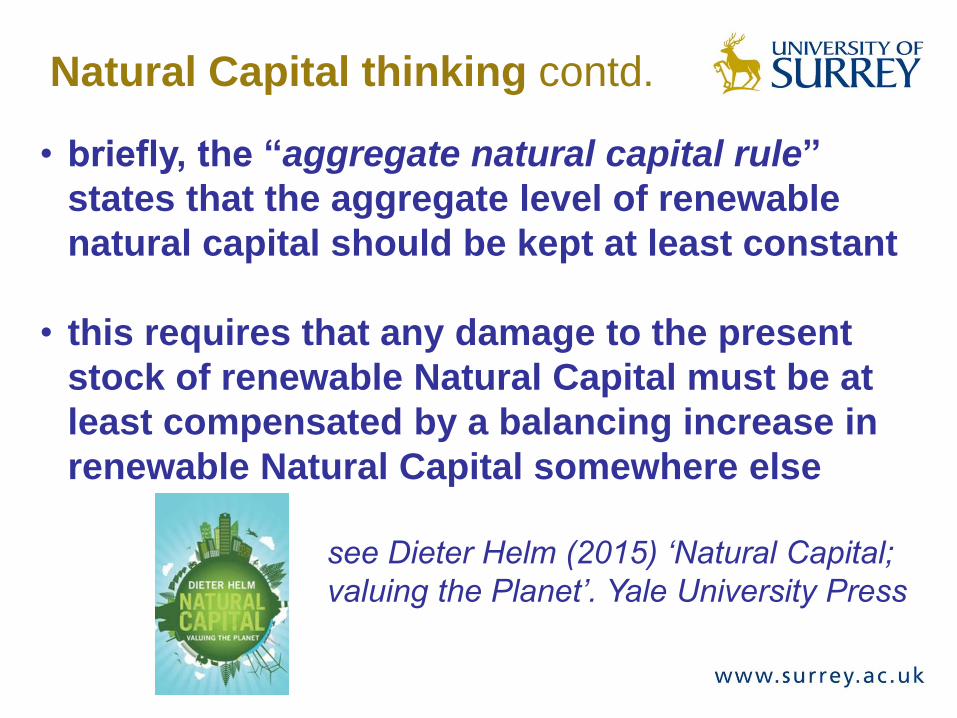
• briefly, the “aggregate natural capital rule”
states that the aggregate level of renewable
natural capital should be kept at least constant
• this requires that any damage to the present
stock of renewable Natural Capital must be at
least compensated by a balancing increase in
renewable Natural Capital somewhere else
see Dieter Helm (2015) ‘Natural Capital;
valuing the Planet’. Yale University Press
Latest TweetsLatest Tweets
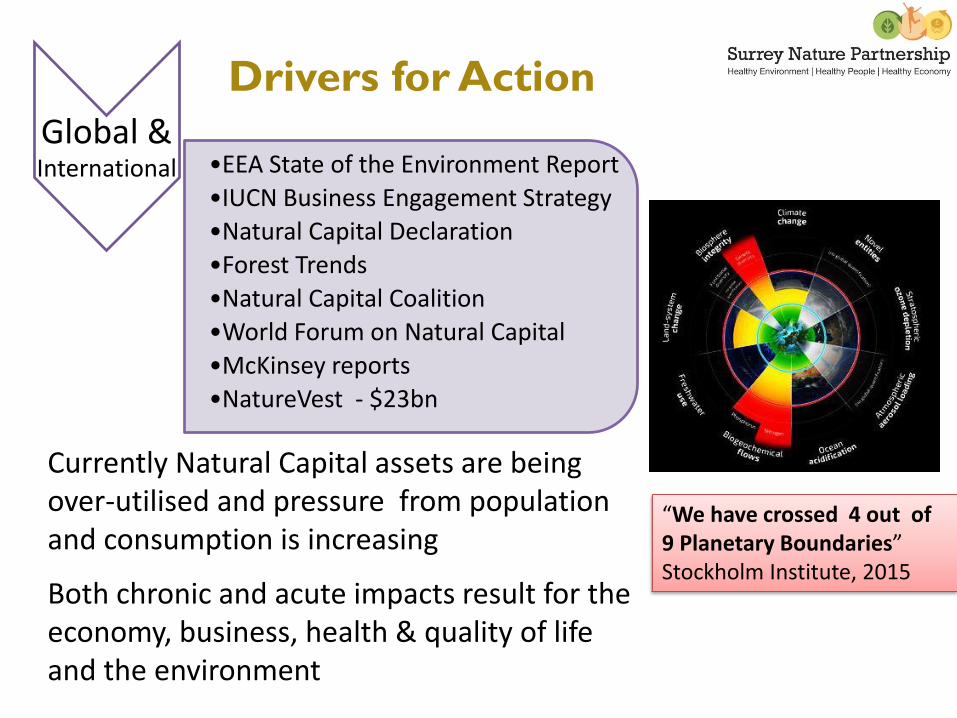
Currently Natural Capital assets are being over-utilised and pressure from population and consumption is increasing
Both chronic and acute impacts result for the economy, business, health & quality of life and the environment
Global &International •EEA State of the Environment Report
•IUCN Business Engagement Strategy
•Natural Capital Declaration
•Forest Trends
•Natural Capital Coalition
•World Forum on Natural Capital
•McKinsey reports
•NatureVest - $23bn
“We have crossed 4 out of 9 Planetary Boundaries” Stockholm Institute, 2015
Drivers for Action
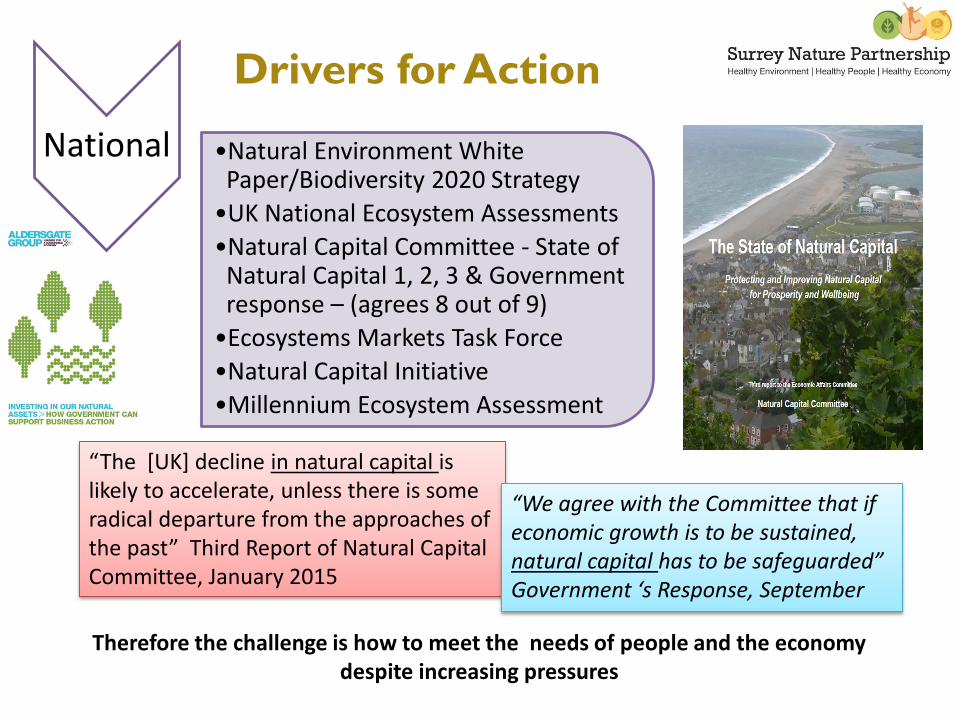
“The [UK] decline in natural capital is likely to accelerate, unless there is some radical departure from the approaches of the past” Third Report of Natural Capital Committee, January 2015
Drivers for Action
•Natural Environment White Paper/Biodiversity 2020 Strategy
•UK National Ecosystem Assessments
•Natural Capital Committee - State of Natural Capital 1, 2, 3 & Government response – (agrees 8 out of 9)
•Ecosystems Markets Task Force
•Natural Capital Initiative
•Millennium Ecosystem Assessment
Therefore the challenge is how to meet the needs of people and the economy despite increasing pressures
“We agree with the Committee that if economic growth is to be sustained, natural capital has to be safeguarded” Government ‘s Response, September
National
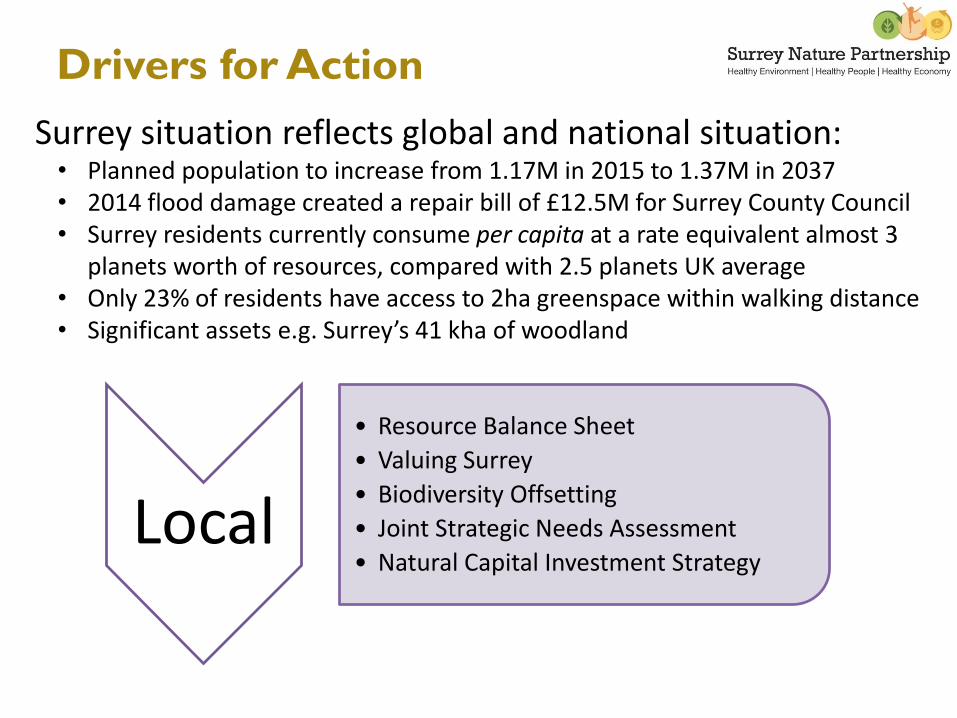
Local
• Resource Balance Sheet
• Valuing Surrey
• Biodiversity Offsetting
• Joint Strategic Needs Assessment
• Natural Capital Investment Strategy
Surrey situation reflects global and national situation:• Planned population to increase from 1.17M in 2015 to 1.37M in 2037 • 2014 flood damage created a repair bill of £12.5M for Surrey County Council• Surrey residents currently consume per capita at a rate equivalent almost 3
planets worth of resources, compared with 2.5 planets UK average• Only 23% of residents have access to 2ha greenspace within walking distance• Significant assets e.g. Surrey’s 41 kha of woodland
Drivers for Action
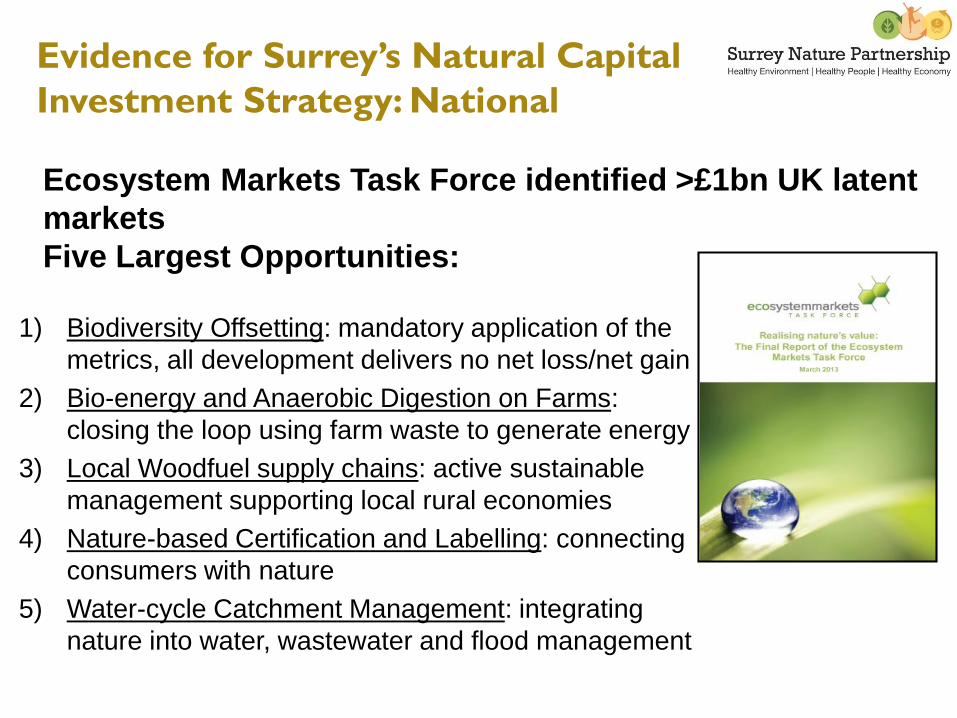
Evidence for Surrey’s Natural Capital
Investment Strategy: National
Ecosystem Markets Task Force identified >£1bn UK latent
markets
Five Largest Opportunities:
1) Biodiversity Offsetting: mandatory application of the
metrics, all development delivers no net loss/net gain
2) Bio-energy and Anaerobic Digestion on Farms:
closing the loop using farm waste to generate energy
3) Local Woodfuel supply chains: active sustainable
management supporting local rural economies
4) Nature-based Certification and Labelling: connecting
consumers with nature
5) Water-cycle Catchment Management: integrating
nature into water, wastewater and flood management
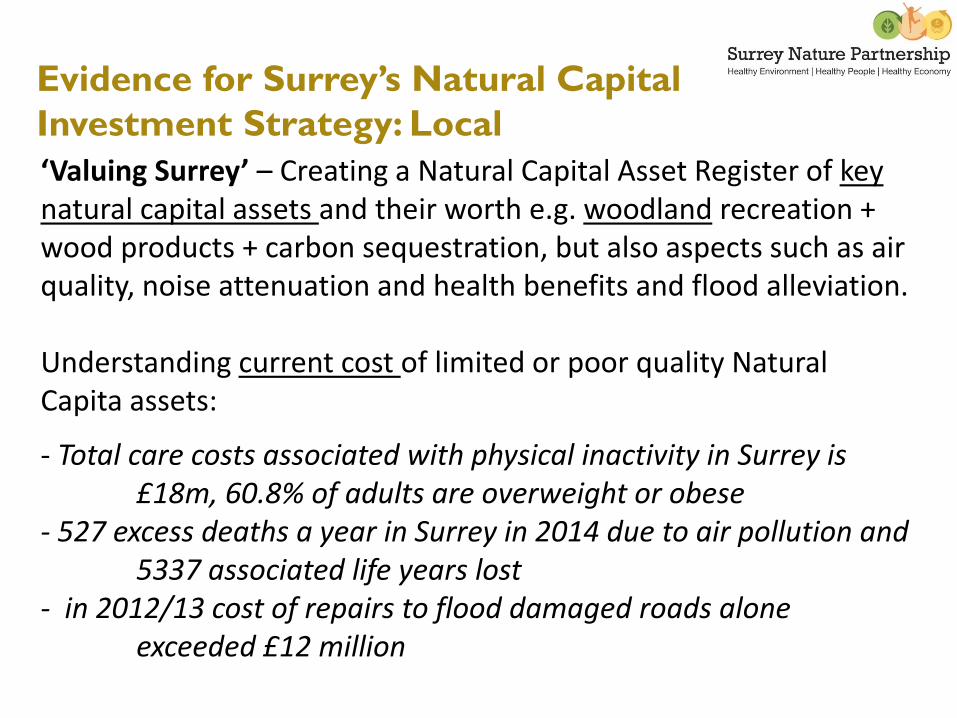
‘Valuing Surrey’ – Creating a Natural Capital Asset Register of key natural capital assets and their worth e.g. woodland recreation + wood products + carbon sequestration, but also aspects such as air quality, noise attenuation and health benefits and flood alleviation.
Understanding current cost of limited or poor quality Natural Capita assets:
- Total care costs associated with physical inactivity in Surrey is £18m, 60.8% of adults are overweight or obese
- 527 excess deaths a year in Surrey in 2014 due to air pollution and 5337 associated life years lost
- in 2012/13 cost of repairs to flood damaged roads alone exceeded £12 million
Evidence for Surrey’s Natural Capital
Investment Strategy: Local
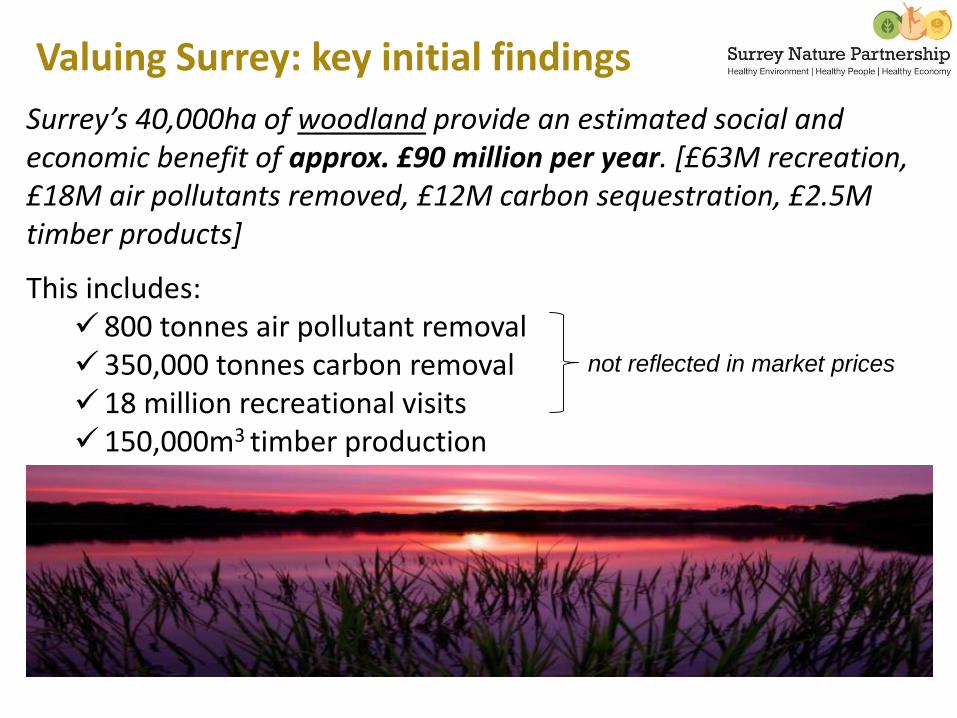
Surrey’s 40,000ha of woodland provide an estimated social and economic benefit of approx. £90 million per year. [£63M recreation, £18M air pollutants removed, £12M carbon sequestration, £2.5M timber products]
This includes: 800 tonnes air pollutant removal 350,000 tonnes carbon removal 18 million recreational visits 150,000m3 timber production
Valuing Surrey: key initial findings
not reflected in market prices
Modelling Biodiversity Offsetting in Surrey
Biodiversity Opportunity Areas
Habitat Creation Register
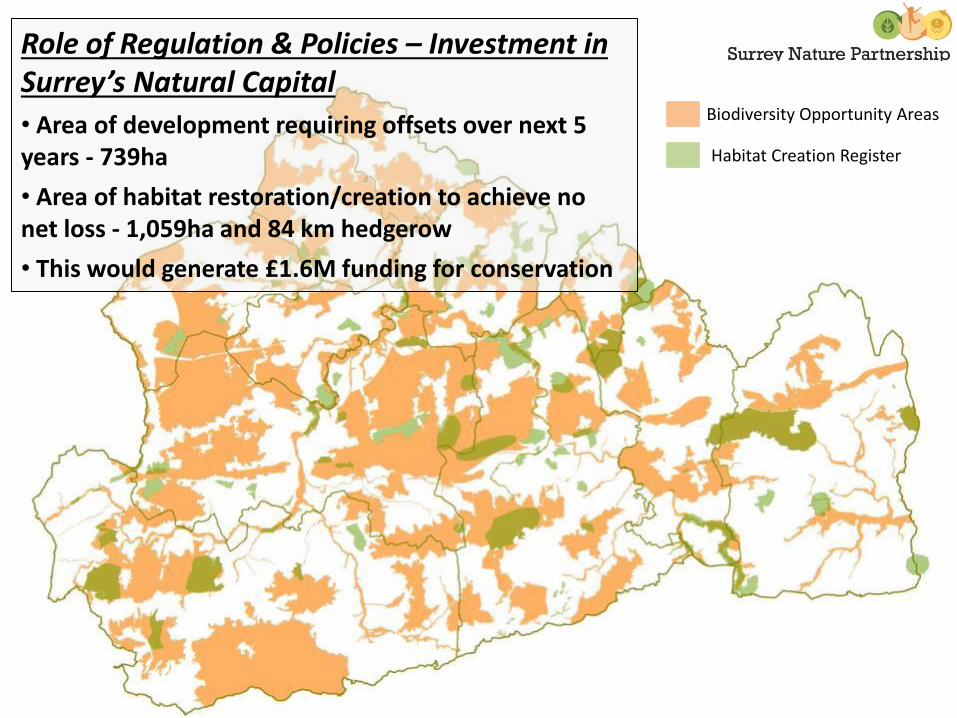
Role of Regulation & Policies – Investment in Surrey’s Natural Capital
• Area of development requiring offsets over next 5 years - 739ha
• Area of habitat restoration/creation to achieve no net loss - 1,059ha and 84 km hedgerow
• This would generate £1.6M funding for conservation
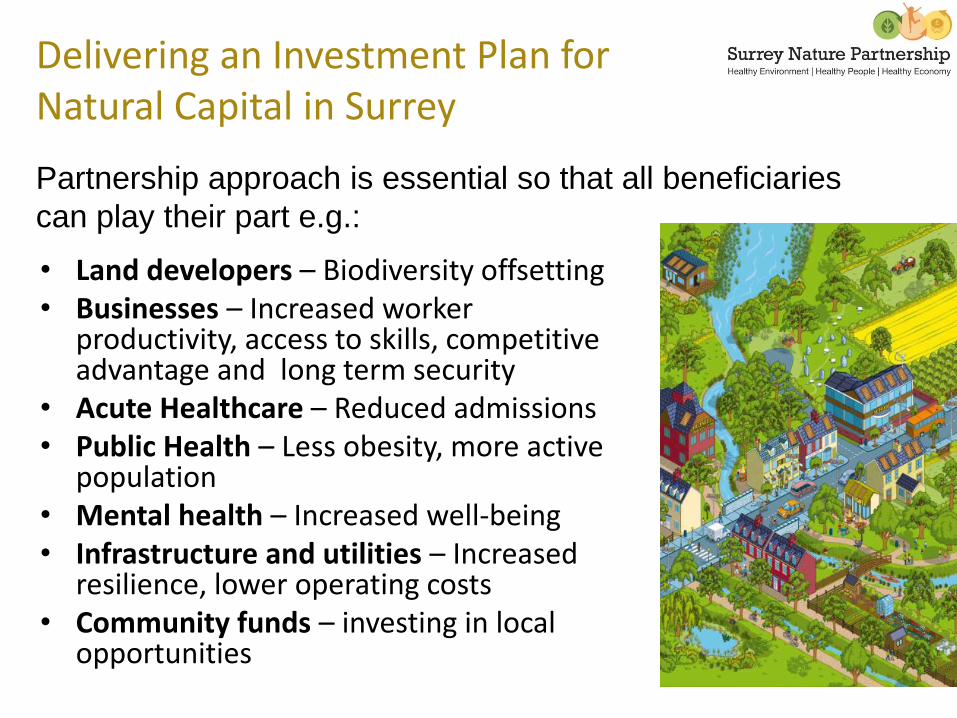
Delivering an Investment Plan for Natural Capital in Surrey
• Land developers – Biodiversity offsetting• Businesses – Increased worker
productivity, access to skills, competitive advantage and long term security
• Acute Healthcare – Reduced admissions• Public Health – Less obesity, more active
population• Mental health – Increased well-being• Infrastructure and utilities – Increased
resilience, lower operating costs• Community funds – investing in local
opportunities
Partnership approach is essential so that all beneficiaries
can play their part e.g.:
Learning from, and
using, Natural Capital
four brief examples ….
Latest TweetsLatest Tweets

Life Cycle Assessment
(LCA) of Local SE UK
Wood Energy Supply
Chains
Weiqun Wu - MSc student researcher
Supervisors:Richard Murphy CES, University of SurreyMartin Head CEP, Imperial College LondonRoland Clift CES, University of Surrey
Participating Company: LC Energy Ltd, Surrey UK
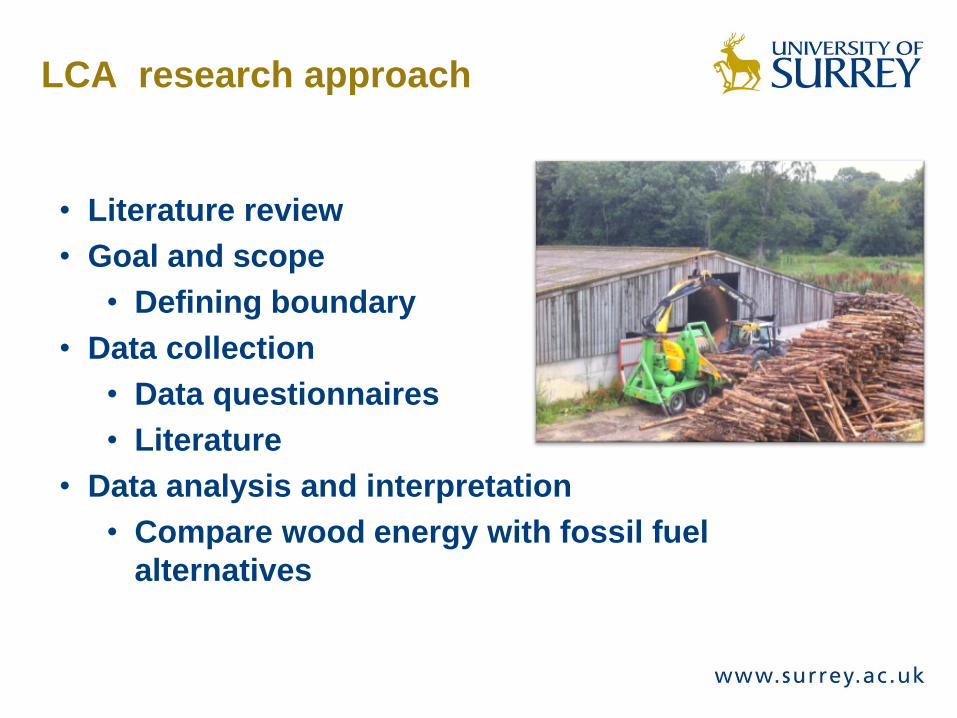
LCA research approach
• Literature review
• Goal and scope
• Defining boundary
• Data collection
• Data questionnaires
• Literature
• Data analysis and interpretation
• Compare wood energy with fossil fuel
alternatives
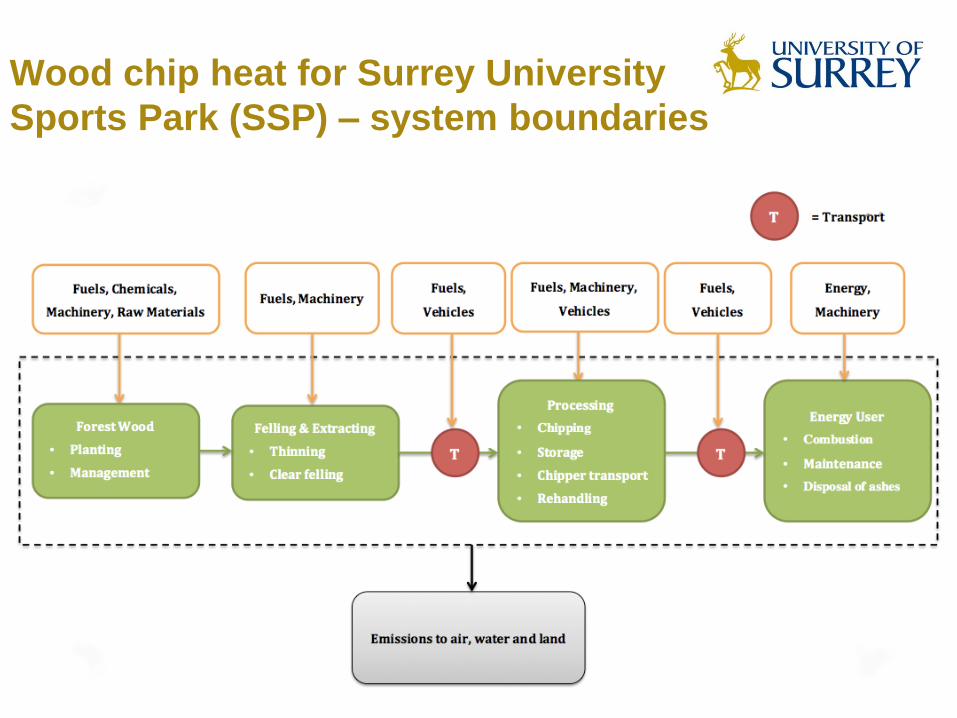
Wood chip heat for Surrey University
Sports Park (SSP) – system boundaries
Functional unit
The functional unit acts as a reference flow,
which connects all other modelled flows. The
functional unit was:
• the annual supply of wood fuel energy at the
Sports Park = 1,114,030 kWh of heat.
• Comparison with ‘heat production by natural
gas, at industrial furnace >100kW’ and ‘heat
production, at hard coal industrial furnace 1-
10MW’.
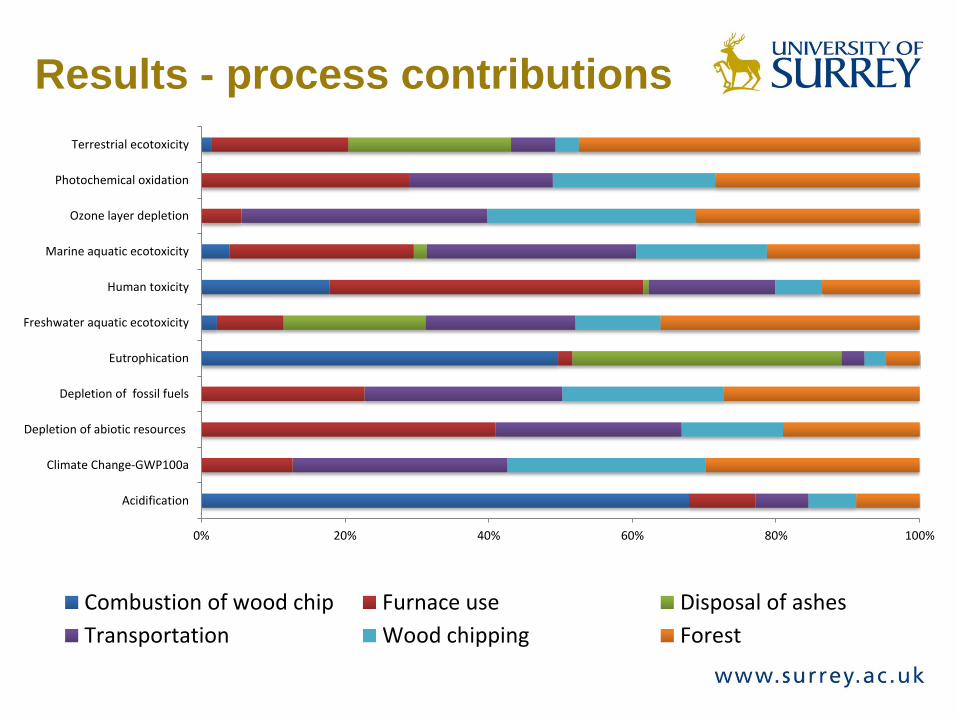
Results - process contributions
0% 20% 40% 60% 80% 100%
Acidification
Climate Change-GWP100a
Depletion of abiotic resources
Depletion of fossil fuels
Eutrophication
Freshwater aquatic ecotoxicity
Human toxicity
Marine aquatic ecotoxicity
Ozone layer depletion
Photochemical oxidation
Terrestrial ecotoxicity
Combustion of wood chip Furnace use Disposal of ashes
Transportation Wood chipping Forest
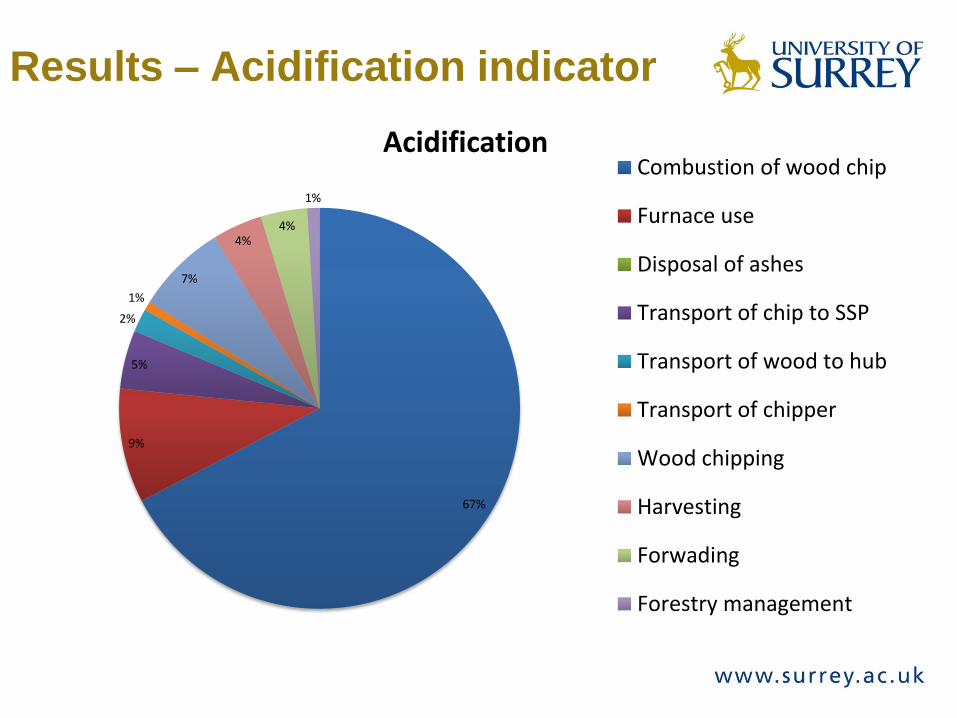
Results – Acidification indicator
67%
9%
5%
2%
1%
7%
4%4%
1%
AcidificationCombustion of wood chip
Furnace use
Disposal of ashes
Transport of chip to SSP
Transport of wood to hub
Transport of chipper
Wood chipping
Harvesting
Forwading
Forestry management
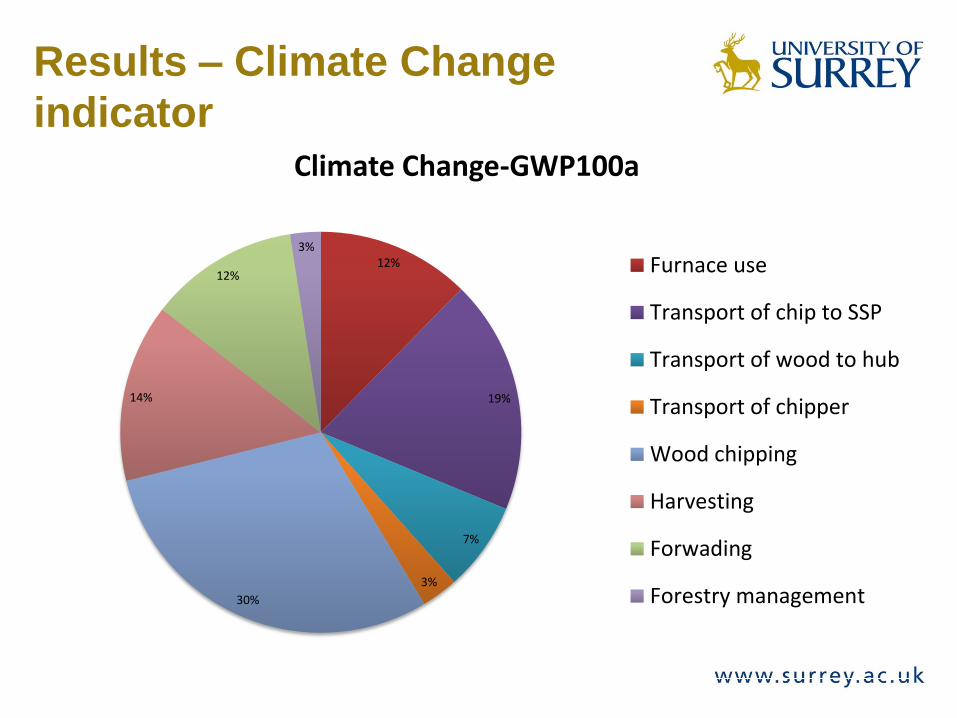
Results – Climate Change
indicator
12%
19%
7%
3%
30%
14%
12%
3%
Climate Change-GWP100a
Furnace use
Transport of chip to SSP
Transport of wood to hub
Transport of chipper
Wood chipping
Harvesting
Forwading
Forestry management
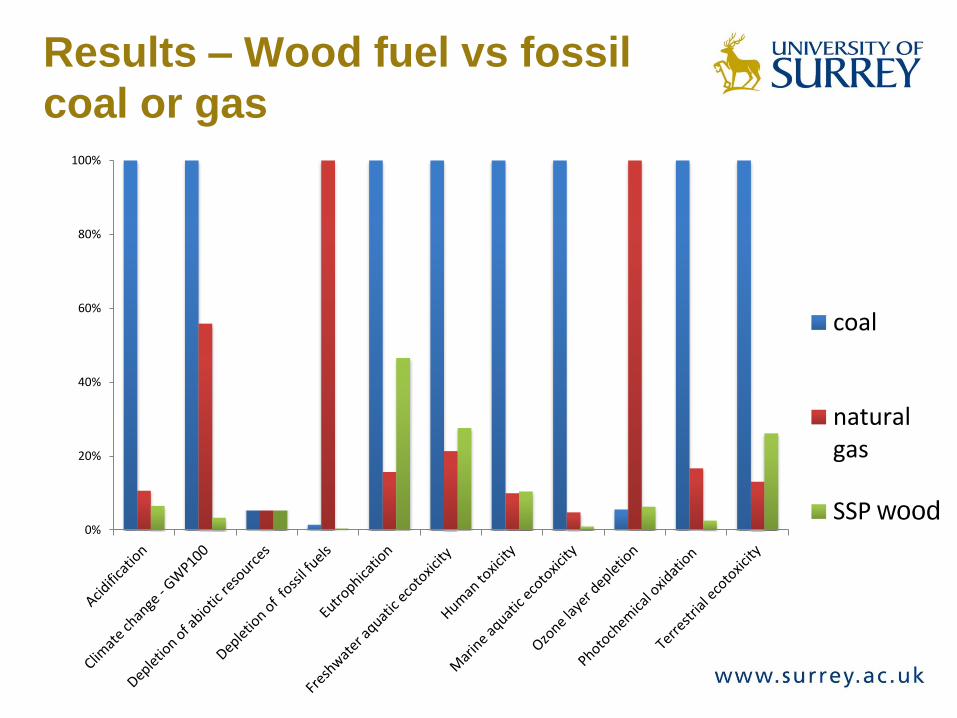
Results – Wood fuel vs fossil
coal or gas
0%
20%
40%
60%
80%
100%
coal
naturalgas
SSP wood
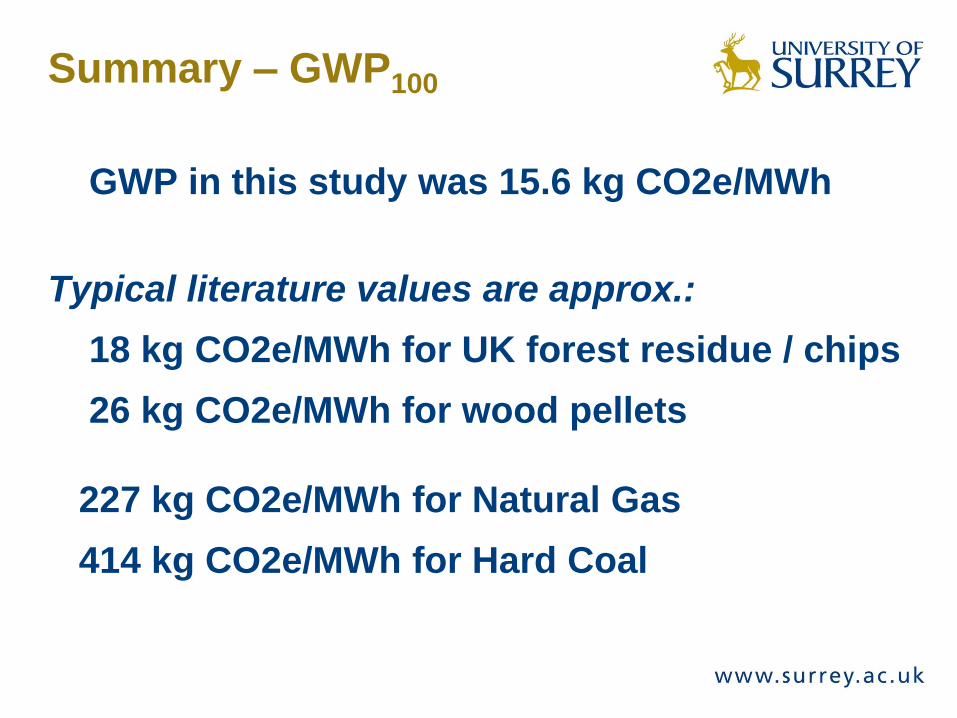
Summary – GWP100
GWP in this study was 15.6 kg CO2e/MWh
Typical literature values are approx.:
18 kg CO2e/MWh for UK forest residue / chips
26 kg CO2e/MWh for wood pellets
227 kg CO2e/MWh for Natural Gas
414 kg CO2e/MWh for Hard Coal
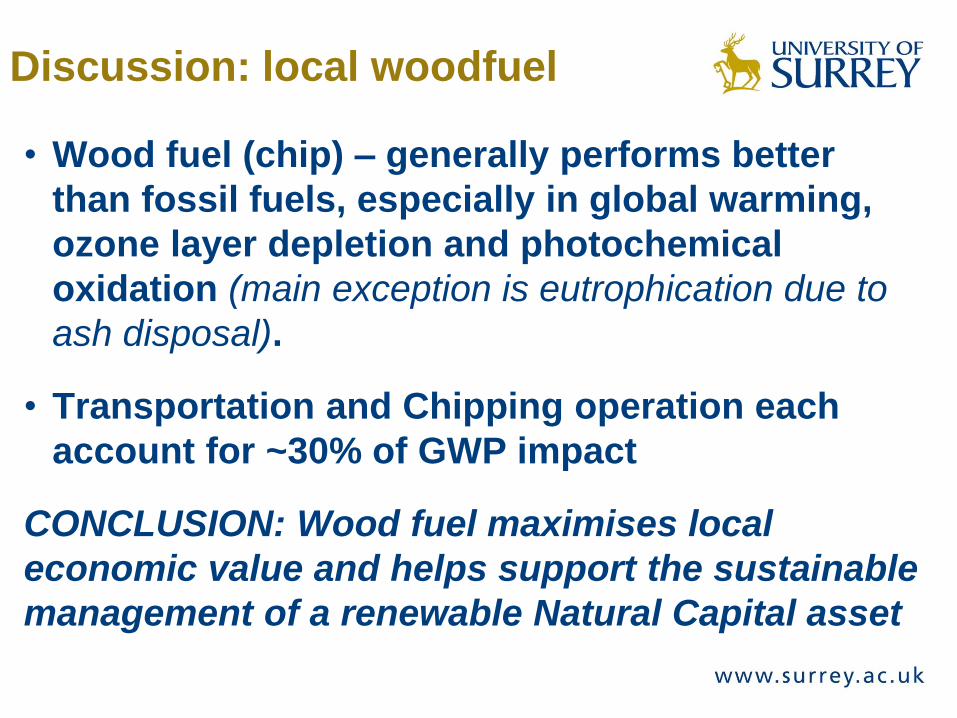
Discussion: local woodfuel
• Wood fuel (chip) – generally performs better
than fossil fuels, especially in global warming,
ozone layer depletion and photochemical
oxidation (main exception is eutrophication due to
ash disposal).
• Transportation and Chipping operation each
account for ~30% of GWP impact
CONCLUSION: Wood fuel maximises local
economic value and helps support the sustainable
management of a renewable Natural Capital asset
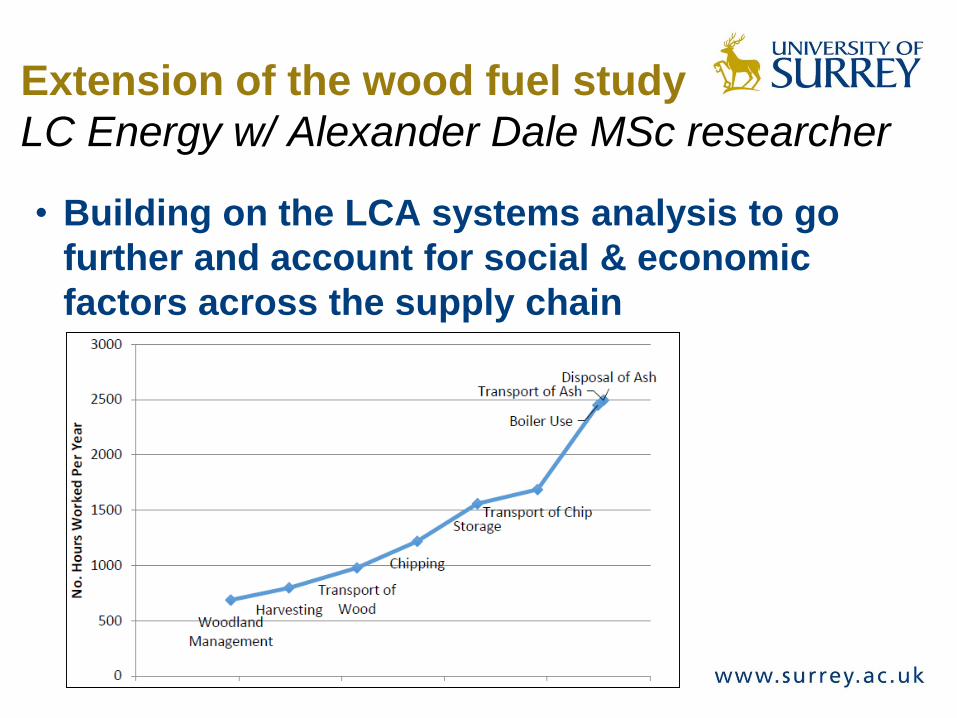
Extension of the wood fuel study
LC Energy w/ Alexander Dale MSc researcher
• Building on the LCA systems analysis to go
further and account for social & economic
factors across the supply chain
Prof Richard Murphy, Centre for Environmental Strategy (CES)
Green infrastructure
with thanks to
Dr Jonathan Chenoweth (CES, Surrey)
&
Professor Bill Hunt
(Biological and Agricultural Engineering
North Carolina State University, USA)
Definitions: green infrastructure
Green infrastructure is a planned network, not just a
collection of open spaces in urban areas:
• Green infrastructure refers to the combined structure,
position and connectivity of green spaces
• “a strategically planned network of high quality
natural and semi-natural areas” European Commission
(2013, p7)
• Not all green space is necessarily green
infrastructure – must be part of a planned network
Ecosystem service delivery is a key feature
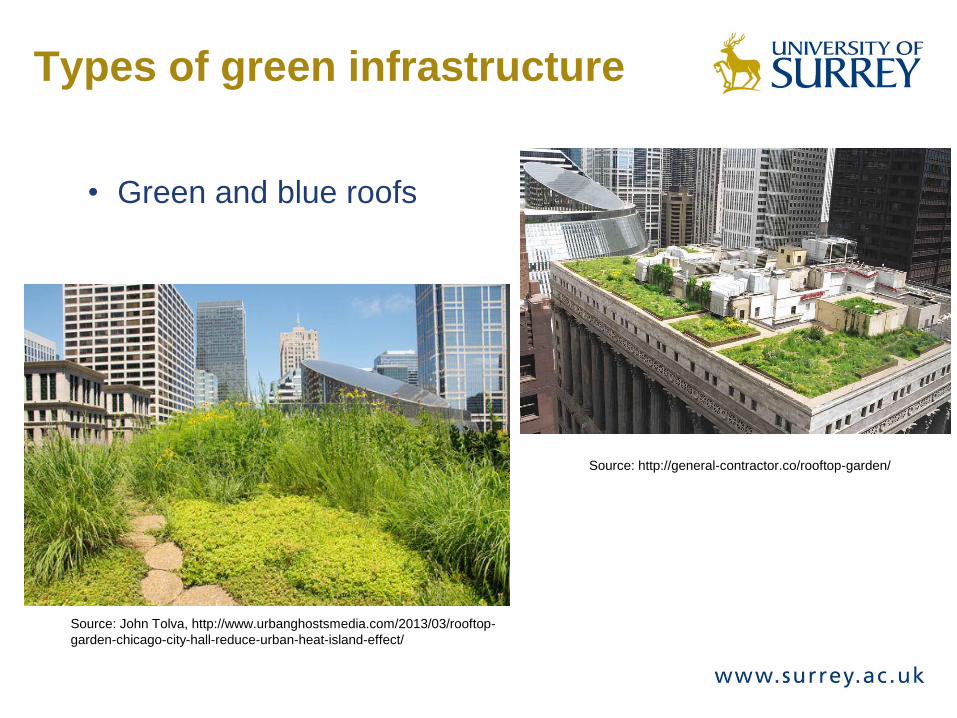
Types of green infrastructure
Source: http://general-contractor.co/rooftop-garden/
• Green and blue roofs
Source: John Tolva, http://www.urbanghostsmedia.com/2013/03/rooftop-
garden-chicago-city-hall-reduce-urban-heat-island-effect/
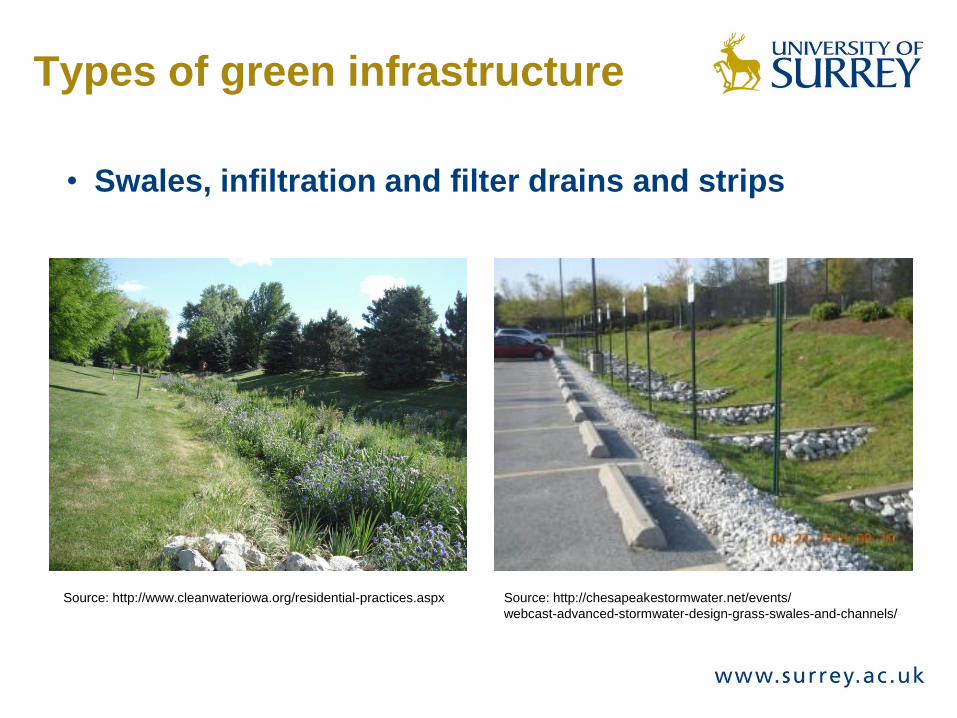
Types of green infrastructure
• Swales, infiltration and filter drains and strips
Source: http://chesapeakestormwater.net/events/
webcast-advanced-stormwater-design-grass-swales-and-channels/
Source: http://www.cleanwateriowa.org/residential-practices.aspx
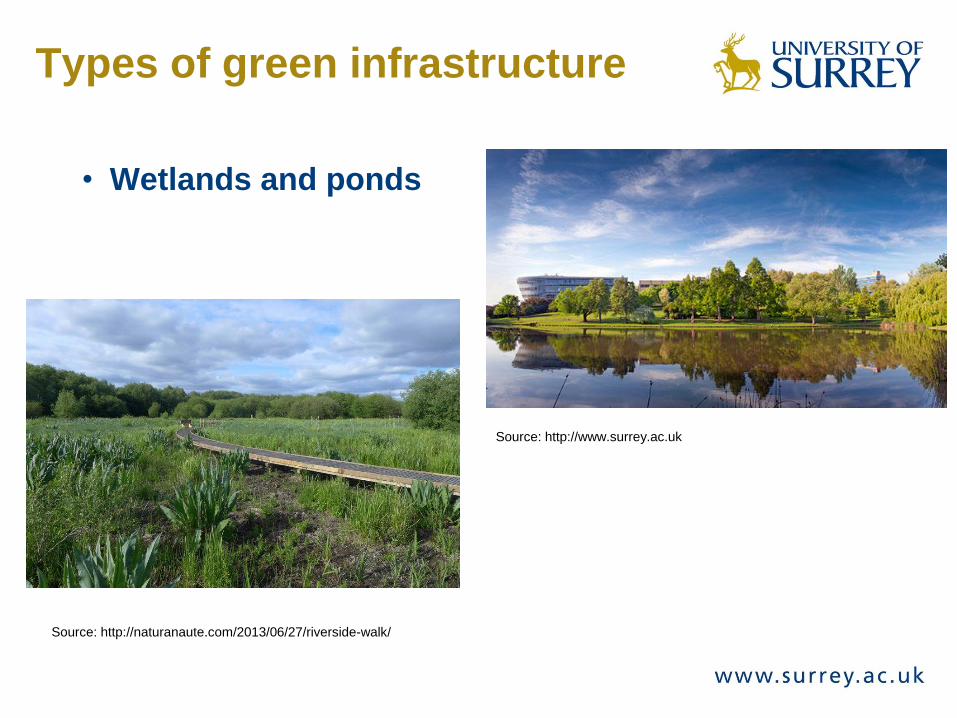
Types of green infrastructure
• Wetlands and ponds
Source: http://www.surrey.ac.uk
Source: http://naturanaute.com/2013/06/27/riverside-walk/
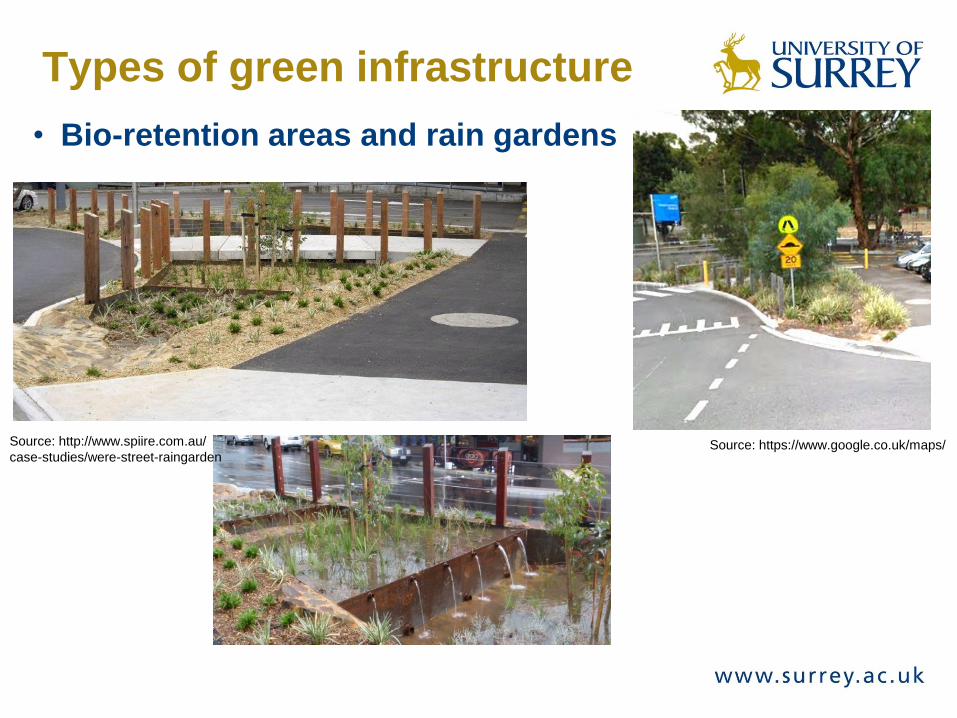
Types of green infrastructure
• Bio-retention areas and rain gardens
Source: http://www.spiire.com.au/
case-studies/were-street-raingardenSource: https://www.google.co.uk/maps/
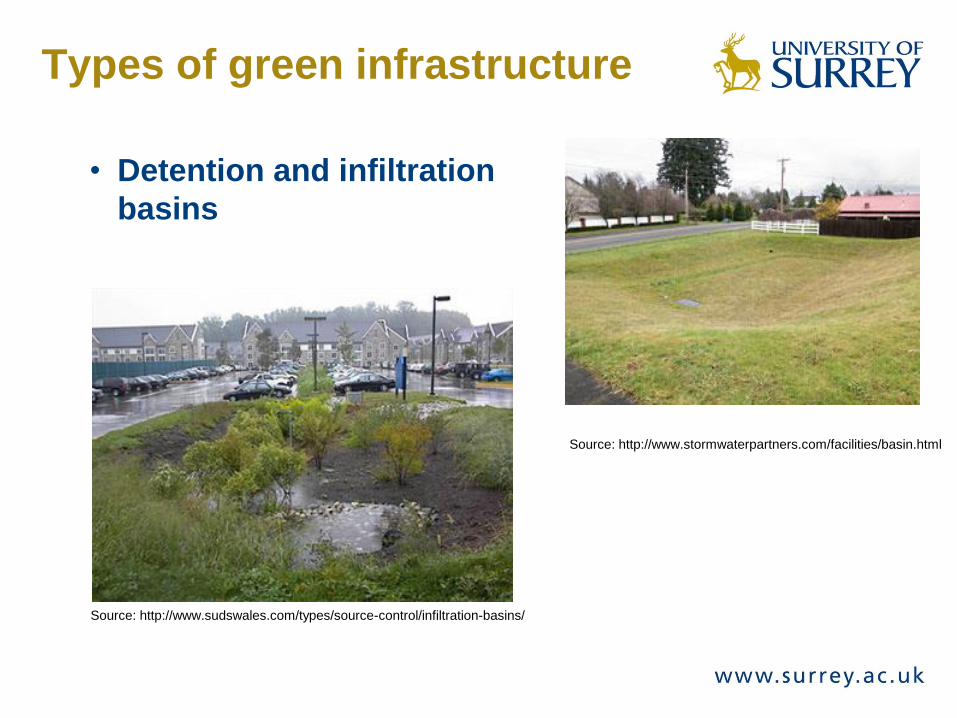
Types of green infrastructure
• Detention and infiltration
basins
Source: http://www.stormwaterpartners.com/facilities/basin.html
Source: http://www.sudswales.com/types/source-control/infiltration-basins/
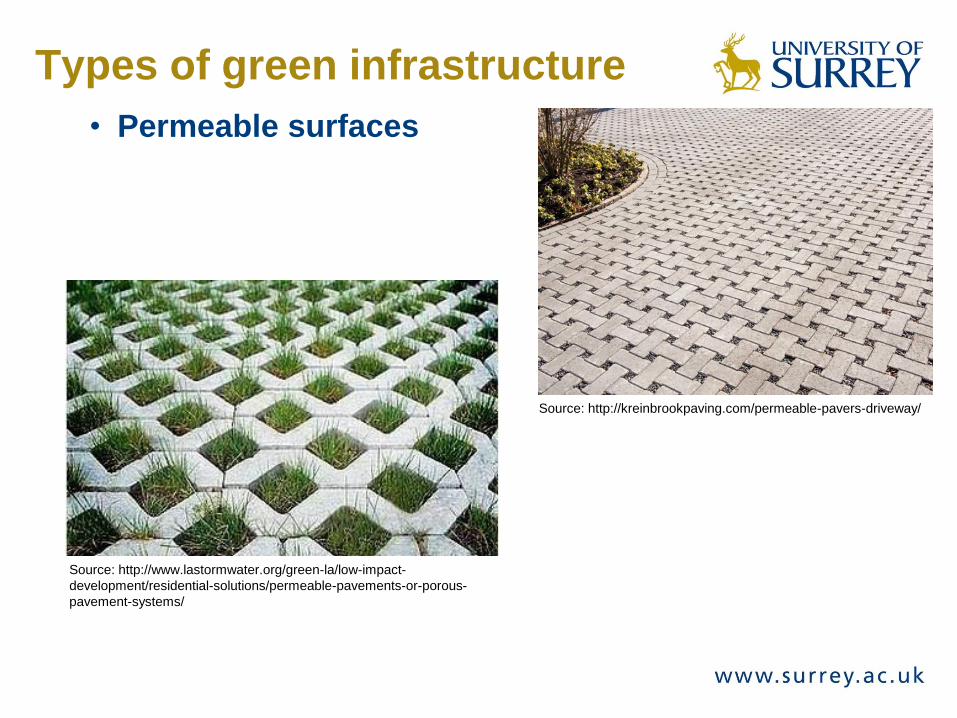
Types of green infrastructure
• Permeable surfaces
Source: http://kreinbrookpaving.com/permeable-pavers-driveway/
Source: http://www.lastormwater.org/green-la/low-impact-
development/residential-solutions/permeable-pavements-or-porous-
pavement-systems/
Benefits: green infrastructure
• Benefits to humans: Wellbeing, quality of life and health
• Filtering of air and water pollution
• Reducing heat island effect
• Health benefits due to enhanced opportunities for
exercise, sport and recreation
• Benefits to ecosystems and landscapes
• Green corridors to improve the permeability of urban
areas to wildlife
• Increased habitat area and connectivity leading to
increased biodiversity & increase in renewable
Natural Capital
Benefits: green infrastructure
• Benefits to society and the economy
• Green infrastructure helps to reconcile economic
growth with maintenance of or increase in renewable
Natural Capital assets
• Temporary and permanent job creation
• Reduced storm water treatment costs
• Increased property values
Economic costs: example green
infrastructure projects
A survey of 94 green infrastructure projects across
Europe showed that:
• Most projects had a budget of between €0.5 and €5
million
• Five very large projects with budgets over €25 million –
one with a budget of €177 million – the UK National
Forest project
• Costs per hectare for projects ranged from €250 to
€942,000 (Naumann et al, 2011)
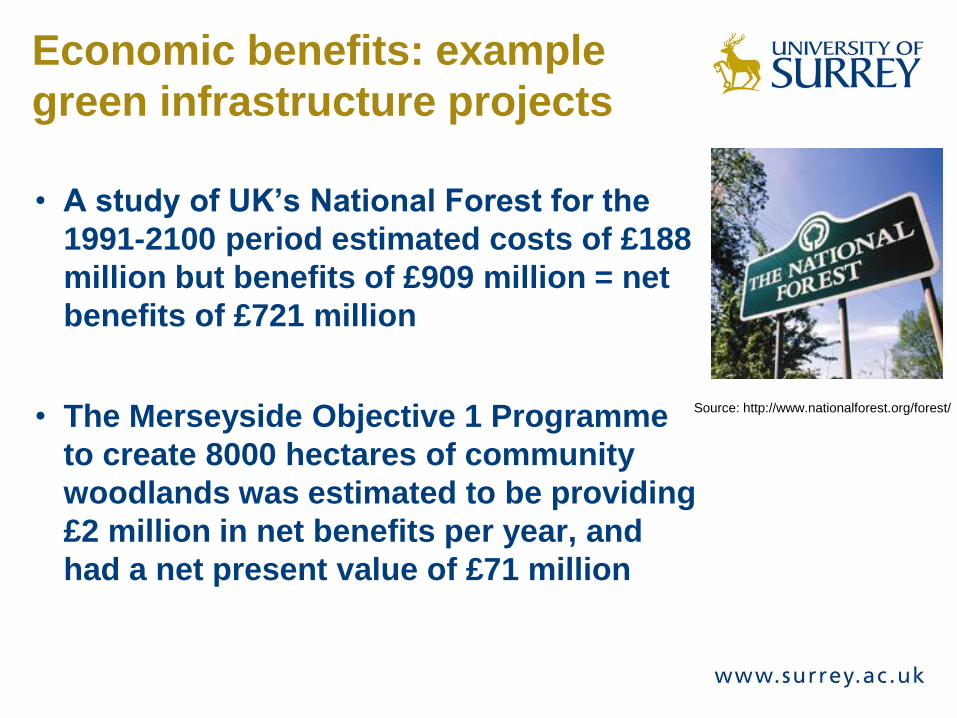
Economic benefits: example
green infrastructure projects
• A study of UK’s National Forest for the
1991-2100 period estimated costs of £188
million but benefits of £909 million = net
benefits of £721 million
• The Merseyside Objective 1 Programme
to create 8000 hectares of community
woodlands was estimated to be providing
£2 million in net benefits per year, and
had a net present value of £71 million
Source: http://www.nationalforest.org/forest/
Tree evapotranspiration & cooling
CES MSc researcher Joe Moss w/ Forest Research
• New research to introduce evapotranspiration
factors for UK species into the i-TREE model for
the benefits assessment of trees (USDA Forest
Service software, see http://www.itreetools.org/).
Has been applied by the Forestry Commission
England to urban tree valuation see
http://www.forestry.gov.uk/london-itree
• Estimate the value of cooling effect of trees in
urban situations
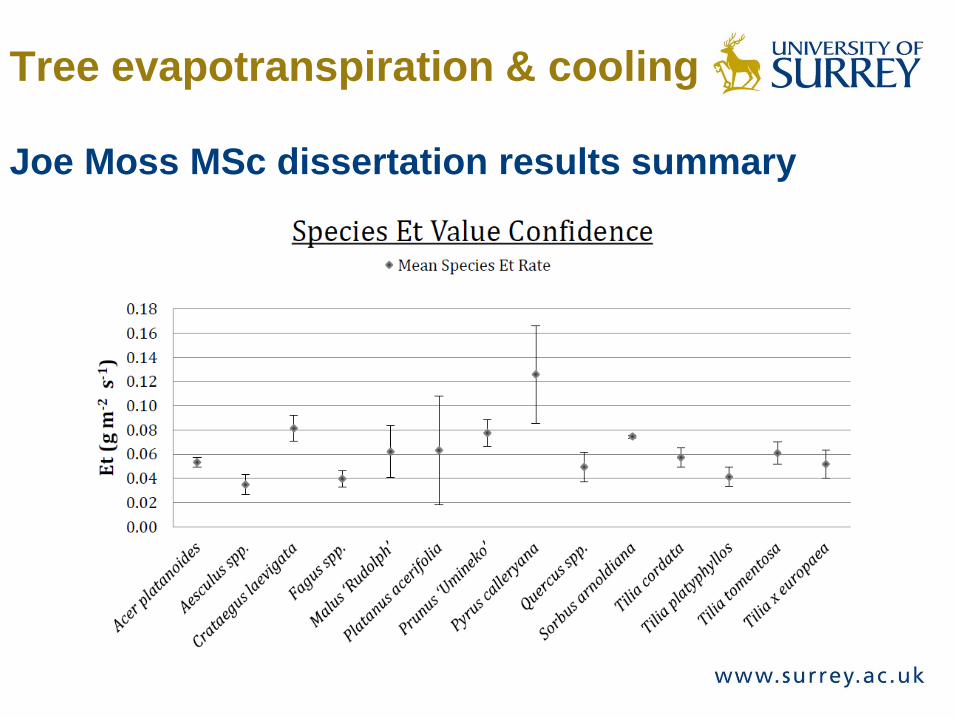
Tree evapotranspiration & cooling
Joe Moss MSc dissertation results summary
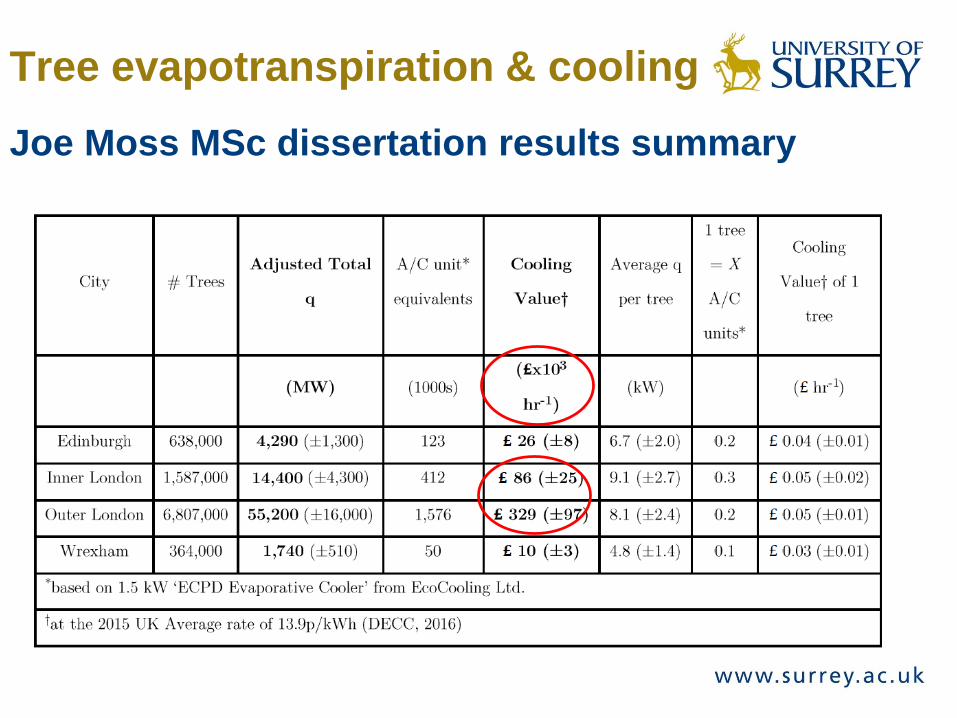
Tree evapotranspiration & cooling
Joe Moss MSc dissertation results summary
Tree evapotranspiration & cooling
• Greater London urban forest evapotranspiration
energy was 139GW, 50% of that is able to
contribute to additional urban cooling (70GW)
• For comparison, total UK electricity demand at
20:30hrs on 25 August 2016 was 36.6GW.
NOTE: these are preliminary results which require
further careful interpretation but which are
indicative of the scale of benefit that examples of
this renewable Natural Capital asset can provide
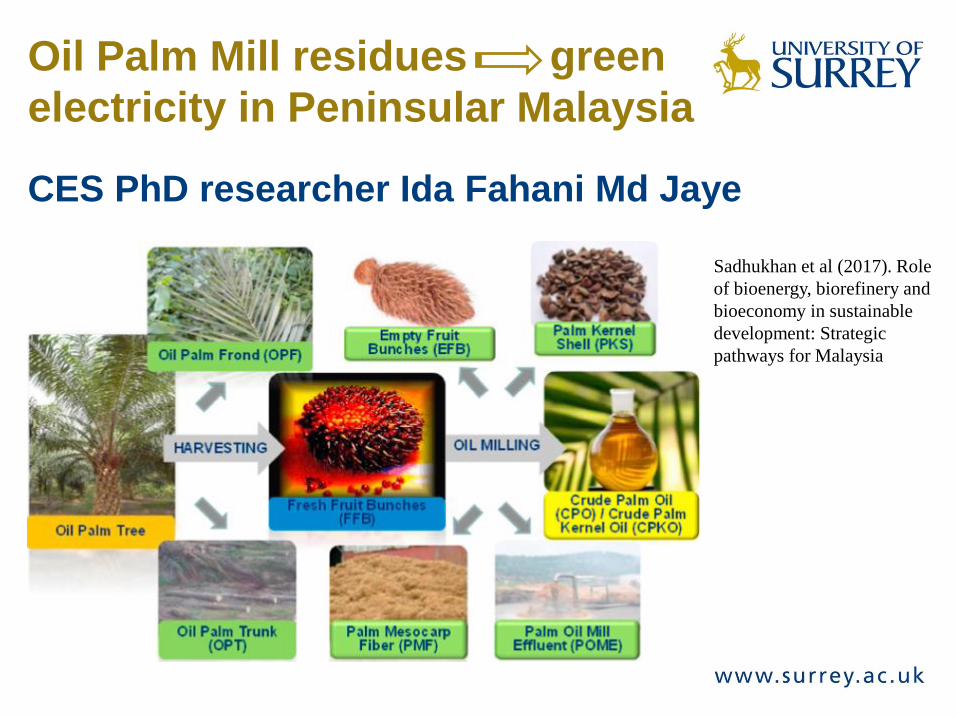
Oil Palm Mill residues green
electricity in Peninsular Malaysia
CES PhD researcher Ida Fahani Md Jaye
Sadhukhan et al (2017). Role
of bioenergy, biorefinery and
bioeconomy in sustainable
development: Strategic
pathways for Malaysia
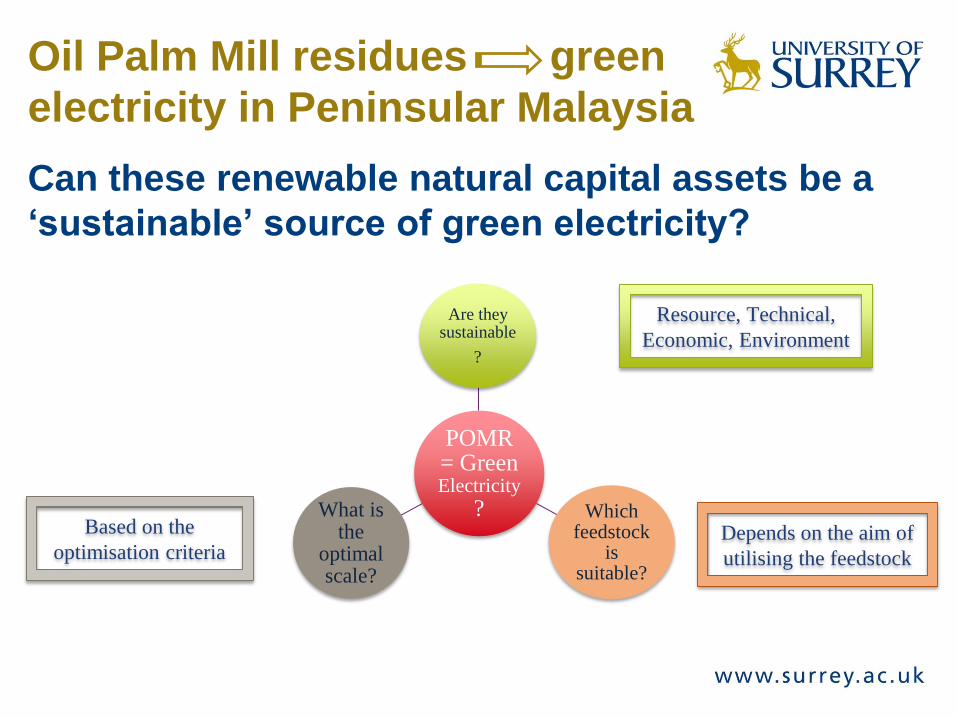
Oil Palm Mill residues green
electricity in Peninsular Malaysia
Can these renewable natural capital assets be a
‘sustainable’ source of green electricity?
POMR= Green Electricity
?
Are they sustainable
?
Which feedstock
is suitable?
What is the
optimal scale?
Resource, Technical,
Economic, Environment
Depends on the aim of
utilising the feedstock
Based on the
optimisation criteria
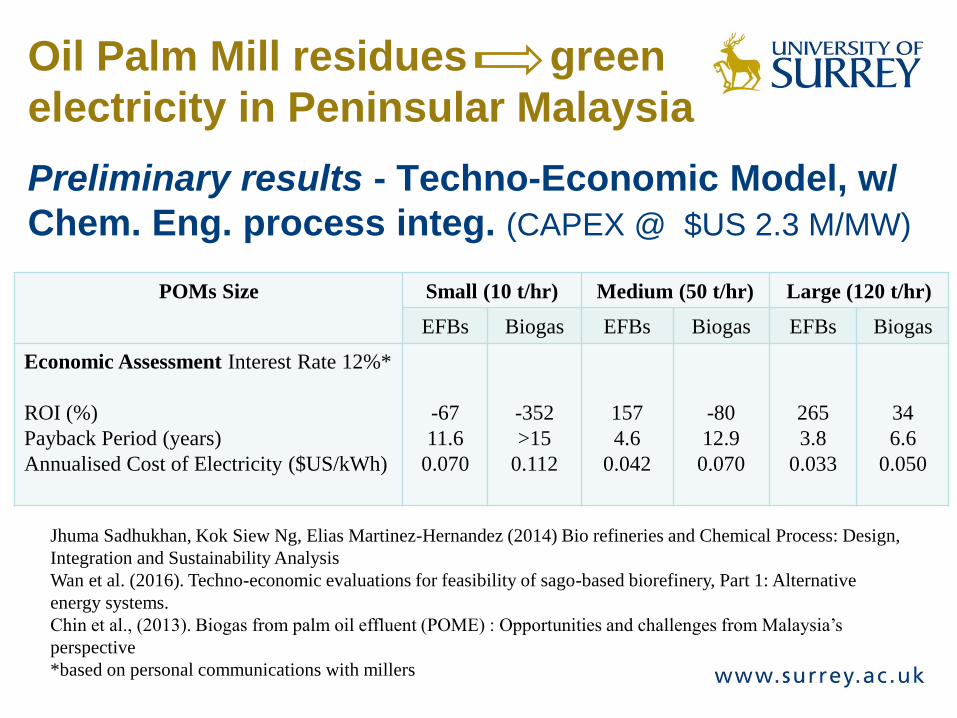
Oil Palm Mill residues green
electricity in Peninsular Malaysia
Preliminary results - Techno-Economic Model, w/
Chem. Eng. process integ. (CAPEX @ $US 2.3 M/MW)
Jhuma Sadhukhan, Kok Siew Ng, Elias Martinez-Hernandez (2014) Bio refineries and Chemical Process: Design,
Integration and Sustainability Analysis
Wan et al. (2016). Techno-economic evaluations for feasibility of sago-based biorefinery, Part 1: Alternative
energy systems.
Chin et al., (2013). Biogas from palm oil effluent (POME) : Opportunities and challenges from Malaysia’s
perspective
*based on personal communications with millers
POMs Size Small (10 t/hr) Medium (50 t/hr) Large (120 t/hr)
EFBs Biogas EFBs Biogas EFBs Biogas
Economic Assessment Interest Rate 12%*
ROI (%)
Payback Period (years)
Annualised Cost of Electricity ($US/kWh)
-67
11.6
0.070
-352
>15
0.112
157
4.6
0.042
-80
12.9
0.070
265
3.8
0.033
34
6.6
0.050
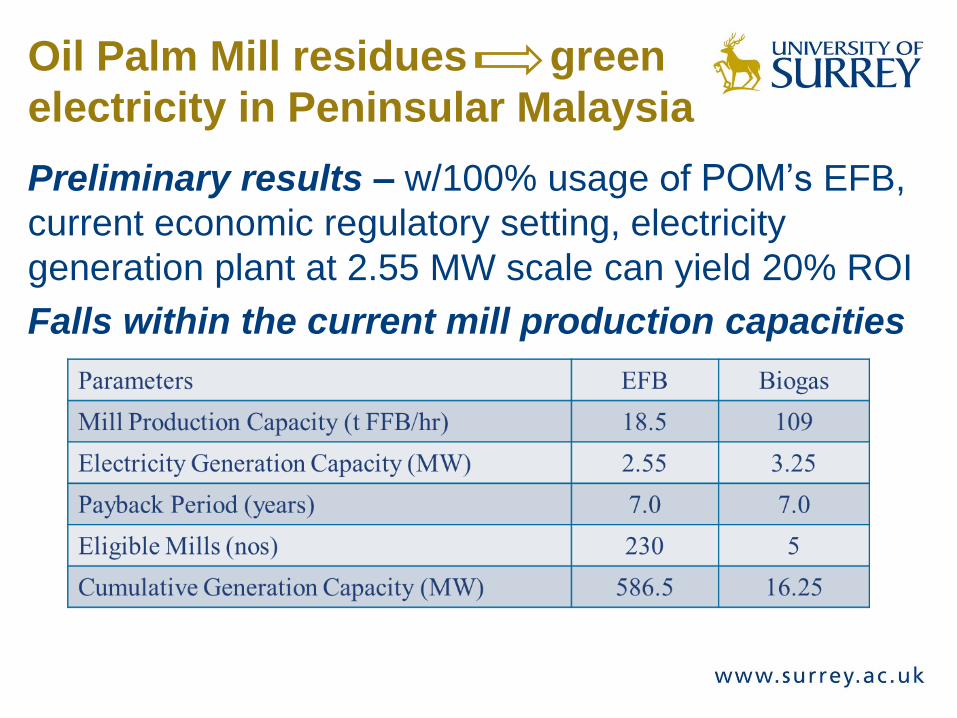
Oil Palm Mill residues green
electricity in Peninsular Malaysia
Preliminary results – w/100% usage of POM’s EFB,
current economic regulatory setting, electricity
generation plant at 2.55 MW scale can yield 20% ROI
Falls within the current mill production capacities
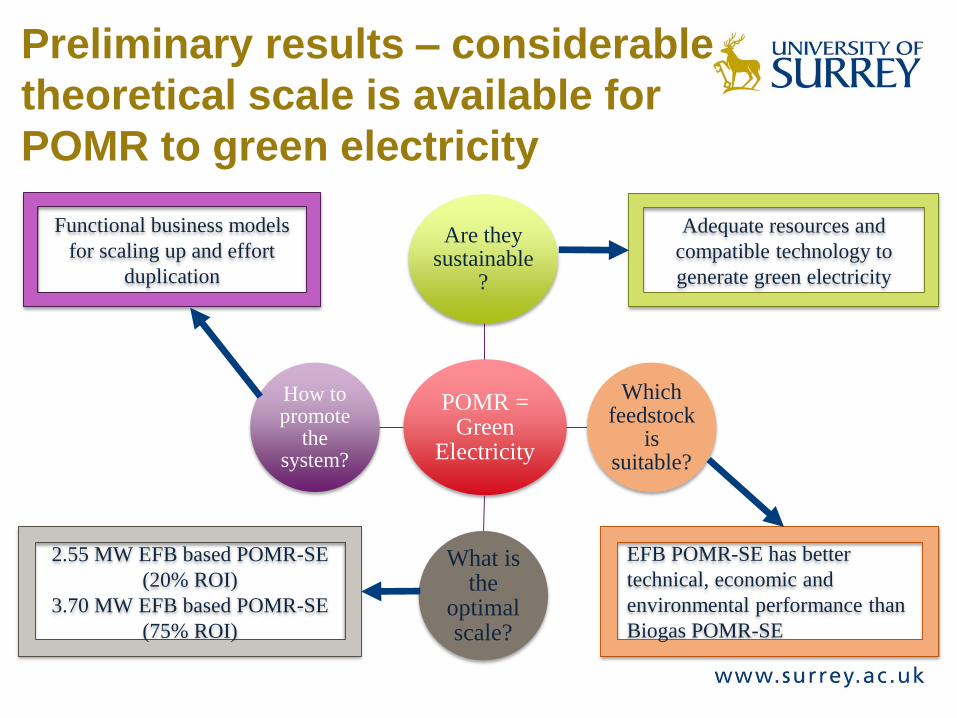
Preliminary results – considerable
theoretical scale is available for
POMR to green electricity
POMR =Green
Electricity
Are they sustainable
?
Which feedstock
is suitable?
What is the
optimal scale?
How to promote
the system?
Adequate resources and
compatible technology to
generate green electricity
EFB POMR-SE has better
technical, economic and
environmental performance than
Biogas POMR-SE
2.55 MW EFB based POMR-SE
(20% ROI)
3.70 MW EFB based POMR-SE
(75% ROI)
Functional business models
for scaling up and effort
duplication
• We need to measure and sustain renewable
Natural Capital assets in our development –
this will require new tools, thinking and
knowledge in planning, design and policy
• How we think about and use
Natural Capital assets is
essential if we are to progress
towards the UN’s Sustainable
Development Goals
Closing Remarks
you will be most welcome to visit us at The University of Surrey and the Centre for Environment & Sustainability