Embed Size (px)
DESCRIPTION
Briefing to Portfolio Committee on 3 rd Quarter Report – 2010/11. Nosipho Ngcaba Director-General Departmental of Environmental Affairs 25-26 January 2011. Presentation Outline. Departmental Expenditure per quarter for the 2010/2011 financial year - PowerPoint PPT Presentation
Citation preview
Briefing to Portfolio Committee on 3rd Quarter Report – 2010/11
Nosipho NgcabaDirector-GeneralDepartmental of Environmental Affairs25-26 January 2011
Presentation Outline
- Departmental Expenditure per quarter for the 2010/2011 financial year
- Departmental Expenditure to the third quarter of the 2010/2011 Financial Year
- Reprioritizations of the Budget- Donor Funding Expenditure- MTEF Allocations and Baseline Adjustments- Challenges over the MTEF
2
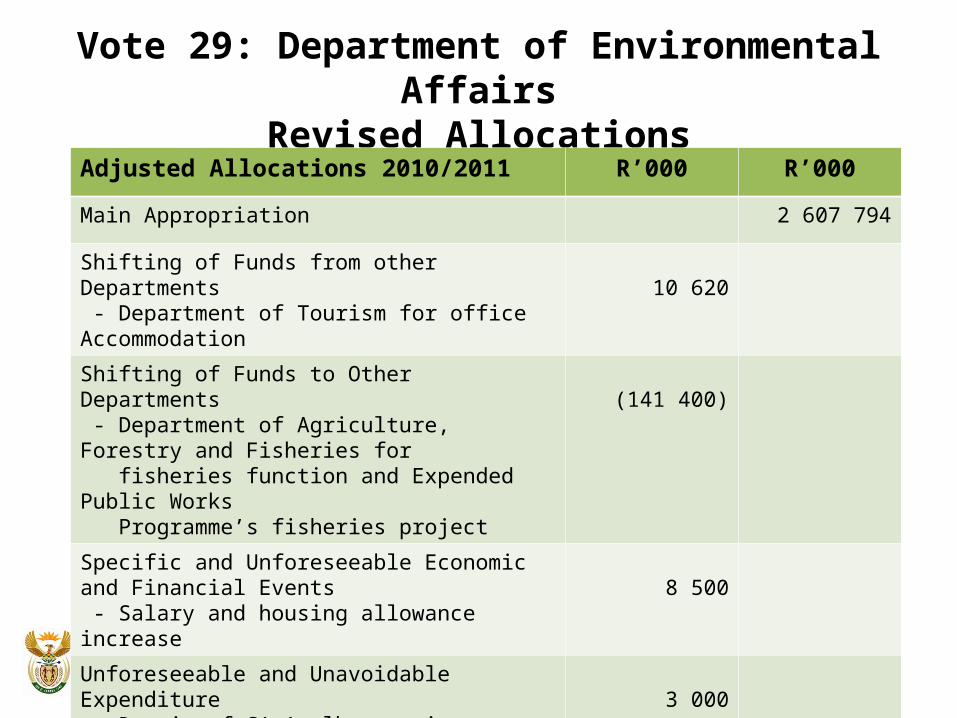
Vote 29: Department of Environmental AffairsRevised Allocations
3
Adjusted Allocations 2010/2011 R’000 R’000
Main Appropriation 2 607 794
Shifting of Funds from other Departments - Department of Tourism for office Accommodation 10 620
Shifting of Funds to Other Departments - Department of Agriculture, Forestry and Fisheries for fisheries function and Expended Public Works Programme’s fisheries project
(141 400)
Specific and Unforeseeable Economic and Financial Events - Salary and housing allowance increase
8 500
Unforeseeable and Unavoidable Expenditure - Repair of SA Agulhas engine 3 000
Adjusted Appropriation 2 488 514
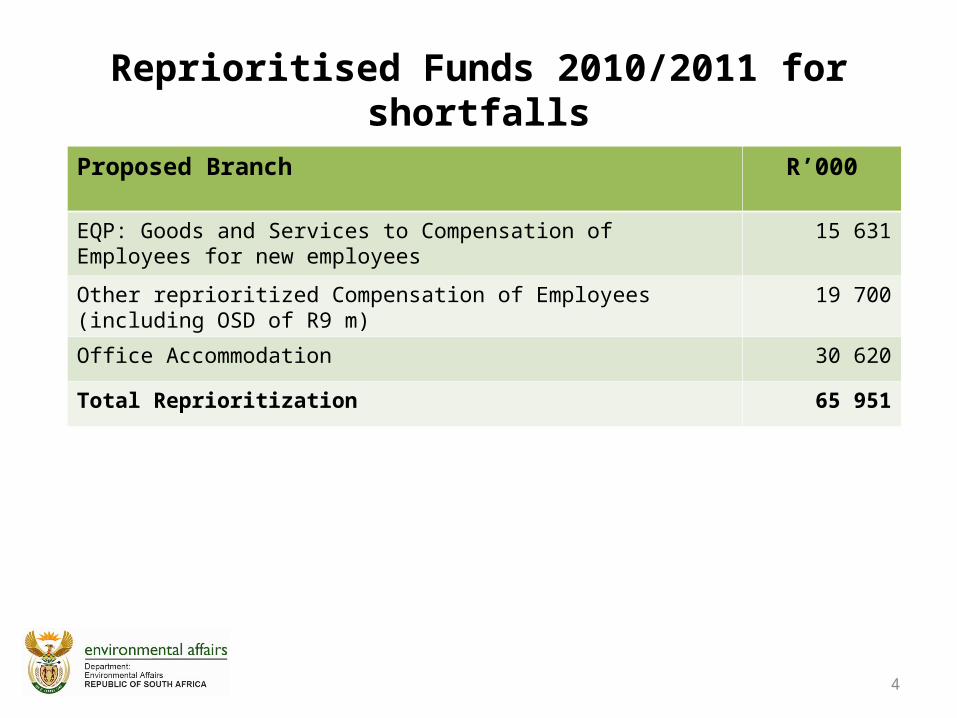
Reprioritised Funds 2010/2011 for shortfalls
4
Proposed Branch R’000
EQP: Goods and Services to Compensation of Employees for new employees
15 631
Other reprioritized Compensation of Employees (including OSD of R9 m) 19 700
Office Accommodation 30 620
Total Reprioritization 65 951
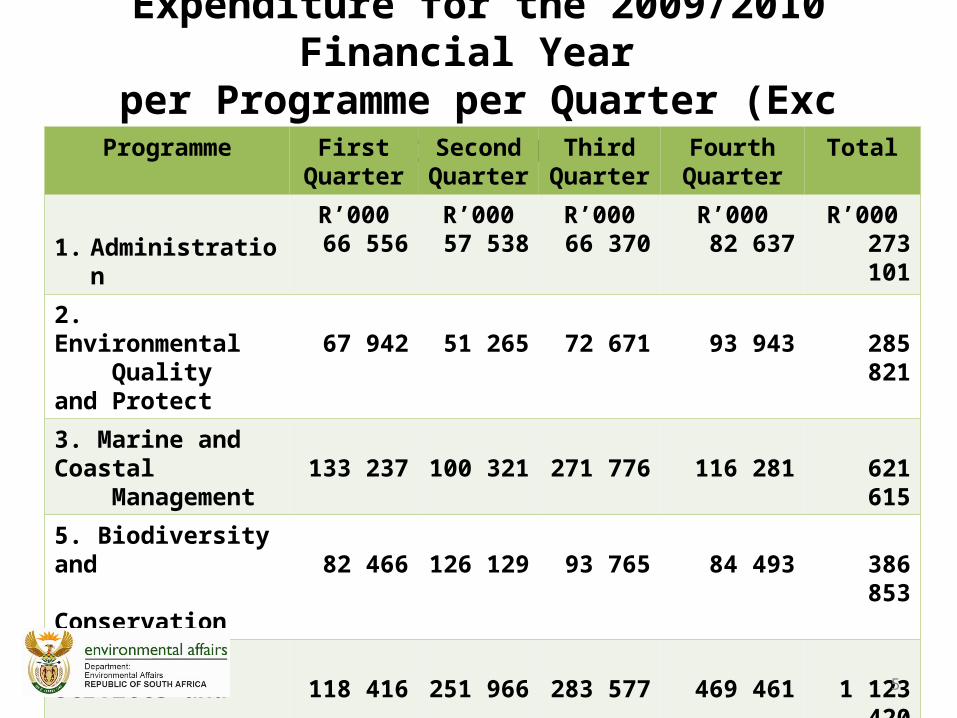
Expenditure for the 2009/2010 Financial Year per Programme per Quarter (Exc Tourism)
Programme FirstQuarter
SecondQuarter
ThirdQuarter
FourthQuarter
Total
1. AdministrationR’000
66 556R’000
57 538R’000
66 370R’000
82 637R’000273 101
2. Environmental Quality and Protect 67 942 51 265 72 671 93 943 285 821
3. Marine and Coastal Management 133 237 100 321 271 776 116 281 621 615
5. Biodiversity and Conservation 82 466 126 129 93 765 84 493 386 853
6. Sector Services and International Relat 118 416 251 966 283 577 469 461 1 123 420
Total 468 617 587 219 788 159 846 815 2 690 810
17% 22% 29% 32%
5
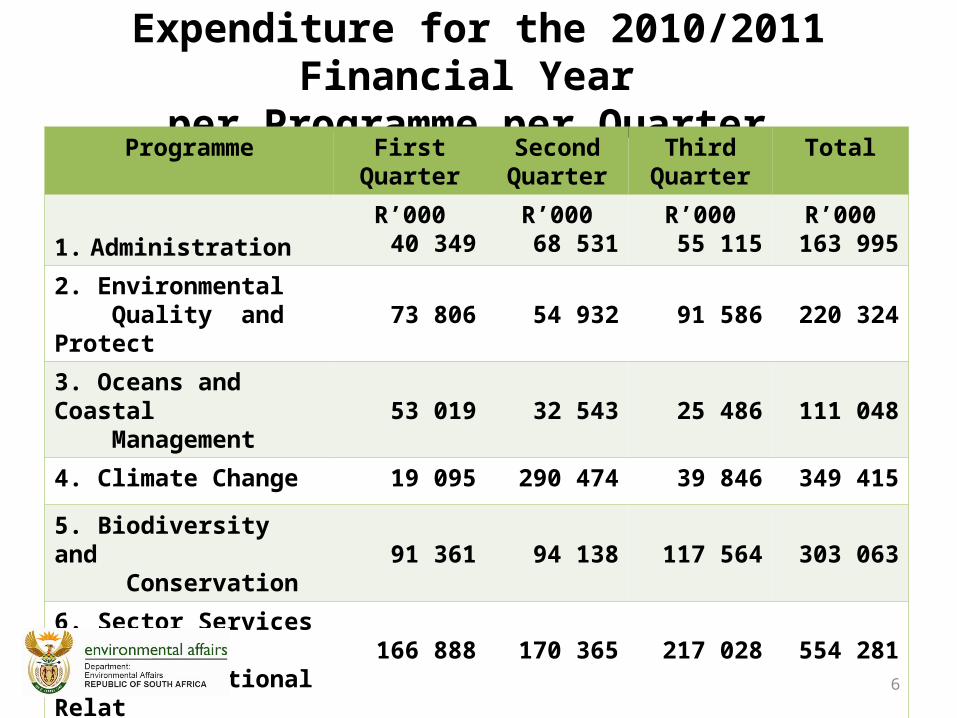
Expenditure for the 2010/2011 Financial Year per Programme per Quarter
Programme FirstQuarter
SecondQuarter
ThirdQuarter
Total
1. AdministrationR’000
40 349R’000
68 531R’000
55 115R’000163 995
2. Environmental Quality and Protect 73 806 54 932 91 586 220 324
3. Oceans and Coastal Management 53 019 32 543 25 486 111 048
4. Climate Change 19 095 290 474 39 846 349 415
5. Biodiversity and Conservation 91 361 94 138 117 564 303 063
6. Sector Services and International Relat 166 888 170 365 217 028 554 281
Total 444 518 710 983 546 625 1702 126
18% 29% 22%6
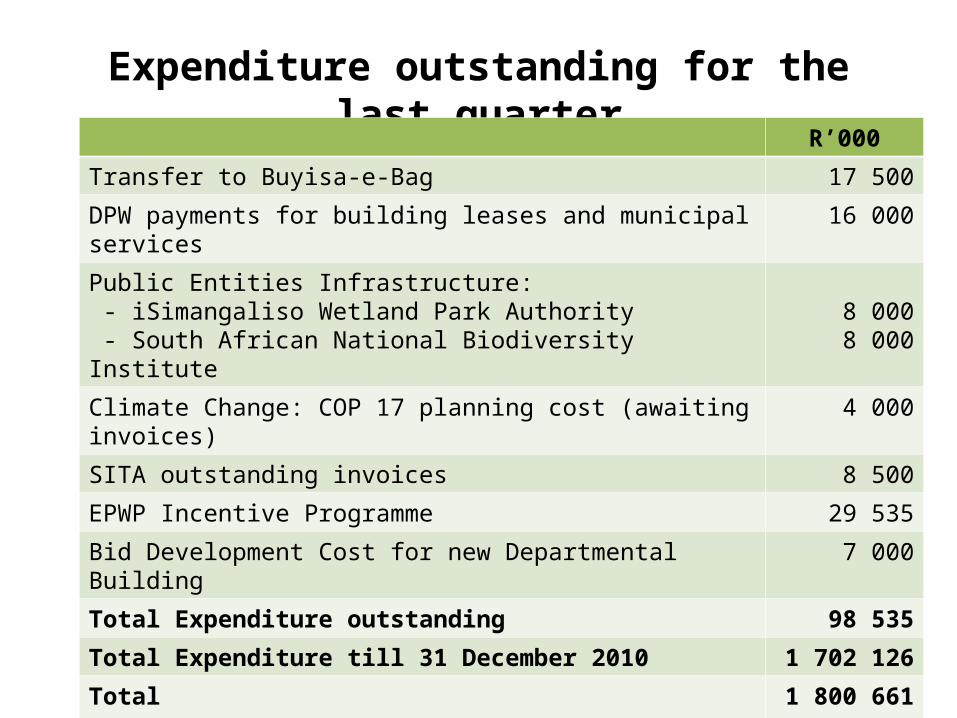
Expenditure outstanding for the last quarter
7
R’000
Transfer to Buyisa-e-Bag 17 500
DPW payments for building leases and municipal services 16 000
Public Entities Infrastructure: - iSimangaliso Wetland Park Authority - South African National Biodiversity Institute
8 0008 000
Climate Change: COP 17 planning cost (awaiting invoices) 4 000
SITA outstanding invoices 8 500
EPWP Incentive Programme 29 535
Bid Development Cost for new Departmental Building 7 000
Total Expenditure outstanding 98 535
Total Expenditure till 31 December 2010 1 702 126
Total (72%) 1 800 661
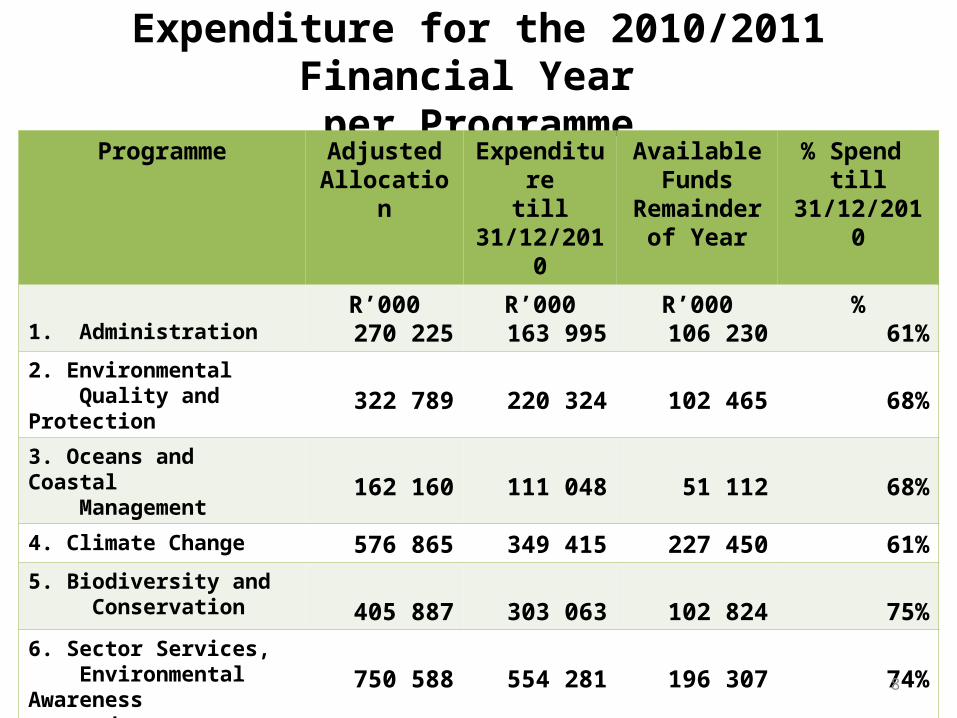
Expenditure for the 2010/2011 Financial Year per Programme
Programme Adjusted Allocation
Expendituretill
31/12/2010
Available Funds
Remainder of Year
% Spend till
31/12/2010
1. AdministrationR’000
270 225R’000
163 995R’000
106 230%
61%2. Environmental Quality and Protection 322 789 220 324 102 465 68%3. Oceans and Coastal Management 162 160 111 048 51 112 68%4. Climate Change 576 865 349 415 227 450 61%5. Biodiversity and Conservation 405 887 303 063 102 824 75%6. Sector Services, Environmental Awareness and International Relations
750 588 554 281 196 307 74%
Total 2 488 514 1 702 126 786 388 68%8
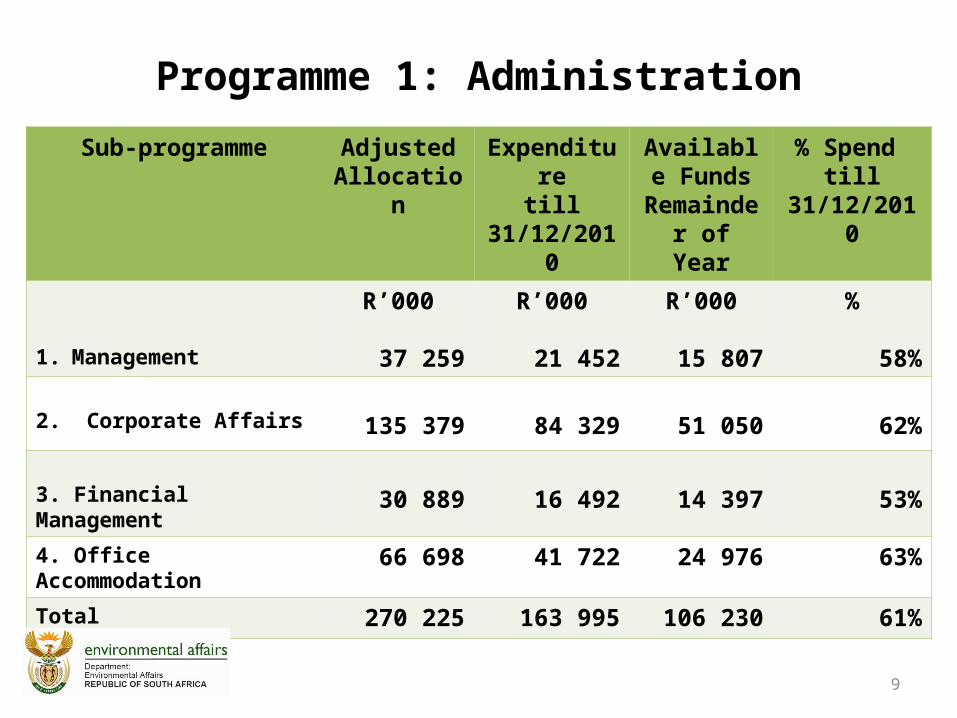
Programme 1: Administration
Sub-programme Adjusted Allocation
Expendituretill
31/12/2010
Available Funds
Remainder of Year
% Spend till
31/12/2010
1. Management
R’000
37 259
R’000
21 452
R’000
15 807
%
58%
2. Corporate Affairs 135 379 84 329 51 050 62%
3. Financial Management 30 889 16 492 14 397 53%
4. Office Accommodation 66 698 41 722 24 976 63%
Total 270 225 163 995 106 230 61%
9
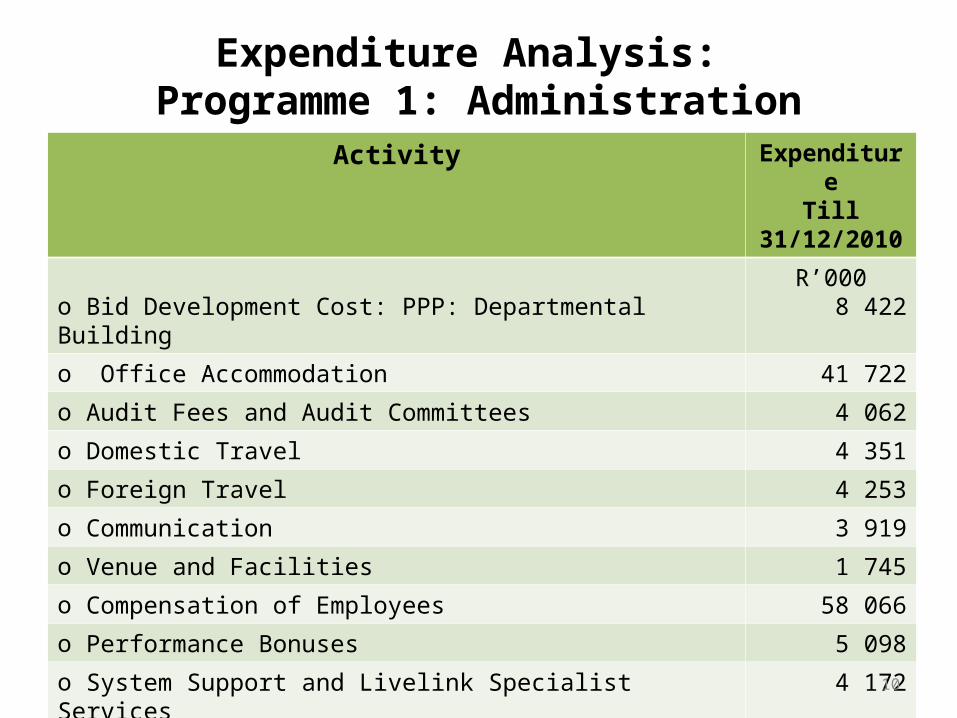
Expenditure Analysis: Programme 1: Administration
Activity ExpenditureTill
31/12/2010
o Bid Development Cost: PPP: Departmental BuildingR’000
8 422o Office Accommodation 41 722o Audit Fees and Audit Committees 4 062o Domestic Travel 4 351o Foreign Travel 4 253o Communication 3 919o Venue and Facilities 1 745o Compensation of Employees 58 066o Performance Bonuses 5 098o System Support and Livelink Specialist Services 4 172o Training and Staff Development 1 732
10
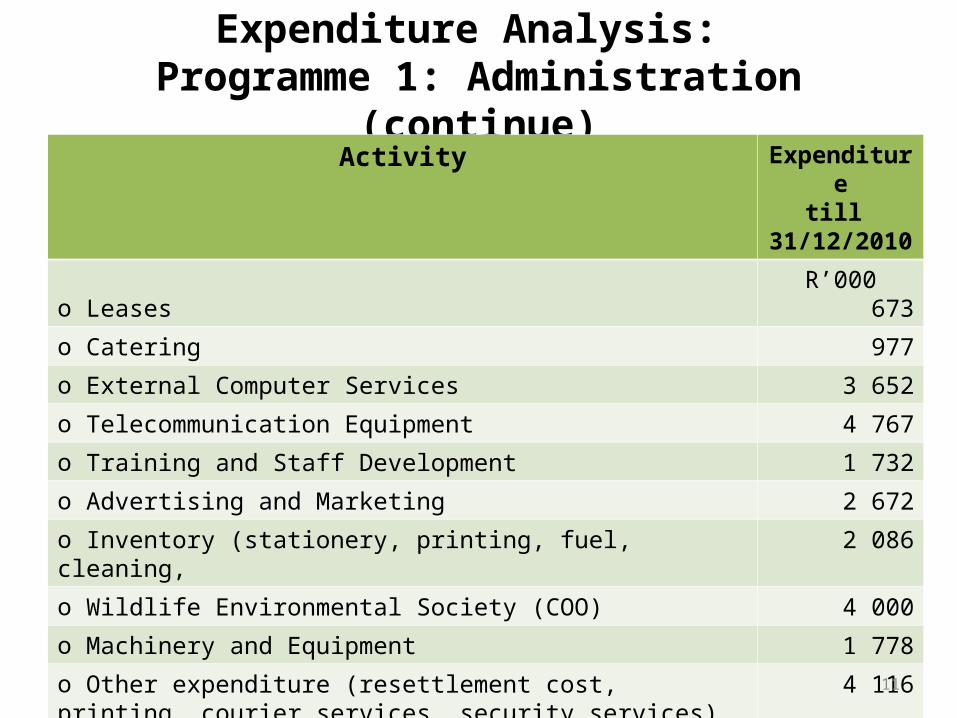
Expenditure Analysis: Programme 1: Administration (continue)
Activity Expendituretill
31/12/2010
o LeasesR’000
673o Catering 977o External Computer Services 3 652o Telecommunication Equipment 4 767o Training and Staff Development 1 732o Advertising and Marketing 2 672o Inventory (stationery, printing, fuel, cleaning, 2 086o Wildlife Environmental Society (COO) 4 000o Machinery and Equipment 1 778o Other expenditure (resettlement cost, printing, courier services, security services)
4 116
Total 163 99511
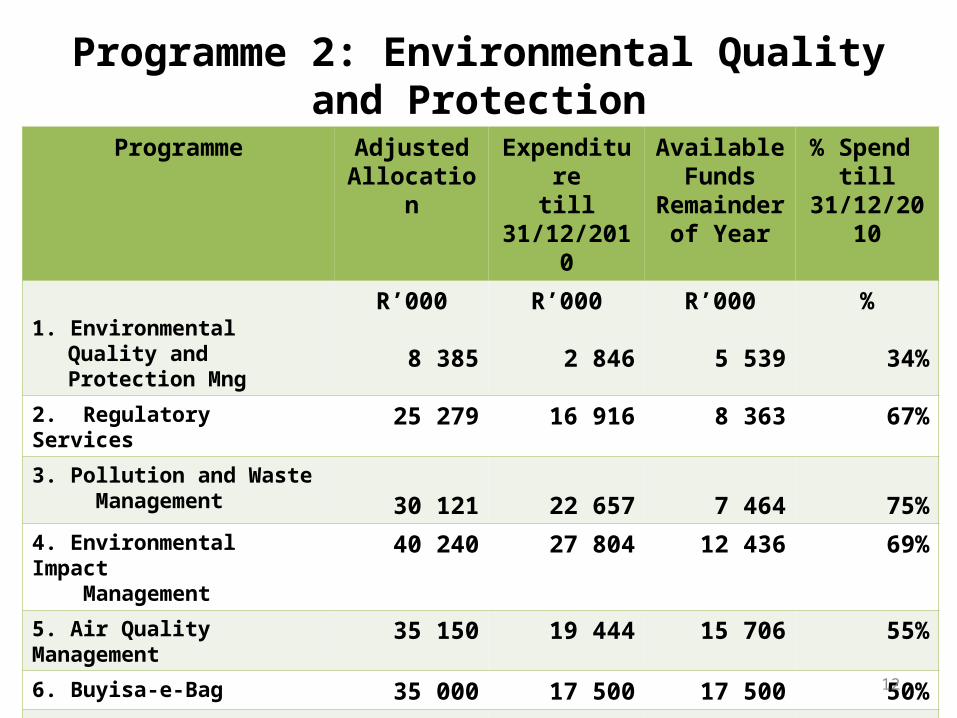
Programme 2: Environmental Quality and Protection
Programme Adjusted Allocation
Expendituretill
31/12/2010
Available Funds
Remainder of Year
% Spend till
31/12/2010
1. Environmental Quality and Protection Mng
R’000
8 385
R’000
2 846
R’000
5 539
%
34%2. Regulatory Services 25 279 16 916 8 363 67%3. Pollution and Waste Management 30 121 22 657 7 464 75%4. Environmental Impact Management
40 240 27 804 12 436 69%
5. Air Quality Management 35 150 19 444 15 706 55%6. Buyisa-e-Bag 35 000 17 500 17 500 50%7. South African Weather Service
148 614 113 157 35 457 76%
Total 322 789 220 324 102 465 68%12
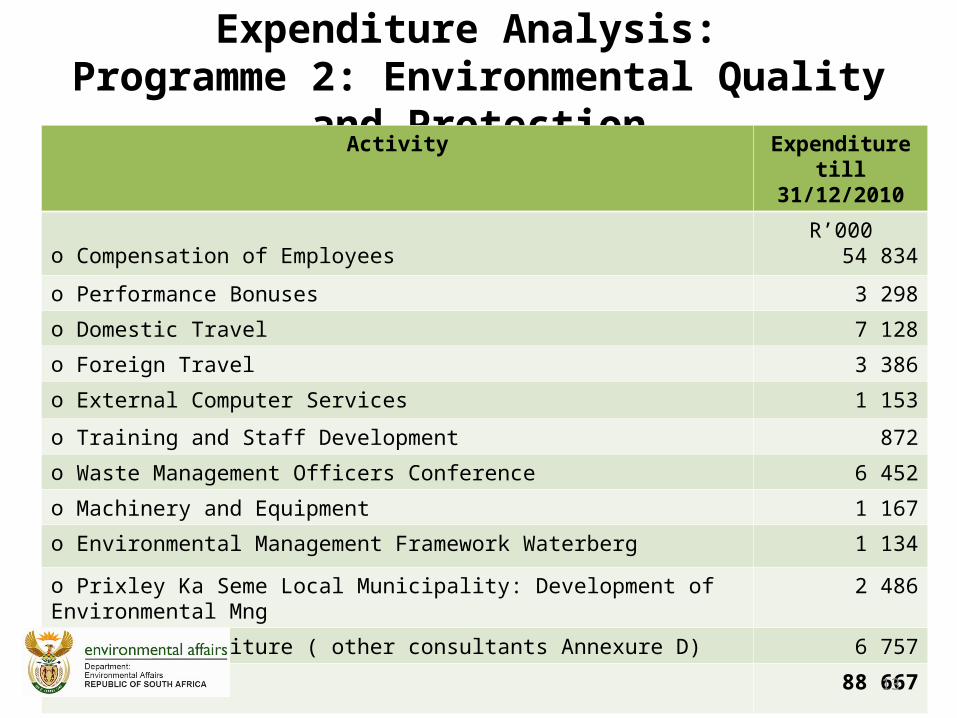
Expenditure Analysis: Programme 2: Environmental Quality and Protection
Activity Expendituretill
31/12/2010
o Compensation of EmployeesR’000
54 834
o Performance Bonuses 3 298
o Domestic Travel 7 128
o Foreign Travel 3 386
o External Computer Services 1 153
o Training and Staff Development 872
o Waste Management Officers Conference 6 452
o Machinery and Equipment 1 167
o Environmental Management Framework Waterberg 1 134
o Prixley Ka Seme Local Municipality: Development of Environmental Mng 2 486
o Other expenditure ( other consultants Annexure D) 6 757
Total 88 66713
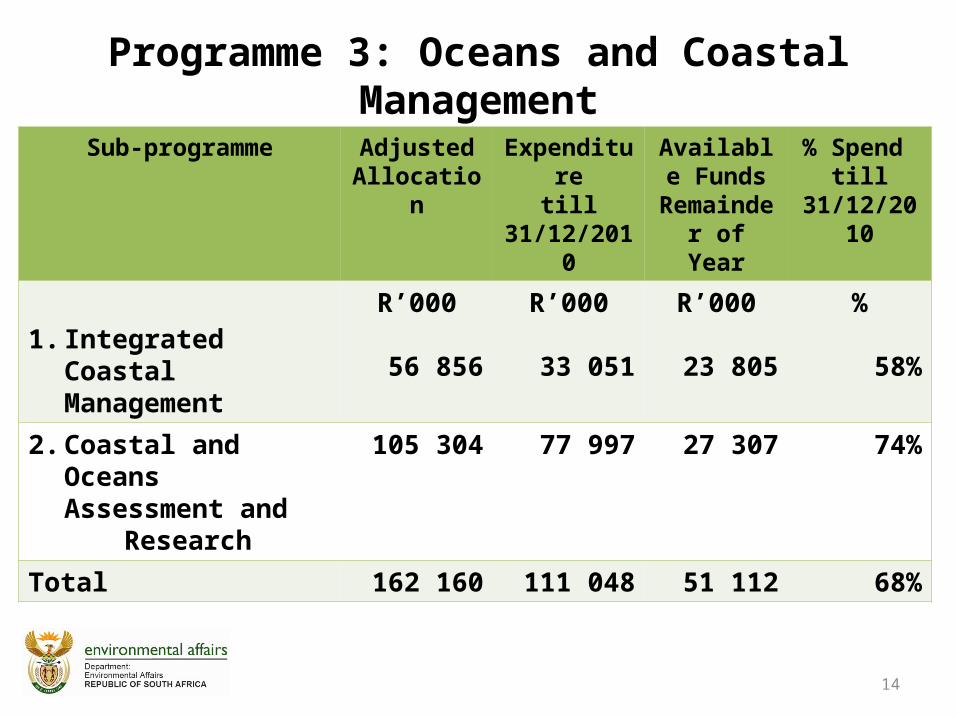
Programme 3: Oceans and Coastal Management
Sub-programme Adjusted Allocation
Expendituretill
31/12/2010
Available Funds
Remainder of Year
% Spend till
31/12/2010
1. Integrated Coastal Management
R’000
56 856
R’000
33 051
R’000
23 805
%
58%
2. Coastal and Oceans Assessment and
Research
105 304 77 997 27 307 74%
Total 162 160 111 048 51 112 68%
14
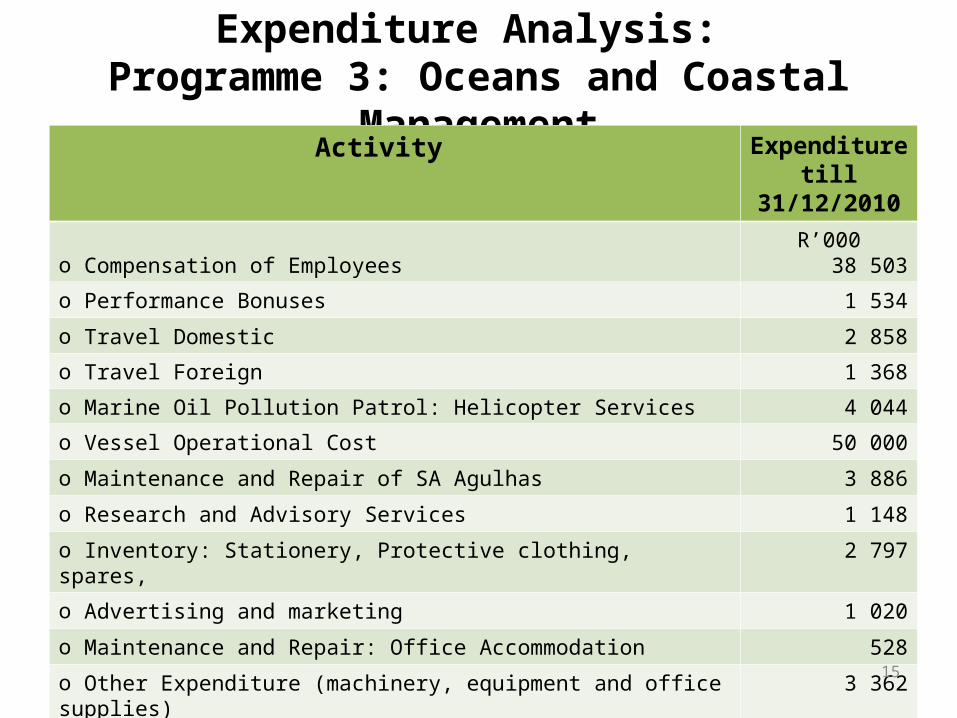
Expenditure Analysis: Programme 3: Oceans and Coastal Management
Activity Expendituretill
31/12/2010
o Compensation of Employees R’000
38 503
o Performance Bonuses 1 534
o Travel Domestic 2 858
o Travel Foreign 1 368
o Marine Oil Pollution Patrol: Helicopter Services 4 044
o Vessel Operational Cost 50 000
o Maintenance and Repair of SA Agulhas 3 886
o Research and Advisory Services 1 148
o Inventory: Stationery, Protective clothing, spares, 2 797
o Advertising and marketing 1 020
o Maintenance and Repair: Office Accommodation 528
o Other Expenditure (machinery, equipment and office supplies) 3 362
Total 111 04815
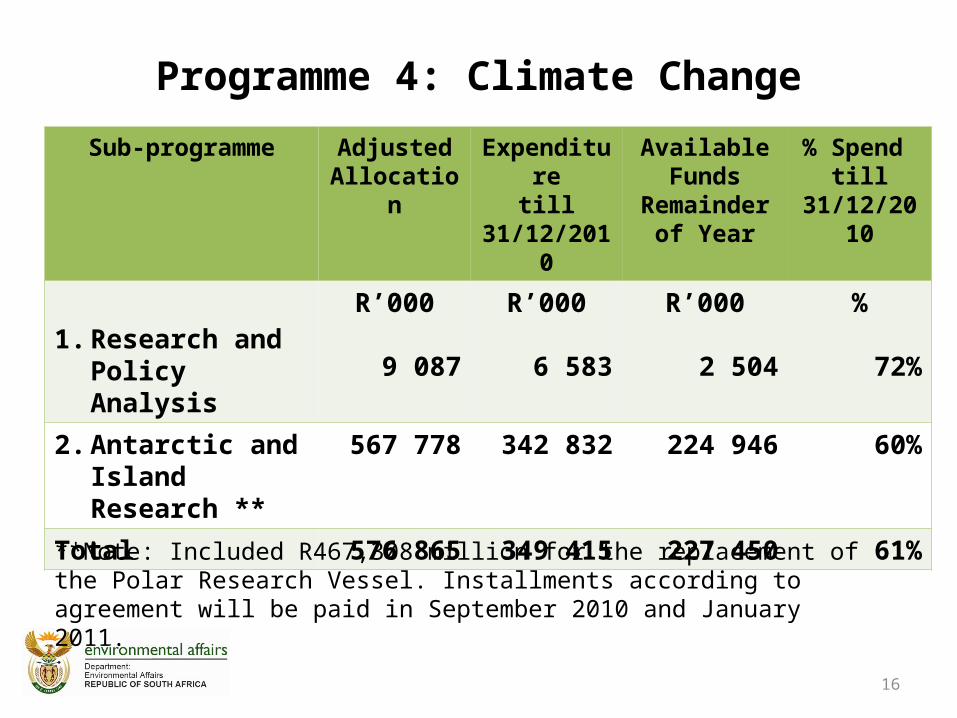
Programme 4: Climate Change
Sub-programme Adjusted Allocation
Expendituretill
31/12/2010
Available Funds
Remainder of Year
% Spend till
31/12/2010
1. Research and Policy Analysis
R’000
9 087
R’000
6 583
R’000
2 504
%
72%
2. Antarctic and Island Research **
567 778 342 832 224 946 60%
Total 576 865 349 415 227 450 61%
16
**Note: Included R467,308 million for the replacement of the Polar Research Vessel. Installments according to agreement will be paid in September 2010 and January 2011.
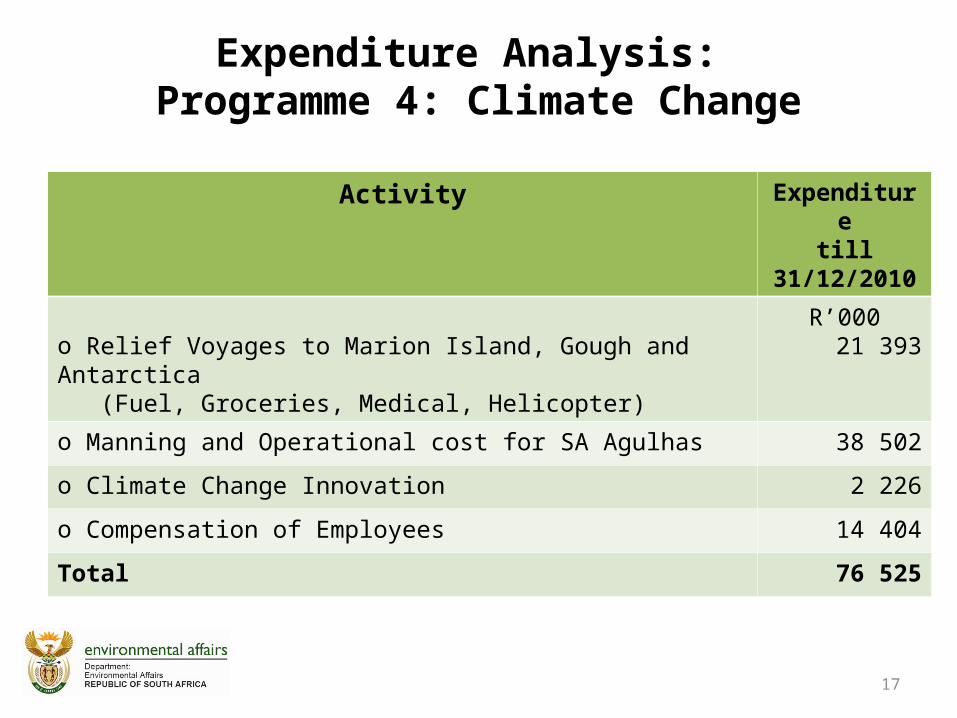
Expenditure Analysis: Programme 4: Climate Change
Activity Expendituretill
31/12/2010
o Relief Voyages to Marion Island, Gough and Antarctica (Fuel, Groceries, Medical, Helicopter)
R’00021 393
o Manning and Operational cost for SA Agulhas 38 502
o Climate Change Innovation 2 226
o Compensation of Employees 14 404
Total 76 525
17
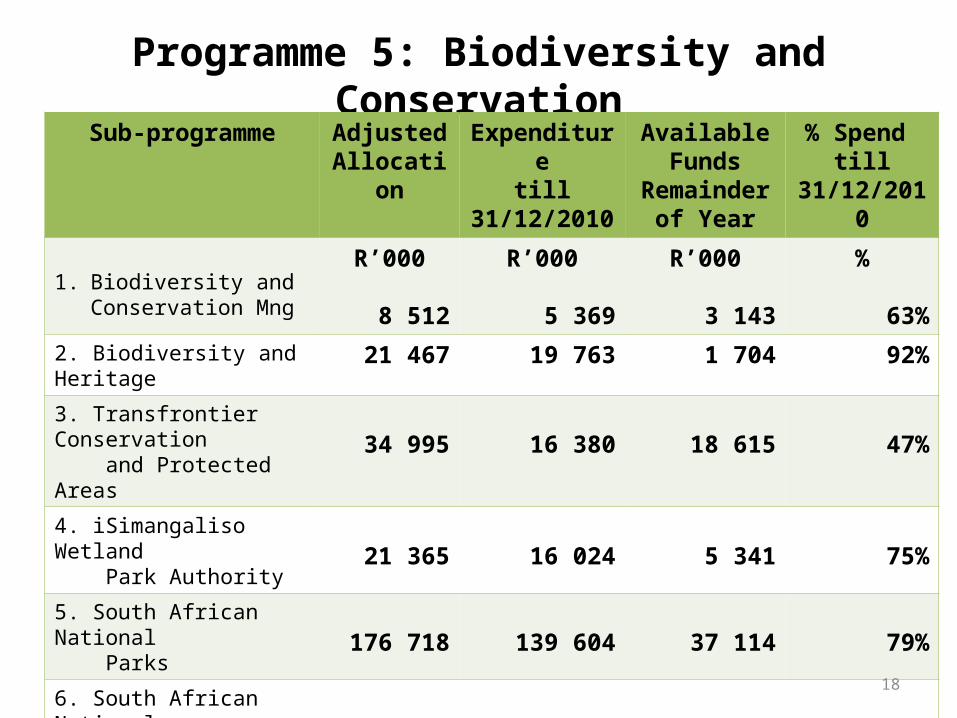
Programme 5: Biodiversity and ConservationSub-programme Adjusted
AllocationExpenditure
till31/12/2010
Available Funds
Remainder of Year
% Spend till
31/12/2010
1. Biodiversity and Conservation Mng
R’000
8 512
R’000
5 369
R’000
3 143
%
63%2. Biodiversity and Heritage 21 467 19 763 1 704 92%
3. Transfrontier Conservation and Protected Areas
34 995 16 380 18 615 47%
4. iSimangaliso Wetland Park Authority 21 365 16 024 5 341 75%5. South African National Parks 176 718 139 604 37 114 79%6. South African National Biodiversity Institute 142 830 105 923 36 907 74%Total 405 887 303 063 102 824 75%18
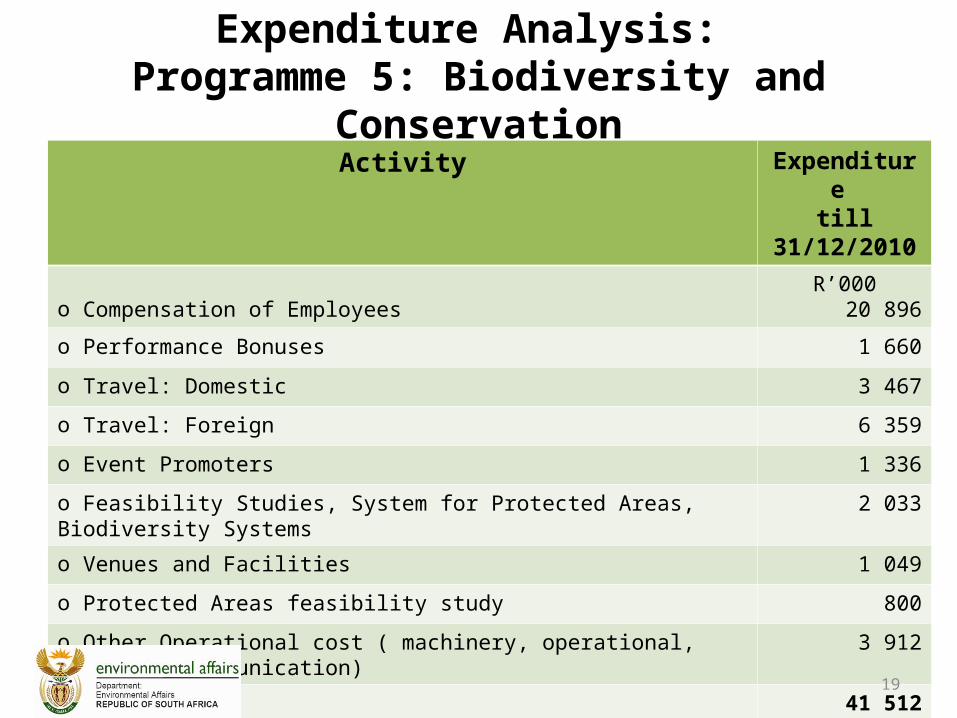
Expenditure Analysis: Programme 5: Biodiversity and Conservation
Activity Expenditure till
31/12/2010
o Compensation of EmployeesR’000
20 896
o Performance Bonuses 1 660
o Travel: Domestic 3 467
o Travel: Foreign 6 359
o Event Promoters 1 336
o Feasibility Studies, System for Protected Areas, Biodiversity Systems 2 033
o Venues and Facilities 1 049
o Protected Areas feasibility study 800
o Other Operational cost ( machinery, operational, printing, communication) 3 912
Total 41 512
19
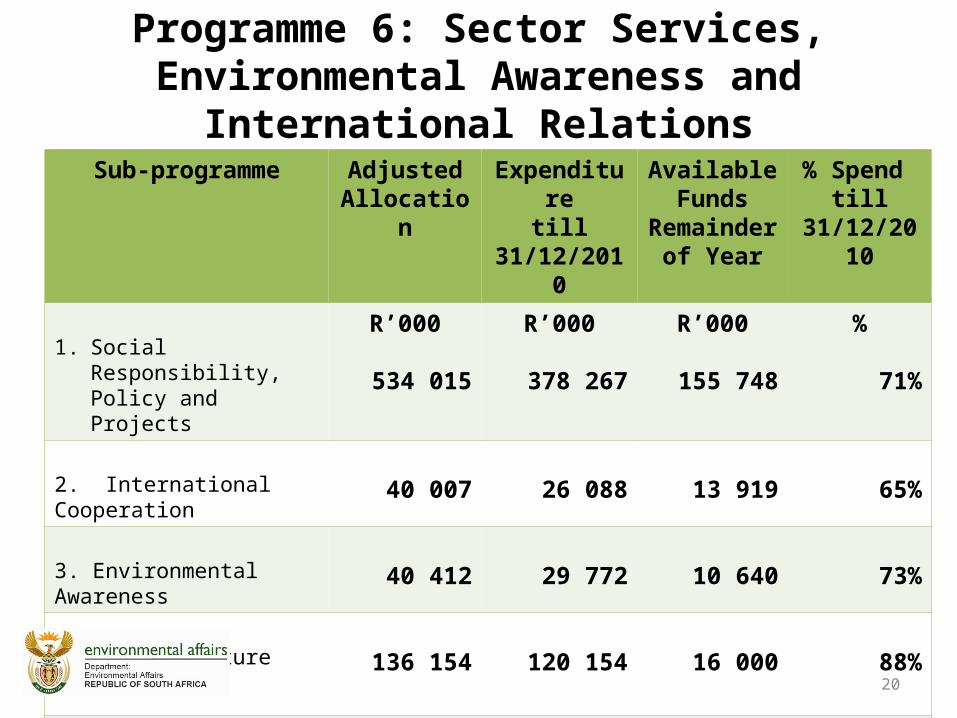
Programme 6: Sector Services, Environmental Awareness and International Relations
Sub-programme Adjusted Allocation
Expendituretill
31/12/2010
Available Funds
Remainder of Year
% Spend till
31/12/2010
1. Social Responsibility, Policy and Projects
R’000
534 015
R’000
378 267
R’000
155 748
%
71%
2. International Cooperation 40 007 26 088 13 919 65%
3. Environmental Awareness 40 412 29 772 10 640 73%
4. Infrastructure Investment 136 154 120 154 16 000 88%
Total 750 588 554 281 196 307 74%20
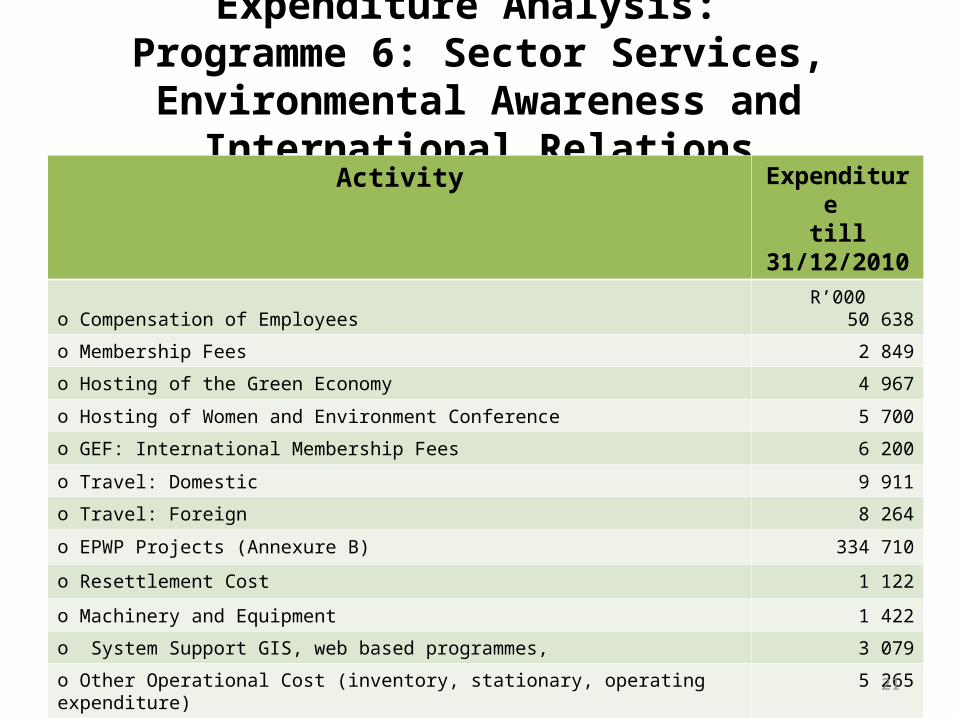
Expenditure Analysis: Programme 6: Sector Services, Environmental
Awareness and International RelationsActivity Expenditure
till31/12/2010
o Compensation of EmployeesR’000
50 638
o Membership Fees 2 849
o Hosting of the Green Economy 4 967
o Hosting of Women and Environment Conference 5 700
o GEF: International Membership Fees 6 200
o Travel: Domestic 9 911
o Travel: Foreign 8 264
o EPWP Projects (Annexure B) 334 710
o Resettlement Cost 1 122
o Machinery and Equipment 1 422
o System Support GIS, web based programmes, 3 079
o Other Operational Cost (inventory, stationary, operating expenditure) 5 265
Total 434 12721
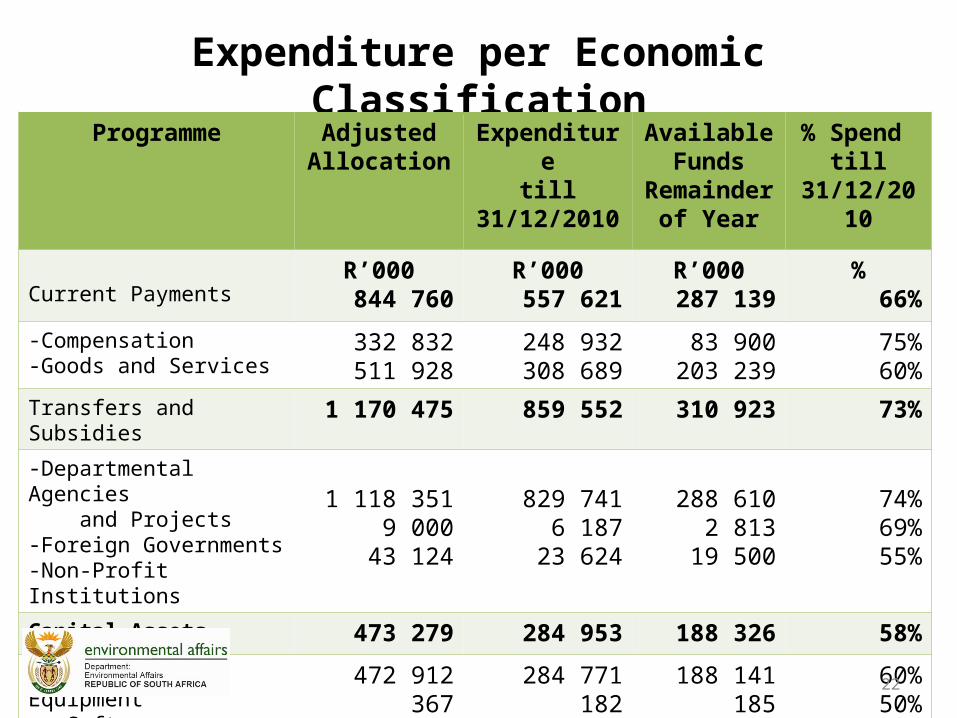
Expenditure per Economic ClassificationProgramme Adjusted
AllocationExpenditure
till31/12/2010
Available Funds
Remainder of Year
% Spend till
31/12/2010
Current PaymentsR’000
844 760R’000
557 621R’000
287 139%
66%
-Compensation-Goods and Services
332 832511 928
248 932308 689
83 900203 239
75%60%
Transfers and Subsidies 1 170 475 859 552 310 923 73%-Departmental Agencies and Projects-Foreign Governments-Non-Profit Institutions
1 118 3519 000
43 124
829 7416 187
23 624
288 6102 813
19 500
74%69%55%
Capital Assets 473 279 284 953 188 326 58%-Machinery and Equipment-- Software
472 912367
284 771182
188 141185
60%50%
Total 2 488 514 1 702 126 786 388 68%22
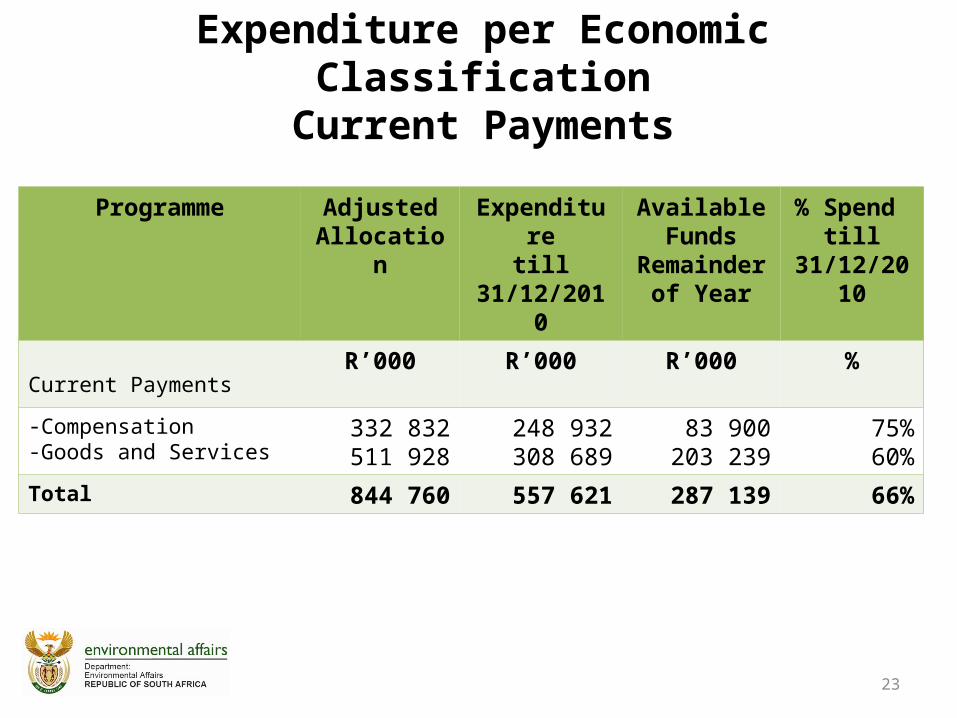
Expenditure per Economic ClassificationCurrent Payments
Programme Adjusted Allocation
Expendituretill
31/12/2010
Available Funds
Remainder of Year
% Spend till
31/12/2010
Current PaymentsR’000 R’000 R’000 %
-Compensation-Goods and Services
332 832511 928
248 932308 689
83 900203 239
75%60%
Total 844 760 557 621 287 139 66%
23
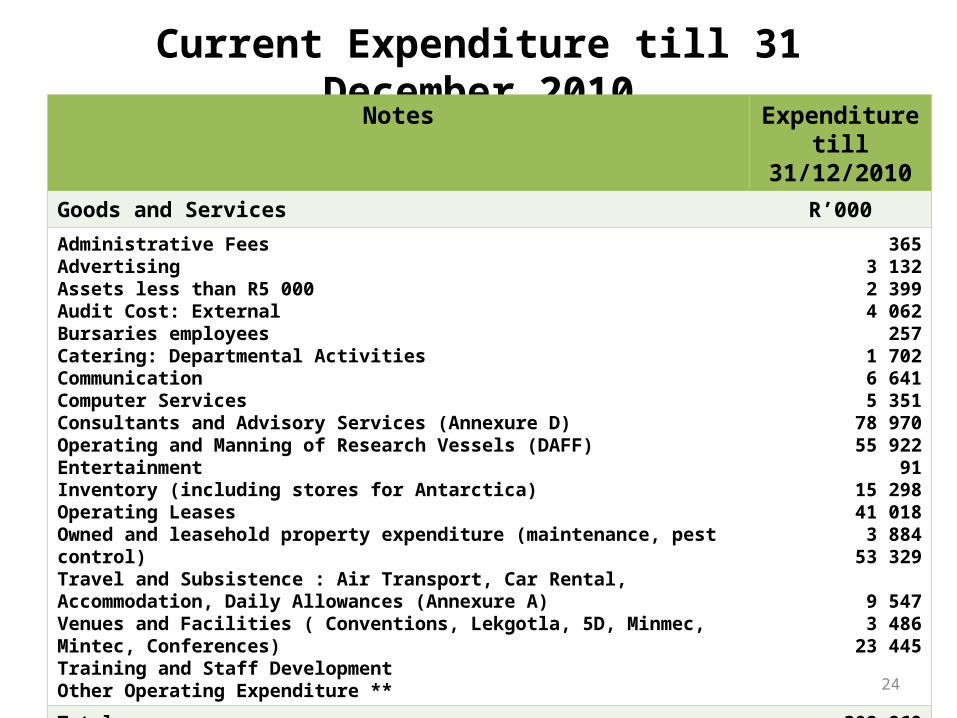
Current Expenditure till 31 December 2010Notes Expenditure till
31/12/2010
Goods and Services R’000
Administrative FeesAdvertisingAssets less than R5 000Audit Cost: ExternalBursaries employeesCatering: Departmental ActivitiesCommunicationComputer ServicesConsultants and Advisory Services (Annexure D)Operating and Manning of Research Vessels (DAFF)EntertainmentInventory (including stores for Antarctica)Operating LeasesOwned and leasehold property expenditure (maintenance, pest control)Travel and Subsistence : Air Transport, Car Rental, Accommodation, Daily Allowances (Annexure A)Venues and Facilities ( Conventions, Lekgotla, 5D, Minmec, Mintec, Conferences)Training and Staff DevelopmentOther Operating Expenditure **
3653 1322 3994 062
2571 7026 6415 351
78 97055 922
9115 29841 018
3 88453 329
9 5473 486
23 445
Total 308 869
24
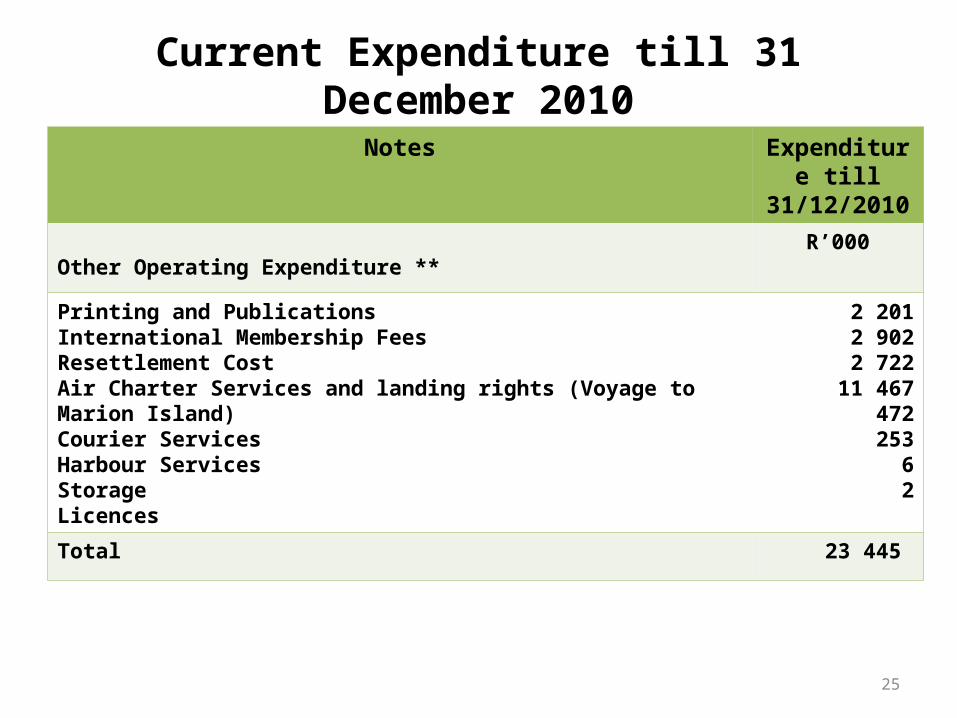
Current Expenditure till 31 December 2010
Notes Expenditure till31/12/2010
Other Operating Expenditure **R’000
Printing and PublicationsInternational Membership FeesResettlement CostAir Charter Services and landing rights (Voyage to Marion Island)Courier ServicesHarbour ServicesStorageLicences
2 2012 9022 722
11 467472253
62
Total 23 445
25
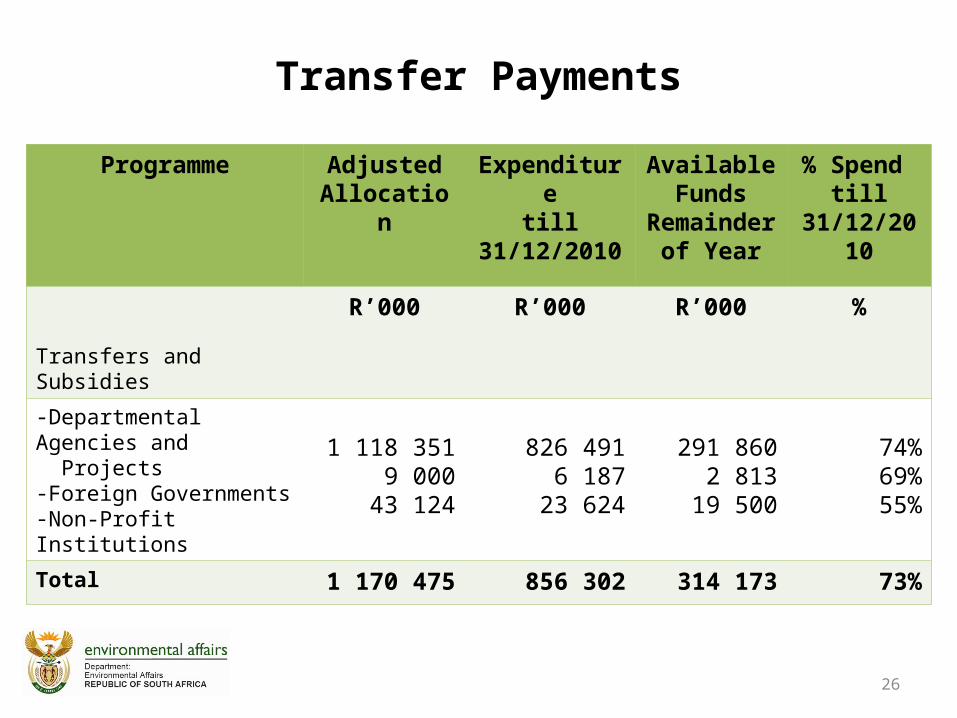
Transfer Payments
Programme Adjusted Allocation
Expendituretill
31/12/2010
Available Funds
Remainder of Year
% Spend till
31/12/2010
Transfers and Subsidies
R’000 R’000 R’000 %
-Departmental Agencies and Projects-Foreign Governments-Non-Profit Institutions
1 118 3519 000
43 124
826 4916 187
23 624
291 8602 813
19 500
74%69%55%
Total 1 170 475 856 302 314 173 73%
26
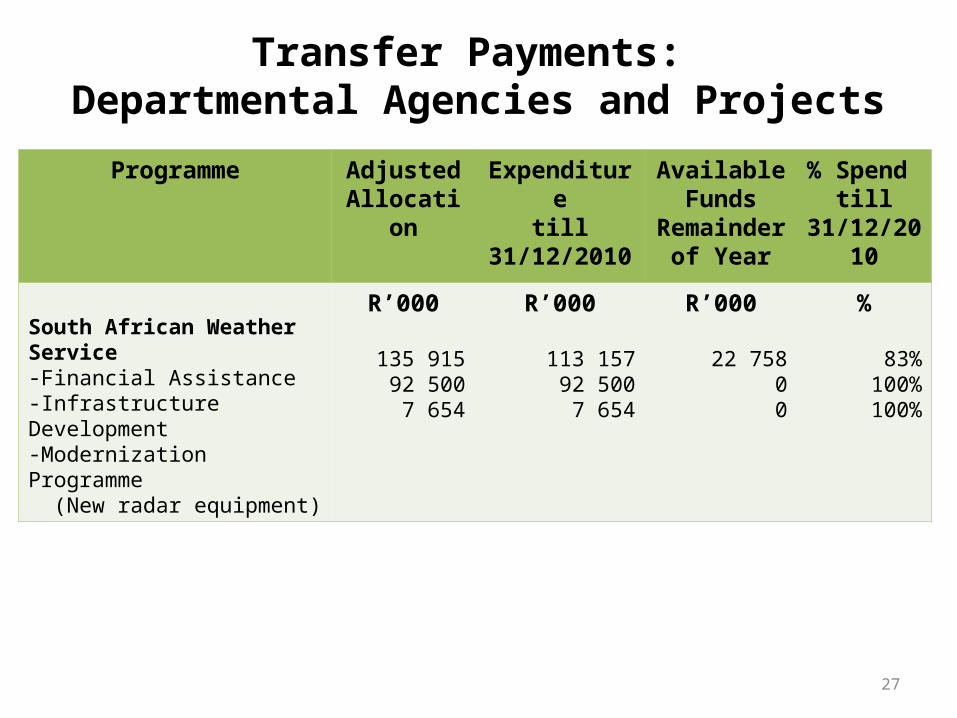
Transfer Payments: Departmental Agencies and Projects
Programme Adjusted Allocation
Expendituretill
31/12/2010
Available Funds
Remainder of Year
% Spend till
31/12/2010
South African Weather Service-Financial Assistance-Infrastructure Development-Modernization Programme (New radar equipment)
R’000
135 91592 500
7 654
R’000
113 15792 500
7 654
R’000
22 75800
%
83%100%100%
27
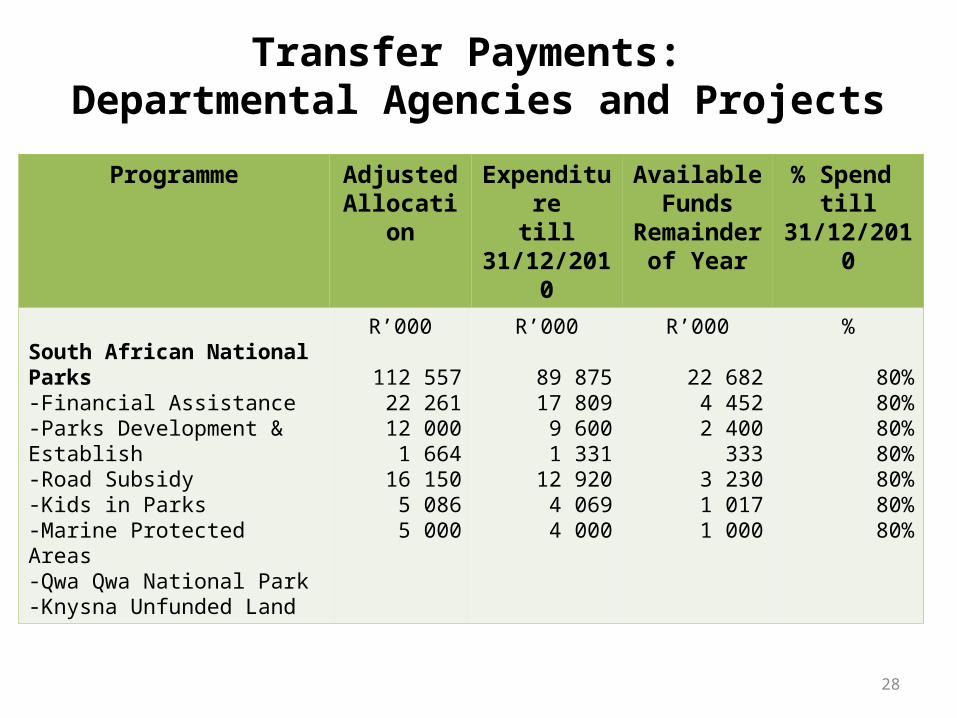
Transfer Payments: Departmental Agencies and Projects
Programme Adjusted Allocation
Expendituretill
31/12/2010
Available Funds
Remainder of Year
% Spend till
31/12/2010
South African National Parks-Financial Assistance-Parks Development & Establish-Road Subsidy-Kids in Parks-Marine Protected Areas-Qwa Qwa National Park-Knysna Unfunded Land
R’000
112 55722 26112 000
1 66416 150
5 0865 000
R’000
89 87517 809
9 6001 331
12 9204 0694 000
R’000
22 6824 4522 400
3333 2301 0171 000
%
80%80%80%80%80%80%80%
28
Transfer Payments: Departmental Agencies and Projects (continue)
Programme Adjusted Allocation
Expendituretill
31/12/2010
Available Funds
Remainder of Year
% Spend till
31/12/2010
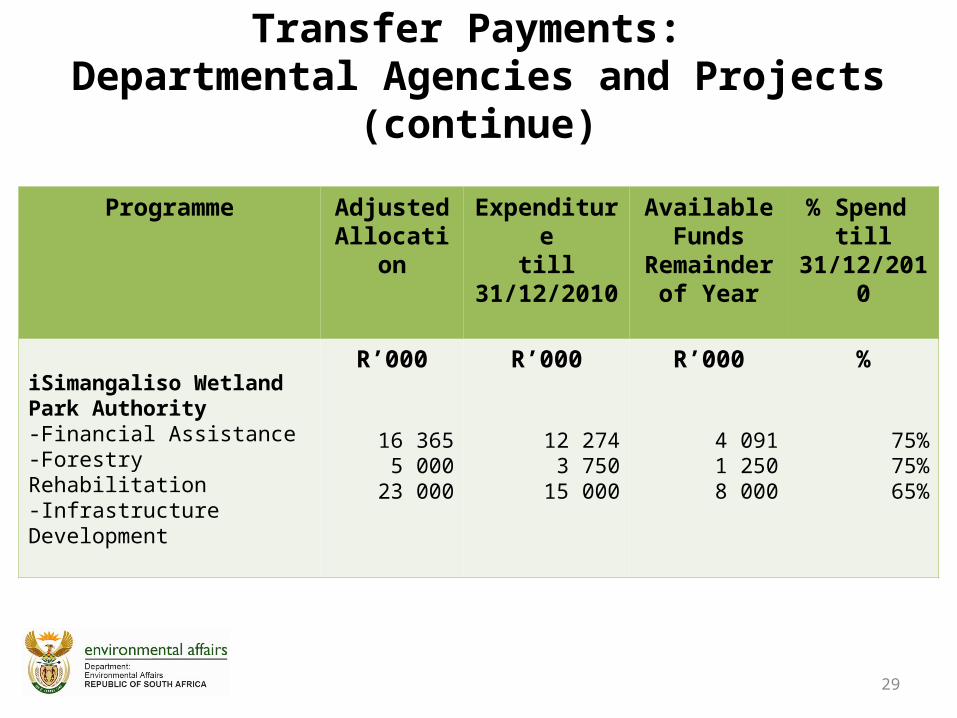
iSimangaliso Wetland Park Authority-Financial Assistance-Forestry Rehabilitation-Infrastructure Development
R’000
16 3655 000
23 000
R’000
12 2743 750
15 000
R’000
4 0911 2508 000
%
75%75%65%
29
Transfer Payments: Departmental Agencies and Projects (continue)
Programme Adjusted Allocation
Expendituretill
31/12/2010
Available Funds
Remainder of Year
% Spend till
31/12/2010
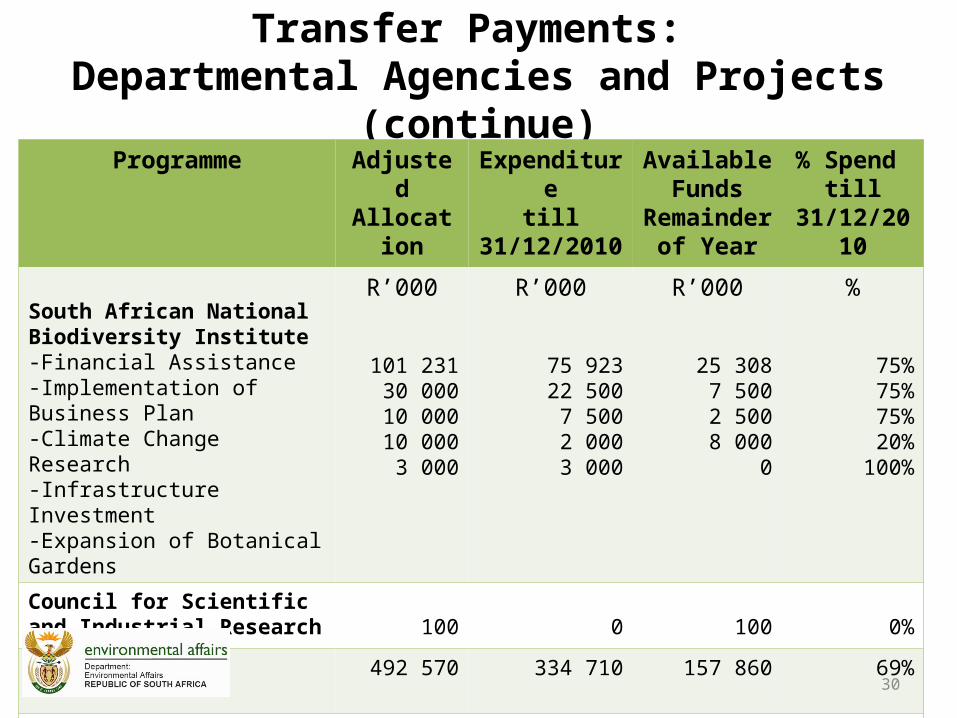
South African National Biodiversity Institute-Financial Assistance-Implementation of Business Plan-Climate Change Research-Infrastructure Investment-Expansion of Botanical Gardens
R’000
101 23130 00010 00010 000
3 000
R’000
75 92322 500
7 5002 0003 000
R’000
25 3087 5002 5008 000
0
%
75%75%75%20%
100%
Council for Scientific and Industrial Research 100 0 100 0%
Projects 492 570 334 710 157 860 69%
Total 1 118 351 826 491 291 860 74%
30
Transfer Payments: Projects and Expanded Public Works Programme
Programme Adjusted Allocation
Expenditure till
31/12/2010
Available Funds
Remainder of Year
% Spend till31/12/2010
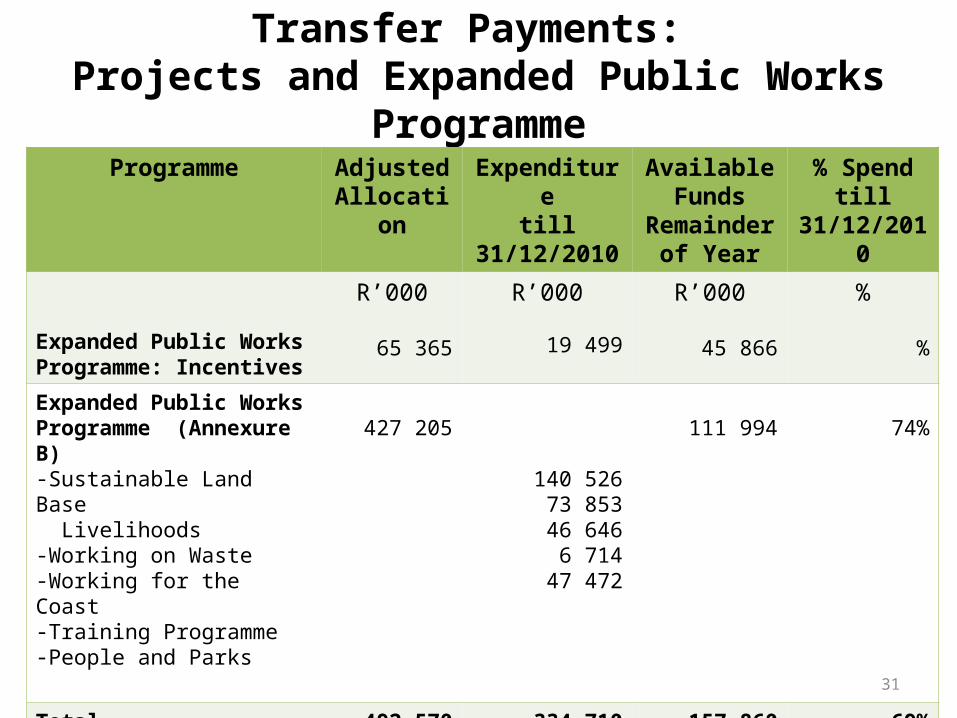
Expanded Public Works Programme: Incentives
R’000
65 365
R’000
19 499
R’000
45 866
%
%
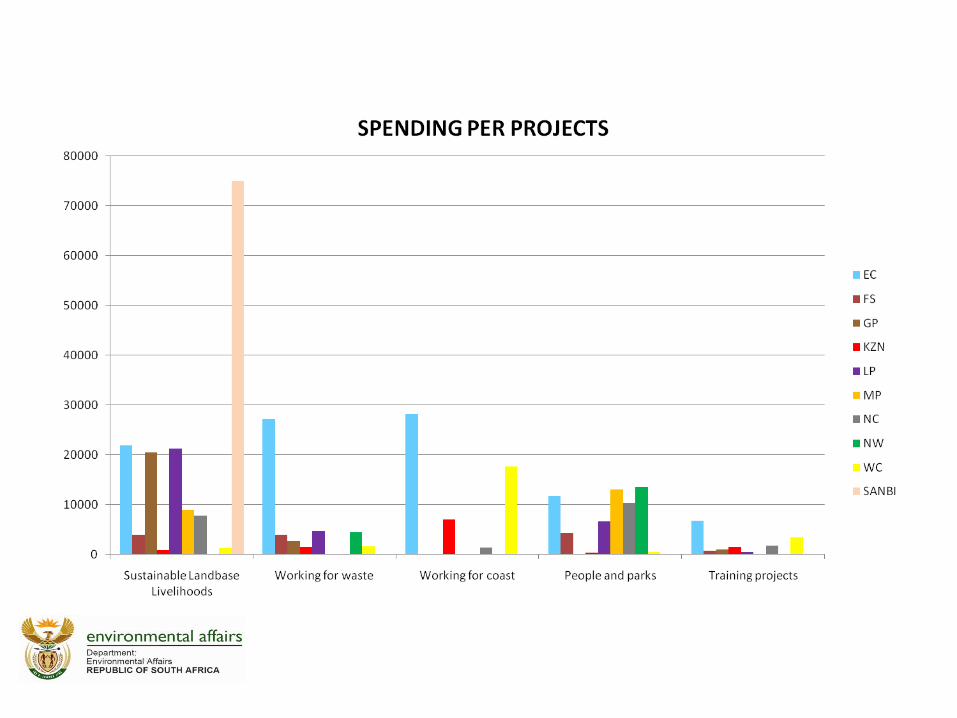
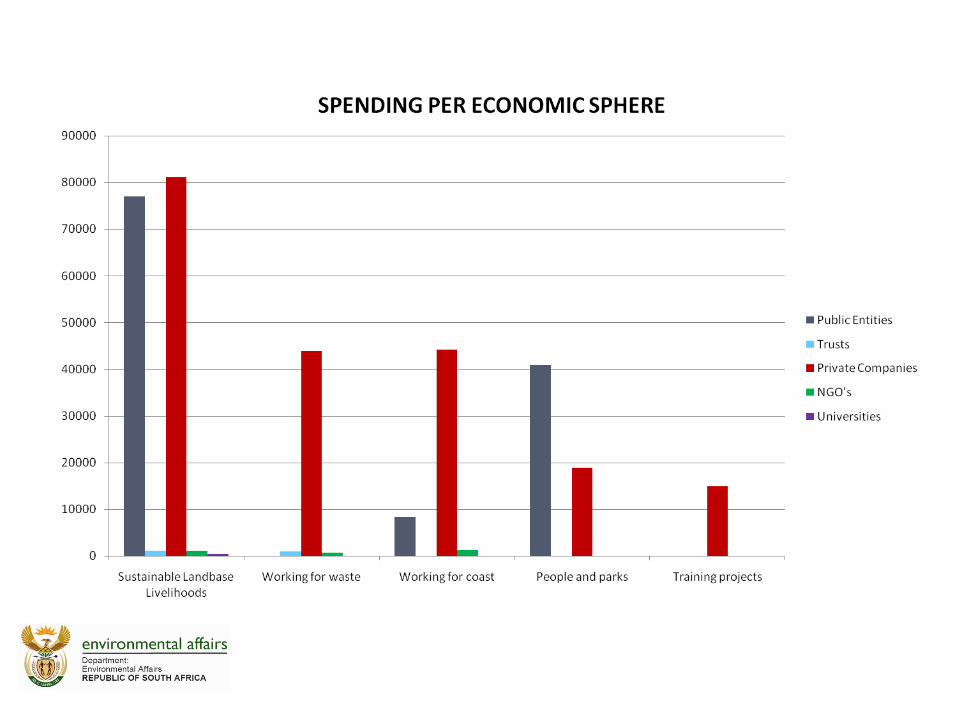
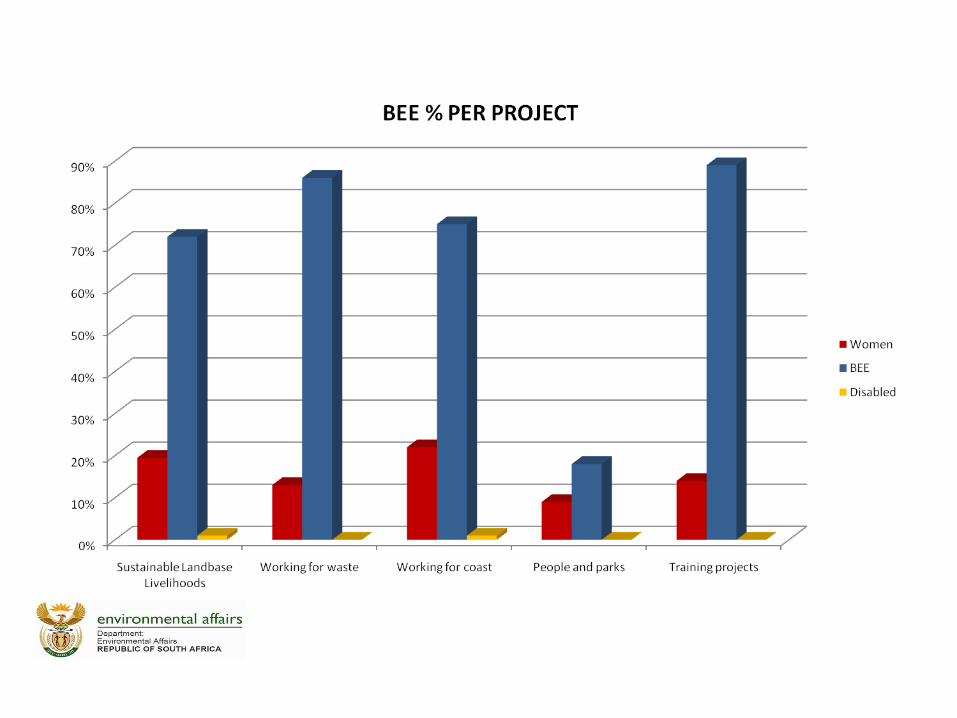
Expanded Public Works Programme (Annexure B)-Sustainable Land Base Livelihoods-Working on Waste-Working for the Coast-Training Programme-People and Parks
427 205
140 52673 85346 646
6 71447 472
111 994 74%
Total 492 570 334 710 157 860 69%
31
Transfer Payments: Foreign Governments and International institutions
Programme Adjusted Allocation
Expenditure till
31/12/2010
Available Funds
Remainder of Year
% Spend till31/12/2010
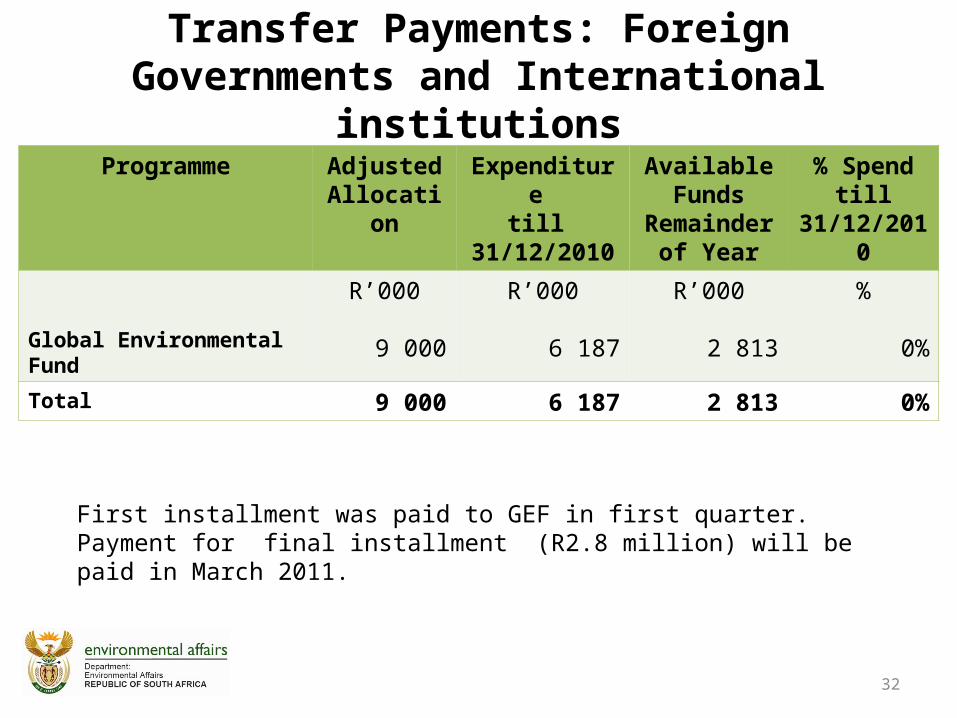
Global Environmental Fund
R’000
9 000
R’000
6 187
R’000
2 813
%
0%Total 9 000 6 187 2 813 0%
32
First installment was paid to GEF in first quarter. Payment for final installment (R2.8 million) will be paid in March 2011.
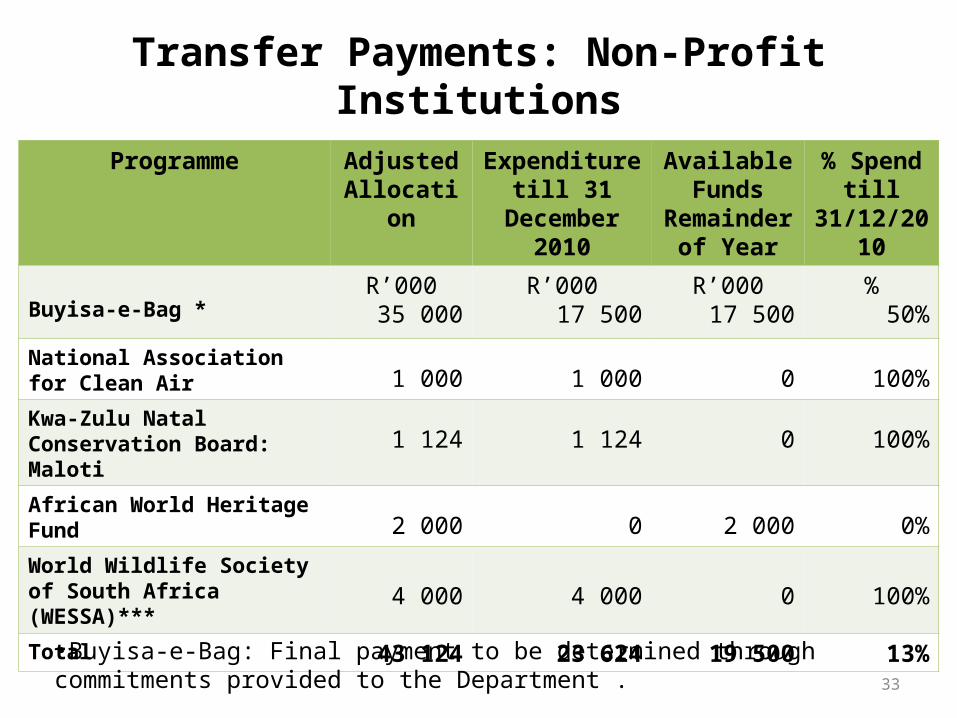
Transfer Payments: Non-Profit Institutions
Programme Adjusted Allocation
Expenditure till 31 December
2010
Available Funds
Remainder of Year
% Spend till
31/12/2010
Buyisa-e-Bag *R’000
35 000R’000
17 500R’000
17 500%
50%
National Association for Clean Air 1 000 1 000 0 100%
Kwa-Zulu Natal Conservation Board: Maloti 1 124 1 124 0 100%
African World Heritage Fund2 000 0 2 000 0%
World Wildlife Society of South Africa (WESSA)*** 4 000 4 000 0 100%Total 43 124 23 624 19 500 13%
33
•Buyisa-e-Bag: Final payment to be determined through commitments provided to the Department .
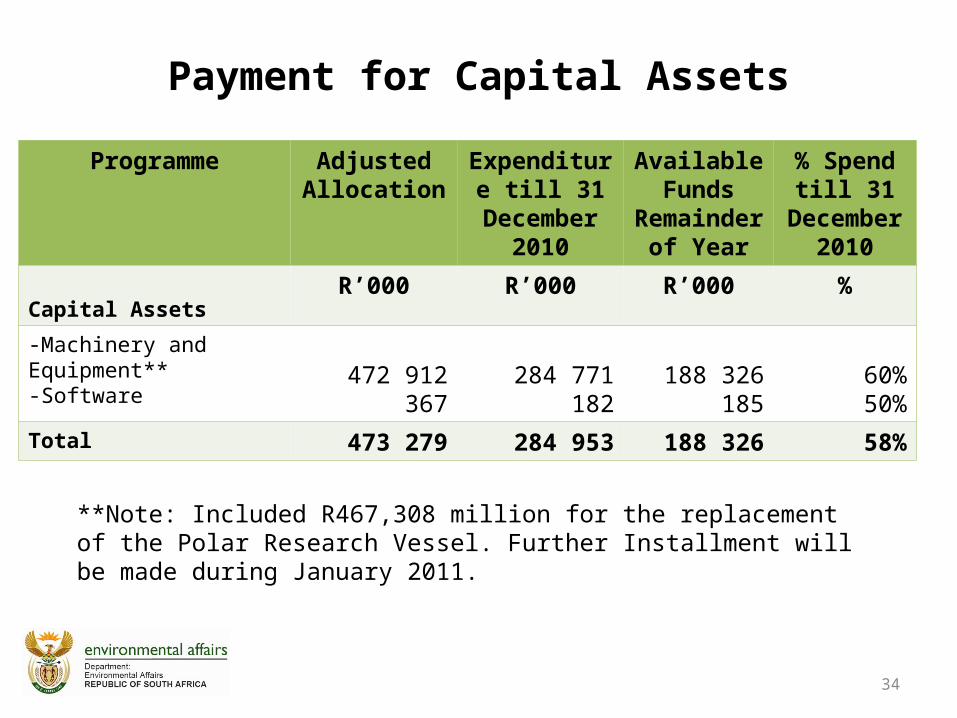
Payment for Capital Assets
Programme AdjustedAllocation
Expenditure till 31
December 2010
Available Funds
Remainder of Year
% Spend till 31
December 2010
Capital AssetsR’000 R’000 R’000 %
-Machinery and Equipment**-Software
472 912367
284 771182
188 326185
60%50%
Total 473 279 284 953 188 326 58%
34
**Note: Included R467,308 million for the replacement of the Polar Research Vessel. Further Installment will be made during January 2011.
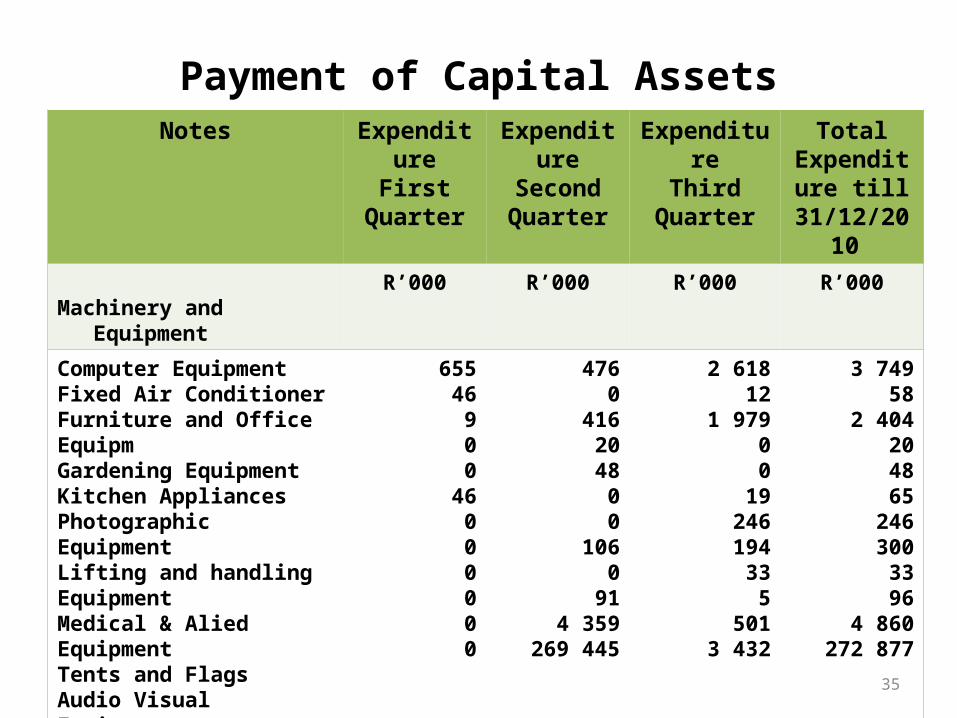
Payment of Capital AssetsNotes Expenditure
FirstQuarter
ExpenditureSecondQuarter
ExpenditureThird
Quarter
Total Expenditure
till 31/12/2010
Machinery and EquipmentR’000 R’000 R’000 R’000
Computer EquipmentFixed Air ConditionerFurniture and Office EquipmGardening EquipmentKitchen AppliancesPhotographic EquipmentLifting and handling EquipmentMedical & Alied EquipmentTents and FlagsAudio Visual EquipmentTelecommunication Equipment Ship and Marine Equipment (Replacement Polar Vessel)
65546
900
46000000
4760
4162048
00
1060
914 359
269 445
2 61812
1 97900
19246194
335
5013 432
3 74958
2 404204865
246300
3396
4 860272 877
Total 776 274 941 9 039 284 75635
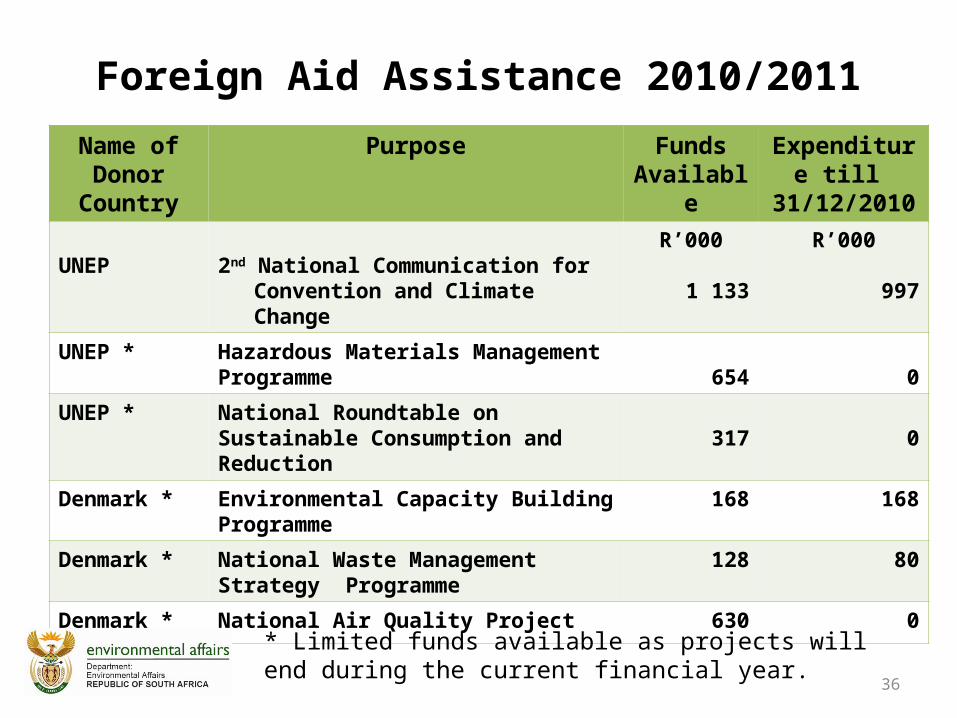
Foreign Aid Assistance 2010/2011
Name of Donor
Country
Purpose Funds Available
Expenditure till
31/12/2010
UNEP 2nd National Communication for Convention and Climate Change
R’000
1 133
R’000
997
UNEP * Hazardous Materials Management Programme 654 0
UNEP * National Roundtable on Sustainable Consumption and Reduction 317 0
Denmark * Environmental Capacity Building Programme 168 168
Denmark * National Waste Management Strategy Programme
128 80
Denmark * National Air Quality Project 630 0
36
* Limited funds available as projects will end during the current financial year.
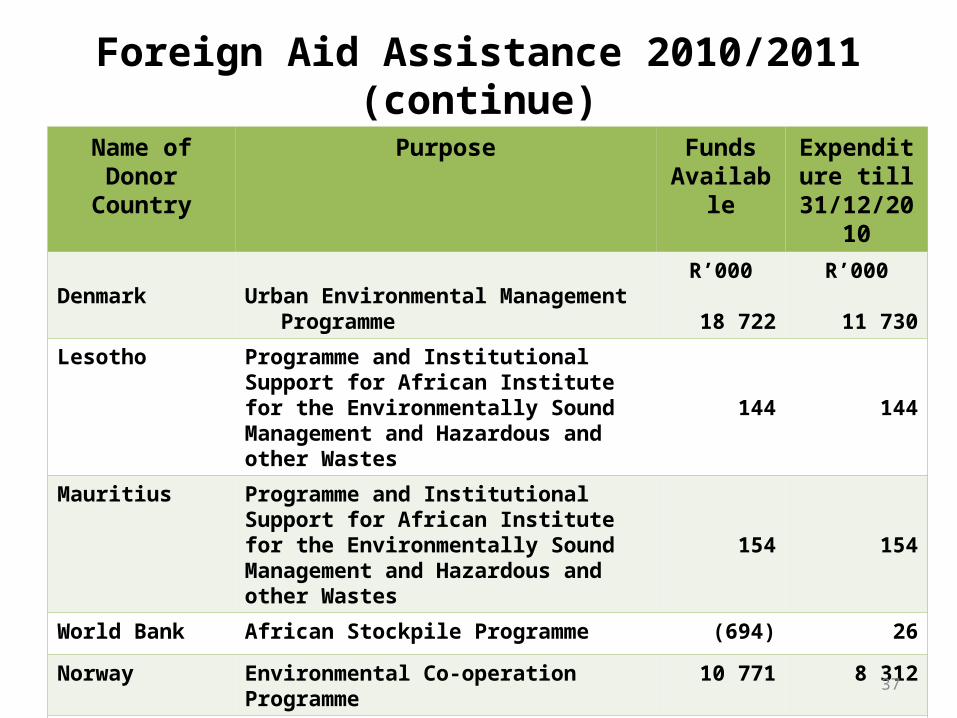
Foreign Aid Assistance 2010/2011 (continue)
Name of Donor Country
Purpose Funds Available
Expenditure till
31/12/2010
Denmark Urban Environmental Management Programme
R’000
18 722
R’000
11 730
Lesotho Programme and Institutional Support for African Institute for the Environmentally Sound Management and Hazardous and other Wastes
144 144
Mauritius Programme and Institutional Support for African Institute for the Environmentally Sound Management and Hazardous and other Wastes
154 154
World Bank African Stockpile Programme (694) 26
Norway Environmental Co-operation Programme 10 771 8 312
Total 32 127 21 611
37
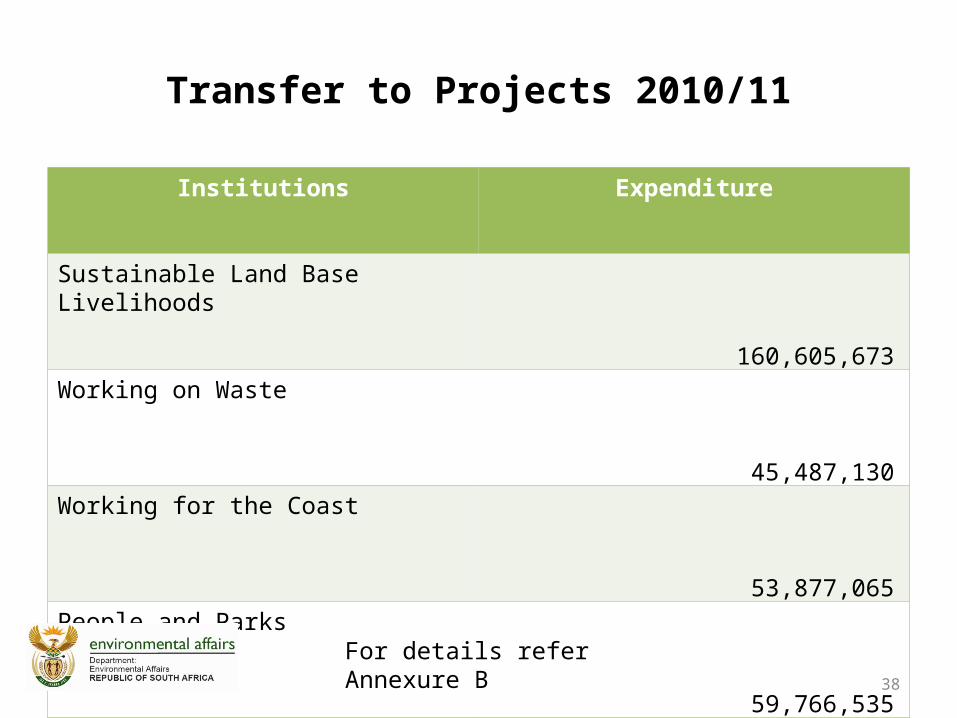
Transfer to Projects 2010/11
Institutions Expenditure
Sustainable Land Base Livelihoods 160,605,673
Working on Waste 45,487,130
Working for the Coast 53,877,065
People and Parks 59,766,535
Beneficiary Training 14,973,561
TOTAL 334,709,968
38
For details refer Annexure B
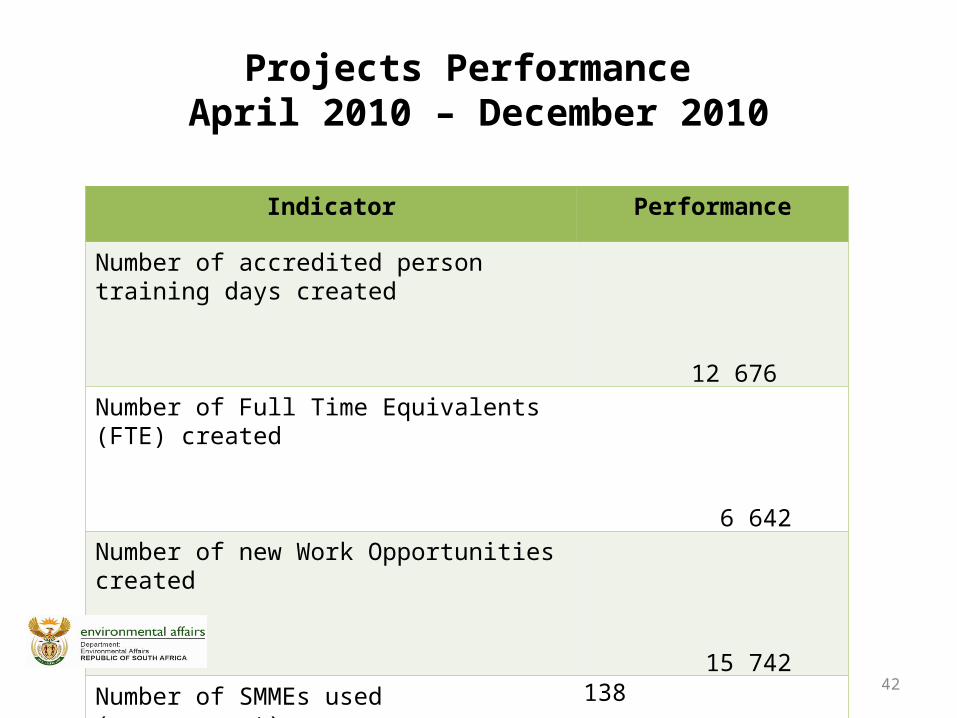
Projects Performance April 2010 – December 2010
Indicator Performance
Number of accredited person training days created
12 676
Number of Full Time Equivalents (FTE) created 6 642
Number of new Work Opportunities created 15 742
Number of SMMEs used (empowerment) 138
Number of youth benefiting from the NYS 541
42
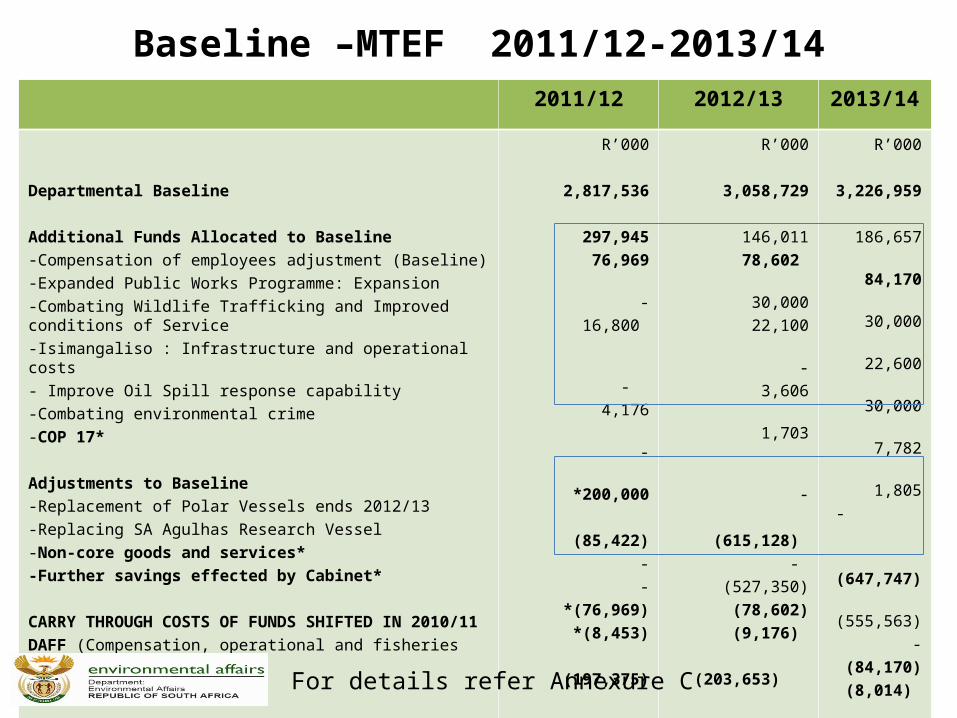
Baseline –MTEF 2011/12-2013/142011/12 2012/13 2013/14
Departmental Baseline
Additional Funds Allocated to Baseline-Compensation of employees adjustment (Baseline)-Expanded Public Works Programme: Expansion-Combating Wildlife Trafficking and Improved conditions of Service-Isimangaliso : Infrastructure and operational costs- Improve Oil Spill response capability-Combating environmental crime-COP 17*
Adjustments to Baseline-Replacement of Polar Vessels ends 2012/13-Replacing SA Agulhas Research Vessel-Non-core goods and services*-Further savings effected by Cabinet*
CARRY THROUGH COSTS OF FUNDS SHIFTED IN 2010/11DAFF (Compensation, operational and fisheries projects)
R’000
2,817,536
297,945 76,969 -
16,800 - 4,176 -
*200,000
(85,422)--
*(76,969)*(8,453)
(197,375)
R’000
3,058,729
146,011 78,602
30,000 22,100
- 3,606 1,703
-
(615,128) -
(527,350)(78,602)(9,176)
(203,653)
R’000
3,226,959
186,657 84,170 30,000 22,600
30,000 7,782 1,805
-
(647,747) (555,563)
-(84,170)(8,014)
(139,722)
2010 MTEF A L LOCATIONS (to be included in 2010 ENE) 2,832,684 2,385,959 2,625,847
For details refer Annexure C
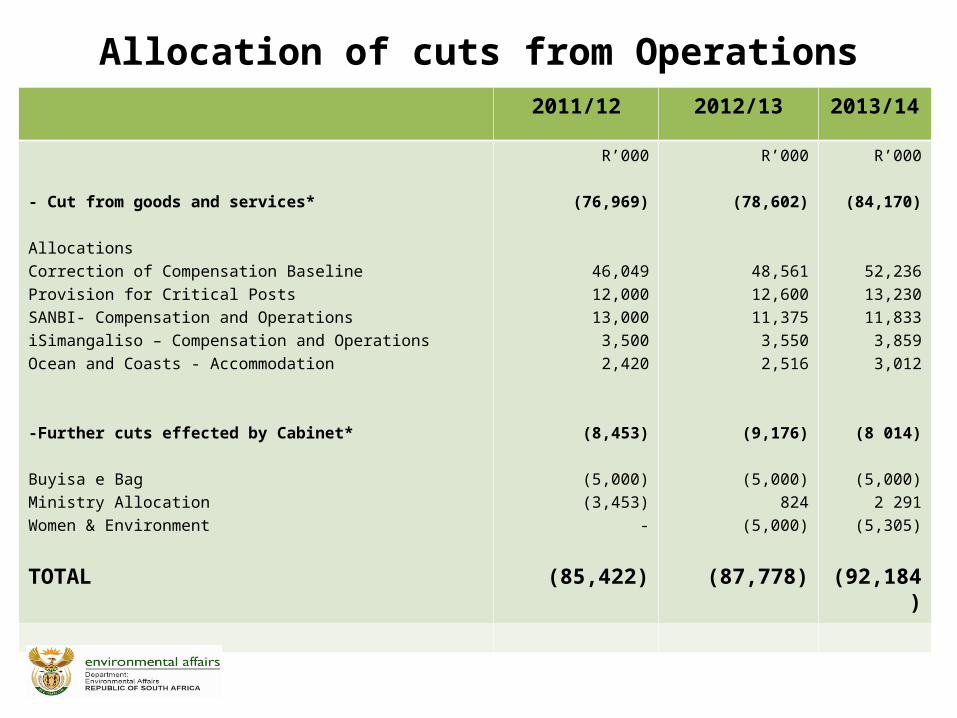
Allocation of cuts from Operations2011/12 2012/13 2013/14
- Cut from goods and services*
AllocationsCorrection of Compensation BaselineProvision for Critical PostsSANBI- Compensation and OperationsiSimangaliso – Compensation and OperationsOcean and Coasts - Accommodation
-Further cuts effected by Cabinet*
Buyisa e BagMinistry AllocationWomen & Environment
TOTAL
R’000
(76,969)
46,04912,00013,000
3,5002,420
(8,453)
(5,000)(3,453)
-
(85,422)
R’000
(78,602)
48,56112,60011,375
3,5502,516
(9,176)
(5,000)824
(5,000)
(87,778)
R’000
(84,170)
52,23613,23011,833
3,8593,012
(8 014)
(5,000)2 291
(5,305)
(92,184)
Challenges over the MTEF
- Decrease in Baseline for Use of Goods and Services:
Main areas: Vessel Operating costs Accommodation Municipal Services Funding of New building Green Economy and Environmental Awareness, Events and
projects
- Decreasing Donor funding- Funding of Entities infrastructure developments, operations and deficits