Embed Size (px)
Citation preview
Transmitted by the expert Informal doc. No. GRSG-109-
of Hungary 109th GRSG, 28. Sept. - 2. Oct. 2015
Agenda item:2
BRIEF INTRODUCTION TO STATISTICAL STUDY OF BUS ACCIDENTS
(Are the buses safe, or not?)
This paper is not a proposal for detailed discussion, its aim is to present a method, a tool to get reliable, statistical
evidences when discussing different safety issues of buses for developing existing UN-ECE regulations or work-
ing out new ones.
INTRODUCTION
The collection and evaluation of road vehicle accidents has a long history on national and international
level. The conclusions drawn from the accident information are useful to:
improve the traffic safety policy, the traffic rules
determine the development of road systems and road construction
improve the national and international vehicle safety regulations
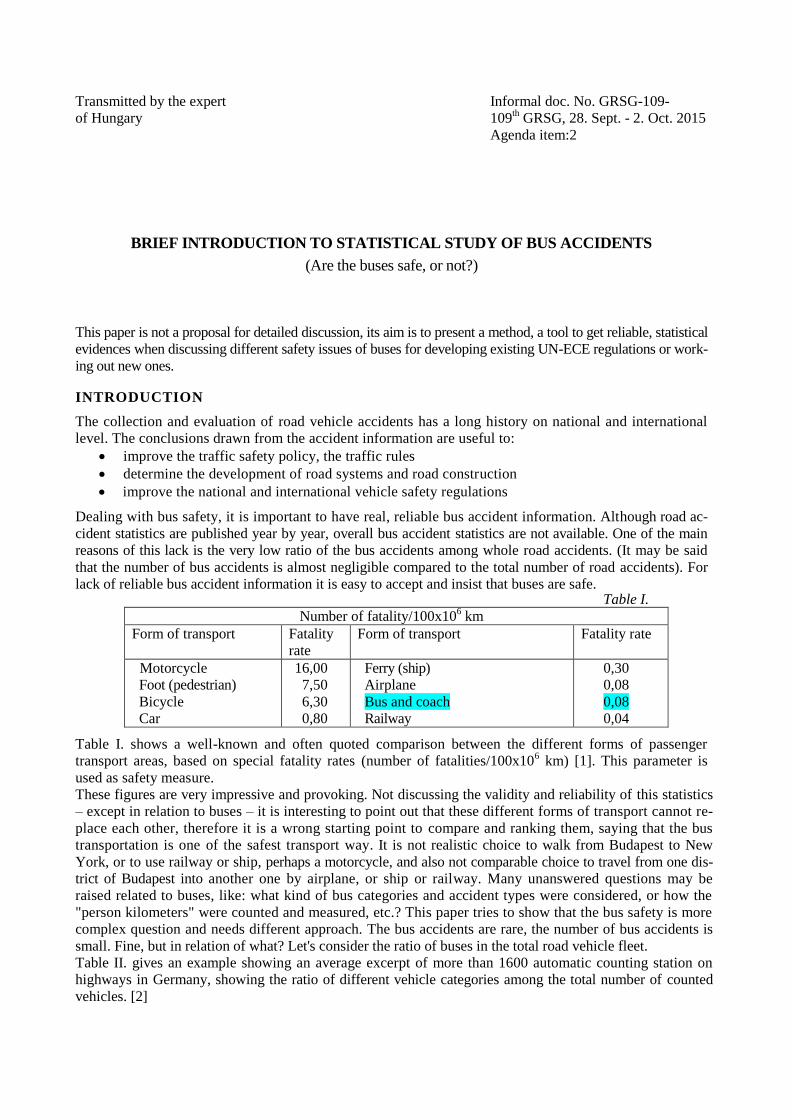
Dealing with bus safety, it is important to have real, reliable bus accident information. Although road ac-
cident statistics are published year by year, overall bus accident statistics are not available. One of the main
reasons of this lack is the very low ratio of the bus accidents among whole road accidents. (It may be said
that the number of bus accidents is almost negligible compared to the total number of road accidents). For
lack of reliable bus accident information it is easy to accept and insist that buses are safe. Table I.
Number of fatality/100x106 km
Form of transport Fatality
rate
Form of transport Fatality rate
Motorcycle
Foot (pedestrian)
Bicycle
Car
16,00
7,50
6,30
0,80
Ferry (ship)
Airplane
Bus and coach
Railway
0,30
0,08
0,08
0,04
Table I. shows a well-known and often quoted comparison between the different forms of passenger
transport areas, based on special fatality rates (number of fatalities/100x106 km) [1]. This parameter is
used as safety measure.
These figures are very impressive and provoking. Not discussing the validity and reliability of this statistics
– except in relation to buses – it is interesting to point out that these different forms of transport cannot re-
place each other, therefore it is a wrong starting point to compare and ranking them, saying that the bus
transportation is one of the safest transport way. It is not realistic choice to walk from Budapest to New
York, or to use railway or ship, perhaps a motorcycle, and also not comparable choice to travel from one dis-
trict of Budapest into another one by airplane, or ship or railway. Many unanswered questions may be
raised related to buses, like: what kind of bus categories and accident types were considered, or how the
"person kilometers" were counted and measured, etc.? This paper tries to show that the bus safety is more
complex question and needs different approach. The bus accidents are rare, the number of bus accidents is
small. Fine, but in relation of what? Let's consider the ratio of buses in the total road vehicle fleet.
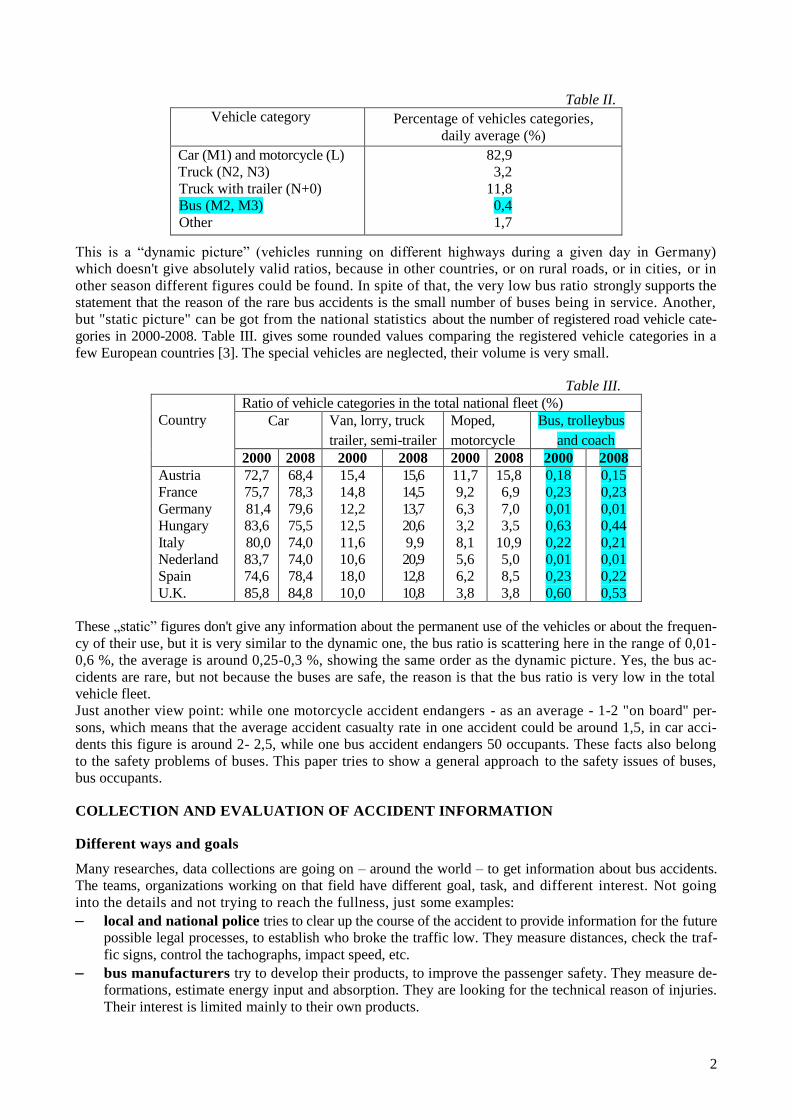
Table II. gives an example showing an average excerpt of more than 1600 automatic counting station on
highways in Germany, showing the ratio of different vehicle categories among the total number of counted
vehicles. [2]
2
Table II.
Vehicle category Percentage of vehicles categories,
daily average (%)
Car (M1) and motorcycle (L)
Truck (N2, N3)
Truck with trailer (N+0)
Bus (M2, M3)
Other
82,9
3,2
11,8
0,4
1,7
This is a “dynamic picture” (vehicles running on different highways during a given day in Germany)
which doesn't give absolutely valid ratios, because in other countries, or on rural roads, or in cities, or in
other season different figures could be found. In spite of that, the very low bus ratio strongly supports the
statement that the reason of the rare bus accidents is the small number of buses being in service. Another,
but "static picture" can be got from the national statistics about the number of registered road vehicle cate-
gories in 2000-2008. Table III. gives some rounded values comparing the registered vehicle categories in a
few European countries [3]. The special vehicles are neglected, their volume is very small.
Table III.
Country
Ratio of vehicle categories in the total national fleet (%)
Car Van, lorry, truck
trailer, semi-trailer
Moped,
motorcycle
Bus, trolleybus
and coach
2000 2008 2000 2008 2000 2008 2000 2008
Austria
France
Germany
Hungary
Italy
Nederland
Spain
U.K.
72,7
75,7
81,4
83,6
80,0
83,7
74,6
85,8
68,4
78,3
79,6
75,5
74,0
74,0
78,4
84,8
15,4
14,8
12,2
12,5
11,6
10,6
18,0
10,0
15,6
14,5
13,7
20,6
9,9
20,9
12,8
10,8
11,7
9,2
6,3
3,2
8,1
5,6
6,2
3,8
15,8
6,9
7,0
3,5
10,9
5,0
8,5
3,8
0,18
0,23
0,01
0,63
0,22
0,01
0,23
0,60
0,15
0,23
0,01
0,44
0,21
0,01
0,22
0,53
These „static” figures don't give any information about the permanent use of the vehicles or about the frequen-
cy of their use, but it is very similar to the dynamic one, the bus ratio is scattering here in the range of 0,01-
0,6 %, the average is around 0,25-0,3 %, showing the same order as the dynamic picture. Yes, the bus ac-
cidents are rare, but not because the buses are safe, the reason is that the bus ratio is very low in the total
vehicle fleet.
Just another view point: while one motorcycle accident endangers - as an average - 1-2 "on board" per-
sons, which means that the average accident casualty rate in one accident could be around 1,5, in car acci-
dents this figure is around 2- 2,5, while one bus accident endangers 50 occupants. These facts also belong
to the safety problems of buses. This paper tries to show a general approach to the safety issues of buses,
bus occupants.
COLLECTION AND EVALUATION OF ACCIDENT INFORMATION
Different ways and goals
Many researches, data collections are going on – around the world – to get information about bus accidents.
The teams, organizations working on that field have different goal, task, and different interest. Not going
into the details and not trying to reach the fullness, just some examples:
local and national police tries to clear up the course of the accident to provide information for the future
possible legal processes, to establish who broke the traffic low. They measure distances, check the traf-
fic signs, control the tachographs, impact speed, etc.
bus manufacturers try to develop their products, to improve the passenger safety. They measure de-
formations, estimate energy input and absorption. They are looking for the technical reason of injuries.
Their interest is limited mainly to their own products.
3
insurance companies try to reduce their costs and fend off by legal way their debt obligation.
fire men on the scene concentrate on the escape and rescue of occupants and to eliminate the traffic
obstacles.
ambulance teams look after the injured occupants and organize their transportation into hospitals.
Further groups, organizations may be listed (e.g. highway authorities, national statistical bureaus, transport
companies, research institutes, etc.) but this list clearly shows the different interests, viewpoints and capabili-
ties. These organizations are using different definitions for the injury categories, and what is more, different
interpretations and definitions for the incident (accident). In consequence of these, the information and
data sets collected by these different groups are not comparable and addable, and do not serve the crea-
tion of large, statistical samples.
Demands of the international regulatory work
There is a very important field of the bus safety which needs accident information, statistical evidences:
the international bus safety regulations. The regulatory work is going on in the frame of UN-ECE, in Ge-
neva. There are two regulations concerning directly buses (UN-ECE Regulation No. 66 and 107) and more
others dealing with buses, too, among other vehicle categories. Discussing bus safety issues in different ex-
pert groups, everyday problem is the lack of reliable accident information, usable statistical evidences. This
was the weak point, or on other hand a very important conclusion of the ECBOS project, too – performed
by 8 EU countries – aiming to prepare proposals for the competent Geneva expert groups to enhance the bus
safety [1]. The group could collect only a few real bus accidents, they didn't have information about the dis-
tribution of different accident types, the injury statistics were based on police reports and ECBOS experts
underlined that the different injury definitions (used in different countries) made their evaluation more dif-
ficult. The regulatory work needs special kind of accident information:
in this respect the legal relations (who is responsible for the accident), the cost consequences (how big is
the own and the caused damage, cost), the weather circumstances, etc. are not relevant.
the type and course of the accident, the structural damage of the bus, the number of occupants in the acci-
dent, the number of the died, injured occupants, the types of injuries, the way of evacuation and escape,
etc. are the most important useful information.
all the really technical information, like impact speed and direction in collision, the number of rotations
in rollover, ejection of occupants, malfunctions in bus systems (brake, steering, etc.) causing the ac-
cident, etc. can be very useful.
important thing is to have a large data set from which different statistical samples may be derived.
It seems to be a useful method for this kind of data and information collection – paralell to data of other
groups, mentioned above – to use the media news and reports as well. When working on the development
of regulation R.66 (Strength of bus superstructure in rollover) this method was tried out [4], and later wide-
ly used. The media reports are very different in length and depth. There are very brief information just de-
scribing the type of the accident the number of casualties and also "long stories" can be found, going into
the details. Both kinds of report are good for statistical analysis, while the second one is good for in-depth
analysis [5], [8], too.
Collection of large accident data set
The first and most important step is to collect and built up a large data set from all available bus acci-
dent information. All kind of information sources – mentioned above – can be and shall be used. Today
the computer based electronic backround is given to this work. It is important to find an appropriate
structuring of the information belonging to one accident, which helps the easy seeking out of the needed
accidents to build up the necessary statistical sample. The only common feature of the accidents being
in the data set: they are bus accidents (inccidents). The data set, used in this study contains around 1500
events. These events represent different bus categories, different accident types, different geographical
regions (countries), so this data set does not represent a statistical sample, but provides a good basis to
deduce and build up representative statistical samples.
4
Statistical samples from data set
Only representative statistical samples are usable for getting evidences to the international safety regulations.
Not going into the details of the mathematical statistics, only a few definitions are given here, being im-
portant to collect and evaluate bus accident information:
event is an individual element of the data set. In our case it is a bus incident (accident). When collecting
the accident information very important thing is the definition of the event. In the everyday practice, the
different teams in different countries are using different definitions for bus accident. e.g. bus accident is
in which: at least one bus occupant died, or at least one injured; or a road incident, in which at least one
bus was involved, etc.
sample is a collection of events, having certain common features, grouping bus accidents which are the
object of a certain study.
sampling parameter is the basis of the selection of events from the data set and put them into the
sample (e.g. rollover accidents). Simultaneously two sampling parameters may be used (e.g. rollover of
DD coaches), or even more (e.g. severe rollover of DD coaches). This means a sampling hierarchy: the
first example represents more general, the last one more specific sample.
sample size is the number of the individual events belonging to the sample. Bigger sample size higher
reliability when drawing conclusions from the statistical analysis. Using a given data set – like in this
study – and referring to the three examples given above, it may be said that the more general sample
has bigger and the more specific smaller sample size.
sample homogeneity means that all the individual elements of the sample are characterized and identi-
fied strictly by the same sampling parameter(s). The inhomogeneous sample is not suitable to reach reli-
able conclusions.
representative sample means that the sample is homogeneous and the sample size is big enough. On-
ly the representative sample provides valid, acceptable conclusions.
The sampling parameters may be defined arbitrarily, according to the goal of the investigation. Having a
large, wide data set, samples may be defined any time, even subsequently too, on the basis of new sampling
parameters. In this study the sampling parameters are the bus categories, types of accidents, regions, certain
injury criteria and some others.
Evaluation of safety level
The international regulatory work – dealing with buses – concentrates on the safety of bus occupants (pas-
sengers, drivers, crew). As said before, the safety level of buses cannot be evaluated on the basis of abso-
lute casualty figures, even related to the performed way or services hours. The bus accidents – as showed
before – are rare in the everyday practice, because of the very low rate of buses in the total road vehicle fleet.
It is more realistic approach to evaluate the severity of different kinds of bus accidents based on relative
casualty figures and statistical analysis.
Therefore it seems to be practical to introduce the concept of accident casualty rate and personal casualty
risk:
- Accident casualty rate (ACRx) means the average number of the given casualty in the statistical sam-
ple, representing one accident in general:
n
xACR
n
1i i
x
…1
where: x means the given injury category (e.g. fatality, life danger serious or slight injury, all casualties,
etc.) xi is the number of individual casualties in the individual accident belonging to the sample and n
is the sample size. Giving examples in this paper, only the fatality rate (RF), the injury rate (RI) and the
all casualty rate (RA) will be used. The differentiation between the injuries (life danger, serious, slight or
other) needs more work and space, but doesn't effect the main line of this study. The accident casualty
rates are useful figures to compare the different bus categories, accident types, regions, etc. on severity
(safety) basis. The careful sampling is very important to avoid the different distortions. One distortion
could be caused by the nominal passenger capacity of the buses (small or large bus, DD, or articulated
bus, etc.).
Personal casualty risk (PCRx) means the casualty rate related to one passenger:
5
c
ACRPCR x
x …2
where: c is the passenger capacity (max. allowed number of passengers) of the bus. The different bus cat-
egories have significantly different passenger capacity. To avoid this significant possible distortion in
the accident casualty rates, having different bus categories in the sample it is useful to use PCRx in-
stead of ACRx. The personal casualty risk could be a useful parameter, when the bus occupants have dif-
ferent casualty risk in certain accident types (e.g. the driver and the crew is frontal collision).
The driver (and the crew, if any) is key person in the past-accident situation: he knows what and how
to operate to minimize the hazard, he can operate the doors, emergency exits and help to the passen-
gers to evacuate the bus, he can inform the police, firemen, emergency service, etc. Therefore the
driver protection has absolute priority in safety improvement. It is expedient to compare the driver’s
personal casualty risk to the average passenger’s personal casualty risk, getting the comperative pa-
rameter (PC):
risk personal spassenger'
risk personal sdriver'
PCR
PCRCP
P
D …3
and if CP >1, the driver has higher hazard in the given accident situation.
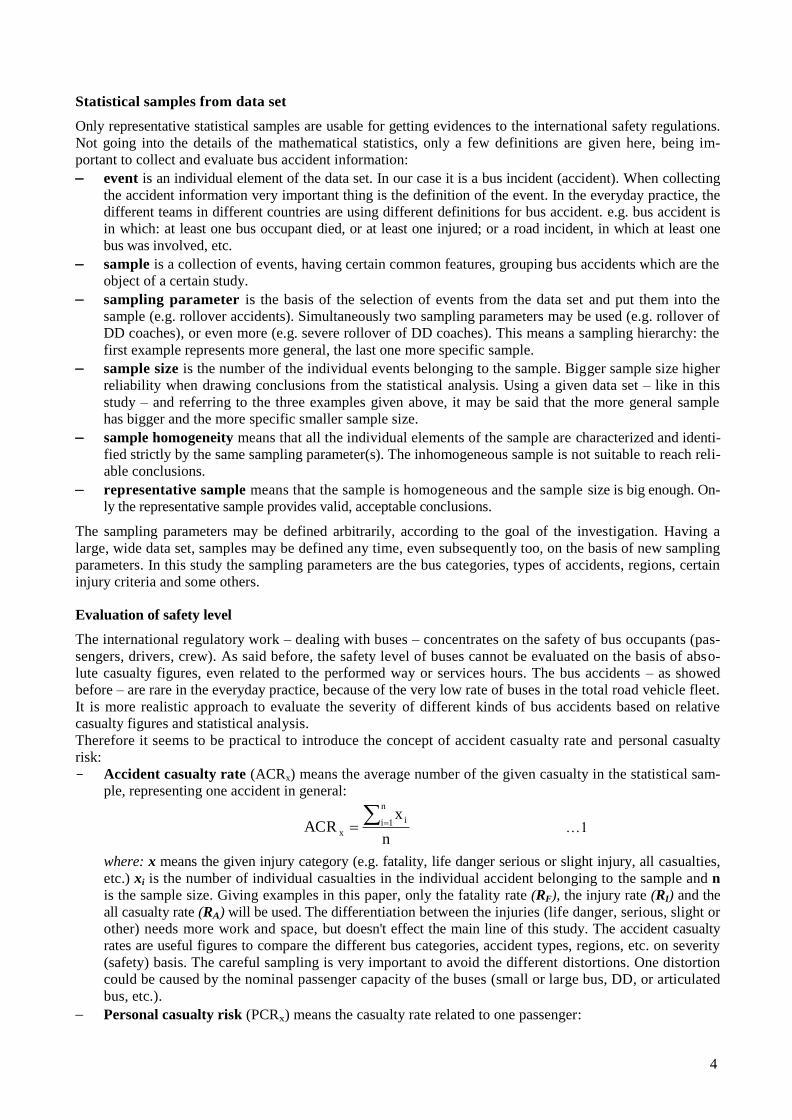
The practice proved [6] that it is appropriate to use certain ranges, when considering the passenger ca-
pacity of the bus (e.g. 50 for the traditional 11-12 m long tourist coaches covering 45-55 passengers), or
16 for small buses covering 9-22 passengers). The passenger capacity itself doesn't represent the real
number of bus occupants in the individual accidents, but it was studied and proved that on statistical
level this difference doesn't influence significantly the casualty rates [7]. Theoretically the personal cas-
ualty risk is the most accurate parameter to compare the safety level of occupants in different bus catego-
ries and different accident situation. The most precise parameter, but rather labour-intensive to produce
it. An acceptable approach – to avoid the distortion of the different passenger capacities – is to use a
“comparative” ACRx with a correction factor (F) representing the bus categories having significantly dif-
ferent passenger capacity.
(ACRx)comparative = (ACRx)*F …4
The basic bus category can be the 11-12 m tourist coach. The possible correction factors for different bus
categories are given in Table IV., as examples. Other categorizations and groupings may be used, too.
Table IV.
Bus category Passenger capacity Correction
factor (F) range average
11-12 m long tourist coach
15 m long tourist coach
13-14 m long DD coach
Small bus (SB)
11-12 m long city bus
18 m long articulated bus
45-55
65-75
65-75
9-22
80-95
150-160
50
70
70
16
85
155
1,0
0,7
0,7
3,0
0,6
0,3
Categorization of casualties.
While the safety studies and analysis is based on the number and severity of casualties, it is important to de-
cide and define the injury categories used in this work.
In the practice, there are different ways and definitions to specify and categorize the injuries in an accident:
Severity of injury: fatal, life danger, serious and slight injury, injury without specification, etc. The le-
gal definitions of these categories are not agreed, they are different in the different countries. The me-
dia information is using these categories, but doesn't care about their legal definitions.
AIS severity index is purely medical classification, never used in the media news.
6
Way of injury: compression, projection, ejection, burning, etc. The media information is occa-
sionally using these injury categories, but not systematically.
Medical feature: fracture, blow, skin injury, nervous system injury, etc. This is a very special
medical approach, used by medical teams in research work, the media doesn't use it, and the leg-
islation doesn’t need it.
Body parts: head, spin, chest, abdominal, extremities, etc. This is also basically for medical use,
some information can be found in the media reports.
In this study mainly the first method (severity of injury) is used to give certain examples, trying to show a
possible, well usable way of data collection and statistical evaluation of bus accidents. For this reason only a
reduced version is used, considering only the number of fatalities, all kind of injuries together and all casual-
ties when counting the accident casualty rates and personal casualty risk. These three figures can represent well
the major tendencies of the severity of different types of bus accident and also the safety level of bus
transport.
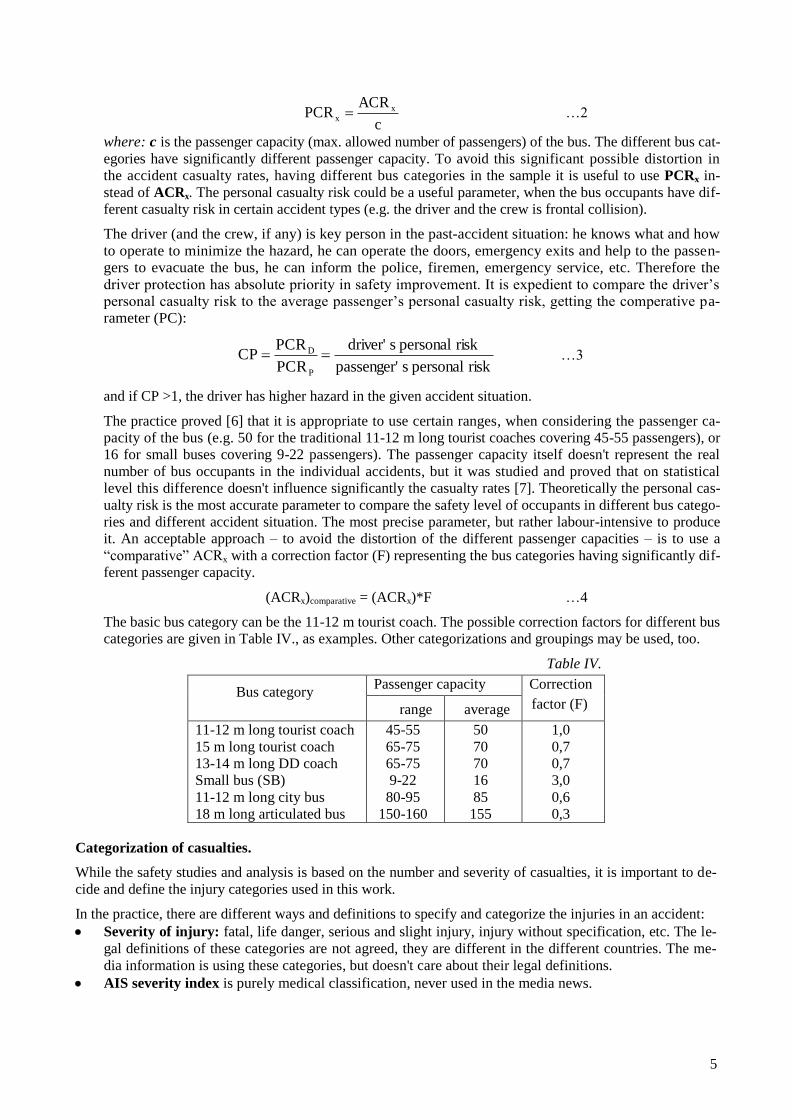
GENERAL PICTURE ABOUT THE LARGE DATA SET
15 years ago new way was started and tried to collect bus accident information: collecting the news, re-
ports of the Hungarian media in this subject. At that time an important international work was going on – the
development of UN-ECE Regulation 66 – and the expert group did not have enough real bus rollover infor-
mation. Therefore – at the beginning – the collection was focused on the rollover accident of large buses.
Later on this method was extended to all bus categories and further extension included other accident types
as well. Table V. gives a general overview about bus accidents collected until the end of 2014. The data
are grouped into three regions, considering 7 basic accident categories. Table V.
Type of
accident
Rollover Frontal
collision
Rear and side
collision
Direct
fire
Combined
accident
Collision
with train
Special
accidents
Total
R FC RSC F CA CT S
Hungary 176
335 28 65 11 6 19 645 Europe 168 96 7 13 28 12 5 324 World 201 124 2 20 146 15 17 525
Σ 545 555 37 98 185 33 41 1494
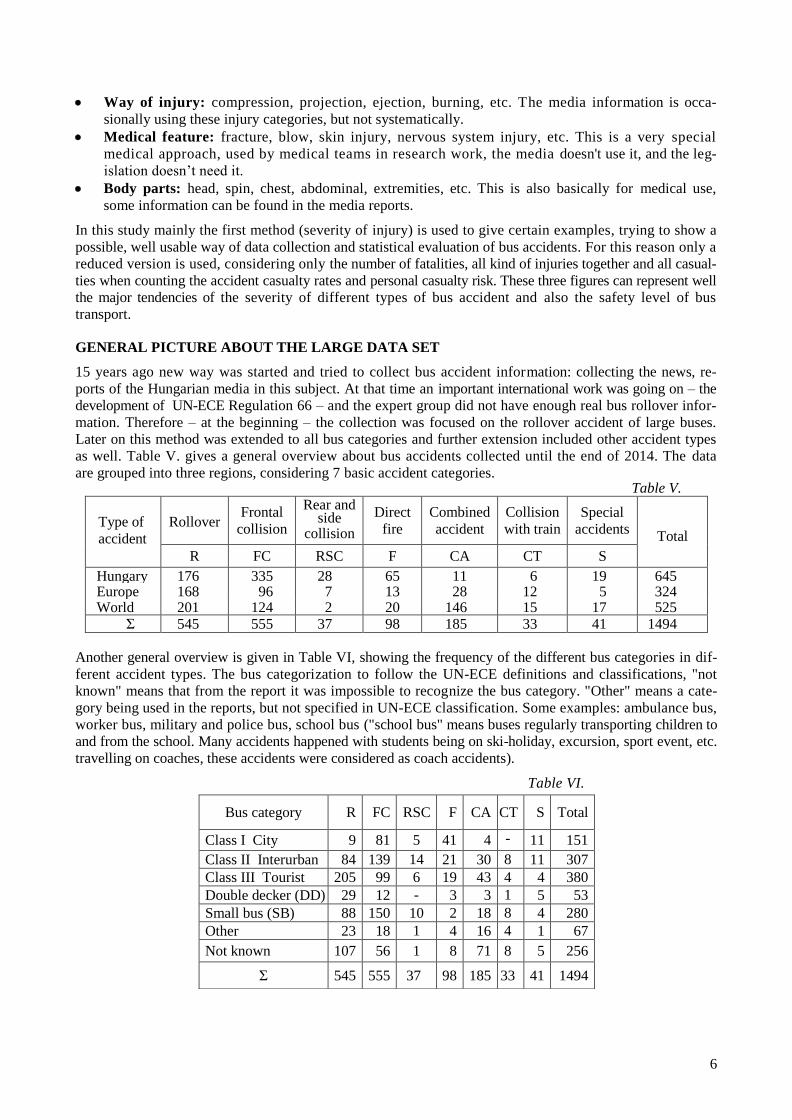
Another general overview is given in Table VI, showing the frequency of the different bus categories in dif-
ferent accident types. The bus categorization to follow the UN-ECE definitions and classifications, "not
known" means that from the report it was impossible to recognize the bus category. "Other" means a cate-
gory being used in the reports, but not specified in UN-ECE classification. Some examples: ambulance bus,
worker bus, military and police bus, school bus ("school bus" means buses regularly transporting children to
and from the school. Many accidents happened with students being on ski-holiday, excursion, sport event, etc.
travelling on coaches, these accidents were considered as coach accidents).
Table VI.
Bus category R FC RSC F CA CT S Total
Class I City 9 81 5 41 4 -
11 151
Class II Interurban 84 139 14
6
21 30 8 11 307
Class III Tourist 205 99 6
19 43 4 4 380
Double decker (DD) 29 12 -
- 3 3 1 5 53
Small bus (SB) 88 150 10 2 18 8 4 280
Other 23 18 1
4 16 4
1 67
Not known 107 56 1 8 71 8 5 256
Σ 545 555 37 98 185 33 41 1494
7
Three regions were chosen arbitrarily, of course other regions may be chosen in the future, too. Some re-
marks about these regions:
- World (without Europe) practically is not a real region. These data can be used similarly to the Eu-
ropean information. Studying this sub data set, a very important, essential problem shall be under-
lined: the distortion of the way of information collection. The majority of the accident reports were
presented by the Hungarian media. It is clear that the accident of a small bus with few casualties in Af-
rica is not interesting news in Hungary, so it will not be reported. From the far countries - (regions)
only the sever, dramatic or very special bus accidents are presented.
- Europe (without Hungary) means the geographical Europe including much more countries than EU.
(EU could be also a region). This is not a representative sample regarding the distribution of the acci-
dent types or the involved bus categories. But the data may be well usable when creating other repre-
sentative statistical samples (e.g. on the basis of injury criteria). It contains some detailed accident in-
formation for in-depth analysis as well.
- Hungary is a well-defined, closed region, this data set is almost a representative statistical sample.
Hungary is a closed region with given population, bus fleet, geographical position and road infrastruc-
ture, etc.
HUNGARY AS A “REFERENCE” REGION
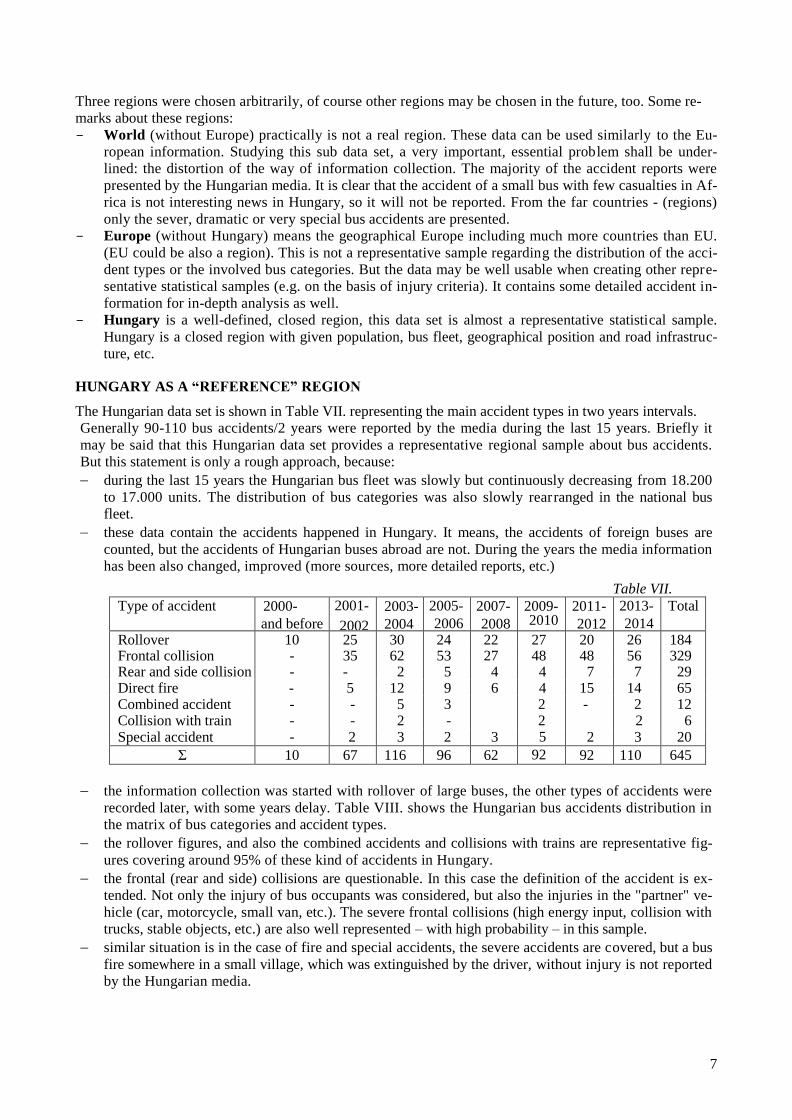
The Hungarian data set is shown in Table VII. representing the main accident types in two years intervals.
Generally 90-110 bus accidents/2 years were reported by the media during the last 15 years. Briefly it
may be said that this Hungarian data set provides a representative regional sample about bus accidents.
But this statement is only a rough approach, because:
during the last 15 years the Hungarian bus fleet was slowly but continuously decreasing from 18.200
to 17.000 units. The distribution of bus categories was also slowly rearranged in the national bus
fleet.
these data contain the accidents happened in Hungary. It means, the accidents of foreign buses are
counted, but the accidents of Hungarian buses abroad are not. During the years the media information
has been also changed, improved (more sources, more detailed reports, etc.)
Table VII.
Type of accident 2000-
and before
2001-
2002
2003-
2004
2005-
2006
2007-
2008
2009-2010
2011-
2012
2013-
2014
Total
Rollover 10 25 30 24 22 27
20 26 184 Frontal collision - 35 62 53 27 48 48 56 329 Rear and side collision - - 2 5 4 4
7 7 29 Direct fire - 5 12 9 6 4
15 14 65 Combined accident - - 5 3 2
- 2 12 Collision with train - - 2 - 2 2 6 Special accident - 2 3 2 3 5 2 3 20
Σ 10 67 116 96 62 92 92 110 645
the information collection was started with rollover of large buses, the other types of accidents were
recorded later, with some years delay. Table VIII. shows the Hungarian bus accidents distribution in
the matrix of bus categories and accident types.
the rollover figures, and also the combined accidents and collisions with trains are representative fig-
ures covering around 95% of these kind of accidents in Hungary.
the frontal (rear and side) collisions are questionable. In this case the definition of the accident is ex-
tended. Not only the injury of bus occupants was considered, but also the injuries in the "partner" ve-
hicle (car, motorcycle, small van, etc.). The severe frontal collisions (high energy input, collision with
trucks, stable objects, etc.) are also well represented – with high probability – in this sample.
similar situation is in the case of fire and special accidents, the severe accidents are covered, but a bus
fire somewhere in a small village, which was extinguished by the driver, without injury is not reported
by the Hungarian media.

8
The conclusion drawn from Table VII. and Table VIII. is that all accident types occurs in the practice, and all
bus categories are involved. The dominant accidents are the rollover and the frontal collision.
Table VIII.
Type of accident
Bus category
Rollover
Frontal
collision
Rear and
side colli-
sion
Direct
fire
Combined
accident
Collision
with train
Special
accident Total
R FC RSC F CA CT S
Class I. City bus 1 76 5 36 - - 6 124 Class II. Interurban 51 102 13 14 6 3 6 195 Class III. Tourist 40 27 4 9 3 1 3 87 DD Double deck-
er
5 3 - - 1 - 2 11 Small bus 72 98 7 3 2 2 3 187 Other 12 13 - 1 - - - 26 Not known 3 10 2 - - - 15
Σ 184 319 29 65 12 6 20 645
It was said that Hungary more or less may be assumed as a representative region. Therefore it could be in-
teresting to compare its figures to the complete data set. This comparison also proves that – in general –
the rollover and frontal collisions are the most frequent bus accident types.
OVERVIEW OF DIFFERENT ACCIDENT CATEGORIES
This chapter gives a brief overview about the severity of the different accident categories, based on the acci-
dent casualty rates (see equ.1.) It shall be underlined that these “pictures” can be used only as examples about
the way of statistical evaluation, the listed accident categories themselves are not homogenious samples. Dif-
ferent “sub”- and “sub-sub” categories may be specified in one accident category. As mentioned before, the
goal of this study is only to show the statistical method itself, therefore a reduced “severity list of injury” is
used (number of fatalities, injuries and all casualties).
Also the regional effects were neglected, thus “rollover” covers all accident happened in Hungary, Europe or
any other country of the world.
Rollover (R)
The rollover is a frequent, specific, kinematically and mechanically well-defined bus accident. As said be-
fore, the data and information collection started with rollover, getting information to the development of
UN-ECE Regulation No.66 (Strength of superstructure of buses).
The following categorization of rollover accidents are arbitrary, but it gives the possibility to evaluate the
severity of different rollover accidents and to the definition of "protectable rollover accident" (PRA):
a) turn on side: the bus rolls over, turns on its side or turns into a small ditch, but stops on its side. The
angle of rotation is between 60°-120
°, no further motion.
b) rolling down (from the road) means minimum half, maximum two rotations. The angle of rotation is
between 180-720°.
c) severe rollover means more than two rotations, or falling into a precipice. The angle of rotation is
more than 720o
d) protectable rollover accidents (PRA) in which the bus occupants may be and shall be protected reduc-
ing the fatality and injury rate. Subcategories "a" and "b" can be considered as PRA.
Some remarks to Table IX.
a), b) and c) subcategories may be considered as statistical samples. The sample sizes are large enough,
the accident situation is well defined, but their homogeneity is questionable in respect of the bus cate-
gories. The major difference between these subcategories is in the fatality rate.
the "all rollover together" is not a statistical sample it gives some kind of average figure in rollover.
at the beginning the combined rollover (when the rollover is connected with another accident ), was
discussed among rollover subcategories, in this study all the combined bus accidents form a new ac-

9
cident category. This sub-group of rollover accidents is also shown in Table IX. to give an idea about
their severity. The fatality rate is extremely high in this case.
the injury rates are close to each other and rather high. The lower figure in combined rollover is due to
the higher fatality rate. It means that more occupants are killed and less injured.
improving the UN-ECE regulation R.66, the question was raised, whether the requirements are appro-
priate, the required strength of the superstructure can reduce significantly the casualty the casualty rate
in rollover?
Table IX. compares the rollover sub-categories on the basis of casualty rates, showing their severity
Table IX.
Casualty rates
Rollover
subcategory
Number
of events Accident casualty rates (ACRx)
Fatality
rate (RF)
Injury rate
(RI)
All casualty
rate (RA)
a) turn on side 196 1,8 13,7 15,5
b) rolling down 217 8,8 17,5 26,3
c) severe rollover 132 16,5 13,7 30,2
all rollover together 545 11,0 14,1 25,1
combined rollover 116 21,7 7,4 29,1
There is an indirect way to check the effectiveness of Reg.66, based on the accident information. Considering
the rollover subcategory "d" and selecting PRA accidents in which there are unambiguous information
about the structure deformations and the survival space (SS), certain evidences may be found. This gives an
example, how to go down from the general level – using sub-sub categories – to the true, real problems get-
ting statistical evidences on the questions. Table X. shows the comparison between the two cases: the sur-
vival space was harmed (even more the superstructure collapsed), or remained intact.
Table X.
Casualty rates
Rollover subcategory
Number
of events Accident casualty rates (ACRx)
Fatality
rate (RF)
Injury rate
(R1)
All casualty
rate (RA)
All PRA 413 5,5 16,1 21,6
survival space (SS) intact 123 0,9 11,8 12,7
survival space (SS) damaged 188 13,8 12,9 26,7
These are statistical samples, but their homogeneity is questionable in respect of bus categories. The differ-
ences are striking comparing the damaged and intact survival spaces:
- fatality rate: 13,8/0,9 ≈ 15; one order difference in favour of intact SS
- all casualty rate: 26,7/12,7 ≈ 2; twice favourable figure for intact SS
This is more than significant difference in favour of the strong superstructure. The most dangerous injury
mechanism in rollover is the compression of occupants by the strongly deformed (collapsed) superstructure. It
is clear from these figures that the strong superstructure (which was not destroyed in the rollover) provides
much higher survival probability. But it is not proved by these data that the strength is consequence of an of-
ficial approval process or without that the superstructure is strong enough. On the other hand, the required
strength and the belonging approval test in Reg.66 was specified on a very detailed mechanical and energy
analysis and the goal was to ensure safe roof strength in PRA-s.
Frontal collision (FC)
This is the most complex, ramifying bus accident category. Beyond the different bus categories, different
colliding partners (objects), different directions of the impact, different occupant positions in the bus (dif-
ferent injury risk), therefore different safety requirements and protection philosophy are belonging to this
subject. This problem is discussed since many years on international level [9] [10], but by now there is no
solution, no international regulation in this subject. Only a general overview is given in this paper to show
10
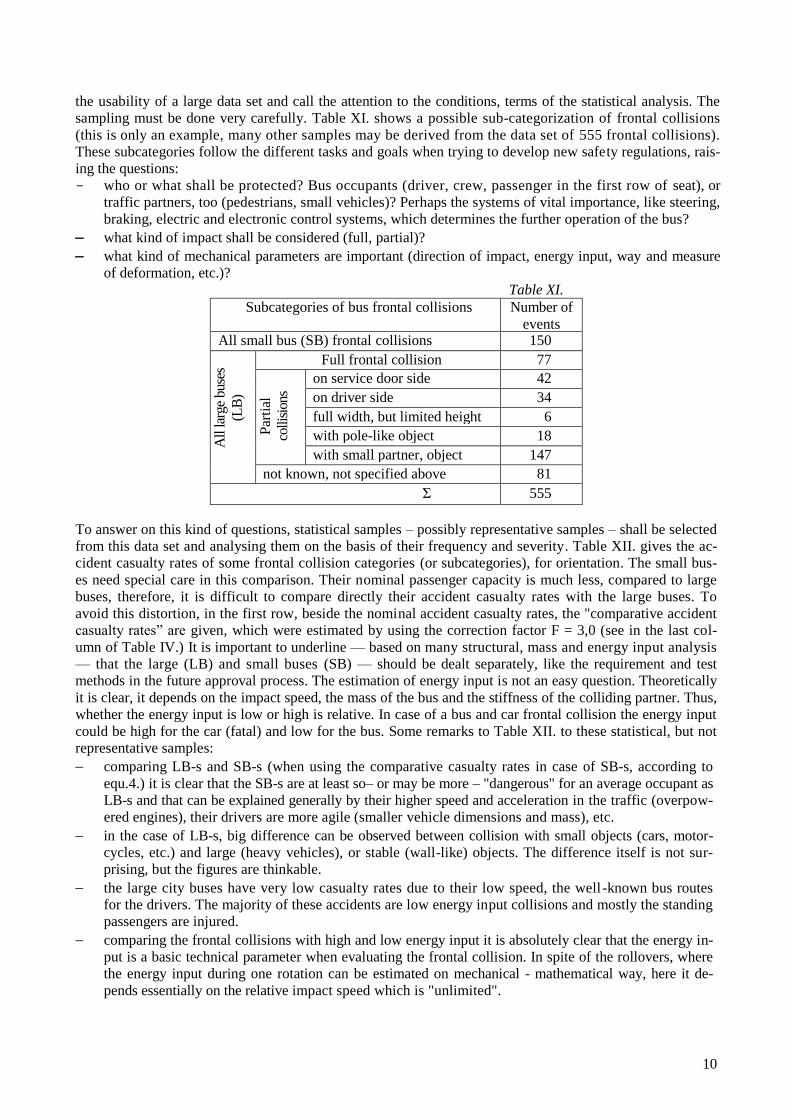
the usability of a large data set and call the attention to the conditions, terms of the statistical analysis. The
sampling must be done very carefully. Table XI. shows a possible sub-categorization of frontal collisions
(this is only an example, many other samples may be derived from the data set of 555 frontal collisions).
These subcategories follow the different tasks and goals when trying to develop new safety regulations, rais-
ing the questions:
- who or what shall be protected? Bus occupants (driver, crew, passenger in the first row of seat), or
traffic partners, too (pedestrians, small vehicles)? Perhaps the systems of vital importance, like steering,
braking, electric and electronic control systems, which determines the further operation of the bus?
what kind of impact shall be considered (full, partial)?
what kind of mechanical parameters are important (direction of impact, energy input, way and measure
of deformation, etc.)?
Table XI.
Subcategories of bus frontal collisions Number of
events All small bus (SB) frontal collisions 150
All la
rge
buse
s
(LB
)
Full frontal collision 77
Par
tial
collis
ions
on service door side 42
on driver side 34
full width, but limited height 6
with pole-like object 18
with small partner, object 147
not known, not specified above 81
Σ 555
To answer on this kind of questions, statistical samples – possibly representative samples – shall be selected
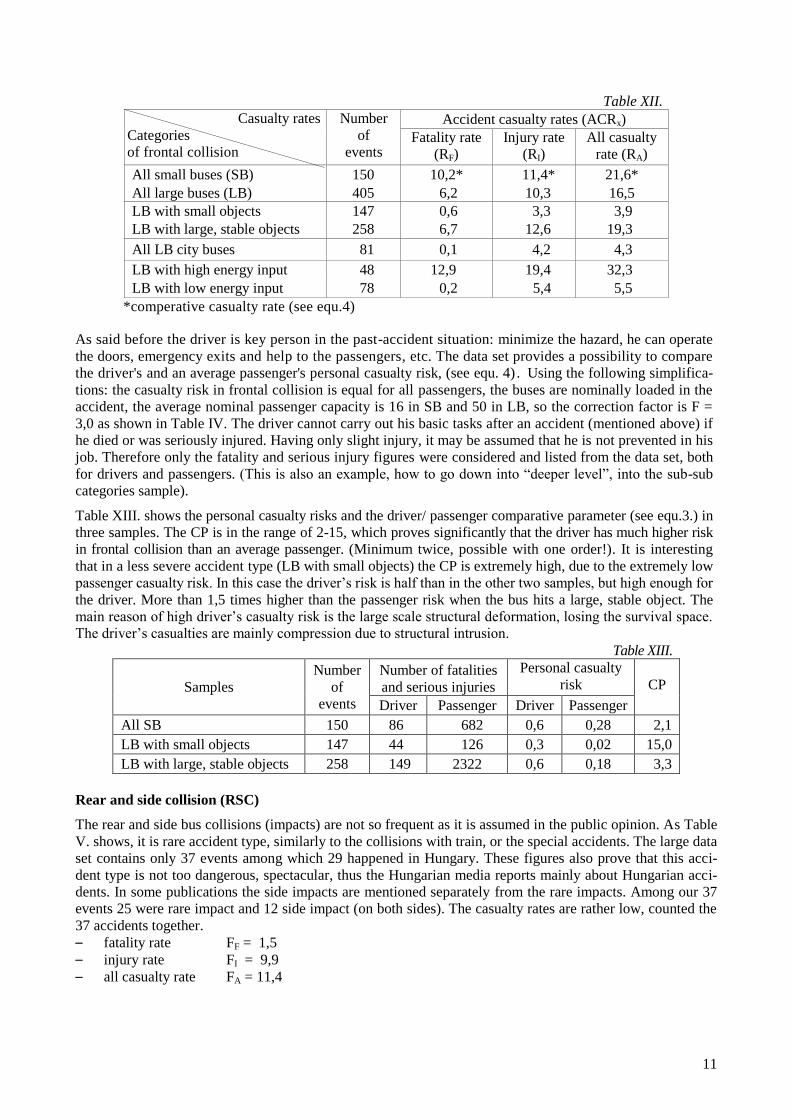
from this data set and analysing them on the basis of their frequency and severity. Table XII. gives the ac-
cident casualty rates of some frontal collision categories (or subcategories), for orientation. The small bus-
es need special care in this comparison. Their nominal passenger capacity is much less, compared to large
buses, therefore, it is difficult to compare directly their accident casualty rates with the large buses. To
avoid this distortion, in the first row, beside the nominal accident casualty rates, the "comparative accident
casualty rates” are given, which were estimated by using the correction factor F = 3,0 (see in the last col-
umn of Table IV.) It is important to underline — based on many structural, mass and energy input analysis
— that the large (LB) and small buses (SB) — should be dealt separately, like the requirement and test
methods in the future approval process. The estimation of energy input is not an easy question. Theoretically
it is clear, it depends on the impact speed, the mass of the bus and the stiffness of the colliding partner. Thus,
whether the energy input is low or high is relative. In case of a bus and car frontal collision the energy input
could be high for the car (fatal) and low for the bus. Some remarks to Table XII. to these statistical, but not
representative samples:
comparing LB-s and SB-s (when using the comparative casualty rates in case of SB-s, according to
equ.4.) it is clear that the SB-s are at least so– or may be more – "dangerous" for an average occupant as
LB-s and that can be explained generally by their higher speed and acceleration in the traffic (overpow-
ered engines), their drivers are more agile (smaller vehicle dimensions and mass), etc.
in the case of LB-s, big difference can be observed between collision with small objects (cars, motor-
cycles, etc.) and large (heavy vehicles), or stable (wall-like) objects. The difference itself is not sur-
prising, but the figures are thinkable.
the large city buses have very low casualty rates due to their low speed, the well -known bus routes
for the drivers. The majority of these accidents are low energy input collisions and mostly the standing
passengers are injured.
comparing the frontal collisions with high and low energy input it is absolutely clear that the energy in-
put is a basic technical parameter when evaluating the frontal collision. In spite of the rollovers, where
the energy input during one rotation can be estimated on mechanical - mathematical way, here it de-
pends essentially on the relative impact speed which is "unlimited".
11
Table XII.
Casualty rates
Categories
of frontal collision
Number
of
events
Accident casualty rates (ACRx)
Fatality rate
(RF)
Injury rate
(RI)
All casualty
rate (RA)
All small buses (SB) 150 10,2* 11,4* 21,6*
All large buses (LB) 405 6,2 10,3 16,5
LB with small objects 147 0,6 3,3 3,9
LB with large, stable objects 258 6,7 12,6 19,3
All LB city buses 81 0,1 4,2 4,3
LB with high energy input 48 12,9 19,4 32,3
LB with low energy input 78 0,2 5,4 5,5
*comperative casualty rate (see equ.4)
As said before the driver is key person in the past-accident situation: minimize the hazard, he can operate
the doors, emergency exits and help to the passengers, etc. The data set provides a possibility to compare
the driver's and an average passenger's personal casualty risk, (see equ. 4) . Using the following simplifica-
tions: the casualty risk in frontal collision is equal for all passengers, the buses are nominally loaded in the
accident, the average nominal passenger capacity is 16 in SB and 50 in LB, so the correction factor is F =
3,0 as shown in Table IV. The driver cannot carry out his basic tasks after an accident (mentioned above) if
he died or was seriously injured. Having only slight injury, it may be assumed that he is not prevented in his
job. Therefore only the fatality and serious injury figures were considered and listed from the data set, both
for drivers and passengers. (This is also an example, how to go down into “deeper level”, into the sub-sub
categories sample).
Table XIII. shows the personal casualty risks and the driver/ passenger comparative parameter (see equ.3.) in
three samples. The CP is in the range of 2-15, which proves significantly that the driver has much higher risk
in frontal collision than an average passenger. (Minimum twice, possible with one order!). It is interesting
that in a less severe accident type (LB with small objects) the CP is extremely high, due to the extremely low
passenger casualty risk. In this case the driver’s risk is half than in the other two samples, but high enough for
the driver. More than 1,5 times higher than the passenger risk when the bus hits a large, stable object. The
main reason of high driver’s casualty risk is the large scale structural deformation, losing the survival space.
The driver’s casualties are mainly compression due to structural intrusion.
Table XIII.
Samples
Number
of
events
Number of fatalities
and serious injuries
Personal casualty
risk
CP
Driver Passenger Driver Passenger
All SB 150 86 682 0,6 0,28 2,1
LB with small objects 147 44 126 0,3 0,02 15,0
LB with large, stable objects 258 149 2322 0,6 0,18 3,3
Rear and side collision (RSC)
The rear and side bus collisions (impacts) are not so frequent as it is assumed in the public opinion. As Table
V. shows, it is rare accident type, similarly to the collisions with train, or the special accidents. The large data
set contains only 37 events among which 29 happened in Hungary. These figures also prove that this acci-
dent type is not too dangerous, spectacular, thus the Hungarian media reports mainly about Hungarian acci-
dents. In some publications the side impacts are mentioned separately from the rare impacts. Among our 37
events 25 were rare impact and 12 side impact (on both sides). The casualty rates are rather low, counted the
37 accidents together.
– fatality rate FF = 1,5
– injury rate FI = 9,9
– all casualty rate FA = 11,4
12
It shall be emphasized again that this is not a representative sample (sample size, different types and subcate-
gories of these collisions, different bus categories) therefore the figures shown above are just for orientation.
It is worthwhile to fix three conclusions:
- The reason of the lower severity (lower casualty rates) of this kind of accident is that the survival space
of the passengers generally are not harmed. The transverse stiffnes of the frame structure is high, simili-
arly to the engine compartment equipped with large, bulky main components.
- The major problem can be the damage of the doors and door operating systems in door-side impact.
This can block or slow down the evacuation of the bus. In the future regulatory work mainly this second
problem shall be considered, rather than the occupant protection.
Bus fires. (F)
Basically there are two different kinds of bus fire:
direct fire, when the fire starts in the bus without any outside effect. These bus fires can be put into
two subcategories:
when the fire is detected in early stage (by the driver, passengers, people from the street, or a
fire detector) so the driver stops the bus and passengers can evacuate through the service doors.
when the fire reaches a full grown stage before recognizing it (high temperature, smoke, failure
in the door opening system, panic, etc.), and the passengers cannot evacuate the bus.
fire in combined accident, when the fire is the consequence of a previous accident (rollover, collision
etc.) which is an outside effect.
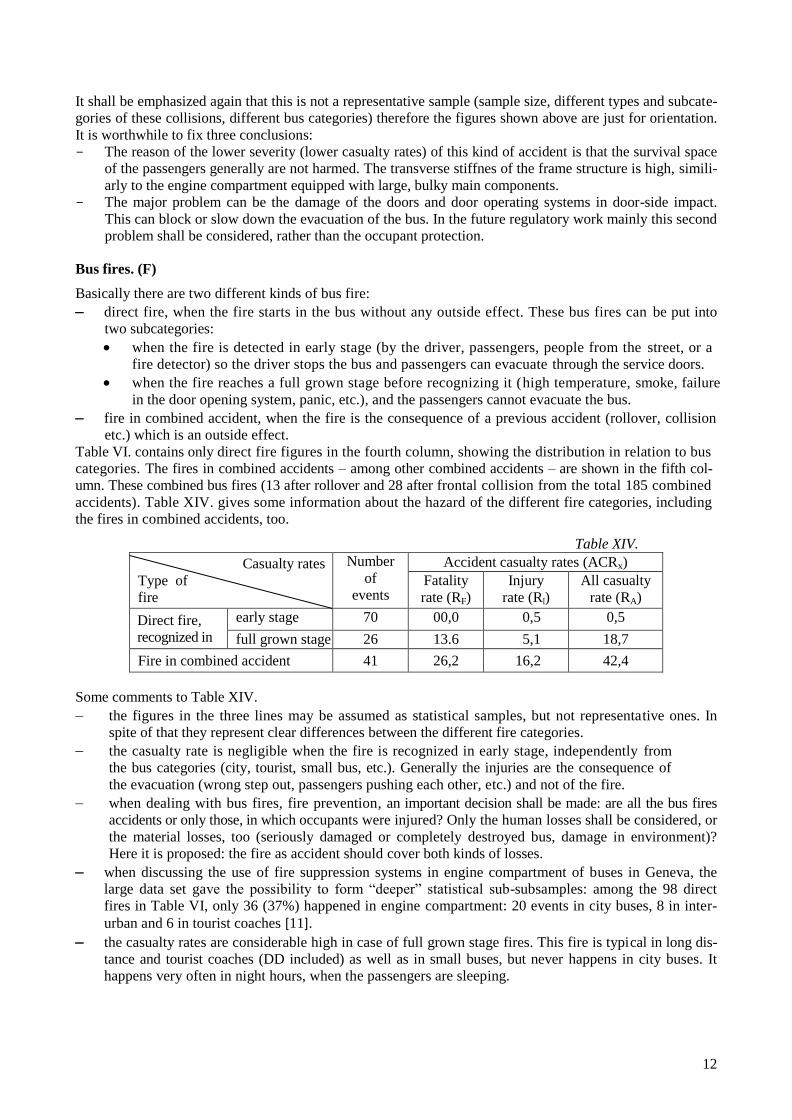
Table VI. contains only direct fire figures in the fourth column, showing the distribution in relation to bus
categories. The fires in combined accidents – among other combined accidents – are shown in the fifth col-
umn. These combined bus fires (13 after rollover and 28 after frontal collision from the total 185 combined
accidents). Table XIV. gives some information about the hazard of the different fire categories, including
the fires in combined accidents, too.
Table XIV.
Casualty rates
Type of
fire
Number
of
events
Accident casualty rates (ACRx)
Fatality
rate (RF)
Injury
rate (RI)
All casualty
rate (RA)
Direct fire,
recognized in
early stage 70 00,0 0,5 0,5
full grown stage 26 13.6 5,1 18,7
Fire in combined accident 41 26,2 16,2 42,4
Some comments to Table XIV.
the figures in the three lines may be assumed as statistical samples, but not representative ones. In
spite of that they represent clear differences between the different fire categories.
the casualty rate is negligible when the fire is recognized in early stage, independently from
the bus categories (city, tourist, small bus, etc.). Generally the injuries are the consequence of
the evacuation (wrong step out, passengers pushing each other, etc.) and not of the fire.
when dealing with bus fires, fire prevention, an important decision shall be made: are all the bus fires
accidents or only those, in which occupants were injured? Only the human losses shall be considered, or
the material losses, too (seriously damaged or completely destroyed bus, damage in environment)?
Here it is proposed: the fire as accident should cover both kinds of losses.
when discussing the use of fire suppression systems in engine compartment of buses in Geneva, the
large data set gave the possibility to form “deeper” statistical sub-subsamples: among the 98 direct
fires in Table VI, only 36 (37%) happened in engine compartment: 20 events in city buses, 8 in inter-
urban and 6 in tourist coaches [11].
the casualty rates are considerable high in case of full grown stage fires. This fire is typical in long dis-
tance and tourist coaches (DD included) as well as in small buses, but never happens in city buses. It
happens very often in night hours, when the passengers are sleeping.
13
the fire in combined accident is one of the most dangerous accident types. The casualty rates are ex-
tremely high and it is impossible to separate which casualty is the consequence of the first accident
and which is caused by the fire. The bus generally burns out completely.
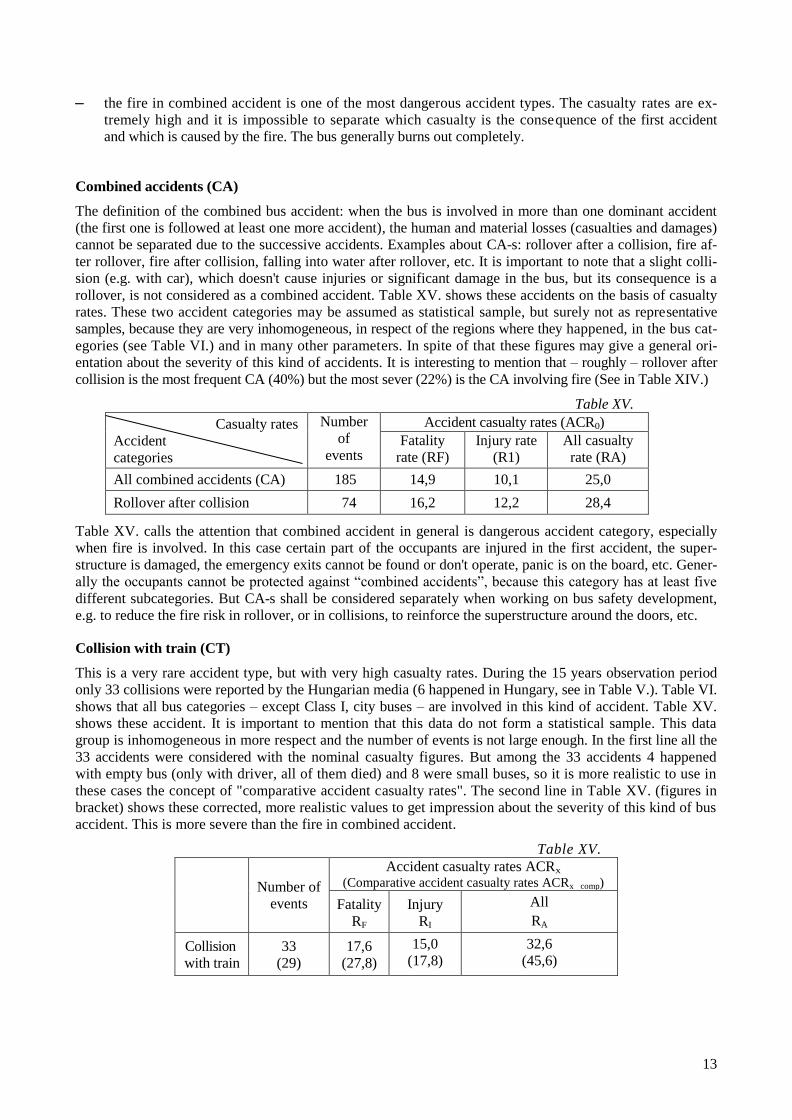
Combined accidents (CA)
The definition of the combined bus accident: when the bus is involved in more than one dominant accident
(the first one is followed at least one more accident), the human and material losses (casualties and damages)
cannot be separated due to the successive accidents. Examples about CA-s: rollover after a collision, fire af-
ter rollover, fire after collision, falling into water after rollover, etc. It is important to note that a slight colli-
sion (e.g. with car), which doesn't cause injuries or significant damage in the bus, but its consequence is a
rollover, is not considered as a combined accident. Table XV. shows these accidents on the basis of casualty
rates. These two accident categories may be assumed as statistical sample, but surely not as representative
samples, because they are very inhomogeneous, in respect of the regions where they happened, in the bus cat-
egories (see Table VI.) and in many other parameters. In spite of that these figures may give a general ori-
entation about the severity of this kind of accidents. It is interesting to mention that – roughly – rollover after
collision is the most frequent CA (40%) but the most sever (22%) is the CA involving fire (See in Table XIV.)
Table XV.
Casualty rates
Accident
categories
Number
of
events
Accident casualty rates (ACR0)
Fatality
rate (RF)
Injury rate
(R1)
All casualty
rate (RA)
All combined accidents (CA) 185 14,9 10,1 25,0
Rollover after collision 74 16,2 12,2 28,4
Table XV. calls the attention that combined accident in general is dangerous accident category, especially
when fire is involved. In this case certain part of the occupants are injured in the first accident, the super-
structure is damaged, the emergency exits cannot be found or don't operate, panic is on the board, etc. Gener-
ally the occupants cannot be protected against “combined accidents”, because this category has at least five
different subcategories. But CA-s shall be considered separately when working on bus safety development,
e.g. to reduce the fire risk in rollover, or in collisions, to reinforce the superstructure around the doors, etc.
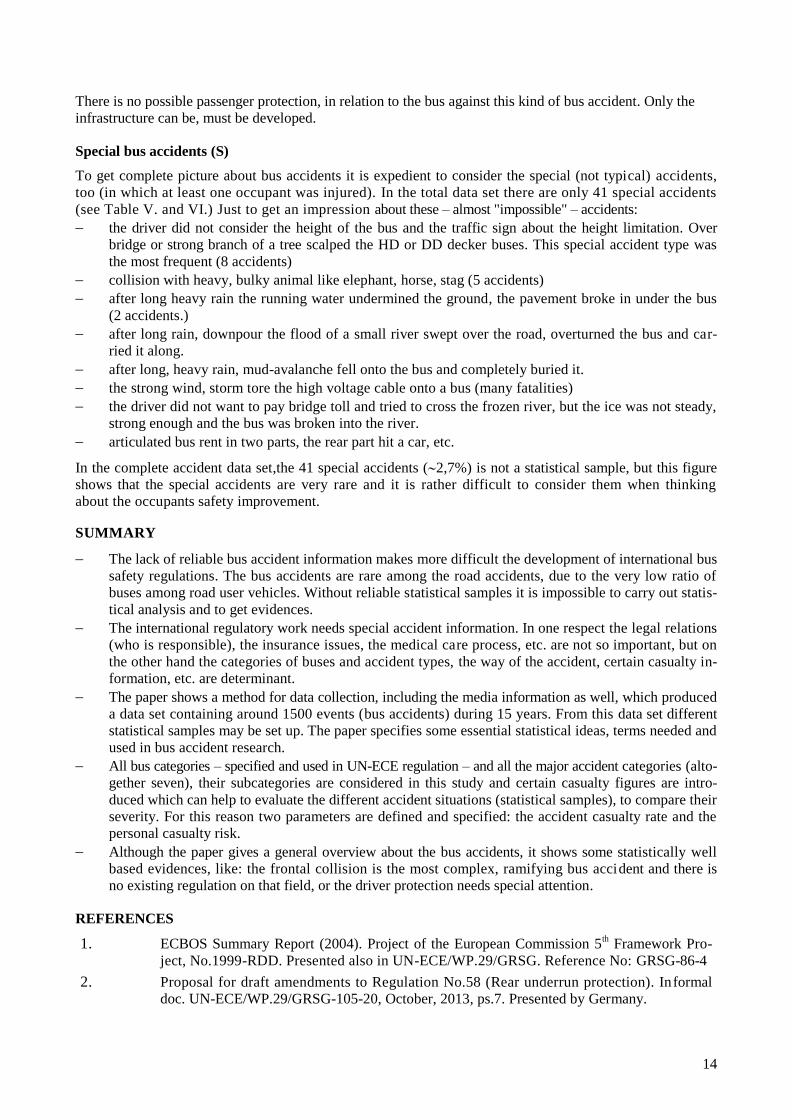
Collision with train (CT)
This is a very rare accident type, but with very high casualty rates. During the 15 years observation period
only 33 collisions were reported by the Hungarian media (6 happened in Hungary, see in Table V.). Table VI.
shows that all bus categories – except Class I, city buses – are involved in this kind of accident. Table XV.
shows these accident. It is important to mention that this data do not form a statistical sample. This data
group is inhomogeneous in more respect and the number of events is not large enough. In the first line all the
33 accidents were considered with the nominal casualty figures. But among the 33 accidents 4 happened
with empty bus (only with driver, all of them died) and 8 were small buses, so it is more realistic to use in
these cases the concept of "comparative accident casualty rates". The second line in Table XV. (figures in
bracket) shows these corrected, more realistic values to get impression about the severity of this kind of bus
accident. This is more severe than the fire in combined accident.
Table XV.
Number of
events
Accident casualty rates ACRx (Comparative accident casualty rates ACRx comp)
Fatality
RF
Injury
RI
All
RA
Collision
with train
33
(29)
17,6
(27,8)
15,0
(17,8)
32,6
(45,6)
14
There is no possible passenger protection, in relation to the bus against this kind of bus accident. Only the
infrastructure can be, must be developed.
Special bus accidents (S)
To get complete picture about bus accidents it is expedient to consider the special (not typical) accidents,
too (in which at least one occupant was injured). In the total data set there are only 41 special accidents
(see Table V. and VI.) Just to get an impression about these – almost "impossible" – accidents:
the driver did not consider the height of the bus and the traffic sign about the height limitation. Over
bridge or strong branch of a tree scalped the HD or DD decker buses. This special accident type was
the most frequent (8 accidents)
collision with heavy, bulky animal like elephant, horse, stag (5 accidents)
after long heavy rain the running water undermined the ground, the pavement broke in under the bus
(2 accidents.)
after long rain, downpour the flood of a small river swept over the road, overturned the bus and car-
ried it along.
after long, heavy rain, mud-avalanche fell onto the bus and completely buried it.
the strong wind, storm tore the high voltage cable onto a bus (many fatalities)
the driver did not want to pay bridge toll and tried to cross the frozen river, but the ice was not steady,
strong enough and the bus was broken into the river.
articulated bus rent in two parts, the rear part hit a car, etc.
In the complete accident data set,the 41 special accidents (2,7%) is not a statistical sample, but this figure
shows that the special accidents are very rare and it is rather difficult to consider them when thinking
about the occupants safety improvement.
SUMMARY
The lack of reliable bus accident information makes more difficult the development of international bus
safety regulations. The bus accidents are rare among the road accidents, due to the very low ratio of
buses among road user vehicles. Without reliable statistical samples it is impossible to carry out statis-
tical analysis and to get evidences.
The international regulatory work needs special accident information. In one respect the legal relations
(who is responsible), the insurance issues, the medical care process, etc. are not so important, but on
the other hand the categories of buses and accident types, the way of the accident, certain casualty in-
formation, etc. are determinant.
The paper shows a method for data collection, including the media information as well, which produced
a data set containing around 1500 events (bus accidents) during 15 years. From this data set different
statistical samples may be set up. The paper specifies some essential statistical ideas, terms needed and
used in bus accident research.
All bus categories – specified and used in UN-ECE regulation – and all the major accident categories (alto-
gether seven), their subcategories are considered in this study and certain casualty figures are intro-
duced which can help to evaluate the different accident situations (statistical samples), to compare their
severity. For this reason two parameters are defined and specified: the accident casualty rate and the
personal casualty risk.
Although the paper gives a general overview about the bus accidents, it shows some statistically well
based evidences, like: the frontal collision is the most complex, ramifying bus accident and there is
no existing regulation on that field, or the driver protection needs special attention.
REFERENCES
1. ECBOS Summary Report (2004). Project of the European Commission 5th Framework Pro-
ject, No.1999-RDD. Presented also in UN-ECE/WP.29/GRSG. Reference No: GRSG-86-4
2. Proposal for draft amendments to Regulation No.58 (Rear underrun protection). Informal
doc. UN-ECE/WP.29/GRSG-105-20, October, 2013, ps.7. Presented by Germany.
15
3. Annual Bulletin of Transport Statistics. United Nations, 2012.
4. Matolcsy M. Background to the statistical analysis of bus rollover accidents. Science and Motor Ve-
hicles Conference, 2013 Belgrade, ps. 15
5. Conclusion of a sever accident. Informal doe. UN-ECE/WP.29/GRSG-102-03 (2012) Pre-
sented by Hungary.
6. Matolcsy M. Study of small and double deck coach rollover accidents. Conference on International In-
novative Automotive Technology IAT'07, Rogla, Slovenia 2007. ps.9.
7. Matolcsy M. Statistical evaluation of bus rollover accidents. Results and difficulties. Securitas Vialis
(2013) No.14. ps.20.
8. Brief description about a serious rollover accident. Informal doc. UN-ECE/
WP.29 /GRSG-83-10 (2002), ps.7 Presented by Hungary.
9. Frontal collision of buses. Informal doc. UN-ECE/WP.29/GRSG-92-7 (2007) Presented
by Hungary.
10. Driver and crew protection in frontal collision- of buses. Informal doc. UN-ECE/
WP.29/GRSG-96-33 (2009) Presented by Hungary.
11. Statistical information about fires in different bus categories and Classes. UN-
ECE/EP.29/GRSG-108-10 (2015), Presented by Hungary