Embed Size (px)
Citation preview
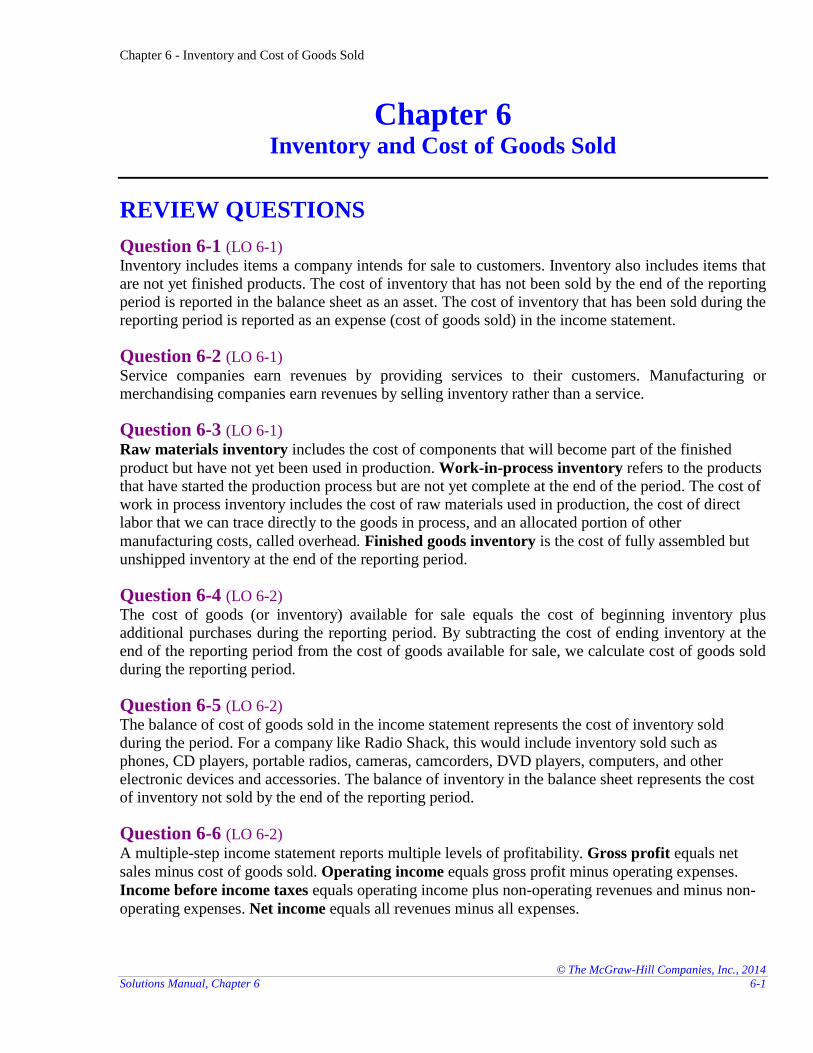
Chapter 6 - Inventory and Cost of Goods Sold
© The McGraw-Hill Companies, Inc., 2014
Solutions Manual, Chapter 6 6-1
Chapter 6 Inventory and Cost of Goods Sold
REVIEW QUESTIONS
Question 6-1 (LO 6-1) Inventory includes items a company intends for sale to customers. Inventory also includes items that
are not yet finished products. The cost of inventory that has not been sold by the end of the reporting
period is reported in the balance sheet as an asset. The cost of inventory that has been sold during the
reporting period is reported as an expense (cost of goods sold) in the income statement.
Question 6-2 (LO 6-1) Service companies earn revenues by providing services to their customers. Manufacturing or
merchandising companies earn revenues by selling inventory rather than a service.
Question 6-3 (LO 6-1) Raw materials inventory includes the cost of components that will become part of the finished
product but have not yet been used in production. Work-in-process inventory refers to the products
that have started the production process but are not yet complete at the end of the period. The cost of
work in process inventory includes the cost of raw materials used in production, the cost of direct
labor that we can trace directly to the goods in process, and an allocated portion of other
manufacturing costs, called overhead. Finished goods inventory is the cost of fully assembled but
unshipped inventory at the end of the reporting period.
Question 6-4 (LO 6-2) The cost of goods (or inventory) available for sale equals the cost of beginning inventory plus
additional purchases during the reporting period. By subtracting the cost of ending inventory at the
end of the reporting period from the cost of goods available for sale, we calculate cost of goods sold
during the reporting period.
Question 6-5 (LO 6-2) The balance of cost of goods sold in the income statement represents the cost of inventory sold
during the period. For a company like Radio Shack, this would include inventory sold such as
phones, CD players, portable radios, cameras, camcorders, DVD players, computers, and other
electronic devices and accessories. The balance of inventory in the balance sheet represents the cost
of inventory not sold by the end of the reporting period.
Question 6-6 (LO 6-2) A multiple-step income statement reports multiple levels of profitability. Gross profit equals net
sales minus cost of goods sold. Operating income equals gross profit minus operating expenses.
Income before income taxes equals operating income plus non-operating revenues and minus non-
operating expenses. Net income equals all revenues minus all expenses.
Chapter 6 - Inventory and Cost of Goods Sold
© The McGraw-Hill Companies, Inc., 2014
6-2 Financial Accounting, 3e
Answers to Review Questions (continued)
Question 6-7 (LO 6-3) Because of the large number of inventory transactions for most companies and the high volatility in
many inventory costs, it is not possible or cost effective to identify the cost of each item sold.
Therefore, assumptions are made as to which units of inventory are sold.
Question 6-8 (LO 6-3) The three most common inventory cost flow assumptions are FIFO (first-in, first-out), LIFO (last-in,
first-out), and weighted-average cost. These methods provide assumptions as to which inventory
units are sold, whereas the specific identification method matches or identifies each unit of inventory
with its actual cost.
Question 6-9 (LO 6-4) FIFO results in the highest reported amount for ending inventory when inventory costs are rising.
The reason is that under the FIFO method, the oldest (or first) items are sold first and these are the
lower-cost items, leaving the higher-cost items to be reported in ending inventory.
Question 6-10 (LO 6-4) FIFO results in the highest reported amount of net income when inventory costs are rising. The
reason is that under the FIFO method, the oldest (or first) items are sold first and these are the lower-
cost items. Reporting cost of goods sold based on the lower-cost items results in net income being
higher.
Question 6-11 (LO 6-4) Since FIFO assumes the first purchases sell first, the amount it reports for ending inventory (in the
balance sheet) better approximates the current cost of inventory. LIFO assumes the last purchases are
sold first, reporting the most recent inventory cost in cost of goods sold (in the income statement).
Thus, LIFO more realistically matches the current costs of inventory needed to produce current
revenues.
Question 6-12 (LO 6-4) LIFO generally results in lower income taxes payable when inventory costs are increasing because
net income in this case is lower (than if FIFO were used). The LIFO conformity rule requires a
company that uses LIFO for tax reporting to also use LIFO for financial reporting.
Question 6-13 (LO 6-5) The perpetual inventory system maintains a continual – or perpetual – record of inventory purchased
and sold, while the periodic system periodically adjusts for purchases and sales of inventory at the
end of the reporting period.
Question 6-14 (LO 6-5) Freight charges add to the cost of inventory, while purchase discounts and purchase returns reduce
the cost of inventory.
Chapter 6 - Inventory and Cost of Goods Sold
© The McGraw-Hill Companies, Inc., 2014
Solutions Manual, Chapter 6 6-3
Answers to Review Questions (continued)
Question 6-15 (LO 6-6) We report inventory using the lower-of-cost-or-market method, that is, at cost (specific
identification, FIFO, LIFO, or weighted-average cost) or market value (normally, replacement cost),
whichever is lower. When market value falls below cost, we adjust inventory down from cost to
market value.
Question 6-16 (LO 6-6) The cost of inventory is determined using specific identification, FIFO, LIFO, or weighted-average
cost. Market value is determined using replacement cost. Replacement cost is the cost to replace the
inventory item in its identical form.
Question 6-17 (LO 6-6) The entry to adjust from cost to market for inventory write-downs includes a debit to cost of goods
sold (increase to expenses) and a credit to inventory (decrease to assets). The adjustment has the
following effects:
(a) assets (inventory) = decrease
(b) liabilities = no effect
(c) stockholders’ equity (or retained earnings) = decrease
(d) revenues = no effect
(e) expenses (cost of goods sold) = increase
(f) net income = decrease
Question 6-18 (LO 6-6) Firms are required to report the falling value of inventory but not allowed to report the increasing
value of inventory. Conservative accounting implies that there is more potential harm to users of
financial statements if estimated gains turn out to be wrong than if estimated losses turn out to be
wrong. Therefore, companies typically do not report estimated gains.
Question 6-19 (LO 6-7)
The inventory turnover ratio equals cost of goods sold divided by average inventory. The ratio shows
the number of times the firm sells its average inventory balance during a reporting period. The more
frequently a business is able to sell or “turn over” its average inventory balance, the less the company
needs to invest in inventory for a given level of sales. Typically, a higher ratio indicates greater
effectiveness of a company in managing its investment in inventory.
Chapter 6 - Inventory and Cost of Goods Sold
© The McGraw-Hill Companies, Inc., 2014
6-4 Financial Accounting, 3e
Answers to Review Questions (continued)
Question 6-20 (LO 6-7) Gross profit equals net sales minus cost of goods sold. The gross profit ratio equals gross profit
divided by net sales. The gross profit ratio measures the amount by which the sale price of inventory
exceeds its cost per dollar of sales. The higher the ratio, the higher is the “markup” a company is able
to achieve on its inventories.
Question 6-21 (LO 6-8) Under the periodic system, the sale of inventory is recorded by increasing an asset account (cash or
accounts receivable) and increasing sales revenue. Under the perpetual system, two transactions are
recorded. The first entry is the same as that under the periodic system. The second entry involves
recording the cost of goods sold and decreasing inventory.
Question 6-22 (LO 6-8) The purposes of the period-end adjustment are to (1) update the balance of inventory for its ending
amount, (2) record cost of goods sold, and (3) close the temporary purchases accounts to zero.
Question 6-23 (LO 6-9) Understating ending inventory in the current year will have the following effects in the current year:
(a) assets (inventory) = understated
(b) liabilities = no effect
(c) stockholders’ equity (or retained earnings) = understated
(d) revenues = no effect
(e) expenses (cost of goods sold) = overstated
(f) net income = understated
Question 6-24 (LO 6-9) Understating ending inventory in the current year will have the following effects in the following
year:
(a) assets (inventory) = no effect
(b) liabilities = no effect
(c) stockholders’ equity (or retained earnings) = no effect
(d) revenues = no effect
(e) expenses (cost of goods sold) = understated
(f) net income = overstated
Chapter 6 - Inventory and Cost of Goods Sold
© The McGraw-Hill Companies, Inc., 2014
Solutions Manual, Chapter 6 6-5
BRIEF EXERCISES
Brief Exercise 6-1 (LO 6-1)
1. b.
2. a.
3. c.
Brief Exercise 6-2 (LO 6-1)
1. c.
2. a.
3. b.
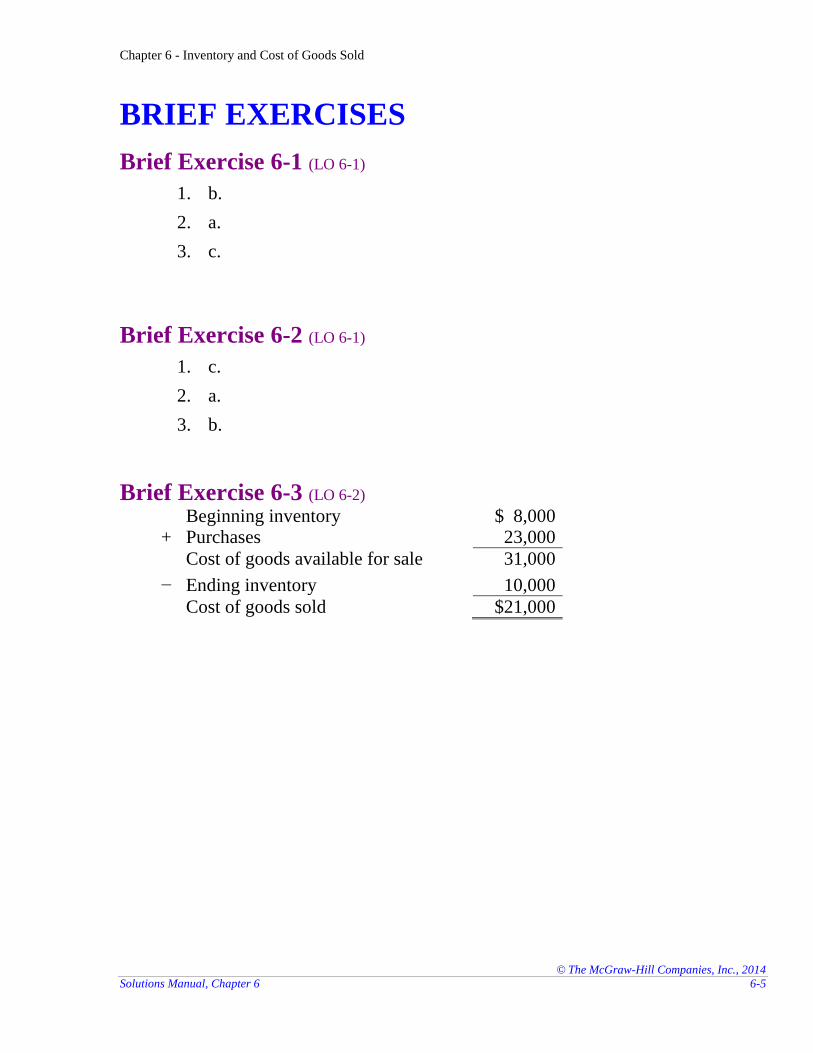
Brief Exercise 6-3 (LO 6-2) Beginning inventory $ 8,000
+ Purchases 23,000
Cost of goods available for sale 31,000
− Ending inventory 10,000
Cost of goods sold $21,000
Chapter 6 - Inventory and Cost of Goods Sold
© The McGraw-Hill Companies, Inc., 2014
6-6 Financial Accounting, 3e
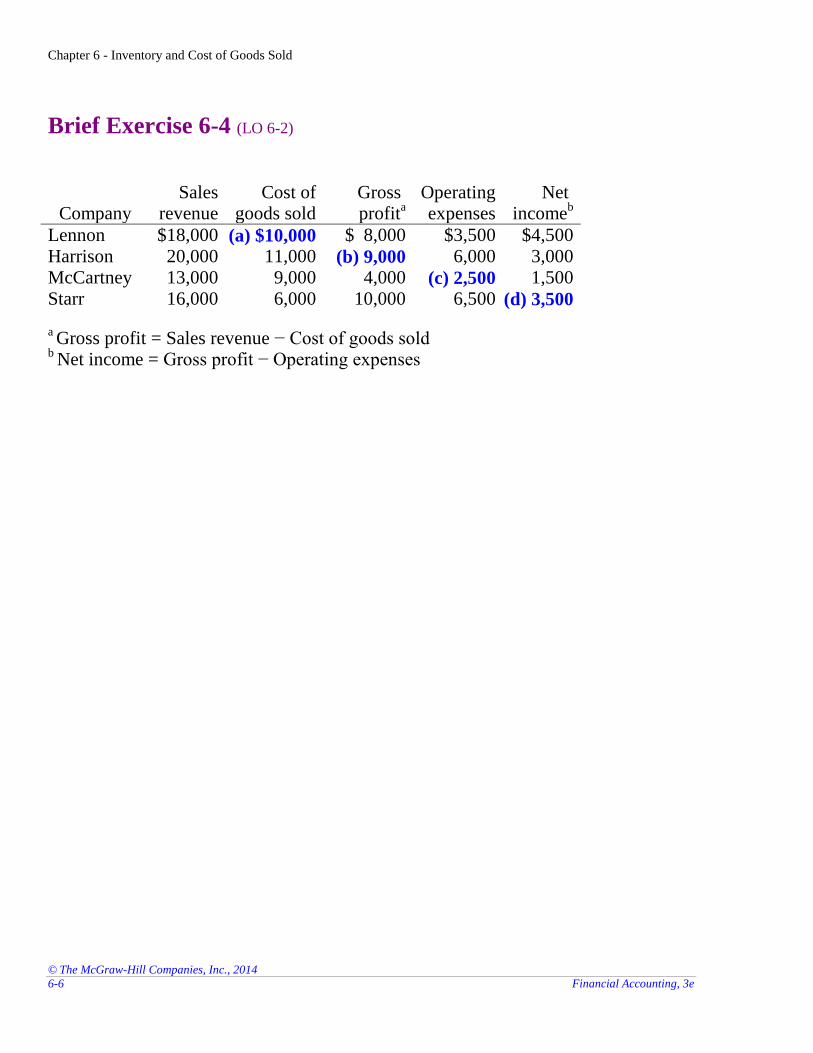
Brief Exercise 6-4 (LO 6-2)
Company Sales
revenue Cost of
goods sold Gross profit
a
Operating expenses
Net income
b
Lennon $18,000 (a) $10,000 $ 8,000 $3,500 $4,500
Harrison 20,000 11,000 (b) 9,000 6,000 3,000
McCartney 13,000 9,000 4,000 (c) 2,500 1,500
Starr 16,000 6,000 10,000 6,500 (d) 3,500 a Gross profit = Sales revenue − Cost of goods sold
b Net income = Gross profit − Operating expenses
Chapter 6 - Inventory and Cost of Goods Sold
© The McGraw-Hill Companies, Inc., 2014
Solutions Manual, Chapter 6 6-7
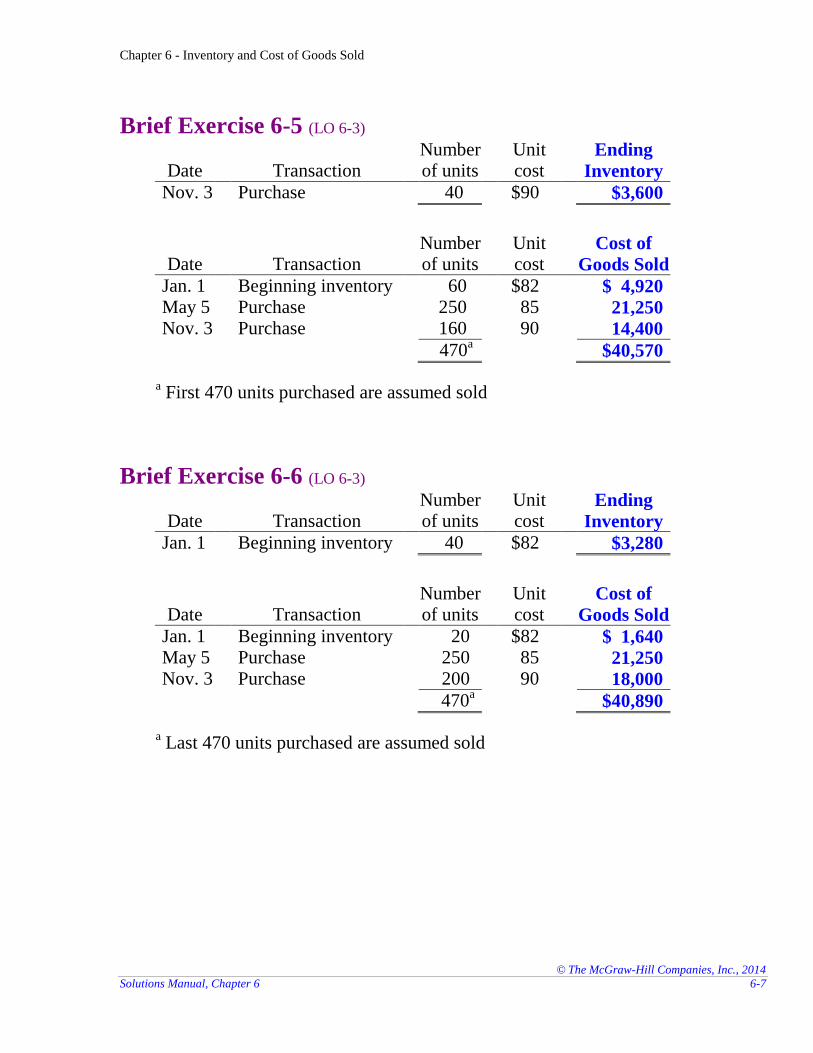
Brief Exercise 6-5 (LO 6-3)
Date Transaction Number of units
Unit cost
Ending
Inventory
Nov. 3 Purchase 40 $90 $3,600
Date Transaction Number of units
Unit cost
Cost of
Goods Sold
Jan. 1 Beginning inventory 60 $82 $ 4,920 May 5 Purchase 250 85 21,250 Nov. 3 Purchase 160 90 14,400
470a $40,570
a First 470 units purchased are assumed sold
Brief Exercise 6-6 (LO 6-3)
Date Transaction Number of units
Unit cost
Ending
Inventory
Jan. 1 Beginning inventory 40 $82 $3,280
Date Transaction Number of units
Unit cost
Cost of
Goods Sold
Jan. 1 Beginning inventory 20 $82 $ 1,640 May 5 Purchase 250 85 21,250 Nov. 3 Purchase 200 90 18,000
470a $40,890
a Last 470 units purchased are assumed sold
Chapter 6 - Inventory and Cost of Goods Sold
© The McGraw-Hill Companies, Inc., 2014
6-8 Financial Accounting, 3e
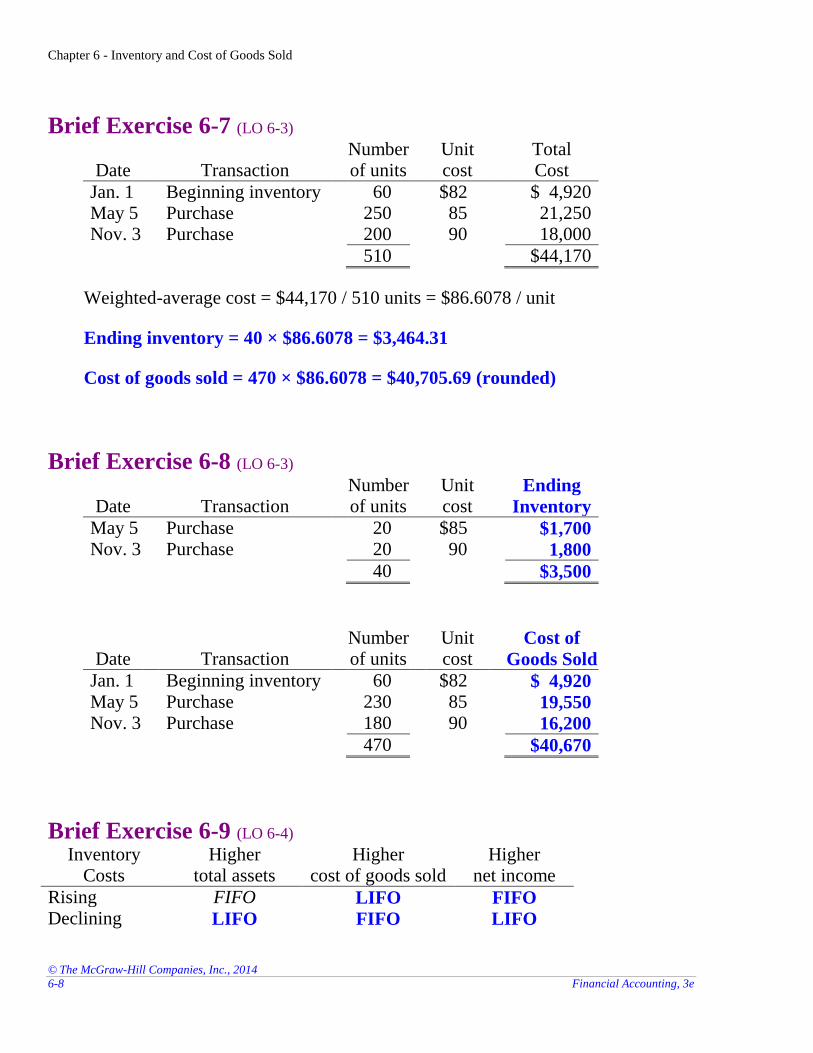
Brief Exercise 6-7 (LO 6-3)
Date Transaction Number of units
Unit cost
Total Cost
Jan. 1 Beginning inventory 60 $82 $ 4,920 May 5 Purchase 250 85 21,250 Nov. 3 Purchase 200 90 18,000
510 $44,170
Weighted-average cost = $44,170 / 510 units = $86.6078 / unit
Ending inventory = 40 × $86.6078 = $3,464.31
Cost of goods sold = 470 × $86.6078 = $40,705.69 (rounded)
Brief Exercise 6-8 (LO 6-3)
Date Transaction Number of units
Unit cost
Ending
Inventory
May 5 Purchase 20 $85 $1,700 Nov. 3 Purchase 20 90 1,800
40 $3,500
Date Transaction Number of units
Unit cost
Cost of
Goods Sold
Jan. 1 Beginning inventory 60 $82 $ 4,920 May 5 Purchase 230 85 19,550 Nov. 3 Purchase 180 90 16,200
470 $40,670
Brief Exercise 6-9 (LO 6-4) Inventory
Costs Higher
total assets Higher
cost of goods sold Higher
net income
Rising FIFO LIFO FIFO Declining LIFO FIFO LIFO
Chapter 6 - Inventory and Cost of Goods Sold
© The McGraw-Hill Companies, Inc., 2014
Solutions Manual, Chapter 6 6-9
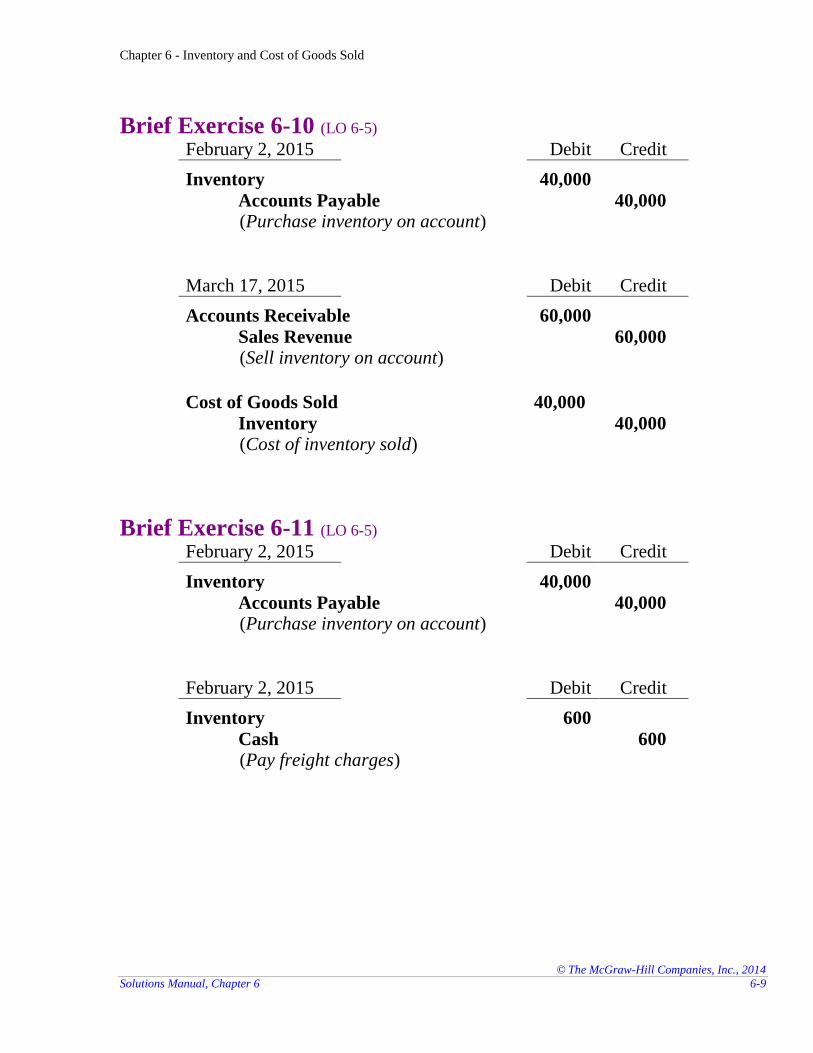
Brief Exercise 6-10 (LO 6-5) February 2, 2015 Debit Credit
Inventory 40,000
Accounts Payable 40,000 (Purchase inventory on account)
March 17, 2015 Debit Credit
Accounts Receivable 60,000
Sales Revenue 60,000 (Sell inventory on account)
Cost of Goods Sold 40,000
Inventory 40,000 (Cost of inventory sold)
Brief Exercise 6-11 (LO 6-5) February 2, 2015 Debit Credit
Inventory 40,000
Accounts Payable 40,000 (Purchase inventory on account)
February 2, 2015 Debit Credit
Inventory 600
Cash 600 (Pay freight charges)
Chapter 6 - Inventory and Cost of Goods Sold
© The McGraw-Hill Companies, Inc., 2014
6-10 Financial Accounting, 3e
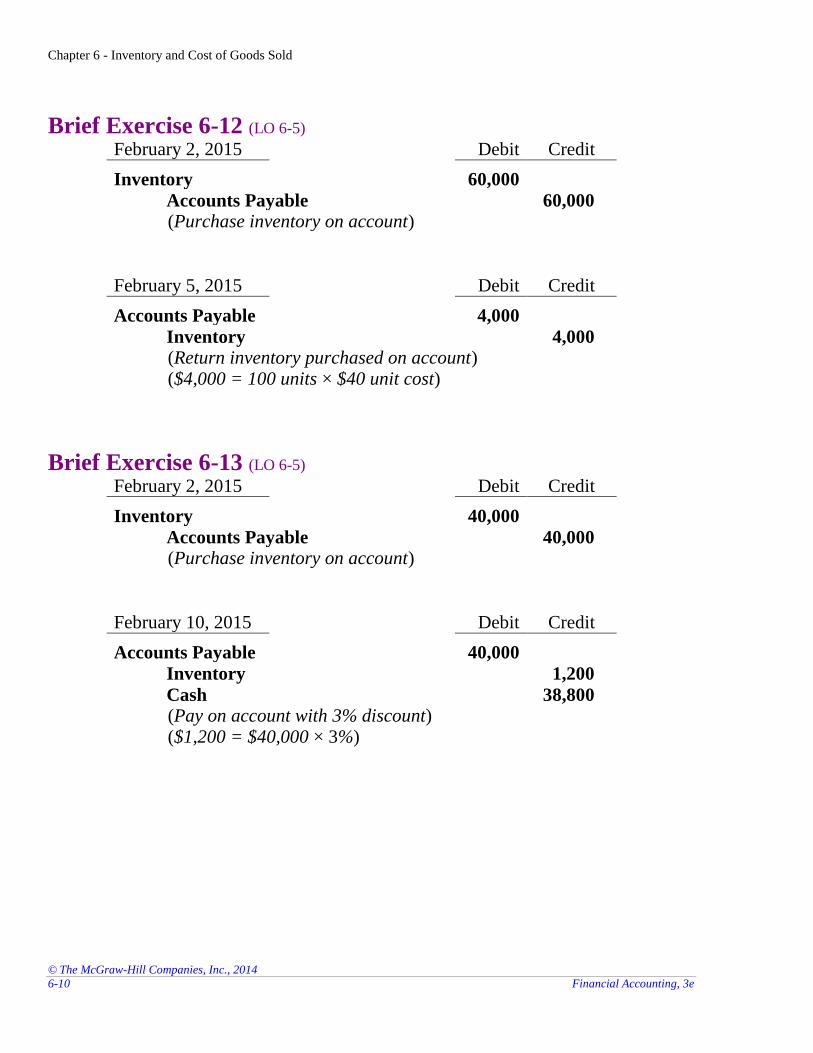
Brief Exercise 6-12 (LO 6-5) February 2, 2015 Debit Credit
Inventory 60,000
Accounts Payable 60,000 (Purchase inventory on account)
February 5, 2015 Debit Credit
Accounts Payable 4,000
Inventory 4,000 (Return inventory purchased on account) ($4,000 = 100 units × $40 unit cost)
Brief Exercise 6-13 (LO 6-5) February 2, 2015 Debit Credit
Inventory 40,000
Accounts Payable 40,000 (Purchase inventory on account)
February 10, 2015 Debit Credit
Accounts Payable 40,000
Inventory 1,200
Cash 38,800 (Pay on account with 3% discount) ($1,200 = $40,000 × 3%)
Chapter 6 - Inventory and Cost of Goods Sold
© The McGraw-Hill Companies, Inc., 2014
Solutions Manual, Chapter 6 6-11
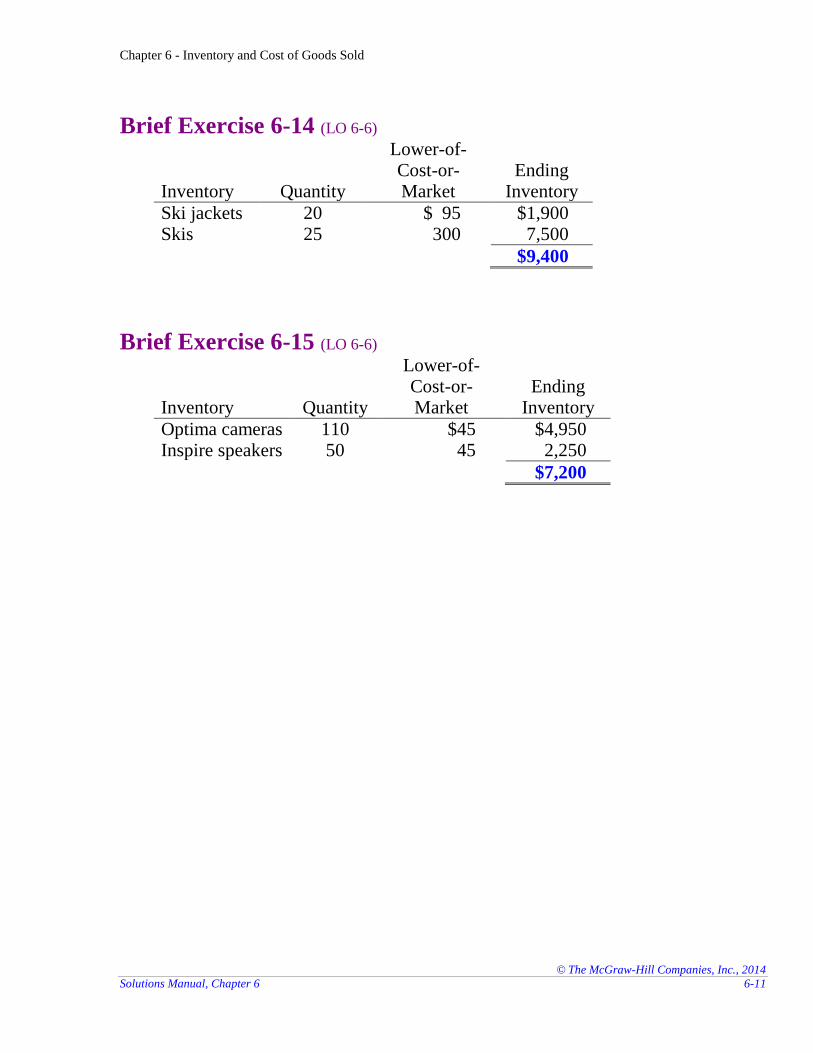
Brief Exercise 6-14 (LO 6-6)
Inventory Quantity
Lower-of-Cost-or-Market
Ending Inventory
Ski jackets 20 $ 95 $1,900 Skis 25 300 7,500
$9,400
Brief Exercise 6-15 (LO 6-6)
Inventory Quantity
Lower-of-Cost-or-Market
Ending Inventory
Optima cameras 110 $45 $4,950 Inspire speakers 50 45 2,250
$7,200
Chapter 6 - Inventory and Cost of Goods Sold
© The McGraw-Hill Companies, Inc., 2014
6-12 Financial Accounting, 3e
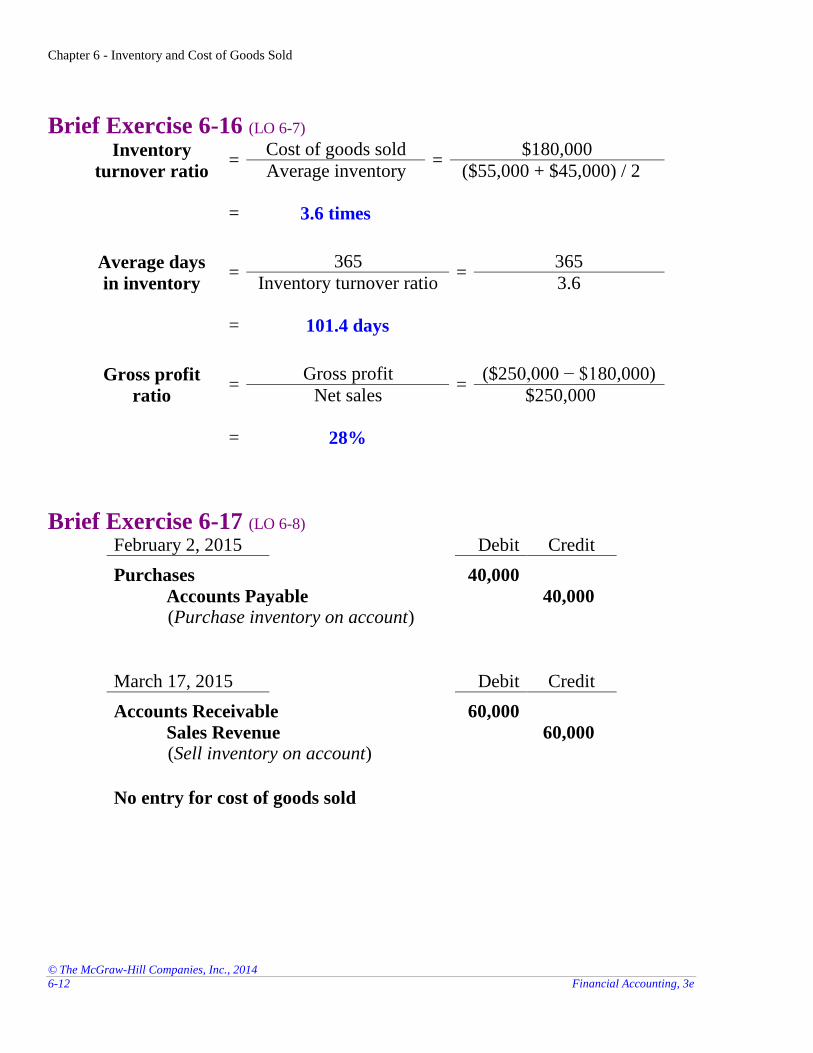
Brief Exercise 6-16 (LO 6-7) Inventory
turnover ratio =
Cost of goods sold =
$180,000
Average inventory ($55,000 + $45,000) / 2 = 3.6 times
Average days
in inventory =
365 =
365
Inventory turnover ratio 3.6 = 101.4 days
Gross profit
ratio =
Gross profit =
($250,000 − $180,000)
Net sales $250,000 = 28%
Brief Exercise 6-17 (LO 6-8) February 2, 2015 Debit Credit
Purchases 40,000
Accounts Payable 40,000 (Purchase inventory on account)
March 17, 2015 Debit Credit
Accounts Receivable 60,000
Sales Revenue 60,000 (Sell inventory on account)
No entry for cost of goods sold
Chapter 6 - Inventory and Cost of Goods Sold
© The McGraw-Hill Companies, Inc., 2014
Solutions Manual, Chapter 6 6-13
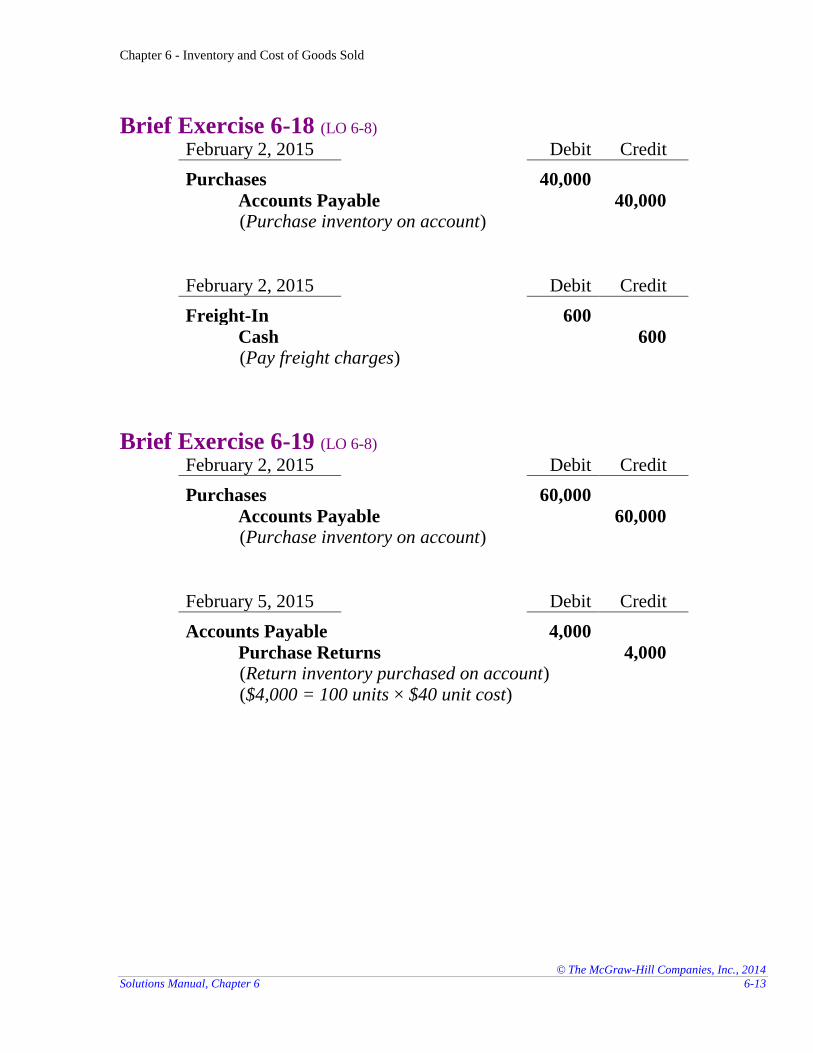
Brief Exercise 6-18 (LO 6-8) February 2, 2015 Debit Credit
Purchases 40,000
Accounts Payable 40,000 (Purchase inventory on account)
February 2, 2015 Debit Credit
Freight-In 600
Cash 600 (Pay freight charges)
Brief Exercise 6-19 (LO 6-8) February 2, 2015 Debit Credit
Purchases 60,000
Accounts Payable 60,000 (Purchase inventory on account)
February 5, 2015 Debit Credit
Accounts Payable 4,000
Purchase Returns 4,000 (Return inventory purchased on account) ($4,000 = 100 units × $40 unit cost)
Chapter 6 - Inventory and Cost of Goods Sold
© The McGraw-Hill Companies, Inc., 2014
6-14 Financial Accounting, 3e
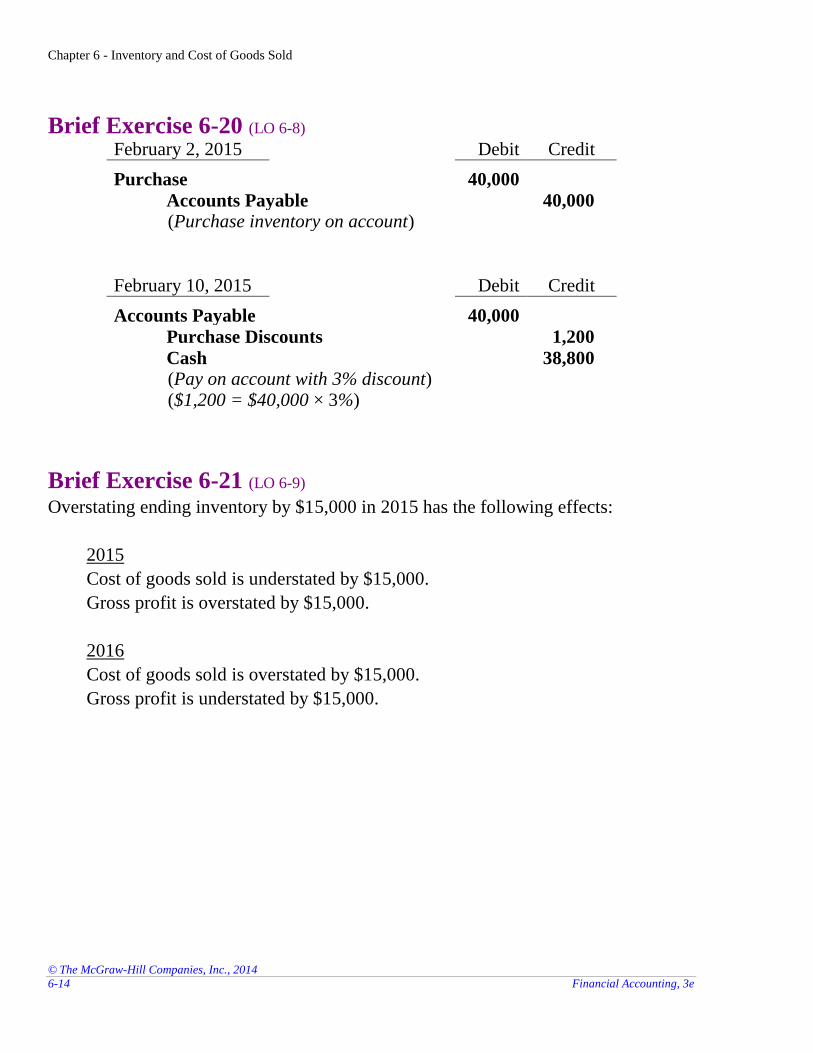
Brief Exercise 6-20 (LO 6-8) February 2, 2015 Debit Credit
Purchase 40,000
Accounts Payable 40,000 (Purchase inventory on account)
February 10, 2015 Debit Credit
Accounts Payable 40,000
Purchase Discounts 1,200
Cash 38,800 (Pay on account with 3% discount) ($1,200 = $40,000 × 3%)
Brief Exercise 6-21 (LO 6-9) Overstating ending inventory by $15,000 in 2015 has the following effects:
2015
Cost of goods sold is understated by $15,000.
Gross profit is overstated by $15,000.
2016
Cost of goods sold is overstated by $15,000.
Gross profit is understated by $15,000.
Chapter 6 - Inventory and Cost of Goods Sold
© The McGraw-Hill Companies, Inc., 2014
Solutions Manual, Chapter 6 6-15
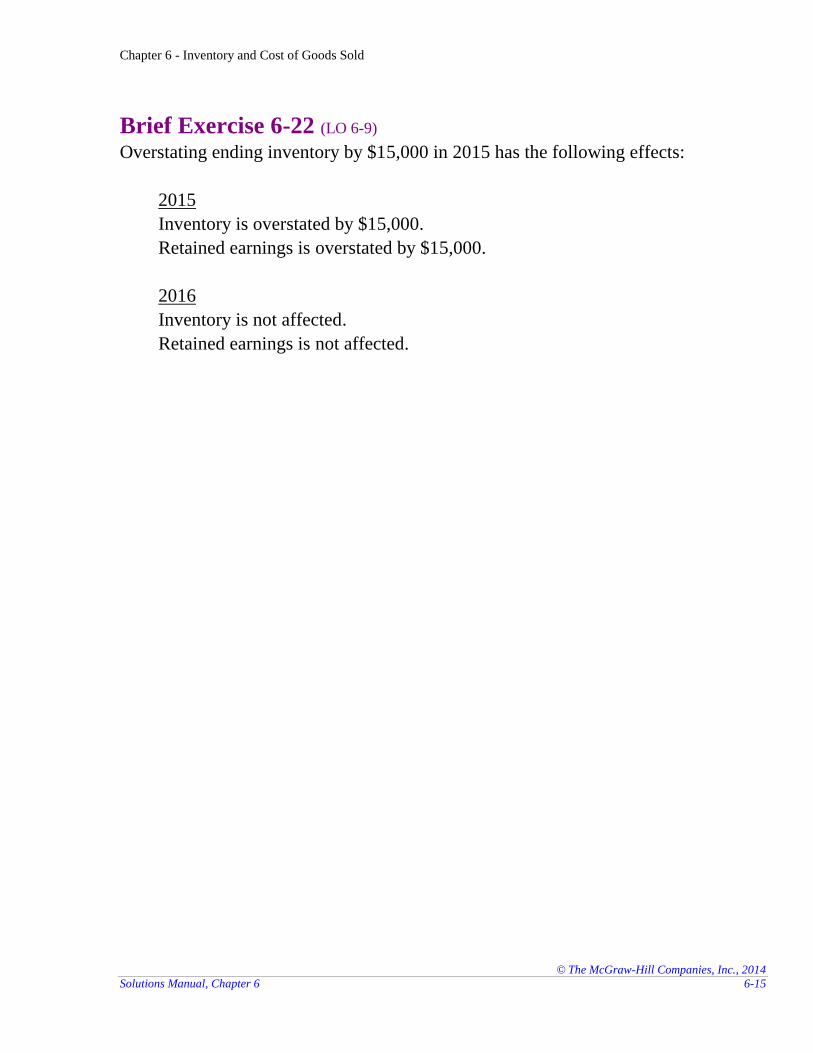
Brief Exercise 6-22 (LO 6-9) Overstating ending inventory by $15,000 in 2015 has the following effects:
2015
Inventory is overstated by $15,000.
Retained earnings is overstated by $15,000.
2016
Inventory is not affected.
Retained earnings is not affected.
Chapter 6 - Inventory and Cost of Goods Sold
© The McGraw-Hill Companies, Inc., 2014
6-16 Financial Accounting, 3e
EXERCISES
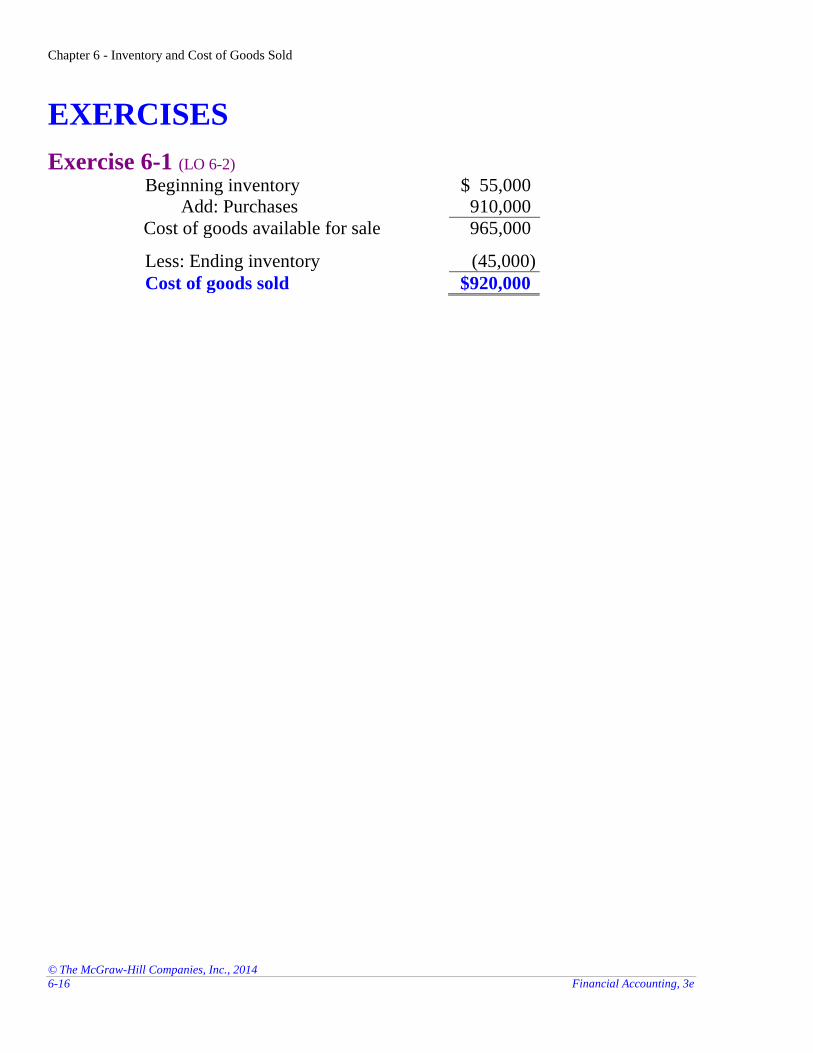
Exercise 6-1 (LO 6-2) Beginning inventory $ 55,000
Add: Purchases 910,000
Cost of goods available for sale 965,000
Less: Ending inventory (45,000)
Cost of goods sold $920,000
Chapter 6 - Inventory and Cost of Goods Sold
© The McGraw-Hill Companies, Inc., 2014
Solutions Manual, Chapter 6 6-17
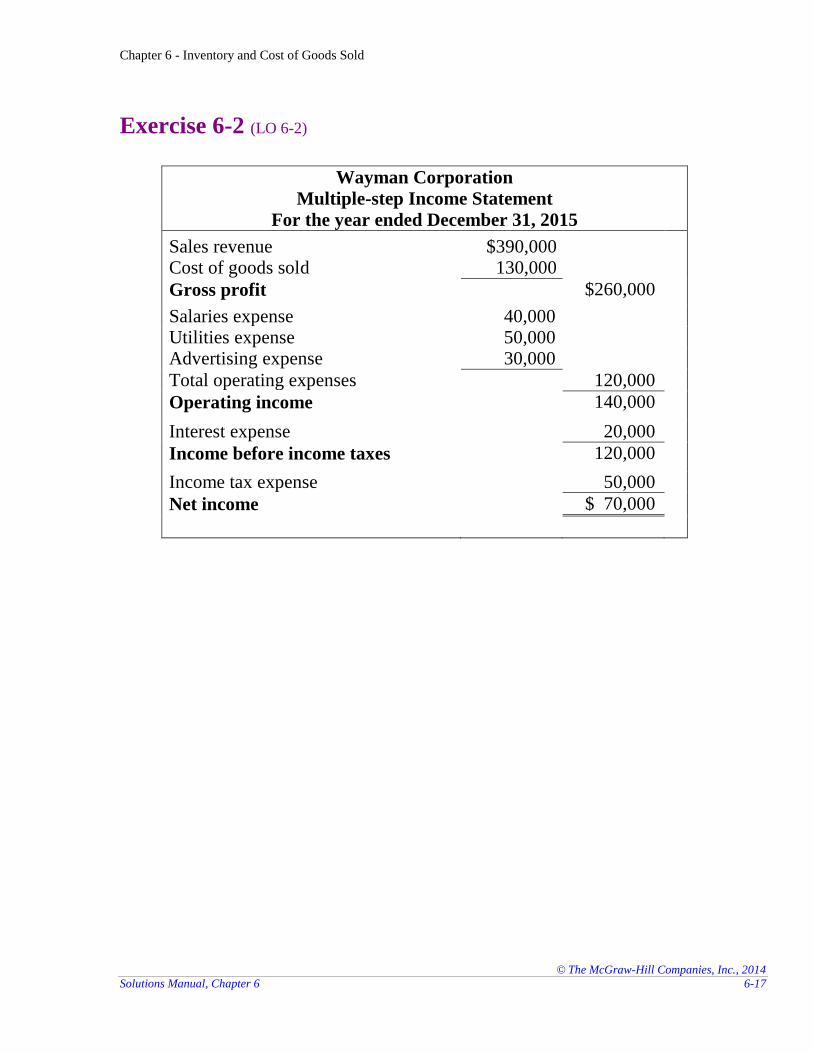
Exercise 6-2 (LO 6-2)
Wayman Corporation
Multiple-step Income Statement
For the year ended December 31, 2015
Sales revenue $390,000
Cost of goods sold 130,000
Gross profit $260,000
Salaries expense 40,000 Utilities expense 50,000 Advertising expense 30,000
Total operating expenses 120,000
Operating income 140,000
Interest expense 20,000
Income before income taxes 120,000
Income tax expense 50,000
Net income $ 70,000
Chapter 6 - Inventory and Cost of Goods Sold
© The McGraw-Hill Companies, Inc., 2014
6-18 Financial Accounting, 3e
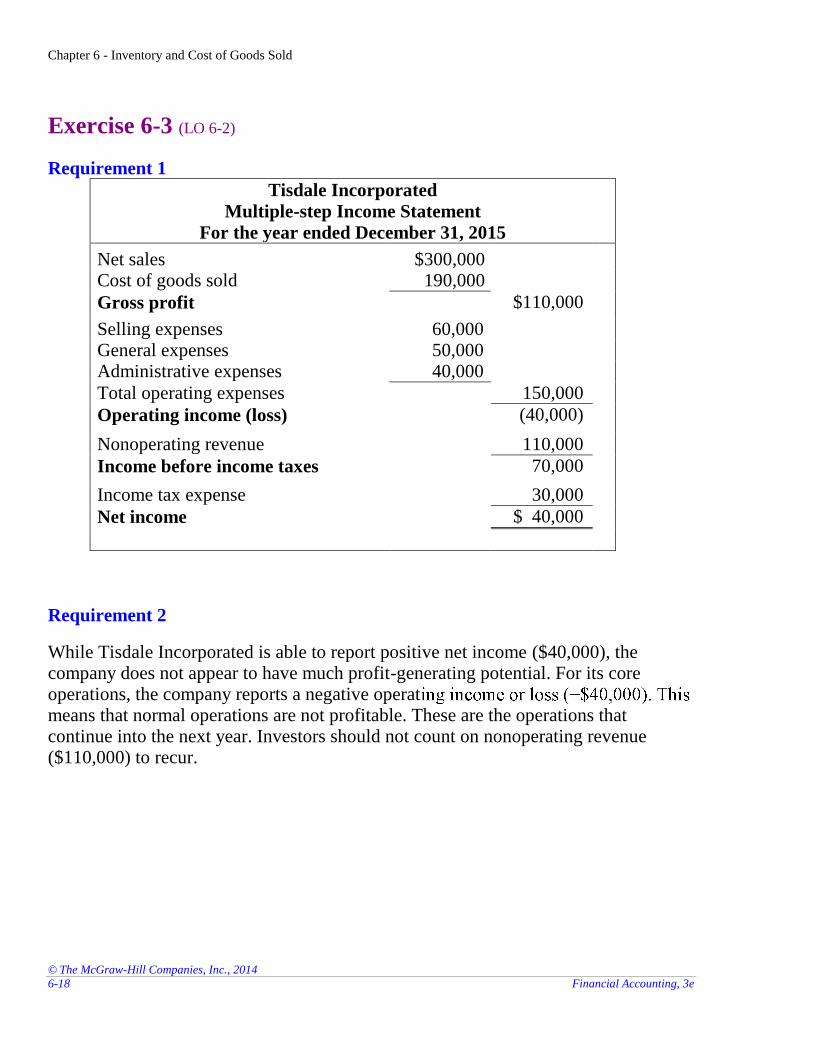
Exercise 6-3 (LO 6-2)
Requirement 1
Tisdale Incorporated
Multiple-step Income Statement
For the year ended December 31, 2015
Net sales $300,000
Cost of goods sold 190,000
Gross profit $110,000
Selling expenses 60,000 General expenses 50,000 Administrative expenses 40,000
Total operating expenses 150,000
Operating income (loss) (40,000)
Nonoperating revenue 110,000
Income before income taxes 70,000
Income tax expense 30,000
Net income $ 40,000
Requirement 2
While Tisdale Incorporated is able to report positive net income ($40,000), the company does not appear to have much profit-generating potential. For its core operations, the company reports a negative operatmeans that normal operations are not profitable. These are the operations that continue into the next year. Investors should not count on nonoperating revenue ($110,000) to recur.
Chapter 6 - Inventory and Cost of Goods Sold
© The McGraw-Hill Companies, Inc., 2014
Solutions Manual, Chapter 6 6-19
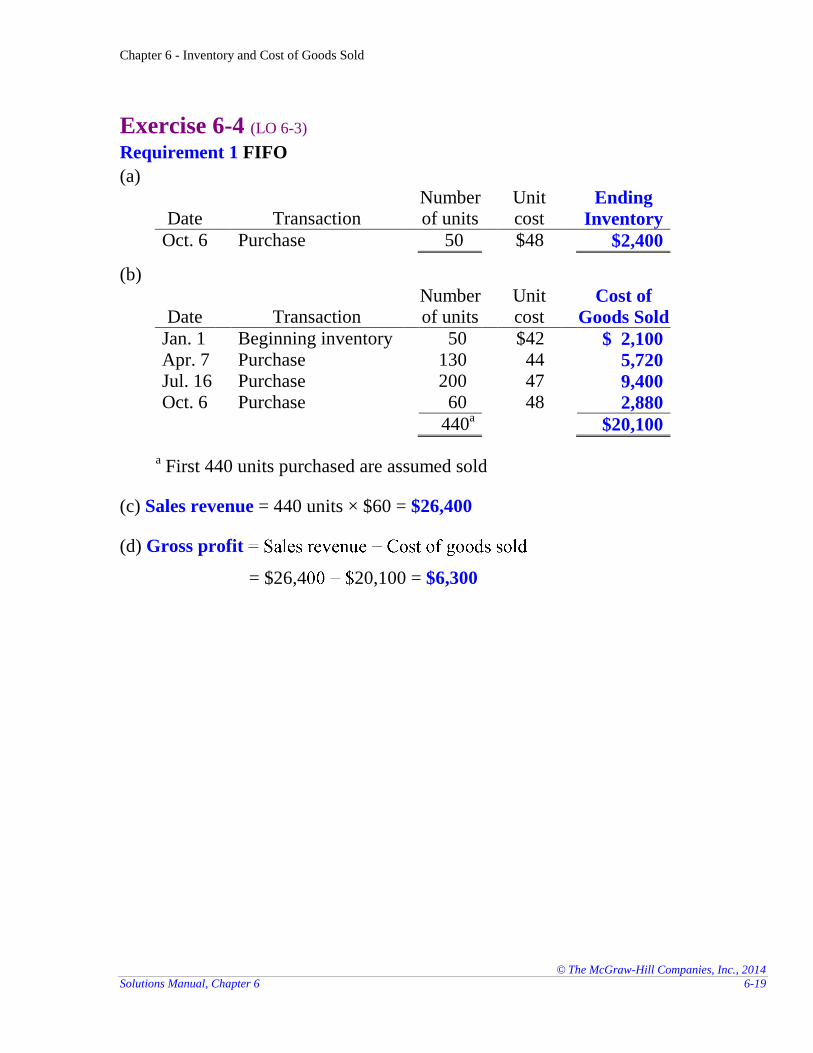
Exercise 6-4 (LO 6-3) Requirement 1 FIFO
(a)
Date Transaction Number of units
Unit cost
Ending
Inventory
Oct. 6 Purchase 50 $48 $2,400
(b)
Date Transaction Number of units
Unit cost
Cost of
Goods Sold
Jan. 1 Beginning inventory 50 $42 $ 2,100 Apr. 7 Purchase 130 44 5,720 Jul. 16 Purchase 200 47 9,400 Oct. 6 Purchase 60 48 2,880
440a $20,100
a First 440 units purchased are assumed sold
(c) Sales revenue = 440 units × $60 = $26,400
(d) Gross profit
= $26,4 20,100 = $6,300
Chapter 6 - Inventory and Cost of Goods Sold
© The McGraw-Hill Companies, Inc., 2014
6-20 Financial Accounting, 3e
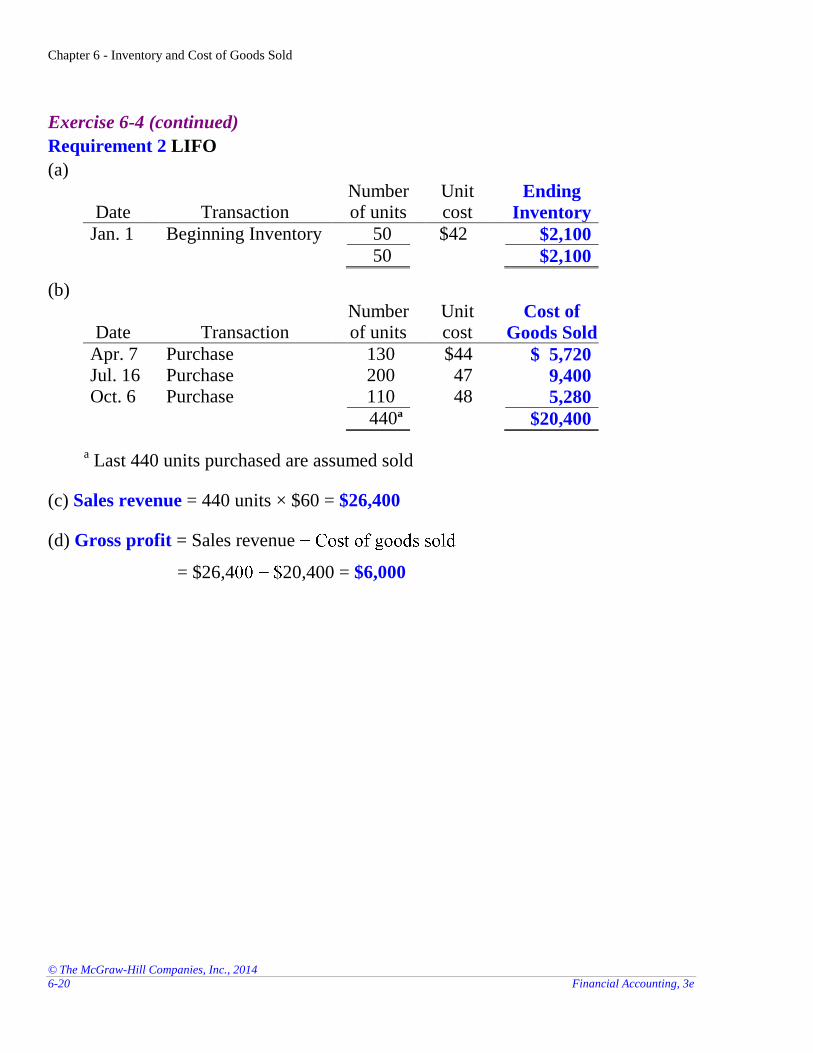
Exercise 6-4 (continued)
Requirement 2 LIFO
(a)
Date Transaction Number of units
Unit cost
Ending
Inventory
Jan. 1 Beginning Inventory 50 $42 $2,100
50 $2,100
(b)
Date Transaction Number of units
Unit cost
Cost of
Goods Sold
Apr. 7 Purchase 130 $44 $ 5,720 Jul. 16 Purchase 200 47 9,400 Oct. 6 Purchase 110 48 5,280
440a $20,400
a Last 440 units purchased are assumed sold
(c) Sales revenue = 440 units × $60 = $26,400
(d) Gross profit = Sales revenue
= $26,4 20,400 = $6,000
Chapter 6 - Inventory and Cost of Goods Sold
© The McGraw-Hill Companies, Inc., 2014
Solutions Manual, Chapter 6 6-21
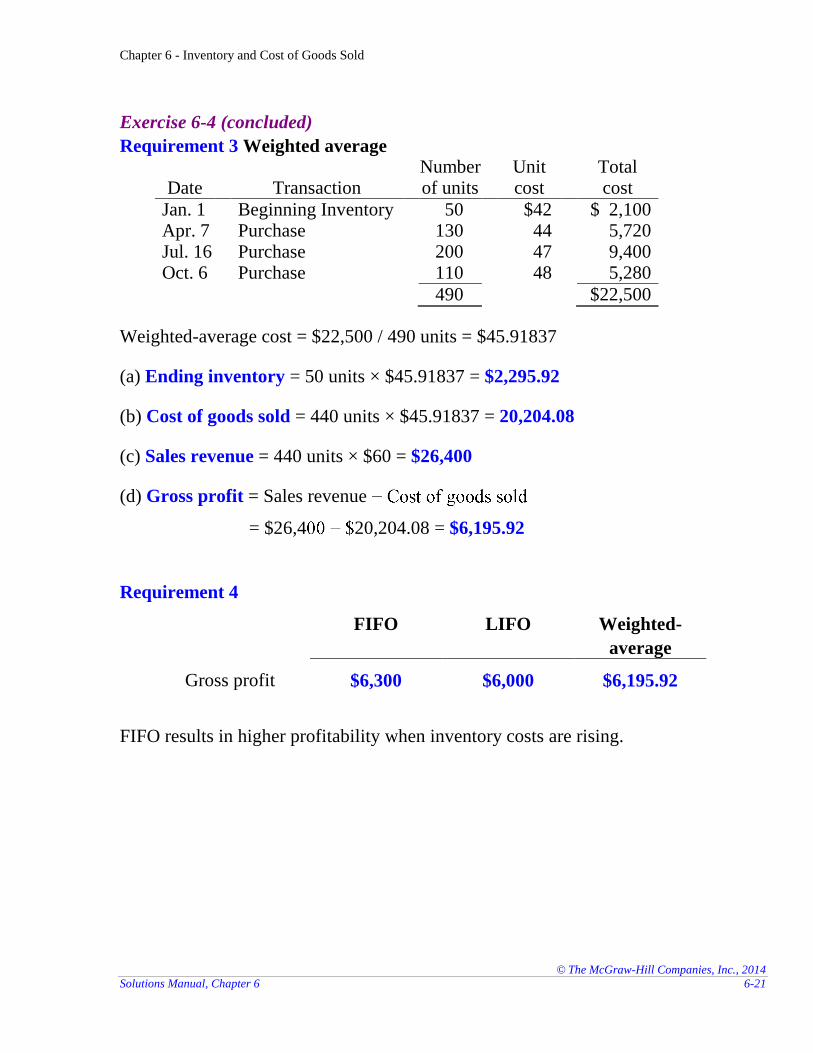
Exercise 6-4 (concluded)
Requirement 3 Weighted average
Date Transaction Number of units
Unit cost
Total cost
Jan. 1 Beginning Inventory 50 $42 $ 2,100 Apr. 7 Purchase 130 44 5,720 Jul. 16 Purchase 200 47 9,400 Oct. 6 Purchase 110 48 5,280
490 $22,500
Weighted-average cost = $22,500 / 490 units = $45.91837
(a) Ending inventory = 50 units × $45.91837 = $2,295.92
(b) Cost of goods sold = 440 units × $45.91837 = 20,204.08
(c) Sales revenue = 440 units × $60 = $26,400
(d) Gross profit = Sales revenue
= $26,4 20,204.08 = $6,195.92
Requirement 4
FIFO LIFO Weighted-
average
Gross profit $6,300 $6,000 $6,195.92
FIFO results in higher profitability when inventory costs are rising.
Chapter 6 - Inventory and Cost of Goods Sold
© The McGraw-Hill Companies, Inc., 2014
6-22 Financial Accounting, 3e
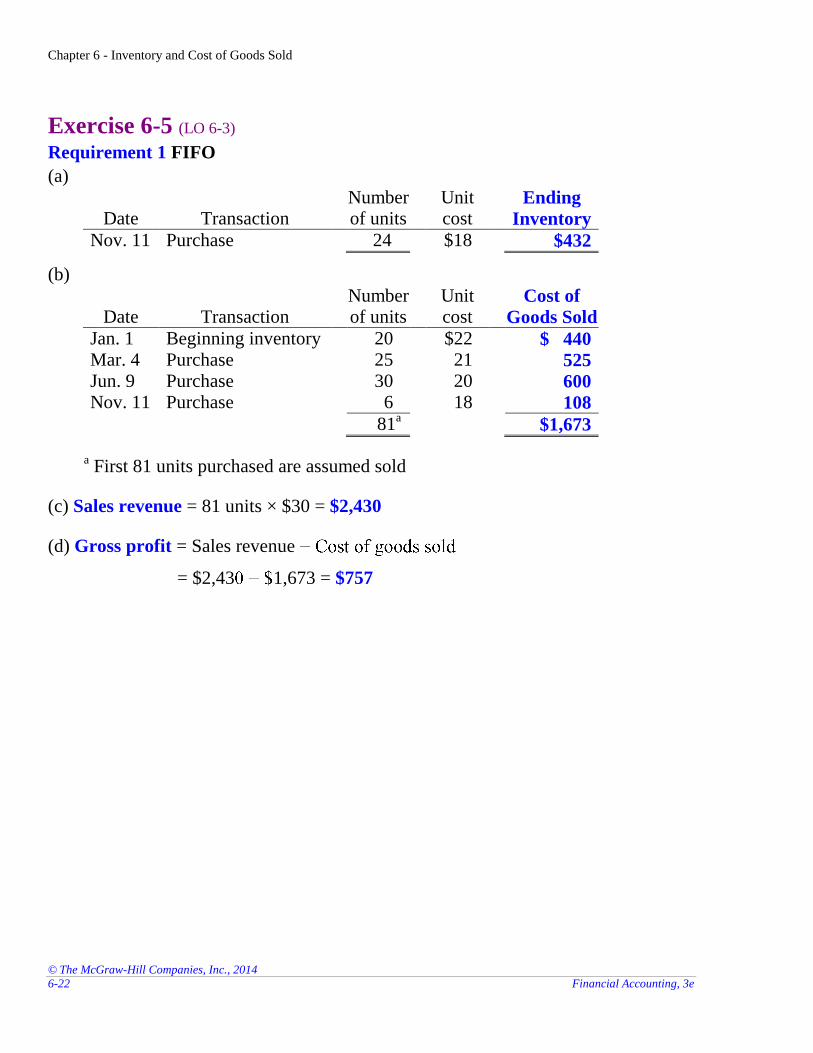
Exercise 6-5 (LO 6-3) Requirement 1 FIFO
(a)
Date Transaction Number of units
Unit cost
Ending
Inventory
Nov. 11 Purchase 24 $18 $432
(b)
Date Transaction Number of units
Unit cost
Cost of
Goods Sold
Jan. 1 Beginning inventory 20 $22 $ 440 Mar. 4 Purchase 25 21 525 Jun. 9 Purchase 30 20 600 Nov. 11 Purchase 6 18 108
81a $1,673
a First 81 units purchased are assumed sold
(c) Sales revenue = 81 units × $30 = $2,430
(d) Gross profit = Sales revenue
= $2,43 1,673 = $757
Chapter 6 - Inventory and Cost of Goods Sold
© The McGraw-Hill Companies, Inc., 2014
Solutions Manual, Chapter 6 6-23
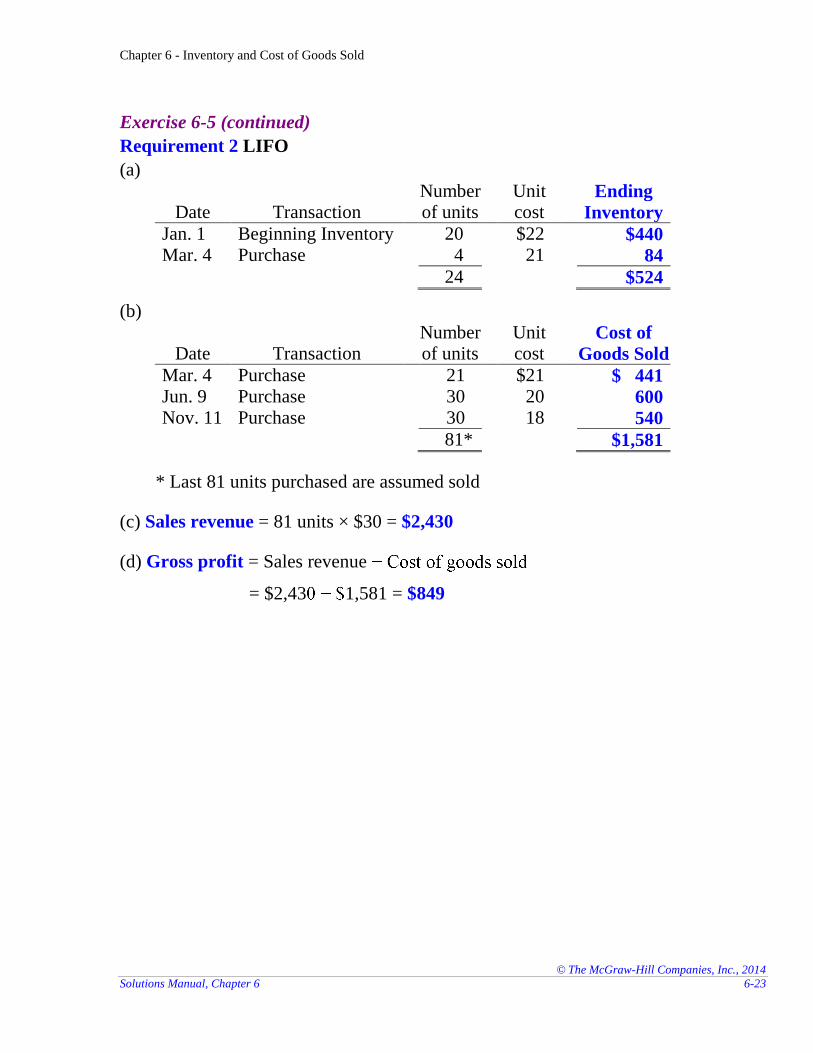
Exercise 6-5 (continued)
Requirement 2 LIFO
(a)
Date Transaction Number of units
Unit cost
Ending
Inventory
Jan. 1 Beginning Inventory 20 $22 $440 Mar. 4 Purchase 4 21 84
24 $524
(b)
Date Transaction Number of units
Unit cost
Cost of
Goods Sold
Mar. 4 Purchase 21 $21 $ 441 Jun. 9 Purchase 30 20 600 Nov. 11 Purchase 30 18 540
81* $1,581
* Last 81 units purchased are assumed sold
(c) Sales revenue = 81 units × $30 = $2,430
(d) Gross profit = Sales revenue
= $2,43 1,581 = $849
Chapter 6 - Inventory and Cost of Goods Sold
© The McGraw-Hill Companies, Inc., 2014
6-24 Financial Accounting, 3e
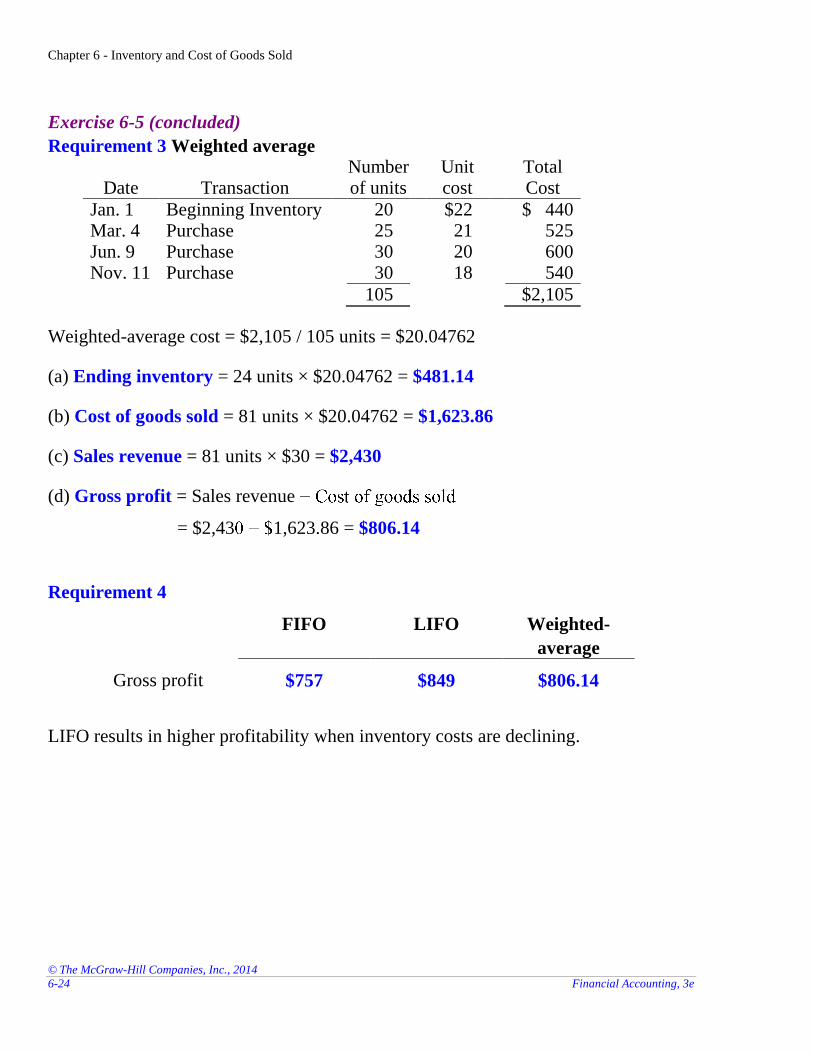
Exercise 6-5 (concluded)
Requirement 3 Weighted average
Date Transaction Number of units
Unit cost
Total Cost
Jan. 1 Beginning Inventory 20 $22 $ 440 Mar. 4 Purchase 25 21 525 Jun. 9 Purchase 30 20 600 Nov. 11 Purchase 30 18 540
105 $2,105
Weighted-average cost = $2,105 / 105 units = $20.04762
(a) Ending inventory = 24 units × $20.04762 = $481.14
(b) Cost of goods sold = 81 units × $20.04762 = $1,623.86
(c) Sales revenue = 81 units × $30 = $2,430
(d) Gross profit = Sales revenue
= $2,43 1,623.86 = $806.14
Requirement 4
FIFO LIFO Weighted-
average
Gross profit $757 $849 $806.14
LIFO results in higher profitability when inventory costs are declining.
Chapter 6 - Inventory and Cost of Goods Sold
© The McGraw-Hill Companies, Inc., 2014
Solutions Manual, Chapter 6 6-25
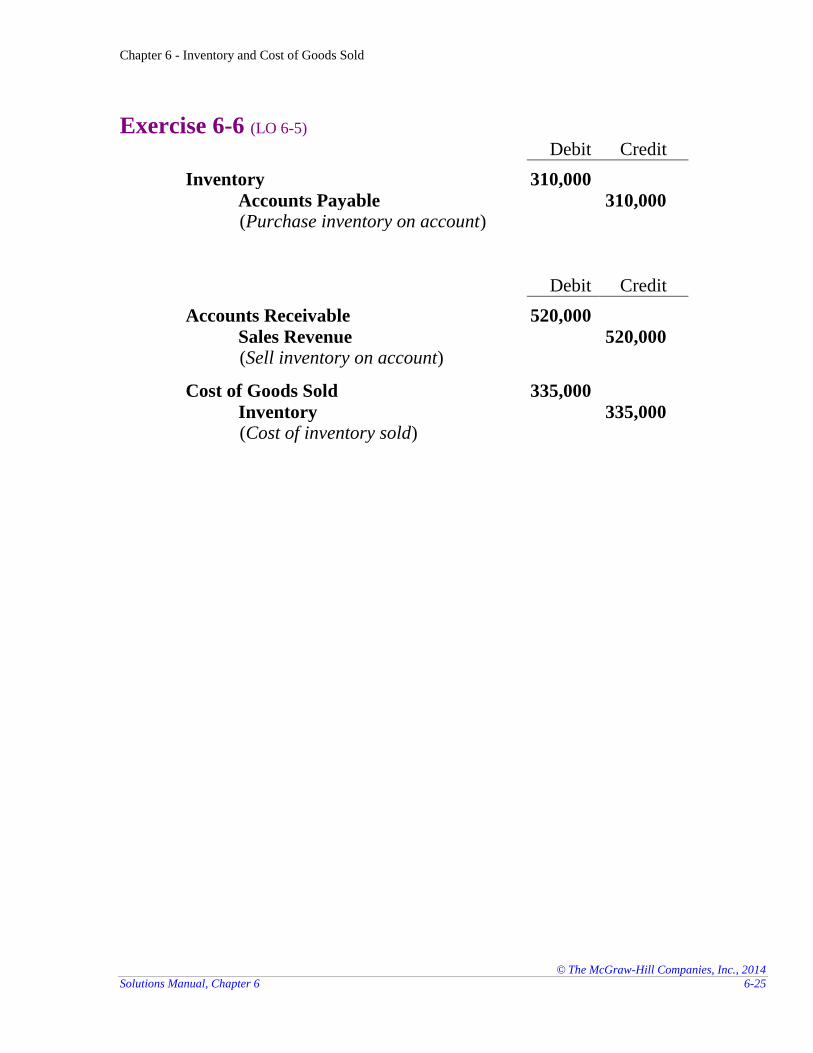
Exercise 6-6 (LO 6-5) Debit Credit
Inventory 310,000
Accounts Payable 310,000 (Purchase inventory on account)
Debit Credit
Accounts Receivable 520,000
Sales Revenue 520,000 (Sell inventory on account)
Cost of Goods Sold 335,000
Inventory 335,000 (Cost of inventory sold)
Chapter 6 - Inventory and Cost of Goods Sold
© The McGraw-Hill Companies, Inc., 2014
6-26 Financial Accounting, 3e
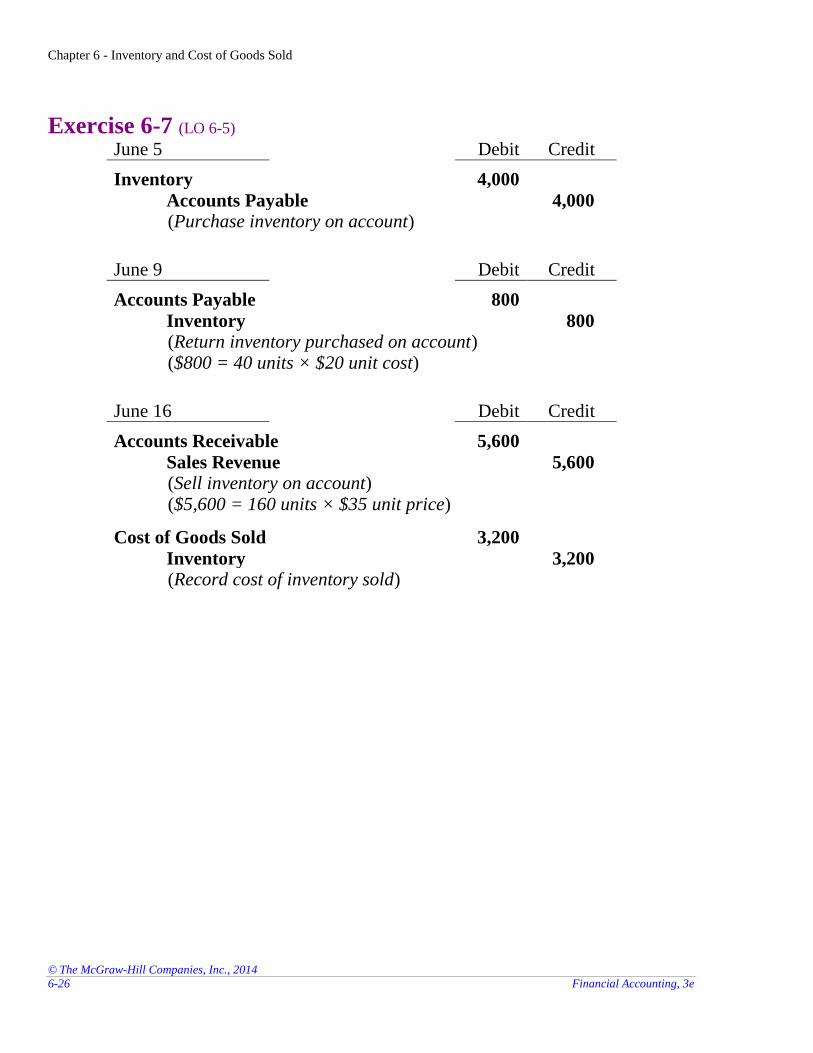
Exercise 6-7 (LO 6-5) June 5 Debit Credit
Inventory 4,000
Accounts Payable 4,000 (Purchase inventory on account)
June 9 Debit Credit
Accounts Payable 800
Inventory 800 (Return inventory purchased on account) ($800 = 40 units × $20 unit cost)
June 16 Debit Credit
Accounts Receivable 5,600
Sales Revenue 5,600 (Sell inventory on account) ($5,600 = 160 units × $35 unit price)
Cost of Goods Sold 3,200
Inventory 3,200 (Record cost of inventory sold)
Chapter 6 - Inventory and Cost of Goods Sold
© The McGraw-Hill Companies, Inc., 2014
Solutions Manual, Chapter 6 6-27
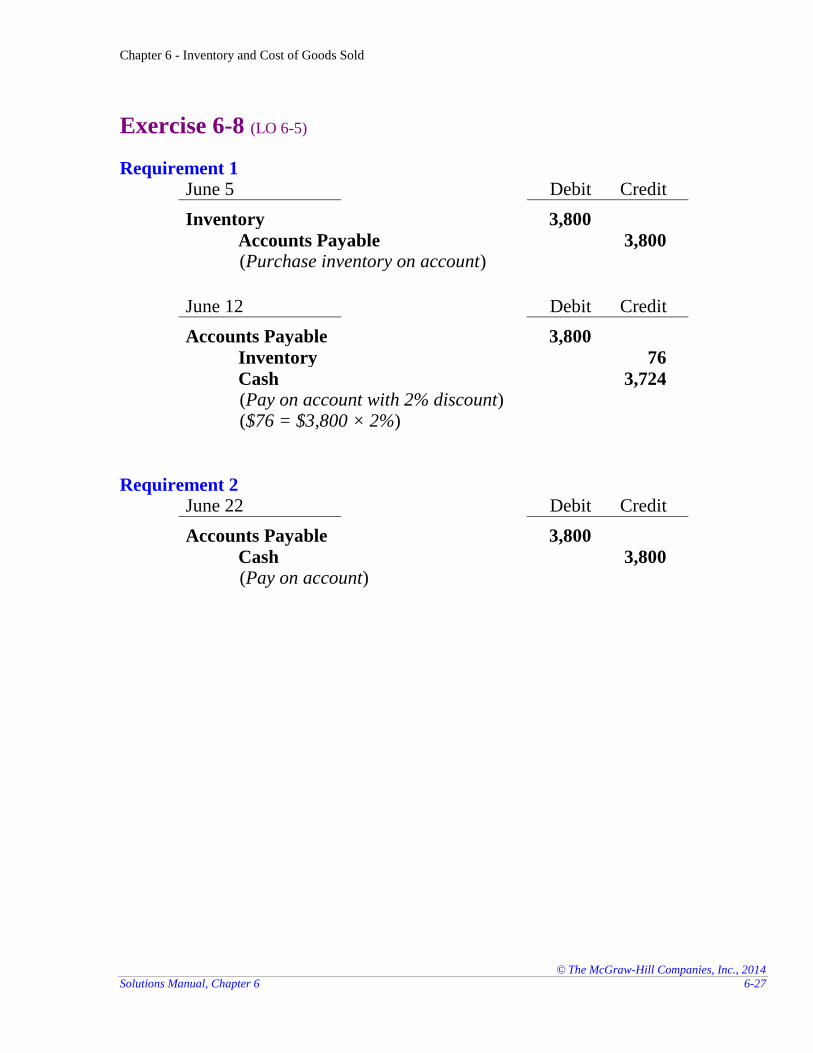
Exercise 6-8 (LO 6-5)
Requirement 1 June 5 Debit Credit
Inventory 3,800
Accounts Payable 3,800 (Purchase inventory on account)
June 12 Debit Credit
Accounts Payable 3,800
Inventory 76
Cash 3,724 (Pay on account with 2% discount) ($76 = $3,800 × 2%)
Requirement 2 June 22 Debit Credit
Accounts Payable 3,800
Cash 3,800 (Pay on account)
Chapter 6 - Inventory and Cost of Goods Sold
© The McGraw-Hill Companies, Inc., 2014
6-28 Financial Accounting, 3e
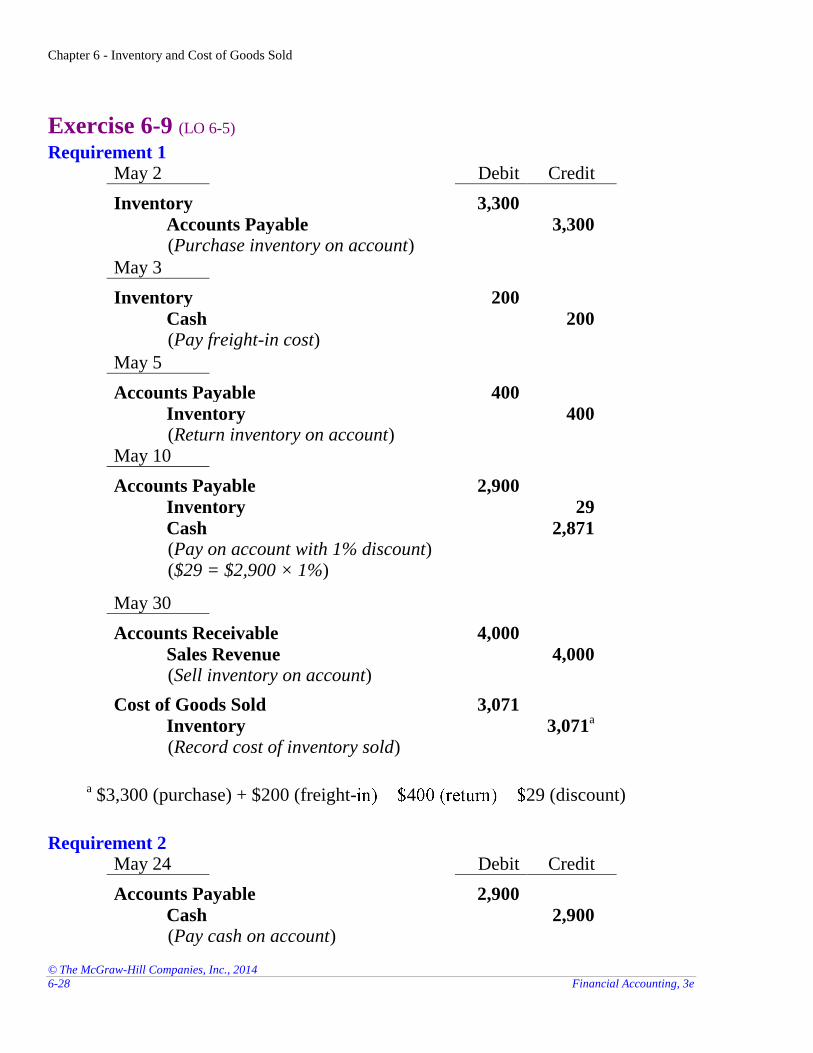
Exercise 6-9 (LO 6-5) Requirement 1
May 2 Debit Credit
Inventory 3,300
Accounts Payable 3,300 (Purchase inventory on account)
May 3
Inventory 200
Cash 200 (Pay freight-in cost)
May 5
Accounts Payable 400
Inventory 400 (Return inventory on account)
May 10
Accounts Payable 2,900
Inventory 29
Cash 2,871 (Pay on account with 1% discount) ($29 = $2,900 × 1%)
May 30
Accounts Receivable 4,000
Sales Revenue 4,000 (Sell inventory on account)
Cost of Goods Sold 3,071
Inventory 3,071a
(Record cost of inventory sold)
a $3,300 (purchase) + $200 (freight- 4 29 (discount)
Requirement 2 May 24 Debit Credit
Accounts Payable 2,900
Cash 2,900 (Pay cash on account)
Chapter 6 - Inventory and Cost of Goods Sold
© The McGraw-Hill Companies, Inc., 2014
Solutions Manual, Chapter 6 6-29
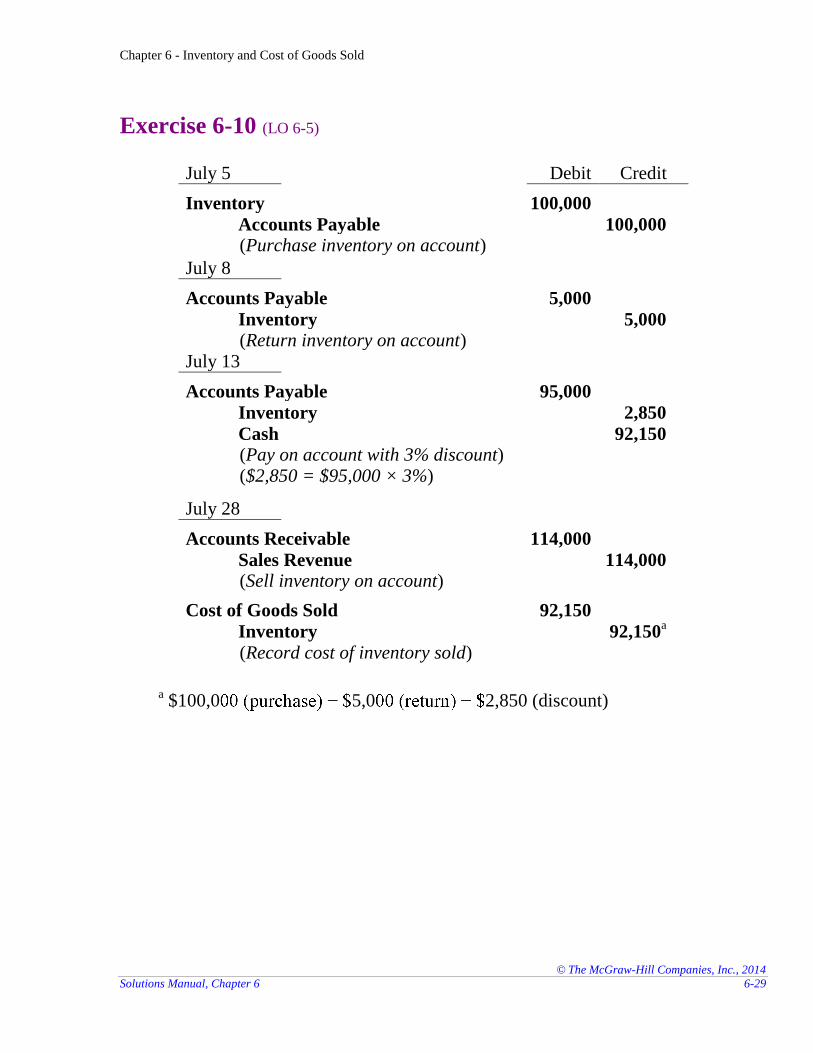
Exercise 6-10 (LO 6-5)
July 5 Debit Credit
Inventory 100,000
Accounts Payable 100,000 (Purchase inventory on account)
July 8
Accounts Payable 5,000
Inventory 5,000 (Return inventory on account)
July 13
Accounts Payable 95,000
Inventory 2,850
Cash 92,150 (Pay on account with 3% discount) ($2,850 = $95,000 × 3%)
July 28
Accounts Receivable 114,000
Sales Revenue 114,000 (Sell inventory on account)
Cost of Goods Sold 92,150
Inventory 92,150a
(Record cost of inventory sold)
a $100,0 5,0 2,850 (discount)
Chapter 6 - Inventory and Cost of Goods Sold
© The McGraw-Hill Companies, Inc., 2014
6-30 Financial Accounting, 3e
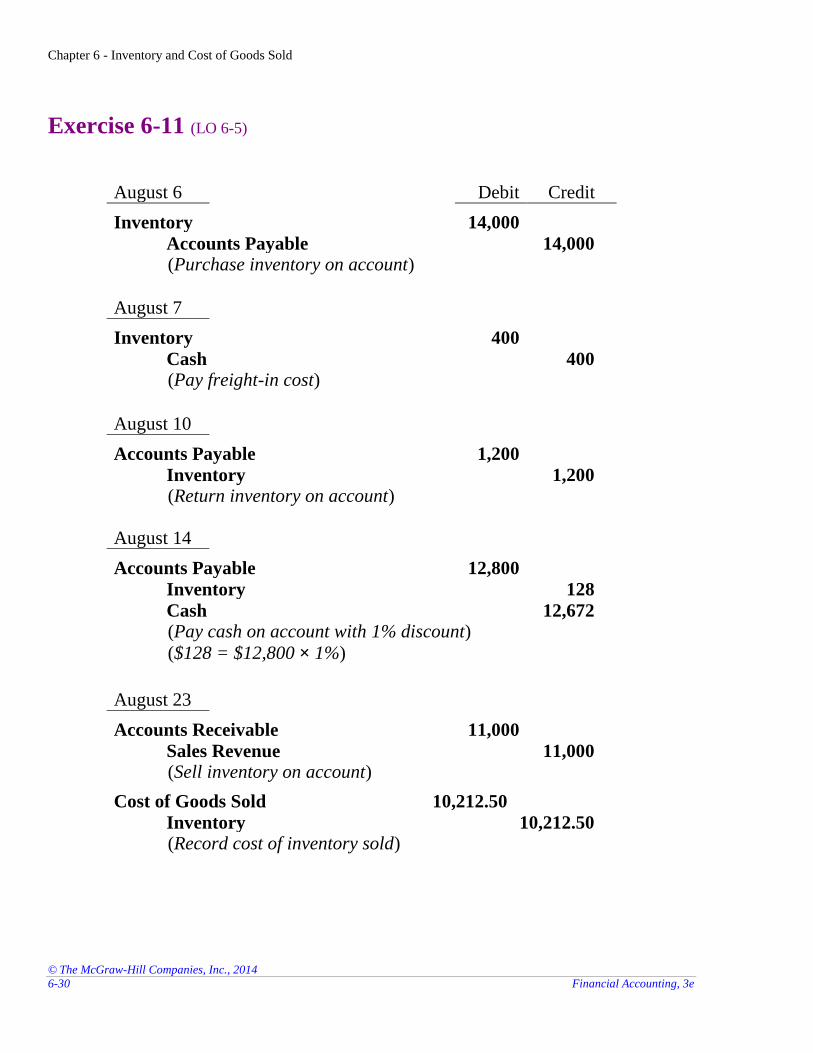
Exercise 6-11 (LO 6-5)
August 6 Debit Credit
Inventory 14,000
Accounts Payable 14,000 (Purchase inventory on account)
August 7
Inventory 400
Cash 400 (Pay freight-in cost)
August 10
Accounts Payable 1,200
Inventory 1,200 (Return inventory on account)
August 14
Accounts Payable 12,800
Inventory 128
Cash 12,672 (Pay cash on account with 1% discount)
($128 = $12,800 × 1%)
August 23
Accounts Receivable 11,000
Sales Revenue 11,000 (Sell inventory on account)
Cost of Goods Sold 10,212.50
Inventory 10,212.50 (Record cost of inventory sold)
Chapter 6 - Inventory and Cost of Goods Sold
© The McGraw-Hill Companies, Inc., 2014
Solutions Manual, Chapter 6 6-31
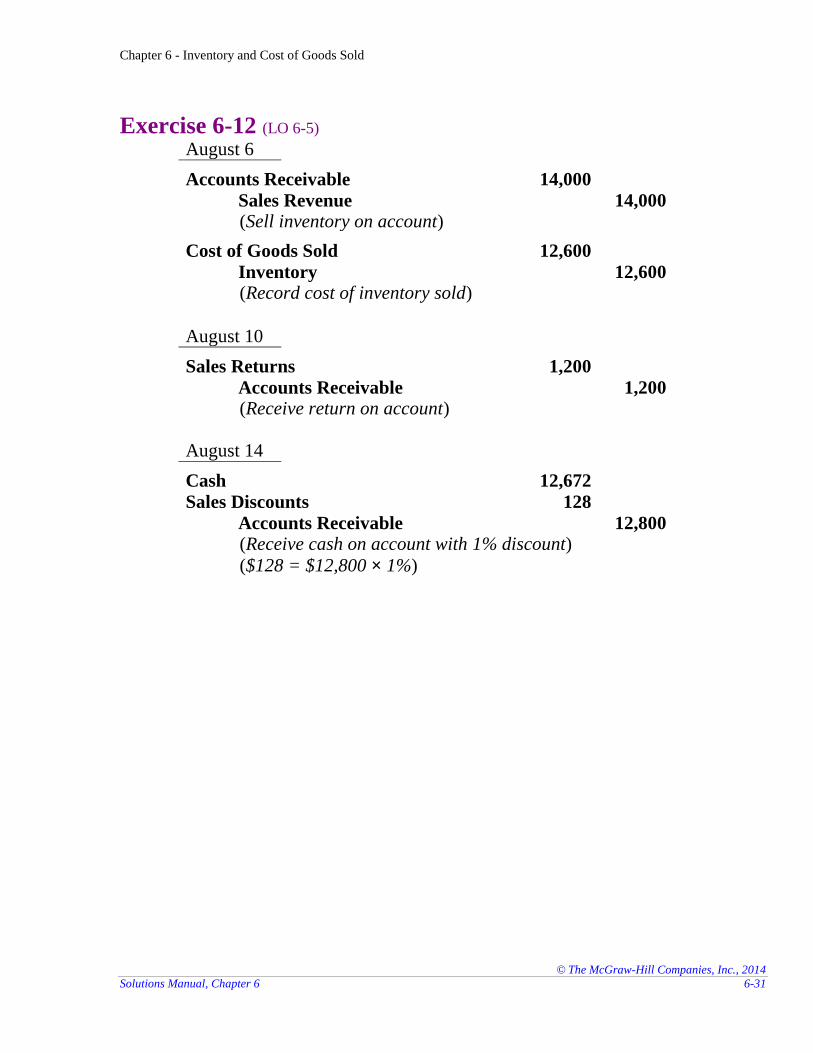
Exercise 6-12 (LO 6-5) August 6
Accounts Receivable 14,000
Sales Revenue 14,000 (Sell inventory on account)
Cost of Goods Sold 12,600
Inventory 12,600 (Record cost of inventory sold)
August 10
Sales Returns 1,200
Accounts Receivable 1,200 (Receive return on account)
August 14
Cash 12,672
Sales Discounts 128
Accounts Receivable 12,800 (Receive cash on account with 1% discount)
($128 = $12,800 × 1%)
Chapter 6 - Inventory and Cost of Goods Sold
© The McGraw-Hill Companies, Inc., 2014
6-32 Financial Accounting, 3e
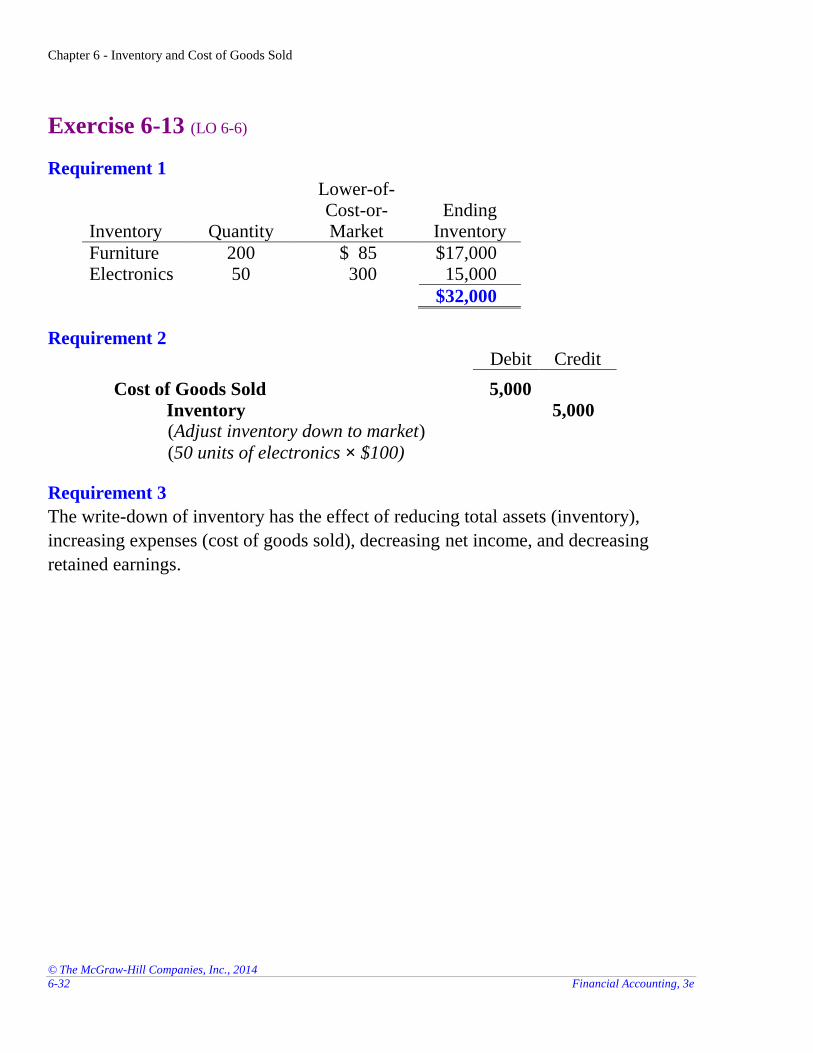
Exercise 6-13 (LO 6-6)
Requirement 1
Inventory Quantity
Lower-of-Cost-or-Market
Ending Inventory
Furniture 200 $ 85 $17,000 Electronics 50 300 15,000
$32,000
Requirement 2 Debit Credit
Cost of Goods Sold 5,000
Inventory 5,000 (Adjust inventory down to market)
(50 units of electronics × $100)
Requirement 3
The write-down of inventory has the effect of reducing total assets (inventory),
increasing expenses (cost of goods sold), decreasing net income, and decreasing
retained earnings.
Chapter 6 - Inventory and Cost of Goods Sold
© The McGraw-Hill Companies, Inc., 2014
Solutions Manual, Chapter 6 6-33
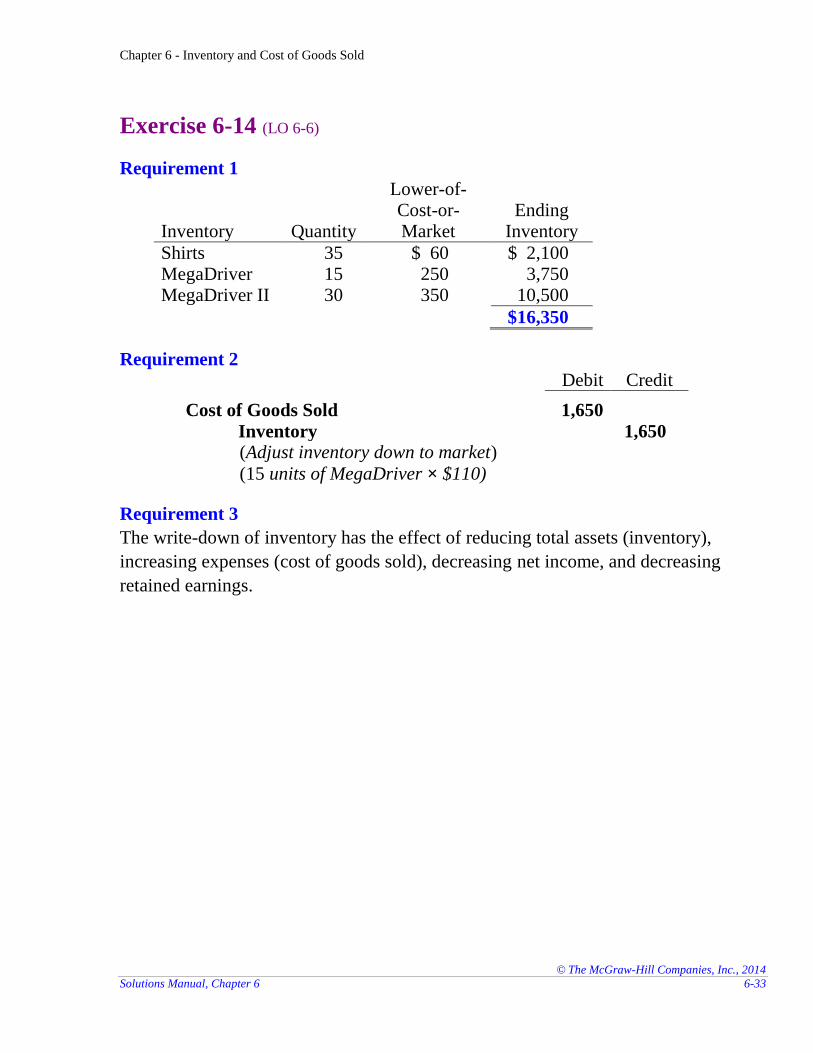
Exercise 6-14 (LO 6-6)
Requirement 1
Inventory Quantity
Lower-of-Cost-or-Market
Ending Inventory
Shirts 35 $ 60 $ 2,100 MegaDriver 15 250 3,750 MegaDriver II 30 350 10,500
$16,350
Requirement 2 Debit Credit
Cost of Goods Sold 1,650
Inventory 1,650 (Adjust inventory down to market)
(15 units of MegaDriver × $110)
Requirement 3
The write-down of inventory has the effect of reducing total assets (inventory),
increasing expenses (cost of goods sold), decreasing net income, and decreasing
retained earnings.
Chapter 6 - Inventory and Cost of Goods Sold
© The McGraw-Hill Companies, Inc., 2014
6-34 Financial Accounting, 3e
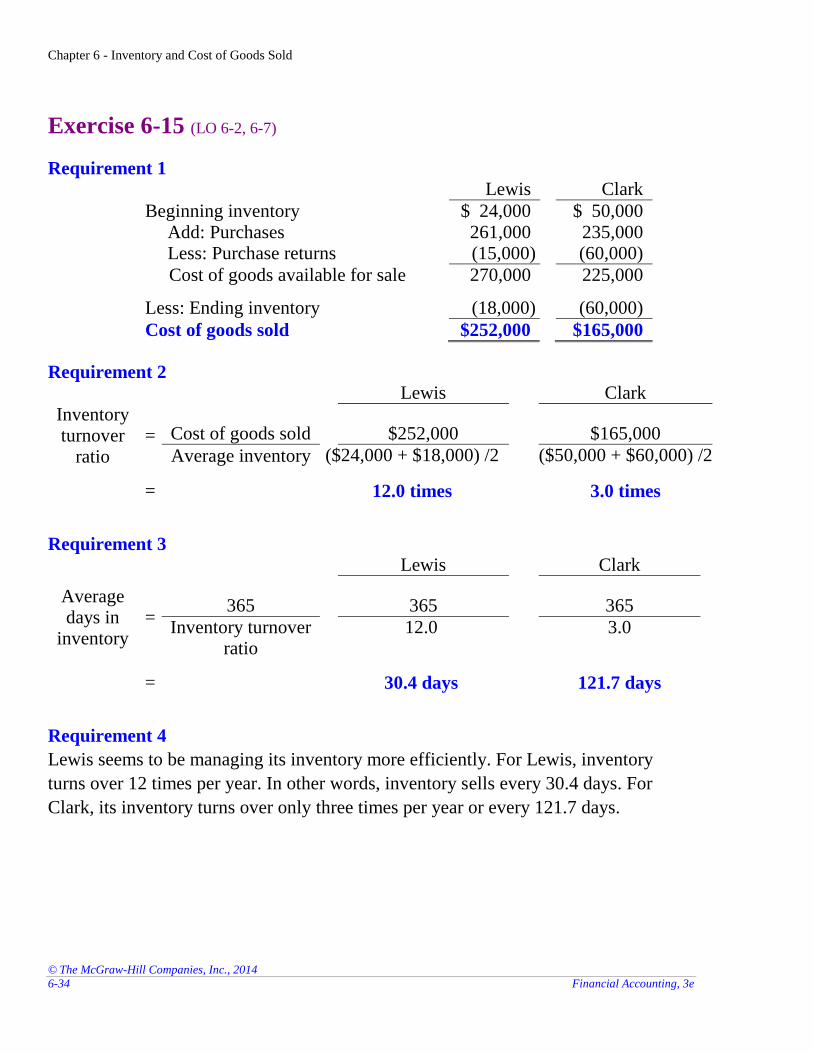
Exercise 6-15 (LO 6-2, 6-7)
Requirement 1 Lewis Clark
Beginning inventory $ 24,000 $ 50,000
Add: Purchases 261,000 235,000 Less: Purchase returns (15,000) (60,000)
Cost of goods available for sale 270,000 225,000
Less: Ending inventory (18,000) (60,000)
Cost of goods sold $252,000 $165,000
Requirement 2 Lewis Clark
Inventory turnover
ratio = Cost of goods sold
$252,000 $165,000
Average inventory ($24,000 + $18,000) /2 ($50,000 + $60,000) /2
= 12.0 times 3.0 times
Requirement 3 Lewis Clark
Average days in
inventory =
365
365 365
Inventory turnover ratio
12.0 3.0
= 30.4 days 121.7 days
Requirement 4
Lewis seems to be managing its inventory more efficiently. For Lewis, inventory
turns over 12 times per year. In other words, inventory sells every 30.4 days. For
Clark, its inventory turns over only three times per year or every 121.7 days.
Chapter 6 - Inventory and Cost of Goods Sold
© The McGraw-Hill Companies, Inc., 2014
Solutions Manual, Chapter 6 6-35
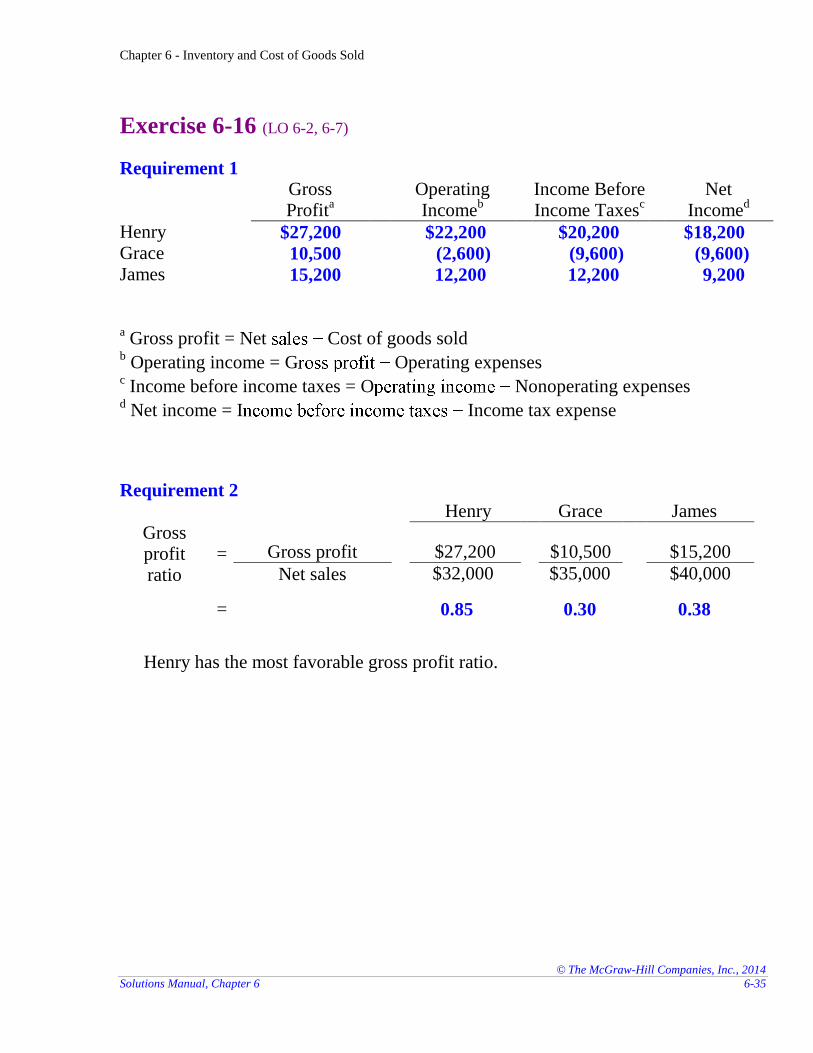
Exercise 6-16 (LO 6-2, 6-7)
Requirement 1
Gross Profit
a
Operating Income
b
Income Before Income Taxes
c
Net Income
d
Henry $27,200 $22,200 $20,200 $18,200 Grace 10,500 (2,600) (9,600) (9,600) James 15,200 12,200 12,200 9,200
a Gross profit = Net Cost of goods sold
b Operating income = G Operating expenses
c Income before income taxes = O Nonoperating expenses
d Net income = I Income tax expense
Requirement 2 Henry Grace James
Gross profit ratio
= Gross profit
$27,200 $10,500 $15,200
Net sales $32,000 $35,000 $40,000
= 0.85 0.30 0.38
Henry has the most favorable gross profit ratio.
Chapter 6 - Inventory and Cost of Goods Sold
© The McGraw-Hill Companies, Inc., 2014
6-36 Financial Accounting, 3e
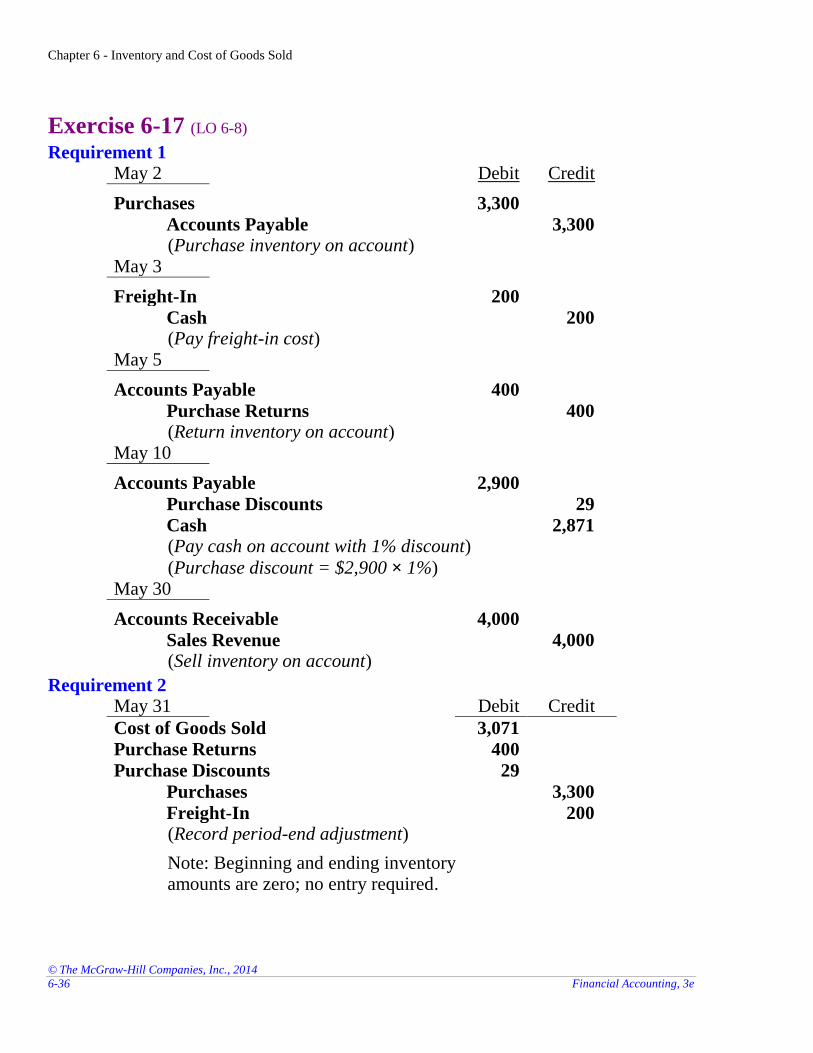
Exercise 6-17 (LO 6-8) Requirement 1
May 2 Debit Credit
Purchases 3,300
Accounts Payable 3,300 (Purchase inventory on account)
May 3
Freight-In 200
Cash 200 (Pay freight-in cost)
May 5
Accounts Payable 400
Purchase Returns 400 (Return inventory on account)
May 10
Accounts Payable 2,900
Purchase Discounts 29
Cash 2,871 (Pay cash on account with 1% discount)
(Purchase discount = $2,900 × 1%)
May 30
Accounts Receivable 4,000
Sales Revenue 4,000 (Sell inventory on account)
Requirement 2 May 31 Debit Credit
Cost of Goods Sold 3,071
Purchase Returns 400
Purchase Discounts 29
Purchases 3,300
Freight-In 200 (Record period-end adjustment)
Note: Beginning and ending inventory amounts are zero; no entry required.
Chapter 6 - Inventory and Cost of Goods Sold
© The McGraw-Hill Companies, Inc., 2014
Solutions Manual, Chapter 6 6-37
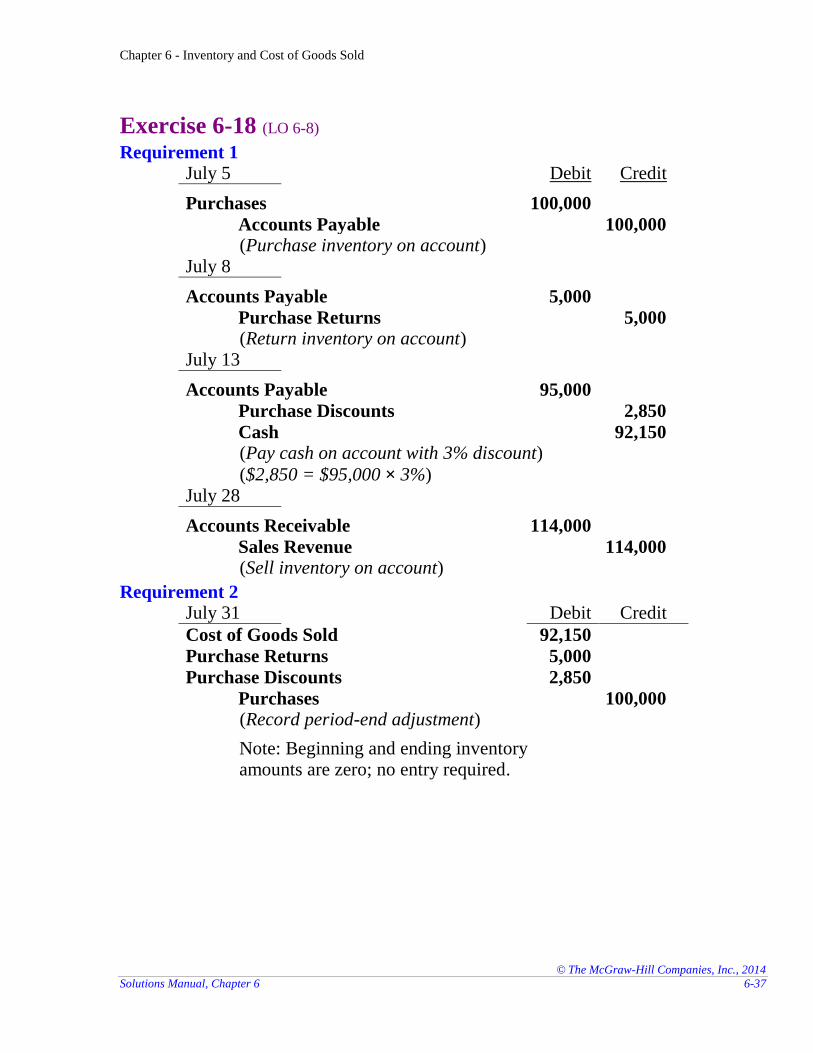
Exercise 6-18 (LO 6-8) Requirement 1
July 5 Debit Credit
Purchases 100,000
Accounts Payable 100,000 (Purchase inventory on account)
July 8
Accounts Payable 5,000
Purchase Returns 5,000 (Return inventory on account)
July 13
Accounts Payable 95,000
Purchase Discounts 2,850
Cash 92,150 (Pay cash on account with 3% discount)
($2,850 = $95,000 × 3%)
July 28
Accounts Receivable 114,000
Sales Revenue 114,000 (Sell inventory on account)
Requirement 2 July 31 Debit Credit
Cost of Goods Sold 92,150
Purchase Returns 5,000
Purchase Discounts 2,850
Purchases 100,000 (Record period-end adjustment)
Note: Beginning and ending inventory amounts are zero; no entry required.
Chapter 6 - Inventory and Cost of Goods Sold
© The McGraw-Hill Companies, Inc., 2014
6-38 Financial Accounting, 3e
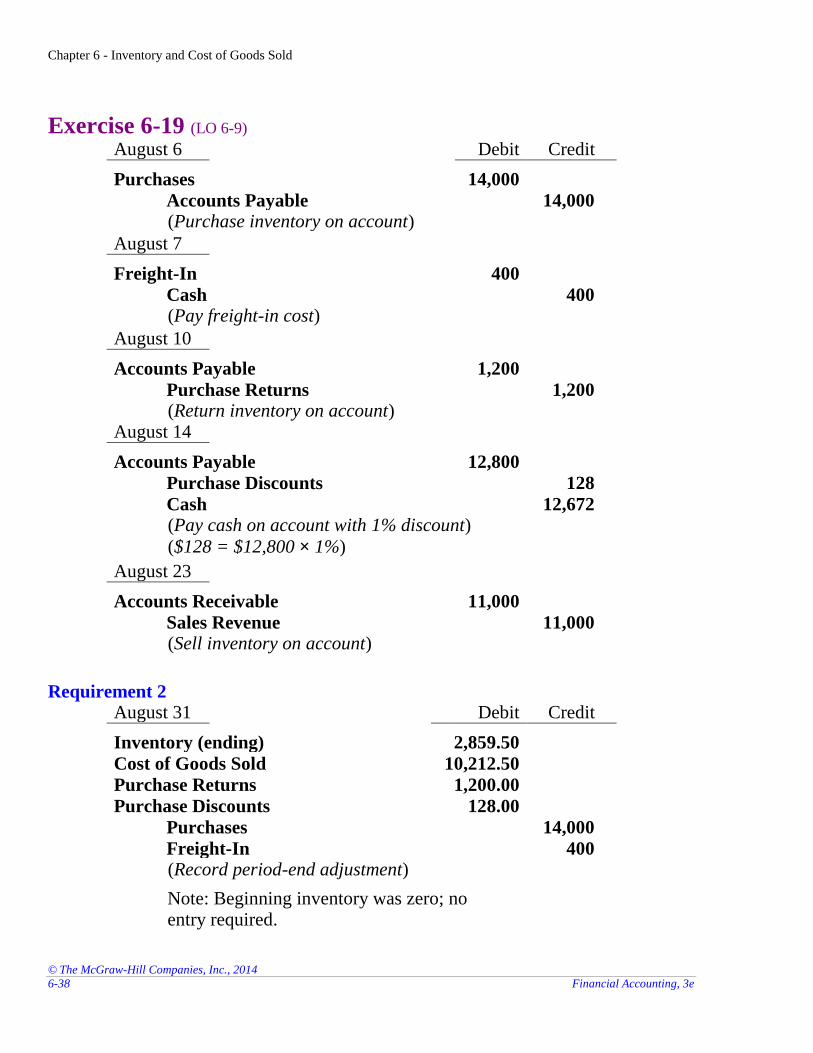
Exercise 6-19 (LO 6-9) August 6 Debit Credit
Purchases 14,000
Accounts Payable 14,000 (Purchase inventory on account)
August 7
Freight-In 400
Cash 400 (Pay freight-in cost)
August 10
Accounts Payable 1,200
Purchase Returns 1,200 (Return inventory on account)
August 14
Accounts Payable 12,800
Purchase Discounts 128
Cash 12,672 (Pay cash on account with 1% discount)
($128 = $12,800 × 1%)
August 23
Accounts Receivable 11,000
Sales Revenue 11,000 (Sell inventory on account)
Requirement 2 August 31 Debit Credit
Inventory (ending) 2,859.50
Cost of Goods Sold 10,212.50
Purchase Returns 1,200.00
Purchase Discounts 128.00
Purchases 14,000
Freight-In 400 (Record period-end adjustment)
Note: Beginning inventory was zero; no entry required.
Chapter 6 - Inventory and Cost of Goods Sold
© The McGraw-Hill Companies, Inc., 2014
Solutions Manual, Chapter 6 6-39
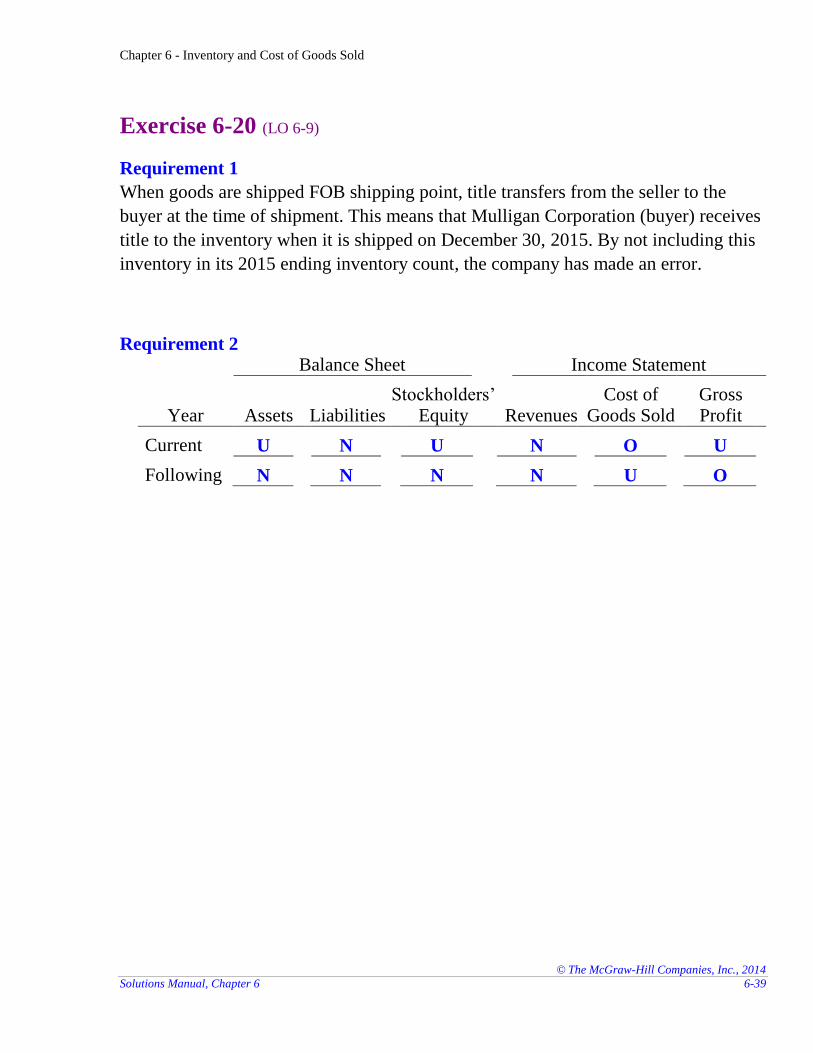
Exercise 6-20 (LO 6-9)
Requirement 1
When goods are shipped FOB shipping point, title transfers from the seller to the
buyer at the time of shipment. This means that Mulligan Corporation (buyer) receives
title to the inventory when it is shipped on December 30, 2015. By not including this
inventory in its 2015 ending inventory count, the company has made an error.
Requirement 2 Balance Sheet Income Statement
Year Assets Liabilities Stockholders’
Equity Revenues Cost of
Goods Sold Gross Profit
Current U N U N O U
Following N N N N U O
Chapter 6 - Inventory and Cost of Goods Sold
© The McGraw-Hill Companies, Inc., 2014
6-40 Financial Accounting, 3e
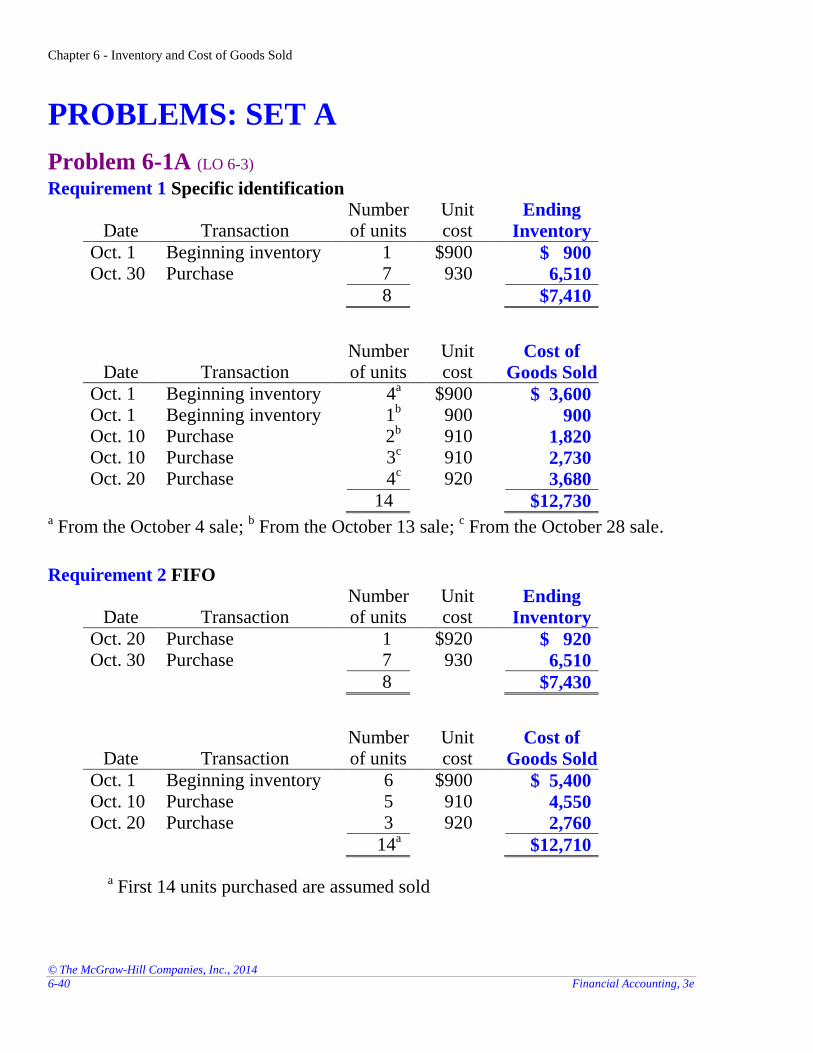
PROBLEMS: SET A
Problem 6-1A (LO 6-3) Requirement 1 Specific identification
Date Transaction Number of units
Unit cost
Ending
Inventory
Oct. 1 Beginning inventory 1 $900 $ 900 Oct. 30 Purchase 7 930 6,510
8 $7,410
Date Transaction Number of units
Unit cost
Cost of
Goods Sold
Oct. 1 Beginning inventory 4a $900 $ 3,600
Oct. 1 Beginning inventory 1b 900 900
Oct. 10 Purchase 2b 910 1,820
Oct. 10 Purchase 3c 910 2,730
Oct. 20 Purchase 4c 920 3,680
14 $12,730 a From the October 4 sale;
b From the October 13 sale;
c From the October 28 sale.
Requirement 2 FIFO
Date Transaction Number of units
Unit cost
Ending
Inventory
Oct. 20 Purchase 1 $920 $ 920 Oct. 30 Purchase 7 930 6,510
8 $7,430
Date Transaction Number of units
Unit cost
Cost of
Goods Sold
Oct. 1 Beginning inventory 6 $900 $ 5,400 Oct. 10 Purchase 5 910 4,550 Oct. 20 Purchase 3 920 2,760
14a $12,710
a First 14 units purchased are assumed sold
Chapter 6 - Inventory and Cost of Goods Sold
© The McGraw-Hill Companies, Inc., 2014
Solutions Manual, Chapter 6 6-41
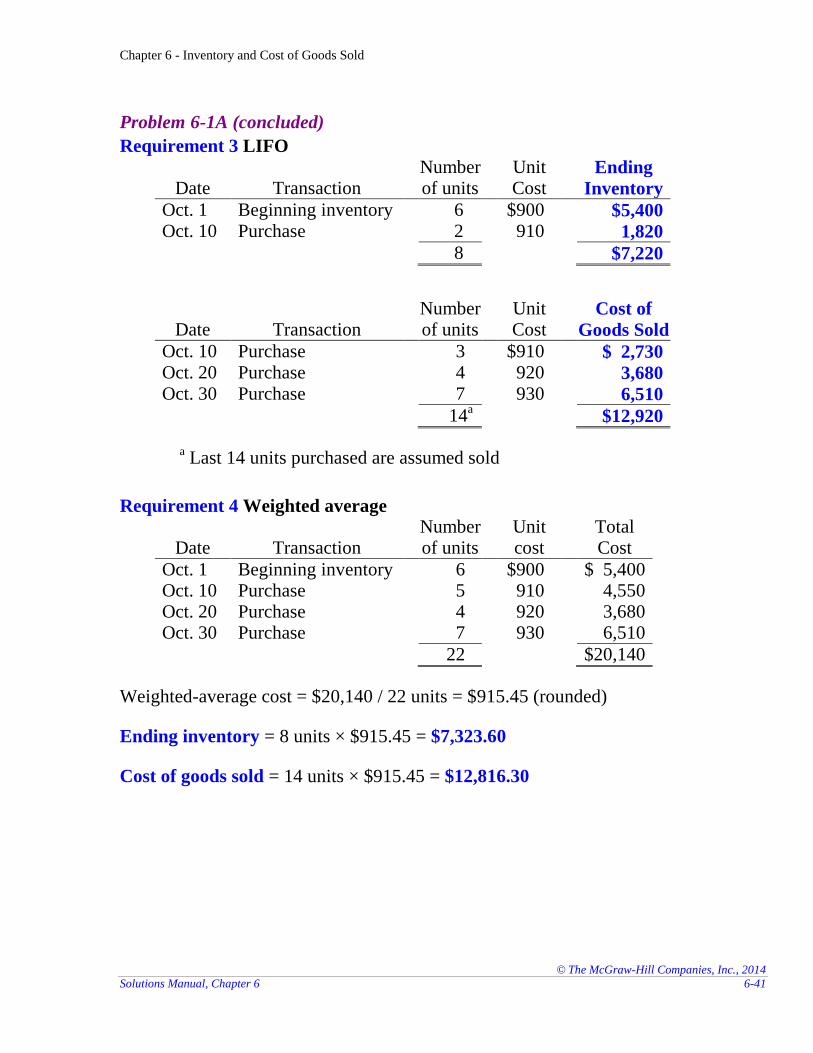
Problem 6-1A (concluded)
Requirement 3 LIFO
Date Transaction Number of units
Unit Cost
Ending
Inventory
Oct. 1 Beginning inventory 6 $900 $5,400 Oct. 10 Purchase 2 910 1,820
8 $7,220
Date Transaction Number of units
Unit Cost
Cost of
Goods Sold
Oct. 10 Purchase 3 $910 $ 2,730 Oct. 20 Purchase 4 920 3,680 Oct. 30 Purchase 7 930 6,510
14a $12,920
a Last 14 units purchased are assumed sold
Requirement 4 Weighted average
Date Transaction Number of units
Unit cost
Total Cost
Oct. 1 Beginning inventory 6 $900 $ 5,400 Oct. 10 Purchase 5 910 4,550 Oct. 20 Purchase 4 920 3,680 Oct. 30 Purchase 7 930 6,510
22 $20,140
Weighted-average cost = $20,140 / 22 units = $915.45 (rounded)
Ending inventory = 8 units × $915.45 = $7,323.60
Cost of goods sold = 14 units × $915.45 = $12,816.30
Chapter 6 - Inventory and Cost of Goods Sold
© The McGraw-Hill Companies, Inc., 2014
6-42 Financial Accounting, 3e
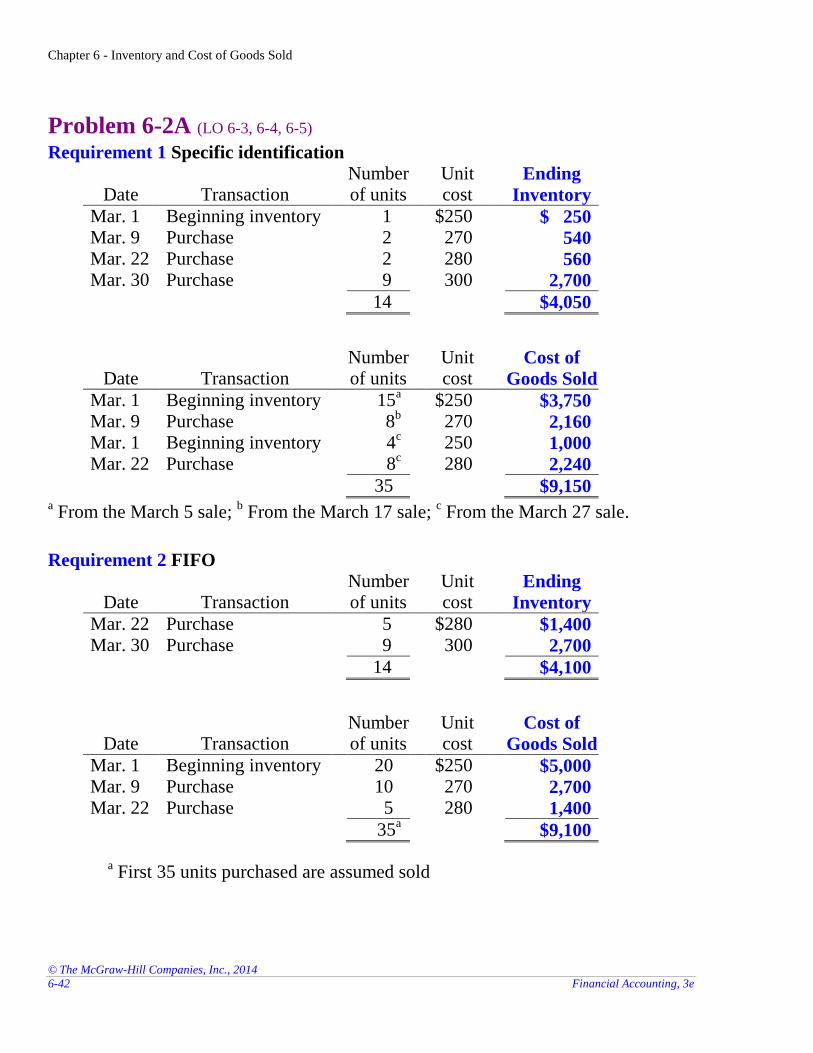
Problem 6-2A (LO 6-3, 6-4, 6-5) Requirement 1 Specific identification
Date Transaction Number of units
Unit cost
Ending
Inventory
Mar. 1 Beginning inventory 1 $250 $ 250 Mar. 9 Purchase 2 270 540 Mar. 22 Purchase 2 280 560 Mar. 30 Purchase 9 300 2,700
14 $4,050
Date Transaction Number of units
Unit cost
Cost of
Goods Sold
Mar. 1 Beginning inventory 15a $250 $3,750
Mar. 9 Purchase 8b 270 2,160
Mar. 1 Beginning inventory 4c 250 1,000
Mar. 22 Purchase 8c 280 2,240
35 $9,150 a From the March 5 sale;
b From the March 17 sale;
c From the March 27 sale.
Requirement 2 FIFO
Date Transaction Number of units
Unit cost
Ending
Inventory
Mar. 22 Purchase 5 $280 $1,400 Mar. 30 Purchase 9 300 2,700
14 $4,100
Date Transaction Number of units
Unit cost
Cost of
Goods Sold
Mar. 1 Beginning inventory 20 $250 $5,000 Mar. 9 Purchase 10 270 2,700 Mar. 22 Purchase 5 280 1,400
35a $9,100
a First 35 units purchased are assumed sold
Chapter 6 - Inventory and Cost of Goods Sold
© The McGraw-Hill Companies, Inc., 2014
Solutions Manual, Chapter 6 6-43
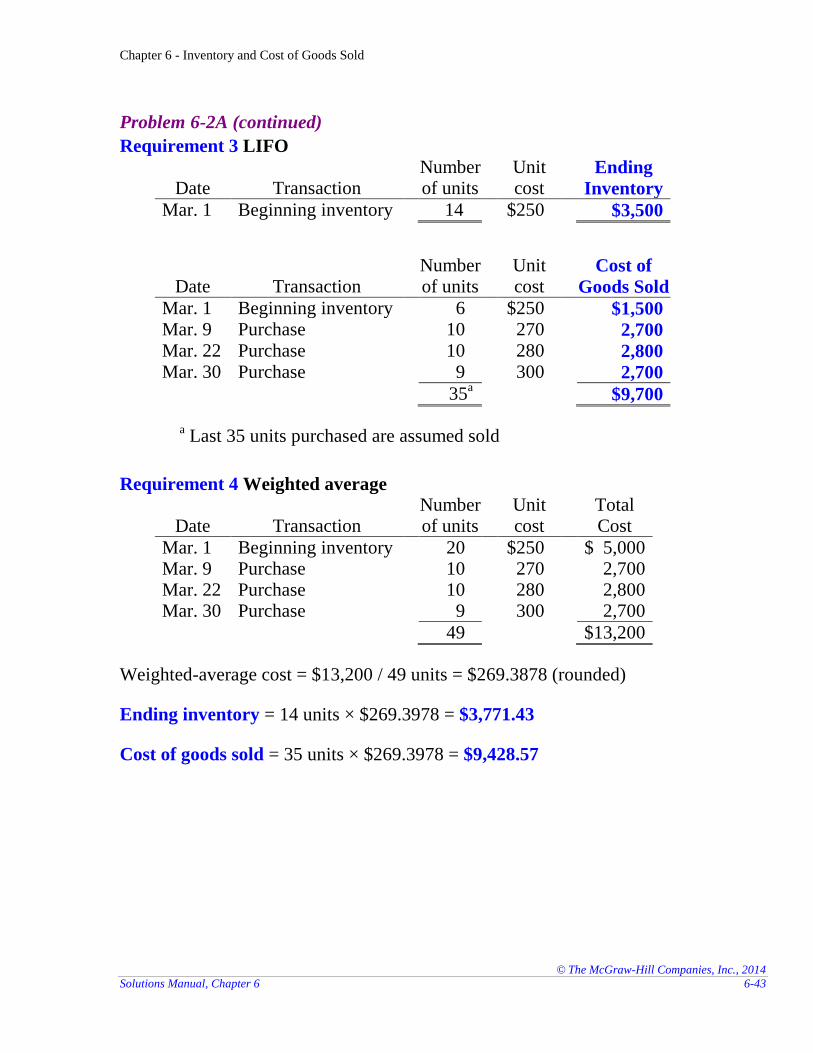
Problem 6-2A (continued)
Requirement 3 LIFO
Date Transaction Number of units
Unit cost
Ending
Inventory
Mar. 1 Beginning inventory 14 $250 $3,500
Date Transaction Number of units
Unit cost
Cost of
Goods Sold
Mar. 1 Beginning inventory 6 $250 $1,500 Mar. 9 Purchase 10 270 2,700 Mar. 22 Purchase 10 280 2,800 Mar. 30 Purchase 9 300 2,700
35a $9,700
a Last 35 units purchased are assumed sold
Requirement 4 Weighted average
Date Transaction Number of units
Unit cost
Total Cost
Mar. 1 Beginning inventory 20 $250 $ 5,000 Mar. 9 Purchase 10 270 2,700 Mar. 22 Purchase 10 280 2,800 Mar. 30 Purchase 9 300 2,700
49 $13,200
Weighted-average cost = $13,200 / 49 units = $269.3878 (rounded)
Ending inventory = 14 units × $269.3978 = $3,771.43
Cost of goods sold = 35 units × $269.3978 = $9,428.57
Chapter 6 - Inventory and Cost of Goods Sold
© The McGraw-Hill Companies, Inc., 2014
6-44 Financial Accounting, 3e
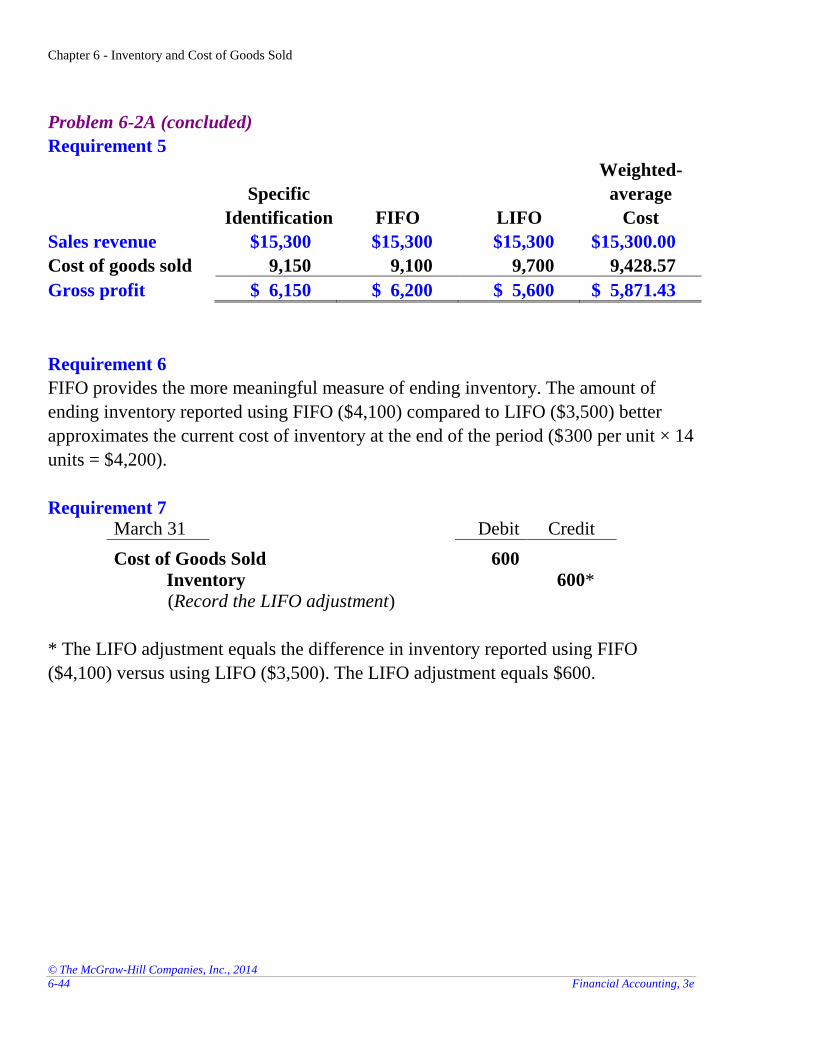
Problem 6-2A (concluded)
Requirement 5
Specific
Identification FIFO LIFO
Weighted-
average
Cost
Sales revenue $15,300 $15,300 $15,300 $15,300.00
Cost of goods sold 9,150 9,100 9,700 9,428.57
Gross profit $ 6,150 $ 6,200 $ 5,600 $ 5,871.43
Requirement 6
FIFO provides the more meaningful measure of ending inventory. The amount of
ending inventory reported using FIFO ($4,100) compared to LIFO ($3,500) better
approximates the current cost of inventory at the end of the period ($300 per unit × 14
units = $4,200).
Requirement 7 March 31 Debit Credit
Cost of Goods Sold 600
Inventory 600* (Record the LIFO adjustment)
* The LIFO adjustment equals the difference in inventory reported using FIFO
($4,100) versus using LIFO ($3,500). The LIFO adjustment equals $600.
Chapter 6 - Inventory and Cost of Goods Sold
© The McGraw-Hill Companies, Inc., 2014
Solutions Manual, Chapter 6 6-45
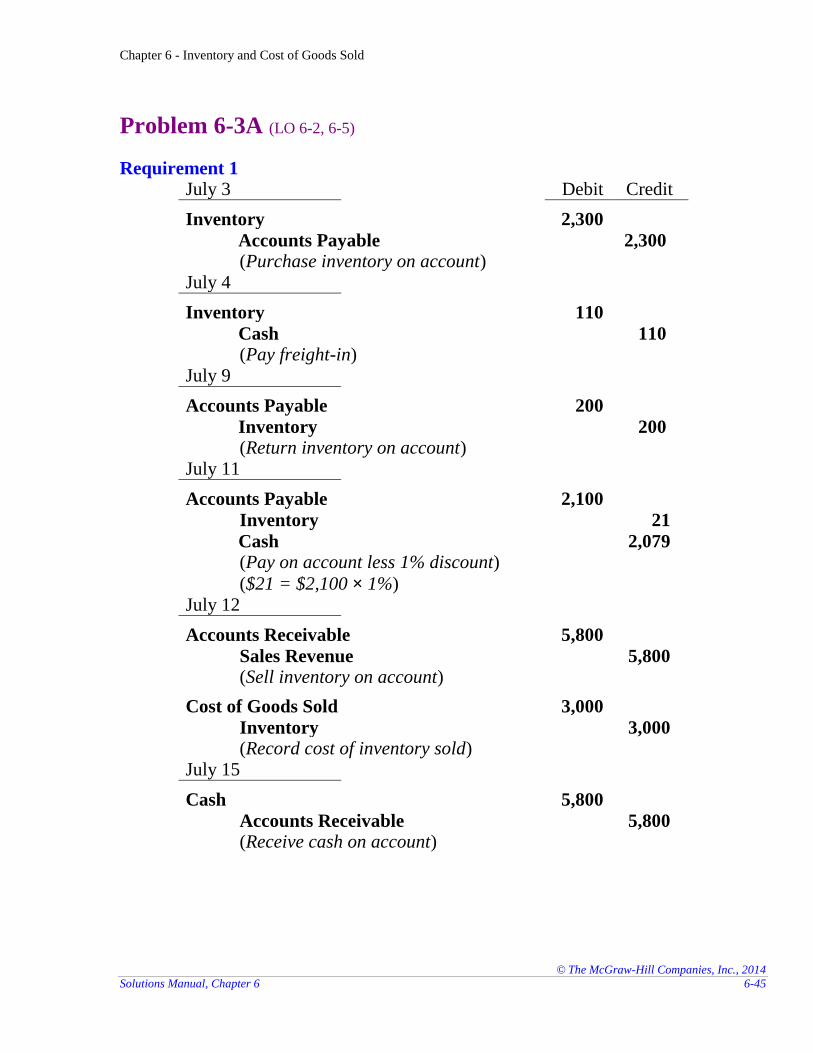
Problem 6-3A (LO 6-2, 6-5)
Requirement 1 July 3 Debit Credit
Inventory 2,300
Accounts Payable 2,300 (Purchase inventory on account)
July 4
Inventory 110
Cash 110 (Pay freight-in)
July 9
Accounts Payable 200
Inventory 200 (Return inventory on account)
July 11
Accounts Payable 2,100
Inventory 21
Cash 2,079 (Pay on account less 1% discount)
($21 = $2,100 × 1%)
July 12
Accounts Receivable 5,800
Sales Revenue 5,800 (Sell inventory on account)
Cost of Goods Sold 3,000
Inventory 3,000 (Record cost of inventory sold)
July 15
Cash 5,800
Accounts Receivable 5,800 (Receive cash on account)
Chapter 6 - Inventory and Cost of Goods Sold
© The McGraw-Hill Companies, Inc., 2014
6-46 Financial Accounting, 3e
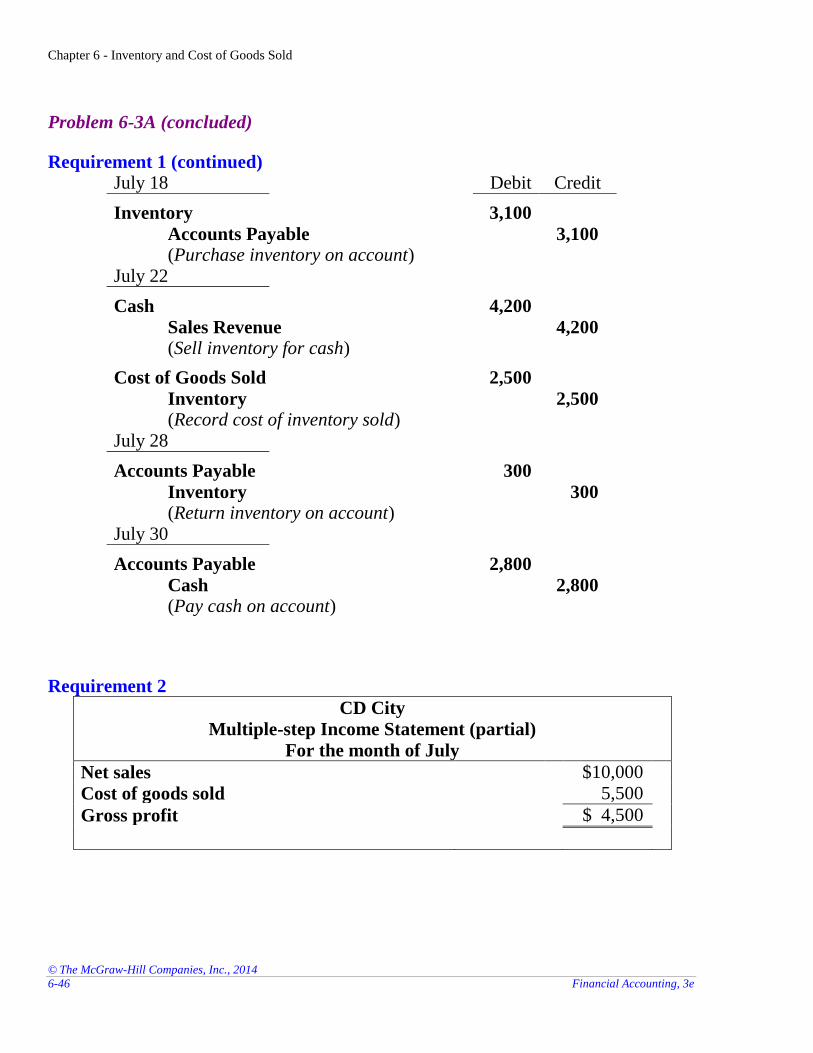
Problem 6-3A (concluded)
Requirement 1 (continued) July 18 Debit Credit
Inventory 3,100
Accounts Payable 3,100 (Purchase inventory on account)
July 22
Cash 4,200
Sales Revenue 4,200 (Sell inventory for cash)
Cost of Goods Sold 2,500
Inventory 2,500 (Record cost of inventory sold)
July 28
Accounts Payable 300
Inventory 300 (Return inventory on account)
July 30
Accounts Payable 2,800
Cash 2,800 (Pay cash on account)
Requirement 2
CD City
Multiple-step Income Statement (partial)
For the month of July
Net sales $10,000
Cost of goods sold 5,500
Gross profit $ 4,500
Chapter 6 - Inventory and Cost of Goods Sold
© The McGraw-Hill Companies, Inc., 2014
Solutions Manual, Chapter 6 6-47
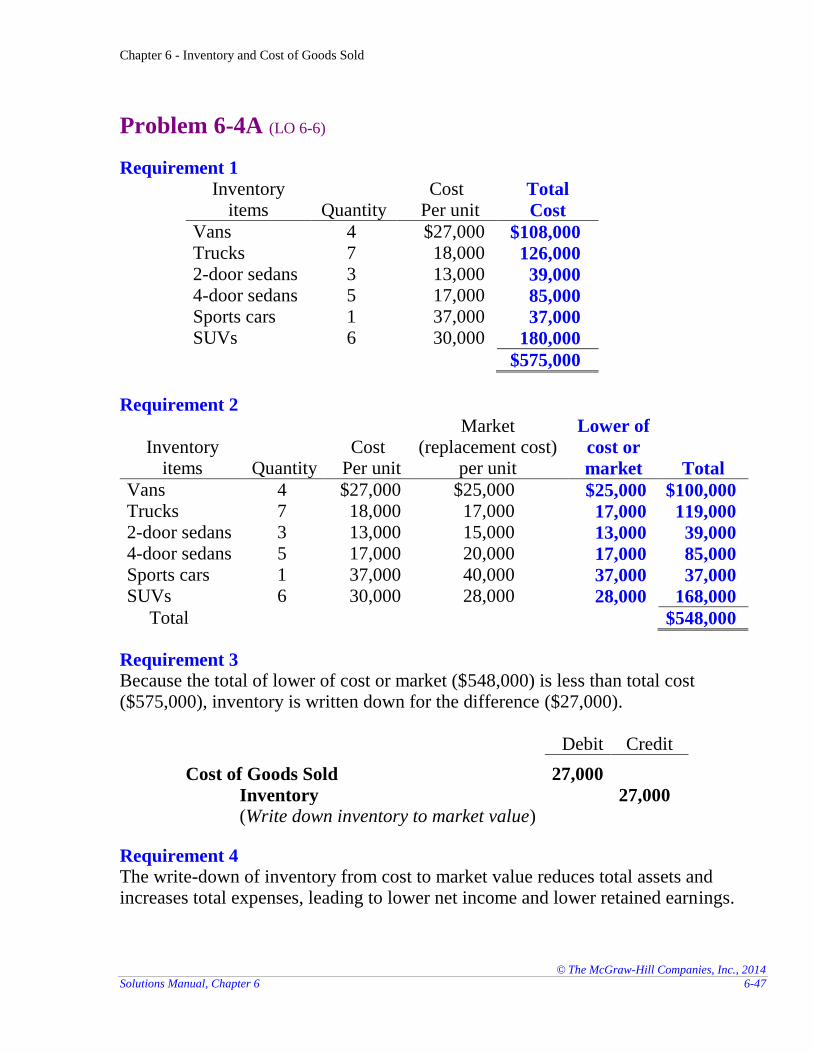
Problem 6-4A (LO 6-6)
Requirement 1
Inventory items Quantity
Cost Per unit
Total
Cost
Vans 4 $27,000 $108,000 Trucks 7 18,000 126,000 2-door sedans 3 13,000 39,000 4-door sedans 5 17,000 85,000 Sports cars 1 37,000 37,000 SUVs 6 30,000 180,000
$575,000
Requirement 2
Inventory items Quantity
Cost Per unit
Market (replacement cost)
per unit
Lower of
cost or
market Total
Vans 4 $27,000 $25,000 $25,000 $100,000 Trucks 7 18,000 17,000 17,000 119,000 2-door sedans 3 13,000 15,000 13,000 39,000 4-door sedans 5 17,000 20,000 17,000 85,000 Sports cars 1 37,000 40,000 37,000 37,000 SUVs 6 30,000 28,000 28,000 168,000
Total $548,000
Requirement 3 Because the total of lower of cost or market ($548,000) is less than total cost ($575,000), inventory is written down for the difference ($27,000).
Debit Credit
Cost of Goods Sold 27,000
Inventory 27,000 (Write down inventory to market value)
Requirement 4 The write-down of inventory from cost to market value reduces total assets and increases total expenses, leading to lower net income and lower retained earnings.
Chapter 6 - Inventory and Cost of Goods Sold
© The McGraw-Hill Companies, Inc., 2014
6-48 Financial Accounting, 3e
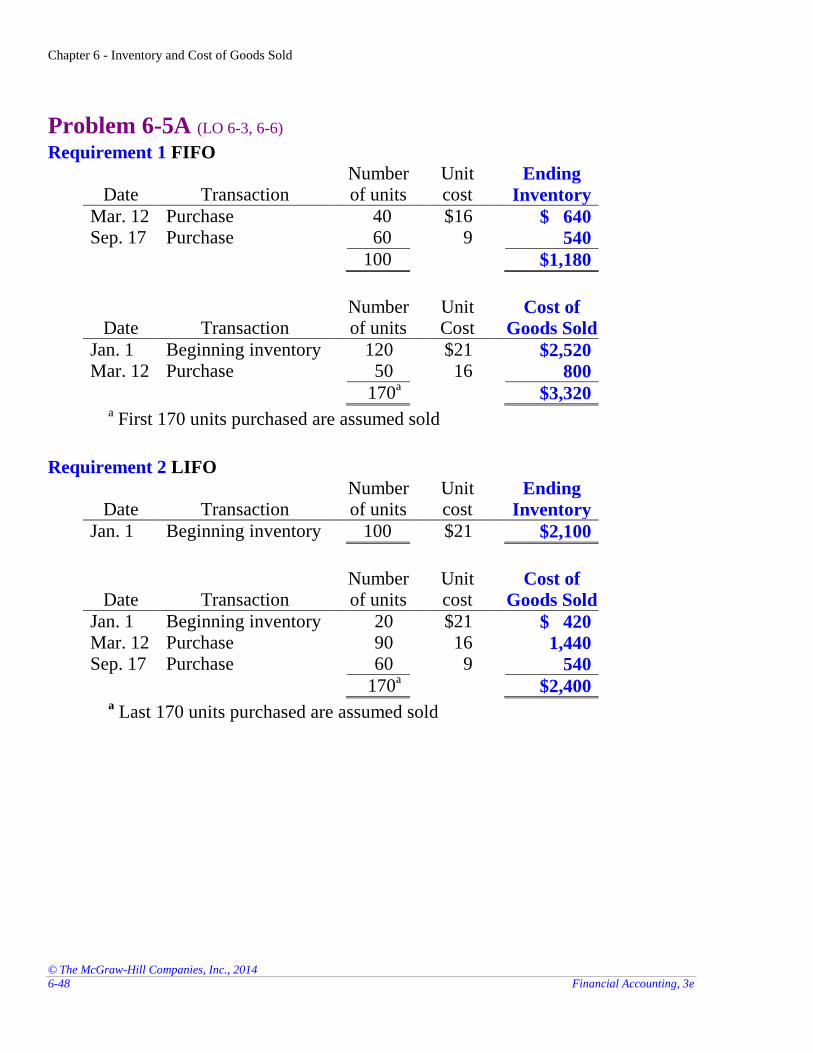
Problem 6-5A (LO 6-3, 6-6) Requirement 1 FIFO
Date Transaction Number of units
Unit cost
Ending
Inventory
Mar. 12 Purchase 40 $16 $ 640 Sep. 17 Purchase 60 9 540
100 $1,180
Date Transaction Number of units
Unit Cost
Cost of
Goods Sold
Jan. 1 Beginning inventory 120 $21 $2,520 Mar. 12 Purchase 50 16 800
170a $3,320
a First 170 units purchased are assumed sold
Requirement 2 LIFO
Date Transaction Number of units
Unit cost
Ending
Inventory
Jan. 1 Beginning inventory 100 $21 $2,100
Date Transaction Number of units
Unit cost
Cost of
Goods Sold
Jan. 1 Beginning inventory 20 $21 $ 420 Mar. 12 Purchase 90 16 1,440 Sep. 17 Purchase 60 9 540
170a $2,400
a Last 170 units purchased are assumed sold

Chapter 6 - Inventory and Cost of Goods Sold
© The McGraw-Hill Companies, Inc., 2014
Solutions Manual, Chapter 6 6-49
Problem 6-5A (concluded)
Requirement 3
Ending Inventory
Cost Market
Lower-of-cost-
or-market
FIFO $ 1,180a $500 $500
LIFO 2,100b 500 500
a Ending inventory from Requirement 1 above.
b Ending inventory from Requirement 2 above.
(a) FIFO Debit Credit
Cost of Goods Sold 680
Inventory 680 (Adjust inventory to market value)
(b) LIFO
Cost of Goods Sold 1,600
Inventory 1,600 (Adjust inventory to market value)
Chapter 6 - Inventory and Cost of Goods Sold
© The McGraw-Hill Companies, Inc., 2014
6-50 Financial Accounting, 3e
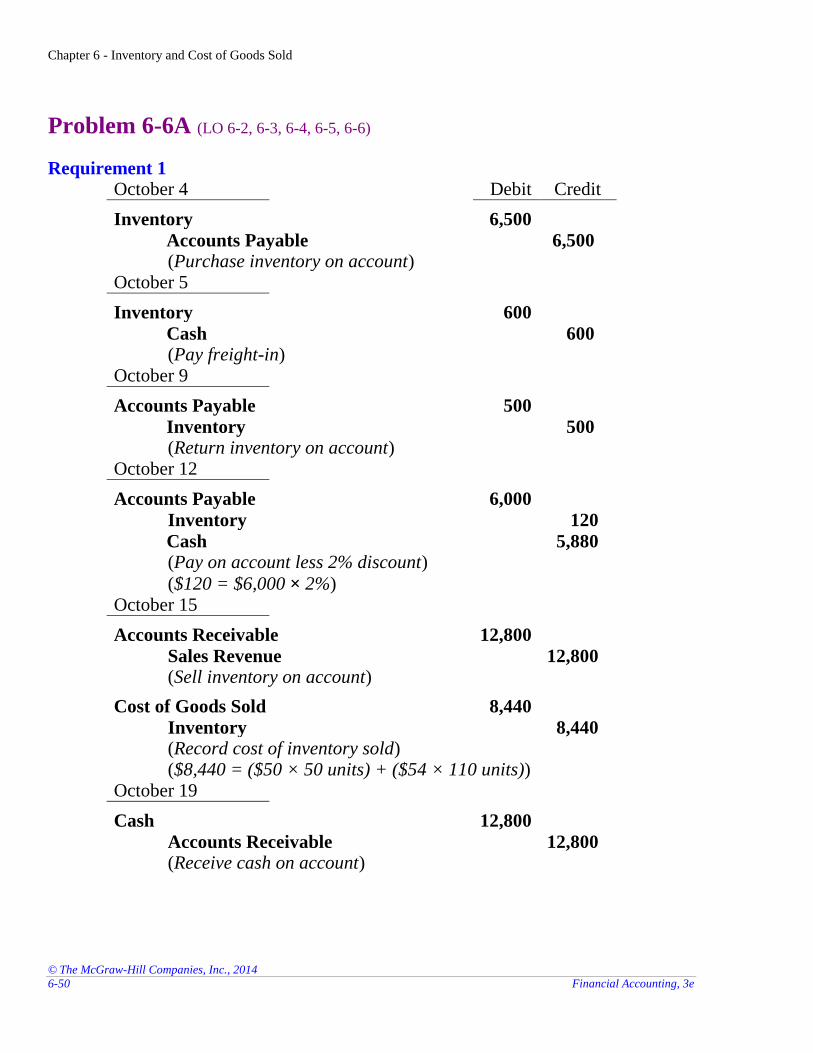
Problem 6-6A (LO 6-2, 6-3, 6-4, 6-5, 6-6)
Requirement 1 October 4 Debit Credit
Inventory 6,500
Accounts Payable 6,500 (Purchase inventory on account)
October 5
Inventory 600
Cash 600 (Pay freight-in)
October 9
Accounts Payable 500
Inventory 500 (Return inventory on account)
October 12
Accounts Payable 6,000
Inventory 120
Cash 5,880 (Pay on account less 2% discount)
($120 = $6,000 × 2%)
October 15
Accounts Receivable 12,800
Sales Revenue 12,800 (Sell inventory on account)
Cost of Goods Sold 8,440
Inventory 8,440 (Record cost of inventory sold) ($8,440 = ($50 × 50 units) + ($54 × 110 units))
October 19
Cash 12,800
Accounts Receivable 12,800 (Receive cash on account)
Chapter 6 - Inventory and Cost of Goods Sold
© The McGraw-Hill Companies, Inc., 2014
Solutions Manual, Chapter 6 6-51
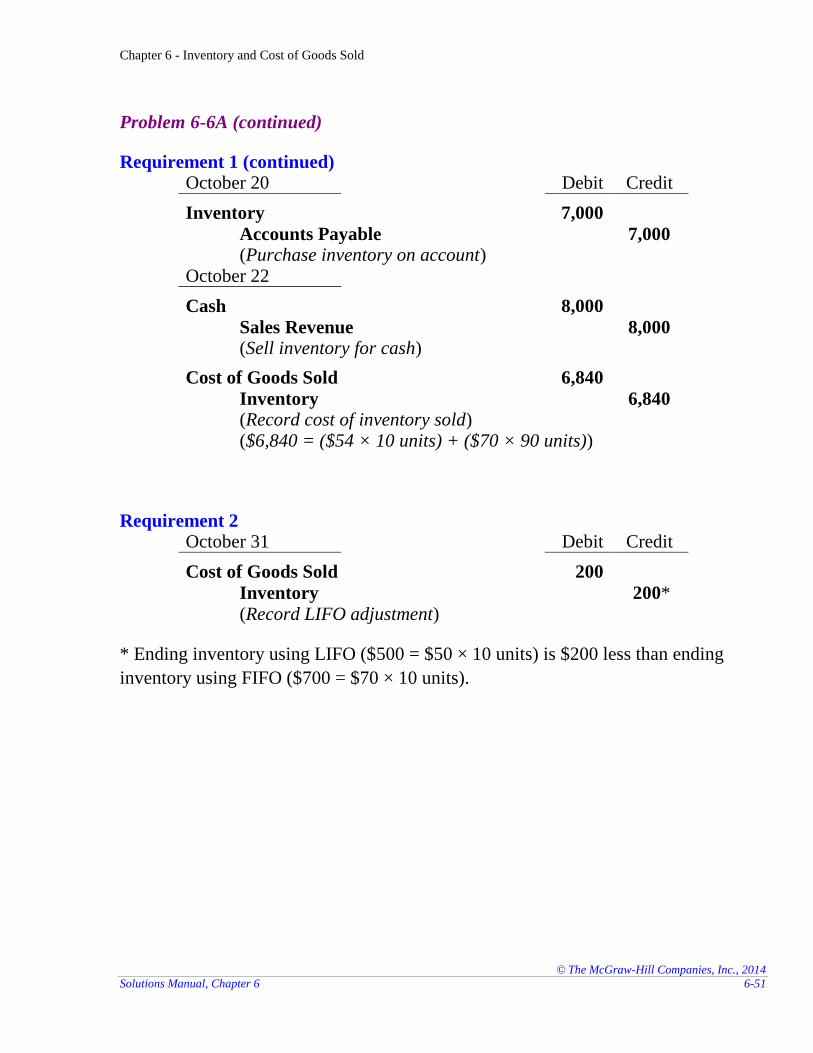
Problem 6-6A (continued)
Requirement 1 (continued) October 20 Debit Credit
Inventory 7,000
Accounts Payable 7,000 (Purchase inventory on account)
October 22
Cash 8,000
Sales Revenue 8,000 (Sell inventory for cash)
Cost of Goods Sold 6,840
Inventory 6,840 (Record cost of inventory sold) ($6,840 = ($54 × 10 units) + ($70 × 90 units))
Requirement 2 October 31 Debit Credit
Cost of Goods Sold 200
Inventory 200* (Record LIFO adjustment)
* Ending inventory using LIFO ($500 = $50 × 10 units) is $200 less than ending
inventory using FIFO ($700 = $70 × 10 units).
Chapter 6 - Inventory and Cost of Goods Sold
© The McGraw-Hill Companies, Inc., 2014
6-52 Financial Accounting, 3e
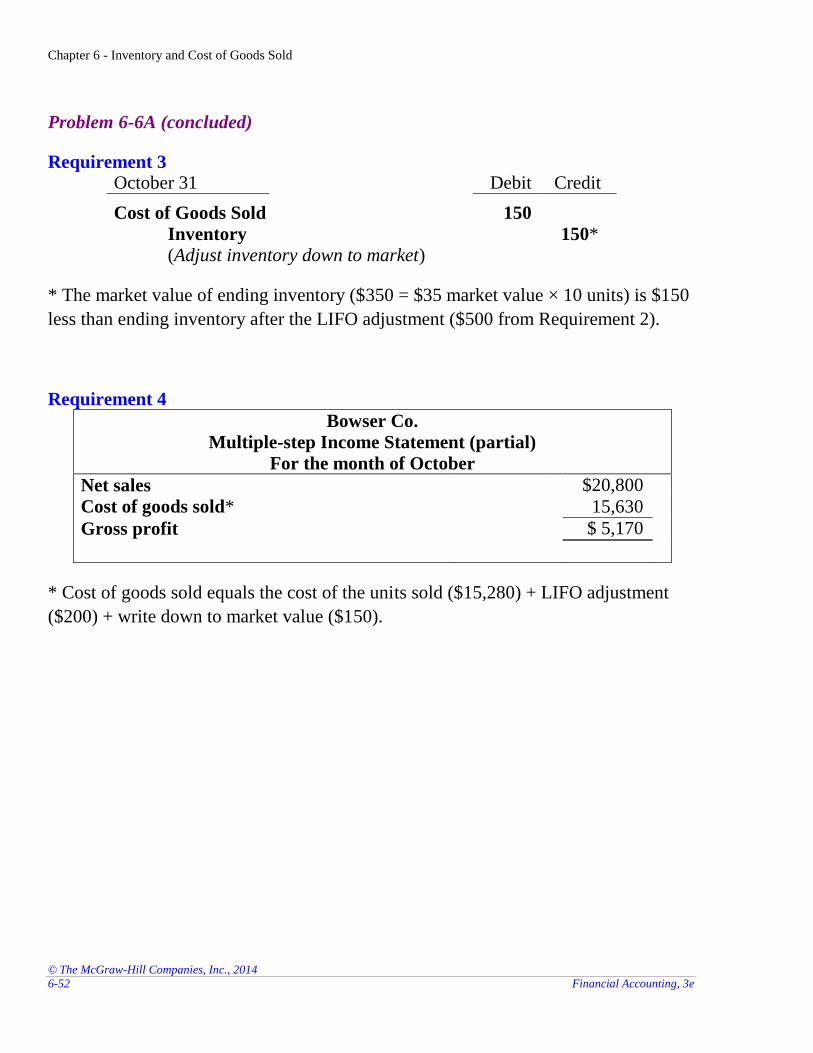
Problem 6-6A (concluded)
Requirement 3 October 31 Debit Credit
Cost of Goods Sold 150
Inventory 150* (Adjust inventory down to market)
* The market value of ending inventory ($350 = $35 market value × 10 units) is $150
less than ending inventory after the LIFO adjustment ($500 from Requirement 2).
Requirement 4
Bowser Co.
Multiple-step Income Statement (partial)
For the month of October
Net sales $20,800
Cost of goods sold* 15,630
Gross profit $ 5,170
* Cost of goods sold equals the cost of the units sold ($15,280) + LIFO adjustment
($200) + write down to market value ($150).
Chapter 6 - Inventory and Cost of Goods Sold
© The McGraw-Hill Companies, Inc., 2014
Solutions Manual, Chapter 6 6-53
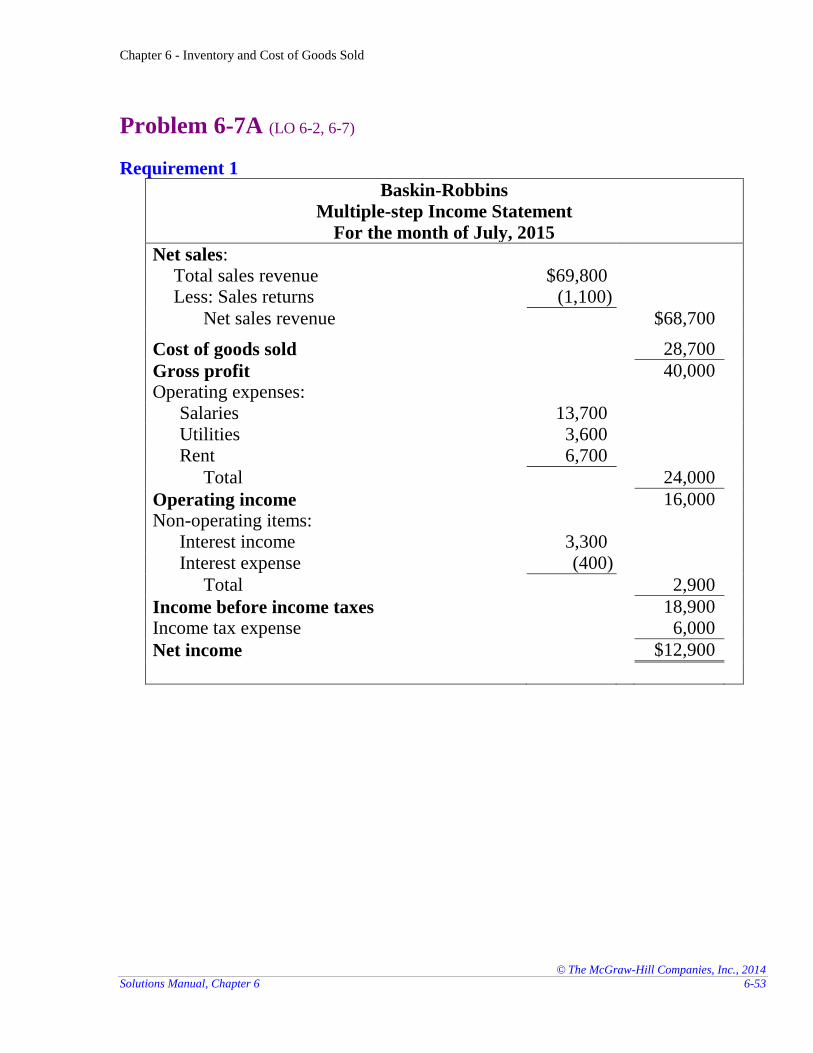
Problem 6-7A (LO 6-2, 6-7)
Requirement 1
Baskin-Robbins
Multiple-step Income Statement
For the month of July, 2015
Net sales:
Total sales revenue $69,800 Less: Sales returns (1,100)
Net sales revenue $68,700
Cost of goods sold 28,700
Gross profit 40,000
Operating expenses:
Salaries 13,700
Utilities 3,600
Rent 6,700
Total 24,000
Operating income 16,000
Non-operating items:
Interest income 3,300
Interest expense (400)
Total 2,900
Income before income taxes 18,900
Income tax expense 6,000
Net income $12,900
Chapter 6 - Inventory and Cost of Goods Sold
© The McGraw-Hill Companies, Inc., 2014
6-54 Financial Accounting, 3e
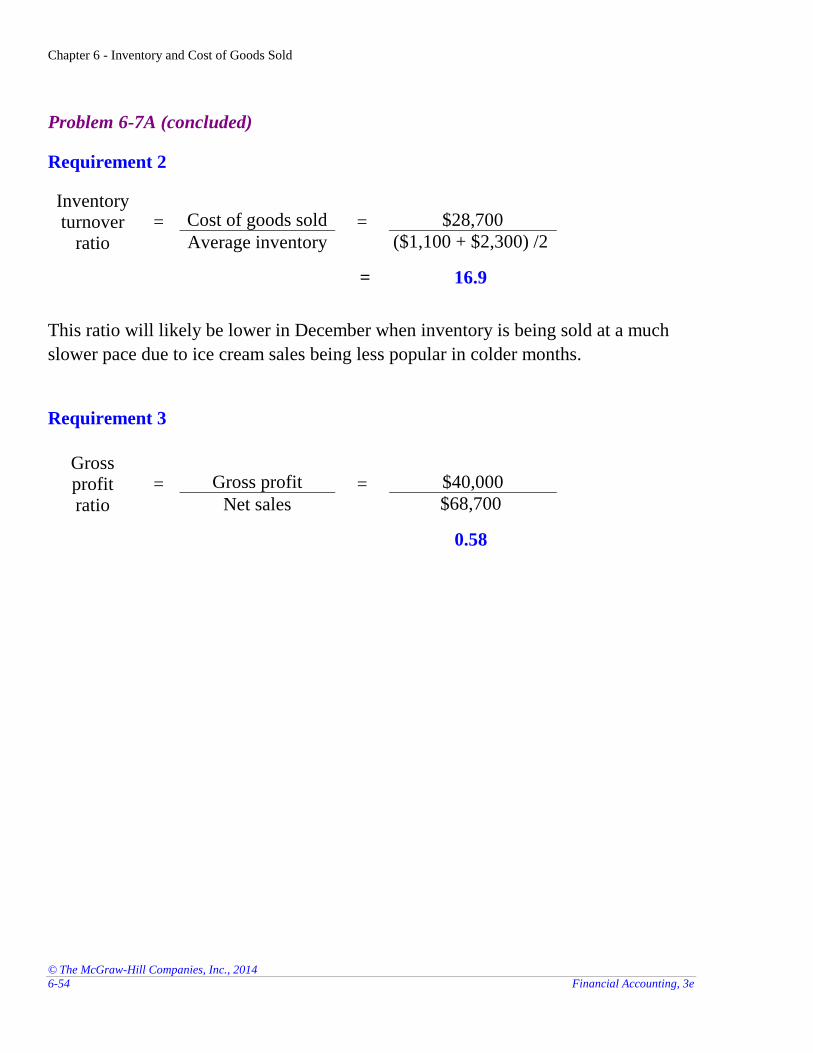
Problem 6-7A (concluded)
Requirement 2
Inventory turnover
ratio = Cost of goods sold = $28,700
Average inventory ($1,100 + $2,300) /2
= 16.9
This ratio will likely be lower in December when inventory is being sold at a much
slower pace due to ice cream sales being less popular in colder months.
Requirement 3
Gross profit ratio
= Gross profit = $40,000
Net sales $68,700
0.58
Chapter 6 - Inventory and Cost of Goods Sold
© The McGraw-Hill Companies, Inc., 2014
Solutions Manual, Chapter 6 6-55
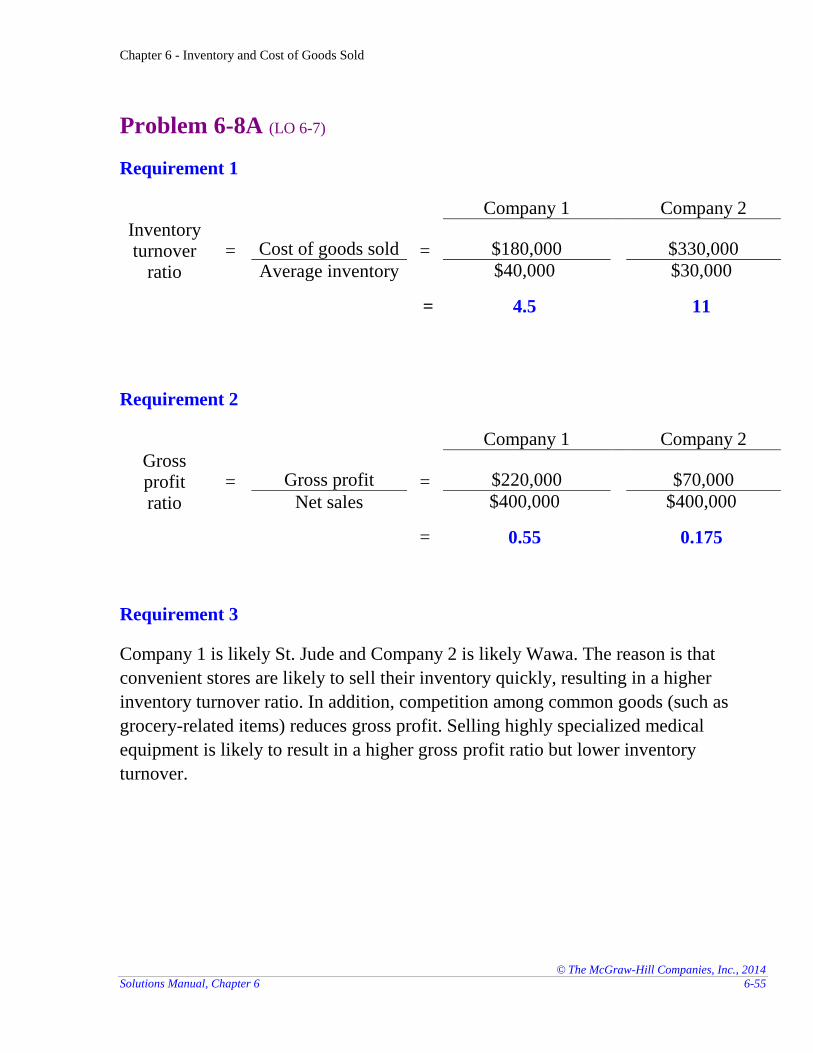
Problem 6-8A (LO 6-7)
Requirement 1
Company 1
Company 2
Inventory turnover
ratio = Cost of goods sold = $180,000
$330,000
Average inventory $40,000 $30,000
= 4.5
11
Requirement 2
Company 1
Company 2
Gross profit ratio
= Gross profit = $220,000
$70,000
Net sales $400,000 $400,000
= 0.55 0.175
Requirement 3
Company 1 is likely St. Jude and Company 2 is likely Wawa. The reason is that
convenient stores are likely to sell their inventory quickly, resulting in a higher
inventory turnover ratio. In addition, competition among common goods (such as
grocery-related items) reduces gross profit. Selling highly specialized medical
equipment is likely to result in a higher gross profit ratio but lower inventory
turnover.
Chapter 6 - Inventory and Cost of Goods Sold
© The McGraw-Hill Companies, Inc., 2014
6-56 Financial Accounting, 3e
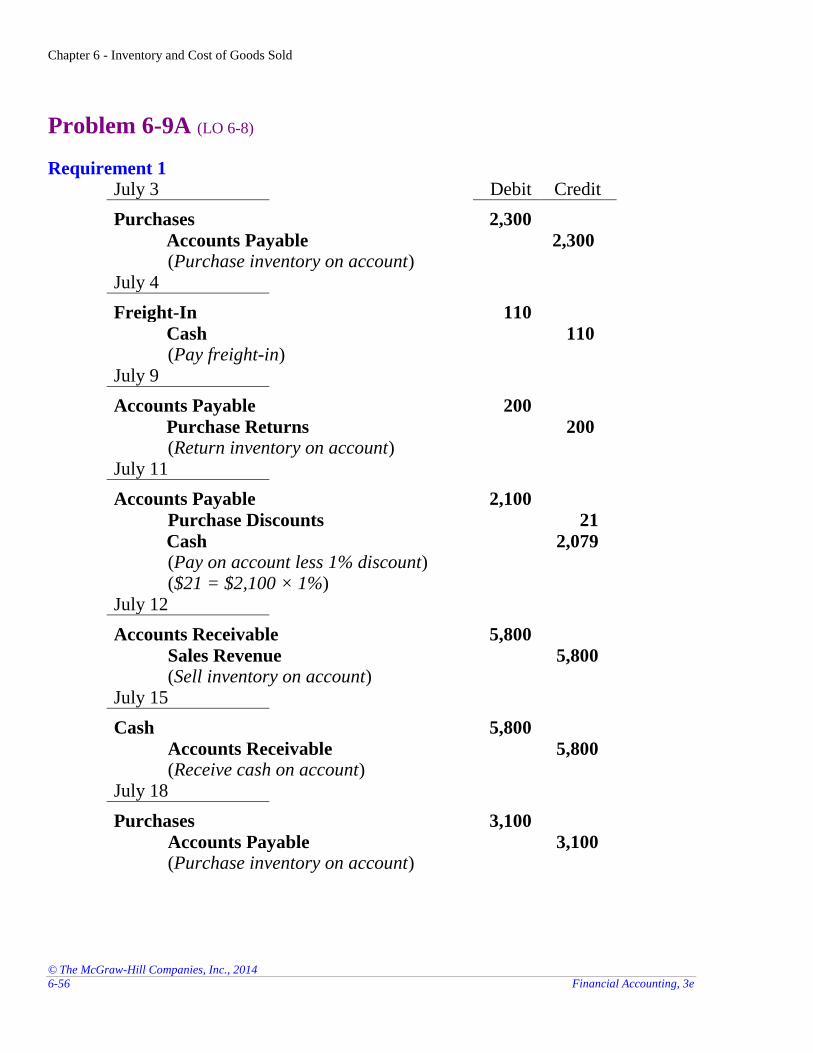
Problem 6-9A (LO 6-8)
Requirement 1 July 3 Debit Credit
Purchases 2,300
Accounts Payable 2,300 (Purchase inventory on account)
July 4
Freight-In 110
Cash 110 (Pay freight-in)
July 9
Accounts Payable 200
Purchase Returns 200 (Return inventory on account)
July 11
Accounts Payable 2,100
Purchase Discounts 21
Cash 2,079 (Pay on account less 1% discount) ($21 = $2,100 × 1%)
July 12
Accounts Receivable 5,800
Sales Revenue 5,800 (Sell inventory on account)
July 15
Cash 5,800
Accounts Receivable 5,800 (Receive cash on account)
July 18
Purchases 3,100
Accounts Payable 3,100 (Purchase inventory on account)
Chapter 6 - Inventory and Cost of Goods Sold
© The McGraw-Hill Companies, Inc., 2014
Solutions Manual, Chapter 6 6-57
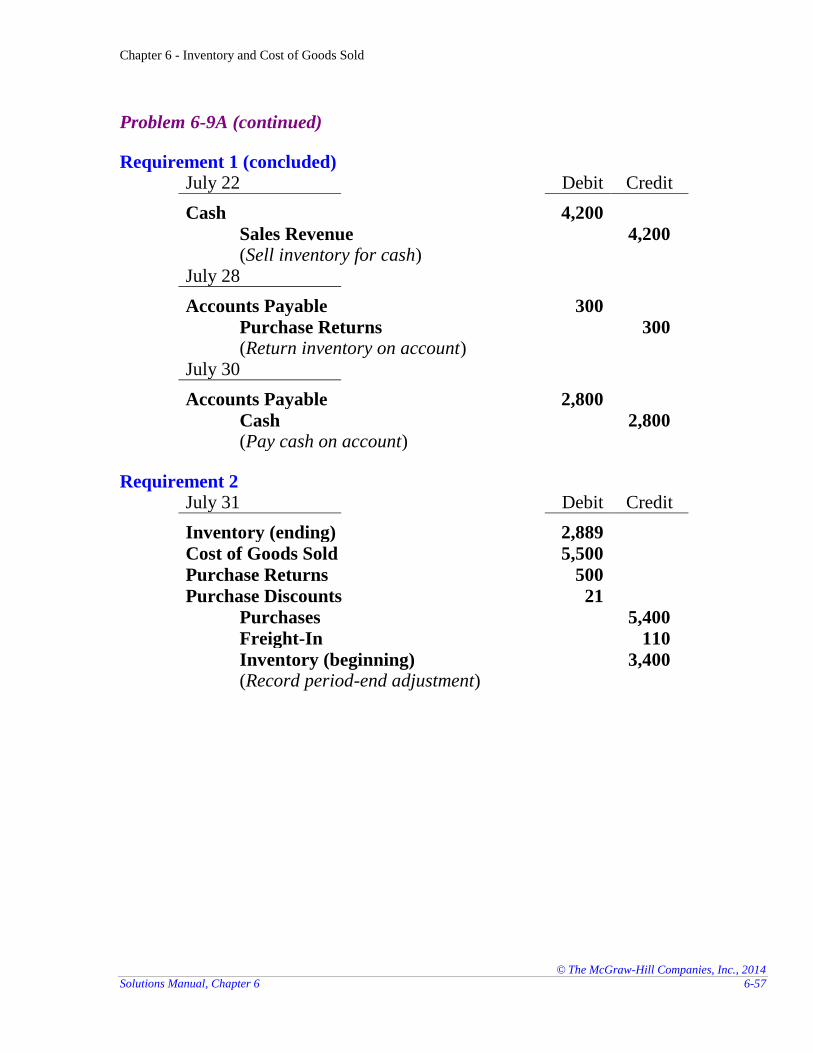
Problem 6-9A (continued)
Requirement 1 (concluded) July 22 Debit Credit
Cash 4,200
Sales Revenue 4,200 (Sell inventory for cash)
July 28
Accounts Payable 300
Purchase Returns 300 (Return inventory on account)
July 30
Accounts Payable 2,800
Cash 2,800 (Pay cash on account)
Requirement 2 July 31 Debit Credit
Inventory (ending) 2,889
Cost of Goods Sold 5,500
Purchase Returns 500
Purchase Discounts 21
Purchases 5,400
Freight-In 110
Inventory (beginning) 3,400 (Record period-end adjustment)
Chapter 6 - Inventory and Cost of Goods Sold
© The McGraw-Hill Companies, Inc., 2014
6-58 Financial Accounting, 3e
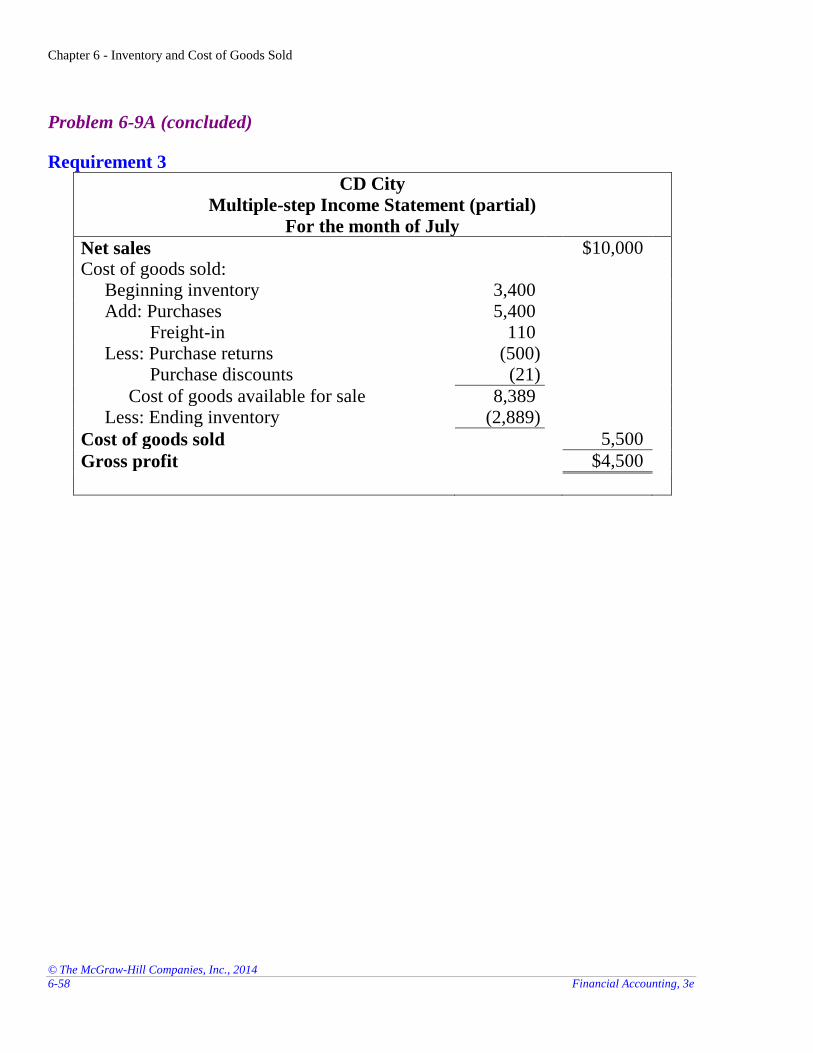
Problem 6-9A (concluded)
Requirement 3
CD City
Multiple-step Income Statement (partial)
For the month of July
Net sales $10,000
Cost of goods sold: Beginning inventory 3,400 Add: Purchases
Freight-in 5,400
110 Less: Purchase returns
Purchase discounts
(500) (21)
Cost of goods available for sale 8,389 Less: Ending inventory (2,889)
Cost of goods sold 5,500
Gross profit $4,500
Chapter 6 - Inventory and Cost of Goods Sold
© The McGraw-Hill Companies, Inc., 2014
Solutions Manual, Chapter 6 6-59
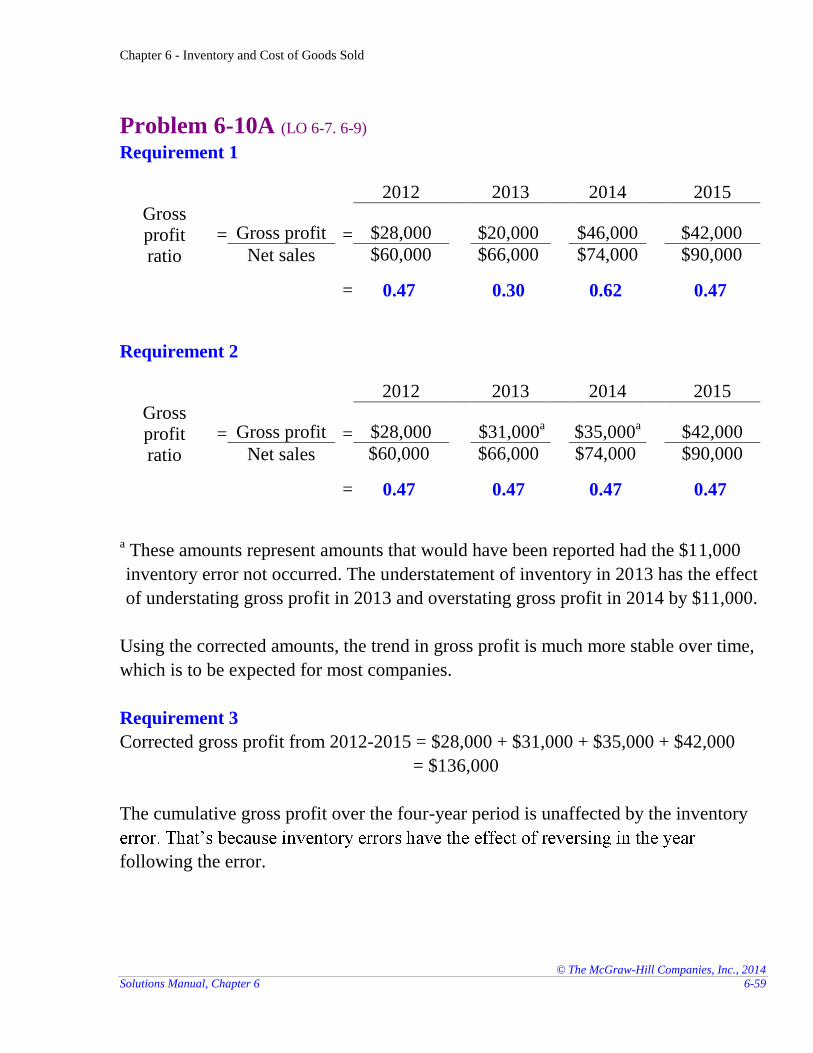
Problem 6-10A (LO 6-7. 6-9) Requirement 1
2012
2013 2014 2015
Gross profit ratio
= Gross profit = $28,000
$20,000
$46,000 $42,000
Net sales $60,000 $66,000 $74,000 $90,000
= 0.47 0.30 0.62 0.47
Requirement 2
2012
2013 2014 2015
Gross profit ratio
= Gross profit = $28,000
$31,000a
$35,000
a $42,000
Net sales $60,000 $66,000 $74,000 $90,000
= 0.47 0.47 0.47 0.47
a These amounts represent amounts that would have been reported had the $11,000
inventory error not occurred. The understatement of inventory in 2013 has the effect
of understating gross profit in 2013 and overstating gross profit in 2014 by $11,000.
Using the corrected amounts, the trend in gross profit is much more stable over time,
which is to be expected for most companies.
Requirement 3
Corrected gross profit from 2012-2015 = $28,000 + $31,000 + $35,000 + $42,000
= $136,000
The cumulative gross profit over the four-year period is unaffected by the inventory
following the error.
Chapter 6 - Inventory and Cost of Goods Sold
© The McGraw-Hill Companies, Inc., 2014
6-60 Financial Accounting, 3e
PROBLEMS: SET B
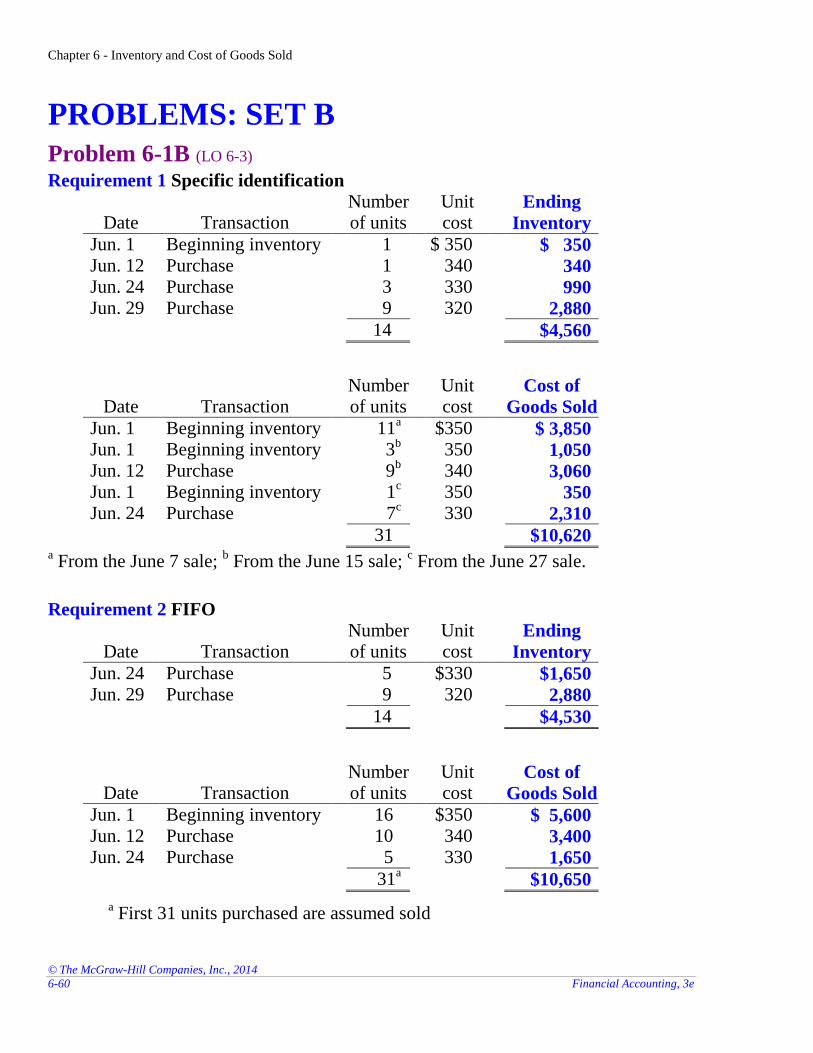
Problem 6-1B (LO 6-3) Requirement 1 Specific identification
Date Transaction Number of units
Unit cost
Ending
Inventory
Jun. 1 Beginning inventory 1 $ 350 $ 350 Jun. 12 Purchase 1 340 340 Jun. 24 Purchase 3 330 990 Jun. 29 Purchase 9 320 2,880
14 $4,560
Date Transaction Number of units
Unit cost
Cost of
Goods Sold
Jun. 1 Beginning inventory 11a $350 $ 3,850
Jun. 1 Beginning inventory 3b 350 1,050
Jun. 12 Purchase 9b 340 3,060
Jun. 1 Beginning inventory 1c 350 350
Jun. 24 Purchase 7c 330 2,310
31 $10,620 a From the June 7 sale;
b From the June 15 sale;
c From the June 27 sale.
Requirement 2 FIFO
Date Transaction Number of units
Unit cost
Ending
Inventory
Jun. 24 Purchase 5 $330 $1,650 Jun. 29 Purchase 9 320 2,880
14 $4,530
Date Transaction Number of units
Unit cost
Cost of
Goods Sold
Jun. 1 Beginning inventory 16 $350 $ 5,600 Jun. 12 Purchase 10 340 3,400 Jun. 24 Purchase 5 330 1,650
31a $10,650
a First 31 units purchased are assumed sold
Chapter 6 - Inventory and Cost of Goods Sold
© The McGraw-Hill Companies, Inc., 2014
Solutions Manual, Chapter 6 6-61
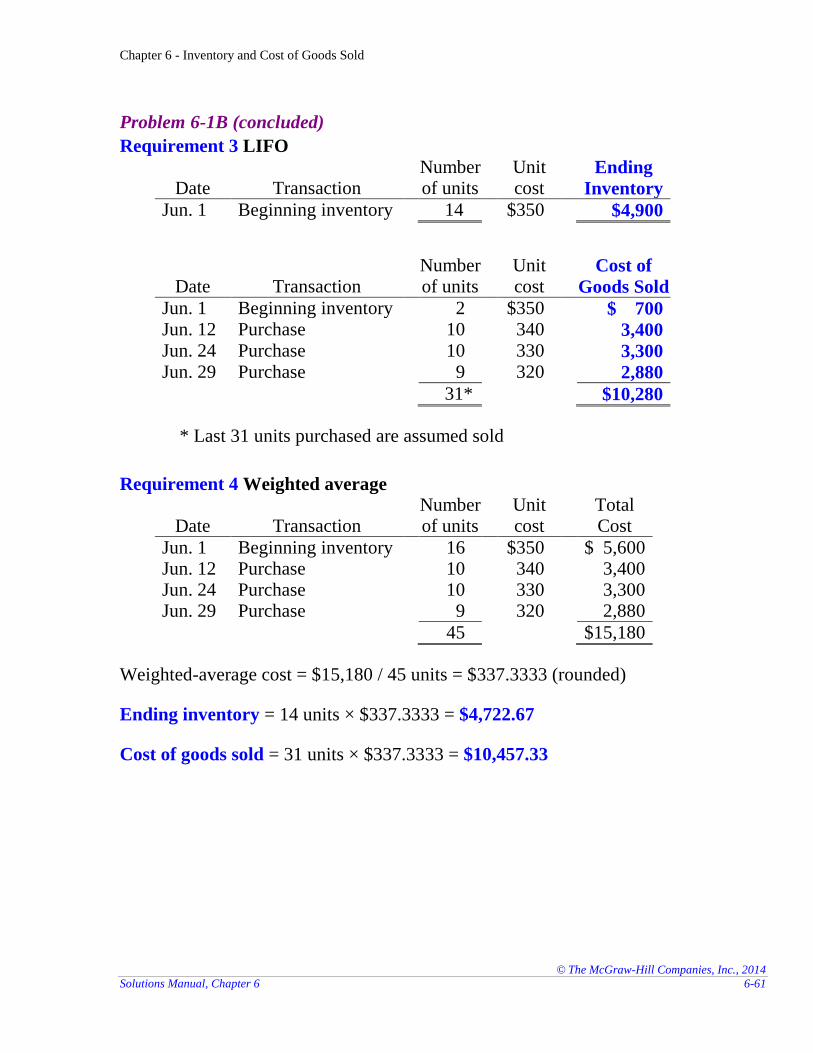
Problem 6-1B (concluded)
Requirement 3 LIFO
Date Transaction Number of units
Unit cost
Ending
Inventory
Jun. 1 Beginning inventory 14 $350 $4,900
Date Transaction Number of units
Unit cost
Cost of
Goods Sold
Jun. 1 Beginning inventory 2 $350 $ 700 Jun. 12 Purchase 10 340 3,400 Jun. 24 Purchase 10 330 3,300 Jun. 29 Purchase 9 320 2,880
31* $10,280
* Last 31 units purchased are assumed sold
Requirement 4 Weighted average
Date Transaction Number of units
Unit cost
Total Cost
Jun. 1 Beginning inventory 16 $350 $ 5,600 Jun. 12 Purchase 10 340 3,400 Jun. 24 Purchase 10 330 3,300 Jun. 29 Purchase 9 320 2,880
45 $15,180
Weighted-average cost = $15,180 / 45 units = $337.3333 (rounded)
Ending inventory = 14 units × $337.3333 = $4,722.67
Cost of goods sold = 31 units × $337.3333 = $10,457.33
Chapter 6 - Inventory and Cost of Goods Sold
© The McGraw-Hill Companies, Inc., 2014
6-62 Financial Accounting, 3e
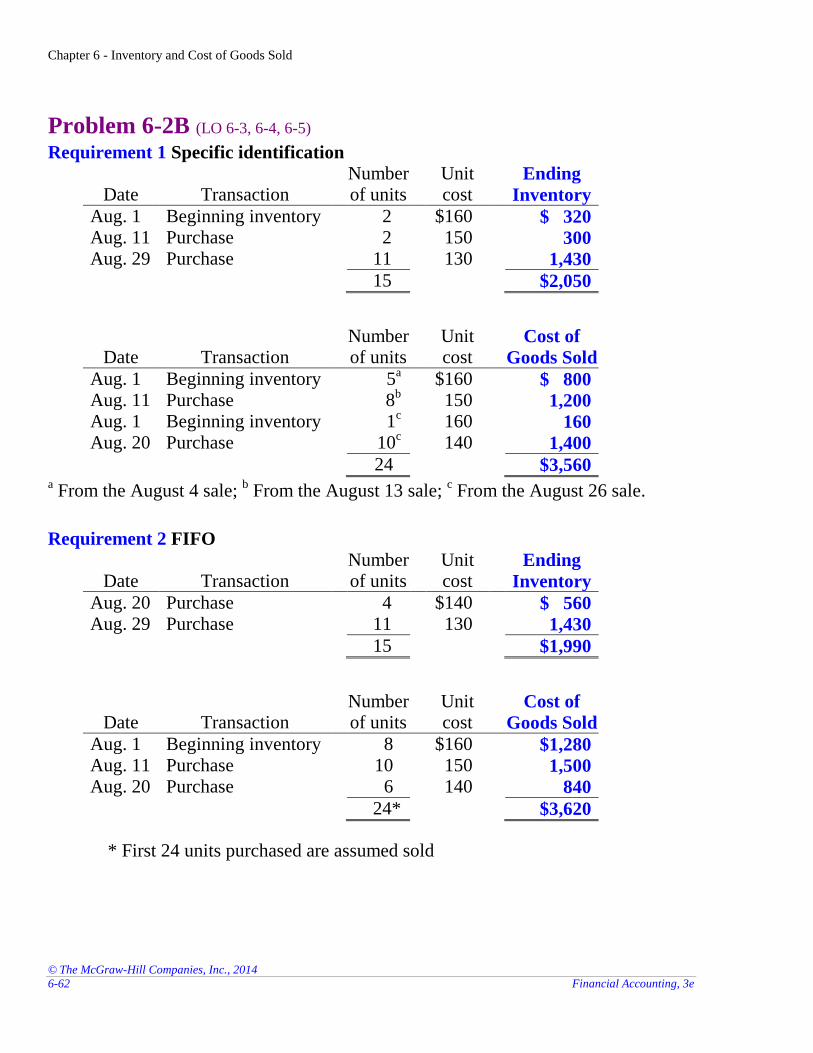
Problem 6-2B (LO 6-3, 6-4, 6-5) Requirement 1 Specific identification
Date Transaction Number of units
Unit cost
Ending
Inventory
Aug. 1 Beginning inventory 2 $160 $ 320 Aug. 11 Purchase 2 150 300 Aug. 29 Purchase 11 130 1,430
15 $2,050
Date Transaction Number of units
Unit cost
Cost of
Goods Sold
Aug. 1 Beginning inventory 5a $160 $ 800
Aug. 11 Purchase 8b 150 1,200
Aug. 1 Beginning inventory 1c 160 160
Aug. 20 Purchase 10c 140 1,400
24 $3,560 a From the August 4 sale;
b From the August 13 sale;
c From the August 26 sale.
Requirement 2 FIFO
Date Transaction Number of units
Unit cost
Ending
Inventory
Aug. 20 Purchase 4 $140 $ 560 Aug. 29 Purchase 11 130 1,430
15 $1,990
Date Transaction Number of units
Unit cost
Cost of
Goods Sold
Aug. 1 Beginning inventory 8 $160 $1,280 Aug. 11 Purchase 10 150 1,500 Aug. 20 Purchase 6 140 840
24* $3,620
* First 24 units purchased are assumed sold
Chapter 6 - Inventory and Cost of Goods Sold
© The McGraw-Hill Companies, Inc., 2014
Solutions Manual, Chapter 6 6-63
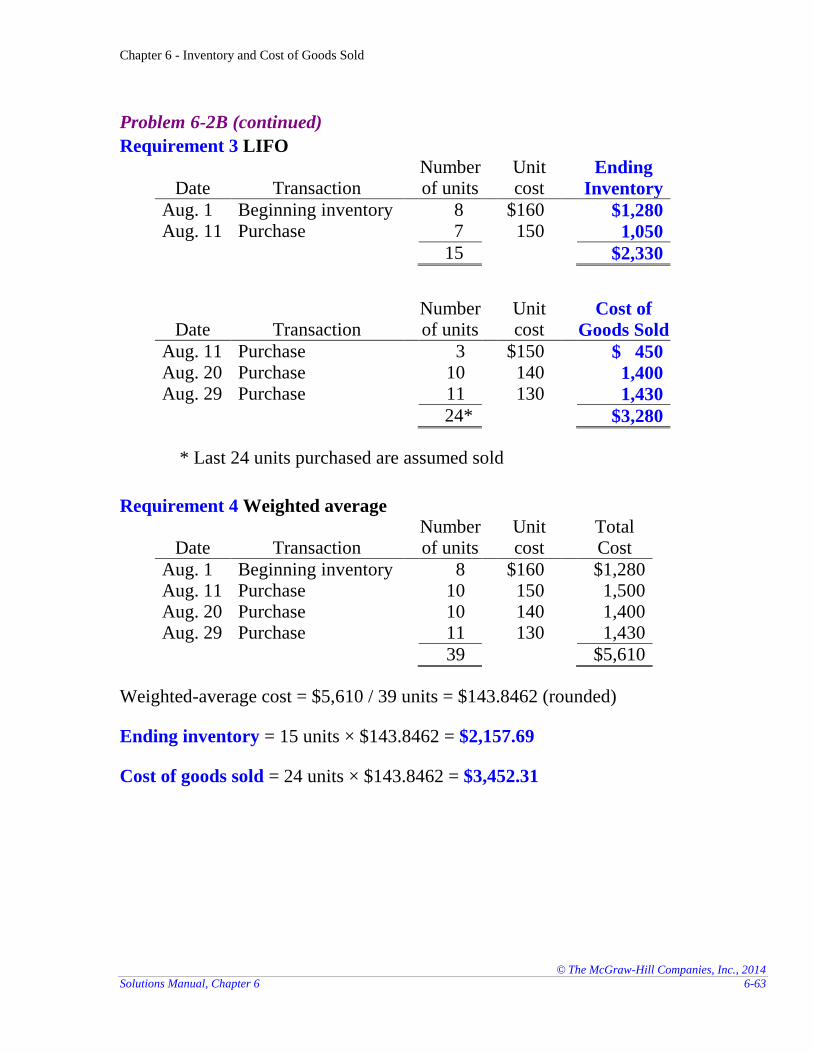
Problem 6-2B (continued)
Requirement 3 LIFO
Date Transaction Number of units
Unit cost
Ending
Inventory
Aug. 1 Beginning inventory 8 $160 $1,280 Aug. 11 Purchase 7 150 1,050
15 $2,330
Date Transaction Number of units
Unit cost
Cost of
Goods Sold
Aug. 11 Purchase 3 $150 $ 450 Aug. 20 Purchase 10 140 1,400 Aug. 29 Purchase 11 130 1,430
24* $3,280
* Last 24 units purchased are assumed sold
Requirement 4 Weighted average
Date Transaction Number of units
Unit cost
Total Cost
Aug. 1 Beginning inventory 8 $160 $1,280 Aug. 11 Purchase 10 150 1,500 Aug. 20 Purchase 10 140 1,400 Aug. 29 Purchase 11 130 1,430
39 $5,610
Weighted-average cost = $5,610 / 39 units = $143.8462 (rounded)
Ending inventory = 15 units × $143.8462 = $2,157.69
Cost of goods sold = 24 units × $143.8462 = $3,452.31
Chapter 6 - Inventory and Cost of Goods Sold
© The McGraw-Hill Companies, Inc., 2014
6-64 Financial Accounting, 3e
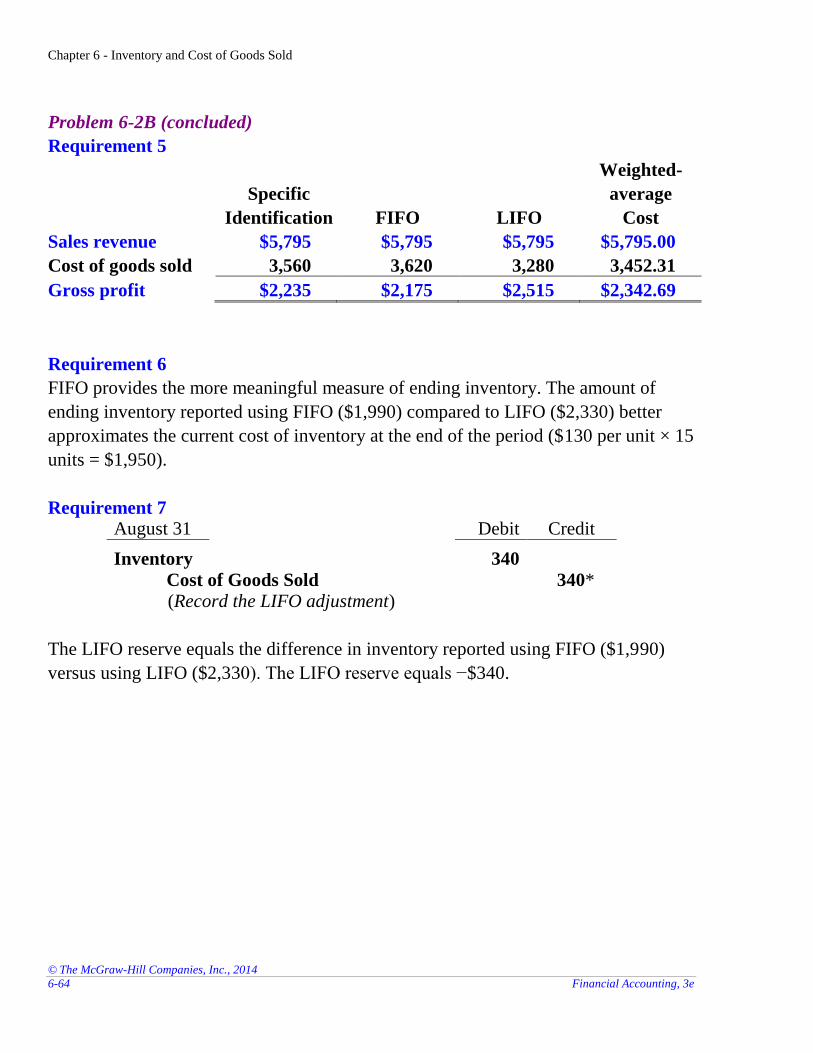
Problem 6-2B (concluded)
Requirement 5
Specific
Identification FIFO LIFO
Weighted-
average
Cost
Sales revenue $5,795 $5,795 $5,795 $5,795.00
Cost of goods sold 3,560 3,620 3,280 3,452.31
Gross profit $2,235 $2,175 $2,515 $2,342.69
Requirement 6
FIFO provides the more meaningful measure of ending inventory. The amount of
ending inventory reported using FIFO ($1,990) compared to LIFO ($2,330) better
approximates the current cost of inventory at the end of the period ($130 per unit × 15
units = $1,950).
Requirement 7 August 31 Debit Credit
Inventory 340
Cost of Goods Sold 340* (Record the LIFO adjustment)
The LIFO reserve equals the difference in inventory reported using FIFO ($1,990)
versus using LIFO ($2,330). The LIFO reserve equals −$340.

Chapter 6 - Inventory and Cost of Goods Sold
© The McGraw-Hill Companies, Inc., 2014
Solutions Manual, Chapter 6 6-65
Problem 6-3B (LO 6-2, 6-5)
Requirement 1 June 2 Debit Credit
Inventory 2,700
Accounts Payable 2,700 (Purchase inventory on account)
June 4
Inventory 400
Cash 400 (Pay freight-in)
June 8
Accounts Payable 400
Inventory 400 (Return inventory on account)
June 10
Accounts Payable 2,300
Inventory 23
Cash 2,277 (Pay on account less 1% discount) ($23 = $2,300 × 1%)
June 11
Accounts Receivable 5,000
Sales Revenue 5,000 (Sell inventory on account)
Cost of Goods Sold 3,200
Inventory 3,200 (Record cost of inventory sold)
June 18
Cash 4,000
Accounts Receivable 4,000 (Receive cash on account)
Chapter 6 - Inventory and Cost of Goods Sold
© The McGraw-Hill Companies, Inc., 2014
6-66 Financial Accounting, 3e
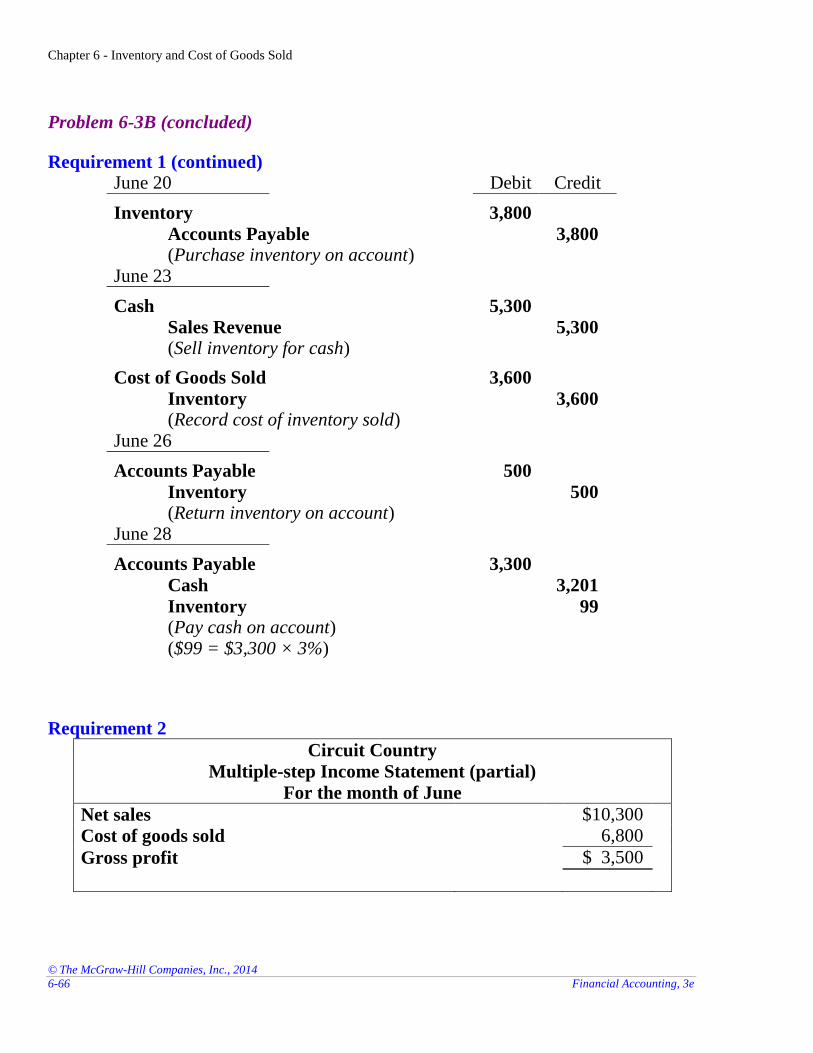
Problem 6-3B (concluded)
Requirement 1 (continued) June 20 Debit Credit
Inventory 3,800
Accounts Payable 3,800 (Purchase inventory on account)
June 23
Cash 5,300
Sales Revenue 5,300 (Sell inventory for cash)
Cost of Goods Sold 3,600
Inventory 3,600 (Record cost of inventory sold)
June 26
Accounts Payable 500
Inventory 500 (Return inventory on account)
June 28
Accounts Payable 3,300
Cash 3,201
Inventory 99 (Pay cash on account) ($99 = $3,300 × 3%)
Requirement 2
Circuit Country
Multiple-step Income Statement (partial)
For the month of June
Net sales $10,300
Cost of goods sold 6,800
Gross profit $ 3,500
Chapter 6 - Inventory and Cost of Goods Sold
© The McGraw-Hill Companies, Inc., 2014
Solutions Manual, Chapter 6 6-67
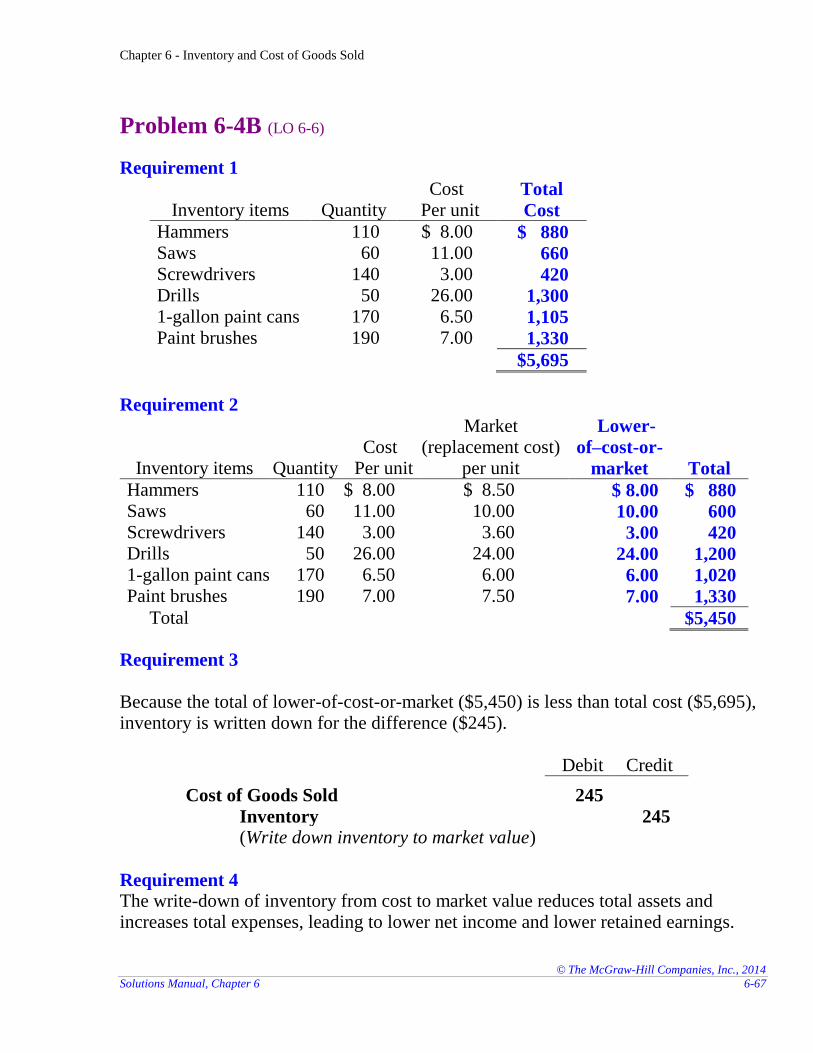
Problem 6-4B (LO 6-6)
Requirement 1
Inventory items Quantity Cost
Per unit Total
Cost
Hammers 110 $ 8.00 $ 880 Saws 60 11.00 660 Screwdrivers 140 3.00 420 Drills 50 26.00 1,300 1-gallon paint cans 170 6.50 1,105 Paint brushes 190 7.00 1,330
$5,695
Requirement 2
Inventory items Quantity Cost
Per unit
Market (replacement cost)
per unit
Lower-
of–cost-or-
market Total
Hammers 110 $ 8.00 $ 8.50 $ 8.00 $ 880 Saws 60 11.00 10.00 10.00 600 Screwdrivers 140 3.00 3.60 3.00 420 Drills 50 26.00 24.00 24.00 1,200 1-gallon paint cans 170 6.50 6.00 6.00 1,020 Paint brushes 190 7.00 7.50 7.00 1,330
Total $5,450
Requirement 3
Because the total of lower-of-cost-or-market ($5,450) is less than total cost ($5,695), inventory is written down for the difference ($245).
Debit Credit
Cost of Goods Sold 245
Inventory 245 (Write down inventory to market value)
Requirement 4 The write-down of inventory from cost to market value reduces total assets and increases total expenses, leading to lower net income and lower retained earnings.
Chapter 6 - Inventory and Cost of Goods Sold
© The McGraw-Hill Companies, Inc., 2014
6-68 Financial Accounting, 3e
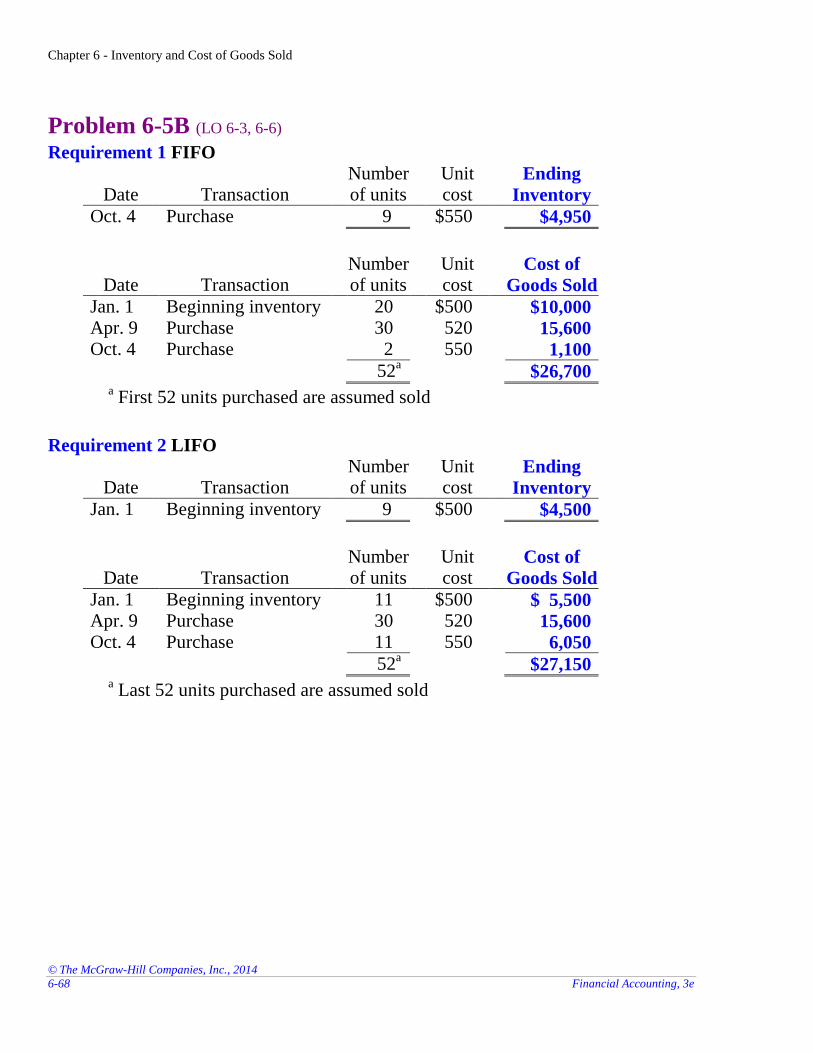
Problem 6-5B (LO 6-3, 6-6) Requirement 1 FIFO
Date Transaction Number of units
Unit cost
Ending
Inventory
Oct. 4 Purchase 9 $550 $4,950
Date Transaction Number of units
Unit cost
Cost of
Goods Sold
Jan. 1 Beginning inventory 20 $500 $10,000 Apr. 9 Purchase 30 520 15,600 Oct. 4 Purchase 2 550 1,100
52a $26,700
a First 52 units purchased are assumed sold
Requirement 2 LIFO
Date Transaction Number of units
Unit cost
Ending
Inventory
Jan. 1 Beginning inventory 9 $500 $4,500
Date Transaction Number of units
Unit cost
Cost of
Goods Sold
Jan. 1 Beginning inventory 11 $500 $ 5,500 Apr. 9 Purchase 30 520 15,600 Oct. 4 Purchase 11 550 6,050
52a $27,150
a Last 52 units purchased are assumed sold
Chapter 6 - Inventory and Cost of Goods Sold
© The McGraw-Hill Companies, Inc., 2014
Solutions Manual, Chapter 6 6-69
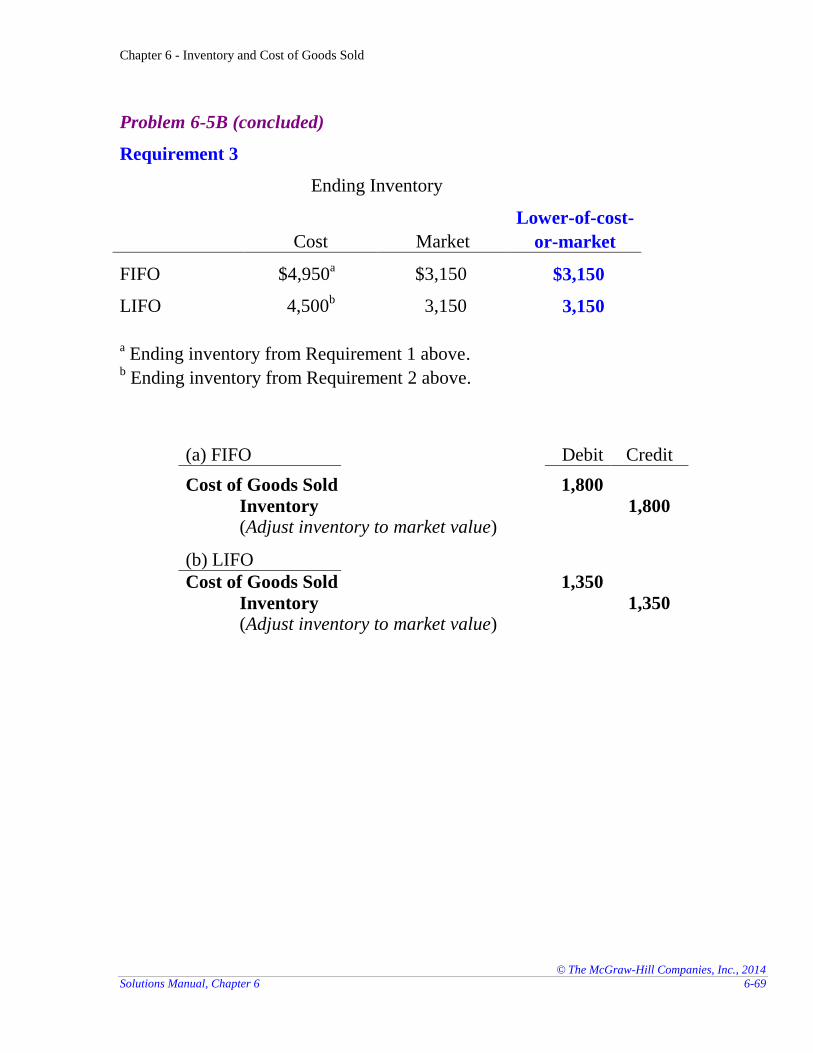
Problem 6-5B (concluded)
Requirement 3
Ending Inventory
Cost Market
Lower-of-cost-
or-market
FIFO $4,950a $3,150 $3,150
LIFO 4,500b 3,150 3,150
a Ending inventory from Requirement 1 above.
b Ending inventory from Requirement 2 above.
(a) FIFO Debit Credit
Cost of Goods Sold 1,800
Inventory 1,800 (Adjust inventory to market value)
(b) LIFO
Cost of Goods Sold 1,350
Inventory 1,350 (Adjust inventory to market value)

Chapter 6 - Inventory and Cost of Goods Sold
© The McGraw-Hill Companies, Inc., 2014
6-70 Financial Accounting, 3e
Problem 6-6B (LO 6-2, 6-3, 6-4, 6-5, 6-6)
Requirement 1 November 2 Debit Credit
Inventory 9,000
Accounts Payable 9,000 (Purchase inventory on account)
November 3
Inventory 231
Cash 231 (Pay freight-in)
November 9
Accounts Payable 1,300
Inventory 1,300 (Return inventory on account)
November 11
Accounts Payable 7,700
Inventory 231
Cash 7,469 (Pay on account less 3% discount) ($231 = $7,700 × 3%)
November 16
Accounts Receivable 14,000
Sales Revenue 14,000 (Sell inventory on account)
Cost of Goods Sold 9,640
Inventory 9,640 (Cost of inventory sold) ($9,640 = ($94 × 60 units) + ($100 × 40 units))
November 20
Cash 14,000
Accounts Receivable 14,000 (Receive cash on account)
Chapter 6 - Inventory and Cost of Goods Sold
© The McGraw-Hill Companies, Inc., 2014
Solutions Manual, Chapter 6 6-71
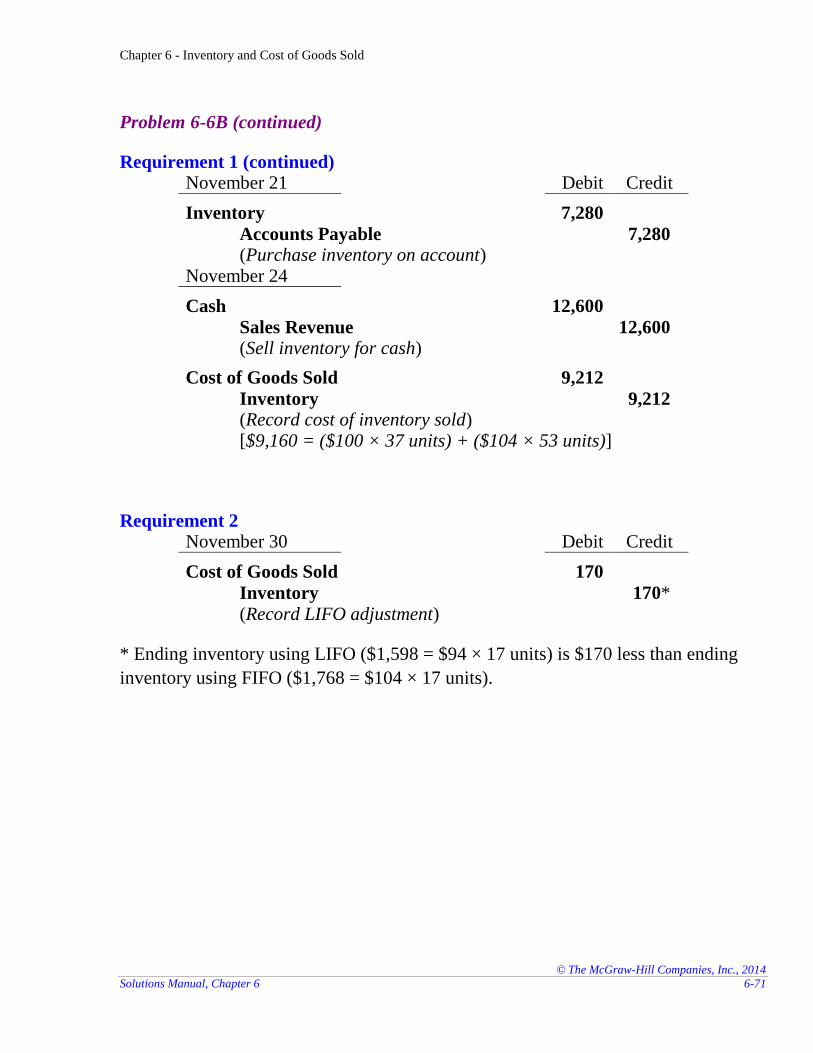
Problem 6-6B (continued)
Requirement 1 (continued) November 21 Debit Credit
Inventory 7,280
Accounts Payable 7,280 (Purchase inventory on account)
November 24
Cash 12,600
Sales Revenue 12,600 (Sell inventory for cash)
Cost of Goods Sold 9,212
Inventory 9,212 (Record cost of inventory sold) [$9,160 = ($100 × 37 units) + ($104 × 53 units)]
Requirement 2 November 30 Debit Credit
Cost of Goods Sold 170
Inventory 170* (Record LIFO adjustment)
* Ending inventory using LIFO ($1,598 = $94 × 17 units) is $170 less than ending
inventory using FIFO ($1,768 = $104 × 17 units).
Chapter 6 - Inventory and Cost of Goods Sold
© The McGraw-Hill Companies, Inc., 2014
6-72 Financial Accounting, 3e
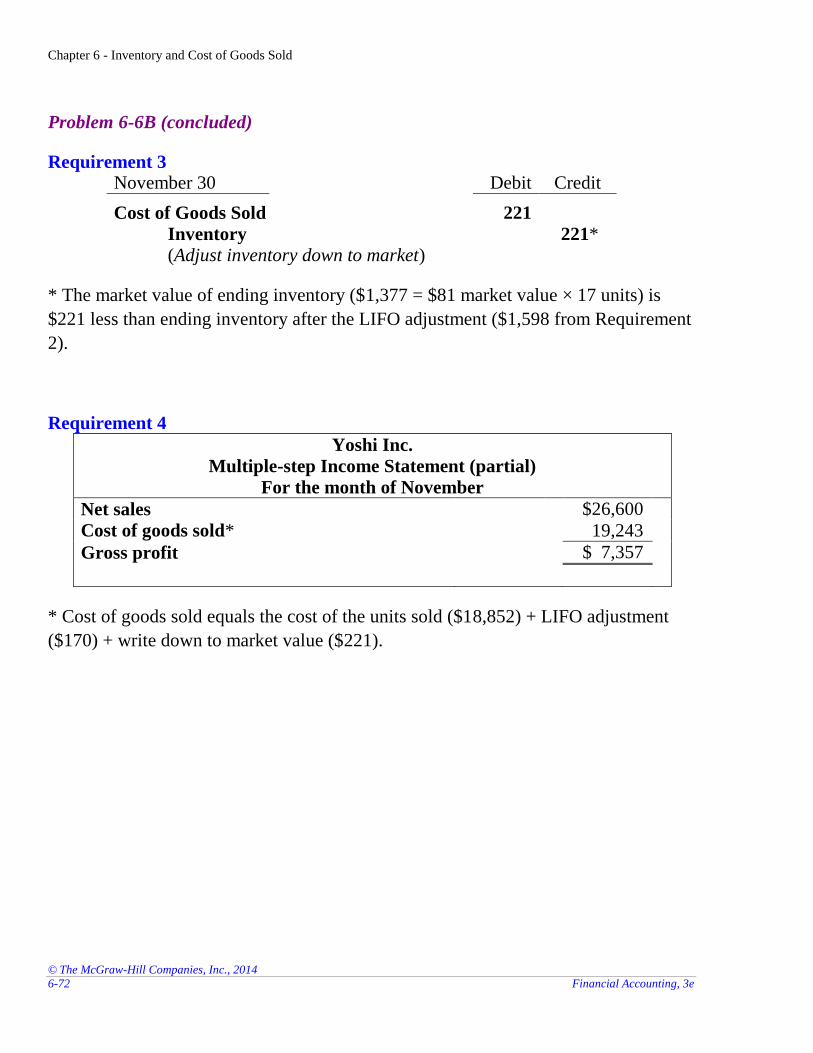
Problem 6-6B (concluded)
Requirement 3 November 30 Debit Credit
Cost of Goods Sold 221
Inventory 221* (Adjust inventory down to market)
* The market value of ending inventory ($1,377 = $81 market value × 17 units) is
$221 less than ending inventory after the LIFO adjustment ($1,598 from Requirement
2).
Requirement 4
Yoshi Inc.
Multiple-step Income Statement (partial)
For the month of November
Net sales $26,600
Cost of goods sold* 19,243
Gross profit $ 7,357
* Cost of goods sold equals the cost of the units sold ($18,852) + LIFO adjustment
($170) + write down to market value ($221).
Chapter 6 - Inventory and Cost of Goods Sold
© The McGraw-Hill Companies, Inc., 2014
Solutions Manual, Chapter 6 6-73
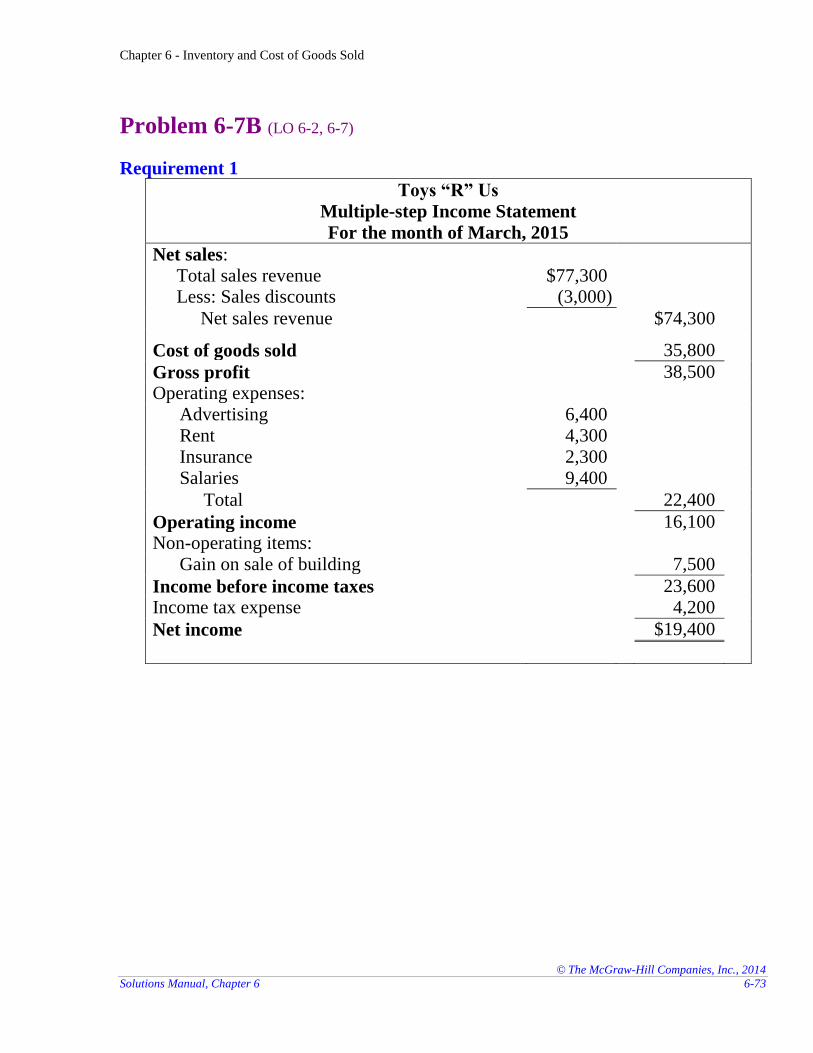
Problem 6-7B (LO 6-2, 6-7)
Requirement 1
Toys “R” Us
Multiple-step Income Statement
For the month of March, 2015
Net sales:
Total sales revenue $77,300 Less: Sales discounts (3,000)
Net sales revenue $74,300
Cost of goods sold 35,800
Gross profit 38,500
Operating expenses:
Advertising 6,400
Rent 4,300
Insurance 2,300
Salaries 9,400
Total 22,400
Operating income 16,100
Non-operating items:
Gain on sale of building 7,500
Income before income taxes 23,600
Income tax expense 4,200
Net income $19,400
Chapter 6 - Inventory and Cost of Goods Sold
© The McGraw-Hill Companies, Inc., 2014
6-74 Financial Accounting, 3e
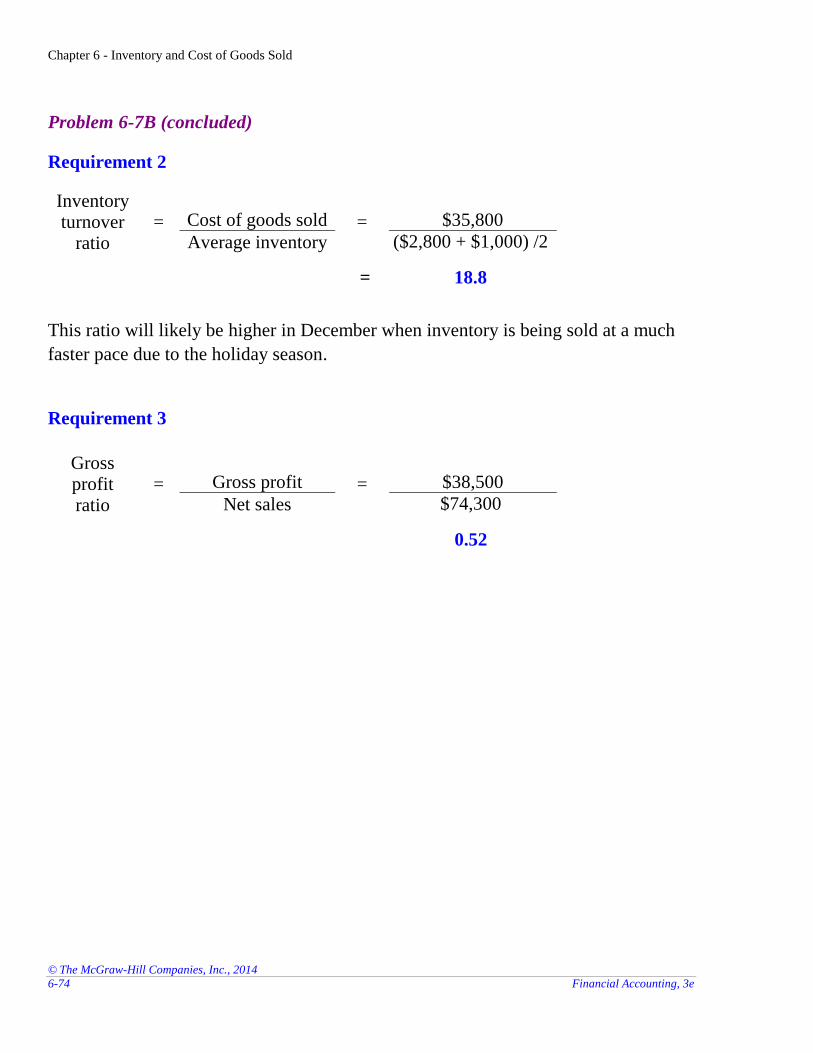
Problem 6-7B (concluded)
Requirement 2
Inventory turnover
ratio = Cost of goods sold = $35,800
Average inventory ($2,800 + $1,000) /2
= 18.8
This ratio will likely be higher in December when inventory is being sold at a much
faster pace due to the holiday season.
Requirement 3
Gross profit ratio
= Gross profit = $38,500
Net sales $74,300
0.52
Chapter 6 - Inventory and Cost of Goods Sold
© The McGraw-Hill Companies, Inc., 2014
Solutions Manual, Chapter 6 6-75
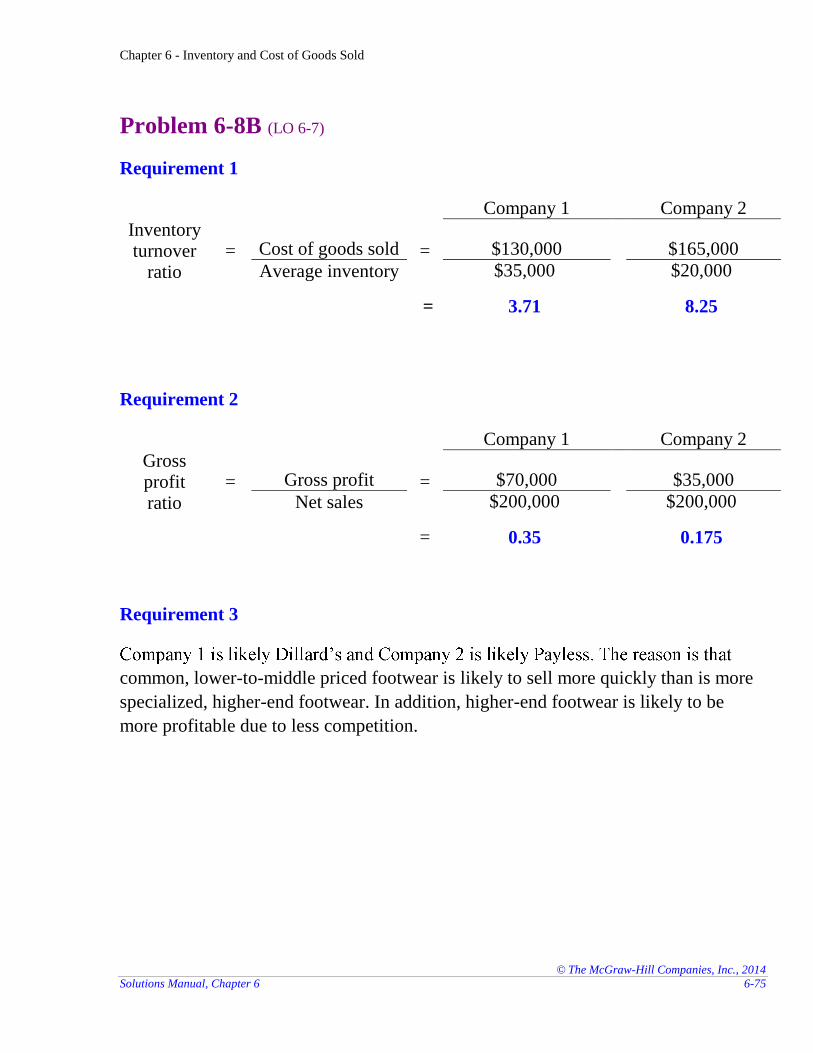
Problem 6-8B (LO 6-7)
Requirement 1
Company 1
Company 2
Inventory turnover
ratio = Cost of goods sold = $130,000
$165,000
Average inventory $35,000 $20,000
= 3.71
8.25
Requirement 2
Company 1
Company 2
Gross profit ratio
= Gross profit = $70,000
$35,000
Net sales $200,000 $200,000
= 0.35 0.175
Requirement 3
common, lower-to-middle priced footwear is likely to sell more quickly than is more
specialized, higher-end footwear. In addition, higher-end footwear is likely to be
more profitable due to less competition.
Chapter 6 - Inventory and Cost of Goods Sold
© The McGraw-Hill Companies, Inc., 2014
6-76 Financial Accounting, 3e
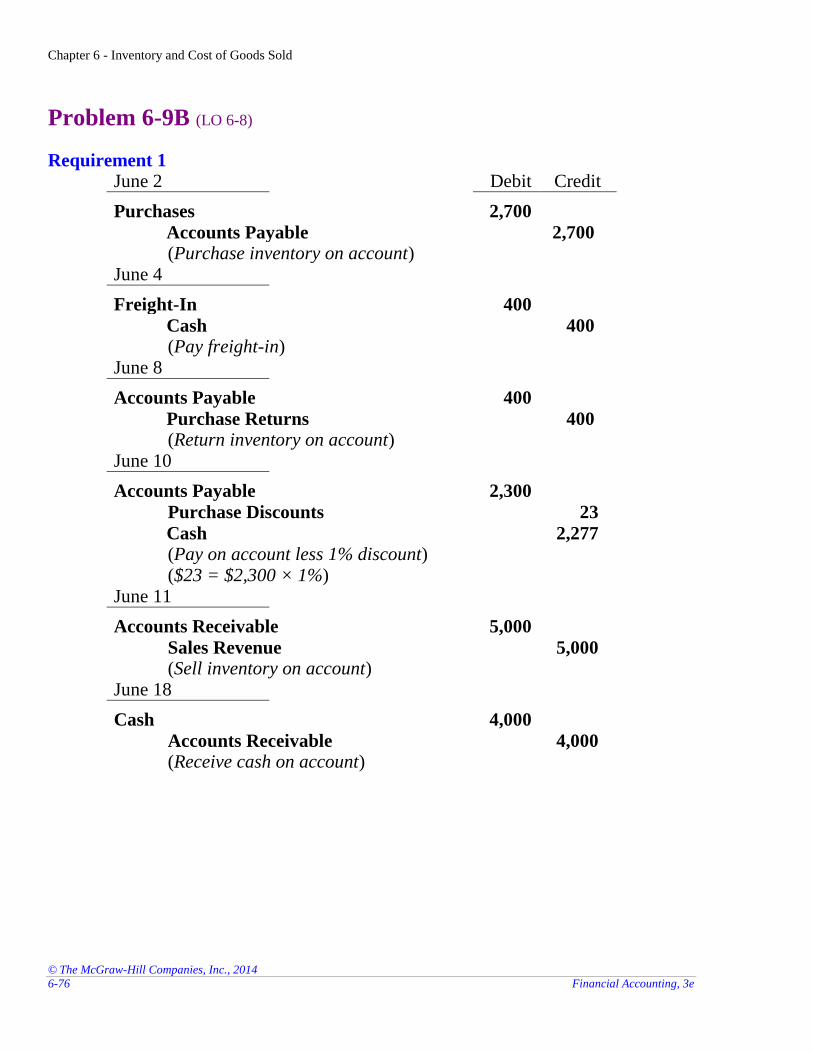
Problem 6-9B (LO 6-8)
Requirement 1 June 2 Debit Credit
Purchases 2,700
Accounts Payable 2,700 (Purchase inventory on account)
June 4
Freight-In 400
Cash 400 (Pay freight-in)
June 8
Accounts Payable 400
Purchase Returns 400 (Return inventory on account)
June 10
Accounts Payable 2,300
Purchase Discounts 23
Cash 2,277 (Pay on account less 1% discount) ($23 = $2,300 × 1%)
June 11
Accounts Receivable 5,000
Sales Revenue 5,000 (Sell inventory on account)
June 18
Cash 4,000
Accounts Receivable 4,000 (Receive cash on account)
Chapter 6 - Inventory and Cost of Goods Sold
© The McGraw-Hill Companies, Inc., 2014
Solutions Manual, Chapter 6 6-77
Problem 6-9B (concluded)
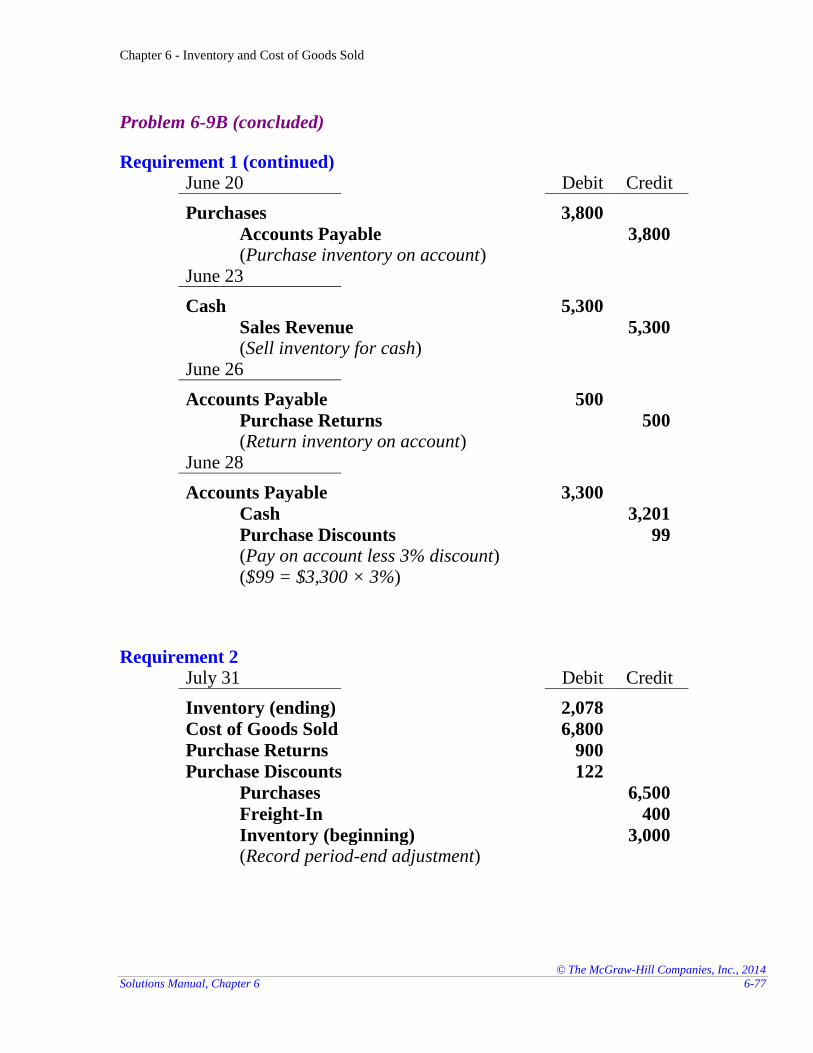
Requirement 1 (continued) June 20 Debit Credit
Purchases 3,800
Accounts Payable 3,800 (Purchase inventory on account)
June 23
Cash 5,300
Sales Revenue 5,300 (Sell inventory for cash)
June 26
Accounts Payable 500
Purchase Returns 500 (Return inventory on account)
June 28
Accounts Payable 3,300
Cash 3,201
Purchase Discounts 99 (Pay on account less 3% discount) ($99 = $3,300 × 3%)
Requirement 2 July 31 Debit Credit
Inventory (ending) 2,078
Cost of Goods Sold 6,800
Purchase Returns 900
Purchase Discounts 122
Purchases 6,500
Freight-In 400
Inventory (beginning) 3,000 (Record period-end adjustment)
Chapter 6 - Inventory and Cost of Goods Sold
© The McGraw-Hill Companies, Inc., 2014
6-78 Financial Accounting, 3e
Problem 6-9B (concluded)
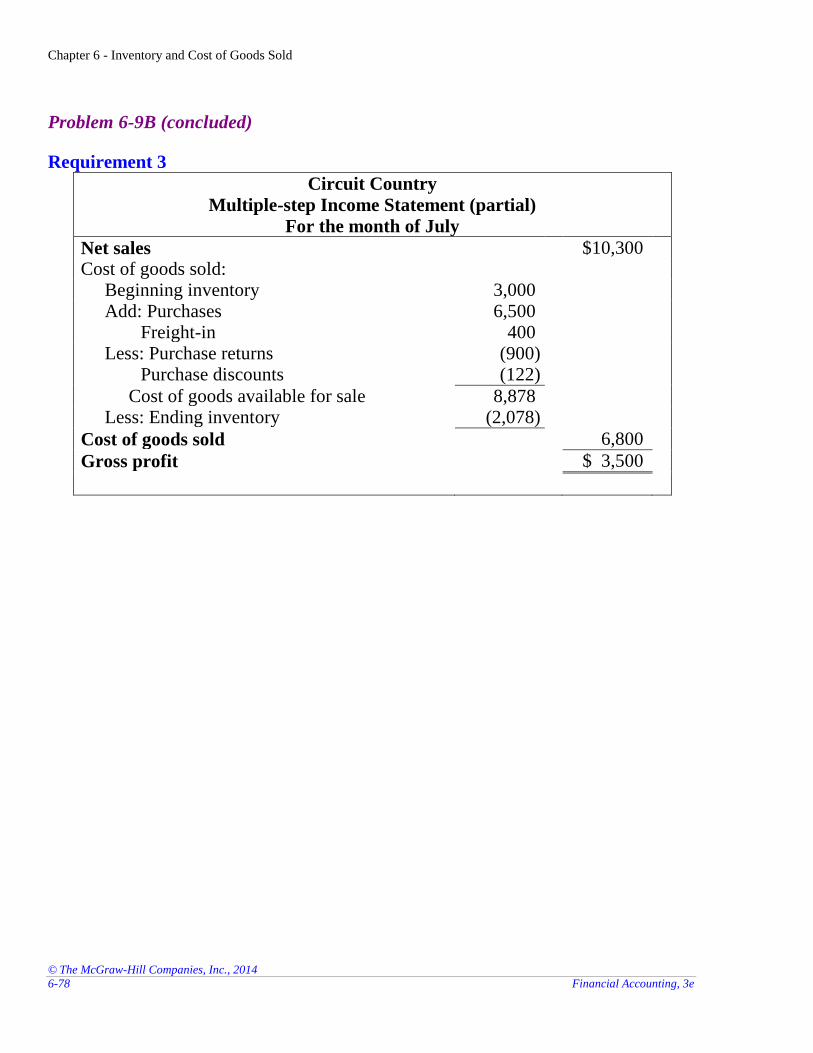
Requirement 3
Circuit Country
Multiple-step Income Statement (partial)
For the month of July
Net sales $10,300
Cost of goods sold: Beginning inventory 3,000 Add: Purchases
Freight-in 6,500
400 Less: Purchase returns
Purchase discounts
(900) (122)
Cost of goods available for sale 8,878 Less: Ending inventory (2,078)
Cost of goods sold 6,800
Gross profit $ 3,500
Chapter 6 - Inventory and Cost of Goods Sold
© The McGraw-Hill Companies, Inc., 2014
Solutions Manual, Chapter 6 6-79
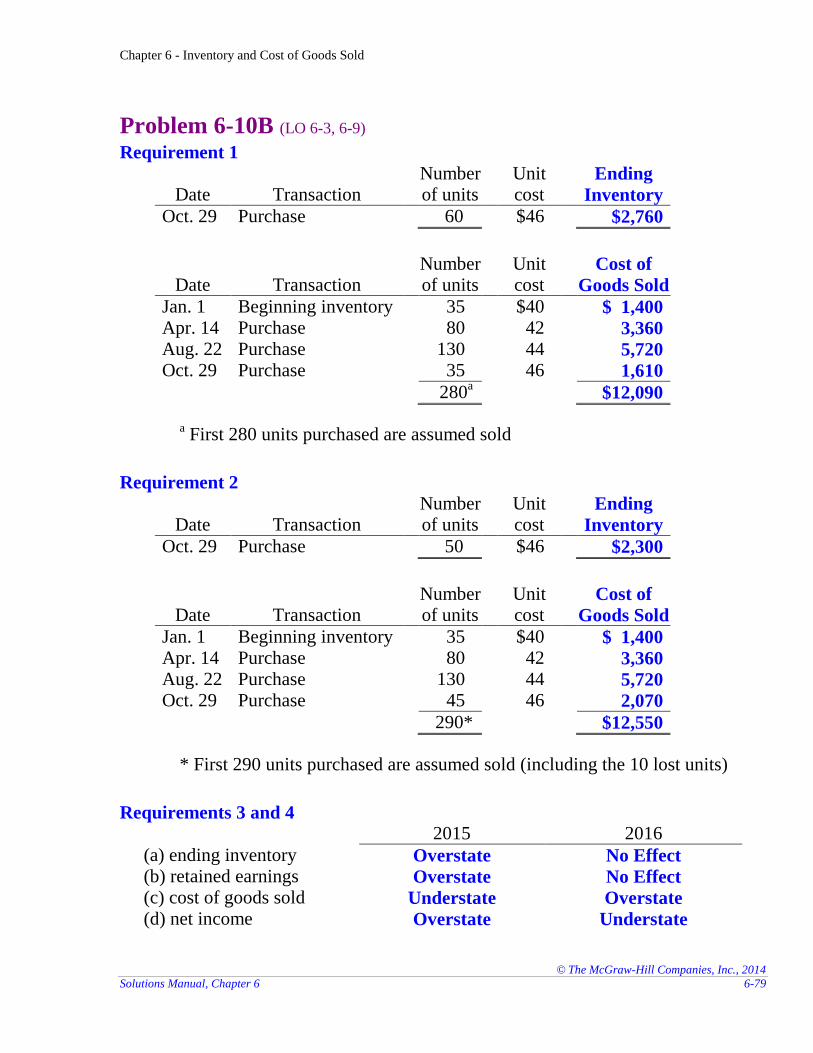
Problem 6-10B (LO 6-3, 6-9) Requirement 1
Date Transaction Number of units
Unit cost
Ending
Inventory
Oct. 29 Purchase 60 $46 $2,760
Date Transaction Number of units
Unit cost
Cost of
Goods Sold
Jan. 1 Beginning inventory 35 $40 $ 1,400 Apr. 14 Purchase 80 42 3,360 Aug. 22 Purchase 130 44 5,720 Oct. 29 Purchase 35 46 1,610
280a $12,090
a First 280 units purchased are assumed sold
Requirement 2
Date Transaction Number of units
Unit cost
Ending
Inventory
Oct. 29 Purchase 50 $46 $2,300
Date Transaction Number of units
Unit cost
Cost of
Goods Sold
Jan. 1 Beginning inventory 35 $40 $ 1,400 Apr. 14 Purchase 80 42 3,360 Aug. 22 Purchase 130 44 5,720 Oct. 29 Purchase 45 46 2,070
290* $12,550
* First 290 units purchased are assumed sold (including the 10 lost units)
Requirements 3 and 4 2015 2016
(a) ending inventory Overstate No Effect (b) retained earnings Overstate No Effect (c) cost of goods sold Understate Overstate (d) net income Overstate Understate
Chapter 6 - Inventory and Cost of Goods Sold
© The McGraw-Hill Companies, Inc., 2014
6-80 Financial Accounting, 3e
ADDITIONAL PERSPECTIVES
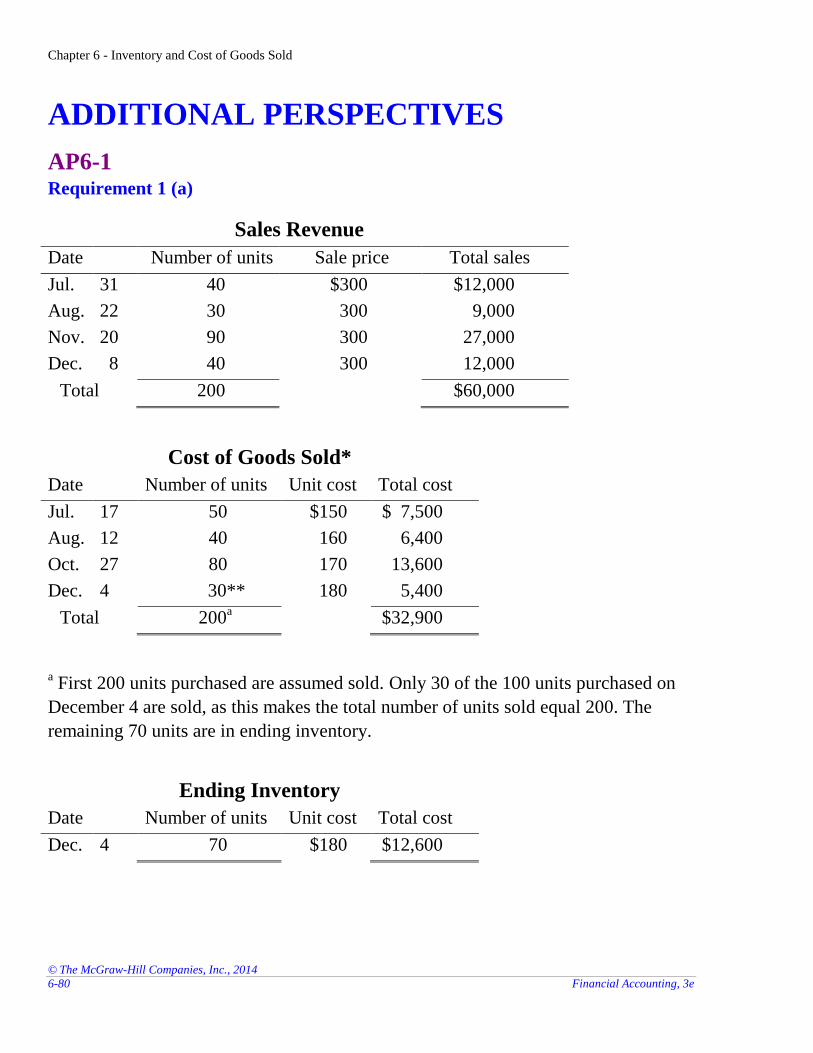
AP6-1
Requirement 1 (a)
Sales Revenue
Date Number of units Sale price Total sales
Jul. 31 40 $300 $12,000
Aug. 22 30 300 9,000
Nov. 20 90 300 27,000
Dec. 8 40 300 12,000
Total 200 $60,000
Cost of Goods Sold*
Date Number of units Unit cost Total cost
Jul. 17 50 $150 $ 7,500
Aug. 12 40 160 6,400
Oct. 27 80 170 13,600
Dec. 4 30** 180 5,400
Total 200a $32,900
a First 200 units purchased are assumed sold. Only 30 of the 100 units purchased on
December 4 are sold, as this makes the total number of units sold equal 200. The
remaining 70 units are in ending inventory.
Ending Inventory
Date Number of units Unit cost Total cost
Dec. 4 70 $180 $12,600
Chapter 6 - Inventory and Cost of Goods Sold
© The McGraw-Hill Companies, Inc., 2014
Solutions Manual, Chapter 6 6-81
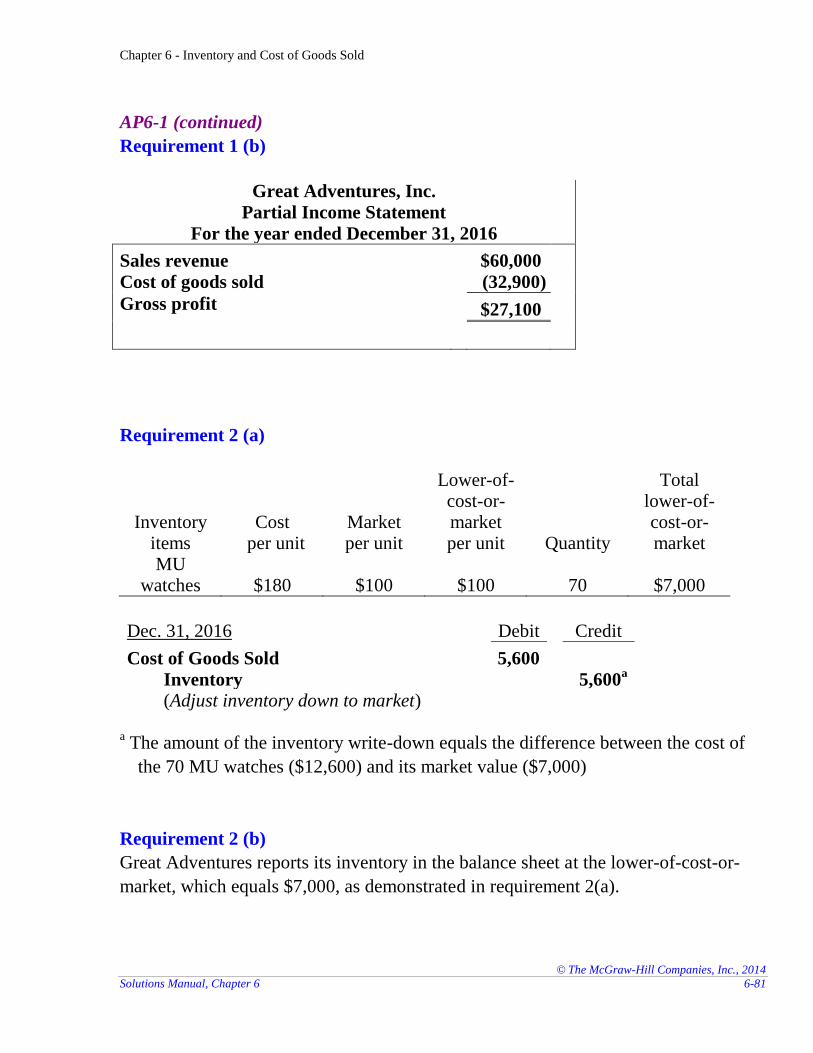
AP6-1 (continued)
Requirement 1 (b)
Great Adventures, Inc.
Partial Income Statement
For the year ended December 31, 2016
Sales revenue $60,000
Cost of goods sold (32,900)
Gross profit $27,100
Requirement 2 (a)
Inventory items
Cost per unit
Market per unit
Lower-of-cost-or-market per unit Quantity
Total lower-of-cost-or-market
MU watches $180 $100 $100 70 $7,000
Dec. 31, 2016 Debit Credit
Cost of Goods Sold 5,600
Inventory 5,600a
(Adjust inventory down to market) a The amount of the inventory write-down equals the difference between the cost of
the 70 MU watches ($12,600) and its market value ($7,000)
Requirement 2 (b)
Great Adventures reports its inventory in the balance sheet at the lower-of-cost-or-
market, which equals $7,000, as demonstrated in requirement 2(a).
Chapter 6 - Inventory and Cost of Goods Sold
© The McGraw-Hill Companies, Inc., 2014
6-82 Financial Accounting, 3e
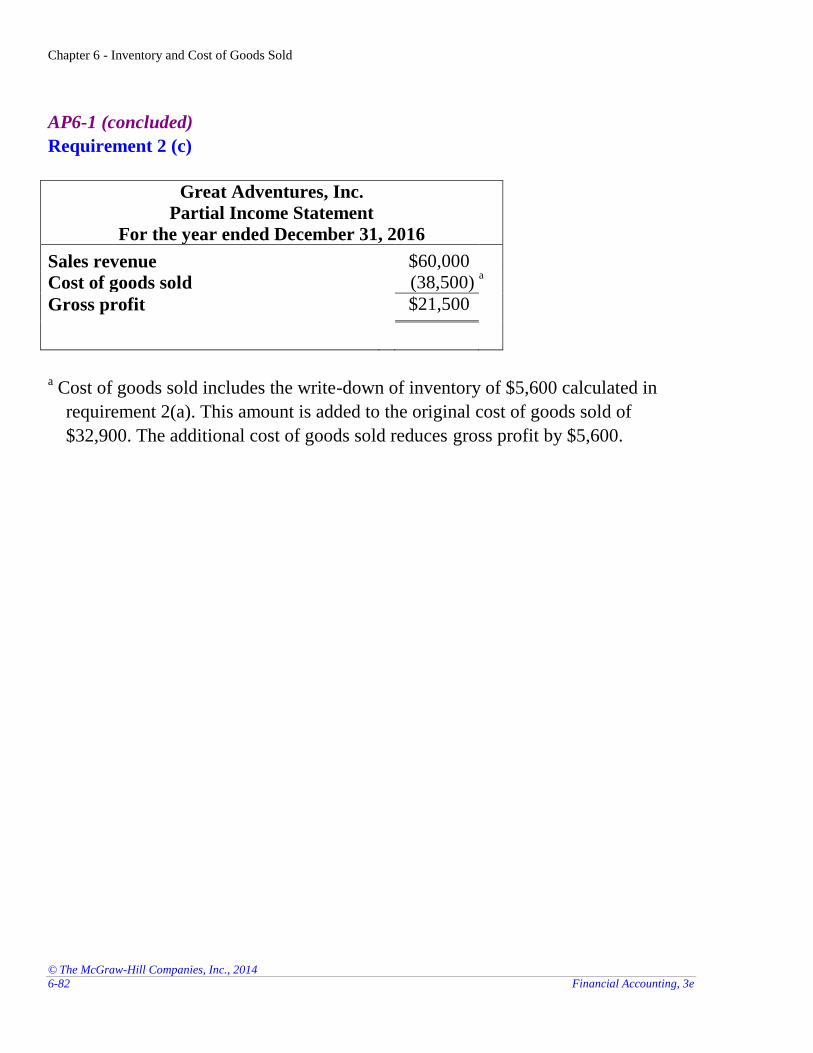
AP6-1 (concluded)
Requirement 2 (c)
Great Adventures, Inc.
Partial Income Statement
For the year ended December 31, 2016
Sales revenue $60,000
Cost of goods sold (38,500) a
Gross profit $21,500
a Cost of goods sold includes the write-down of inventory of $5,600 calculated in
requirement 2(a). This amount is added to the original cost of goods sold of
$32,900. The additional cost of goods sold reduces gross profit by $5,600.
Chapter 6 - Inventory and Cost of Goods Sold
© The McGraw-Hill Companies, Inc., 2014
Solutions Manual, Chapter 6 6-83
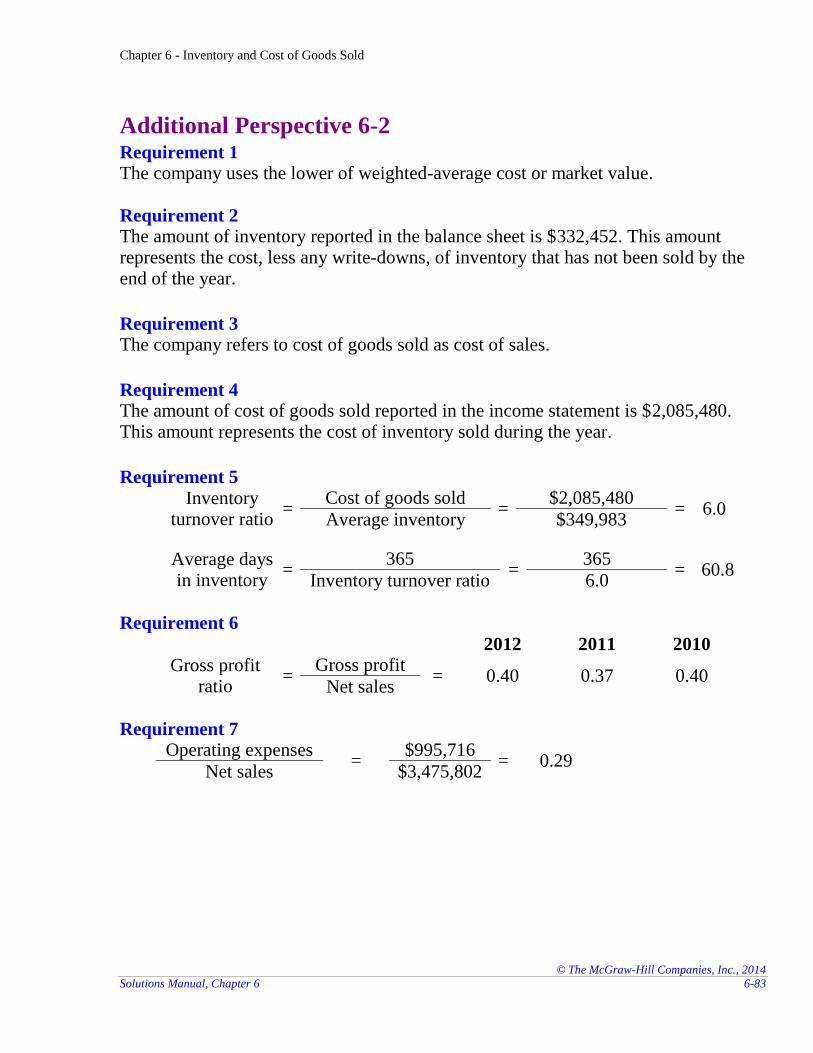
Additional Perspective 6-2
Requirement 1 The company uses the lower of weighted-average cost or market value.
Requirement 2 The amount of inventory reported in the balance sheet is $332,452. This amount represents the cost, less any write-downs, of inventory that has not been sold by the end of the year.
Requirement 3 The company refers to cost of goods sold as cost of sales.
Requirement 4 The amount of cost of goods sold reported in the income statement is $2,085,480. This amount represents the cost of inventory sold during the year.
Requirement 5
Inventory turnover ratio
= Cost of goods sold
= $2,085,480
= 6.0 Average inventory $349,983
Average days in inventory
= 365
= 365
= 60.8 Inventory turnover ratio 6.0
Requirement 6 2012 2011 2010
Gross profit ratio
= Gross profit
= 0.40 0.37 0.40 Net sales
Requirement 7 Operating expenses
= $995,716
= 0.29 Net sales $3,475,802
Chapter 6 - Inventory and Cost of Goods Sold
© The McGraw-Hill Companies, Inc., 2014
6-84 Financial Accounting, 3e
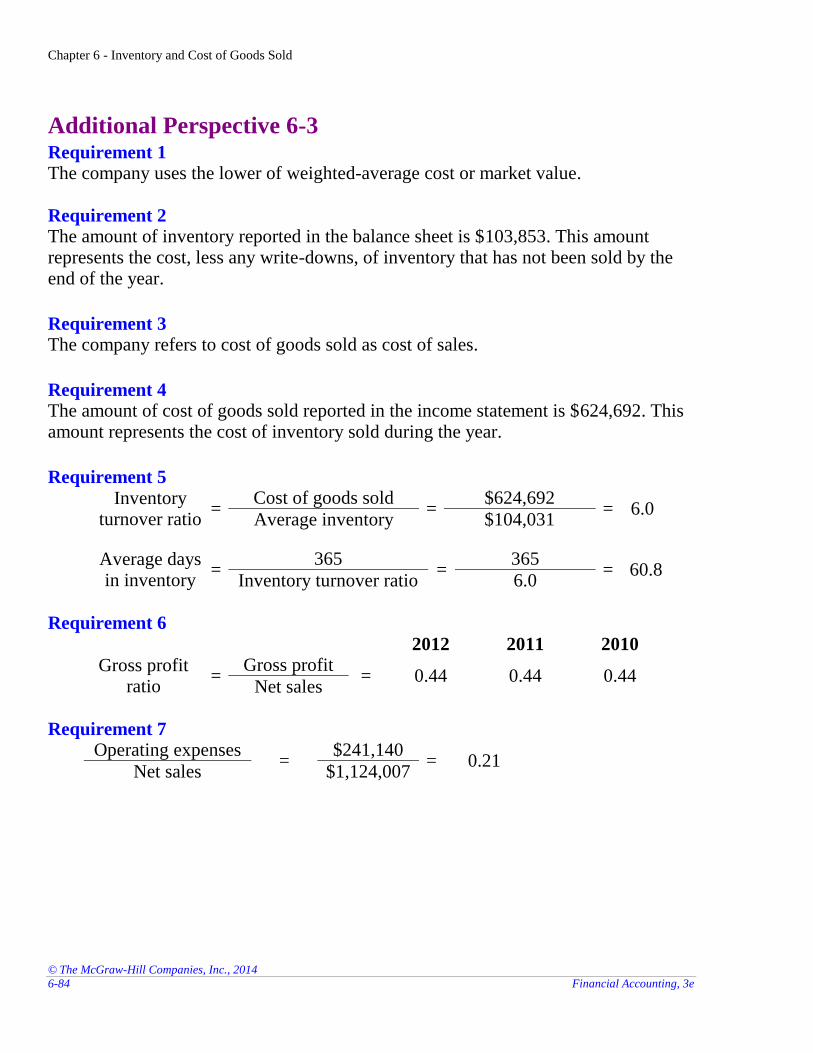
Additional Perspective 6-3
Requirement 1 The company uses the lower of weighted-average cost or market value.
Requirement 2 The amount of inventory reported in the balance sheet is $103,853. This amount represents the cost, less any write-downs, of inventory that has not been sold by the end of the year.
Requirement 3 The company refers to cost of goods sold as cost of sales.
Requirement 4 The amount of cost of goods sold reported in the income statement is $624,692. This amount represents the cost of inventory sold during the year.
Requirement 5
Inventory turnover ratio
= Cost of goods sold
= $624,692
= 6.0 Average inventory $104,031
Average days in inventory
= 365
= 365
= 60.8 Inventory turnover ratio 6.0
Requirement 6 2012 2011 2010
Gross profit ratio
= Gross profit
= 0.44 0.44 0.44 Net sales
Requirement 7 Operating expenses
= $241,140
= 0.21 Net sales $1,124,007
Chapter 6 - Inventory and Cost of Goods Sold
© The McGraw-Hill Companies, Inc., 2014
Solutions Manual, Chapter 6 6-85
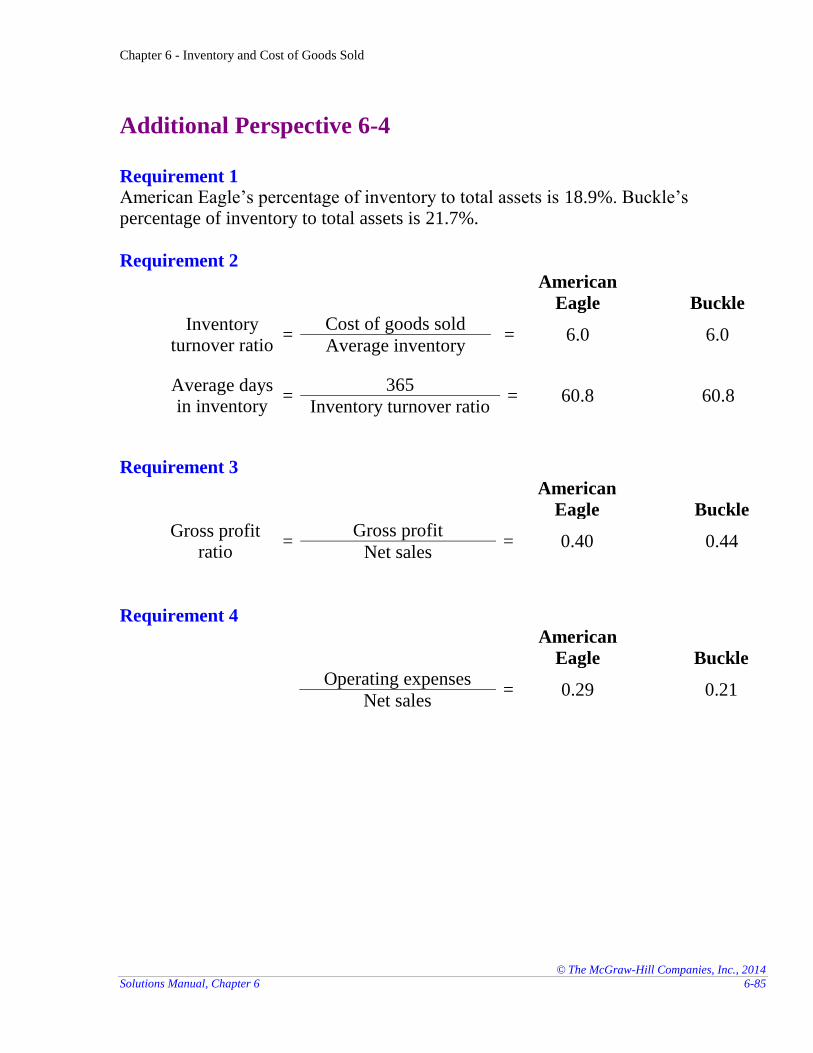
Additional Perspective 6-4
Requirement 1 American Eagle’s percentage of inventory to total assets is 18.9%. Buckle’s percentage of inventory to total assets is 21.7%.
Requirement 2
American
Eagle
Buckle
Inventory turnover ratio
= Cost of goods sold
= 6.0 6.0 Average inventory
Average days in inventory
= 365
= 60.8 60.8 Inventory turnover ratio
Requirement 3
American
Eagle
Buckle
Gross profit ratio
= Gross profit
= 0.40 0.44 Net sales
Requirement 4
American
Eagle
Buckle Operating expenses
= 0.29
0.21 Net sales
Chapter 6 - Inventory and Cost of Goods Sold
© The McGraw-Hill Companies, Inc., 2014
6-86 Financial Accounting, 3e
Additional Perspective 6-5
What is the issue? When the market value of inventory falls below its cost, companies are required to write down inventory, resulting in a loss being reported in the income statement. The
The financial effects of reporting this decline in inventory value will have severe
force the company into bankruptcy. By recording the fictitious sale, the company avoids having to record the inventory write down, and the company reports additional revenue from the sale.
Who are the parties involved? Jim knows the importance to the company of reporting acceptable profits in 2015. If profits are too low, Jim will lose his job and so will all of his coworkers. However, reporting the sale would lead to misstated financial statements. Even if creditors are
discovered and likely lead to bankruptcy. The longer the company stays in business, the more money it could lose and the less creditors would be paid in bankruptcy proceedings. Therefore, not reporting accurately in 2015 could easily cause larger losses to creditors in the future. New investors could potentially suffer as well if their decision to invest in the business is based on financial reports prepared using misstated amounts. What factors should Jim consider in making his decision?
their job. If he allows the
other jobs. He will also please his boss, and if the company somehow is able to continue its existence, this could mean promotions and pay raises. However, as the person responsible for preparing financial statements, Jim has an ethical responsibility to investors and creditors to accurately report the financial position of the company. Jim may face legal penalties for fraudulent reporting. In addition, by refusing to issue misleading financial statements, Jim sends a strong signal to upper management that he is someone who can be trusted. This could prove useful if the company maintains its business or in his career with another employer.
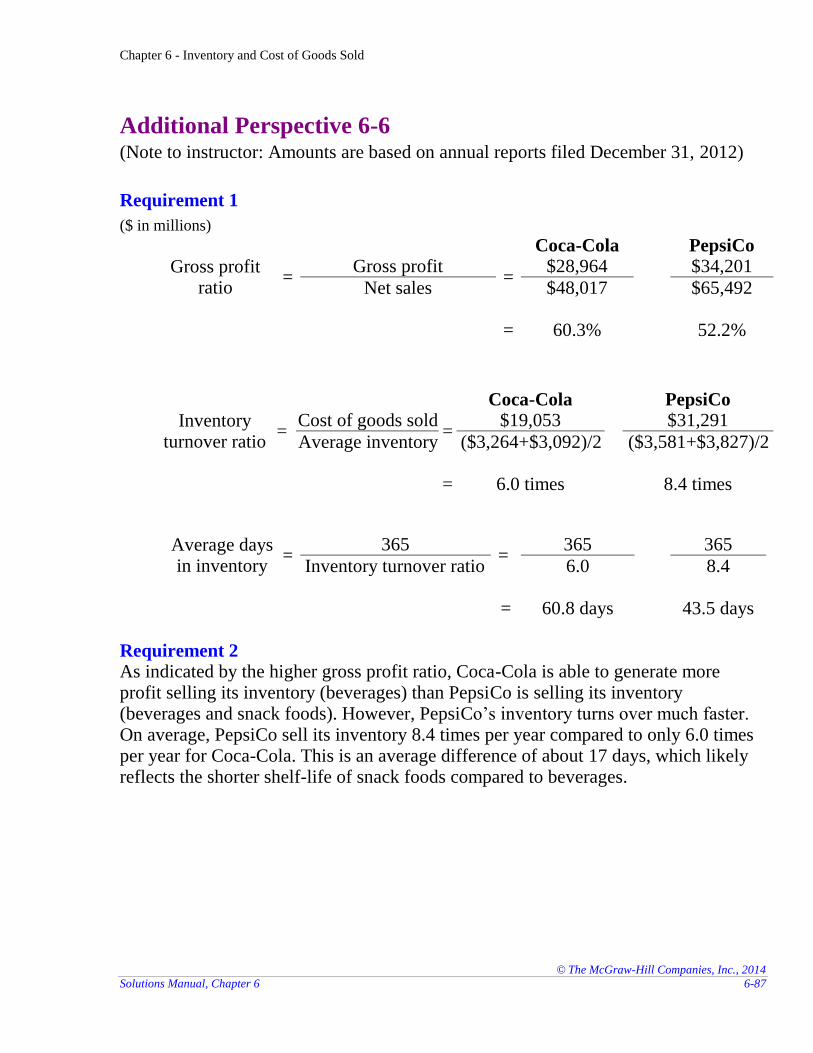
Chapter 6 - Inventory and Cost of Goods Sold
© The McGraw-Hill Companies, Inc., 2014
Solutions Manual, Chapter 6 6-87
Additional Perspective 6-6
(Note to instructor: Amounts are based on annual reports filed December 31, 2012)
Requirement 1
($ in millions)
Coca-Cola PepsiCo
Gross profit ratio
= Gross profit
= $28,964 $34,201
Net sales $48,017 $65,492 = 60.3% 52.2%
Coca-Cola PepsiCo
Inventory turnover ratio
= Cost of goods sold
= $19,053 $31,291
Average inventory ($3,264+$3,092)/2 ($3,581+$3,827)/2 = 6.0 times 8.4 times
Average days in inventory
= 365
= 365 365
Inventory turnover ratio 6.0 8.4 = 60.8 days 43.5 days
Requirement 2 As indicated by the higher gross profit ratio, Coca-Cola is able to generate more profit selling its inventory (beverages) than PepsiCo is selling its inventory (beverages and snack foods). However, PepsiCo’s inventory turns over much faster. On average, PepsiCo sell its inventory 8.4 times per year compared to only 6.0 times per year for Coca-Cola. This is an average difference of about 17 days, which likely reflects the shorter shelf-life of snack foods compared to beverages.
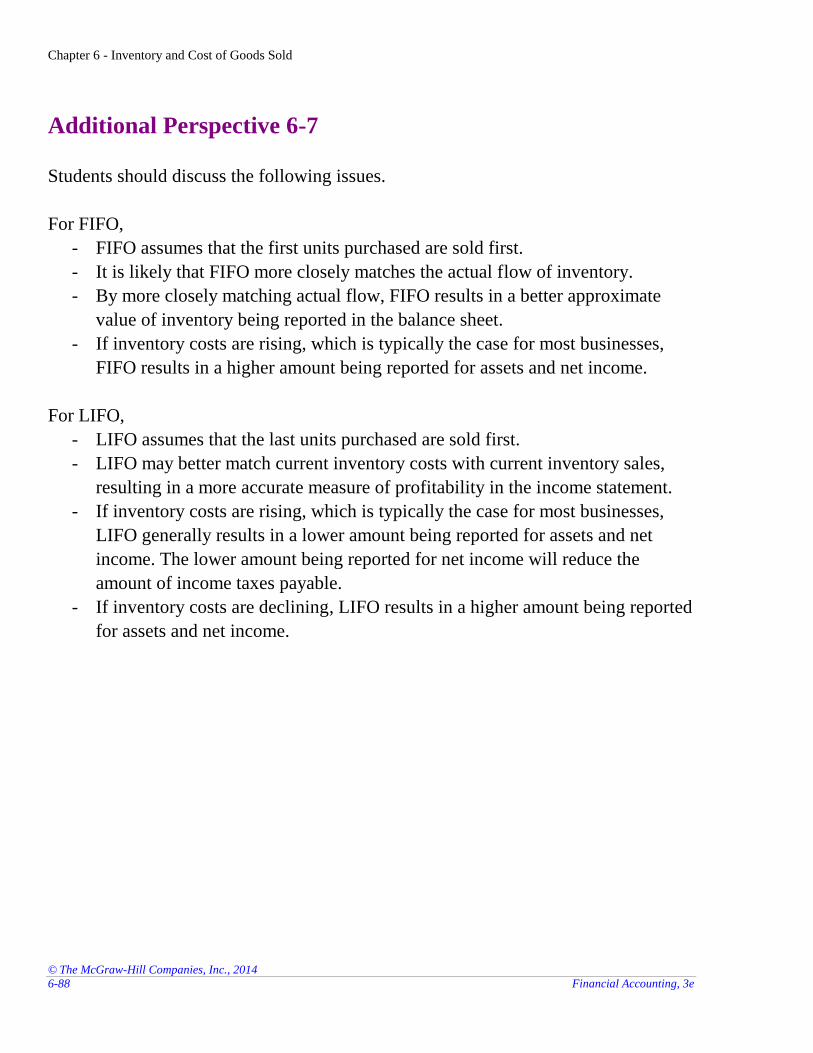
Chapter 6 - Inventory and Cost of Goods Sold
© The McGraw-Hill Companies, Inc., 2014
6-88 Financial Accounting, 3e
Additional Perspective 6-7
Students should discuss the following issues.
For FIFO,
- FIFO assumes that the first units purchased are sold first.
- It is likely that FIFO more closely matches the actual flow of inventory.
- By more closely matching actual flow, FIFO results in a better approximate
value of inventory being reported in the balance sheet.
- If inventory costs are rising, which is typically the case for most businesses,
FIFO results in a higher amount being reported for assets and net income.
For LIFO,
- LIFO assumes that the last units purchased are sold first.
- LIFO may better match current inventory costs with current inventory sales,
resulting in a more accurate measure of profitability in the income statement.
- If inventory costs are rising, which is typically the case for most businesses,
LIFO generally results in a lower amount being reported for assets and net
income. The lower amount being reported for net income will reduce the
amount of income taxes payable.
- If inventory costs are declining, LIFO results in a higher amount being reported
for assets and net income.
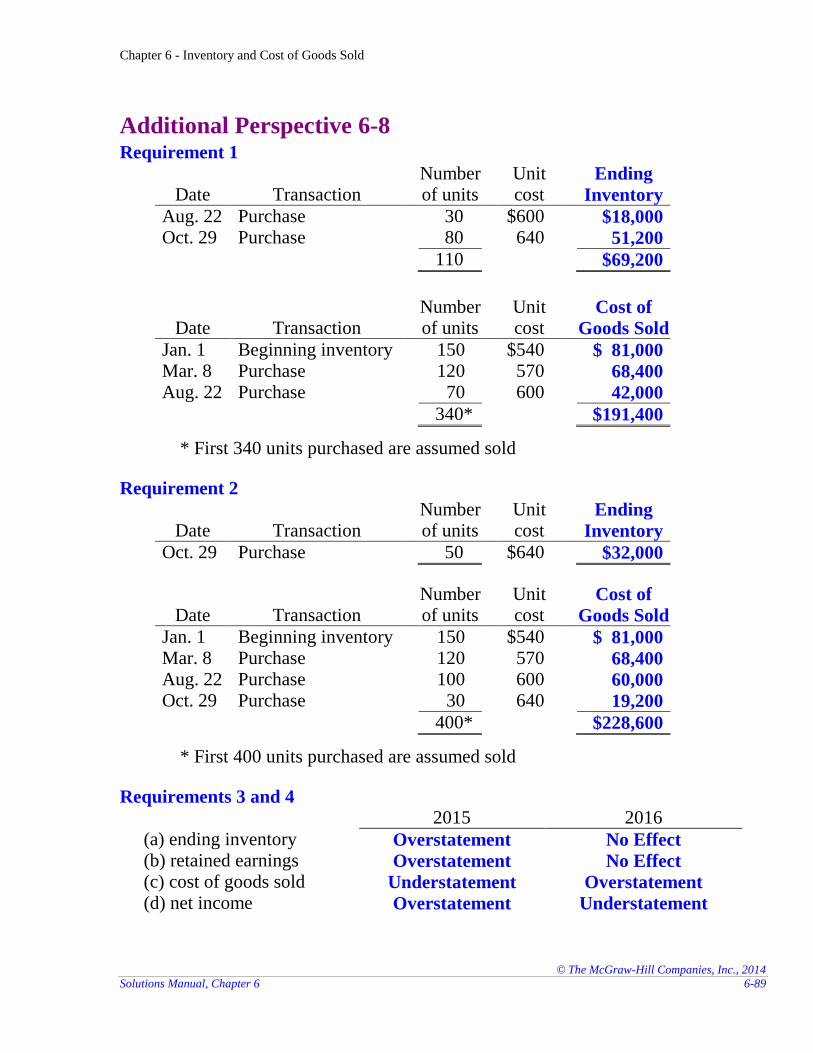
Chapter 6 - Inventory and Cost of Goods Sold
© The McGraw-Hill Companies, Inc., 2014
Solutions Manual, Chapter 6 6-89
Additional Perspective 6-8
Requirement 1
Date Transaction Number of units
Unit cost
Ending
Inventory
Aug. 22 Purchase 30 $600 $18,000 Oct. 29 Purchase 80 640 51,200
110 $69,200
Date Transaction Number of units
Unit cost
Cost of
Goods Sold
Jan. 1 Beginning inventory 150 $540 $ 81,000 Mar. 8 Purchase 120 570 68,400 Aug. 22 Purchase 70 600 42,000
340* $191,400
* First 340 units purchased are assumed sold
Requirement 2
Date Transaction Number of units
Unit cost
Ending
Inventory
Oct. 29 Purchase 50 $640 $32,000
Date Transaction Number of units
Unit cost
Cost of
Goods Sold
Jan. 1 Beginning inventory 150 $540 $ 81,000 Mar. 8 Purchase 120 570 68,400 Aug. 22 Purchase 100 600 60,000 Oct. 29 Purchase 30 640 19,200
400* $228,600
* First 400 units purchased are assumed sold
Requirements 3 and 4 2015 2016
(a) ending inventory Overstatement No Effect (b) retained earnings Overstatement No Effect (c) cost of goods sold Understatement Overstatement (d) net income Overstatement Understatement


![[INSERT TITLE] TABLETOP EXERCISE (TTX) · CISA Tabletop Exercise Package Brief Slide Deck Created Date: 20200708203419Z](https://img.pdfslide.us/doc/110x75/5fb62a70a98474222f1d1551/insert-title-tabletop-exercise-ttx-cisa-tabletop-exercise-package-brief-slide.jpg)

![[Exercise 1-6] (COMPILATION)](https://img.pdfslide.us/doc/110x75/577c86e01a28abe054c2ef0e/exercise-1-6-compilation.jpg)