Embed Size (px)
Citation preview
BRIDGING THE DIGITAL DIVIDE IN AFRICA:
A TECHNOLOGY PERSPECTIVE A. BAGULA, M. ZENARRO, A. NUNGU, M. NKOLOMA
Wireless Communication and Information 2011 Conference
A Look on the Digital Divide
0
10
20
30
40
50
60
70
80
90
100
2000 2001 2002 2003 2004 2005 2006 2007 2008 2009 2010
Per
100
inha
bita
nts
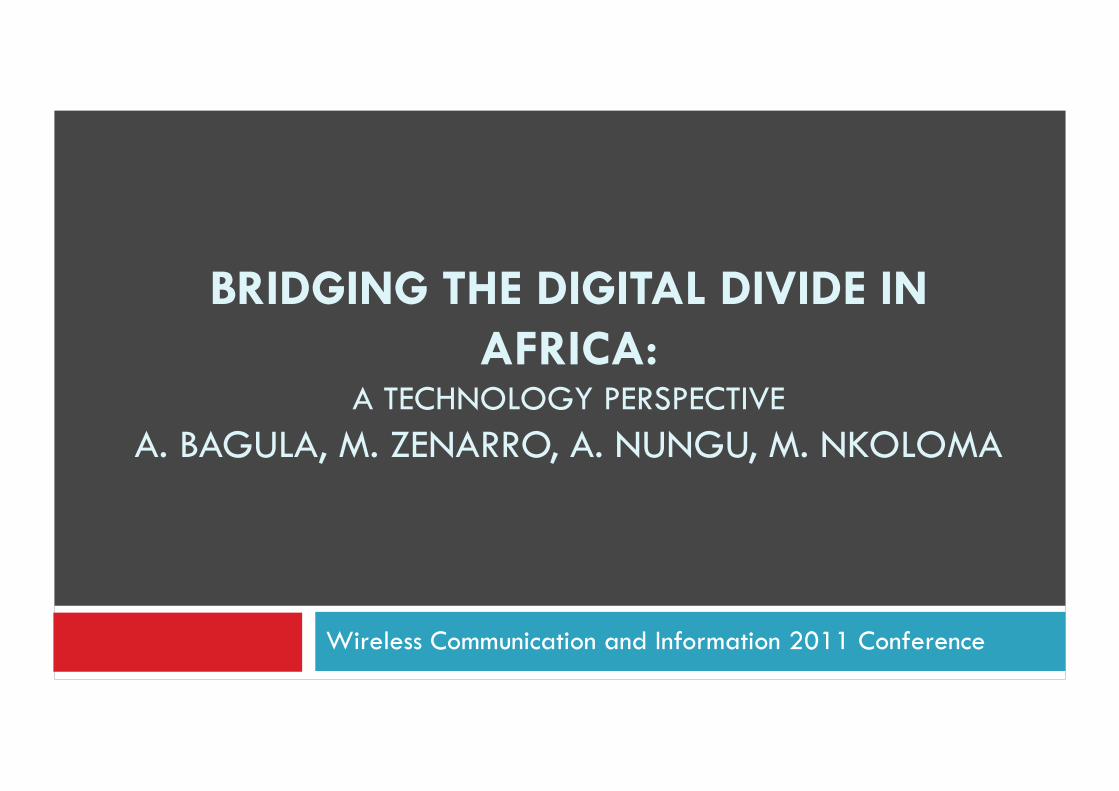
Global ICT developments, 2000-2010
Mobile cellular telephone subscriptions
Internet users
Fixed telephone lines
Active mobile broadband subscriptions
Fixed (wired) broadband subscriptions
Source: ITU World Telecommunication /ICT Indicators database
WCI2011
A Look on the Digital Divide
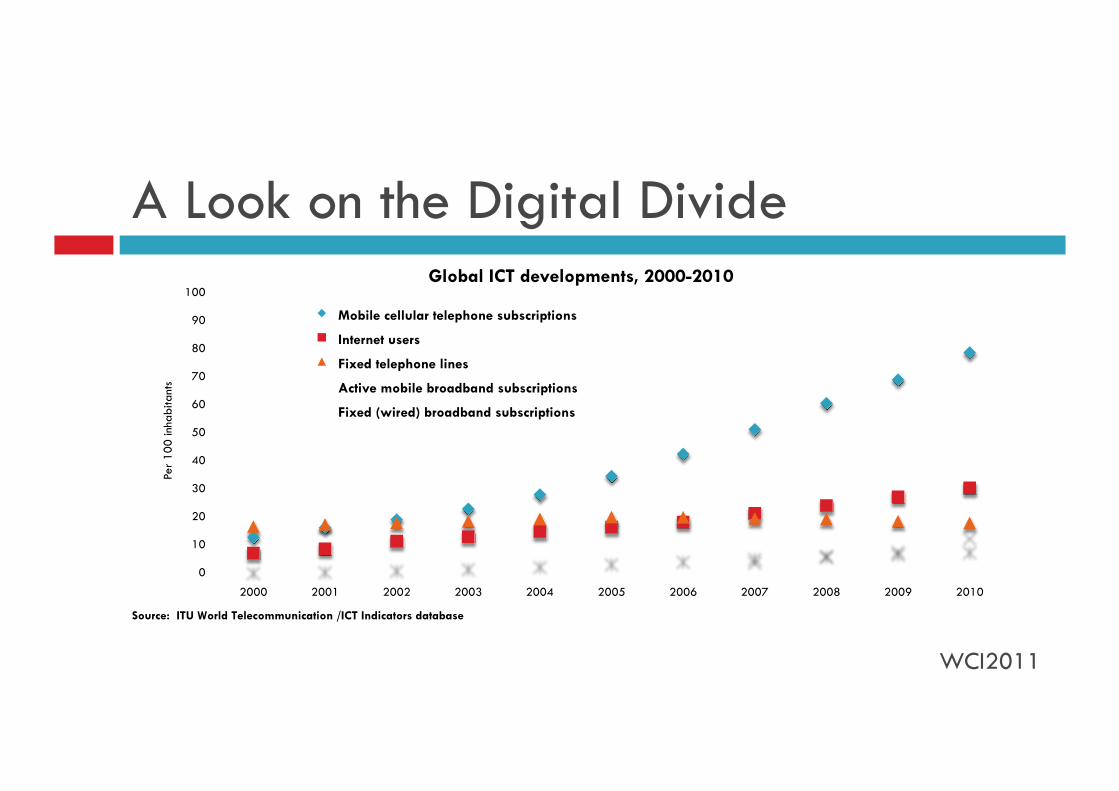
2000 - 2010 Global number of Internet users and total per 100 inhabitants.
WCI2011
A Look on the Digital Divide
6
6,2
6,4
6,6
6,8
7
7,2
7,4
7,6
7,8
8
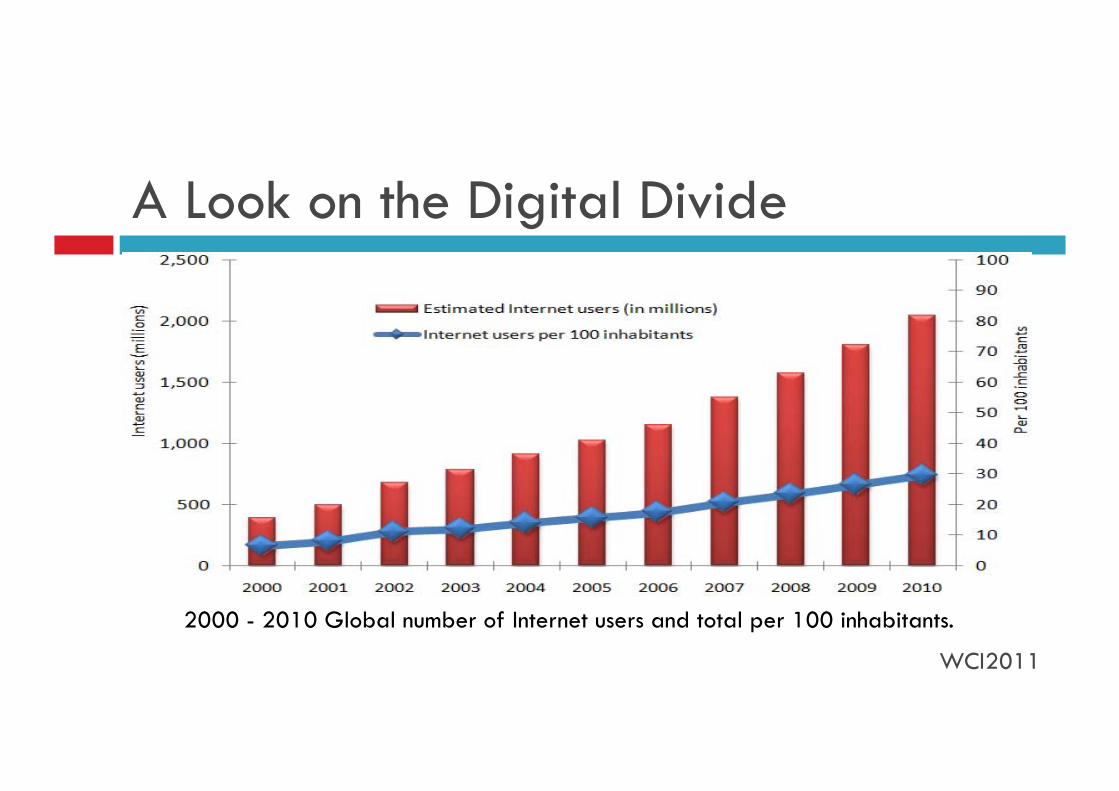
Sweden Luxembourg Rep. Korea Denmark Netherlands Iceland Switzerland Japan Norway UK
Source: ITU Measuring the Information Society 2010.
ITU ICT Development Index (IDI) : 2008 top ten countries
WCI2011
A Look on the Digital Divide
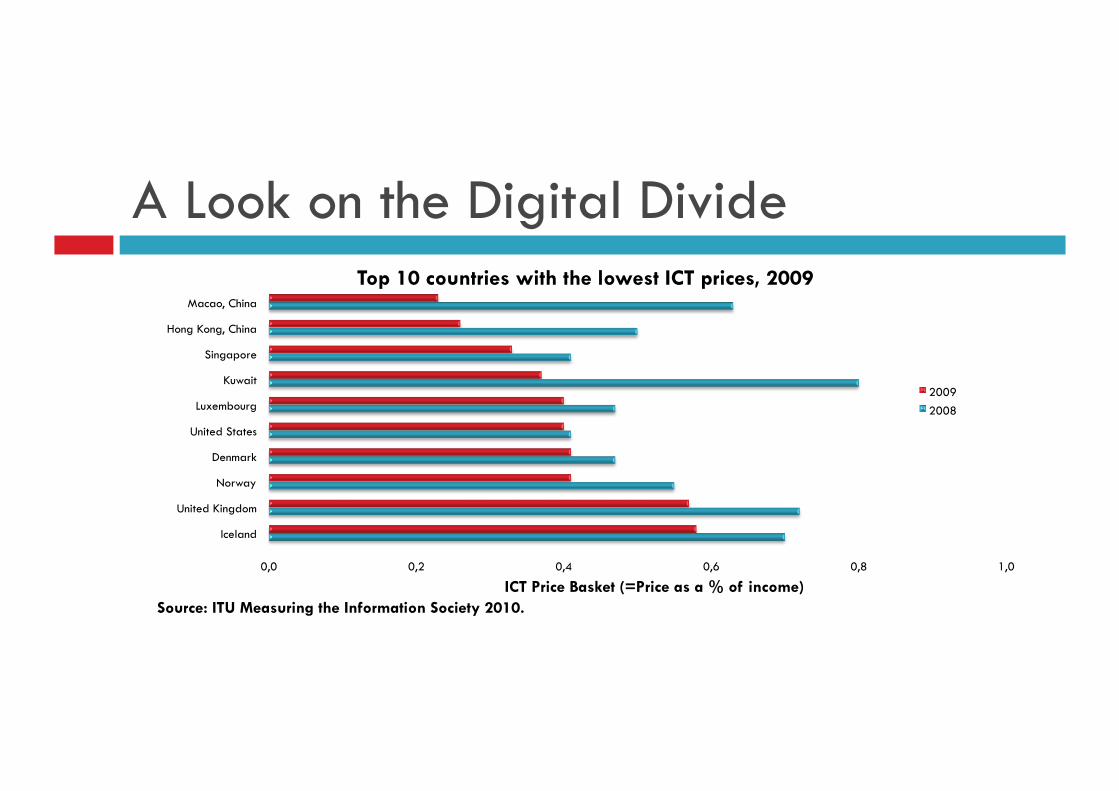
0,0 0,2 0,4 0,6 0,8 1,0
Iceland
United Kingdom
Norway
Denmark
United States
Luxembourg
Kuwait
Singapore
Hong Kong, China
Macao, China
ICT Price Basket (=Price as a % of income)
Top 10 countries with the lowest ICT prices, 2009
2009 2008
Source: ITU Measuring the Information Society 2010.
A Look on the Digital Divide
Introduction
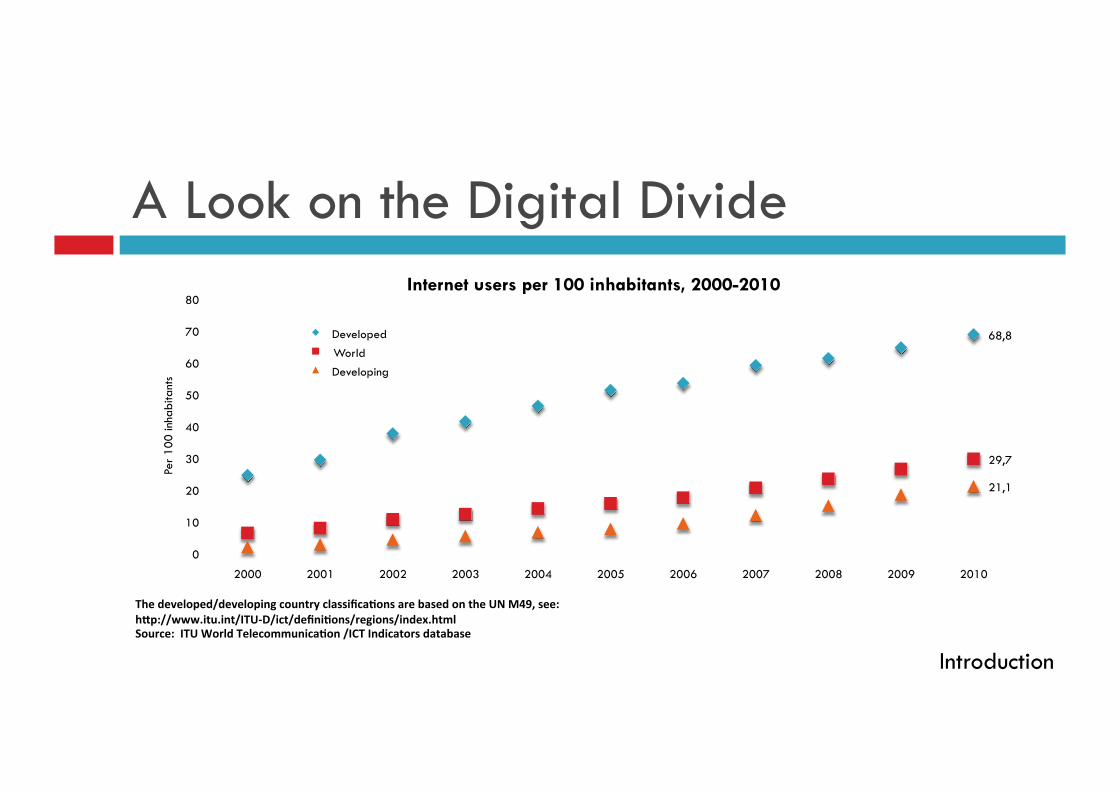
68,8
29,7
21,1
0
10
20
30
40
50
60
70
80
2000 2001 2002 2003 2004 2005 2006 2007 2008 2009 2010
Per
100
inha
bita
nts
Internet users per 100 inhabitants, 2000-2010
Developed World Developing
The developed/developing country classifica6ons are based on the UN M49, see: h?p://www.itu.int/ITU-‐D/ict/defini6ons/regions/index.html Source: ITU World Telecommunica6on /ICT Indicators database
Outline
Introduction. Digital Divide. Case Studies. Conclusion.
WCI2011
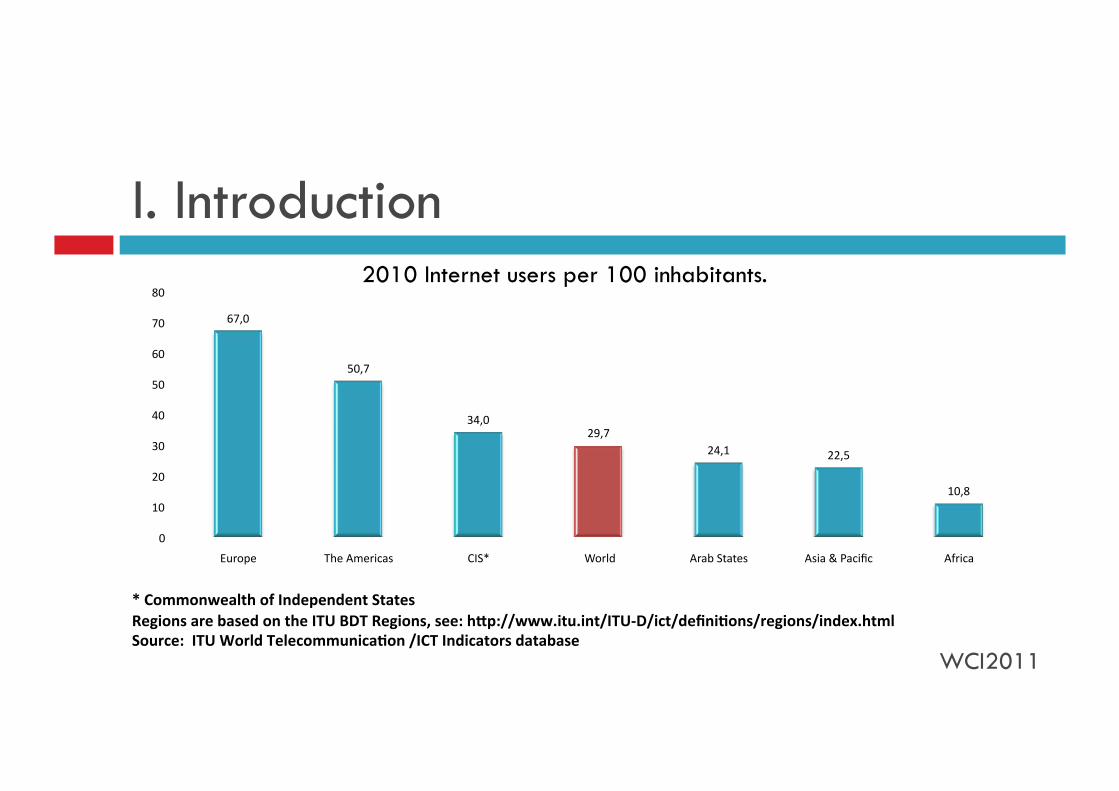
I. Introduction 2010 Internet users per 100 inhabitants.
67,0
50,7
34,0 29,7
24,1 22,5
10,8
0
10
20
30
40
50
60
70
80
Europe The Americas CIS* World Arab States Asia & Pacific Africa
* Commonwealth of Independent States Regions are based on the ITU BDT Regions, see: h?p://www.itu.int/ITU-‐D/ict/defini6ons/regions/index.html Source: ITU World Telecommunica6on /ICT Indicators database
WCI2011
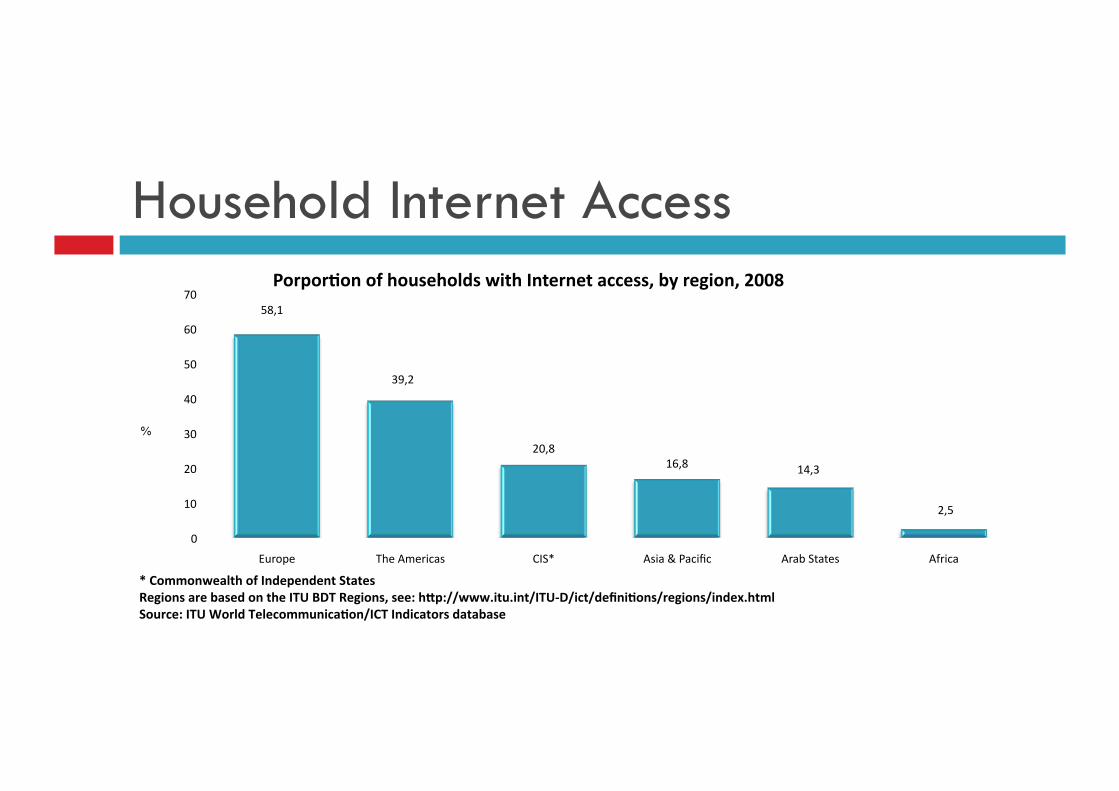
Household Internet Access
58,1
39,2
20,8 16,8 14,3
2,5
0
10
20
30
40
50
60
70
Europe The Americas CIS* Asia & Pacific Arab States Africa
Porpor6on of households with Internet access, by region, 2008
* Commonwealth of Independent States Regions are based on the ITU BDT Regions, see: h?p://www.itu.int/ITU-‐D/ict/defini6ons/regions/index.html Source: ITU World Telecommunica6on/ICT Indicators database
%
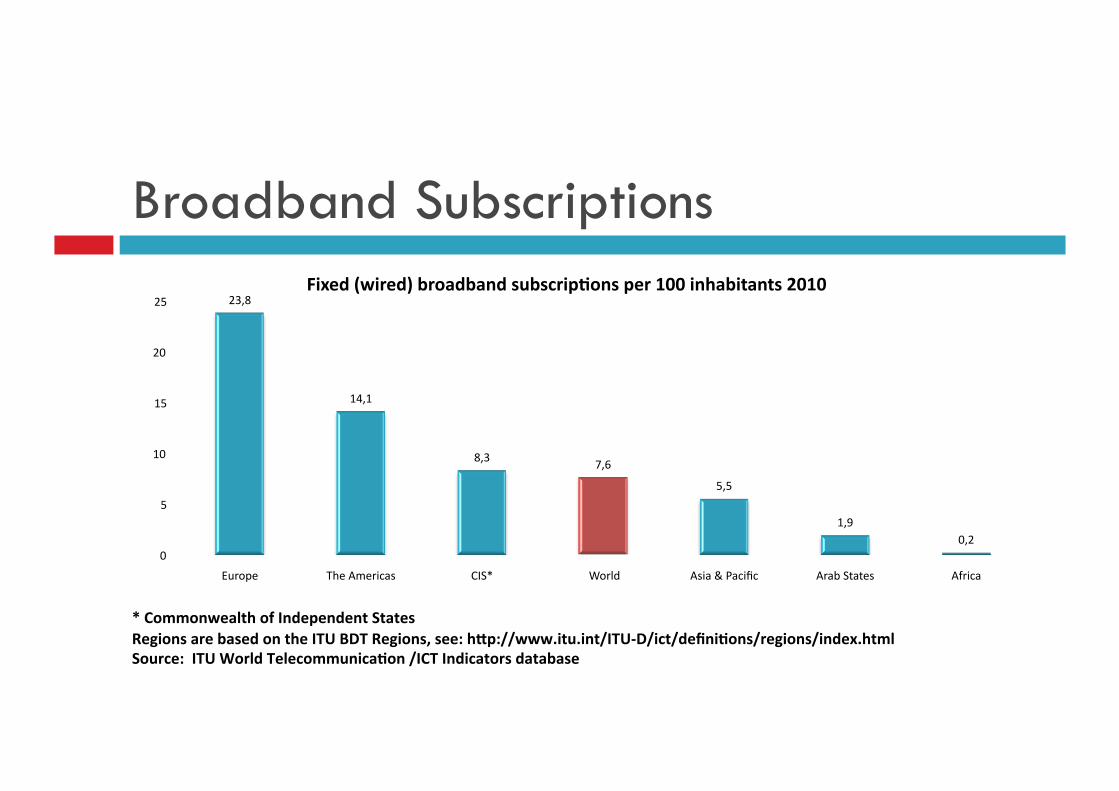
Broadband Subscriptions 23,8
14,1
8,3 7,6
5,5
1,9 0,2
0
5
10
15
20
25
Europe The Americas CIS* World Asia & Pacific Arab States Africa
Fixed (wired) broadband subscrip6ons per 100 inhabitants 2010
* Commonwealth of Independent States Regions are based on the ITU BDT Regions, see: h?p://www.itu.int/ITU-‐D/ict/defini6ons/regions/index.html Source: ITU World Telecommunica6on /ICT Indicators database
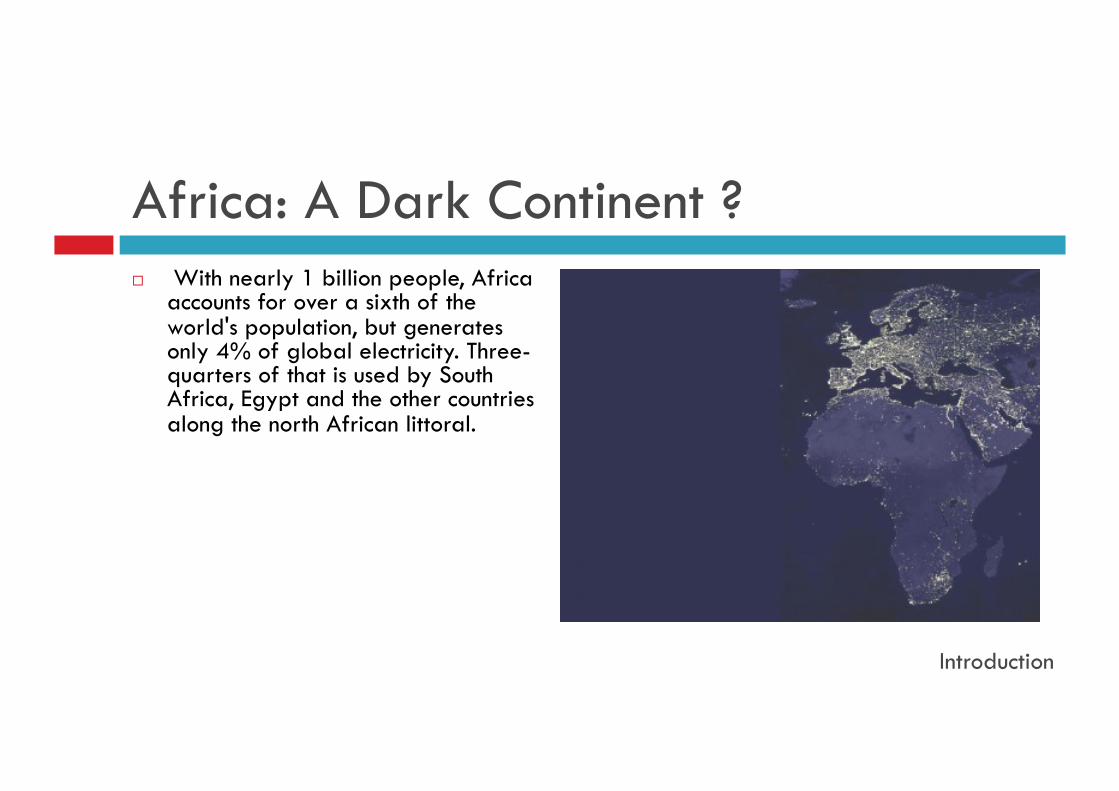
Africa: A Dark Continent ? With nearly 1 billion people, Africa
accounts for over a sixth of the world's population, but generates only 4% of global electricity. Three-quarters of that is used by South Africa, Egypt and the other countries along the north African littoral.
Introduction
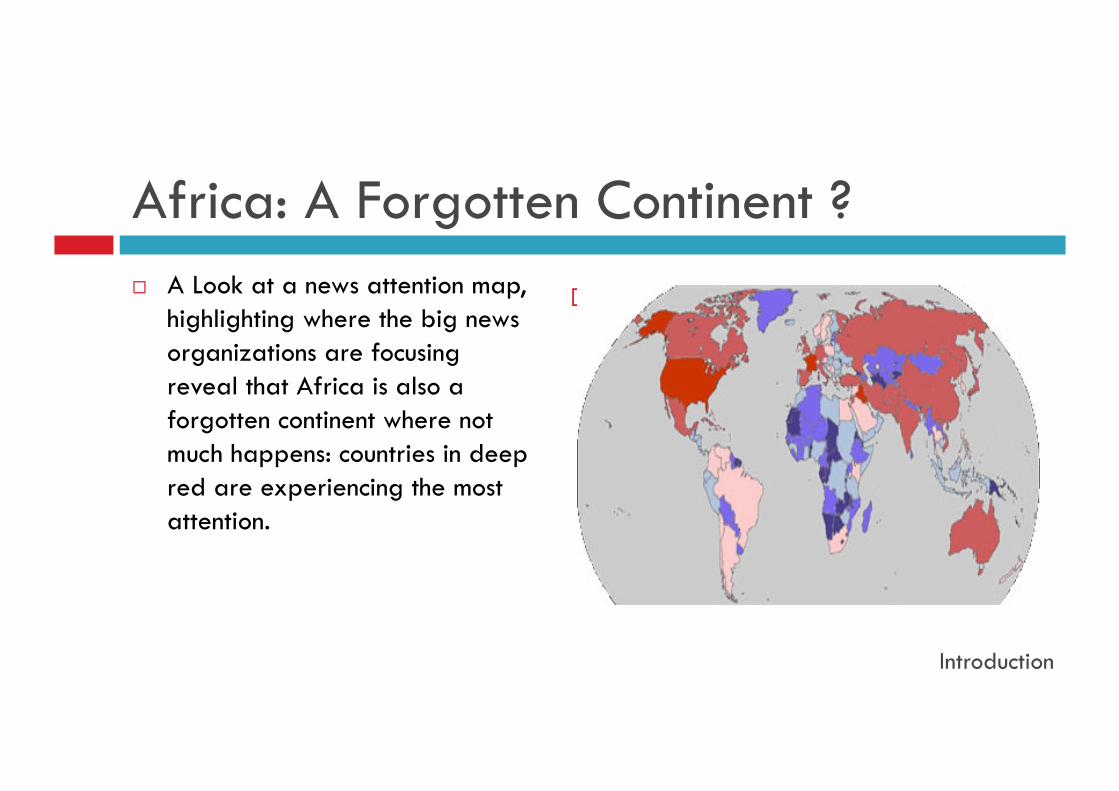
Africa: A Forgotten Continent ? A Look at a news attention map,
highlighting where the big news organizations are focusing reveal that Africa is also a forgotten continent where not much happens: countries in deep red are experiencing the most attention.
Introduction
Africa: The Big Picture The big picture revealed by the ITU statistics and data from the
ones depicted on different sites on the Internet presents Africa as the “dark continent” with 1) the poorest luminosity during the night as a result of poor
power grid infrastructure 2) the lowest numbers of google search and news hits and 3) the lowest scores in terms of digital performance.
Introduction
II. The Digital Divide A multi-facet/multi-constrained problem:
Objective: reduce the technological gap.
Constraints: social, cultural, technological, political, and others.
Mathematical expression: If expressed mathematically, the digital divide would appear as a complex NP-complete problem requiring approximations to mimic an optimal solution.
Approximations: Such approximations involve networking technologies aimed at moving the Internet further to isolated regions using least cost optical, fixed and mobile wireless, and the emerging sensor technologies.
WCI2011
A. Optical Networking Optical technology has the potential to provide large-capacity links using
dense wavelength-division multiplexing (DWDM) .
Due legacy communication infrastructure, It is by far the most viable solution to Greenfield deployment in Africa since the capital to be invested including cable laying costs may be similar to its counterpart, copper deployments.
However, tough providing a theoretical capacity estimated to hundreds of Terabytes per second, Fiber might be harder to work with and termination equipment is still costly.
WCI2011
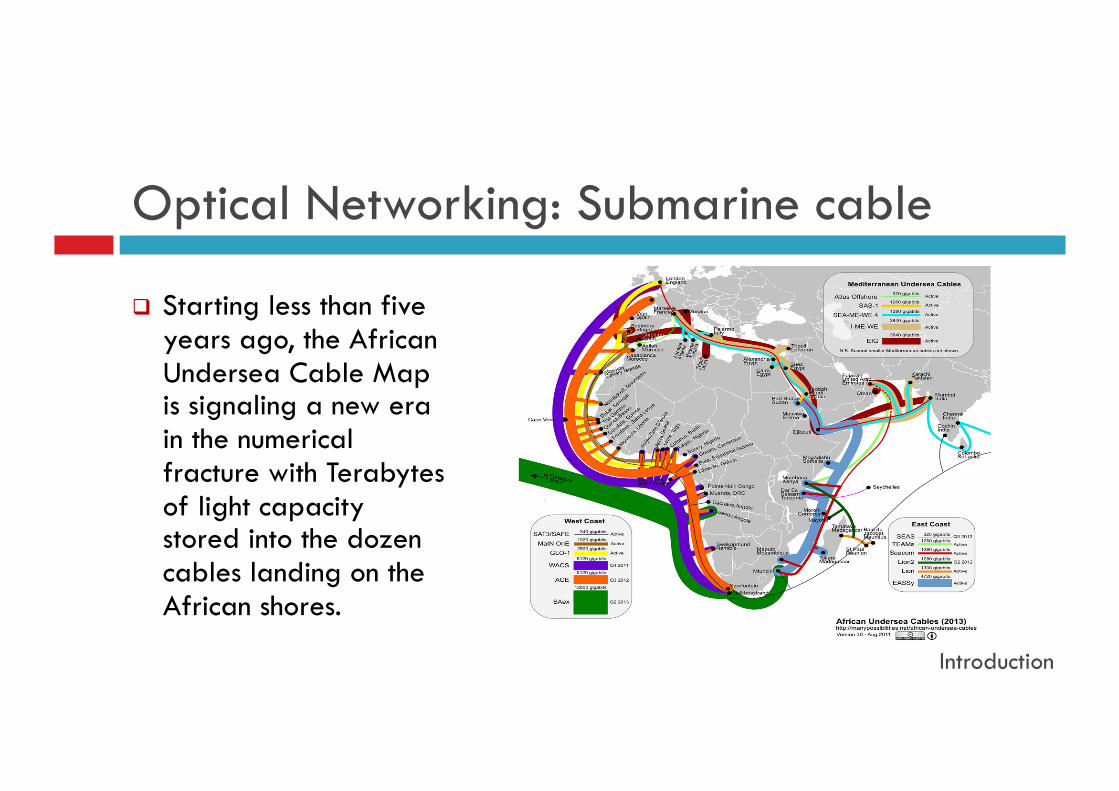
Optical Networking: Submarine cable
Starting less than five years ago, the African Undersea Cable Map is signaling a new era in the numerical fracture with Terabytes of light capacity stored into the dozen cables landing on the African shores.
Introduction
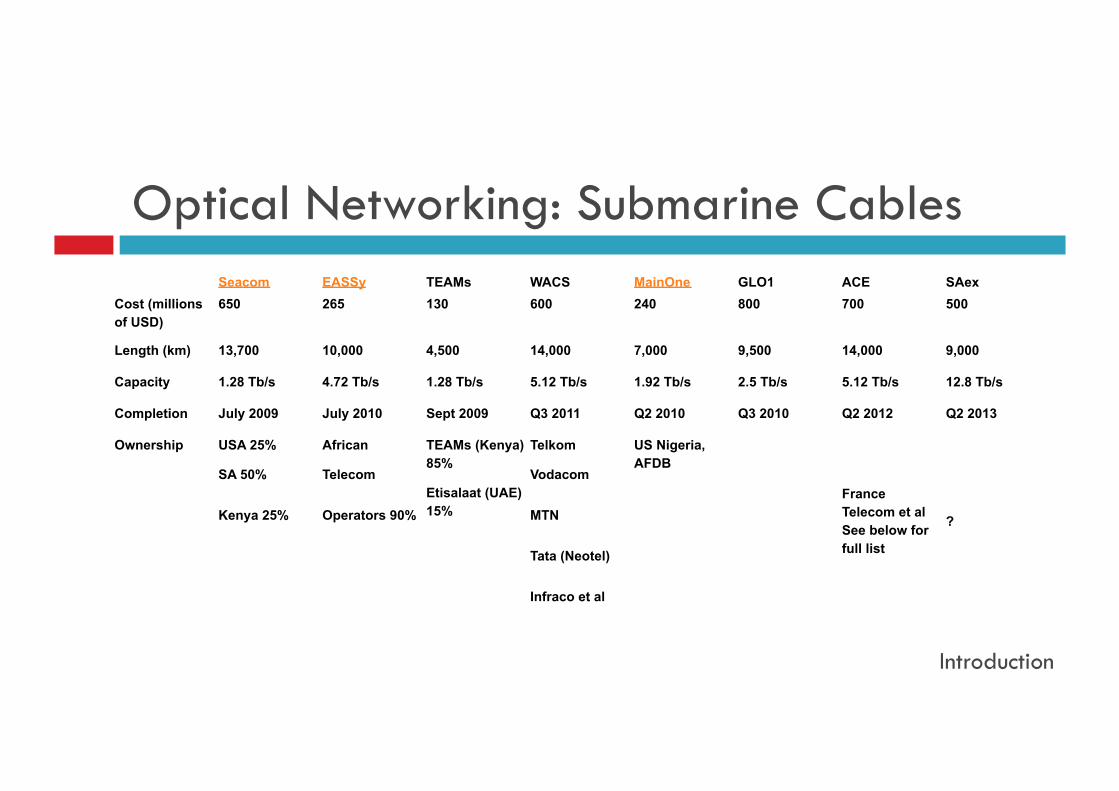
Optical Networking: Submarine Cables
Introduction
Seacom EASSy TEAMs WACS MainOne GLO1 ACE SAex Cost (millions of USD)
650 265 130 600 240 800 700 500
Length (km) 13,700 10,000 4,500 14,000 7,000 9,500 14,000 9,000
Capacity 1.28 Tb/s 4.72 Tb/s 1.28 Tb/s 5.12 Tb/s 1.92 Tb/s 2.5 Tb/s 5.12 Tb/s 12.8 Tb/s
Completion July 2009 July 2010 Sept 2009 Q3 2011 Q2 2010 Q3 2010 Q2 2012 Q2 2013
Ownership USA 25%
SA 50%
Kenya 25%
African
Telecom
Operators 90%
TEAMs (Kenya) 85%
Etisalaat (UAE) 15%
Telkom
Vodacom
MTN
Tata (Neotel)
Infraco et al
US Nigeria, AFDB
France Telecom et al See below for full list
?
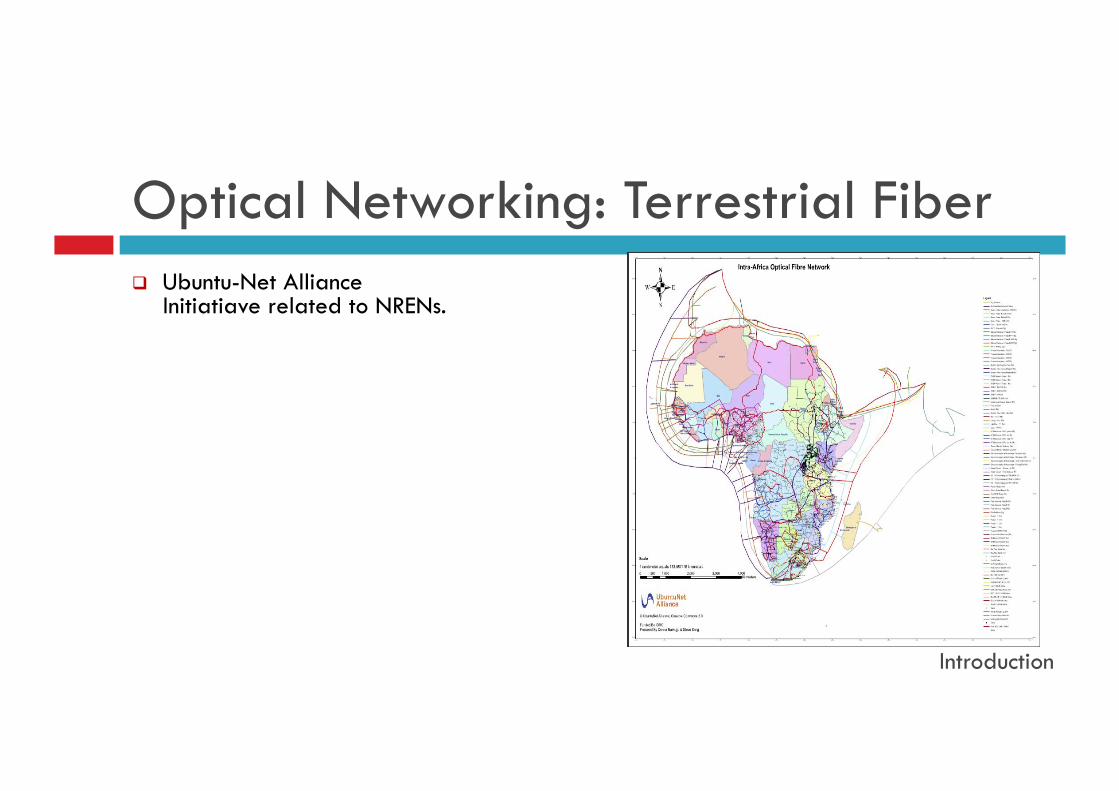
Optical Networking: Terrestrial Fiber Ubuntu-Net Alliance
Initiatiave related to NRENs.
Introduction
B. Wireless Networking 802.11 Wi-Fi: Due to cost and mass production, the 802.11 standard has been proven
as a mature technology for the last mile in developing world. However, Wi-FI suffers from the interference.
802.22 WRAN: A novel technology called Wireless Regional Area Network (WRAN) Ithat uses the 802.22 protocol.
It uses frequencies normally used for Television (TV) broadcast services referred to as “white spaces” and harnesses cognitive radio (CR) techniques to enable the sharing of the broadcast communication band by having data communication being automatically routed to unused frequencies.
By using the lower frequency TV band, WRAN link can span distances up to 100km, thereby making this a very promising technological option for many unconnected developing countries. The standard also provides broadband connectivity up to around 20 Mb/s for each access point installed. Introduction
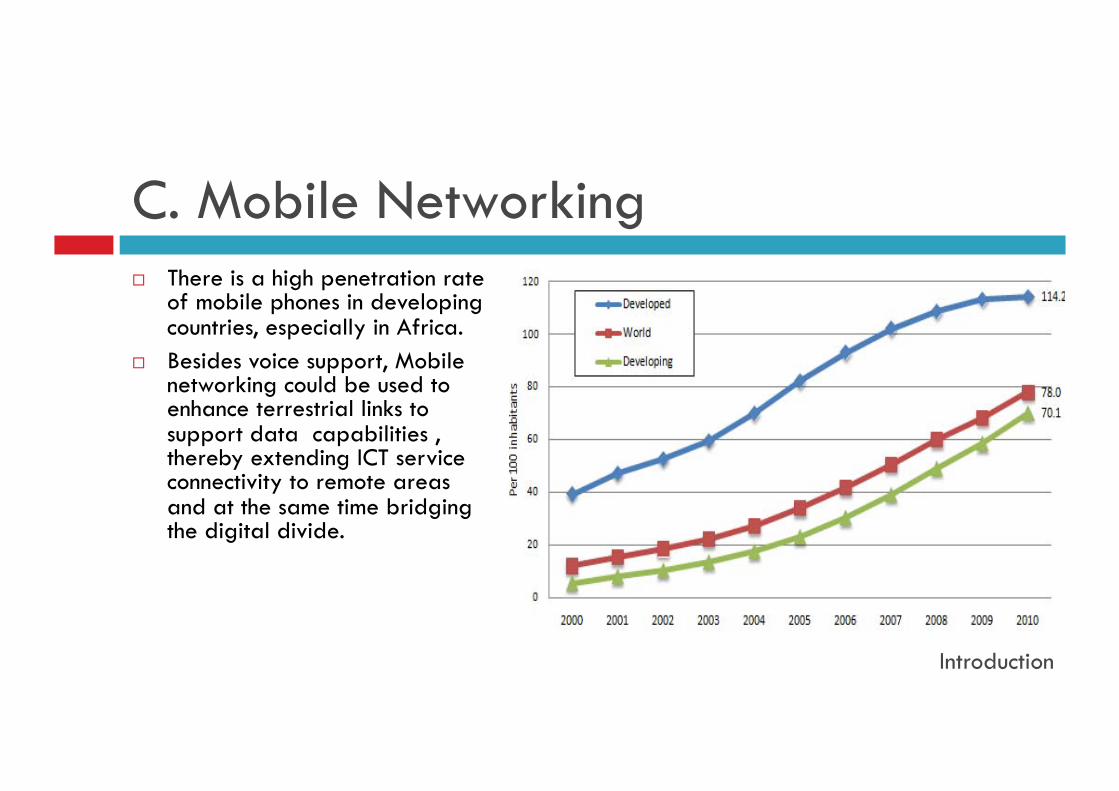
C. Mobile Networking
Introduction
There is a high penetration rate of mobile phones in developing countries, especially in Africa.
Besides voice support, Mobile networking could be used to enhance terrestrial links to support data capabilities , thereby extending ICT service connectivity to remote areas and at the same time bridging the digital divide.
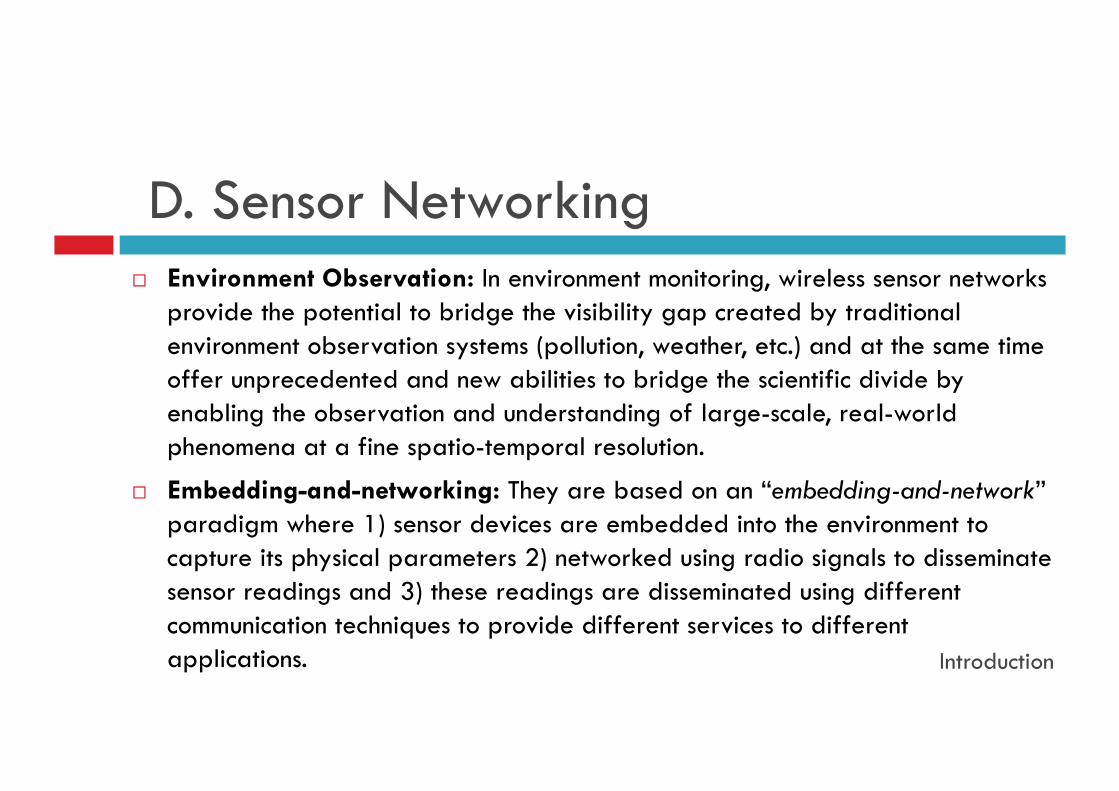
D. Sensor Networking Environment Observation: In environment monitoring, wireless sensor networks
provide the potential to bridge the visibility gap created by traditional environment observation systems (pollution, weather, etc.) and at the same time offer unprecedented and new abilities to bridge the scientific divide by enabling the observation and understanding of large-scale, real-world phenomena at a fine spatio-temporal resolution.
Embedding-and-networking: They are based on an “embedding-and-network” paradigm where 1) sensor devices are embedded into the environment to capture its physical parameters 2) networked using radio signals to disseminate sensor readings and 3) these readings are disseminated using different communication techniques to provide different services to different applications. Introduction
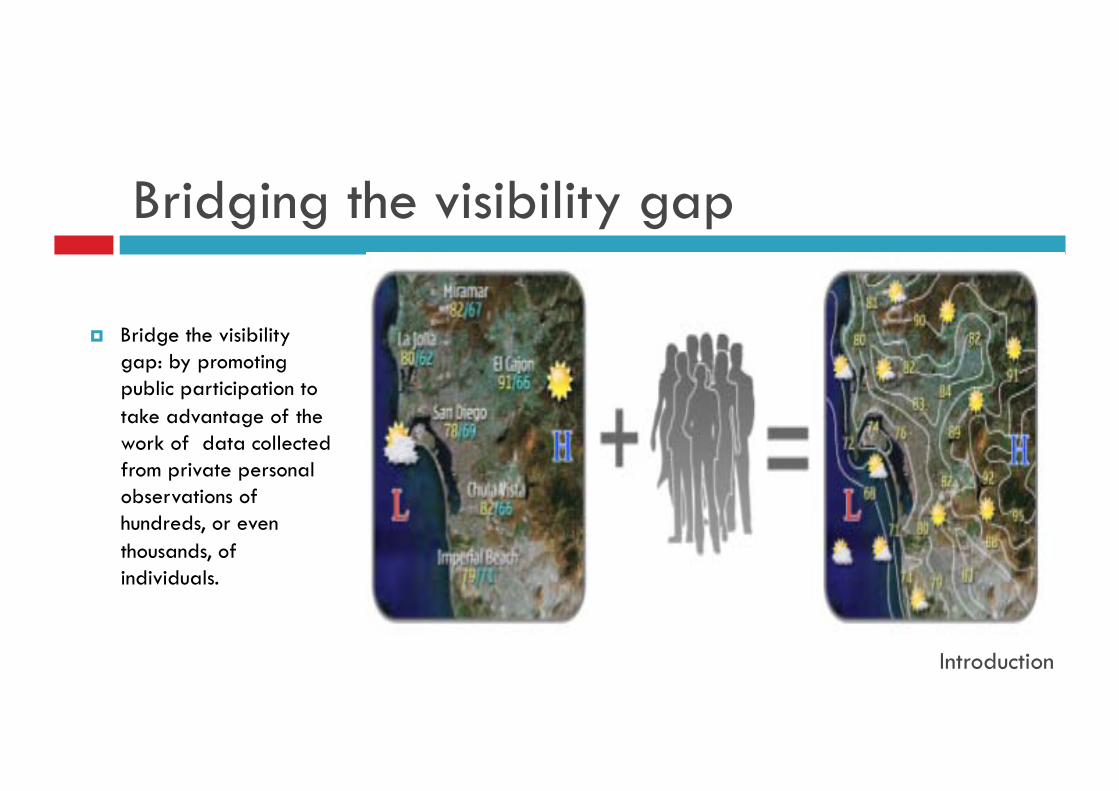
Bridging the visibility gap
Bridge the visibility gap: by promoting public participation to take advantage of the work of data collected from private personal observations of hundreds, or even thousands, of individuals.
Introduction
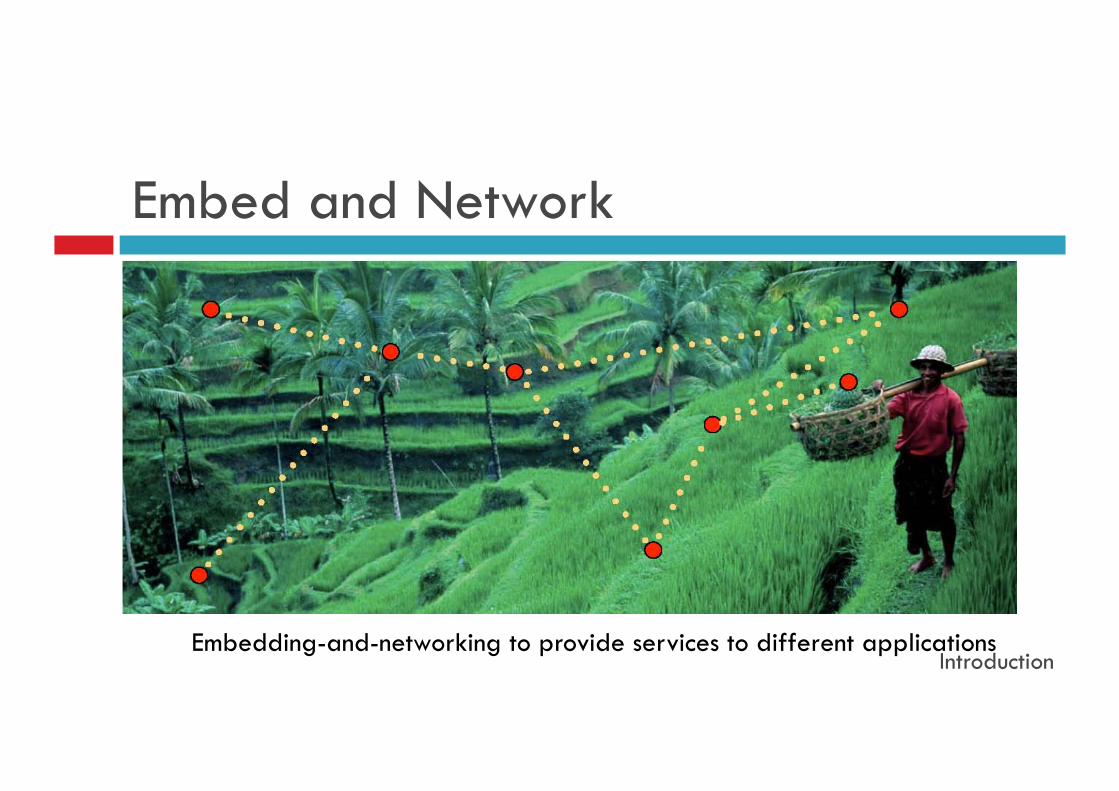
Embed and Network
Embedding-and-networking to provide services to different applications Introduction
Sensor Networking: Applications Water resources management: they can be used to measure the rate, quantity, and
direction of contaminant flow in water and the presence of different other water substances. They can also be used to determine the rate and direction of a river flow.
Pollution Monitoring: Using off-the-shelf gas sensors they can be used to measure the levels of pollutants in the air and thus protect the environment, human health and help in preventing visibility casualties resulting from pollution.
Weather Monitoring: Miniaturized weather stations are being produced by sensor manufacturers. They are hundred times much cheaper than professional weather stations while exhibiting the same features as professional stations. By changing the way we measure weather, these stations provide a high potential to improve agriculture and the fight against drought in many of the African countries where agriculture represents a big portion of a country economic income. Introduction
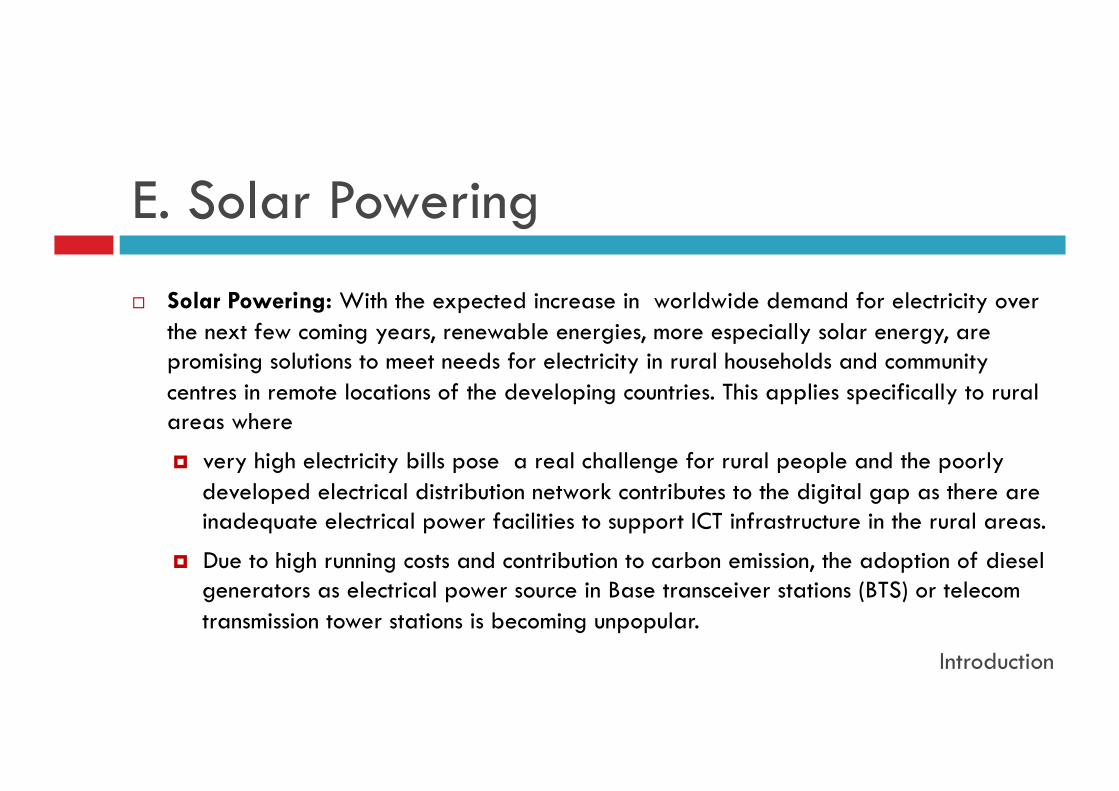
E. Solar Powering
Solar Powering: With the expected increase in worldwide demand for electricity over the next few coming years, renewable energies, more especially solar energy, are promising solutions to meet needs for electricity in rural households and community centres in remote locations of the developing countries. This applies specifically to rural areas where
very high electricity bills pose a real challenge for rural people and the poorly developed electrical distribution network contributes to the digital gap as there are inadequate electrical power facilities to support ICT infrastructure in the rural areas.
Due to high running costs and contribution to carbon emission, the adoption of diesel generators as electrical power source in Base transceiver stations (BTS) or telecom transmission tower stations is becoming unpopular.
Introduction
III. Successful Deployments
A. Serengeti Network in Tanzania
B. Malaria Network in Malawi
C. Solar System in Malawi
D. Pollution Monitoring in Cape Town
Introduction
Objective: Looking at the best technological practices that can fill the digital divide, we look at some of the successful deployments in Africa that may be replicated to improve connectivity in Africa and reduce the infrastructural gap. These include
A. Serengeti Network in Tanzania Main Goal: goal of creating a model for building and sustaining broadband
communication networks in under-served areas.
Approach: The approach is to create broadband Islands, defined as self-sustained local area networks that provide services in a local community with a capacity that is not limiting the spectrum of services.
Deployment: The Serengeti pilot is in the Mara region, northern Tanzania, connecting two districts of Serengeti and Bunda, with a total population of about 500,000 people [14]
Potential: Focus on facilitating basic public services, including education, health, local government and the local entrepreneurs, in order to progress the millennium development goals (MDGs).
Introduction
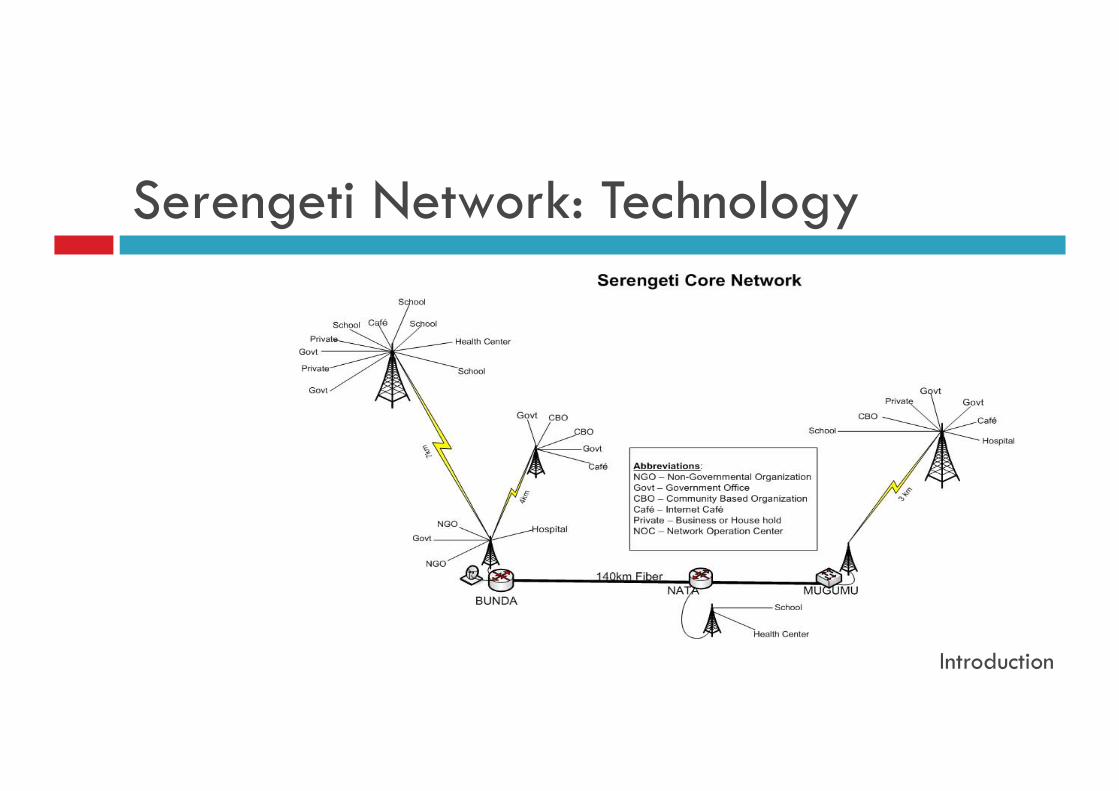
Serengeti Network: Technology
Introduction
Main features: On the communication link, the ICT4RD model is about sharing of the passive infrastructure at cost-related basis. For the Serengeti pilot, a pair of fiber cable is provided by the power utility company in exchange for an Internet connection. The fibre was installed as underground wire in their rural electrification program. End users are connected through wireless technology using free spectrum, a mix of both 2.4 and 5GHz.
Serengeti Network: Technology
Introduction
Serengeti Network: Cost
Introduction
Cost: To build Serengeti pilot as a self-sustained broadband island, the network operate its own servers, running the network services as well as user applications. On the back-end, the deployment included buying 2 servers, fibre termination equipments and wireless broadcasting antennas. Each connected institution was provided a computer, printer, UPS, Voice over IP (VoIP) phone, and WiFi (ubiquiti networks) antenna. Including labor, the fibre equipments and termination was about 10,000USD, setting up the wireless network cost about 10,000USD, the two servers cost about 5,000USD while connecting each institution cost about 2,5000USD. Once the network is up and running, connecting individuals who pay their own costs, buying the ubnt antennas is about 80USD (shipping included). A shared Internet is also provided at a cost of 25USD per each connected computer.
Serengeti Network: Impact
Introduction
Impact: The following highlights notable positive impacts of this technology.
The local government use the VoIP phones and emails communications between departments as well as with connected schools and health facilities. A pharmacy in Serengeti is reported using Internet to search for proper drug dose. A survey on Internet cafes indicated that frequent users are students and reporters. The students make applications to universities in the country as well as access registration or study results online. The reporters use Internet to send stories to their head offices in the capital city. There is video on demand materials on the local servers for health and education
sector.
B. Malaria Network in Malawi
Introduction
Objective: connect the faculty of Medicine in Blantyre to the hospital in Mangochi which was previously unconnected. The final goal was to allow medical staff in Mangochi to communicate with their colleagues in the main hospital of Blantyre, where specialized doctors are available. Team: A group of engineers from the International Centre for Theoretical Physics of Trieste (ICTP), Italy, in collaboration with local engineers. Technology: Long wireless (Wi-FI) link. Collaboration: Malawi Polytechnic and the College of Medicine, and ICTP
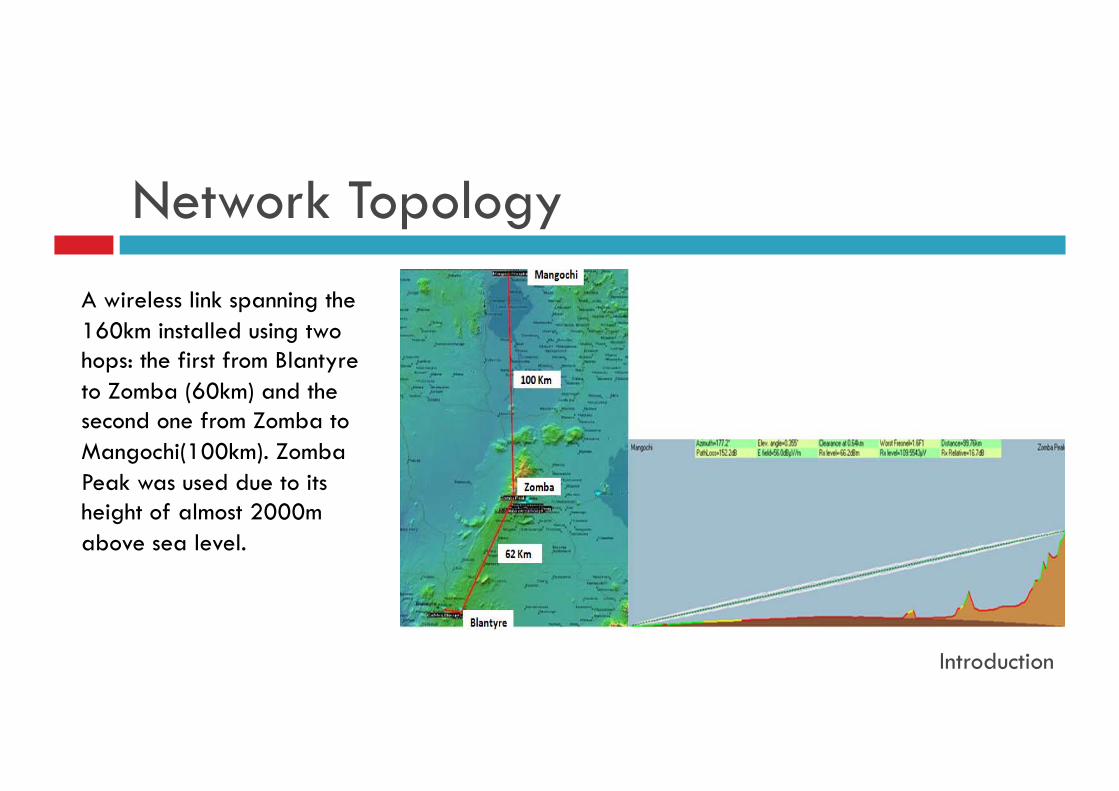
Network Topology
Introduction
A wireless link spanning the 160km installed using two hops: the first from Blantyre to Zomba (60km) and the second one from Zomba to Mangochi(100km). Zomba Peak was used due to its height of almost 2000m above sea level.
Malaria Network in Malawi
Introduction
Implementation: The initial idea was to provide internet connectivity in Mangochi via the College of Medicine in Blantyre and to install video-chat software on the doctors' PCs. After a second visit in 2010, it was decided to install video IP phones and to connect smaller clinics around Mangochi to include them in a malaria database system. Bandwidth demand has thus grown in just one year, so the broadband request proved to be important.
Sustainability: The low cost requirement had to do with the limited budget available but also to the sustainability of the network. If the network has to be locally maintained and expended, low cost was paramount. The new connections deployed in 2011 were possible because additional equipment was provided in 2009 due to its low cost.
Malaria Network in Malawi
Introduction
Deploying two long Wi-Fi links presents technical and logistical issues. Antenna pointing: the antenna pointing that at long distances is a very delicate matter. Logistical issues have to do with moving more than 300kg of equipment around the country and with getting the approval of the telecom operators to use their commercial towers. Human capacity: Human capacity building is required for the link to be maintained after the installation. This required that a team of highly skilled engineers be trained. ICTP considered this as a priority, and several training activities have been organized for Malawian engineers. Since the initial planning, two requirements have been considered as mandatory: the link had to provide a broadband connection to allow future, unpredictable, uses of the network and the equipment had to be low cost.
Malaria Network in Malawi: Impact
Introduction
Impact: A successful example of output of this project is the connection to St Martin’s hospital. This is a remote clinic, in the Mangochi area, which did not have any internet connection. Bringing fiber to the clinic is out of discussion due to its remoteness and to the little economic value an operator would gain from the connection. A team of local engineers deployed a 10km wireless link and were able to connect the clinic to the main wireless backbone installed in 2009. The doctor at St Martin’s hospital is now able to video-chat with his colleagues in Blantyre for consultation. Data on malaria cases are now electronically gathered on a weekly basis and transmitted to the Malawi ministry of health. Before the network was deployed, this was done manually with long delays.
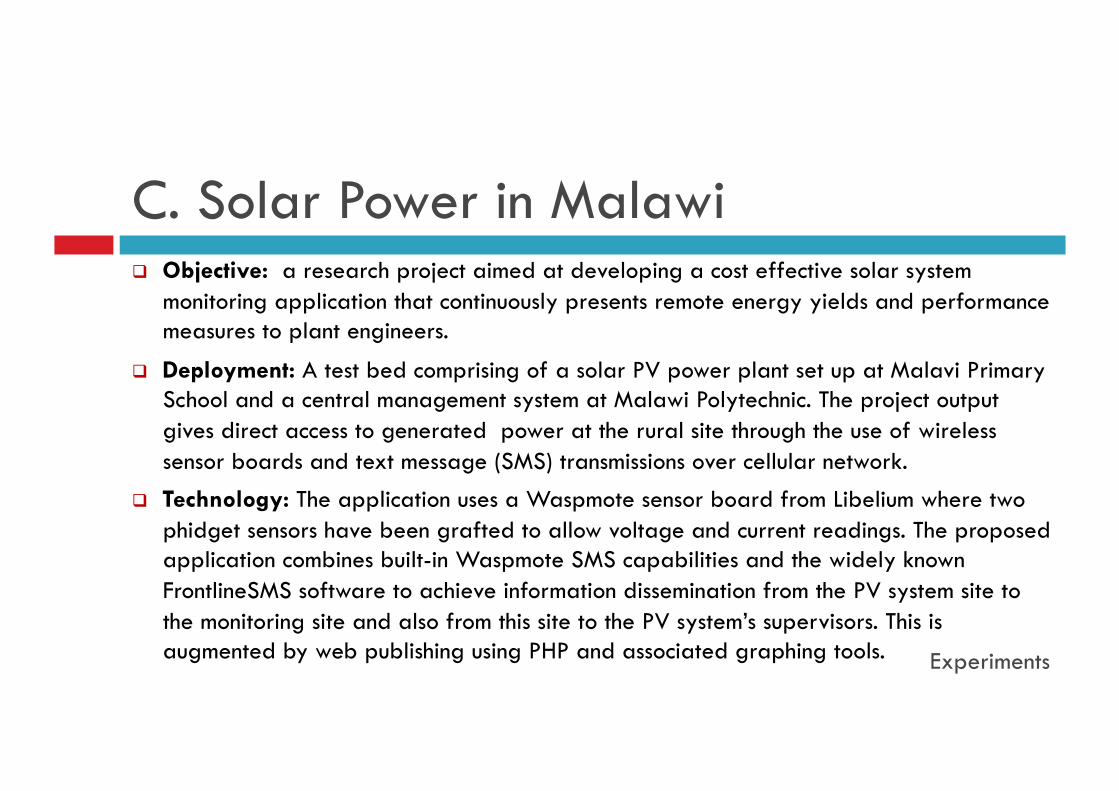
C. Solar Power in Malawi Objective: a research project aimed at developing a cost effective solar system
monitoring application that continuously presents remote energy yields and performance measures to plant engineers.
Deployment: A test bed comprising of a solar PV power plant set up at Malavi Primary School and a central management system at Malawi Polytechnic. The project output gives direct access to generated power at the rural site through the use of wireless sensor boards and text message (SMS) transmissions over cellular network.
Technology: The application uses a Waspmote sensor board from Libelium where two phidget sensors have been grafted to allow voltage and current readings. The proposed application combines built-in Waspmote SMS capabilities and the widely known FrontlineSMS software to achieve information dissemination from the PV system site to the monitoring site and also from this site to the PV system’s supervisors. This is augmented by web publishing using PHP and associated graphing tools. Experiments
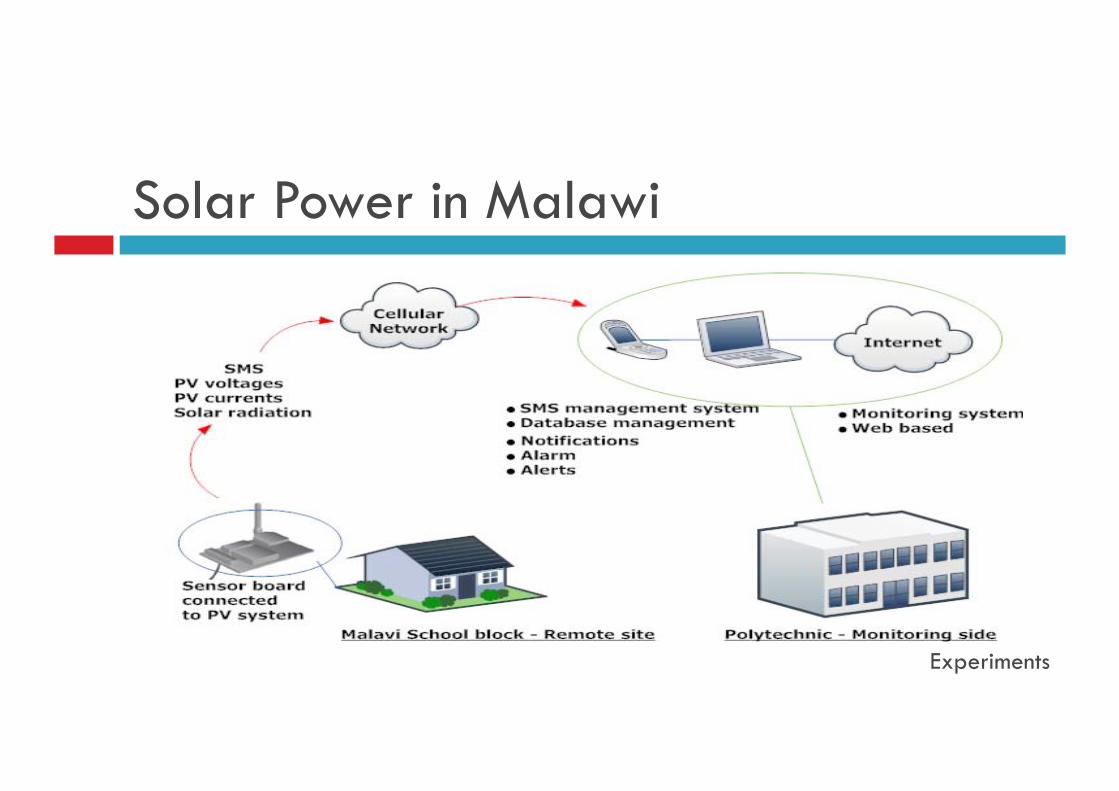
Solar Power in Malawi
Experiments
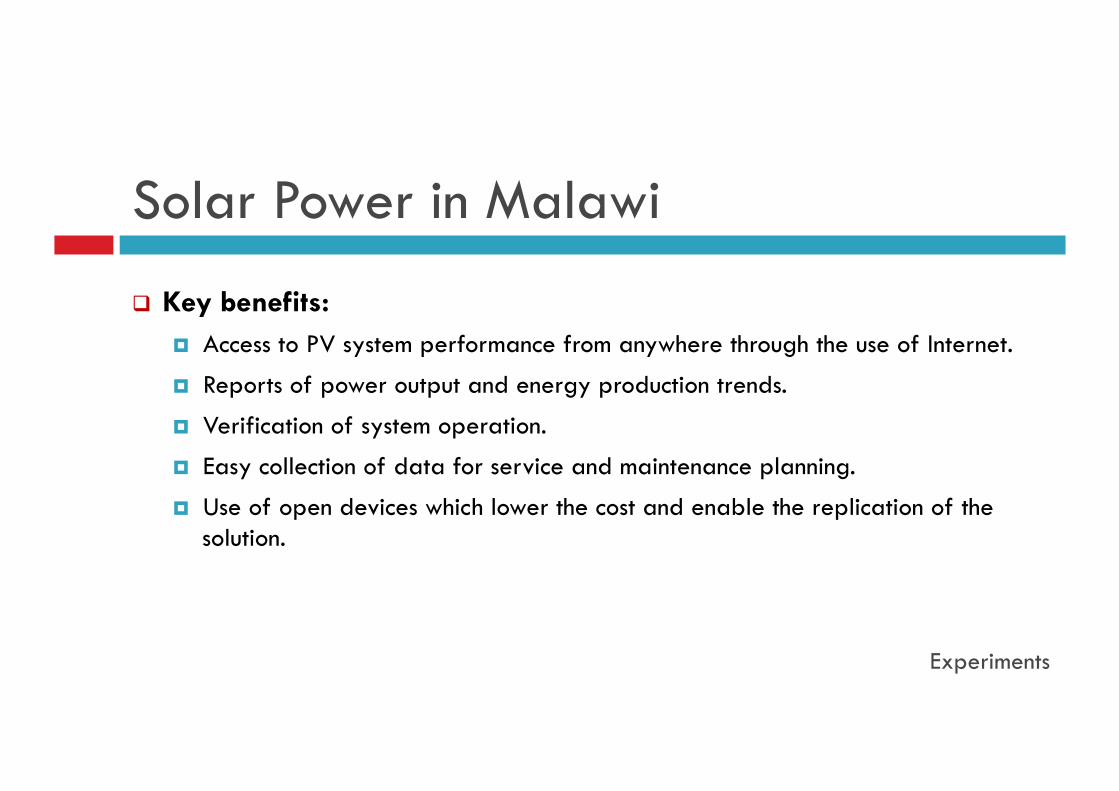
Solar Power in Malawi
Key benefits: Access to PV system performance from anywhere through the use of Internet.
Reports of power output and energy production trends.
Verification of system operation.
Easy collection of data for service and maintenance planning.
Use of open devices which lower the cost and enable the replication of the solution.
Experiments
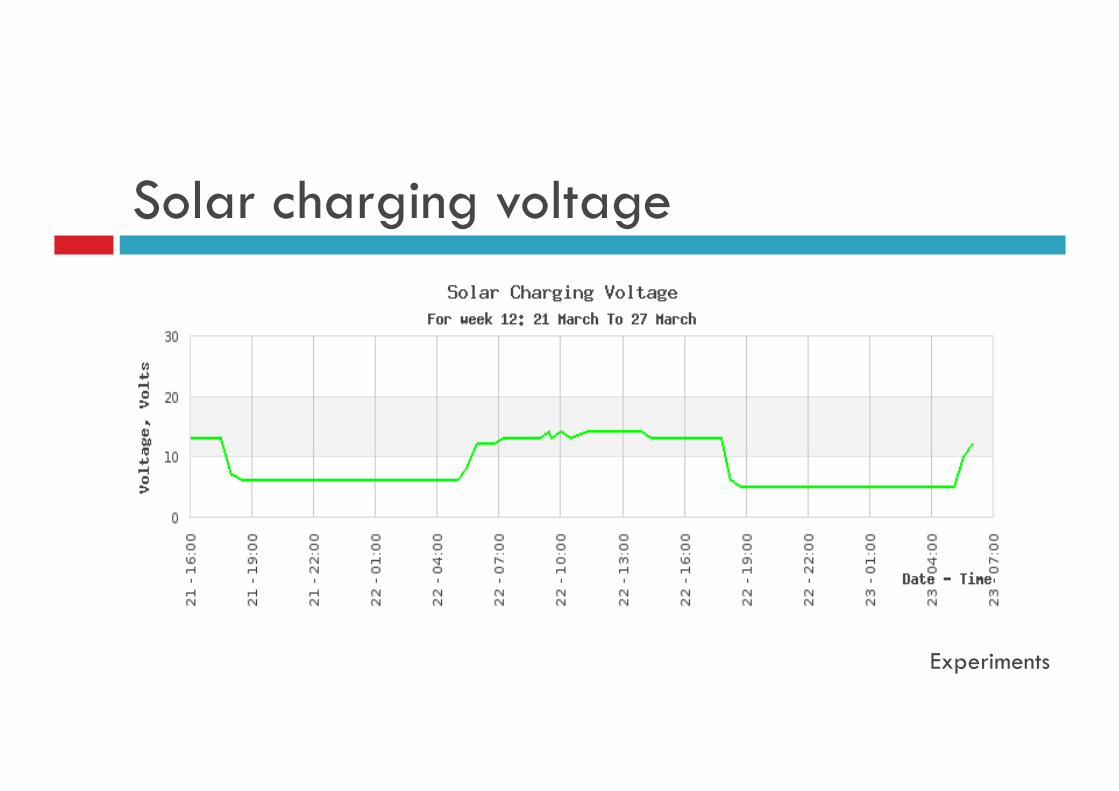
Solar charging voltage
Experiments
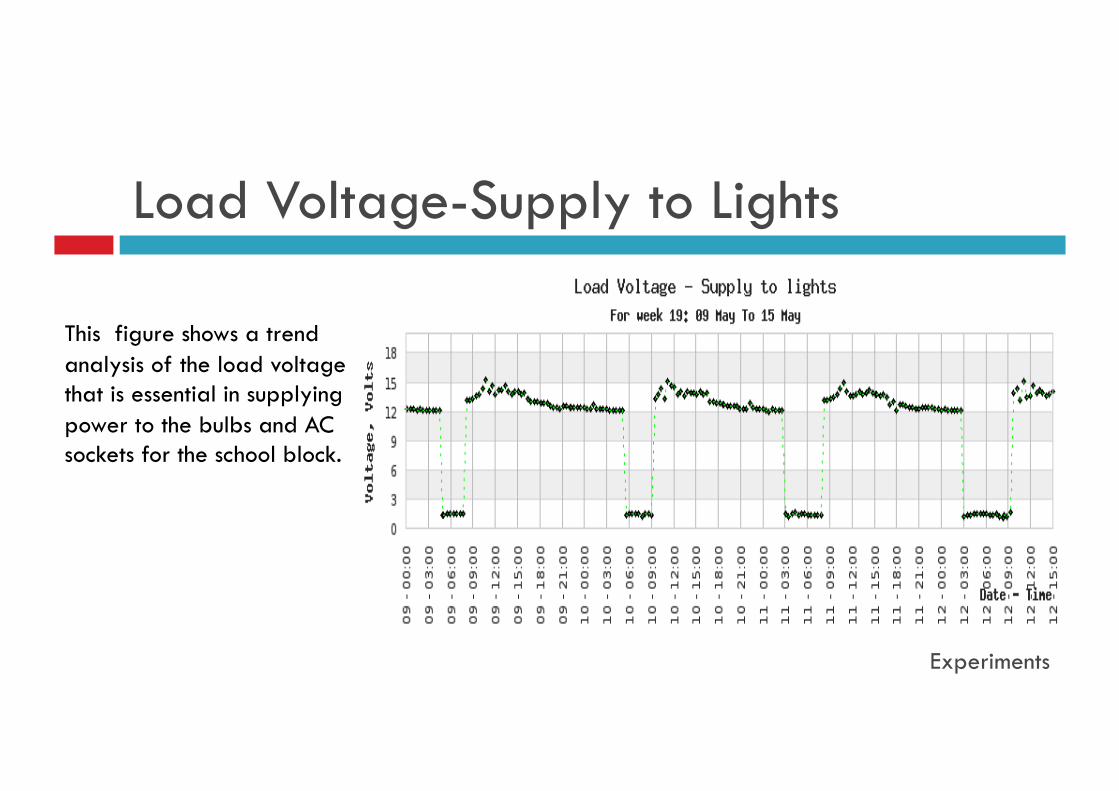
Load Voltage-Supply to Lights
Experiments
This figure shows a trend analysis of the load voltage that is essential in supplying power to the bulbs and AC sockets for the school block.
Solar Power in Malawi
Experiments
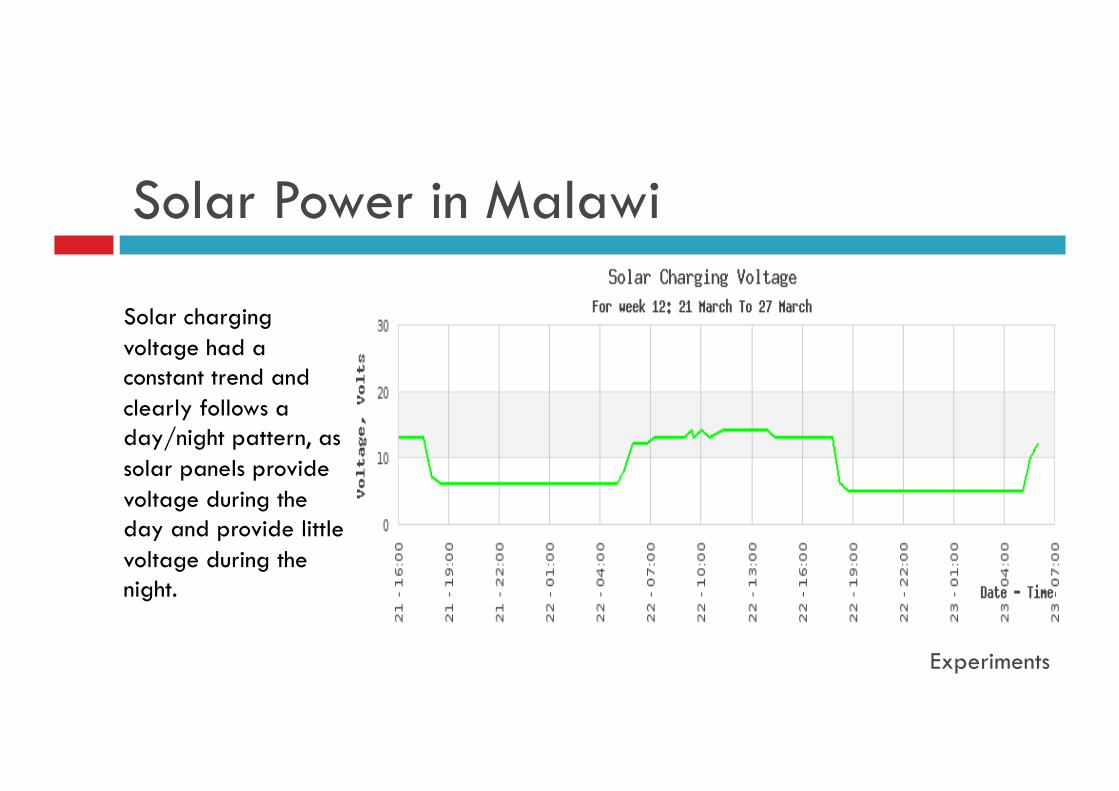
Solar charging voltage had a constant trend and clearly follows a day/night pattern, as solar panels provide voltage during the day and provide little voltage during the night.
Solar Power in Malawi: Impact
Experiments
Impact Accuracy: the results on solar charging and load voltages serves as a tip of the iceberg on the accuracy of the remote monitoring application. Management cost: the monitoring system has proved to lower management cost as timely information reaches the group at the Polytechnic right in front of their work stations. This assists in alerting the technical team of remote circumstances and also eases system study time for the researchers. Replication: On the other hand, the use of GSM communication allows for easy system replication to other remote rural renewable plants.
D. Pollution Monitoring in Cape Town Objective: Assess the relevance of using sensor networking in pollution
monitoring with the aim of bridging the visibility gap and protecting citizens health: detect pollution hotspots in cities and help in city planning when planning new housing developments.
Technology: Waspmote from a Spanish company called Linelium and Telit modems from an Italian company. Waspmotes are equipped with GPRS, GPS, SD card and use ZigBee communication.
Implementation: Mobile pollution monitoring system carried by the Bus of the university of Cape Town NGO called SHAWCO. Data captured is stored on SD card and opportunistically dropped into the gateway using either ZigBee or GPRS.
Experiments
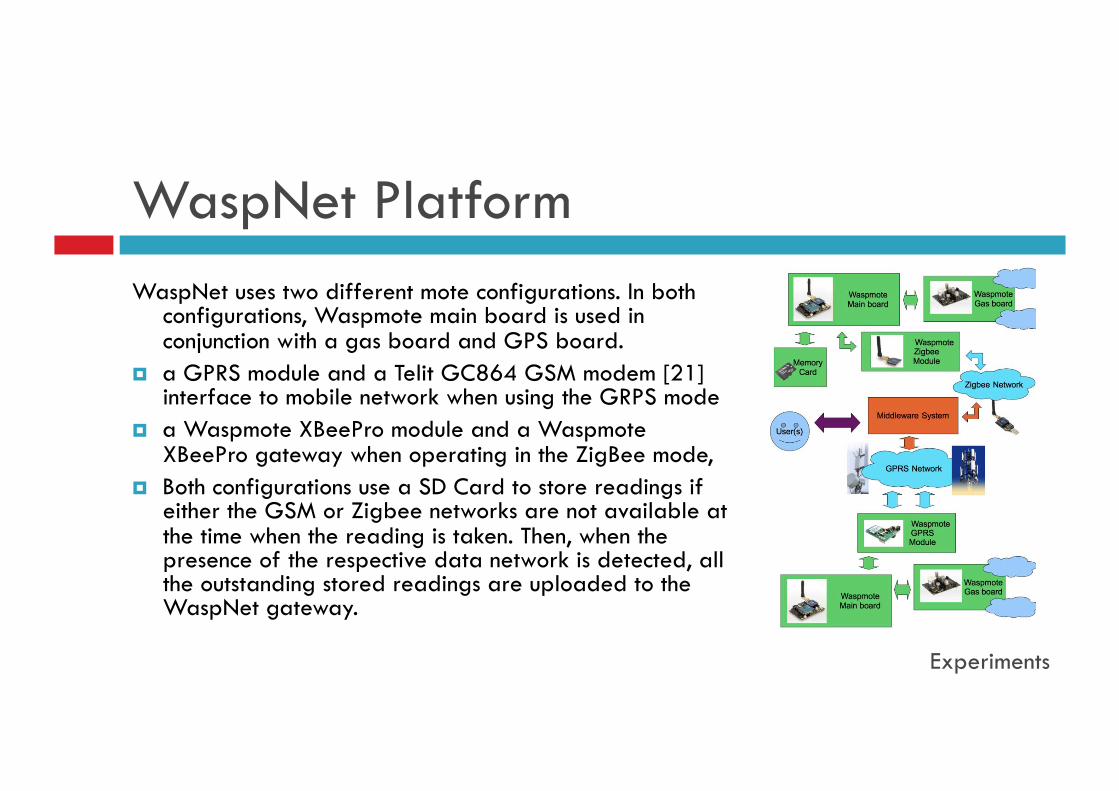
WaspNet Platform WaspNet uses two different mote configurations. In both
configurations, Waspmote main board is used in conjunction with a gas board and GPS board.
a GPRS module and a Telit GC864 GSM modem [21] interface to mobile network when using the GRPS mode
a Waspmote XBeePro module and a Waspmote XBeePro gateway when operating in the ZigBee mode,
Both configurations use a SD Card to store readings if either the GSM or Zigbee networks are not available at the time when the reading is taken. Then, when the presence of the respective data network is detected, all the outstanding stored readings are uploaded to the WaspNet gateway.
Experiments
Pollution Maping
Experiments
Two types of clouds are used: those without circles representing the pollutant levels taken in Zigbee mode and the ones with circles within them which present the pollutant levels taken in GPRS mode. The readings were averaged at a particular point if multiple readings were taken at that geographic location and the time label considered was the one of the last reading taken at that point. Looking at the pollution map depicted by the pollution map, one should note that the sensor responds to the levels of the whole group of the gases, and so is a composite value of the various gas concentrations present. While this doesn’t allow for accurate measurement of the level of a particular gas, it does give an effective “neighborhood” which the various gas levels fall within, and thus an indication of the level of air pollution.
Pollution Maping
Experiments
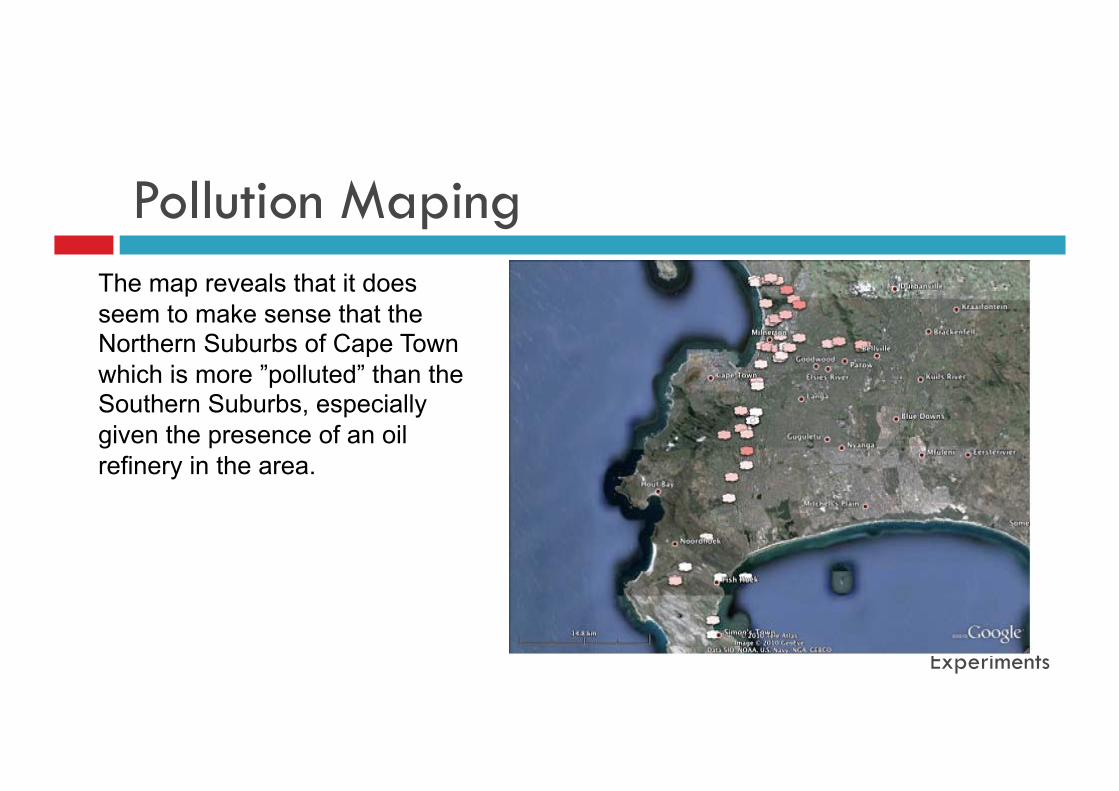
The map reveals that it does seem to make sense that the Northern Suburbs of Cape Town which is more ”polluted” than the Southern Suburbs, especially given the presence of an oil refinery in the area.
IV. Conclusion and Future Work This paper reflects on the impact of ICTs on the Digital Divide in Africa and
building upon successful deployments on the African continent it further presents some guidelines on how the digital divide might be filled.
There is a need of appropriate ICT policies and strategies to mitigate the worse socio - economic status that can be promoted by the digital divide.
It has been discussed that factors contributing to these challenges are largely related to high cost of both infrastructure and connectivity.
There is great need for coordinated approaches together with skilled human resources across the sectors to allow efficient use of ICTs.
As Internet based information is dependent on electrical power; we suggest taping into the potential offered by Solar energy to fill the gap left by the lack of utility grid infrastructure in order to reach out to the rural communities.
Conclusion
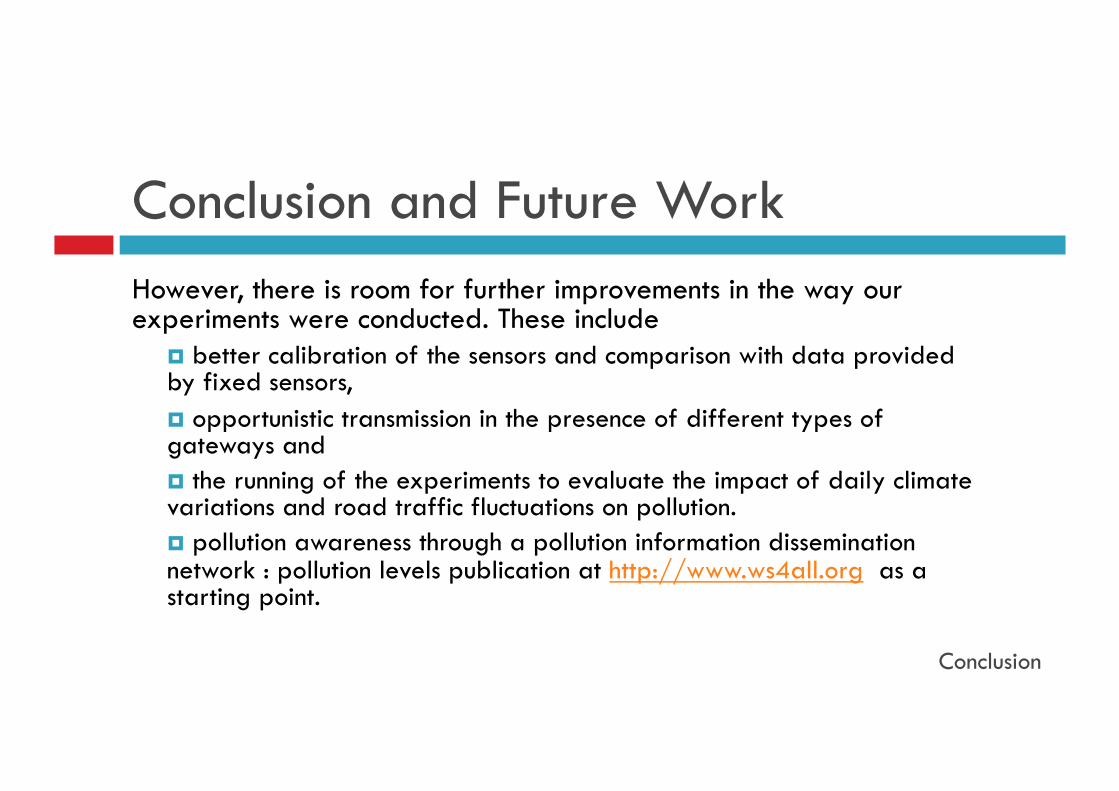
Conclusion and Future Work However, there is room for further improvements in the way our experiments were conducted. These include
better calibration of the sensors and comparison with data provided by fixed sensors, opportunistic transmission in the presence of different types of gateways and the running of the experiments to evaluate the impact of daily climate variations and road traffic fluctuations on pollution. pollution awareness through a pollution information dissemination network : pollution levels publication at http://www.ws4all.org as a starting point.
Conclusion
References [9] Burke, J., Estrin, D., Hansen, M., Parker, A., Ramanathan, N., Reddy, S., and Srivanstava, N.B. Participatory sensing. In
Proceedings of the World Sensor Web Workshop, ACM SENSYS (Boulder, CO, 2006);
[10] K. Shilton, J.A. Burke, D. Estrin, M. Hansen, and M. Srivastava. Participatory Privacy in Urban Sensing. In Proceedings of the MODUS Workshop, St. Louis, Missouri, 2008.
[11] Campbell, A.T., Eisenman, S.B., Lane, N.D., Miluzzo, E., and Peterson, R. People-Centric Urban Sensing. In Proceedings of the 2nd ACM/IEEE Annual International Wireless Internet Conference (Boston, MA, Aug. 25, 2006).
[12] Reddy, S., G. Chen, B. Fulkerson, S.-J. Kim, U. Park, N. Yau, J. Cho, M. Hansen and J. Heidemann. Sensor-Internet share and search: Enabling collaboration of citizen scientists. In Proceedings of theWorkshop for Data Sharing and Interoperability, 2007.
[13] http://www.pm-air.net/, last accessed 28 Sept 2010.
[14] http:////bioinf.ncl.ac.uk/message/?q=node/5, last accessed 28 Sept 2010.
[15] Air Quality Index: A Guide to Air Quality and Your Health, AIR NOW, http://airnow.gov/index.cfm?action=static.aqi¿
[16] N. Kushalnagar et al, IPv6 over Low-Power Wireless Personal Area Networks (6LoWPANs): Overview, Assumptions, Problem Statement, and Goals, IETF Request for Comments, http://datatracker.ietf.org/doc/rfc4919/, August 2007.
References [1] http://www.policyalmanac.org/environment/archive/epa clean air act.shtml, last accessed 28 September 2010.
[2] Kaj Roholm, The Fog Disaster in the Meuse Valley, 1930: A Fluorine Intoxication , http://www.fluoridealert.org/meuse.htm, last accessed 28 September 2010.
[3] Dr. Hajime Akimoto & Dr. James Oliver Wild, Effective Control of Global Warming by Simultaneous Reduction of NOx and CO Emissions: Development of a Method for Assessing the Impact of Air Pollutant Gases on Global Warming, http://www.jamstec.go.jp/frcgc/eng/akimoto/010502/, last accessed 28 Sept 2010.
[4] Ground Level Ozone, Environmental Protection Agency, http://www.epa.gov/air/ozonepollution/, last accessed 28 September 2010.
[5] http://www.epa.gov/air/caa/, last accessed 28 September 2010.
[6] http://www.epa.gov/, last accessed 28 September 2010.
[7] Six Common Air Pollutants, Environmental Protection Agency, http://www.epa.gov/air/urbanair/nox/hlth.html, last accessed 28 September 2010.
[8] A. van Donkelaar et al, Global Estimates of Ambient Fine Particulate Matter Concentrations from Satellite-Based Aerosol Optical Depth: Development and Application, in Environmental Health Perspectives, Vol. 118, Number 6 , June 2010.
References [17] ITU-T, Ubiquitous Sensor Networks (USN), ITU-T Watch Briefing Report Series, No. 4, February 2008.
[18] http://peir.cens.ucla.edu/, last accessed 10 May 2010.
[19] http://www.libelium.com, last accessed 10 May 2010.
[20] http://www.digi.com/products/wireless/zigbee-mesh/, last accessed 10 May 2010.
[21] Telit GC864, http://www.telit.com/en/products.php?pid = 3&pac=show&p=12, last accessed 10 May 2010.