Embed Size (px)
Citation preview
Breast Cancer Screening Behaviours and Outcomes in Women with a Family History of Breast and/or
Ovarian Cancer in Ontario
by
Meghan Jane Walker
A thesis submitted in conformity with the requirements for the degree of Doctor of Philosophy
Dalla Lana School of Public Health University of Toronto
© Copyright by Meghan Jane Walker 2014
ii
Breast Cancer Screening Behaviours and Outcomes in Women
with a Family History of Breast and/or Ovarian Cancer in Ontario
Meghan Jane Walker
Doctor of Philosophy
Dalla Lana School of Public Health
University of Toronto
2014
Abstract
Having a family history of breast and/or ovarian cancer is one of the most important risk factors
for developing breast cancer. It is unknown if the survival benefit from mammography
screening extends to women with a family history, and if prognostic features differ by level of
familial risk. The relationship between perceived breast cancer risk and breast screening has
been widely studied in women with familial risk; however, most studies are cross-sectional,
precluding insight into the directionality of this relationship. The objectives of this thesis were
to: examine the impact of mammography screening and familial risk on diagnoses and
prognostic features of breast cancer and benign breast disease (BBD); and examine the effect of
perceived risk on breast screening. An additional methodological objective was to evaluate the
validity of self-reported mammogram data. The data source for this thesis was the Family
History Study (FHS), a prospective cohort study of women from the Ontario site of the Breast
Cancer Family Registry with a family history of breast/ovarian cancer. Women with high
familial risk were more likely to be diagnosed with breast cancer (OR = 2.84; 95% CI:1.50-
5.38), or BBD (OR = 1.94; 95% CI:1.03-3.66), than women with low/moderate risk. No
significant differences were detected in prognostic features by level of risk; however,
iii
symptomatic cancers were larger (OR = 9.72; 95% CI:1.01-93.61) and diagnosed at a later stage
(OR = 7.80; 95% CI:1.18-51.50) than screen-detected cancers. In low risk women, women who
perceived their risk as >50% were more likely to have a mammogram (OR = 1.13; 95% CI:0.59-
2.16), and clinical breast examination (CBE (OR = 1.11; 95% CI:0.63-1.95) than women who
perceived their risk as 50%. In moderate/high risk women, women who perceived their risk as
>50% were less likely to have a mammogram (OR = 0.70; 95% CI:0.40-1.20), and CBE (OR =
0.52; 95% CI:0.30-0.91) than women who perceived their risk as 50%. Over 90% of women in
the FHS accurately reported their mammogram use in the previous year. Together, these studies
make an important contribution to understanding the effectiveness and use of breast screening in
women with familial risk.

iv
For Ernest Sinclair, who instilled in me the importance of education

v
Acknowledgements
I am grateful to numerous people who made completion of this thesis possible.
My foremost thanks are owed to my supervisor, Dr. Anna Chiarelli, for her daily guidance,
support, and patience throughout this journey. Anna, I am grateful for your mentorship, and I
look forward to future collaborations in cancer screening.
I would also like to acknowledge my advisory committee, Drs. Julia Knight, and Lucia Mirea,
for their instrumental role in guiding my thesis project, and meticulous review at every stage.
Special thanks are owed to Dr. Mirea for the time she has generously spent working with me to
navigate biostatistical issues.
Many thanks are owed to Drs. Heather Bryant, Jason Pole, Shelley Harris, and Rayjean Hung
for the time they dedicated to the critical review of my thesis, their participation in my
examinations, and thoughtful recommendations to improve the thesis.
I would like to acknowledge Drs. Paul Ritvo, Irene Andrulis, and Frances O’Malley, as well as
Gord Glendon, for their valuable contributions as co-authors to the research products of this
thesis. I am also indebted to Nancy Deming for the invaluable organizational support she
provided at Cancer Care Ontario.
I would like to acknowledge the financial support I received, namely the Doctoral Fellowship
from the Canadian Breast Cancer Foundation - Ontario Region, and Open Fellowships from the
University of Toronto. Thanks also go to Cancer Care Ontario for twice awarding me the A.H.
Sellers Travel Award, as well as the International Cancer Screening Network for awarding me a
Junior Investigator Scholarship.
I must thank my parents and sister for their enduring support and encouragement during the past
five years. Thank you to my friends for helping me maintain balance in my life. Thank you to
my fellow PhD students for your contributions and advice. I extend my deepest gratitude to
Philip Eley, for both his technical and emotional support throughout this journey.
Lastly, I am grateful to all of the women who shared their time and experience by participating
in this important study.
vi
Table of Contents
Abstract ......................................................................................................................................... ii
Acknowledgements....................................................................................................................... v
List of Tables ............................................................................................................................... ix
List of Figures .............................................................................................................................. xi
List of Appendices ...................................................................................................................... xii
List of Abbreviations ................................................................................................................. xiii
Chapter 1 Introduction and Objectives ........................................................................................ 1
1.1 Introduction ..................................................................................................................... 1
1.2 Study Objectives .............................................................................................................. 3
Chapter 2 Background and Literature Review ............................................................................ 5
2.1 Epidemiology of Breast Cancer ....................................................................................... 5
2.1.1 Anatomy ................................................................................................................ 5
2.1.2 Tumor Features ...................................................................................................... 6
2.1.3 Histological Type .................................................................................................. 9
2.1.4 Molecular Factors .................................................................................................. 9
2.1.5 Benign Breast Disease ......................................................................................... 10
2.1.7 Familial Breast Cancer ........................................................................................ 12
2.2 Screening for Breast Cancer .......................................................................................... 16
2.2.1 Evidence for the Effectiveness of Breast Cancer Screening ............................... 16
2.2.2 Potential Harms of Breast Cancer Screening ...................................................... 24
2.2.3 Breast Cancer Screening Recommendations in Canada ...................................... 27
2.2.4 Breast Cancer Screening in Canada .................................................................... 29
2.3 Breast Cancer Screening Use and Predictors of Use ..................................................... 31
2.3.1 Participation in breast cancer screening .............................................................. 31
2.3.2 Familial breast cancer risk and participation in breast cancer screening ............ 34
2.3.3 Behavioural factors and breast cancer screening ................................................. 35
2.3.4 Manuscript 1: Perceived risk and adherence to breast cancer screening guidelines
among women with a familial history of breast cancer: A review of the literature ..... 39
vii
2.4 Summary of Evidence and Rationale for the Current Study ......................................... 66
Chapter 3 Study Methods .......................................................................................................... 70
3.1 Summary of Study Design and Data Source ................................................................. 70
3.2 Study Population and Sample ........................................................................................ 71
3.2.1 Ontario site of the Breast Cancer Family Registry .............................................. 71
3.2.2. Family History Study ......................................................................................... 73
3.3 Data Collection .............................................................................................................. 74
3.4 Variable Definitions ...................................................................................................... 76
3.4.1 Familial Breast Cancer Risk Classification ......................................................... 76
3.4.2 Breast Cancer Screening Measures ..................................................................... 79
3.4.3 Pathologic Measures ............................................................................................ 80
3.4.4 Perceived Breast Cancer Risk Measures ............................................................. 82
3.4.5 Potential Confounders ......................................................................................... 84
3.5 Statistical Analysis ........................................................................................................ 86
3.5.1 Descriptive Analyses ........................................................................................... 86
3.5.2 Univariate Tests of Association and Logistic Regression Analyses ................... 87
Objective 1.................................................................................................................... 87
3.5.3 Clustering ............................................................................................................ 90
3.5.4 Data Quality Analyses ......................................................................................... 93
3.6 Ethical Approval ............................................................................................................ 94
Chapter 4 Results ..................................................................................................................... 105
4.1 Overview of Results .................................................................................................... 105
4.2 Manuscript 2: Impact of familial risk and mammography screening on prognostic
indicators of breast disease among women from the Ontario site of the Breast Cancer
Family Registry ................................................................................................................. 106
4.3 Manuscript 3: Does perceived risk predict breast cancer screening use? Findings from a
prospective cohort study of female relatives from the Ontario site of the Breast Cancer
Family Registry ................................................................................................................. 131
4.4 Manuscript 4: Accuracy of self-reported screening mammography use: examining recall
among female relatives from the Ontario site of the Breast Cancer Family Registry. ...... 152
viii
Chapter 5 Discussion and Conclusions ................................................................................... 174
5.2 Limitations and Methodological Issues ....................................................................... 178
5.2.1 Selection Bias .................................................................................................... 178
5.2.2 Information Bias ................................................................................................ 182
5.2.3 Confounding ...................................................................................................... 187
5.2.4 Effect Modification & Statistical Interaction .................................................... 189
5.2.5 Analytical Issues ................................................................................................ 191
5.2.6 General Limitations ........................................................................................... 195
5.2.7 External Validity ............................................................................................... 196
5.3 Study Strengths ............................................................................................................ 197
5.4 Implications for Epidemiology and Public Health, and Future Directions ................. 198
Chapter 6 Contribution to the Design and Conduct of the Thesis Project .............................. 203
References ................................................................................................................................ 204
Appendices ............................................................................................................................... 230
ix
List of Tables
Chapter 2
Table 2.1. Summary of breast cancer screening recommendations for women with a family
history of breast and/or ovarian cancer………………………………….…………...68
Manuscript 1
Table 1. Perceived risk of breast cancer (numeric scale) and adherence to mammography
guidelines………………………………...……….………………...……………...…..60
Table 2. Perceived risk of breast cancer (verbal scale) and adherence to mammography
guidelines …………………………………………………………………..………….61
Table 3. Perceived risk of breast cancer and adherence to clinical breast examination (CBE)
guidelines…....................................................................................................................63
Table 4. Perceived risk of breast cancer and adherence to breast self-examination (BSE)
guidelines……….………………………………………………..…………………….64
Chapter 3
Table 3.1. Moderate/high-risk criteria for the Ontario site of the Breast Cancer Family
Registry……………………..………………………………………………………..95
Table 3.2. Classification scheme of familial breast and/or ovarian cancer risk………….……. 96
Table 3.3. Summary of breast cancer assessment models…………………………………........97
Table 3.4 TNM classification for breast cancer from the AJCC Cancer Staging Manual……...98
Table 3.5 Stage grouping for breast cancer from the AJCC Cancer Staging Manual………....101
Chapter 4
Manuscript 2
Table 1. Classification of familial risk of breast and/or ovarian cancer……………..………...126
Table 2. Breast cancer risk factors and mammography practices at baseline by level of familial
breast cancer risk and screening status…………………........……………………….127
Table 3. Adjusted odds ratios (OR) and 95% confidence intervals (CI) for associations between
level of familial breast cancer risk and diagnosis of breast cancer or benign breast
disease…………………………..…………………………………………….....…....128
x
Table 4. Prognostic characteristics of pathologically-confirmed breast outcomes by level of
familial breast cancer risk and screening status………….……..…………………….129
Manuscript 3
Table 1. Classification of familial risk of breast and/or ovarian cancer among female relatives
from the Ontario site of the Breast Cancer Family Registry………...……………….149
Table 2. Distribution of baseline characteristics by level of perceived breast cancer risk for
female relatives from the Ontario site of the Breast Cancer Family Registry………..150
Table 3. Adjusted odds ratios and 95% confidence intervals for associations between baseline
perceived breast cancer risk and adherence to breast cancer screening guidelines at
Year 1 for female relatives from the Ontario site of the Breast Cancer Family
Registry……………………………………………………………………………….151
Manuscript 4
Table 1. Classification of familial risk of breast and/or ovarian cancer………………..……...168
Table 2. Distribution of socio-demographic, health behavior, and cancer screening
characteristics for female relatives of the Ontario site of the Breast Cancer Family
Registry…………………………………………………………………………….…169
Table 3. Accuracy of screening mammography date recall among female relatives from the
Ontario site of the Breast Cancer Family Registry………….………………………..170
Table 4. Accuracy of self-reported adherence to screening mammography guidelines among
female relatives from the Ontario site of the Breast Cancer Family Registry…..……171
Table 5. Associations between screening mammography date recall and socio-demographic,
health behavior, and cancer screening characteristics for female relatives from the
Ontario site of the Breast Cancer Family Registry..……………………………....….172
Appendix E
Table 1. Factors Associated with Participation in the Family History Study…………..……...255
Appendix G
Table 1. Missing data for variables used in Objective 1 analyses…………..…………………259
Table 2. Missing data for variables used in Objective 2 analyses…………..…………………260
Table 3. Missing data for variables used in Objective 3 analyses……………………..………261
xi
List of Figures
Chapter 2
Manuscript 1
Figure 1. Flow diagram of study selection process…………………………….……………….59
Chapter 3
Figure 3.1. Recruitment flowchart for the Ontario site of the Breast Cancer Family Registry..102
Figure 3.2. Sample flow diagram for the Family History Study……………...……………… 103
Figure 3.3. Distribution of numeric perceived breast cancer risk at baseline…………..…..….104
xii
List of Appendices
Appendix A. Family History Study Grant Abstract ................................................................. 230
Appendix B. Family History Study - Baseline Personal History and Screening
Questionnaire ....................................................................................................... 231
Appendix C. Family History Study - Pathology Consent Form ............................................... 253
Appendix D. Family History Study - Imaging Consent Form ................................................. 254
Appendix E. Factors Associated with Participation in the Family History Study ................... 255
Appendix F. Ethical Approval .................................................................................................. 257
Appendix G. Missing Data ....................................................................................................... 259
xiii
List of Abbreviations
ATM ataxia telangiectasia mutated
AUC area under the curve
BBD benign breast disease
BCFR Breast Cancer Family Registry
BI-RADS Breast Imaging - Reporting and Data System
BOADICEA Breast and Ovarian Analysis of Disease Incidence and Carrier Estimation
Algorithm
BRCA1 breast cancer 1 gene
BRCA2 breast cancer 2 gene
BRIP1 BRCA1 interacting protein C-terminal helicase 1
BSE breast self-examination
CBE clinical breast examination
CCHS Canadian Community Health Survey
CCS Canadian Cancer Society’s Advisory Committee on Cancer Statistics
CHEK2 checkpoint kinase 2
CI confidence interval
CPAC Canadian Partnership Against Cancer
CR computed radiography
DCIS ductal carcinoma in situ
DR direct radiography
ER estrogen receptor
ERBB2 v-erb-b2 avian erythroblastic leukemia viral oncogene homolog 2
FHQ Family History Questionnaire
FHS Family History Study
FISH fluorescence in situ hybridization
GWAS genome-wide association study
HBM Health Belief Model
HER-2/neu human epidermal growth factor receptor 2
HRT hormone replacement therapy
xiv
IBIS International Breast Intervention Study
IHC immunohistochemistry
IHF independent health facility
LCIS lobular carcinoma in situ
MAR missing at random
MARIBS MRI breast imaging screening study
MCAR missing completely at random
MNAR missing not at random
MRI magnetic resonance imaging
NICE National Institute for Care and Excellence
NNS number needed to screen
NST no special type
OBSP Ontario Breast Screening Program
OCR Ontario Cancer Registry
OHIP Ontario Health Insurance Plan
OR odds ratio
PALB2 partner and localizer of BRCA2
PHQ Personal History Questionnaire
PHSQ Personal History and Screening Questionnaire
PR progesterone receptor
PTEN phosphatase and tensin homolog
PTNM pathological classification system of staging tumors
RAD51C RAD51 paralog C
RCT randomized controlled trial
ROC receiver operating characteristic
RR relative risk
TNM classification system of staging tumors
TP53 tumor protein 53
WHO World Health Organization
1
Chapter 1 Introduction and Objectives
1.1 Introduction
Breast cancer is the leading incident cancer and second-leading cause of cancer death among
Canadian women (Canadian Cancer Society’s Advisory Committee on Cancer Statistics [CCS],
2014). Having a family history of breast cancer has been established as one of the most important
risk factors for developing breast cancer (Collaborative Group on Hormonal Factors in Breast
Cancer, 2001; Pharoah et al., 1997). A mortality benefit from screening mammography in
women at average risk of developing breast cancer has been established (Nelson et al., 2009;
Canadian Task Force on Preventive Health Care, 2011); however, the mortality benefit for
women with a family history of breast and/or ovarian remains unknown. Several studies have
found that women with a family history may benefit from regular breast cancer screening,
reporting higher cancer detection rates (Halapy et al., 2004; Kerlikowske et al, 2000) and
favourable prognostic features of screen-detected cancers (Randall et al., 2009; Møller et al.,
1998; Tilanus-Linthorst et al., 2000). The impact of level of familial risk on breast cancer
prognosis has not been previously examined.
Women with a family history of breast cancer are recommended to be screened for breast
cancer annually with mammography, clinical breast examination (CBE), and/or magnetic
resonance imaging (MRI) starting prior to age 50 years (Eccles et al., 2000; Warner et al., 1999a;
Chart & Franssen, 1997). North-American studies have demonstrated that many (45-64%)
women with familial risk do not undergo annual screening mammography (Campitelli et al.,
2011, Madlensky et al., 2005). The relationship between perceived risk of breast cancer and
breast cancer screening has been widely studied in women with a family history of breast cancer.
Most of these previous studies have been cross-sectional. As it is likely that women’s recent
2
breast cancer screening histories could influence perceived breast cancer risk, reverse causation
is an important concern. While four prospective studies have been conducted (Price et al., 2010;
Somers et al., 2009; Lemon et al., 2006; Diefenbach et al., 1999), their generalizability and
validity is limited. Somers et al. (2009) did not account for confounders, Difenbach et al. (1999)
included only women with very strong family histories from a high-risk clinical setting, and
Lemon et al. (2009) examined screening behaviours in the year following relative’s diagnosis of
breast cancer
Self-reported mammogram data are often relied on in epidemiologic research evaluating the
use of breast cancer screening. Only two studies (Pijpe et al., 2011; Larouche et al., 2012) have
validated self-reported mammogram dates in women with a family history of breast cancer, both
including only women with confirmed or suspected mutations in the breast cancer 1 gene
(BRCA1) or breast cancer 2 gene (BRCA2). These women likely differ in their breast cancer
screening behaviours, and ability to recall screening episodes compared with women in the
general population with familial risk.
The objectives of this thesis were developed to address identified gaps and methodological
limitations in the breast cancer screening literature. The overall aims of the thesis were to: (i)
develop a better understanding of the effectiveness of mammography screening, and impact of
level of familial risk on diagnoses and prognostic features of breast cancer and benign breast
disease; (ii) assess the effect of perceived risk on breast cancer screening use; and (iii) evaluate
the validity of self-reported screening mammogram data, in women with varying levels of
familial breast cancer risk.
3
1.2 Study Objectives
Objective 1. Examine the effect of mammography screening and familial risk on diagnoses and
prognostic features of breast outcomes in women with varying levels of familial breast cancer
risk
(i) Estimate associations between screening mammography and diagnoses of breast
outcomes (invasive and in-situ cancers, and benign breast disease).
(ii) Estimate associations between screening mammography and prognostic features of
cases of invasive breast cancer and benign breast disease.
(iii) Estimate associations between level of familial breast cancer risk and diagnoses of
breast outcomes (invasive and in-situ cancers, and benign breast disease).
(iv) Estimate associations between level of familial breast cancer risk and prognostic
features of cases of invasive breast cancer and benign breast disease.
Objective 2. Examine the effect of perceived breast cancer risk on participation in breast cancer
screening in women with varying levels of familial breast cancer risk
(i) Examine the association between perceived breast cancer risk and breast cancer
screening use in women with a family history of breast cancer through a systematic
review of published observational studies, and evaluate the quality of previous
literature.
(ii) Estimate associations between perceived lifetime breast cancer risk and subsequent
use of screening mammography, CBE, and genetic testing.
(iii) Examine whether the level of familial breast cancer risk modifies the association
between perceived breast cancer risk and breast cancer screening/genetic test use.
4
Objective 3. Examine the accuracy of self-reported screening mammogram dates in women with
varying levels of familial breast cancer risk
(i) Validate self-reported mammogram dates against dates abstracted from imaging
reports, and estimate the magnitude and direction of inaccurate recall of mammogram
dates.
(ii) Identify factors (socio-demographic characteristics, health and breast cancer
screening behaviours) associated with the accuracy of self-report.

5
Chapter 2 Background and Literature Review
2.1 Epidemiology of Breast Cancer
2.1.1 Anatomy
The female breast is composed of both epithelial elements, which include milk-producing
glands (lobules) and ducts, and stromal elements, which include adipose tissue, connective
tissue, and blood and lymphatic vessels (Colditz et al., 2006; Canadian Breast Cancer
Foundation, 2013). Breast development is regulated by hormones and growth factors; responding
selectively to hormonal stimuli with either cell proliferation or differentiation (Russo & Russo,
2002). Estrogens are known to play a significant role in promoting proliferation of both normal
and neoplastic breast cells (Russo & Russo, 2002). Breast cancer is a disease in which malignant
cells form in the breast tissue. Nearly all breast cancers (>95%) are epithelial in origin, and are
classified as adenocarcinomas (Colditz et al., 2006). Cancers of the breast are classified as in situ
(cancers which are contained within the breast lobule or duct) or invasive (cancers which are not
contained by the lobular or ductal walls and have invaded the breast stroma) (Colditz et al.,
2006). Lobular carcinoma in situ (LCIS) is not clinically detectable, as it rarely produces
abnormalities which present during mammography. Instead, LCIS is typically detected
incidentally during histologic examination of other breast lesions (Goldschmidt & Victor, 1996;
Vainio & Bianchini, 2002). LCIS increases the risk for subsequent invasive breast cancer in
either breast approximately 10-fold (Vainio & Bianchini, 2002; Page et al., 1991). Ductal
carcinoma in situ (DCIS) is characterized from low- to high-grade, and subtypes may have
different risks of subsequent invasive breast cancer (Vainio & Bianchini, 2002). Unlike LCIS,
6
invasive tumors subsequent to a diagnosis of DCIS often occur in the quadrant of the breast
where the DCIS lesion was initially located (Page et al., 1995).
Breast cancers are further subtyped based on their histopathology, molecular pathology,
genetic analysis or gene expression profiling. This is done to obtain detailed clinical and
prognostic information regarding tumor behaviour, for the prediction of tumor response to
specific therapeutic strategies, as well as prediction of overall outcome (Colditz et al., 2006;
Sims et al., 2008).
2.1.2 Tumor Features
Tumor size has long been recognized to be one of the most important prognostic
indicators. Larger breast cancer tumors are associated with poorer rates of survival compared
with tumors smaller in size (Soerjomataram et al., 2008; Fitzgibbons et al., 2000), and a dose-
response trend has been demonstrated (Soerjomataram et al., 2008). The absence or presence of
metastases to the regional lymph nodes is also of prognostic importance with regard to disease-
free and overall survival. While regional metastasis is partially a function of time (invasive breast
cancers are more likely to become node-positive the longer they exist in the preclinical phase),
nodal involvement is also considered to indicate a more biologically aggressive breast cancer
phenotype (Jatoi et al., 1999, Nassar et al., 2001). One previous study found average 10-year
survival for patients with node-negative breast cancers was 75%, but only 25-30% for patients
with node-positive disease (Rampaul et al., 2001). A similar trend is apparent with regard to
disease recurrence; one previous study found that while only 20-30% of node-negative patients
experienced recurrence of their breast cancer within 10 years, recurrence occurred for
approximately 70% of patients with node-positive breast cancers (Fitzgibbons et al., 2000). Rates
of survival have also been found to be poorer with increasing numbers of affected lymph nodes.

7
For example, previous studies have demonstrated that cases with four or more positive nodes
have poorer rates of 5-year (Jatoi et al., 1999; Fitzgibbons et al., 2000) and 10-year (Weiss et al.,
2003) survival compared with patients with 3 or fewer positive nodes. Survival of patients with
lymph node-positive breast cancer has improved with the revision of staging systems, and
systemic treatment approaches (Soerjomataram et al., 2008)
Staging of cancers is a method of determining the anatomic extent of a cancer based on
its natural history, which is relevant to therapeutic decision-making and determining overall
prognosis (Edge et al., 2010). TNM staging is determined by the combined score on three
components, including: tumor size (T), involvement of the regional lymph nodes (N) and
presence of distant metastasis (M) (Edge et al., 2010). The clinical TNM classification system is
based on evidence acquired from non-invasive diagnostic methods such as physical examination
or imaging, or more invasive methods such as biopsy (Beahrs, 1988). The clinical classification
system is prone to unreliability; there is clinical-pathological agreement on tumor size in only
54% of cases (Yorkshire Breast Cancer Group, 1980), and clinical assessment of lymph nodes is
not always accurate (i.e. positive nodes may be impalpable or negative nodes may be enlarged
due to benign changes) (Pinder et al., 2008). As such, the pathological TNM (pTNM) staging
system is recommended, which incorporates pathologic measurement of both tumor size and
lymph node status following surgical resection of the primary tumor and lymph nodes (Pinder et
al., 2008). The presence of metastatic disease is not typically assessed histologically, and thus the
clinical classification of distant metastasis is usually given by the “M” component (Pinder et al.,
2008). Breast cancers diagnosed at a later stage are associated with poorer prognosis. For
example, one population-based study of all cases of breast cancer in British Columbia in 2002
found that 10-year breast cancer survival rates by stage were above 99% for stage 0, 95% for
stage I, 81% for stage II, 55% for stage III, and 4% for stage IV (Davidson et al., 2013).

8
Histologic grade is also strongly associated with breast cancer survival and recurrence,
though not included in formal staging criteria due to concerns about its value for small tumors
(Rakha et al., 2008). The Elston-Ellis modification to the Scarff-Bloom-Richardson grading
system (Nottingham grading system) is the most commonly used histologic grading system; it is
recommended by the United Kingdom, the European Breast Screening Pathology Groups, the
United States Directors of Anatomic and Surgical Pathology, the Union for International Cancer
Control, and the World Health Organization (WHO) (Pinder et al., 2008). Histologic grading
takes into account three morphological features, including: tubule formation, nuclear
pleomorphism and mitotic count, each of which is assigned a score from 1 to 3 (Elston & Ellis,
1991). Tumors are considered well-differentiated if the overall score is 3 to 5 (histologic grade I),
moderately-differentiated if the score was 6 to 7 (histologic grade II) or poorly-differentiated if
the score was 8 to 9 (histologic grade III). A study by Rakha et al (2008) examined the
association between histologic grade and survival, finding survival was significantly decreased
for cancers with a histologic grade of II vs. 1 and III vs. 1. Rates of disease-free survival were
also poorer for breast cancers with higher histological grade, though this association only
reached statistical significance for grade III vs. 1 (Rakha et al., 2008). High mitotic activity index
has also been demonstrated to be associated with poorer prognosis (van Diest et al., 2004).
Lymphovascular invasion refers to the presence of tumor emboli within blood vessels or
lymphatic vessels. While not currently included in most staging systems, prognostic indices or
treatment guidelines, some studies have demonstrated that lymphovascular invasion is strongly
associated with survival (Rakha et al., 2012; Lee et al., 2006; Schoppmann et al., 2004), and
presence of distant metastases (Ragage et al., 2010). It has been suggested that lymphovascular
invasion may be as predictively important as lymph node involvement with regard to survival
(Pinder et al., 2008).
9
2.1.3 Histological Type
Breast cancer is a heterogeneous disease, demonstrating marked variability in its clinical
presentation and behaviour. Histologic typing may confer biological and prognostically
meaningful information (Ellis, 1992), in addition to that inferred by tumor morphology alone.
Invasive ductal carcinoma of no special type (NST) is the most common carcinoma of the breast,
accounting for 40% to 75% of invasive breast cancers (Ellis et al., 2003). NST is a diagnosis of
exclusion, referring to adenocarcinomas that do not exhibit characteristics to warrant
classification as a special type. Special types account for approximately 25% of all breast
cancers, and 18 special types are currently recognized by the WHO (Ellis et al., 2003). Some
special types, including tubular, mucinous, invasive cribriform, medullary, infiltrating lobular
and tubulo-lobular breast cancers have demonstrated more favourable prognoses compared with
NST (Vainio & Bianchini, 2002; Pereira et al., 1995). These cancers are typically diagnosed at
grade 1 and demonstrate rates of 10-year survival that generally exceed 80% (Pereira et al.,
1995). Alternatively, other special types, such as mixed or solid lobular, mixed ductal and
lobular, or ductal/NST have substantially lower rates of 10-year survival (Pereira et al., 1995).
Ten-year survival from inflammatory breast cancer is approximately 30% (Tai et al., 2005).
2.1.4 Molecular Factors
Breast cancers are further classified by their expression levels of steroid hormone
receptors (estrogen-receptors (ER) and progesterone-receptors (PR)) assessed with
immunohistochemistry (IHC), as well as expression of human epidermal growth factor receptor
2/neu (HER-2), assessed with IHC and fluorescence in situ hybridization (FISH) (Colditz et al.,
2006; Sims et al., 2008). ER is expressed in 60-80% of invasive breast tumors (Vainio &
Bianchini, 2002), and over half of ER+ tumors are also PR+ (Ghayad & Cohen, 2008). Less than
10
10% of tumors are ER-/PR+ (Ghayad & Cohen, 2008). The v-erb-b2 avian erythroblastic
leukemia viral oncogene homolog 2 (ERBB2) or human epidermal growth factor receptor 2
(HER-2/neu) oncogene is amplified in an estimated 20% of invasive breast tumors, leading to
HER-2 overexpression (Vainio & Bianchini, 2002). Compared with ER+/PR+/HER-2- tumors,
ER-/PR-/HER-2+ and ER-/PR-/HER-2-(triple-negative) tumors are significantly more likely to
be diagnosed at a later stage and higher histologic grade, after adjusting for age (Ontitilo, 2009).
Triple negative tumors also have low rates of overall survival, and disease-free survival (Ontitilo,
2009; O’Brien, 2010; Bauer et al., 2007). Expression status for ER, PR and HER-2 receptors
indicate which molecular pathways affect a tumor, and is used to determine the type of endocrine
therapy. ER+/PR+ (early-stage and metastatic) breast cancers are treated with anti-estrogenic
endocrine therapies such as adjuvant tamoxifen or anastrozole (Early Breast Cancer Trialists’
Collaborative Group, 2005; Budzar, 2003), and have a response rate of 60 to 70%, while ER-
/PR- tumors have a response rate of less than 10% to hormone therapy (Vainio & Bianchini,
2002). ER+/PR- tumors have an intermediate response rate of 40%. Tumors that have receptor
overexpression or gene amplification of HER2 are treated with anti-HER2 therapies, such as
trastuzumab, which improves chemotherapy response in HER2+ breast cancers (Kelly & Buzdar,
2013). To date, no specific drug therapy has been identified for triple negative tumors, and thus
chemotherapy remains the mainstay in treatment of these cancers (Kelly & Buzdar, 2013).
2.1.5 Benign Breast Disease
Benign breast disease (BBD) represents small changes in normal breast tissue that can
indicate an increased risk of invasive breast cancer, or may behave as a non-obligate precursor
lesion (Bodian, 1993; Lakhani, 2003; Page et al., 2003). Specific histologic abnormalities based
on pathologic examination have a range of relative risks for subsequent invasive breast cancer
(Colditz et al., 2006; Schnitt & Connelly, 2004). BBD is generally sub-classified into three types
11
of lesions, based on their severity and associated risk for subsequent breast cancer, including: (i)
non-proliferative disease, (ii) proliferative disease without atypia, and (iii) proliferative disease
with atypia (Dupont & Page, 1985). Non-proliferative breast lesions (i.e. mastitis, cysts, apocrine
metaplasia and mild hyperplasia) are not associated with increased risk of breast cancer
(Hartmann et al., 2005; Fitzgibbons et al., 1998). Proliferative breast disease without atypia (i.e.
fibroadenoma with complex features, intraductral papilloma, sclerosing adenosis) is associated
with moderately increased risk (1.5- to 2-fold) of subsequent breast cancer (Shnitt & Connelly,
2004), while breast cancer risk is increased 3.5- to 6-fold when atypical hyperplasia (ductal or
lobular) is present (Shnitt & Connelly, 2004; Fitzgibbons et al., 1998). While many studies have
demonstrated that a higher proportion of breast cancers subsequent to a diagnosis of BBD
develop in the ipsilateral breast, lesions with atypia also confer increased risk of breast cancer in
the contralateral breast (Collins et al., 2007; Hartmann et al., 2005).
2.1.6 Descriptive Epidemiology
While breast cancer can occur in both men and women, male breast cancer is rare; less
than 1% of all breast cancer cases occur in men (Bove, 2008; Hankinson et al., 2008). Breast
cancer is both the leading incident cancer and leading cause of cancer-related mortality among
women worldwide (Youlden et al., 2012). It is estimated that in 2008, 1,384,000 women were
diagnosed with breast cancer and 450,000 women died from breast cancer globally (Youlden et
al., 2012). Within Canada, breast cancer is the most commonly diagnosed malignancy among
women, with an estimated 24,400 new diagnoses in 2014, representing 26.1% of all newly
diagnosed female cancers (CCS, 2014). In Canada, breast cancer incidence rose through the early
1990s, likely due to the rising use of mammography screening (CCS, 2014). From 1988 to 2004,
breast cancer incidence rates have fluctuated, likely a result of shifts in hormonal factors (i.e. age
at menarche, pregnancy, and menopause, breastfeeding practices, and use of oral contraceptives
12
and hormone replacement therapy [HRT]) (Holford et al., 2006). Since 2004, breast cancer
incidence has stabilized in Canada (CCS, 2014). The lifetime probability of developing breast
cancer for Canadian women of all ages is 11.5% (CCS, 2014). In 2014, 9500 new breast cancer
diagnoses and 1950 breast cancer deaths are expected to occur in the province of Ontario (CCS,
2014). The prevalence of breast cancer is just below 1.0%; approximately 63,000 women in
Ontario had been diagnosed with breast cancer in the previous 10 years by the beginning of 2010
(Cancer Care Ontario, 2013).
Breast cancer ranks second (following lung cancer) in female cancer mortality in Canada;
there will be an estimated 5000 deaths from breast cancer in 2014, representing 13.8% of all
female cancer deaths (CCS, 2014). Age-standardized mortality rates for female breast cancer in
Canada have been declining since the mid-1980s, demonstrating a relative reduction of 43%
from 32.0 per 100,000 women in 1986, to a projected 18.4 deaths per 100,000 women in 2014
(CCS, 2014). This is thought to be the direct result of increased participation in breast cancer
screening (namely mammography), combined with the use of targeted adjuvant therapies
following breast cancer surgery (CCS, 2014). Similar declines in rates of breast cancer mortality
have been observed in the United States, United Kingdom and Australia (Bray et al., 2004).
2.1.7 Familial Breast Cancer
Family history of breast cancer is likely the most important risk factor for the
development of breast cancer, aside from age. Women with one affected first-degree relative are
approximately twice as likely to develop breast cancer in their lifetime compared with women
who have no affected relatives, and risks are higher when more than one first-degree relative is
affected or the relative is younger in age at diagnosis (Collaborative Group on Hormonal Factors
in Breast Cancer, 2001; Pharoah et al., 1997; Bevier et al., 2012). For example, women with both
13
an affected mother and sister have approximately three times the risk of developing breast cancer
relative to women without a family history, and women with three or more affected first-degree
female relatives have nearly four times the risk of developing breast cancer (Pharoah et al., 1997;
Collaborative Group on Hormonal Factors in Breast Cancer, 2001). While rare, a first-degree
family history of male breast cancer may further increase this risk (Bevier et al., 2012). The risk
associated with a family history of breast cancer in female second-degree relatives is lower (RR
= 1.5, 95% CI: 1.4-1.6) than the risk conferred by having a first degree family history (Pharoah
et al., 1997). A woman with a first-degree relative diagnosed with ovarian cancer is also
approximately twice as likely to develop breast cancer compared with women with no affected
relatives (Ziogas et al., 2000).
Studies conducted in the United States have estimated that approximately 7% to 11% of
women in the general population have a first-degree family history of breast cancer (Hughes et
al., 2003; Mai et al., 2011; Ramsey et al., 2006). Extrapolated to the female populations of
Canada and Ontario aged 20 to 79 years as of July 1, 2013 (Statistics Canada, 2013), an
estimated 911,102 to 1,431,731 Canadian women, and 353,704 to 555,820 Ontarian women have
a first-degree family history of breast cancer, respectively.
Many studies that have examined differences in prognostic features of breast cancers
between women with a first- or second-degree family history of breast cancer and women
without a family history have noted no significant differences (Figueiredo et al., 2007; Margolin
et al., 2006; Israeli et al., 1994; Jobsen et al., 2000; Russo et al., 2002; Thalib et al., 2004).
However, a few studies have reported that tumors in women with familial risk are smaller
(Malone et al., 2011; Molino et al., 2004), and more often node-negative (Fukutomi et al., 1993;
Mohammed et al., 1998) and ER+ (Molino et al., 2004) than tumors in women without a family
14
history. These results may explain why some studies have observed a survival benefit in women
with familial risk (Malone et al., 2011; Fukutomi et al., 1993; Mohammed et al., 1998).
Two high-risk breast cancer disposing genes, BRCA1 and BRCA2, have been identified.
A meta-analysis by Antoniou et al. (2003) demonstrated that BRCA1 mutation carriers have a
65% (95% CI: 44-78%) lifetime risk of breast cancer and 39% lifetime risk of ovarian cancer
(95% CI: 18-54%), while BRCA2 mutation carriers have a 45% (95% CI: 31-56%) lifetime risk
of breast cancer and 11% (95% CI: 2-19%) lifetime risk of ovarian cancer, though a range of
estimates have been reported. BRCA2 mutations are also associated with significantly increased
risk of pancreatic, gastric, bone, prostate and laryngeal cancers, as well as melanoma (Breast
Cancer Linkage Consortium, 1999; Risch et al., 2006; Bennett et al., 1999; van Asperen et al.,
2005; Moran et al., 2012). Numerous studies have investigated mutation penetrance, and some
lifetime risk estimates for carriers of either BRCA mutation have exceeded 80% (Ford et al.,
1994; Ford et al., 1998; Easton et al., 1993). Penetrance estimates differ by method of case
ascertainment; family studies tend to produce higher estimates than studies based on cases
unselected for family history (Narod, 2002). While penetrance of BRCA1/2 mutations is high,
they are rare. In the general population, the estimated carrier rate is 1 in 345 to 1 in 1000 (Ford et
al., 1995; Whittemore et al., 1997; Peto et al., 1999). Prevalence of BRCA1/2 mutations is higher
among specific geographic and ethnic sub-populations; the combined population frequency of
BRCA1 and BRCA2 mutations in Ashkenazi Jewish men and women is 2.0% to 2.5% (Struewing
et al., 1995; Roa et al., 1996; Warner et al., 1999b), and clusters of BRCA mutations have also
been identified in the Netherlands (Peelen et al., 1997), Iceland (Thorlacius et al., 1996; Arason
et al., 1998), Sweden (Einbeigi et al., 2001), and the Bahamas (Donenberg et al., 2011).
Mutation carrier status is also linked to breast cancer outcomes. Numerous studies have
investigated prognosis in BRCA-associated breast cancers. Some early studies demonstrated that
15
prognosis may be more favourable in BRCA-associated breast cancer compared with sporadic
cancer (Porter et al., 1994; Marcus et al., 1996; Gaffney et al., 1998; Verhoog et al., 1998). Later
studies with more rigorous methodologies (i.e. larger samples, inclusion of important prognostic
factors, adjusting for treatment type) have demonstrated BRCA-associated cancers have poorer
prognosis (Robson et al., 2004; Goodwin et al., 2012; Brekelmans et al., 2007; Kriege et al.,
2008; Bonadona et al., 2007; Budroni et al., 2009). A review of this evidence suggests the overall
prognosis of BRCA-associated breast cancer does not differ from that of sporadic breast cancer
(Bordeleau et al., 2010). However, risk of contralateral breast cancer is higher in BRCA-
associated breast cancers (Metcalfe et al., 2004; Brekelmans et al., 2007), and survival may
depend on whether adjuvant chemotherapy was administered (Goodwin et al., 2012; Robson et
al., 2004).
Family linkage studies have identified several additional high-penetrance genetic
mutations, on tumor suppressor genes phosphatase and tensin homolog (PTEN) and tumor
protein 53 (TP53) (Filippini & Vega, 2013). Breast cancer risk in female TP53 mutation carriers
is approximately 30% by age 30 years (Lalloo & Evans, 2012), and 50% by age 50 years (Li et
al., 1988). Mutations on checkpoint kinase 2 (CHEK2), ataxia telangiectasia mutated (ATM),
BRCA1 interacting protein C-terminal helicase 1 (BRIP1), RAD51 paralog C (RAD51C), and
partner and localizer of BRCA2 (PALB2) are also associated with a moderate increase (20% to
40%) in lifetime breast cancer risk (Filippini & Bega, 2013; Lalloo & Evans, 2012). Genome-
wide association studies (GWAS) have identified numerous common low-penetrance alleles that
are associated with slightly increased or decreased breast cancer risk (Filippini & Vega, 2013;
Lalloo & Evans, 2012). Only 5% to 10% of all cases of breast cancer are thought to be the direct
result of genetic mutations, with BRCA1 and BRCA2 mutations accounting for the largest
proportion (2% to 5%) (Hankinson et al., 2008).
16
Women with a family history of breast cancer are more likely to be diagnosed with
benign breast disease, and are also at increased risk for developing high-risk types of BBD such
as atypical hyperplasia (Webb et al., 2002). This increase in risk is more pronounced in younger
women (Bertelson et al., 2008; Webb et al., 2002; Berkowitz et al., 1985). Women with both a
family history of breast cancer and diagnosed with a severe type of BBD (i.e. proliferative
lesions without atypia, or atypical hyperplasia) have a greater risk of developing breast cancer
compared with women with corresponding BBD severity who do not have a family history of
breast cancer (Dupont and Page, 1985; Collins et al., 2006).
2.2 Screening for Breast Cancer
The overarching goal of screening is the detection of disease at an early stage, which
facilitates treatment and the potential for improvements in prognosis that would not have been
afforded if the disease were detected at a later stage. The disease must have an asymptomatic
period (preclinical phase), during which the disease can be detected by a screening test. Breast
cancer is known to have a detectable asymptomatic phase (referred to as sojourn time), wherein
breast tumors can be detected by a screening test prior to exhibiting symptoms (clinical phase).
2.2.1 Evidence for the Effectiveness of Breast Cancer Screening
Mammography
Mammography is an X-ray technique developed for imaging the soft tissue of the breast
(Vainio & Bianchini, 2002). Currently, mammography is the gold standard of screening for
breast cancer, but it is also used for diagnostic imaging in symptomatic patients (Vainio &
Bianchini, 2002). Two types of mammography are currently available, including screen-film
mammography and more recently, digital mammography. Digital mammography captures an

17
electronic image of the breast. Digital detectors have a wider dynamic range, which results in
increased contrast resolution than is available with film; thus, digital mammography facilitates
the detection of more cancers that may be hidden by dense breast tissue (Dershaw, 2006; Vainio
& Bianchini, 2002). Other advantages of digital mammography include the potential for
providing images with lower doses of radiation to the breast compared with screen-film
mammography, and the ability to transmit image files electronically (Vainio & Bianchini, 2002).
There are two types of digital mammography technology, including direct radiography (DR) and
computed radiography (CR). With DR, the detector is integrated into the mammographic unit
and the digital image is processed and displayed almost instantaneously (Health Canada, 2013),
while with CR, the detector is cassette-based and removable, and the image is generated by an
external reading device (Fischer et al., 2006).
A wide range of estimates (52% to over 90%) of the sensitivity of screen-film
mammography have been reported by randomized controlled trials (RCT) and population-based
breast cancer screening programs, varying by the method of calculation (i.e. length of the
screening interval) (Vainio & Bianchini, 2002). A meta-analysis by Humphrey et al. (2002),
demonstrated high rates of sensitivity (71% to 98%) for a screening interval of 1 year, while
sensitivity ranged from 53% to 86% for a 2-year interval, based on high quality evidence. Test
sensitivity of screen-film mammography is affected by a number of host characteristics; it is
lower for women who are less than 50 years of age (Humphrey et al., 2002; Carney et al., 2003;
Kerlikowske et al., 1996), who have breasts with a greater amount of fibroglandular tissue (high
mammographic density) (Kerlikoswke et al., 1996; Chiarelli et al., 2006a; Mandelson et al.,
2000; Sala et al., 1998; van Gils et al., 1998), and are current users of HRT (Chiarelli et al.,
2006a; Banks 2001; Kavanagh et al., 2000).
18
Studies have demonstrated that digital mammography has higher cancer detection rates in
women who are more likely to have their cancer missed by screen-film mammography (Burrell
et al., 1996; D’Orsi & Newell, 2007; Ikeda et al., 1992; Rosenberg et al., 1998), and higher
diagnostic accuracy in women who are younger than 50 years of age, women with high breast
density, and women who are pre- or peri-menopausal (Pisano et al., 2005). However, a recent
study evaluating the performance of both CR and DR technology relative to screen-film
mammography (Chiarelli et al., 2013), found important differences between the two types of
digital mammography. Chiarelli et al. (2013) demonstrated that while the cancer detection rate
for digital DR (4.9 per 1000; 95% CI: 4.7-5.2) and screen-film mammography (4.8 per 1000;
95% CI: 4.7-5.0) are approximately equivalent, the cancer detection rate for digital CR is
significantly lower (3.4 per 1000; 95% CI: 3.0-3.9) than cancer detection rates for DR and
screen-film mammography. This 21% reduction in performance would result in the detection of
approximately 10 fewer breast cancers per 10,000 women screened with CR, compared with
screen-film mammography (Chiarelli et al., 2013).
The first RCT to investigate the effect of mammography in reducing breast cancer
mortality, The Health Insurance Plan Study, was initiated in 1963 (Shapiro et al., 1982), and
followed by numerous other studies in Canada (Miller et al., 1992a, Miller et al., 1992b),
Scotland (Roberts et al., 1990) and Sweden (Andersson et al., 1988; Tabar et al., 1985; Bjurstam
et al., 1997; Frissell et al., 1986), over the next twenty years. RCTs have demonstrated a
reduction in breast cancer mortality that is directly attributable to screening with mammography
(Humphrey et al., 2002; Nelson et al., 2009). A 2002 meta-analysis from the U.S. Preventive
Health Services Task Force provided a pooled-estimate from 7 trials, demonstrating a 22%
reduction in mortality (relative risk [RR] = 0.78, 95% CI: 0.70-0.87) for women aged 50 to 74
years from mammography screening (Humphrey et al., 2002). An update was released in 2009,
19
providing age-stratified estimates; pooled-estimates from 6 trials demonstrated that
mammography screening reduces breast cancer mortality by 14% (RR = 0.86, 95% CI: 0.75-
0.99) for women aged 50 to 59 years, and a pooled-estimate from 2 trials demonstrated a greater
mortality benefit in women aged 60 to 69 years of 32% (RR = 0.68, 95% CI: 0.54-0.87) (Nelson
et al., 2009). A summary of evidence from the Canadian Task Force on Preventive Health Care
in 2011 demonstrated results largely in line with those of the U.S. Preventive Health Services
Task Force, showing an overall mortality reduction of 21% (RR = 0.79, 95% CI: 0.68-0.90) from
screening mammography in women aged 50 to 69 years.
A mortality benefit of 15% (RR = 0.85, 95% CI: 0.75-0.96) was also demonstrated for
screening women aged 39 to 49 years with mammography by both the U.S. Preventive Health
Services Task Force and Canadian Task Force on Preventive Health Care (Nelson et al., 2009;
Canadian Task Force on Preventive Health Care, 2011). While the mortality benefit for screening
women aged 39 to 49 years with mammography is significant, the number needed to screen
(NNS), number of false-positive results and subsequently unnecessary diagnostic procedures are
higher among this younger age group in comparison to women aged 50 to 69 years (Canadian
Task Force on Preventive Health Care, 2011). Specifically, the NNS (defined as the number of
women who would need to be screened biennially over a median of approximately 11 years to
prevent a single death from breast cancer) for women aged 50 to 69 years is 721, compared with
2108 for women aged 40 to 49 years (Canadian Task Force on Preventive Health Care, 2011).
Additionally, due to the higher likelihood of false-positive results in women younger than 50
years of age, it is estimated that screening approximately 2100 women biennially for 11 years
would result in about 690 women having a false-positive result, and 75 women undergoing
unnecessary breast biopsy (Canadian Task Force on Preventive Health Care, 2011). For women
70 years of age and above, the U.S. Preventive Health Services Task Force reported results from
20
only one trial (precluding meta-analysis), indicating a RR for breast cancer mortality of 1.12
(95% CI: 0.73-1.72). The Canadian Task Force on Preventive Health care pooled estimates from
two trials for women aged 70 years and above, demonstrating a similar point estimate (RR =
0.68; 95% CI: 0.45-1.01) to the pooled estimate reported by Nelson et al. (2009) for women aged
60 to 69, however this reduction in mortality was statistically non-significant.
A few studies have demonstrated higher rates of cancer detection with mammography in
women with a family history of breast cancer compared to women without a family history
(Halapy et al., 2004; Kerlikowske et al., 2000). Kerlikowske et al. (2000) compared women with
a first-degree family history of breast cancer to women without a family history, and found a
significantly higher positive predictive value, and significantly lower specificity for screening
mammography in women with a family history compared to family history negative women.
Several other studies in women with a family history of breast cancer have demonstrated screen-
detected breast tumors are smaller in size (Randall et al., 2009), less likely to demonstrate nodal
or distant metastases (Randall et al., 2009; Møller et al., 1999a; Møller et al., 1998; Tilanus-
Linthorst et al., 2000), and diagnosed at an earlier stage (Tilanus-Linthorst et al., 2000) compared
with symptomatic cancers. Few previous studies have examined screening outcomes among
women with a family history of breast cancer by varying levels of familial risk. One study by
Gui et al. (2001) found that women with moderate or high familial risk had proportionally fewer
tumors larger than 20mm in diameter compared to women with low familial risk, however these
findings were unadjusted and statistical significance was not reported. Halapy et al. (2004) found
that women with moderate or strong family history of breast and/or ovarian cancer had a similar
proportion of tumors larger than 20mm in diameter as women without a family history, but
women with a strong family history had the lowest proportion of node-negative breast tumors. A
subsequent study by Halapy et al. (2005) also demonstrated increased rates of interval cancers in
21
women with familial risk, with women with a strong family history demonstrating the highest
rates. The impact of screening mammography on reducing mortality specifically in women with
familial breast cancer risk remains unknown.
Clinical breast examination
Clinical breast examination (CBE) is a technique used to examine the breasts, which
includes visual examination and palpation. CBE is conducted by a trained health professional,
typically a physician or nurse. While there is no ‘gold standard’ in CBE technique, it typically
includes examination of the breast in several standing, seated and supine positions (Vainio &
Bianchini, 2002). Test sensitivity of CBE ranges from 40% to 59% (Barton et al., 1999). No
trials have investigated the effect of screening with CBE alone on breast cancer mortality,
relative to no screening. A study by Chiarelli et al. (2009) found that screening women with CBE
in addition to mammography resulted in higher cancer detection rates, and higher sensitivity
compared with screening with mammography alone. However, screening with combined
mammography and CBE increased the likelihood of having a false-positive test compared with
mammography alone; for each additional cancer detected by CBE per 10,000 women screened,
there were an additional 55 false-positive screens (Chiarelli et al., 2009). Bancej et al. (2003)
demonstrated that invasive cancers detected by both mammography and CBE were larger in size
and more often node-positive than tumors detected by mammography alone. Two meta-analyses
of RCTs have been published to date, demonstrating that screening with CBE in addition to
mammography is not associated with reduced breast cancer mortality beyond that achievable by
mammography alone (Humphrey et al., 2002; Kerlikowske et al., 1995). Similar to
mammography, higher cancer detection rates for CBE have been found in women with moderate
to strong familial risk relative to women with no family history of breast and/or ovarian cancer
(Halapy et al., 2005).

22
Breast self-examination
Similar to CBE, breast self-examination (BSE) is a technique used to examine the breast
and axilla using visual examination and palpation. While CBE is performed by a physician or
nurse, BSE is performed by the woman herself. Evidence from clinical trials investigating the
efficacy of BSE is limited. Overall test sensitivity of BSE is approximately 26% in screened
women, but ranges with age from 41% in women aged 35-39 years to 21% in women aged 60-74
years (Woolf, 1992; Baker, 1982). Two reviews have demonstrated that regular BSE results in a
slight increase in rates of cancer detection; however, there is no observable reduction in breast
cancer mortality (Baxter, 2001; Hackshaw & Paul, 2003). None of the trials reviewed by
Hackshaw & Paul (2003) found lower mortality in women who practiced BSE (pooled RR =
1.01, 95% CI: 0.92-1.12), compared with women who did not perform BSE. There is also
evidence that BSE education leads to an increase in benign biopsy rates (Baxter, 2001;
Hackshaw & Paul, 2003). Nevertheless, BSE is still advocated by some groups as a means of
promoting breast health awareness.
Breast ultrasonography
Ultrasound is an imaging technique that produces images from reflected high-frequency
sound waves in real time (Vainio & Bianchini, 2002), and can be used to visualize the internal
structures of the breast. Breast ultrasonography is non-invasive and does not confer exposure to
ionizing radiation. Doppler ultrasound may also be used to evaluate local tissue changes related
to tumor angiogenesis (i.e. blood flow) in an identified breast mass, which aids in distinguishing
malignant tumors from benign lesions and surrounding tissues (Mehta et al., 2000; Warner et al.,
2001). Breast ultrasound is primarily used as an adjunct to mammography, for the evaluation of
suspected breast lesions and/or to guide needle biopsy (Vainio & Bianchini, 2002). Ultrasound is
23
more sensitive than mammography for screening mammographically dense breast tissue (Kolb et
al., 1998; Warner et al., 2001), and thus may be particularly useful for younger women who are
at high risk of breast cancer. Recently, a study examined the use of breast ultrasound in
combination with screen-film mammography in women with elevated breast cancer risk and
dense breasts, finding that the breast cancer detection rate was raised from 8.2 per 1000 for
mammography alone to 11.4 per 1000, with sensitivity increasing from 31.3%% to 43.8% (Berg
et al., 2012). However, the specificity of mammography alone was 92.1%, and reduced to 84.4%
when ultrasound was also performed (Berg et al., 2012).
Breast magnetic resonance imaging
Magnetic resonance imaging (MRI) involves the use of rapidly fluctuating, high magnetic
fields to produce cross-sectional images of internal structures (Vainio & Bianchini, 2002). Like
breast ultrasound, breast MRI does not confer exposure to ionizing radiation, however a contrast
agent must be intravenously infused to be able to reliably detect abnormalities (Vainio &
Bianchini, 2002; Saslow et al., 2007; Warner et al., 2001). Breast MRI has traditionally been
used in the characterization of breast abnormalities identified during mammography, and
evaluation of patients diagnosed with breast cancer; however, it is also indicated for screening
women at increased risk of breast cancer, and women with breast augmentation mammoplasty
(Kuhl, 2007). The sensitivity of breast MRI is not influenced by breast density (Warner et al.,
2001), thus is beneficial in screening young women. The overall test sensitivity of breast MRI is
estimated to be 94% to 100% (Harms et al., 1993; Orel et al., 1994). Some studies have
demonstrated that mammography has superior specificity to MRI in women with familial breast
cancer risk. For example, results of the Magnetic Resonance Imaging Breast Screening
(MARIBS) study in the United Kingdom demonstrated that while sensitivity was significantly
higher (p = 0.01) for breast MRI (77%; 95% CI: 60-90) than mammography (40%; 95% CI: 24-
24
58), specificity was significantly lower (p <0.0001) for breast MRI (81%; 95% CI: 80-83) than
for mammography (93%; 95% CI: 92-95) (Leach et al., 2005). Screening with combined
mammography and breast MRI resulted in a sensitivity of 94% (95% CI: 81-99) and specificity
of 77% (95% CI: 75-79) (Leach et al., 2005). A study that compared breast MRI with breast
ultrasound, mammography, and clinical breast examination in a population of BRCA1 and
BRCA2 mutation carriers in Ontario also found lower specificity for MRI; sensitivity of MRI was
100% compared with 33% for mammography, while specificity was 91% for MRI and 99.5% for
mammography (Warner et al., 2001). A large multicenter study of participants from the
American College of Radiology Imaging Network also demonstrated significantly lower
specificity for MRI (Berg et al., 2012). After three annual screens, sensitivity for MRI was
87.5% (95% CI: 61.7-98.4) and 31.3% (95% CI: 11.0-58.7) for mammography, while specificity
for MRI was 75.7% (95% CI: 72.0-79.1) and 92.1% (95% CI: 89.7-94.1) for mammography
(Berg et al., 2012). Combined screening with mammography and MRI resulted in a sensitivity of
100% (95% CI: 79.4-100.00) and specificity of 70.6% (95% CI: 66.8-74.3) (Berg et al., 2012).
In contrast, a few studies have found similar specificity for both mammography and MRI in
populations of women with familial risk (Warner et al., 2004; Kuhl et al., 2005).
2.2.2 Potential Harms of Breast Cancer Screening
While there is strong evidence of a reduction in mortality attributable to mammography
screening in women aged 40 to 49 years, and 50 to 74 years, the potential harms associated with
screening for breast cancer must also be addressed. In recent years, the balance between the
benefit and potential harms of breast cancer screening has been the topic of much controversy
and debate. The issue of overdetection, or overdiagnosis is central to this debate. Overdiagnosis
of breast cancer refers to cancers detected by a screening test, which would never have become
clinically apparent during a woman’s lifetime without the intervention of screening. Because
25
there is no method to distinguish between cancers that would never progress to become
symptomatic and cancers which would lead to death if left untreated, both types are treated
similarly. Thus, treatment of an overdiagnosed cancer subjects a woman to the harms of cancer
treatment without therapeutic benefit (Pace & Keating, 2014). Quantifying the magnitude of
overdiagnosis is difficult; estimates have ranged from 0% to more than 50%, as a result of major
differences in the populations, types of cancers included, and methods of estimation used across
studies (Pace & Keating, 2014; Marmot et al., 2013). The most robust method to estimate
overdiagnosis is to compare cumulative incidence of breast cancer in the screened and
unscreened groups of a RCT, with adequate years of follow-up after screening ends, and where
the control group was never screened (Biesheuvel et al., 2007). Two recent reviews (Pace &
Keating, 2014; Marmot et al., 2013) suggest the best evidence comes from long-term follow-up
from three RCTs which never invited the control group to screening, including the Malmö I trial
(Zackrisson et al., 2006), and the Canadian National Breast Screening Study trials (Miller et al.,
2002; Miller et al., 2000). A meta-analysis of estimates of overdetection from these trials
estimates that 10.7% of breast cancers were overdiagnosed in women invited for screening
mammography (Independent UK Panel on Breast Cancer Screening, 2012).
Within the context of breast cancer screening, a false-positive result refers to a positive or
abnormal result on a screening test, which is subsequently found not to be cancer during recall
for further assessment. False-positive results are more common in women younger than age 50
years (Canadian Task Force on Preventive Health Care et al., 2011). Harms from receiving a
false-positive result include undergoing unnecessary diagnostic procedures (additional
mammograms or other imaging tests, fine-needle aspiration, or open biopsy), and psychological
distress. A recent systematic review demonstrated that having a false-positive mammogram led
to psychological distress that endured for up to three years, that distress increased with the level
26
of invasiveness of the diagnostic procedure, and that women were significantly less likely to
return for the next round of screening (Bond et al., 2013).
Moderate- and high-dose chest irradiation is an established risk factor for both breast
cancer incidence and mortality, with the highest risk observed for exposures that occur prior to
age 20 years (Preston et al., 2002; Ronckers et al., 2005). Radiation dose from a standard two-
view mammogram is very low. While it has been estimated that risks of radiation-induced breast
cancer are outweighed by the reduction in mortality achievable with annual or biennial screening
mammography for women age 40 years or above (Yaffe & Mainprize, 2011), there are concerns
that regular exposure to low-dose chest irradiation starting at a young age could increase lifetime
breast cancer risk. This is particularly important for women with a first-degree family history of
breast and/or ovarian cancer and BRCA mutation carriers, who are often recommended to begin
screening with mammography as young as age 25 years. Additionally, it has been hypothesized
that carriers of BRCA mutations have increased radiosensitivity due to impaired response to
double strand DNA breaks, which can be caused by ionizing radiation (Powell & Kachnic,
2003). Millikan et al. (2005) found a significant positive association between breast cancer and
number of lifetime mammograms in women with a genetic predisposition, and results reported
by Pijpe et al (2012) suggest that mammogram use prior to age 30 years is associated with
increased risk of breast cancer in BRCA1 and BRCA2 mutation carriers. Other studies have not
observed increased risk of breast cancer from mammography in women with BRCA1 and BRCA2
mutations, and early age at first mammogram (before age 30 or 40 years) did not appear to
increase this risk (Giannakeas et al., 2012; Narod et al., 2006; Goldfrank et al., 2006). It is
worthy of note that much of the evidence regarding the risk of breast cancer from diagnostic and
screening mammography come from studies that include screen-film mammography. The
average radiation dose from digital mammography is approximately 20% lower than that from
27
screen-film mammography (4.7 mGy for a standard two-view screen-film mammogram vs.
3.7 mGy for a digital mammogram) (Hendrick et al., 2010). Given the increasing use of digital
mammography, the risks of mammography-induced breast cancer in future will likely be slightly
lower than those reported by previous studies.
2.2.3 Breast Cancer Screening Recommendations in Canada
In its 1994 report, the Canadian Task Force on the Periodic Health Examination (now the
Canadian Task Force on Preventive Health Care) recommended all women aged 50 to 69 years
undergo screening for breast cancer by mammography and CBE every 1 to 2 years (Morrison,
1994). The 1994 report also recommended against screening women aged 40 to 49 years
(Morrison, 1994). In 2001, the Task Force performed an additional review of studies which
examined the effectiveness of screening mammography in women aged 40 to 49 (Ringash,
2001). The Task Force established that the evidence was not conclusive, and that women should
be informed at age 40 of the benefits and harms of screening mammography, and assisted in their
decision regarding at what age to begin screening (Ringash, 2001). In November 2011, the
Canadian Task Force on Preventive Health Care conducted an update of the evidence reviewed
by the U.S. Preventive Health Services Task Force in 2009, and released a full update to its 1994
screening guidelines. Currently, it is recommended that average risk women between the ages of
50 to 74 years be screened with mammography at an interval of 2 to 3 years (Canadian Task
Force on Preventive Health Care et al., 2011). The 2011 report also recommended against
screening women aged 40 to 49 years with mammography, as well as recommended against
screening average-risk women of any age with breast MRI, CBE (alone or in conjunction with
mammography) or BSE (Canadian Task Force on Preventive Health Care et al., 2011).
Canadian recommendations are largely in line with those of the U.S. Preventive Health
Services Task Force, which currently recommends that average-risk women aged 50 to 74 years
28
be screened biennially with mammography, and recommends against screening average-risk
women aged 40 to 49 years with mammography (US Preventive Services Task Force, 2009). The
U.S. Task force also recommends against clinicians teaching women how to perform BSE, and
found insufficient evidence to make recommendations regarding screening mammography in
women aged 75 years or above or CBE in women aged 40 years and above (US Preventive
Services Task Force, 2009).
Breast cancer screening recommendations for women with increased breast cancer risk
due to family history are based on expert opinion, and typically dictate shorter screening
intervals and screening beginning at an earlier age compared with the guidelines prescribed for
women at average risk of breast cancer. Such strategies include annual mammographic screening
beginning at age 40 years, or 10 years prior to the earliest age of onset observed in the family
(whichever occurs earliest), or starting as young as age 25 years for BRCA mutation carriers
(Eccles et al., 2000; Eisinger et al., 1998; Møller et al., 1999b; Warner et al., 1999a; Chart &
Franssen, 1997). The American Cancer Society currently recommends annual breast MRI for
identified BRCA1/2 mutation carriers, untested first-degree relatives of carriers and women
identified to have a 20-25% lifetime risk of developing breast cancer (Saslow et al., 2007). The
National Hereditary Cancer Task Force in Canada similarly recommends annual mammography
and MRI for BRCA1/2 carriers aged 30 to 69 years (Horsman et al., 2007). BRCA1 mutation
carriers may also be recommended to undergo transvaginal ultrasounds and evaluation of Cancer
Antigen-125 (CA-125) serum levels every 6 to 12 months starting at age 25 to 35 years for
ovarian cancer (Burke et al., 1997; Russo et al., 2009). A summary of North American guidelines
and recommendations for screening for breast cancer is located in Table 2.1.
29
2.2.4 Breast Cancer Screening in Canada
In Canada, mammography is freely available to screen-eligible women through organized
screening programs operated at the provincial level, and opportunistically (with referral by a
physician) through mammography facilities which operate outside of the provincial screening
programs (Canadian Partnership Against Cancer [CPAC], 2013). Canada’s first organized breast
cancer screening program was launched in British Columbia in 1988, followed by programs in
Ontario, Saskatchewan, Alberta and the Yukon Territory in 1990 (CPAC, 2013; Public Health
Agency of Canada, 2011). Organized breast cancer screening programs now exist in all of the
Canadian provinces and territories, with the exception of Nunavut, where only opportunistic
screening is available (CPAC, 2013). Organized programs provide all women without a prior
diagnosis of breast cancer, aged 50 to 69 years, with a biennial, bilateral, 2-view (cranio-caudal
and medio-lateral oblique) screening mammogram, through a provincially managed universal
health insurance plan (CPAC, 2013). Several programs continue to offer CBE performed by a
trained nurse or technologist, but most provinces have removed CBE from the screening program
based on scientific evidence which indicates performance of CBE does not confer a mortality
benefit (CPAC, 2013). Canada’s organized breast screening programs also facilitate the
navigation of women with abnormal or inconclusive screening results through the diagnostic
phase, and issues recall notices to participants who have normal or non-malignant screening
results when the next screening mammogram is due (Mai et al., 2009). In some cases, screening
programs in a number of provinces and territories also screen women outside of this age group or
at more frequent intervals, as requested by the health care provider or client (CPAC, 2013).
The Ontario Breast Screening Program (OBSP) was established in 1990 by the Ontario
Ministry of Health, under the auspices of Cancer Care Ontario. The OBSP offers mammographic
screening through self- or physician-referral to women at average risk for breast cancer aged 50
30
to 74 years (Chiarelli et al., 2006b; Cancer Care Ontario, 2013). Screening services are offered at
165 sites across the province, including 99 hospitals and 66 independent health facilities (IHF)
affiliated with the OBSP (Cancer Care Ontario, 2013). There are also two mobile coaches,
offering screening services to women in remote communities in Northwestern Ontario, and the
Hamilton Niagara Haldimand Brant Local Health Integration Network (Cancer Care Ontario,
2013). Based on the results of the seminal study by Chiarelli et al. (2013), which found lower
cancer detection rates for digital CR compared with screen-film and digital DR mammography,
Cancer Care Ontario and Ontario’s Ministry of Health and Long-Term Care initiated the
replacement of digital CR mammography technology with digital DR technology at all imaging
sites across Ontario in 2013 (Cancer Care Ontario, 2013). The transition to digital DR
technology was completed by early 2014 (Cancer Care Ontario, Internal Communication, 2014).
As of 1 July 2011, the OBSP was expanded to include annual combined breast MRI (or
breast ultrasound where MRI is contraindicated) and mammographic screening for women at
high risk of breast cancer. To date, Ontario is the first region worldwide to offer screening to
high-risk women within the context of an organized screening program (Cancer Care Ontario,
2013). This expansion is supported by clinical practice guidelines which suggest women at high-
risk of breast cancer would benefit from annual combined screening with mammography and
breast MRI (Warner et al., 2012). Currently, 28 of the OBSP screening sites offer high-risk
screening services to eligible women, and at least one OBSP high-risk screening centre is located
in each of the regions across Ontario (Cancer Care Ontario, 2013). Screen-eligible women
include those aged 30 to 69 years with no acute breast symptoms, considered to be at high risk of
breast cancer due to: (i) a known deleterious mutation in BRCA1/2 or other gene predisposing to
a markedly elevated breast cancer risk; (ii) untested first-degree relative of a gene mutation
carrier; (iii) a family history consistent with hereditary breast cancer syndrome and estimated
31
personal lifetime risk of breast cancer ≥25%; (iv) history of therapeutic chest irradiation (before
age 30 years and at least eight years previously) (Chiarelli et al., 2014). It was estimated that
34,000 women in Ontario (<1%) became eligible for screening based on these criteria, and that
17 cancers per year will be detected for every 1000 high-risk women screened through the high-
risk program (Cancer Care Ontario, Internal Communication, 2011). Results from the first year
of OBSP high risk screening program suggest annual MRI in combination with mammography
may be an effective strategy for the early detection of breast cancer in women with highly
elevated breast cancer risk, especially for BRCA mutation carriers; of the 35 cancers detected at
initial screen, none were detected by mammography alone, 23 (65.7%) were detected by MRI
alone, 12 (34.3%) were detected by both MRI and mammography, and 25 (71.0%) were detected
in women with known BRCA mutations (Chiarelli et al., 2014). Positive predictive value was
highest for detection based on both MRI and mammography (12.4%).
2.3 Breast Cancer Screening Use and Predictors of Use
2.3.1 Participation in breast cancer screening
Self-reported breast cancer screening data
In the 2008 Canadian Community Health Survey (CCHS), 72.5% of Canadian women
aged 50 to 69 years self-reported undergoing a mammogram in the previous two years (Shields &
Wilkins, 2009). While this represents a significant increase from the 40.5% of women who
reported a mammogram in 1990, all of this increase occurred during 1990-2001, with self-
reported rates from 2001-2008 remaining stable at approximately 72% (Shields & Wilkins,
2009). In Ontario, self-reported mammogram participation in the previous two years was 73.2%
in 2008, down slightly from 73.6% in 2000-2001 (Shields & Wilkins, 2009). While these self-
reported participation rates do not distinguish between screening and diagnostic examinations,

32
91% of CCHS respondents in 2008 reported that their mammogram was for screening purposes
(Shields & Wilkins, 2009).
Validity of self-reported breast cancer screening data
Epidemiologic research relies heavily on self-reported mammography use data in
determining rates of screening participation, due to the costs and difficulty of accessing medical
records to collect these data. As such, understanding the accuracy of self-reported mammography
use data is critical. Overall, the validity of self-reported mammography use data is supported.
Evidence from several meta-analyses indicate that self-reported data performs well in
determining whether or not a woman has undergone mammography, with rates of sensitivity
exceeding 90% (Newell et al., 1999; Rauscher et al., 2008; Howard et al., 2009). However, self-
reported data is much less accurate for determining the exact timing mammography use. Studies
have consistently demonstrated that women often underestimate the time since their last
mammogram (Paskett et al., 1996; Rauscher et al., 2008; Howard et al., 2009; Caplan et al.,
2003a; Caplan et al., 2003b; McGovern et al., 1998; Gordon et al., 1993; Degnan et al., 1992;
Zapka et al., 1996; Etzi et al., 1994; Fulton-Kehoe et al., 1992) This phenomenon, called
‘telescoping,’ occurs when individuals recall events as more recent than they actually were
(Sudman & Bradburn, 1973). In the case of mammography, the effect of telescoping leads to an
overestimation of mammogram use, inflating rates of screening adherence.
Evidence regarding the factors associated with mammography recall has been mixed, and
many of these studies have focused on specific sub-populations of women based on ethnicity or
income, limiting their generalizability. Some studies have demonstrated that age (Rivera et al.,
2006; Brown & Adams, 1992; Bancej et al., 2004; Norman et el., 2003), ethnicity (Rauscher et
al., 2008; Zapka et al., 1996; Rivera et al., 2006; Cronin et al., 2009; Hiatt et al., 1995; Lawrence
et al., 1999), income (Bancej et al., 2004), education (Caplan et al., 2003a; Rivera et al., 2006),
33
marital status (Rivera et al., 2006), indication for mammogram (Rivera et al., 2006), recency of
the mammogram (McGovern et al., 1998; Craig et al., 2009), and family history of breast cancer
(Caplan et al., 2003a) are associated with accuracy of self-reported mammogram data. Others
however, have provided no evidence that factors such as age (Caplan et al., 2003a; McGovern et
al., 1998), income (Degnan et al., 1992; Zapka et al., 1996), ethnicity (Caplan et al., 2003a;
McGovern et al., 1998), perceived risk (Caplan et al., 2003a), or number of years since last visit
to a health professional (Caplan et al., 2003a) are significantly associated with recall.
While the quality of self-reported mammogram use data has been studied in depth,
studies have focused on women with population-level risk of breast cancer. The two studies
which validated self-reported mammogram data in women with familial risk only included
women with very strong familial breast cancer histories (Pijpe et al., 2011; Larouche et al.,
2012), who are likely to differ in their breast cancer screening behaviours and recall of these
behaviours compared with women in the broader population of women with familial risk.
Administrative breast cancer screening data
Data from the Ontario Health Insurance Plan (OHIP) and the OBSP, demonstrates that
participation in mammography screening in Ontario is lower than suggested by self-reported data
from the CCHS. In 2010-2011, 60.8% of eligible women in Ontario were screened with
mammography, remaining stable from 2008-2009 when 61.1% of eligible women in the province
were screened with mammography (Cancer Care Ontario, 2013). These rates are slightly lower
than the rates seen in 2007-2008, when an estimated 66.3% of eligible women of average-risk
were screened, 64.0% in 2005-2006, and 61.5% in 2003-2004 and 2001-2002 (Cancer Care
Ontario, 2010). The current rate of screening mammography participation in Ontario is currently
below the national target of 70% (Cancer Care Ontario, 2013). The majority of screening
mammograms performed in Ontario occur within the context of the OBSP; in 2010-2011, 71.1%
34
of screening mammograms were performed at an OBSP site (Cancer Care Ontario, 2013). This
represents an increase from 2008-2009, when 65.7% of women were screened within the OBSP
(Cancer Care Ontario, 2013).
2.3.2 Familial breast cancer risk and participation in breast cancer screening
A meta-analysis of 19 studies suggests there is a positive relationship between having a
family history of breast cancer and mammogram use; women with familial risk were more likely
to have screened with mammography than women without a family history of breast cancer
(Pearson’s r = 0.27, p < 0.001) (McCaul et al., 1996). However, many of these studies measured
the ever-use of screening mammography, as opposed to guideline-adherent screening use.
Several subsequent studies of women with familial breast cancer risk, typically including
BRCA1/2 mutation carriers or women attending genetic counselling, have suggested relatively
high rates of adherence (67-90%) to mammography and CBE guidelines (Antill et al., 2006;
Isaacs et al., 2002; Lerman et al., 2000; Meiser et al., 2000). One Australian population-based
study of women of multiple-case breast cancer families demonstrated high adherence (74%) to
mammography guidelines (Price et al., 2011). Two North-American population-based studies
however, have demonstrated relatively lower levels of adherence (Madlensky et al., 2005,
Campitelli et al., 2011). Results from one study indicated that only 40% of women had obtained
a mammogram in the previous 11 months (Madlensky et al., 2005). The other, a cross-sectional
study from the same Ontario cohort of female relatives of breast cancer cases who form the study
population for this thesis, indicated that 36.1% of women at low familial risk and 55.5% of
women at moderate to high familial risk had undergone mammography in the previous 12
months (Campitelli et al., 2011). An inverted u-shaped relationship has also been hypothesized,
wherein women at the extreme ends of breast cancer risk due to family history may be screened
less than women with moderate levels of breast cancer risk (Hailey, 1991). It is thought that this
35
relationship may be mediated by worry about cancer risk (Andersen et al., 2003; Kash et al.,
1992).
2.3.3 Behavioural factors and breast cancer screening
A number of health behaviour theories have been used extensively in attempts to explain
the cognitive processes which influence women to participate in breast cancer screening,
including the Health Belief Model (Becker, 1974), Protection Motivation Theory (Rogers, 1975),
and the Theory of Reasoned Action/Theory of Planned Behaviour (Fishbein & Ajzen, 1975;
Ajzen, 1988).
The Health Belief Model
The Health Belief Model (HBM) was developed in the 1950’s by social psychologists at
the U.S. Public Health Service, in an attempt to explain and predict the factors implicated in the
widespread underutilization of disease preventives and screening tests for the early detection and
diagnosis of disease, such as participation in screening programs for tuberculosis (Janz &
Becker, 1984; Steckler et al., 2010). Since, the HBM has been used extensively to organize the
theoretical predictors of early detection health behaviours, and specifically in the breast cancer
screening literature to explain the conditions under which women will participate in breast cancer
screening. Two assumptions underlie the HBM: (i) that an individual has a desire to avoid
disease (or to become well) and; (ii) that an individual believes that undertaking a specific health
behaviour will prevent or ameliorate that disease (Janz & Becker, 1984). Specifically, the HBM
includes four dimensions believed to motivate health protective behaviours: (i) perceived
susceptibility: perception of personal vulnerability or risk of developing a certain disease or
condition; (ii) perceived severity: perception of the seriousness or consequences (clinical and
social) of developing a disease or condition, or of leaving it untreated; (iii) perceived benefits:
36
beliefs regarding the effectiveness of the various health actions available in reducing or
ameliorating the treat of developing a disease or condition; and (iv): perceived barriers: the
potential negative aspects of a particular health behaviour or impediments perceived to the ability
to undertake that particular behaviour (Rosenstock, 1974). According to the model, individuals
engage in a subconscious cost-benefit analysis, and will undertake a particular preventive or
early detection behaviour if the benefits of the behaviour outweigh the barriers (Rosenstock,
1974). A number of indirect factors were also thought to exert influence on the four dimensions,
including: socio-demographic factors (age, race, ethnicity, socioeconomic status), psychological
factors (personality) and structural factors (knowledge about disease) (Rosenstock, 1974).
Other Health Behaviour Theories
Following the development of the HBM, additional health behaviour theories were
developed under a similar framework. Protection Motivation Theory is a theory of cognitive
change that was developed by Rogers in 1975 to explain and predict how individuals cope with
threats (Rogers, 1975). Generally, Protection Motivation Theory proposes that a fear appeal
(fear-arousing communication regarding threat to an individual’s well-being and measures that
can be taken to avoid it or reduce its impact) will initiate a corresponding cognitive process of
protection motivation (an intervening variable that arouses, maintains and directs appropriate
activity) that involves threat and coping appraisal (Rogers, 1975). Similar to the HMB, the
process of threat appraisal includes appraisal of the following constructs: (i) perceived personal
vulnerability to the threat; and (ii) perceived severity of the threat; but also includes (iii)
magnitude of fear or anxiety that is evoked as a result of the threat (Rogers, 1975). The process
of coping appraisal includes: (i) response efficacy: perceptions regarding whether the
recommended coping response is effective in reducing the threat (similar to the HMB’s
perceived benefits); (ii) self-efficacy: perceptions regarding ability to undertake the
37
recommended coping response; and (iii) response cost: perceptions regarding how costly
(financially burdensome, time-consuming, inconvenient, painful, etc.) performing the
recommended coping response will be (similar to the HBM’s perceived barriers) (Rogers, 1975).
The Theory of Reasoned Action was developed by Fishbein in 1975 in an attempt to
explain health behaviours, assuming that individuals make rational choices based on available
information (Fishbein & Ajzen, 1975). According to this theory, the most important determinant
of undertaking a health behaviour is intention. Behavioural intention is further comprised of: (i)
an individual’s belief toward the health behaviour and the outcomes of undertaking that
behaviour; and (ii) the social normative influence of others who are considered significant in the
individual’s life (Fishbein & Ajzen, 1975). The Theory of Planned Behaviour (Ajzen, 1991), is
an extension of the Theory of Reasoned Action, adding the construct of perceived behavioural
control. Perceived behavioural control refers to an individual’s belief regarding the ease or
difficulty associated with performing a certain health behaviour (Ajzen, 1991).
Perceived risk and breast cancer screening
The relationship between objective measures of breast cancer risk, perceived breast
cancer risk, and breast cancer screening participation has been studied extensively both in
women with population-level breast cancer risk, and women with familial risk of breast and/or
ovarian cancer. Briefly, it is believed that women who hold a more realistic perception of their
risk of developing breast cancer will be motivated to undertake health protective behaviours
appropriate to that level of risk, such as undergoing screening for breast cancer (Rosenstock,
1974; Levanthal et al., 1999). Results from two meta-analyses indicate that there is a small but
significant association between perceived breast cancer risk and breast cancer screening (McCaul
et al, 1996; Katapodi et al., 2004). These reviews have generally included studies of women from
the general population, thus results are likely not generalizable to women at high-risk of breast
38
cancer. Additionally, many of these studies have examined the relationship between perceived
risk and ever use of breast cancer screening, as opposed to screening according to prescribed
guidelines. A number of studies have been conducted which focus on examining the relationship
between perceived risk and breast cancer screening behaviours specifically in women with
familial breast cancer risk; however, to our knowledge, no previous review of this evidence has
been conducted. Synthesizing this evidence is critical to clearly understanding whether perceived
breast cancer risk influences the use of breast cancer screening in women with familial breast
cancer risk, to evaluate the quality of this evidence, and identify areas where future research may
be needed. As such, we conducted a review of observational studies which investigated the
relationship between perceived risk and adherence to breast cancer screening guidelines in
women with a family history of breast and/or ovarian cancer. A meta-analytic approach was not
taken due to the high levels of heterogeneity observed across studies (Higgins & Green, 2011;
Bailar, 1997), in study design, study setting (time period, and country), inclusion criteria (age,
and definition of family history), and measurement (measurement of perceived breast cancer
risk, and definition of breast cancer screening adherence).
39
2.3.4 Manuscript 1: Perceived risk and adherence to breast cancer screening guidelines
among women with a familial history of breast cancer: A review of the literature
Published in The Breast. 2013; 22(4): 395-404.
Meghan J. Walker, Anna M. Chiarelli, Julia A, Knight, Lucia Mirea, Gord Glendon
ABSTRACT
Objectives: A small positive association has been consistently demonstrated between perceived
breast cancer risk and mammography use. Evidence specific to women with familial breast
cancer risk has not been previously reviewed. Methods: A literature search was conducted. 186
studies were identified for abstract/full-text review, of which 10 articles were included. Manual
searching identified 10 additional articles. Twenty articles examining the association between
perceived breast cancer risk and adherence to mammography, clinical breast examination (CBE)
or breast self-examination (BSE) guidelines among women with familial breast cancer risk were
reviewed. Studies were classified according to screening modality, categorized by finding and
ordered by year of publication. Studies assessing mammography were further classified
according to the applied method of measuring perceived risk. Results: Our review found a weak
positive association between higher perceived risk and adherence to mammography guidelines
among women with familial breast cancer risk. Consistent associations between perceived risk
and adherence to CBE and BSE guidelines were not observed. Conclusions: Our ability to
understand the relationship between perceived breast cancer risk and adherence to breast
screening guidelines is limited, because most previous research is cross-sectional. Future studies
with prospective methodologies that use consistent measurement methods and are adequately
powered are warranted.
Keywords: breast cancer; perceived risk; screening; mammography; family history; review
40
Introduction
Breast cancer is the leading incident cancer and cause of cancer-related mortality among
women worldwide [1]. Having a family history of breast cancer has been established as one of
the most important risk factors for breast cancer. Specifically, women with an affected first-
degree relative have approximately twice the risk of developing breast cancer and risk is
increased when more than one relative is affected or the relative is younger at age of diagnosis
[2-4]. Two high-risk cancer-disposing genes, BRCA1 and BRCA2, have been identified, with
carriers at an estimated 40-70% risk of developing breast cancer [5-8].
Mammography screening has been demonstrated to reduce breast cancer mortality among
average risk women aged 50-74 years [9]. Similar benefits have not been established for clinical
breast examination (CBE) and breast self-examination (BSE) [10-12]. Breast cancer screening
guidelines for women at increased risk, based on expert opinion, typically include annual
screening with mammography and CBE starting prior to age 50 [13-17]. The American Cancer
Society recommends annual breast MRI for identified BRCA1/2 mutation carriers, untested first-
degree relatives of carriers and women identified to have a 20-25% lifetime risk of developing
breast cancer [18]. The National Hereditary Cancer Task Force in Canada also recommends
annual mammography and breast MRI for BRCA1/2 mutation carriers aged 30-69 years [19].
BRCA1 mutation carriers are additionally recommended to undergo transvaginal ultrasounds and
evaluation of Cancer Antigen-125 (CA-125) blood serum levels every 6-12 months from age 25-
35 years for ovarian cancer [20,21].
While results from one meta-analysis suggest a positive relationship exists between
familial breast cancer risk and mammogram use [22], many of these studies measured ever-use
of screening as opposed to guideline adherent use. Recent results examining screening adherence
among women with familial breast cancer risk have been mixed. One Australian population-
41
based study of women of multiple-case breast cancer families demonstrated high adherence
(74%) to mammography guidelines [23]. Several recent North American population-based
studies however, have demonstrated relatively lower rates of adherence, one indicating only 40%
of women with familial risk had obtained a mammogram in the previous 11 months [24], and the
other indicating only 36.1% of women at low familial risk and 55.5% at moderate to high
familial risk had undergone mammography in the previous 12 months [25]. An inverted u-shaped
relationship has also been suggested [26], wherein women at the extreme ends of risk may screen
less, in a relationship influenced by worry [27,28].
Breast cancer screening requires behavioural action at the individual level. As such,
understanding the factors which influence screening uptake is critical to increasing rates of
adherence to screening guidelines. There is an extensive literature focusing on the relationship
between perceived susceptibility to breast cancer and breast cancer screening behaviours. The
construct of perceived risk is central to several health behaviour theories, including the Health
Belief Model (HBM) [29], Protection Motivation Theory [30], and the Theory of Reasoned
Action/Theory of Planned Behavior [31,32]. These theories, especially the HBM, have been used
extensively in attempts to explain the cognitive processes which influence women to participate
in breast screening. Briefly, it is believed that a realistic perceived risk would motivate
individuals to undertake health-protective behaviours appropriate to the level of risk, facilitating
the process of early detection and treatment [33,34].
There is a lack of consistency in the measurement of perceived risk due to a lack of
consensus regarding the most valid approach. While there is no existing gold standard, the most
commonly used scales include numeric probability scales, which ask respondents to rate their
risk on a 0-100% probability continuum of developing breast cancer, verbal Likert-type scales,
42
which ask for similar responses using a verbal continuum from “extremely unlikely” to
“extremely likely,” [35-41] or other types of numeric scales (e.g. “1 in x”) [42].
Results from two previous reviews indicate a small but significant positive association
between perceived risk and mammography use (r = 0.16 and g = 0.19) [22,43]. These reviews
have generally included studies of women with population-level risk of breast cancer and studies
that examined the ever-use of screening. To our knowledge, no previous review has examined
this relationship in women with familial breast cancer risk. This review is critical to better
understanding whether perceived risk influences guideline-adherent breast screening use in
women with familial breast cancer risk. Accordingly, the objectives of this review were to: (i)
identify all observational studies that examined the association between perceived breast cancer
risk and adherence to breast screening (mammography, CBE, BSE) recommendations among
women with familial breast cancer history; (ii) examine these studies in regard to methodological
criteria, including measurement of the construct of perceived risk and other study design
features, including recruitment of the study population, sample size, and the analyses conducted.
Materials and Methods
Search Strategy
Searches of the following databases were performed: PubMed, PsycINFO (1960-2011),
EMBASE (1980-2011) and The Cochrane Library. Queries were conducted of article titles,
abstracts and keywords employing combinations of the following terms: breast cancer or breast
neoplasm or mammary cancer and perceived risk or risk perception or attitudes and breast
screening or early detection or health behavior or surveillance or mammography or breast self-
examination or clinical breast examination and family history or family members or at-risk
43
population. No restrictions were placed on publication year or sample size, however studies were
restricted to those with observational designs, published in English and female subjects.
Selection Criteria
The full selection process is shown in Figure 1. Initial queries identified a total of 313
articles from PubMed (n=93), PsycINFO (n=75), EMBASE (n=141) and The Cochrane Library
(n=2). Duplicates were removed (n=127), leaving 186 studies. Titles and abstracts were
screened. Full text review was conducted where the paper passed eligibility screening or the
abstract did not provide sufficient information to determine eligibility. Articles were excluded if
they: focused on cancer at a site other than the breast, did not assess the relationship between
perceived risk and screening adherence, the study population did not have a family history of
breast cancer, were reviews, dissertations or qualitative studies, had a non-observational design,
were duplicate publications of the same data, could not be located, intention to undergo
screening was assessed, only women with excessive BSE practices were included, perceived risk
of BRCA1/2 mutation was assessed, scale of measurement of perceived risk was undefined, did
not present findings indicating direction of the association, included women with a previous
breast cancer diagnosis, or had limited generalizability.
Manual searches of bibliographic references of relevant articles identified by database
search and two previously published meta-analyses were conducted, identifying 9 additional
articles. One article authored by the authors’ research team was also included [44]. A total of 20
studies [23,28, 44-61] were included. Studies were classified according to screening modality,
categorized by finding and ordered by publication year. Studies assessing adherence to
mammography screening guidelines were further classified by perceived risk measurement scale.
Studies were also examined and described on the basis of quality using eleven criteria specific to
observational studies included in the checklist from the Downs and Black quality assessment tool
44
[62]. Ratings included ‘poor’ (satisfied 5 or fewer criteria), ‘fair’ (satisfied 6-8 criteria) or ‘good’
(satisfied 9 or more criteria).
Results
Perceived Risk and Adherence to Mammography Guidelines
Table 1 summarizes 5 studies which analyzed the relationship between perceived risk of
breast cancer measured on a numeric scale and adherence to mammography guidelines.
Perceived risk was measured uniformly across all studies, using an absolute scale from 0 to 100.
Zhang et al. [44] and Schwartz et al. [45] reported that higher ratings of perceived risk were
associated with mammography adherence, with effect sizes ranging from Odds Ratio (OR) =
1.21 to 2.41. Three other studies reported no association, indicating ratings of perceived risk
were approximately equal among adherent and non-adherent women [23,46,47]. Zhang et al.
[44] employed a population-based recruitment strategy, while the remaining studies used clinic-
based recruitment. Zhang et al. [44] also had a relatively large sample size (n = 1019) and
performed multivariate analyses. Schwartz et al. [45], who reported a positive association which
approached statistical significance, similarly recruited relatives of cases of breast cancer and
performed multivariate analyses, however used clinic-based recruitment and had a small sample
size (n = 200), which may have resulted in inadequate power to detect a significant effect. Zhang
et al. [44] and Schwartz et al. [45] similarly defined adherence as undergoing mammography
within the past 12 months, while the studies reporting null findings measured adherence over
longer periods (2-3 years) [23,46].
Table 2 includes 12 studies which analyzed the relationship between perceived breast
cancer risk measured on a verbal scale and mammography adherence. Findings were more
consistent, with 6 studies reporting a positive association [44,48-52], four of which were
45
statistically significant [44,48-50]. Zhang et al. [44] and Lemon et al. [49], both used similar
comparative measures of perceived risk, and reported adjusted estimates (OR =1.82-2.90). Both
studies had relatively large sample sizes and defined adherence as undergoing mammography
within the previous 12 months. Lemon et al. [49] employed a prospective design, while Zhang et
al. [44] used cross-sectional data. Finney-Rutten & Iannotti [50] alternatively used an absolute
measure of perceived risk and reported an effect size of a lower magnitude (OR =1.41; 95% CI:
1.05-1.89). Only Polednak et al. [53] reported a negative association. This study used a random
sampling recruitment approach and reported unadjusted results. Five studies demonstrated no
association between perceived risk and mammography adherence [54-58], generally defined as
screening within the past 12 months. Recruitment methods for these studies were largely clinic-
based, with the exception of Drossaert et al. [56] who recruited women through a population-
based cancer screening program. With regard to design, two of the studies reporting null findings
used prospective cohort designs, while the remainder were cross-sectional. These studies also
had small to moderate sample sizes and only two reported multivariate results, leaving more than
half vulnerable to confounding.
Perceived Risk and Adherence to CBE Guidelines
Six studies examined the relationship between perceived risk and adherence to CBE
guidelines, and are summarized in Table 3. A majority reported null findings [23,51,54,59], with
one study reporting a significant positive association [28] and another reporting a non-significant
positive association [44]. Kash et al. [28] examined CBE adherence in a small sample of women
who were self-selected into a breast screening group, employing a verbal measure of perceived
risk and defining adherence as undergoing CBE within the past 6 months, but did not present
adjusted results. Zhang et al. [44] who also reported a non-significant positive relationship,
conversely employed a large population-based sample of female relatives of breast cancer cases,
46
used a numeric measure of perceived risk, defined adherence as undergoing CBE in the past 12
months and adjusted for a number of potential confounders. In regard to the studies reporting no
association, there was wide variation in study populations, approaches for measuring perceived
risk, definitions of guideline-adherence and analyses conducted. The two cohort studies by Price
et al. [23] and Martin & Degner [54], measured screening adherence over 3-year periods, but
differed on all other features. Price et al. [23] employed a population-based recruitment
approach, had a large sample size (n=748), measured perceived risk numerically and presented
adjusted results, indicating that perceived risk was approximately equal among under-screeners
and adherent women (OR = 0.99). Martin & Degner [54], recruited a small sample of women
(n=56) from a hereditary breast cancer clinic, used an absolute verbal measurement of perceived
risk and reported bivariate results only. The two cross-sectional studies, conducted by Isaacs et
al. [51] and Benedict et al. [59] similarly recruited relatively small samples of women who had
undergone genetic testing or were daughters of cases of breast cancer, respectively.
Perceived Risk and Adherence to BSE Guidelines
Table 4 summarizes 8 studies which examined the relationship between perceived risk
and adherence to BSE guidelines. Similar to the results observed with CBE, methodologies and
findings were mixed. Brain et al. [60] and Zhang et al. [44] indicated that women with higher
ratings of perceived risk practiced BSE more frequently than women with lower ratings of
perceived risk. Both studies had substantial sample sizes, were cross-sectional and presented
results that were adjusted for age, at minimum. Both studies also measured perceived risk using
both absolute and comparative measures, however Brain et al. [60] used a verbal measure, while
Zhang et al. [44], examined perceived risk with both verbal and numeric measures. Two studies,
conducted by Kash et al. [28] and Lindberg & Wellisch [47], reported statistically significant
negative relationships, wherein women with higher levels of perceived risk were less likely to
47
perform BSE. Both studies were cross-sectional and reported unadjusted results. Kash et al. [28]
measured perceived risk verbally and had a relatively small sample (n=217) of women who were
members of a breast screening program. Lindberg & Wellisch [47], however, had a larger sample
of patients of a high-risk breast cancer clinic, who had all undergone genetic counseling, and
measured perceived risk on an absolute numeric scale. Four studies reported no association
between perceived risk and BSE performance [23,56,60,61], and demonstrated many
methodological differences. Price et al. [23] who used a population-based recruitment strategy of
female relatives of breast cancer cases, collected data prospectively, had a relatively large sample
size (n=748), measured perceived risk using an absolute numeric scale and adjusted for a number
of important socio-demographic and cognitive factors. Cohen [61] and Benedict et al. [59] both
recruited small samples of only daughters of breast cancer cases and used a “1 in x” approach to
measure perceived risk. Cohen [61] presented results adjusted for several cognitive factors, as
well as age and education, while Benedict [59] reported bivariate results. Drossaert et al. [56],
had a moderate sample size (n=379) of women invited for a mammogram by a screening
program, used both an absolute and comparative verbal scale to measure perceived risk and
similarly presented unadjusted results.
Discussion
Perceived breast cancer risk appears to be only weakly positively associated with
adherence to screening mammography guidelines. This relationship does not hold for adherence
to guidelines for CBE or BSE. While the association between perceived risk measured on a
numeric scale and mammography was not consistently positive, when perceived risk was
measured verbally, a more consistent positive association was found. With the exception of one
study [49], no evidence of a curvilinear relationship was demonstrated. Lemon et al. [49],
however, found that women who reported their chances of getting breast cancer as “higher” than
48
women without a family history were more likely to adhere to mammography guidelines
compared with women who reported their chances as “the same/lower,” but women who
reported their chances as “much higher,” were not more likely adherent. Only a few studies
calculated objective breast cancer risk [46-48,52,54], generally finding that women significantly
overestimated their risk [46,47,54].
Findings of this review were similar to the conclusions drawn from previously published
meta-analyses examining perceived risk and breast screening use. Katapodi et al. [43] also
indicated the association between perceived risk and BSE use has been inconsistently reported.
Both McCaul et al. [22] and Katapodi et al. [43] demonstrated a small but significant positive
association between higher levels of perceived risk and mammography use. However, many
studies examined ever-use of screening as opposed to guideline-adherent screen use. Thus,
women who reported single screening episodes were not distinguished from women who
engaged in screening that conformed to prescribed guidelines. This is an important distinction as
continual screening adherence is necessary for appreciably reducing risks. Additionally, a
majority of the women included in the previous reviews had a population-level risk of breast
cancer, rather than a family history of breast cancer. Women whose relatives have been
diagnosed with breast cancer may hold exaggerated risk perceptions or disproportionately
experience cognitions such as cancer-related distress, anxiety, depression, worry and fear
regarding breast cancer. Previous research has indicated that as many as half to three-quarters of
women with familial breast cancer history overestimate their personal risk of developing breast
cancer [46,47,63,64]. This may result in a negative impact on coping abilities and in turn, reduce
the likelihood of screening. Research has also demonstrated that women with higher levels of
worry or anxiety are more likely vigilant or hypervigilant with regard to screening [55,
49
60,61,65], however several studies have indicated that intrusive levels of cancer anxiety, worry
or distress may deter screening uptake in women with familial risk [28,45,47,58].
With regard to the methodological quality of the studies, 9 studies received a good quality
rating [23,44-46,49,50,52,57,60], while the remaining 11 [28,47,48,51,53-56,58,59,61] were
rated as fair. None of the included studies had a poor quality rating. Over half of the studies had
samples of 300 subjects or less, giving them limited power to detect statistical significance given
the observed effect sizes. Study populations varied, with only three studies employing
population-based recruitment strategies [44,46,56]. Many samples consisted of women identified
from high-risk clinical settings, limiting generalizability to women in the broader population with
a familial breast cancer history. Many women recruited from clinical settings were reported to
have undergone genetic testing, have strong familial histories of breast cancer and markedly high
rates of adherence to screening mammography guidelines (80-95%) [47,51,54,55].Study
populations also varied by age. Previous research has suggested that rates of screening among
women with familial risk may differ by age [25,66] and several studies included in this review
suggest that age may modify the relationship between perceived risk and adherence to screening
guidelines [49,53].
It is also critical to note the heterogeneity in measurement of perceived risk. Risk
perception is a subjective construct, leading to difficulties in its conceptualization, measurement
and translation. There are substantial differences in the types of measurement scales employed,
including Likert-type verbal scales or numeric scales, and the measurement of absolute vs.
relative or comparative risk. Differences have been demonstrated in the estimates of perceived
risk produced by different types of scales. Numeric scales appear more likely to result in an
overestimation of risk, while verbal scales are more likely to produce the opposite effect,
particularly when women are asked about their comparative risk [43,67]. One previous study
50
demonstrated poor correlations between the numeric and verbal scales used to measure perceived
cancer risk [68].
Several studies have demonstrated evidence that even highly-educated people have
difficulty interpreting basic numeric probability statistics [69-71]. Numeracy (one’s aptitude for
basic mathematical concepts) has been linked with consistency in using perceived risk
measurement scales [72] as well as accuracy of risk estimates [70,73-74] and therefore offer
improved levels of precision and interpretability to scientists compared to verbal scales.
Nonetheless, research suggests that respondents favor verbal scales. For example, Diefenbach et
al. [75] found that college students reported perceived risk scales with verbal anchors easier to
use and more representative than numeric scales. Woloshin et al. [76] similarly found that the
verbal scale demonstrated the highest usability and satisfaction scores, as well as test-retest
reliability for assessing perceived breast cancer risk, while numeric scales (linear odds and “1 in
x”) were reported to be harder to use, had lower satisfaction scores more missing responses and
poorer test-retest reliability.
Scale performance can also be affected by factors including the ordering of items or
perceived risk held by the respondent. Levy et al. [35] analyzed the psychometric properties of
the numeric, verbal and comparative measures of perceived breast cancer risk, finding good
convergent validity (r >0.60). Scale performance however relied on the level of perceived risk
actually held. This study [35] demonstrated that for identifying women with very high risk
perceptions, the numeric and comparative measures had the highest sensitivity and specificity.
For women with very low risk perception, the numeric measure demonstrated the lowest
sensitivity while the comparative measure demonstrated the highest sensitivity and lowest
specificity. Another study [77] indicated that perceptions of ovarian and colorectal cancer risk
were lower when a question measuring comparative risk preceded an item measuring absolute
51
risk. Differences in the types of measurement of perceived risk may explain the inconsistent
findings.
Lastly, it is critical to highlight the lack of prospective studies. Only a few studies
employed prospective designs [23,48,49,55]. The simultaneous measurement of perceived risk
and adherence to breast screening guidelines precludes insight into causality of the observed
associations. It is possible that participation in breast cancer screening (or lack thereof), or the
findings of previous screens may influence perceived breast cancer risk, making reverse
causation a concern. This is a significant limitation and the need for future prospective studies
has been deemed necessary to confirm previous findings [23,53,78-81].
The findings of this review must be considered in light of several limitations. It is based
solely on published data in the English language. Publication bias may lead to an over-
representation of positive and statistically significant results [82] and studies with positive results
are more likely to be published in English language journals [83]. Additionally, a majority of
studies that measure breast screening behaviours, including all of the studies described in this
review, rely on the use of self-reported use of breast screening tests. While self-reported
mammography data is useful in determining whether or not a woman has undergone screening,
evidence suggests that women may underestimate the time since their last mammogram [84-86],
which may lead to an overestimation of guideline-adherent use.
Perceived risk of breast cancer appears to have a weak to moderate positive relationship
with mammography adherence among women with familial breast cancer risk, with the causal
direction of the observed association not yet established. Previous work suggests that the weak
association between perceived risk and breast screening is predictable [34], as the decision to
undergo breast screening is dependent on the complex interaction of a number of cognitive and
environmental factors [22,43]. The lack of a clear effect limits the ability to make
52
recommendations regarding strategies to facilitate increased adherence to breast screening
guidelines among women with familial risk. Heterogeneity in design, measurement and
screening guidelines likely account for much of the inconsistency observed. The most optimal
method of accurately measuring perceived risk has yet to be determined and the lack of
consistency in practice makes cross-study comparisons difficult. Future studies with prospective
methodologies that use consistent measurement, are adequately powered and account for
potential confounding, mediating and effect- modifying factors are warranted.
Appropriate use of mammography and other breast screening modalities is critical for
early detection and diagnosis of women at increased risk of breast cancer and may impact overall
prognosis. Further investigation of how high-risk women perceive their risk, the proximity of
perceived risk to objective risk and how perceived risk may influence breast screening practices
is needed. This will allow researchers and practitioners to understand where appropriate risk
education and management efforts should be focused.
Ethical approval: Ethical approval not required (review paper).
Conflict of interest statement: The authors declare that there are no conflicts of interest.
Acknowledgement: This research was supported by the Canadian Breast Cancer Foundation –
Ontario Region. There was no involvement of the study sponsor in the study design, collection,
analysis and interpretation of data; the writing of the manuscript; or the decision to submit the
manuscript for publication.
53
References
1. Youlden DR, Cramb SM, Dunn NAM, Muller JM, Pyke CM, Baade PD. The descriptive
epidemiology of female breast cancer: An international comparison of screening, incidence,
survival and mortality. Cancer Epidemiol 2012; 36:237-248.
2. Collaborative Group on Hormonal Factors in Breast Cancer. Familial breast cancer:
Collaborative reanalysis of individual data from 52 epidemiological studies including 58, 209
women with breast cancer and 101, 986 women without the disease. Lancet 2001; 358:1389-
99.
3. Pharoah PD, Day N, Duffy S, Easton DF, Ponder BA. Family history and the risk of breast
cancer: A systematic review and meta-analysis. Int J Cancer 1997; 71:800-809.
4. Bevier M, Sundquist K, Hemminki K. Risk of breast cancer in families of multiple effected
women and men. Breast Cancer Res Treat 2011; 132:723-728.
5. Antoniou A, Pharoah PD, Narod S, et al. Average risks of breast and ovarian cancer
associated with BRCA1 or BRCA2 mutations detected in case series unselected for family
history: A combined analysis of 22 studies. Am J Hum Genet 2003; 72:1117-30.
6. Risch HA, McLaughlin JR, Cole DE, et al. Prevalence and penetrance of germline BRCA1
and BRCA2 mutations in a population series of 649 women with ovarian cancer. Am J Hum
Genet 2001; 68:700-710.
7. King MC, Marks JH, Mandell JB, New York Breast Cancer Study Group. Breast and ovarian
cancer risks due to inherited mutations in BRCA1 and BRCA2. Science 2003; 302:643-646.
8. Ford D, Easton DF, Stratton M, et al. Genetic heterogeneity and penetrance analysis of the
BRCA1 and BRCA2 genes in breast cancer families. Am J Hum Genet 1998; 62:676-689.
9. Nelson HD, Tyne K, Naik A, Bougatsos C, Chan BK, Humphrey L. Screening for Breast
Cancer: Systematic Evidence Review Update for the U. S. Preventive Services Task Force.
Ann Intern Med 2009; 151:727-W242.
10. Kerlikowske K, Grady D, Rubin S, Sandrock C, Ernster VL. Efficacy of screening
mammography: a meta-analysis. JAMA 1995, 273:149-153.
11. Baxter N. Preventive health care, 2001 update: should women be routinely taught breast self-
examination to screen for breast cancer? Canadian Task Force on Preventive Health Care.
CMAJ 2001; 164:1837-1846.
12. Hackshaw AK, Paul EA. Breast self-examination and death from breast cancer: a meta-
analysis. Br J Cancer 2003; 88:1047-1053.
13. Evans DGR, Lalloo F. Risk assessment and management of high risk familial breast cancer. J
Med Genet 2002; 39:865-871.
54
14. Eccles DM, Evans DGR, Mackay J. Guidelines for a genetic risk based approach to advising
women with a family history of breast cancer. J Med Genet 2000; 37:203-209.
15. Eisinger F, Alby N, Bremond A, et al. Recommendations for medical management of
hereditary breast and ovarian cancer: the French National Ad Hoc Committee. Ann Oncol
1998; 9:939-950.
16. Møller P, Evans G, Haites N, et al. Guidelines for follow-up of women at high risk for
inherited breast cancer: consensus statement from the Biomed 2 Demonstration Programme
on Inherited Breast Cancer. Dis Markers 1999; 15:207-211.
17. Warner E, Heisey RE, Goel V, Carroll JC, McCready DR. Hereditary breast cancer: Risk
assessment of patients with a family history of breast cancer. Can Fam Physician 1999;
45:104-112.
18. Saslow D, Boetes C, Burke W, et al. American Cancer Society guidelines for breast
screening with MRI as an adjunct to mammography. CA Cancer J Clin 2007; 57:75-89.
19. Horsman D, Wilson BJ, Avard D, et al. Clinical management recommendations for
surveillance and risk-reduction strategies for hereditary breast and ovarian cancer among
individuals carrying a deleterious BRCA1 or BRCA2 mutation. J Obstet and Gynaecol Can
2007; 29(1):45-60.
20. Burke W, Daly M, Garber J, et al. Recommendations for follow-up care of individuals with
an inherited predisposition to cancer. II. BRCA1 and BRCA2. Cancer Genetics Studies
Consortium. JAMA 1997; 277:997-1003.
21. Russo A, Calo V, Brungo L, et al. Hereditary ovarian cancer. Crit Rev Oncol Hemat 2009;
69: 28-44.
22. McCaul KD, Branstetter AD, Schroeder DM, Glasgow RE. What Is the Relationship
Between Breast Cancer Risk and Mammography Screening? A Meta-Analytic Review.
Health Psychol 1996; 15:423-429.
23. Price MA, Butow PN, Charles M, et al. Predictors of breast cancer screening behavior in
women with a strong family history of the disease. Breast Cancer Res Treat 2010; 124:509-
519.
24. Madlensky L, Vierkant RA, Vachon CM, et al. Preventive health behaviors and familial
breast cancer. Cancer Epidemiol Biomarkers Prevent 2005; 14: 2340-2345.
25. Campitelli MA, Chiarelli AM, Mirea L, et al. Adherence to breast and ovarian cancer
screening guidelines for female relatives from the Ontario site of the Breast Cancer Family
Registry. Eur J Cancer Prev 2011; 20:492-500.
26. Hailey BJ. Family history of breast cancer and screening behavior: An inverted U-shaped
curve? Med Hypotheses 1991; 36:397-403.
27. Andersen MR, Smith R, Meischke H, Bowen D, Urban N. Breast cancer worry and
mammography use by women with and without a family history in a population-based
sample. Cancer Epidemiol Biomarkers Prev 2003; 12:314-320.
55
28. Kash KM, Holland JC, Halper MS, Miller DG. Psychological Distress and Surveillance
Behaviors of Women With a Family History of Breast Cancer. J Natl Cancer Inst 1992;
84:24-30.
29. Becker MH. The Health Belief Model and Personal Health Behavior. Thorofare, Charles B.
Slack Inc.: Thorofare; 1974.
30. Rogers RW. A Protection Motivation Theory of Fear Appeals and Attitude Change. J
Psychol 1975; 91:93-114.
31. Fishbein M, Ajzen I. Belief, attitude, intention and behavior: An introduction to theory and
research. Reading: Addison-Wesley: Reading; 1975.
32. Ajzen I. Attitudes, personality and behavior. Chicago: Dorsey Press: Chicago; 1988.
33. Rosenstock, I.M. Historical origins of the health belief model. Health Education Monographs
1974; 2:332.
34. Leventhal H, Kelly K, Leventhal E. Population risk, actual risk, perceived risk, and cancer
control: A discussion. J Natl Cancer Inst Monographs 1999; 25:81-84.
35. Levy AG, Shea J, Williams SV, Quistberg A, Armstrong, K. Measuring Perceptions of
Breast Cancer Risk. Cancer Epidemiol Biomarkers Prev 2006; 15:1893-1898.
36. Lipkus I, Rimer B, Strigo T. Relationships among objective and subjective risk for breast
cancer and mammography stages of change. Cancer Epidemiol Biomarkers Prev 1996;
5:1005-1011.
37. Gurmankin AD, Domchek S, Stopfer J, Fels C, Armstrong K. Patients’ resistance to risk
information in genetic counseling for BRCA1/2. Arch Intern Med 2005; 165:523-529.
38. Gurmankin AD, Baron J, Armstrong K. The message sent versus message received in
hypothetical physician risk communications: exploring the gap. Risk Anal 2004; 24:1337-
1347.
39. Cohn L, Macfarlane S, Yanez C, Imai WK. Risk perception: differences between adolescents
and adults. Health Psychol 1995; 14:217-222.
40. Lerman C, Schwartz MD, Miller SM, Daly M, Sands C, Rimer BK. A randomized trial of
breast cancer risk counseling: Interacting effects of counseling, educational level, and coping
style. Health Psychol 1996; 15:75-83.
41. Lipkus IM, Iden D, Terrenoire J, Feaganes JR. Relationships among breast cancer concern,
risk perceptions, and interest in genetic testing for breast cancer susceptibility among
African-American women with and without a family history of breast cancer. Cancer
Epidemiol Biomarkers Prev 1999; 8:533-539.
42. Woloshin S, Schwartz L, Byram S, Fischhoff B, Welch HG. A new scale for assessing
perceptions of chance: a validation study. Med Decis Making 2000; 20:298-307.
56
43. Katapodi MC, Lee KA, Facione NC, Dodd MJ. Predictors of perceived breast cancer risk and
the relation between perceived risk and breast cancer screening: a meta-analytic review. Prev
Med 2004; 38:388-402.
44. Zhang LR, Chiarelli AM, Glendon G, et al. Influence of perceived breast cancer risk on
screening behaviors of female relatives from the Ontario site of the Breast Cancer Family
Registry. Eur J Cancer Prev 2011; 20:255-262.
45. Schwartz MD, Taylor KL, Willard KS, Siegel JE, Lamdan RM, Moran K. Distress,
personality, and mammography utilization among women with a family history of breast
cancer. Health Psychol 1999; 18:327-332.
46. Bowen DJ, Helmes A, Powers D, et al. Predicting breast cancer screening intentions and
behavior with emotion and cognition. J Soc Clin Psychol 2003; 22: 213-232.
47. Lindberg NM, Wellisch D. Anxiety and Compliance Among Women at High Risk for Breast
Cancer. Ann Behav Med 2001; 23:298-303.
48. Somers TJ, Michael JC, Klein WMP, Baum A. Cancer genetics service interest in women
with a limited family history of breast cancer. J Genet Couns 2009; 18:339-349.
49. Lemon SC, Zapka JG, Clemow L, Estabrook B, Fletcher K. Mammography screening after
breast cancer diagnosis in a first degree female relative: age group differences (United
States). Cancer Cause Control 2006; 17:1053-1065.
50. Finney Rutten LJ & Iannotti RJ. Health beliefs, salience of breast cancer family history, and
involvement with breast cancer issues: adherence to annual mammography screening
recommendations. Cancer Detect Prev 2003; 27:353-359.
51. Isaacs C, Peshkin BN, Schwartz M, DeMarco TA, Main D, Lerman C. Breast and ovarian
cancer screening practices in healthy women with a strong family history of breast or ovarian
cancer. Breast Cancer Res Treat 2002; 71:103-112.
52. Schildkraut JM, Lerman C, Lustbader E, Rimer BK. Adherence to mammography among
subgroups of women at high risk for breast cancer. J Womens Health (Larchmt) 1995; 4:645-
654.
53. Polednak AP, Lane DS, Burg MA. Risk perception, family history, and use of breast cancer
screening tests. Cancer Detect Prev 1991; 15:257-263.
54. Martin W, Degner L. Perception of risk and surveillance practices of women with a family
history of breast cancer. Cancer Nurs 2006; 29:227-235.
55. Diefenbach MA, Miller SM, Daly MB. Specific worry about breast cancer predicts
mammography use in women at risk for breast and ovarian cancer. Health Psychol 1999;
18:532-536.
56. Drossaert CC, Boer H, Seydel ER. Perceived risk, anxiety, mammogram uptake, and breast
self-examination of women with a family history of breast cancer: the role of knowing to be
at increased risk. Cancer Detect Prev 1996; 20:76-85.
57
57. Audrain J, Lerman C, Rimer B, et al. Awareness of Heightened Breast Cancer Risk among
First-Degree Relatives of Recently Diagnosed Breast Cancer Patients. Cancer Epidemiol
Biomarkers Prev 1995; 4:561-565.
58. Lerman C, Daly M, Sands C, et al. Mammography Adherence and Psychological Distress
Among Women at Risk for Breast Cancer. J Natl Cancer Inst 1993; 85:1074-1080.
59. Benedict S, Goon G, Hoomani J, Holder P. Breast cancer detection by daughters of women
with breast cancer. Cancer Pract 1997; 5:213-219.
60. Brain K, Norman P, Gray J, Mansel R. Anxiety and adherence to breast self-examination in
women with a family history of breast cancer. Psychosom Med 1999; 61: 181-187.
61. Cohen M. First-degree relatives of breast-cancer patients: Cognitive perceptions, coping, and
adherence to breast self-examination. Behav Med 2002; 28:15-22.
62. Downs SH, Black N. The feasibility of creating a checklist for the assessment of the
methodological quality both of randomised and non-randomised studies of health care
interventions. J Epidemiol Community Health 1998; 52:377-384.
63. Evans DG, Burnell LD, Hopwood P, Howell A. Perception of risk in women with a family
history of breast cancer. Brit J Cancer 1993; 67:612-614.
64. Lerman C, Audrain J, Croyle RT. DNA-testing for heritable breast cancer risks: Lessons
from traditional genetic counseling. Ann Behav Med 1994; 16:327-333.
65. McCaul KD, Tulloch HE. Cancer Screening Decisions. J Natl Cancer Inst Monographs
1999; 25:52-58.
66. Wu H, Zhu K, Jatoi I, Shah M, Shriver CD, Potter J. Factors associated with the
incompliance with mammogram screening among individuals with a family history of breast
cancer or ovarian cancer. Breast Cancer Res Treat 2007; 101:317-324.
67. Lipkus IM, Kuchibhatla M, McBride CM, et al. Relationships among breast cancer perceived
absolute risk, comparative risk, and worries. Cancer Epidemiol Biomarkers Prev 2000;
9:973-975.
68. Frost MH, Vockley CW, Suman JJ, Green MH, Zahasky K, Hartmann L. Perceived familial
risk of cancer: Health outcomes and psychosocial adjustment. J Psychosoc Oncol 2002;
18:63-82.
69. Lipkus IM, Samsa G, Rimer BK. General Performance on a Numeracy Scale among Highly
Educated Samples. Med Decis Making 2001; 21:37-44.
70. Black WC, Nease RF Jr, Tosteson ANA. Perceptions of Breast Cancer Risk and Screening
Effectiveness in Women Younger Than 50 Years of Age. J Natl Cancer Inst 1997; 87:720-
731.
71. Yamagishi K. When a 12.86% Mortality is More Dangerous than 24.14%: Implications for
Risk Communication. Appl Cognitive Psych 1997; 11:495-506.
58
72. Schapira MM, Davids SL, McAuliffe TL, Nattinger AB. Agreement Between Scales in the
Measurement of Breast Cancer Risk Perceptions. Risk Anal 2004; 24:665-673.
73. Schwartz LM, Woloshin S, Black WC, Welch HG. The Role of Numeracy in Understanding
the Benefit of Screening Mammography. Ann Intern Med 1997; 127:966-972.
74. Davids SL, Schapira MM, McAuliffe TL, Nattinger AB. Predictors of Pessimistic Breast
Cancer Risk Perceptions in a Primary Care Population. J Gen Intern Med 2004; 19:310-315.
75. Diefenbach MA, Weinstein ND, O’Reilly J. Scales for assessing perceptions of health hazard
susceptibility. Health Educ Res 1993; 8:181-192.
76. Woloshin S, Schwartz LM, Byram S, Fischhoff B, Welch HG. A New Scale for Assessing
Perceptions of Chance: a Validation Study. Med Decis Making 2000; 20:298-307.
77. Taylor KL, Shelby RA, Schwarz MD et al. The Impact of Item Order on Ratings of Cancer
Risk Perception. Cancer Epidemiol Biomarkers Prev 2002; 11:654-659.
78. Andersen MR, Smith R, Meischke H, Bowen D, Urban N. Breast cancer worry and
mammography use among women with and without a family history in a population-based
sample. Cancer Epidemiol Biomarkers Prev 2003; 12:314-320.
79. Audrain-McGovern J, Hughes C, Patterson F. Effecting behaviour change. Awareness of
family history. Am J Prev Med 2003; 24:183-189.
80. Vernon SW. Risk Perception and Risk Communication for Cancer Screening Behaviors: a
Review. J Natl Cancer Inst Monographs 1999; 25:101-119.
81. Calvocoressi L, Kasl SV, Lee CH, Stolar M, Claus EB, Jones BA. A prospective study of
perceived susceptibility to breast cancer and nonadherence to mammography screening
guidelines in African American and White women ages 40 to 79 years. Cancer Epidemiol
Biomarkers Prev 2004; 13:2096-2105.
82. Elwood M. Critical Appraisal of Epidemiologic Studies and Clinical Trials – Third Edition.
Oxford University Press: Oxford, 2007.
83. Khan KS, Kunz R, Kleijnen J, Antes G. Systematic Reviews to Support Evidence-based
Medicine: How to Review and Apply Findings on Healthcare Research. Royal Society of
Medicine Press, Ltd.: London, 2003.
84. Howard M, Agarwal G, Lytwyn A. Accuracy of self-reports of pap and mammography
screening compared to medical record: A meta-analysis. Cancer Causes Control 2009; 20:1-
13.
85. Rauscher GH, Johnson TP, Cho YI, Walk JA. Accuracy of self-reported cancer-screening
histories: A meta-analysis. Cancer Epidemiol, Biomarkers Prev 2008; 17:748-757.
86. Caplan LS, Mandelson MT, Anderson LA, Health Maintenance Organization. Validity of
self-reported mammography: Examining recall and covariates among older women in a
health maintenance organization. Am J Epidemiol 2003; 157:267-272.
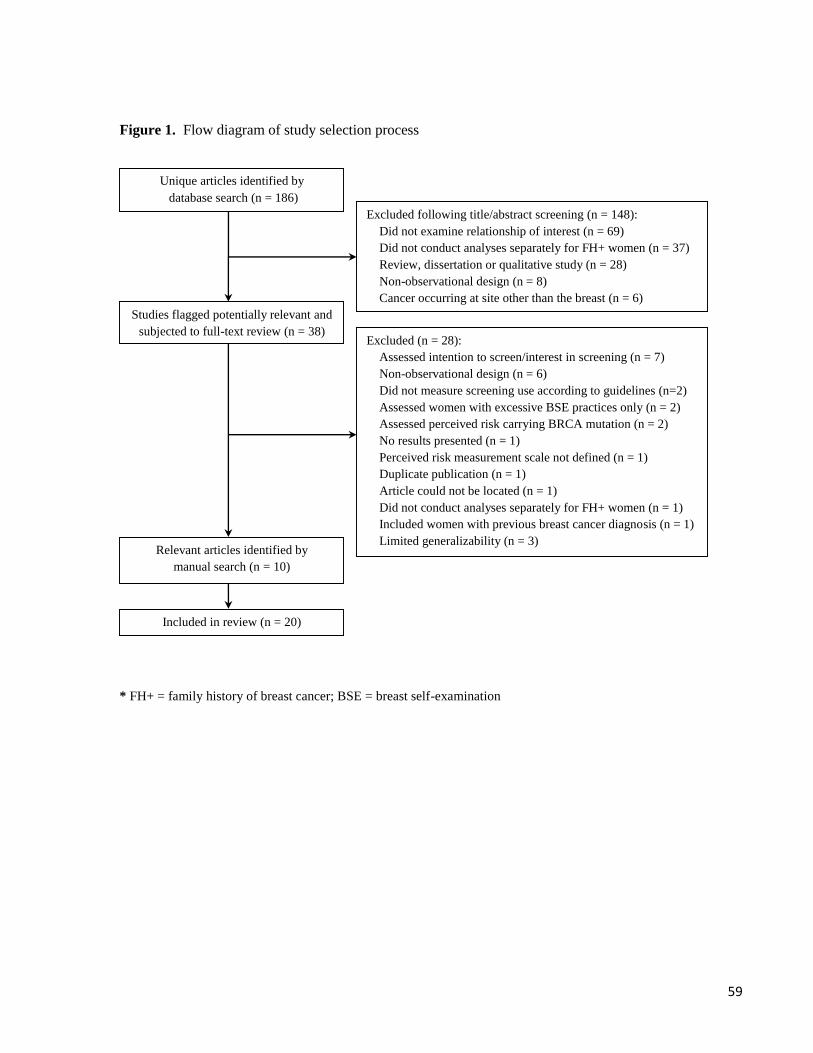
59
Figure 1. Flow diagram of study selection process
* FH+ = family history of breast cancer; BSE = breast self-examination
Unique articles identified by
database search (n = 186)
Excluded following title/abstract screening (n = 148):
Did not examine relationship of interest (n = 69)
Did not conduct analyses separately for FH+ women (n = 37)
Review, dissertation or qualitative study (n = 28)
Non-observational design (n = 8)
Cancer occurring at site other than the breast (n = 6)
Studies flagged potentially relevant and
subjected to full-text review (n = 38)
Included in review (n = 20)
Relevant articles identified by
manual search (n = 10)
Excluded (n = 28):
Assessed intention to screen/interest in screening (n = 7)
Non-observational design (n = 6)
Did not measure screening use according to guidelines (n=2)
Assessed women with excessive BSE practices only (n = 2)
Assessed perceived risk carrying BRCA mutation (n = 2)
No results presented (n = 1)
Perceived risk measurement scale not defined (n = 1)
Duplicate publication (n = 1)
Article could not be located (n = 1)
Did not conduct analyses separately for FH+ women (n = 1)
Included women with previous breast cancer diagnosis (n = 1)
Limited generalizability (n = 3)
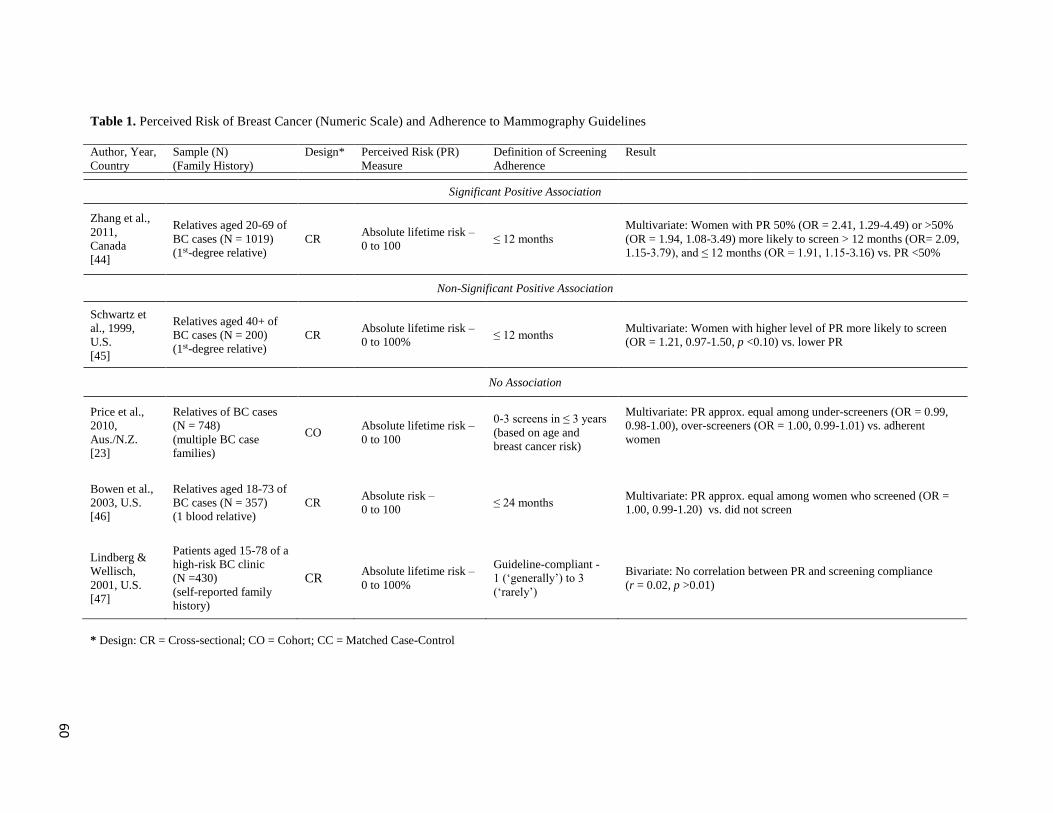
60
Table 1. Perceived Risk of Breast Cancer (Numeric Scale) and Adherence to Mammography Guidelines
Author, Year,
Country
Sample (N)
(Family History)
Design* Perceived Risk (PR)
Measure
Definition of Screening
Adherence
Result
Significant Positive Association
Zhang et al.,
2011,
Canada
[44]
Relatives aged 20-69 of
BC cases (N = 1019)
(1st-degree relative)
CR Absolute lifetime risk –
0 to 100 ≤ 12 months
Multivariate: Women with PR 50% (OR = 2.41, 1.29-4.49) or >50%
(OR = 1.94, 1.08-3.49) more likely to screen > 12 months (OR= 2.09,
1.15-3.79), and ≤ 12 months (OR = 1.91, 1.15-3.16) vs. PR <50%
Non-Significant Positive Association
Schwartz et
al., 1999,
U.S.
[45]
Relatives aged 40+ of
BC cases (N = 200)
(1st-degree relative)
CR Absolute lifetime risk –
0 to 100% ≤ 12 months
Multivariate: Women with higher level of PR more likely to screen
(OR = 1.21, 0.97-1.50, p <0.10) vs. lower PR
No Association
Price et al.,
2010,
Aus./N.Z.
[23]
Relatives of BC cases
(N = 748)
(multiple BC case
families)
CO Absolute lifetime risk –
0 to 100
0-3 screens in ≤ 3 years
(based on age and
breast cancer risk)
Multivariate: PR approx. equal among under-screeners (OR = 0.99,
0.98-1.00), over-screeners (OR = 1.00, 0.99-1.01) vs. adherent
women
Bowen et al.,
2003, U.S.
[46]
Relatives aged 18-73 of
BC cases (N = 357)
(1 blood relative)
CR Absolute risk –
0 to 100 ≤ 24 months
Multivariate: PR approx. equal among women who screened (OR =
1.00, 0.99-1.20) vs. did not screen
Lindberg &
Wellisch,
2001, U.S.
[47]
Patients aged 15-78 of a
high-risk BC clinic
(N =430)
(self-reported family
history)
CR Absolute lifetime risk –
0 to 100%
Guideline-compliant -
1 (‘generally’) to 3
(‘rarely’)
Bivariate: No correlation between PR and screening compliance
(r = 0.02, p >0.01)
* Design: CR = Cross-sectional; CO = Cohort; CC = Matched Case-Control
61
Table 2. Perceived Risk of Breast Cancer (Verbal Scale) and Adherence to Mammography Guidelines
Author, Year,
Country
Sample (N)
(Family History)
Design* Perceived Risk (PR) Measure Definition of Screening
Adherence
Result
Significant Positive Association
Zhang et al.,
2011,
Canada
[44]
Relatives aged 20-69 of
BC cases (N = 1019)
(1st-degree relative)
CR
Comparative lifetime risk
(same-aged women) - 1
(‘much below avg.’) to 5
(‘much above avg.’)
≤ 12 months
Multivariate: Women with PR ‘above’/‘much above’ more
likely to screen (OR = 1.82, 1.17-2.81) vs. PR
‘same’/’below’/’much below’
Somers et al.,
2009,
U.S.
[48]
Relatives aged 22-69
recruited through the
community (N = 187)
(1st-degree relative)
CO
Absolute and comparative
risk (same-aged women); 4-
item sum score
≥ 40: annual, < 40:
speak with health care
professional
Bivariate: Perceived risk significantly correlated with
adherence
(r = 0.27, p <0.001)
Lemon et al.,
2006,
U.S.
[49]
Relatives aged 18+ of
BC cases (N = 577)
(1st-degree relative)
CO
Comparative risk (women
without family history) - 1
(‘much lower’) to 5 (‘much
higher’)
Within 1 year of
relative’s diagnosis
Multivariate: Among women 50-75, adherence higher among
those with ‘higher’ PR (OR = 2.90, 1.29-6.50, p = 0.01) vs.
‘same /lower’ PR. Adherence was not higher among women
with PR ‘much higher’ (OR = 1.43, 0.60-3.43, p = 0.42) vs.
‘same/lower’
Finney-
Rutten &
Iannotti,2003,
U.S. [50]
Women due for annual
screen (N = 300)
( ≥ 1 relative with BC)
CR
Absolute risk - 1 (‘extremely
unlikely’) to 7 (‘extremely
likely’)
Within 2 months of
reminder letter
Multivariate: Women with higher PR more likely to screen
(OR = 1.41, 1.05-1.89) vs. lower PR
Non-Significant Positive Association
Isaacs et al.,
2002,
U.S.
[51]
Genetic test patients
aged 30+ (N = 216)
(10% probability of
being BRCA1/2+ or
BRCA1/2+ relative)
CR
Comparative risk (same-age
women) - 1 (‘much lower’)
to 5 (‘much higher’) ≤ 12 months
Bivariate: Women with ‘higher’ PR more likely to screen
(69%) vs. women with ‘same/‘less’ PR (56%) (p >0.10)
Schildkraut et
al., 1995,
U.S.
[52]
Relatives aged 35+ of
BC cases (N = 967)
(1st-degree relative)
CR
Comparative risk (women
without relative with BC) - 1
(‘less’) to 4 (‘much higher’)
35-39: ever, 40-49: past
1-2 years, 50+: past year
Multivariate: Women with PR ‘greater’ (OR = 1.26, 0.74-2.14,
p =0.37) and ‘little greater’ (OR = 1.06, 0.65-1.73, p =0.81)
more likely to adhere vs. women with PR ‘same.’ PR ‘less’ less
likely to adhere (OR = 0.64, 0.31-1.34, p = 0.25)
62
Author, Year,
Country
Sample (N)
(Family History) Design* Perceived Risk (PR) Measure
Definition of Screening
Adherence Result
Non-Significant Negative Association
Polednak et
al., 1991,
U.S.
[53]
Randomly sampled
aged 50-75 (N = 141)
(mother, grandmother,
aunt, sister or daughter
with a BC diagnosis)
CR
Absolute lifetime risk – 0
(‘not at all’) to 4 (‘very
likely’) ≤ 12 months
Bivariate: Among 50-64 year olds: more women (57.1%) with
lower PR screened in past year vs. higher PR (42.9%) (p =
0.17), among 65-75 year olds: women with lower PR (26.7%)
and higher PR (30%) screened approx. equally (p = 0.90)
No Association
Martin &
Degner, 2006,
Canada
[54]
Patients aged 23+ from
hereditary BC clinic
(N = 56)
(BRCA1/2+ relative)
CO Absolute lifetime and general
risk - 1 (‘strongly agree’) to 5
(‘strongly disagree’); 3-items
50+: annual for past 3
years; < 50: ≥ 1 in past 3
years
Bivariate: More women with ‘moderate’ PR reported screening
than women with ‘high’ PR (p = 0.356)
Diefenbach et
al., 1999,
U.S.
[55]
Patients aged 18+ from
family risk program
(N = 213)
(1st-degree relative)
CO
Absolute lifetime risk -
1 (‘not at all likely’) to 3
(‘very likely’)
≤ 12 months Multivariate: PR not associated with adherence
(OR = 0.99, p = non-significant)
Drossaert et
al., 1996,
Netherlands
[56]
Women aged 50-69
invited for a
mammogram
(N = 379)
(1st-degree relative)
CR
Absolute and comparative
risk (other women) - 1 (‘very
small risk’) to 5 (‘very high
risk’); 5-item sum score
Screen use following
invitation
Bivariate: No association between PR and screening
(correlation coefficients and probability values not presented,
defined as ‘very weak’)
Audrain et
al., 1995,
U.S.
[57]
Women identified by
High Risk BC
Consortium
(N = 395)
(1st degree relative)
CR
Comparative lifetime risk
(women without close
relative with BC) - 1
(‘lower’) to 4 (‘much
higher’)
≤ 12 months, 1-2 yrs, >
2 yrs or never
Multivariate: No association between PR and screening
(estimates not presented, p >0.05)
Lerman et al.,
1993,
U.S.
[58]
Relatives aged 35-79 of
BC cases (N = 140)
(1st-degree relative)
CR
Absolute risk - 0 (‘no chance
of developing BC’) to 10
(‘will get BC’); comparative
risk (relative to avg. woman)
- 1 (‘much more’) to 5
(‘much less’); 2 items
35-39: ever; 40-49: past
2 years; 50+: past year
Bivariate: No association between PR and screening
(coefficients or probability values not presented, defined as
non-significant)
* Design: CR = Cross-sectional; CO = Cohort; CC = Matched Case-Control
63
Table 3. Perceived Risk of Breast Cancer and Adherence to Clinical Breast Examination (CBE) Guidelines
Author, Year,
Country
Sample (N)
(Family History)
Design* Perceived Risk (PR)
Measure
Definition of Screening
Adherence
Result
Significant Positive Association
Kash et al.,
1992,
U.S.
[28]
Women from Breast
Protection Program
(N = 217)
(1st-degree relative)
CR
Question not provided –
‘low/no chance,’
‘moderately likely,’ ‘very/
extremely likely’
≤ 6-months Bivariate: Trend towards positive correlation between PR and
adherence (d = 0.41, t = 0.06)
Non-Significant Positive Association
Zhang et al.,
2011,
Canada
[44]
Relatives aged 20-69 of
cases of invasive BC
(N = 1019)
(1st-degree relative)
CR
Absolute lifetime risk – 0 to
100
Comparative lifetime risk
(same-aged women) - 1
(‘much below avg.’) to 5
(‘much above avg.’)
≤ 12 months
Multivariate: Women with PR 50% or >50% more likely to
screen (OR= 1.79, 0.82-3.92 and OR = 1.15, 0.62-2.13) vs. PR
<50%
Multivariate: Women with PR ‘above/much above average’
less likely to screen (OR = 0.80, 0.45-1.14) vs. PR
‘average/below average’
No Association
Isaacs et al.,
2002,
U.S.
[51]
Genetic test patients
aged 30+ (N = 216)
(10% probability of
being BRCA1/2+ or
BRCA1/2+ relative)
CR
Comparative lifetime risk
(same-age women) - 1
(‘much lower’) to 5 (‘much
higher’)
≤ 12 months Multivariate: PR not significantly associated with screening
(estimates not provided, p >0.05)
Price et al.,
2010,Aus/NZ
[23]
Female relatives of BC
cases (N = 748)
(multiple BC families)
CO Absolute lifetime risk – 0 to
100
0-6 screens within 3
years (based on age and
BC risk)
Multivariate: Under-screeners approx. equal to adherent
women with regards to PR (OR = 0.99, 0.98-1.00, p = ns)
Martin &
Degner, 2006,
Canada
[54]
Patients aged 23+ from
hereditary BC Clinic
(N = 56)
(BRCA1/2+ relative)
CO
Absolute lifetime and
general risk - 1 (‘strongly
agree’) to 5 (‘strongly
disagree’); 3-items
≥ 3 screens within 3
years
Bivariate: No significant difference between women reporting
moderate PR to high PR with regard to screening (p = 0.138)
Benedict et
al., 1997,
U.S.
[59]
Daughters aged 18+ of
mothers aged 40+ with
BC (N = 54)
(daughter of BC case)
CR Absolute risk (1 in x) – ‘1 in
2’ to “no chance’ Frequency of screening
Bivariate: No correlation between PR and screening frequency
(r = -0.0514, p = 0.72)
* Design: CR = Cross-sectional; CO = Cohort; CC = Matched Case-Control
64
Table 4. Perceived Risk of Breast Cancer and Adherence to Breast Self-Examination (BSE) Guidelines
Author, Year,
Country
Sample (N)
(Family History)
Design* Perceived Risk (PR)
Measure
Definition of Screening
Adherence
Result
Significant Positive Association
Brain et al.,
1999,
U.K.
[60]
Women identified by
hospital surgeons
(N = 833)
(1st-degree relative)
CR
Absolute and comparative
risk (average woman) – 1 to
5; 2 items
Infrequent: < monthly;
Appropriate:
monthly/bi-weekly;
Excessive:
weekly/daily+)
Multivariate: Women with excessive BSE practices had
significantly higher PR vs. women with appropriate or
infrequent practices (F=4.54, p ≤ 0.01). No significant
difference in PR between appropriate and infrequent
examiners.
Non-Significant Positive Association
Zhang et al.,
2011,
Canada
[44]
Relatives aged 20-69 of
cases of invasive BC
(N = 1019)
(1st-degree relative)
CR
Absolute lifetime risk –
0 to 100
Comparative lifetime risk
(same-aged women) - 1
‘much below average’ to 5
‘much above average’
≤ once per yr, every 2-6
months, ≥ monthly
Multivariate: Women with PR 50% less likely to screen every
2-6 months (OR = 0.68, 0.37-1.25) and PR ≥50% more likely
to screen ≥ once/month (OR = 1.16, 0.66-2.05) vs. PR < 50%
Multivariate: Women with PR ‘above’/’much above’ average
more likely to screen every 2-6 months (OR = 1.13, 0.72-1.75)
and ≥ once/month (OR = 1.64, 1.02-2.63)
Significant Negative Association
Kash et al.,
1992,
U.S.
[28]
Women from Breast
Protection Program
(N = 217)
(1st-degree relative)
CR
Question not provided –
‘low/no chance,’
‘moderately likely,’ ‘very/
extremely likely’
≥ monthly
Bivariate: More women with high PR never performed BSE vs.
women with moderate PR; women with moderate PR more
frequently performed monthly BSE vs. women with high PR
(p <0.05)
Lindberg &
Wellisch,
2001,
U.S.
[47]
Patients aged 15-78 of a
high-risk BC clinic
(N =430)
(self-reported family
history)
CR Absolute lifetime risk –
0 to 100%
Compliance (3 pt. scale
from ‘generally’ to
‘rarely’)
Bivariate: High PR correlated with poorer compliance
(r = .16, p = 0.01)
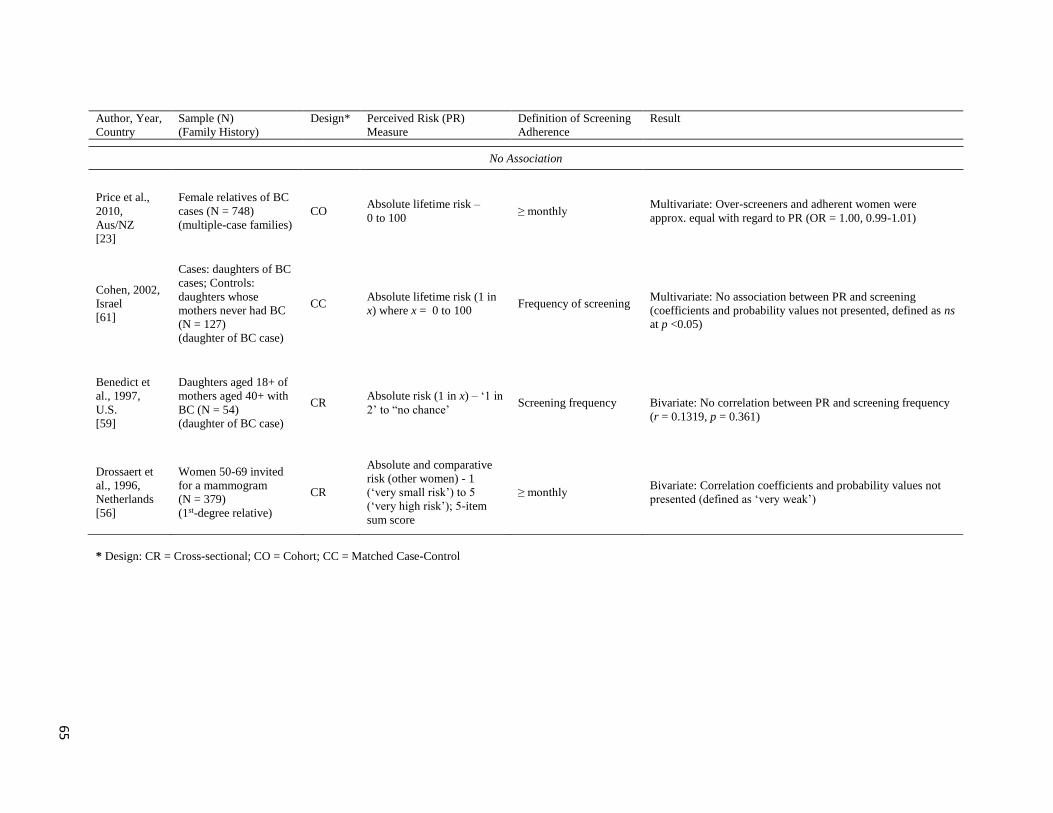
65
Author, Year,
Country
Sample (N)
(Family History)
Design* Perceived Risk (PR)
Measure
Definition of Screening
Adherence
Result
No Association
Price et al.,
2010,
Aus/NZ
[23]
Female relatives of BC
cases (N = 748)
(multiple-case families)
CO Absolute lifetime risk –
0 to 100 ≥ monthly
Multivariate: Over-screeners and adherent women were
approx. equal with regard to PR (OR = 1.00, 0.99-1.01)
Cohen, 2002,
Israel
[61]
Cases: daughters of BC
cases; Controls:
daughters whose
mothers never had BC
(N = 127)
(daughter of BC case)
CC Absolute lifetime risk (1 in
x) where x = 0 to 100Frequency of screening
Multivariate: No association between PR and screening
(coefficients and probability values not presented, defined as ns
at p <0.05)
Benedict et
al., 1997,
U.S.
[59]
Daughters aged 18+ of
mothers aged 40+ with
BC (N = 54)
(daughter of BC case)
CR Absolute risk (1 in x) – ‘1 in
2’ to “no chance’ Screening frequency Bivariate: No correlation between PR and screening frequency
(r = 0.1319, p = 0.361)
Drossaert et
al., 1996,
Netherlands
[56]
Women 50-69 invited
for a mammogram
(N = 379)
(1st-degree relative)
CR
Absolute and comparative
risk (other women) - 1
(‘very small risk’) to 5
(‘very high risk’); 5-item
sum score
≥ monthly Bivariate: Correlation coefficients and probability values not
presented (defined as ‘very weak’)
* Design: CR = Cross-sectional; CO = Cohort; CC = Matched Case-Control
66
2.4 Summary of Evidence and Rationale for the Current Study
Effect of screening mammography and level of familial risk on breast outcomes in
women with a family history of breast cancer
There is evidence that a significant reduction in breast cancer mortality can be achieved
through mammography screening among average risk women aged 50 to 69 years. However, the
impact of mammography screening on reducing mortality specifically in younger women, and
women with a family history of breast and/or ovarian cancer remains unknown. Several studies
have demonstrated that women with a family history of breast cancer may benefit from regular
screening mammography, finding that women with a family history of breast cancer have higher
cancer detection rates compared with women with a negative family history, and that screen-
detected tumors are significantly smaller, free of nodal or distant metastases, and diagnosed
earlier compared with symptomatic cancers in women with a family history. However, the effect
of level of familial breast cancer risk on screening outcomes has not been evaluated. This
evidence is required to develop definitive screening guidelines for women with a range of
increased risks of developing breast cancer due to family history.
Effect of perceived breast cancer risk on breast cancer screening behaviours
The relationship between perceived risk of breast cancer and breast cancer screening in
women with familial risk has been investigated in a number of observational epidemiologic
studies, but never previously reviewed. Our review demonstrated a weak positive association
between higher levels of perceived risk and adherence to screening mammography guidelines,
but noted a number of important limitations, including a lack of consistency in the measurement
of perceived risk, and limited generalizability due to inclusion of only women from high-risk
clinical settings. Most importantly, the large majority of previous studies were cross-sectional,
67
limiting the ability to determine the temporal sequence between perceived risk and breast cancer
screening. It is likely that women’s recent breast cancer screening histories also affect their risk
perceptions. Thus, previous cross-sectional results which suggest higher levels of perceived risk
motivate screening may be explained by temporal bias. While four prospective studies have
been conducted (Price et al., 2010; Somers et al., 2009; Lemon et al., 2006; Diefenbach et al.,
1999), their internal validity and generalizability are limited. Further prospective research is
needed to clarify this relationship. A clearer understanding of how women with a family history
perceive their risk, and how perceived risk affects breast cancer screening use will guide risk
education and management efforts to increase screening participation in this population.
Accuracy of self-reported screening mammography data
Self-reported mammogram data is widely relied on in the context of epidemiologic research
for evaluating the use of breast cancer screening, due to the costs and difficulties of accessing
administrative data for these purposes. The validity of self-reported mammogram use has been
studied extensively in women with population-level breast cancer risk. Overall, the validity of
self-reported mammogram data has been demonstrated; however, these data are much less
accurate in determining the precise timing of screening. Only two studies (Pijpe et al., 2011;
Larouche et al., 2012) have validated self-reported mammogram dates in women with a family
history of breast cancer, including only women with confirmed or suspected BRCA1/2
mutations. These women likely differ in their screening behaviours, and ability to recall their
screening episodes compared to women in the broader population with familial risk. This study
provides the first evidence of the accuracy of self-reported mammogram dates in women with
varying levels of familial breast cancer risk.
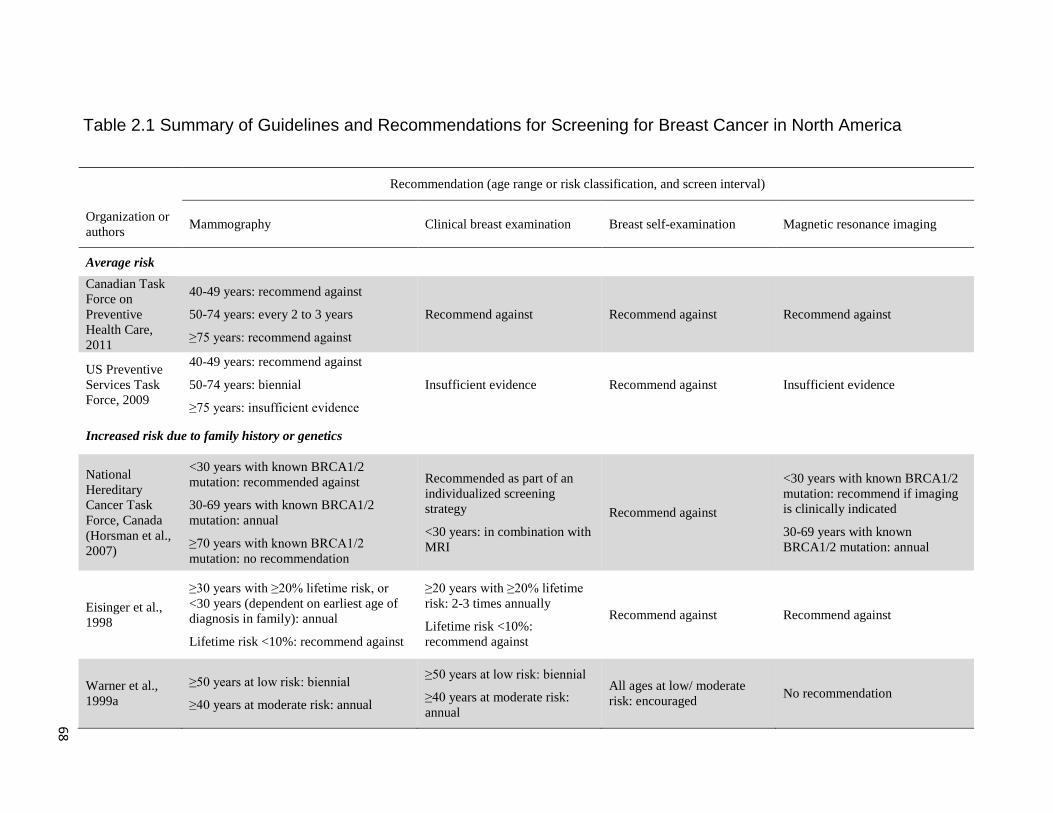
68
Table 2.1 Summary of Guidelines and Recommendations for Screening for Breast Cancer in North America
Recommendation (age range or risk classification, and screen interval)
Organization or
authors Mammography Clinical breast examination Breast self-examination Magnetic resonance imaging
Average risk
Canadian Task
Force on
Preventive
Health Care,
2011
40-49 years: recommend against
50-74 years: every 2 to 3 years
≥75 years: recommend against
Recommend against Recommend against Recommend against
US Preventive
Services Task
Force, 2009
40-49 years: recommend against
50-74 years: biennial
≥75 years: insufficient evidence
Insufficient evidence Recommend against Insufficient evidence
Increased risk due to family history or genetics
National
Hereditary
Cancer Task
Force, Canada
(Horsman et al.,
2007)
<30 years with known BRCA1/2
mutation: recommended against
30-69 years with known BRCA1/2
mutation: annual
≥70 years with known BRCA1/2
mutation: no recommendation
Recommended as part of an
individualized screening
strategy
<30 years: in combination with
MRI
Recommend against
<30 years with known BRCA1/2
mutation: recommend if imaging
is clinically indicated
30-69 years with known
BRCA1/2 mutation: annual
Eisinger et al.,
1998
≥30 years with ≥20% lifetime risk, or
<30 years (dependent on earliest age of
diagnosis in family): annual
Lifetime risk <10%: recommend against
≥20 years with ≥20% lifetime
risk: 2-3 times annually
Lifetime risk <10%:
recommend against
Recommend against Recommend against
Warner et al.,
1999a
≥50 years at low risk: biennial
≥40 years at moderate risk: annual
≥50 years at low risk: biennial
≥40 years at moderate risk:
annual
All ages at low/ moderate
risk: encouraged No recommendation
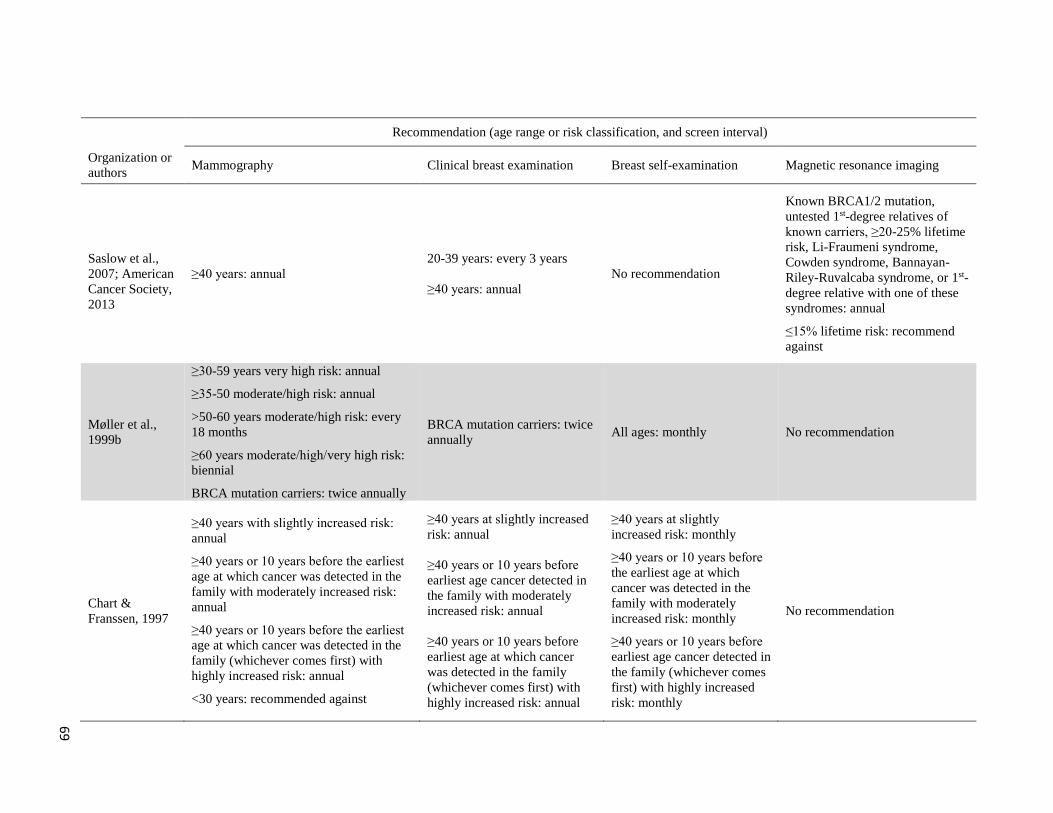
69
Recommendation (age range or risk classification, and screen interval)
Organization or
authors Mammography Clinical breast examination Breast self-examination Magnetic resonance imaging
Saslow et al.,
2007; American
Cancer Society,
2013
≥40 years: annual
20-39 years: every 3 years
≥40 years: annual
No recommendation
Known BRCA1/2 mutation,
untested 1st-degree relatives of
known carriers, ≥20-25% lifetime
risk, Li-Fraumeni syndrome,
Cowden syndrome, Bannayan-
Riley-Ruvalcaba syndrome, or 1st-
degree relative with one of these
syndromes: annual
≤15% lifetime risk: recommend
against
Møller et al.,
1999b
≥30-59 years very high risk: annual
≥35-50 moderate/high risk: annual
>50-60 years moderate/high risk: every
18 months
≥60 years moderate/high/very high risk:
biennial
BRCA mutation carriers: twice annually
BRCA mutation carriers: twice
annually All ages: monthly No recommendation
Chart &
Franssen, 1997
≥40 years with slightly increased risk:
annual
≥40 years or 10 years before the earliest
age at which cancer was detected in the
family with moderately increased risk:
annual
≥40 years or 10 years before the earliest
age at which cancer was detected in the
family (whichever comes first) with
highly increased risk: annual
<30 years: recommended against
≥40 years at slightly increased
risk: annual
≥40 years or 10 years before
earliest age cancer detected in
the family with moderately
increased risk: annual
≥40 years or 10 years before
earliest age at which cancer
was detected in the family
(whichever comes first) with
highly increased risk: annual
≥40 years at slightly
increased risk: monthly
≥40 years or 10 years before
the earliest age at which
cancer was detected in the
family with moderately
increased risk: monthly
≥40 years or 10 years before
earliest age cancer detected in
the family (whichever comes
first) with highly increased
risk: monthly
No recommendation
70
Chapter 3 Study Methods
3.1 Summary of Study Design and Data Source
This thesis entailed a secondary analysis of data originally collected as part of the Family
History Study (FHS). Data collection for the FHS was near completed when the PhD candidate
became involved in this study. As such, all decisions regarding study design and variable
measurement were made previously by the study investigators. The PhD candidate was
independently responsible for conducting an extensive systematic review that led to the
development of explicit study objectives and hypotheses relevant to this thesis project, testing
specific hypotheses, conducting an extensive evaluation of methodological issues and data
quality, and drafting the resulting manuscripts in full. A more detailed description of the
candidate’s contribution is found in Chapter 6.
The FHS was a prospective cohort study undertaken by Dr. Anna Chiarelli (PI) et al.,
funded by the Canadian Cancer Society Research Institute, and Canadian Breast Cancer
Research Alliance (Appendix A). The FHS was additionally supported by the United States
National Cancer Institute, the Breast Cancer Family Registry and Cancer Care Ontario. The
FHS followed a cohort of 1114 women from the Ontario site of the Breast Cancer Family
Registry with a first-degree family history of breast and/or ovarian cancer over a two year
period, interviewing them at annual intervals. The primary objectives of the FHS were to
evaluate the effectiveness of breast cancer screening and to identify determinants of breast
cancer screening behaviours, in women with varying levels of familial risk.
71
3.2 Study Population and Sample
3.2.1 Ontario site of the Breast Cancer Family Registry
The National Cancer Institute’s Breast Cancer Family Registry (BCFR) was established
in 1995, and has six participating sites from the United States (New York, Philadelphia, Utah,
and San Francisco), Canada (Ontario) and Australia (Sydney/Melbourne). Families are
ascertained from cancer registries (population-based families) in San Francisco, Ontario and
Sydney/Melbourne, or seen in high-risk clinical and community settings (clinic-based families)
in New York, Philadelphia, Utah and in Sydney/Melbourne (John et al., 2004). In Ontario,
recruitment from clinic-based families was limited to families of Ashkenazi Jewish ancestry
(John et al., 2004). The BCFR includes lifestyle, medical history, and family history data, as
well as biospecimens, collected from more than 55,000 women and men from 14,000 families
with and without breast cancer for the purposes of studying the role of genetics in breast cancer.
The BCFR and its Ontario site have been previously described in further detail (John et al.,
2004; Sutherland et al., 2001; Knight et al., 2002). Briefly, with regard to the Ontario site of the
BCFR, cases of pathologically-confirmed invasive breast cancer (probands), diagnosed between
1996 and 1998 were identified by Drs. Irene Andrulis (PI) and Julia Knight (co-PI) from the
Ontario Cancer Registry (OCR). The OCR is a population-based tumor registry operated by
Cancer Care Ontario since its inception in 1964. It consists of computerized vital information on
all new cases of cancer (excluding non-melanoma skin cancers) within the province of Ontario
which are identified by using probabilistic record linkage to reconcile information from: (i)
pathology reports, (ii) electronic patient records from regional cancer treatment centres, (iii)
hospital discharge and ambulatory care records from the Canadian Institute for Health
Information, and (iv) death certificates from the Registrar General of Ontario. Completeness of
case ascertainment for the OCR is estimated to be 98% (McLaughlin et al., 1991).
72
A detailed flowchart of recruitment for the Ontario site of the BCFR is located in Figure
3.1. Those eligible to participate in the Ontario site of the BCFR include all women diagnosed
with breast cancer at age 20 to 54 years, a random sample (35%) of women diagnosed with
breast cancer at age 55 to 69 years, and all men diagnosed with breast cancer at age 20 to 79
years (Sutherland et al., 2001). Surgeons named on the pathology report were contacted to
obtain permission to mail their patients a cancer Family History Questionnaire (FHQ). The FHQ
collects information about first-degree relatives of breast cancer cases with regard to their age,
date of birth, status alive or dead, age and/or date of death, whether or not the relative has had
cancer, cancer type, and age and/or date of diagnosis, along with details of any cancers in other
relatives. Permission from physicians was granted for 91% of cases (n = 7668 of 8453).
Respondents meeting a defined set of criteria which deem them to be at moderate to high-risk of
breast cancer (Table 3.1) and a random sample (25%) of those not meeting criteria (deemed low
risk) were asked to participate in the Ontario site of the BCFR by completing a mailed risk
factor questionnaire and providing a blood sample. Of those eligible probands (n = 2587), 1851
(71.5%) probands participated.
Probands were then asked for address information and permission to contact specific
living relatives. These relatives include: proband’s first-degree relatives (children, siblings,
parents), living relatives diagnosed with breast and/or ovarian cancer and their first-degree
relatives, first-degree relatives of deceased relatives diagnosed with breast and/or ovarian
cancer, relatives with an adult-onset cancer diagnosed prior to 50 years of age (excluding
cervical, testicular, leukemia and lymphoma), and half-siblings on the “at-risk” side. An
invitation letter to participate in the Ontario site of the BCFR was sent to all identified relatives
(n = 8416), and the 5122 (60.9%) who agreed to be contacted were mailed a Personal History
Questionnaire (PHQ) between 1998 and 2004.
73
3.2.2. Family History Study
The Family History Study (FHS) was conducted several years (range: 2 to 7 years) after
the initial recruitment of relatives to the Ontario site of the BCFR. All female relatives of
proband cases of invasive breast cancer who were enrolled in the Ontario site of the BCFR, who
had completed a PHQ, were 20 to 69 years of age, still alive, residents of the province of
Ontario at the outset of the study, and unaffected by breast cancer at the time of the proband’s
diagnosis date were eligible to participate in the FHS. Of 3374 female relatives participating in
the Ontario site of the BCFR, 1514 met all study criteria as defined above (44.9%), and were
mailed a baseline Personal History and Screening Questionnaire (PHSQ) (Appendix B) for the
FHS between November 2005 and March 2007.
A detailed flowchart of recruitment for the FHS is located in Figure 3.2. Of the 1514
women to whom a baseline PHSQ was sent, 162 (10.7%) were lost to follow-up and 37 (2.4%)
were deemed ineligible (no longer residents of Ontario, or were deceased or otherwise ineligible
to participate due to a health issue), leaving 1315 (86.9%) women who were contactable and
eligible. Of the 1315 women contacted, 201 (15.3%) refused to complete a baseline PHSQ and
1114 (84.7%) completed it. Women had to be free of a breast cancer diagnosis to be eligible for
follow-up through the FHS. Of the 1077 women who were eligible to complete the year 1
PHSQ, 11 (1.0%) were lost to follow-up and 4 were deemed ineligible (0.4%), leaving 1062
(98.6%) women contactable and eligible. Of the 1062 women contacted, 87 (8.2%) refused to
complete the year 1 PHSQ and 975 (91.8%) completed it. Of the 969 women eligible to
complete a year 2 PHSQ, 32 (3.3%) were lost to follow-up and 1 was ineligible (0.1%), leaving
936 (96.6%) contactable and eligible women. Of the 936 women contacted, 54 (5.8%) refused to
complete the year 2 PHSQ and 882 (94.2%) completed it.
74
3.3 Data Collection
Data collection for the FHS took place from December 2005 to March 2011. Data were
drawn from four sources, including (i) questionnaires; (ii) pathology/surgical reports; (iii) the
Ontario Cancer Registry; and (iv) mammographic imaging reports. With regard to questionnaire
data, this included the self-administered PHQ completed during recruitment to the Ontario site
of the BCFR, as well as baseline, year 1 and year 2 PHSQ telephone-administered
questionnaires completed as part of the FHS. The PHQ consisted of 16 pages with 73 questions,
and collected information on socio-demographic characteristics (i.e. marital status, highest level
of education, ethnicity), breast cancer risk factors (i.e. height/weight, reproductive history,
previous exposure to radiation, history of smoking/alcohol use, use of HRT), surgical history,
and some information on previous mammogram use.
The baseline PHSQ consisted of 22 pages with 73 questions, and collected updated
information on socio-demographic characteristics, breast outcomes (diagnosis of breast cancer
or benign breast disease, breast surgeries), breast cancer screening use (mammography, CBE,
BSE, ultrasound or MRI) and use of other cancer screening tests (Pap test, trans-vaginal
ultrasound, cancer antigen-125 blood test, fecal occult blood test) since completion of the PHQ,
use of genetic testing or counselling since completion of the PHQ, behavioural characteristics
(i.e. perceived risk of breast cancer, worry about breast cancer, knowledge of breast cancer
screening guidelines), breast cancer risk factors (i.e. reproductive history, menopausal status,
use of HRT), and other general health-related characteristics (i.e. self-reported general health,
current depression, smoking/alcohol use since completion of the PHQ, physical activity during
the previous two years). The year 1 and year 2 follow-up PHSQs consisted of 13 pages with 36
questions, and collected updated information on breast outcomes, use of breast cancer screening
and genetic testing or counselling since completion of the previous PHSQ, behavioural
75
characteristics and general health-related characteristics. Approximately two weeks prior to
being contacted by FHS personnel by telephone, an introductory letter and hard copy of the
PHSQ was mailed to the subject, allowing respondents time to recall specific dates and events,
check personal records prior to being interviewed, and refer to the questionnaire during the
interview. This method was previously found to result in high response rates and more complete
data than achieved by self-administered questionnaires (Chiarelli et al., 2000; Chiarelli et al.,
1999). PHQ data were provided to FHS staff in an Excel spreadsheet using a unique
identification number for each subject assigned by the Ontario site of the BCFR. PHSQ
response data were transcribed on to hard copies of the questionnaire during the telephone
interview, and entered into an Access dataset by trained study staff. All FHS participants were
assigned a unique identification number, in addition to the unique identifier assigned by the
Ontario site of the BCFR.
Pathology data were abstracted from pathology and surgical reports, where women self-
reported a diagnosis of breast cancer or benign breast disease and provided written informed
consent to release these reports to the FHS (Appendix C). Data on cancer stage were obtained
from the OCR for cases of invasive breast cancer. Where women reported that they had a
mammogram since the previous interview and provided written informed consent to release the
imaging report to the FHS (Appendix D), mammography data were abstracted from imaging
reports by trained research clerks. As part of a data quality assessment, the PhD candidate
performed logic checks on all mammographic imaging data. As a result, the candidate re-
abstracted and entered a small proportion (7.1% at baseline, 6.5% at year 1, 5.3% at year 2) of
the imaging data that were found to contain errors.
76
3.4 Variable Definitions
3.4.1 Familial Breast Cancer Risk Classification
Classifications for familial breast and/or ovarian cancer risk were based on previously
referenced groups for familial breast cancer risk (Eccles et al., 2000; Cortesi et al., 2006), with
modifications based on key evidence (Collaborative Group on Hormonal Factors in Breast
Cancer et al., 2001; Bevier et al., 2011; Vencken et al., 2013; National Institute for Health Care
and Excellence [NICE], 2013; Egan et al., 1996; Toniolo et al., 1996) and expert opinion. Data
were collected from the FHQ, which was completed by the relative’s proband during
recruitment to the Ontario site of the BCFR, as well as with ongoing updates. The two main
models used were developed by Eccles et al. (2000) and Cortesi et al., (2006), based on the Gail
model (Gail et al., 1989), the Claus tables (Claus et al., 1991), and the BRCAPRO model
(Parmigiani et al., 1998), to classify women as having low, moderate or high familial breast
and/or ovarian cancer risk (Table 3.2).
Minimal modifications were made to the main models to ensure women were accurately
classified, as there was a wide range of familial breast and/or ovarian cancer histories in our
study cohort, which were not described by these models. Modifications were included for
women with a first-degree family history of male breast cancer, as risks are increased above the
2- to 3-fold increased risk for women with 1 first-degree male relative, when a first-degree
female relative is also diagnosed with breast cancer (Bevier et al., 2011). The women in our
cohort with affected male relatives also had affected female relatives, thus these women were
classified as high risk. We also classified women with 2 or more affected first-degree relatives
as high risk, based on the key paper from the Collaborative Group on Hormonal Factors in
Breast Cancer (2001), which found a relative risk for women with 2 affected first-degree
77
relatives of 2.93 (95% CI: 2.37-5.63), and 3.90 (95% CI: 2.03-7.49) for women with 3 or more
affected first-degree relatives, respectively. A few (n = 3) women in our cohort had a personal
history of ovarian cancer. These women were classified as high-risk because they also had
extensive first- and second-degree familial history of breast and/or ovarian cancer,
demonstrating increased likelihood of carrying a BRCA1/2 gene mutation. BRCA1/2 carriers
were recently demonstrated to have a 10-year risk of breast cancer of 11% following an ovarian
cancer diagnosis (Vencken et al., 2013). The United Kingdom’s NICE clinical guideline CG164
recommends that women with 10-year risks of breast cancer greater than 8% be classified as
high risk (NICE, 2013). Egan et al. (1996) found Ashkenazi Jewish women with a first-degree
family history of breast cancer have a relative risk of 3.78 (95% CI: 1.74-8.16), while Toniolo et
al. (1996) found a more modest relative risk of 1.69 (95% CI: 1.16-2.45). To ensure a
conservative estimate, we classified Ashkenazi women as moderate risk. A number of women in
our cohort also had a first-degree female relative with breast cancer, and additionally, 2 or more
second-degree relatives with breast cancer. Based on expert opinion, these women were
classified as moderate risk.
A number of statistical breast cancer risk estimation models have been developed over
the past two decades. A detailed summary of these models is located in Table 3.3. The Gail
model (Gail et al., 1989) was originally developed in 1989 to ascertain eligibility for the Breast
Cancer Prevention Trial, and subsequently modified in 1999 to take into account other factors,
including ethnicity (Costantino et al., 1999). The Gail model has been validated in a number of
databases (Amir et al., 2010). A recent systematic review found that the Gail model was well-
calibrated, but had limited discriminatory accuracy when evaluated using receiver operating
characteristic (ROC) curves (the area under the curve [AUC] ranged from 0.58 to 0.62)
(Cummings et al., 2009). The Gail model was additionally extended by Chen et al. (2006), to
78
incorporate breast density. While the extended Gail model had improved discriminatory
accuracy over the original Gail model, it has been criticized for using a continuous measure of
density (% mammographic density), which is not routinely available in the clinical setting. The
Claus model (Claus et al., 1991) is also commonly used. While the Claus model incorporates
more detailed information about family history compared with the Gail model (second-degree
relatives, and age of relative’s breast cancer diagnosis), it does not include hormonal or other
breast cancer risk factors. The concordance between risk estimates produced by the Gail and
Claus models has been shown to be low (Amir et al., 2010). Jonker et al. (2003) developed an
extended Claus model which includes family history of bilateral breast cancer and ovarian
cancer, but similarly does not include other breast cancer risk factors. The BRCAPRO model
(Parmigiani et al., 1998) uses a software program to estimate the risk of carrying a BRCA
mutation, as well as determine lifetime risk of breast cancer using a Bayesian statistical
algorithm (Amir et al., 2010). BRCAPRO incorporates unaffected and affected relatives, and
can handle complex familial cancer histories; however, like the Claus model, it does not
incorporate other breast cancer risk factors (Amir et al., 2010). The International Breast
Intervention Study (IBIS) or Tyrer-Cuzick model (Tyrer et al., 2004), attempted to address some
of the limitations of previous models by incorporating detailed first- and second-degree cancer
family history, as well as hormonal and other breast cancer risk factors, including history of
benign breast disease. Similar to the Claus models and BRCAPRO, the Breast and Ovarian
Analysis of Disease Incidence and Carrier Estimation Algorithm (BOADICEA) incorporates
detailed cancer family history, but does not include other breast cancer risk factors. BOADICEA
is recommended in the NICE clinical guideline CG164 (NICE, 2013), and has been incorporated
into the guidelines of several countries for the management of familial breast cancer (Lee et al.,
2014), including the OBSP high risk screening program along with IBIS.
79
Amir et al. (2003) conducted a prospective study to evaluate the Gail, BRCAPRO
(Claus) and IBIS models, finding that IBIS (AUC = 0.762) was the most accurate model for
predicting breast cancer risk, compared with the Gail (AUC = 0.735) and BRCAPRO (Claus)
(AUC = 0.716) models. It was also noted that Gail and BRCAPRO (Claus) underestimated
breast cancer risk (Amir et al., 2003). A subsequent retrospective study evaluated the Gail, Gail
2 (Jonker et al., 2003), Claus, IBIS and BOADICEA models, and demonstrated that the Gail,
Gail 2, and Claus models underestimated breast cancer risk, and concluded that the IBIS and
BOADICEA models have the highest accuracy for predicting breast cancer risk (Jacobi et al.,
2009).
3.4.2 Breast Cancer Screening Measures
Self-reported data were collected on the use of several breast cancer screening modalities
in both the self-administered PHQ and the telephone-administered PHSQs. In the PHQ, women
were asked if they had ever had a mammogram, to provide the date of their last mammogram,
and how many mammograms over their lifetime they had undergone. Women were asked during
the baseline, year 1 and year 2 PHSQ interview if they had undergone mammography, CBE,
BSE, breast ultrasound and breast MRI since completion of their previous interview. For
mammography and CBE, women were asked to specify the month and year, or their age at their
last examination. For mammography, CBE, breast ultrasound and MRI, women were asked to
indicate the main reason for having their examination. Response options included: ‘part of a
regular check-up or routine screening’, ‘part of the Ontario Breast Screening Program’, ‘family
history of breast cancer’, or ‘breast problem or symptom’. Women could also provide other
relevant reasons using an open-ended option. In the year 1 and 2 PHSQs, an additional response
option was, ‘being part of this study’. The first three response options (‘part of a regular check-
up or routine screening’, ‘part of the OBSP’ and ‘family history of breast cancer’) were coded as

80
screening, and the response ‘breast problem or symptom’ was coded as diagnostic. Finally,
women who reported having a mammogram were also asked to indicate anything that had
encouraged them to obtain a mammogram. Response options included: ‘family physician,’
‘familial cancer genetic clinic,’ ‘family member,’ ‘friend,’ ‘family member with breast cancer,’
‘someone with breast cancer,’ ‘media’ or ‘community presentation’.
Mammogram data were also abstracted from imaging reports among women who
reported undergoing mammography, consented to release the imaging report, and where the
relevant imaging report was obtained from the imaging facility. Specifically, the mammogram
date (day, month and year), the imaging clinic, indication for the mammogram (screening or
diagnostic/follow-up), as well as the mammographic finding, as given by the Breast Imaging -
Reporting and Data System (BI-RADS) assessment (Balleyguier et al., 2007), were abstracted
by trained research clerks.
3.4.3 Pathologic Measures
The self-reported date and location of any diagnosis of breast disease (breast cancer or
benign breast disease) were obtained from the PHSQ, and written informed consent was
obtained granting access to pathology and surgical records. Copies of relevant reports were
requested from the OCR and medical record departments of hospitals and/or clinics. Reports
were obtained and reviewed for all diagnoses of breast cancer or benign breast disease by the
pathology consultant (Dr. Mitra Nabavi). Histology, tumor characteristics, as well as severity of
benign breast disease were abstracted from pathology and surgical records.
Invasive breast cancer includes the diagnosis of primary invasive breast cancer of any
histologic type. For invasive breast cancers, a number of tumor characteristics were abstracted.
Tumor size was recorded in millimeters, and was defined as the largest diameter (tumor size is
81
typically measured in three dimensions) of the primary invasive carcinoma, as measured before
any tissue is removed. Multifocal tumors were sized using the largest diameter of the largest
centre. Tumor size was categorized as ≤15 millimeters and >15 millimeters. Among women
who had axillary assessment with either sentinel lymph node biopsy or axillary node dissection,
lymph node status was defined as positive if the cancer had invaded any of the sentinel or other
lymph nodes, or negative if there were no positive lymph nodes. The TNM staging classification
from the 6th Edition of the AJCC Cancer Staging Manual (Greene et al., 2002) was used for the
pathologic staging of breast cancers (Greene et al., 2002). The TNM classification takes into
account tumor size (T), nodal involvement (N), and the presence of distant metastasis (M), and
is located in Table 3.4. In the majority of cases, stage was obtained directly from the OCR.
However, in several cases where stage was unavailable from the OCR, but pathology/surgical
reports contained sufficient data on tumor size, lymph node involvement and distant metastasis,
invasive cancers were staged by the pathology consultant. TNM stage was defined as follows: I,
IIa, IIb, IIIa, IIIb, IIIc, or IV, and further grouped as stage I and stage II-IV to increase power
for sub-group analyses. The AJCC TNM stage groupings are located in Table 3.5.
Histopathologic grading of invasive carcinomas was performed using the Nottingham
grading system (Elson & Ellis, 1991). The Nottingham grading system takes into account
individual scores for tubule formation, nuclear pleomorphism and mitotic rate. Grades were
categorized as I, II or III. Tumors were classified as grade I if the combined score was 3-5 (well-
differentiated), grade II if the combined score was 6-7 (moderately-differentiated) or grade III if
the combined score was 8-9 (poorly-differentiated). Additional detail regarding scoring for
tubule formation, nuclear pleomorphism, and mitotic rate can be found in Section 2.1.2. Mitotic
rate was determined by assessing the number of mitoses per 10 high powered fields, which were
standardized to the field diameter of the high power objective and classified as low (score 1),
82
intermediate (score 2) or high (score 3). The absence or presence of lymphovascular invasion
within the endothelial-lined channels of the breast was also recorded. Estrogen receptor (ER)
and progesterone receptor (PR) status was defined as positive if immunohistochemical (IHC)
assays showed >1% tumor cell positivity, or otherwise defined as negative (Hammond et al.,
2010).
Ductal carcinoma in situ (DCIS) included intraductal carcinoma and Paget’s disease of
the nipple with no invasive component. Breast cancer diagnoses that had components of both
DCIS and invasive breast cancer were classified as invasive cancers. Pathologic characteristics
of cases of DCIS were abstracted, including: nuclear grade, necrosis, architectural type, extent,
and the presence of calcifications or microinvasion. However, as there were few cases of DCIS
with no invasive component in our study population (n = 6), pathologic characteristics were not
examined for this subgroup. Cases of BBD were categorized by severity according to their
relative risk for subsequent breast cancer, as detailed in Chapter 2, Sections 2.1.1 and 2.1.5:
fibrocystic changes or proliferative breast disease without atypia was classified as mild (RR for
subsequent breast cancer = 1.5 to 2.0), proliferative breast disease with atypical hyperplasia was
classified as moderate (RR = 3.5 to 6.0), and LCIS was classified as severe (RR = 10.0). As few
cases of BBD were moderate or severe (n = 12), these categories were combined for analyses
which examined severity of BBD.
3.4.4 Perceived Breast Cancer Risk Measures
Given the lack of consensus regarding the optimal method to measure perceived risk,
and the differences in risk estimates produced by varying questions, two questions previously
developed by Lipkus et al. (2000), were used to measure perceived risk in the FHS. The first
question measured perceived risk on an absolute numeric scale, and asked women: “on a scale
83
from 0 to 100, where 0 = certain not to happen, and 100 = certain to happen, how likely are you
to get breast cancer in your lifetime?” Based on the distribution of numeric perceived risk in the
sample (Figure 3.3), and strong preference for reporting a perceived risk of exactly 50%,
categorical measures were also derived. Analyses including both the continuous numeric and 3-
level categorized variables were conducted for Objective 2; however, only the 3-level
categorized variable is shown in Manuscript 2 due to low statistical power when using the 5-
level categorized measure.
The second question measured perceived risk on a comparative Likert-type verbal scale,
by asking subjects: “compared to other women your age, how likely are you to get breast cancer
in your lifetime?” Response anchors included: ‘much below average’, ‘below average’, ‘same as
average risk’, ‘above average’, ‘much above average’, or ‘don’t know’. As extremely few
women perceived their risk as much below average (n = 8, <1%) and few women perceived
their risk as below average (n = 42, 4.7%), these categories were combined with women who
reported their risk was same as average (n = 265, 30.0%). Similarly, few women reported their
risk was much above average (n = 81, 9.2%), so this category was combined with the above
average category (n = 488, 55.2%) for analyses.
Internal consistency between the absolute numeric scale and comparative verbal scale
measures of perceived risk was estimated using Cronbach’s alpha (). The low level of
correlation observed ( = 0.67) was not unexpected, given the differences that exist between
different models for measuring perceived risk that are discussed in detail in Manuscript 1. A
previous study similarly found correlation between numeric and comparative measures of
perceived breast cancer risk to be r = 0.60 (Gurmankin Levy et al., 2006). The study also found
the numeric and comparative measures had similarly high rates of sensitivity (0.91 for numeric,
0.86 for comparative) and specificity (0.99 for numeric, 0.96 for comparative) for identifying
84
women with very high risk perceptions (perceived risk of ≥50%) (Gurmankin Levy et al., 2006).
In Manuscript 3, 76% of women in our study reported a perceived risk of 50% or more.
Perceived risk was measured in the PHSQ questionnaires using the absolute numeric scale,
followed by the comparative verbal scale, and separated by five questions regarding breast
cancer worry, confidence in several breast cancer screening modalities to detect cancer,
knowledge regarding screening intervals and knowledge regarding appropriate age to start and
stop screening mammography. Previous research has demonstrated that risk perceptions may be
lower when a question measuring comparative risk precedes an item measuring absolute risk
(Taylor et al., 2002), thus, the risk perceptions observed in the FHS may be slightly elevated.
3.4.5 Potential Confounders
Confounders for each analysis were chosen a priori, based on evidence from previous
literature or theoretical grounds for inclusion. Confounders were not excluded based on a lack of
statistical significance during univariate testing, as this method can exclude variables known to
be important (Szklo & Nieto, 2007; Mickey & Greenland, 1989). Age (at interview or diagnosis
of breast cancer or BBD) was included in all adjusted models. For Manuscript 3, variables that
changed the effect estimates by a minimum of 5% in one or more of the full models were
retained in the final adjusted models. This conservative cut-off was chosen to reduce residual
confounding. As missing confounder data were minimal (<2.5% for all confounders), the
relative gain in precision afforded by using a higher change in parameter cut-off value (i.e. 10%
or 15%) was negligible.
Age at interview was calculated as the difference in years between the woman’s date of
birth and completion date of the relevant PHSQ interview (for women without a breast
diagnosis). Age at diagnosis was calculated as the difference in years between the woman’s date
85
of birth and date of diagnosis of breast cancer or BBD. The method employed to estimate age
takes into account leap years and does not use month or year mid-points, instead relying on real
calendar dates which account for the fluctuations in lengths of months and years in the modern
Gregorian calendar. Stratified analyses for Objective 1 used age categories of <50 years and ≥50
years. Descriptive analyses for Objective 2 used age categories of 25-29, 30-39, 40-49, and ≥50.
Descriptive analyses for Objective 3 used age categories of <40 years, 40-49 years, and ≥50
years. All other analyses, and model adjustments used the continuous measure of age.
Age at menarche (age at first menstrual period) was self-reported by women in the PHQ
completed during recruitment to the Ontario site of the BCFR. Parity was determined based on
combined responses to the PHQ and baseline PHSQ interviews. Women who reported giving
birth once or more were classified as parous, and otherwise classified as nulliparous.
Menopausal status was determined with combined responses to the PHQ and baseline PHSQ.
Women who reported that their menstrual periods had stopped for at least 1 year were classified
as menopausal, or otherwise classified as peri-menopausal/pre-menopausal. HRT use was
determined using combined responses from the PHQ and baseline PHSQ, and restricted to post-
menopausal women only. Post-menopausal women were classified as ever HRT users if they
reported ever or currently using HRT, or otherwise classified as non-users. History of BBD was
determined based on combined responses to the PHQ and baseline PHSQ. Women were asked:
“has a doctor ever told you that you had benign breast disease (non-cancerous lump or cyst or
breast lump) that was not breast cancer?” Women who reported they had ever been told they had
BBD were classified as having a positive history, or otherwise classified as negative.
Education was based on self-reported highest level of education achieved as reported at
the baseline PHSQ. Response options included: less than high school, some or all of high
school, vocational or technical school, some college or university, and Bachelor’s degree or
86
higher. These categories were further collapsed into a 3-category measure (≤ high school, some
college or university/vocational or technical school, ≥ Bachelor’s degree) in the analyses for
Objectives 2 and 3. Annual frequency of health care visits was estimated by asking women:
“how many times on average, did you go to the doctor’s office, clinic, health centre, or other
place that you usually go to when you were sick or needed advice about your health?” Response
options included: less than once per year, once per year, 2-3 times per year, 4-5 times per year, 6
or more times per year. For the purposes of descriptive analyses, these groups were further
collapsed as follows: ≤ 1 time per year, 2-3 times per year, ≥4 times per year.
Use of genetic counselling was determined based on responses from the baseline PHSQ
and year 1 PHSQ. Women were asked: “have you ever had an appointment at a specialist clinic
to discuss your family history of cancer and the possibility of genetic testing?” Use of genetic
testing was similarly determined based on responses from the baseline PHSQ and year 1 PHSQ.
Women were asked: “have you ever had a genetic test for the breast cancer genes BRCA1 or
BCRA2?” To both questions, response options included: yes, no, or I don’t know.
3.5 Statistical Analysis
An overview of the statistical analyses used throughout the thesis is provided in this
section; however, each of the manuscripts contained within the thesis provide additional detail
regarding statistical methodology specific to each study objective. All statistical analyses were
conducted using SAS, version 9.2. Statistical significance was defined as P-value less than 0.05,
and all statistical tests were two-sided.
3.5.1 Descriptive Analyses
The distribution of variables was examined, and the presence of missing data, impossible
and extreme values for all variables was evaluated for each objective. For categorical measures,
87
frequencies and percentages were examined. For continuous measures, measures of central
tendency and distributional properties were examined (mean, standard deviation, median,
interquartile range).
3.5.2 Univariate Tests of Association and Logistic Regression Analyses
Objective 1
Differences in breast cancer risk factors and screening mammogram history between
exposed (women with high familial risk) and unexposed (women with low to moderate familial
risk) subjects were evaluated using chi-square tests (for binary measures) and t-tests (for
continuous measures). These differences were also evaluated using general linear (for
continuous measures) and logistic (for binary measures) regression, adjusted for age at
interview. Multivariable logistic regression was used to estimate odds ratios (ORs) and 95%
confidence intervals (CI) to test associations between level of familial breast cancer risk
(low/moderate risk vs. high risk), and diagnosis of breast cancer (invasive and/or DCIS) and
BBD in all women adjusting for age. Similar analyses were also conducted stratifying on age at
diagnosis or interview (<50 years, ≥50 years), and screening mammography status (screening
mammogram prior to diagnosis, non-screening mammogram prior to diagnosis). In age-
stratified models, continuous age was also adjusted for to reduce residual confounding. As this
did not result in any change to the effect estimates (<1% change in all age-stratified models),
continuous age was not included in the final models. ORs and 95% CIs were also estimated
from multivariable logistic regression models to test associations between level of familial
breast cancer risk (low/moderate risk vs. high risk) and screening mammography status, and
prognostic characteristics of invasive breast cancer and BBD, adjusting for age at diagnosis. It
was not necessary to adjust for breast MRI or ultrasound screening use, as very few women
88
without a breast outcome, and no women with a breast outcome, were screened with either
modality during the study period.
Objective 2
Differences in baseline characteristics (familial risk, age at interview, education,
frequency of health care visits, menopausal status, history of BBD, history of genetic
counselling, and baseline mammogram and CBE status) by exposure status (perceived breast
cancer risk) were evaluated using overall chi-square tests. For age at interview, the p-value was
estimated from a Fisher’s exact test, as one cell count for women aged 25 to 29 years was less
than five. Multivariable logistic regression was used to estimate ORs and 95% CIs to test for
associations between both the numeric and comparative measures of perceived breast cancer
risk at baseline and use of screening mammography and CBE within the 15 months following
baseline, and ever use of genetic testing. As results from the numeric and comparative models
were similar, and given the slightly higher sensitivity and specificity of the numeric model in
women with high perceived risk noted by Gurmankin Levy et al. (2002), only the models using
numeric estimates of perceived risk are presented in Manuscript 3. The relationship between
numeric perceived risk as a continuous predictor and screening use was also modeled.
Several methods of testing for non-linearity of the associations between numeric
perceived risk and screening use were employed. Firstly, a quadratic term for numeric perceived
risk was fit for each model. Second, likelihood ratio tests were used to compare models using
continuous numeric perceived risk (0% to 100%) to models using a categorized version of
numeric perceived risk (<50%, = 50%, >50%). None of the quadratic terms were statistically
significant, and likelihood ratio tests could not exclude a linear relationship, at p < 0.05.
However, because women displayed a very strong preference for reporting a perceived risk of
exactly 50%, and p-values for likelihood ratio tests approached statistical significance for

89
women at moderate/high familial risk (p = 0.08 for mammography, p = 0.08 for CBE), the
categorized perceived risk measure was used for final models.
Familial risk was identified as a potential effect modifier, a priori. Statistical interaction
between perceived breast cancer risk and familial breast cancer risk was evaluated by entering
interaction terms into multivariable models. While interaction terms were not statistically
significant at p < 0.05, heterogeneity in the stratified OR estimates was suggested, as strata-
specific estimates of the association between perceived risk and screening use were of different
directions. As such, analyses were conducted including overall models of the full cohort, as well
as models stratified by level of familial risk (low familial risk, and moderate/high familial risk).
Final models were adjusted for age at year 1 interview, education, annual frequency of health
care visits, menopausal status, history of BBD, baseline screening behaviour and history of
genetic counselling. All models were also adjusted for breast cancer worry; however, as this did
not result in any change to the effect estimates, it was left out of final models. Sensitivity
analyses were conducted which excluded women under 30 years of age, and under 40 years of
age, respectively, as some of these women may not yet be recommended to undergo screening
for breast cancer (depending on the earliest age of diagnosis observed in the family). As this did
not alter the main results, final models included the full cohort to conserve study power.
Objective 3
For Objective 3, distributions of socio-demographic characteristics, health and cancer
screening behaviours were summarized for women at each PHSQ interview. Self-reported
screening mammogram dates were compared to dates abstracted from imaging reports (“gold
standard”) to estimate rates of agreement. Date agreement among self-reported and abstracted
dates was examined for those who self-reported a full date (exact agreement on month and
year), or a partial date (agreement on year only, or agreement on age at examination). To
90
examine the direction of inaccurate recall, date disagreement was further classified as
overestimation or underestimation of the time since last mammogram. To examine the
magnitude of inaccurate recall, the difference in months between self-reported and abstracted
imaging dates was compared among women who overestimated and underestimated their
imaging date. T-tests were used to determine whether the difference in months between those
who overestimated and underestimated their imaging date was significantly different from zero.
Polytomous logistic regression was used to estimate ORs and 95% CIs to test for
associations between inaccurate recall and a number of factors, including: familial breast cancer
risk, age at interview, education, marital status, annual frequency of visiting a health
professional, CBE use, BRCA1/2 genetic test use, perceived breast cancer risk, number of
months since last mammogram, and the mammographic finding. Final models were adjusted for
age at interview, and number of days since last mammogram. Women who overestimated their
imaging date, and who underestimated their imaging date were compared to women who
accurately reported their imaging date. As these categories of mammography recall have no
natural ordering, a generalized logit model was fit.
3.5.3 Clustering
The Ontario site of the BCFR is composed of many breast cancer families. As such,
many subjects in the FHS population are biologically related. Overall, there are 1114 women
from 677 families who participated in the FHS; there are 396 families with 1 member, 166
families with 2 members, 68 families with 3 members, 20 families with 4 members, 10 families
with 5 members, 5 families with 6 members, 2 families with 7 members, and 1 family with 8
members (mean: 1.26 relatives per familial cluster). Characteristics measured on participants
within clusters are often correlated (Heeringa et al., 2010). Women in the FHS who are related
91
share a similar familial breast cancer risk, and may share other similar characteristics such as
breast cancer screening behaviours, perceived risk of breast cancer, breast cancer risk factors,
and socio-demographic factors such as education.
The amount of statistical information contained within a clustered study sample is less
than that contained within an independently selected random sample of the same size (Heeringa
et al., 2010). The variance estimation formulae for a simple random sample do not apply to
more complex sample designs, as these formulae are based on an assumption of independence
of observations. It is important then, to account for these potential similarities within clusters by
using methodology that correctly estimates variance for the estimates produced by a clustered
sample, to ensure standard errors are not erroneously small. All analyses presented in the thesis
employed Taylor series linearized methods for robust variance estimation (RVE) to adjust p-
values for familial clustering (Binder, 1983; Morel, 1989). The Taylor series method
(linearization) is the most commonly used method to estimate the covariance matrix of the
regression coefficients for complex survey data (SAS Institute, 2010). Specifically, the Morel
adjustment method (Morel, 1989) for RVE was employed to adjust the variance estimator for
the model parameters. The Morel method considers the design effect, and reduces bias reflected
in Type I error rates when sample size is small (SAS Institute, 2010).
Hierarchical or multilevel modeling was also considered as an analytic strategy for
cluster adjustment. Multilevel models are commonly used to analyze data which are
hierarchically structured (Bell et al., 2010; Hox, 1998). While there is no consensus regarding
the required sample size for this type of analysis, one of the commonly cited ‘rules of thumb’
calls for a minimum of 30 units of observation at each level of the analysis (Bell et al., 2010;
Maas & Hox, 2004). Several simulation studies have been conducted to examine the effect of
various design conditions on variance estimates, fixed effect estimates, standard errors, and
92
model convergence. While these studies showed little or no bias in fixed effect estimates (Maas
& Hox, 2004; Maas & Hox et al, 2005; Clarke & Wheaton, 2007), variance estimates were
biased where the number of level-two units were small (Maas & Hox, 2005; Clarke & Wheaton,
2007). Clarke & Wheaton (2007) also examined the effect of the proportion of singleton groups
in two-level models, and found that bias in intercept and slope variance estimates was present
when singleton groups were included. A large proportion (58.5%) of the 677 familial clusters in
the FHS consisted of singleton groups (families with only one member). Therefore, multilevel
modeling was not selected, as it was not the best-suited technique for the structure of these data.
Generalized estimating equations (GEE) was also considered as a potential statistical
strategy for cluster adjustment. GEE is an extension of the quasi-likelihood approach, and is
often used to analyze repeated measures and correlated data (Hanley et al., 2003). Similar to
RVE, GEE accounts for non-independence of data by correcting the variance-covariance matrix
(Zorn, 2006). Fitting a GEE model requires that the link function, distribution of the dependent
variable, and correlation structure be specified (Ballinger, 2004). One important advantage of
GEEs over the RVE method is the ability to use information regarding the structure of
intracluster correlation to produce more efficient standard errors (Zorn, 2006; Odueyungbo et
al., 2008). However, GEE models are sensitive to outlier values (Diggle et al., 2002), have
inflated rates of type I errors when sample size is small (though this bias decreases when the
number of clusters increases) (Teerenstra et al., 2010; Ziegler et al., 1998), and can produce
inefficient estimates if the true structure of the correlation matrix is incorrectly specified
(Odueyungbo et al., 2008). During the period when all statistical analyses were conducted, only
ordinal multinomial models were supported in SAS for GEE (SAS Institute, 2010). As a
generalized logit model to handle the nominal response variable in Objective 3 could not be fit,
it was recommended by SAS software developers that the RVE technique be employed (SAS
93
Technical Support, Personal Communication, 2009). To ensure consistency in the technique for
variance estimation used in the thesis project, the RVE approach was used for all analyses.
3.5.4 Data Quality Analyses
Several additional analyses were undertaken for the purposes of evaluating data quality.
As previously described, the 1514 female relatives identified as eligible for recruitment to the
FHS completed a questionnaire (PHQ) during their recruitment to the Ontario site of the BCFR,
with 1114 (73.6%) of these women consenting to participate in the FHS. Among the 400
(26.4%) non-participating women, 37 (9.2%) were ineligible, 162 (40.5%) were unreachable,
and 201 (50.3%) refused to participate. PHQ data were available for all of these women, thus an
evaluation of selection bias due to non-participation was possible. Women who participated in
the FHS (n = 1114) were compared to women who were unreachable (n = 162), and refused to
participate (n = 201) on a number of socio-demographic measures, level of familial risk, breast
cancer risk factors, and mammogram history. The full analysis is located in Appendix E, and the
anticipated impact on results of the thesis are discussed in Chapter 5.
Women who completed a PHSQ at year 1 or year 2, and reported that they had
undergone a mammogram or CBE since the previous PHSQ were asked to indicate the main
reasons for undergoing these examinations. Women who reported a mammogram were also
asked to specify any factors which encouraged them to have a mammogram. One of the
response options provided was, “participating in this study.” Thus, an evaluation of a crude
measure of Hawthorne effect (Roethlisberger & Dickson, 1939), the phenomenon wherein
research participants change their behaviour as a result of having knowledge that they are being
studied, was undertaken. The frequency of reporting that study participation was either the main
94
reason for undergoing mammography, or encouraged mammography use, was examined.
Results of this analysis are discussed in Chapter 5.
3.6 Ethical Approval
Ethical approval for the Family History Study was initially obtained from the Research
Ethics Boards of the University Health Network, and Mount Sinai Hospital in 2005 by Dr. Anna
Chiarelli (PI), and was renewed on an annual basis until data collection was completed in 2011.
Additional ethical approval for this thesis project was obtained from the University of Toronto
Research Ethics Board by the candidate in December 2011, and renewed for one year in 2012
until December 2013, when all analyses were completed (Appendix F). This thesis project
involved secondary data analysis only, and study participants were not contacted to provide any
additional information. Unique identification numbers were assigned to ensure anonymity of
subjects at all times. To ensure data confidentiality, all hard copies of data were kept in locked
filing cabinets which could only be accessed by approved study staff, and located on a
restricted-access floor at Cancer Care Ontario. All soft copies of data were stored in encrypted
files on a secured network, which could also only be accessed by approved study staff. As such,
the research risk of this thesis project was classified by the University of Toronto as low, and
expedited review was granted.
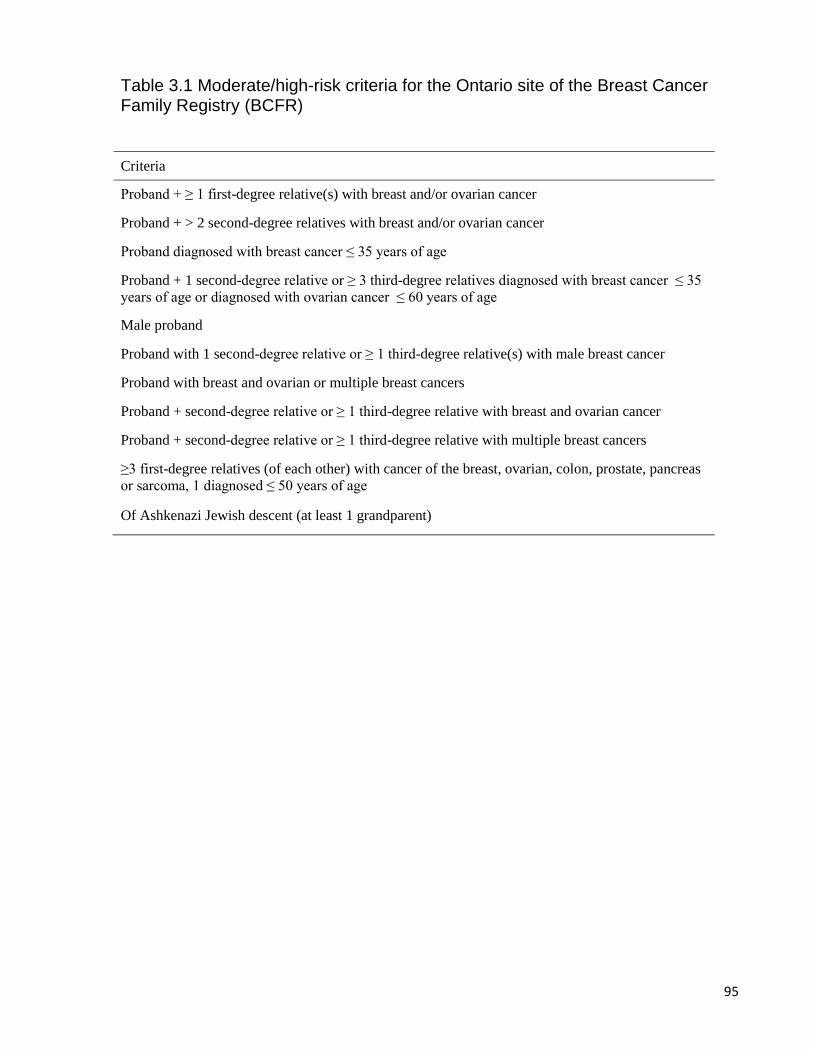
95
Table 3.1 Moderate/high-risk criteria for the Ontario site of the Breast Cancer Family Registry (BCFR)
Criteria
Proband + ≥ 1 first-degree relative(s) with breast and/or ovarian cancer
Proband + > 2 second-degree relatives with breast and/or ovarian cancer
Proband diagnosed with breast cancer ≤ 35 years of age
Proband + 1 second-degree relative or ≥ 3 third-degree relatives diagnosed with breast cancer ≤ 35
years of age or diagnosed with ovarian cancer ≤ 60 years of age
Male proband
Proband with 1 second-degree relative or ≥ 1 third-degree relative(s) with male breast cancer
Proband with breast and ovarian or multiple breast cancers
Proband + second-degree relative or ≥ 1 third-degree relative with breast and ovarian cancer
Proband + second-degree relative or ≥ 1 third-degree relative with multiple breast cancers
≥3 first-degree relatives (of each other) with cancer of the breast, ovarian, colon, prostate, pancreas
or sarcoma, 1 diagnosed ≤ 50 years of age
Of Ashkenazi Jewish descent (at least 1 grandparent)
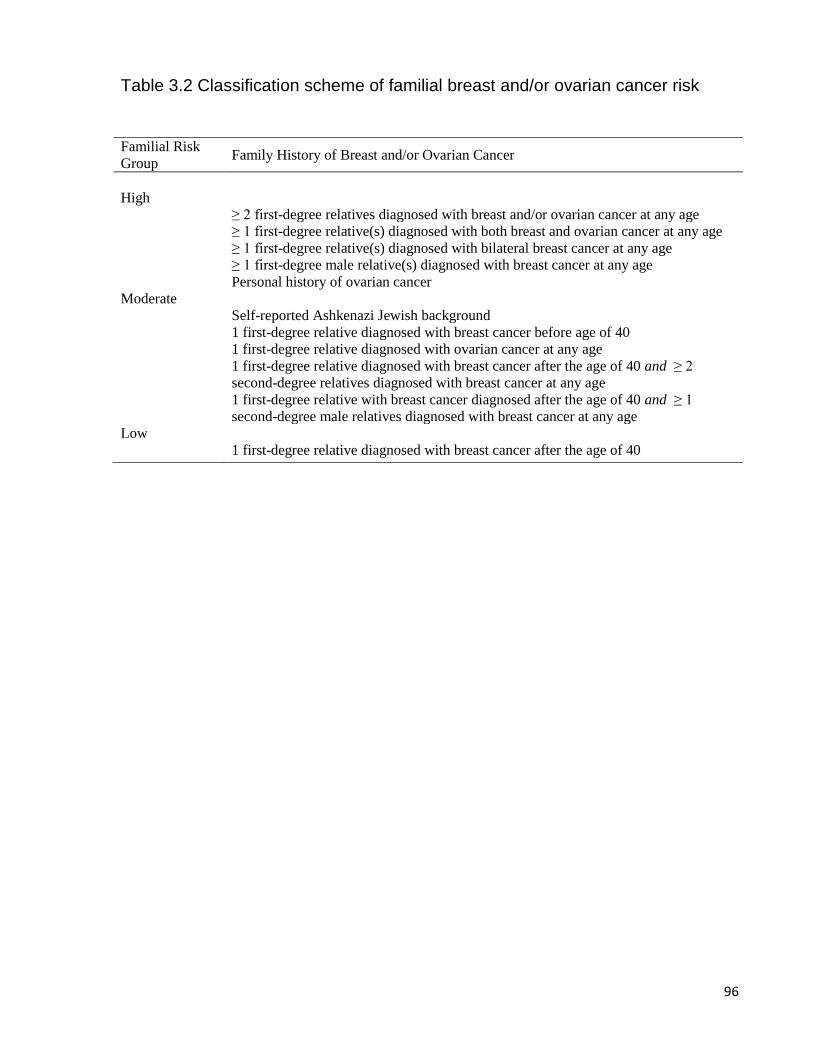
96
Table 3.2 Classification scheme of familial breast and/or ovarian cancer risk
Familial Risk
Group Family History of Breast and/or Ovarian Cancer
High
≥ 2 first-degree relatives diagnosed with breast and/or ovarian cancer at any age
≥ 1 first-degree relative(s) diagnosed with both breast and ovarian cancer at any age
≥ 1 first-degree relative(s) diagnosed with bilateral breast cancer at any age
≥ 1 first-degree male relative(s) diagnosed with breast cancer at any age
Personal history of ovarian cancer
Moderate
Self-reported Ashkenazi Jewish background
1 first-degree relative diagnosed with breast cancer before age of 40
1 first-degree relative diagnosed with ovarian cancer at any age
1 first-degree relative diagnosed with breast cancer after the age of 40 and ≥ 2
second-degree relatives diagnosed with breast cancer at any age
1 first-degree relative with breast cancer diagnosed after the age of 40 and ≥ 1
second-degree male relatives diagnosed with breast cancer at any age
Low
1 first-degree relative diagnosed with breast cancer after the age of 40
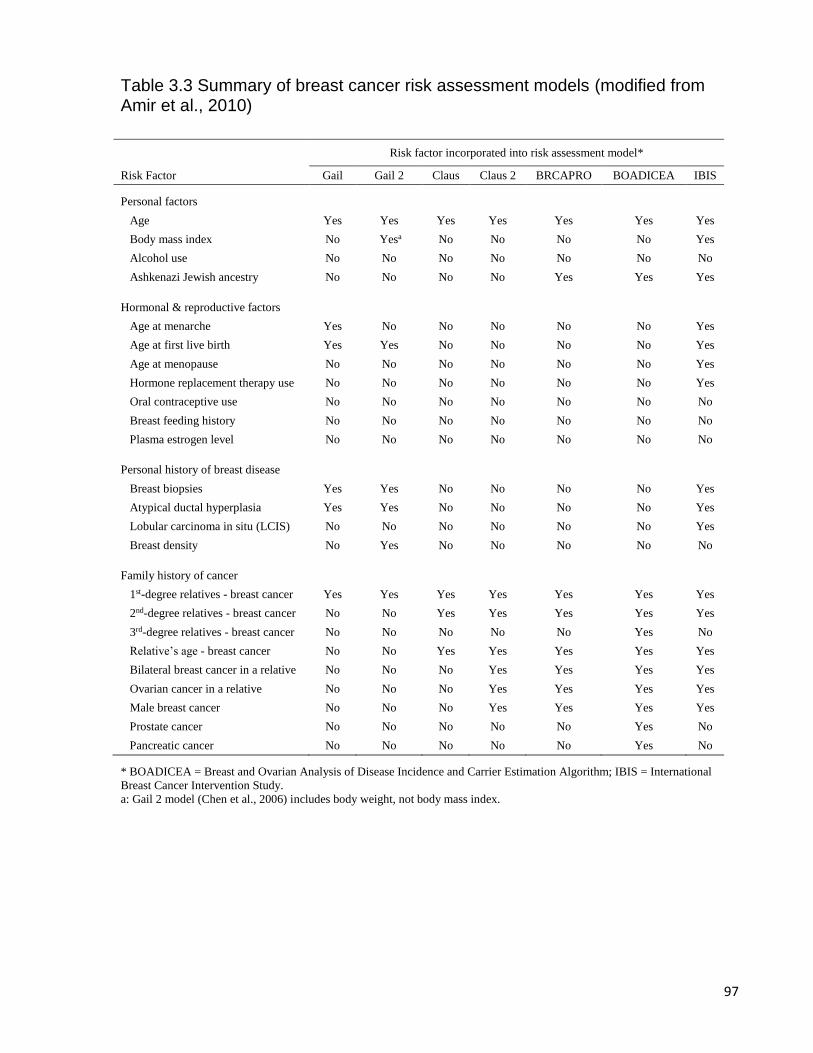
97
Table 3.3 Summary of breast cancer risk assessment models (modified from Amir et al., 2010)
Risk factor incorporated into risk assessment model*
Risk Factor Gail Gail 2 Claus Claus 2 BRCAPRO BOADICEA IBIS
Personal factors
Age Yes Yes Yes Yes Yes Yes Yes
Body mass index No Yesa No No No No Yes
Alcohol use No No No No No No No
Ashkenazi Jewish ancestry No No No No Yes Yes Yes
Hormonal & reproductive factors
Age at menarche Yes No No No No No Yes
Age at first live birth Yes Yes No No No No Yes
Age at menopause No No No No No No Yes
Hormone replacement therapy use No No No No No No Yes
Oral contraceptive use No No No No No No No
Breast feeding history No No No No No No No
Plasma estrogen level No No No No No No No
Personal history of breast disease
Breast biopsies Yes Yes No No No No Yes
Atypical ductal hyperplasia Yes Yes No No No No Yes
Lobular carcinoma in situ (LCIS) No No No No No No Yes
Breast density No Yes No No No No No
Family history of cancer
1st-degree relatives - breast cancer Yes Yes Yes Yes Yes Yes Yes
2nd-degree relatives - breast cancer No No Yes Yes Yes Yes Yes
3rd-degree relatives - breast cancer No No No No No Yes No
Relative’s age - breast cancer No No Yes Yes Yes Yes Yes
Bilateral breast cancer in a relative No No No Yes Yes Yes Yes
Ovarian cancer in a relative No No No Yes Yes Yes Yes
Male breast cancer No No No Yes Yes Yes Yes
Prostate cancer No No No No No Yes No
Pancreatic cancer No No No No No Yes No
* BOADICEA = Breast and Ovarian Analysis of Disease Incidence and Carrier Estimation Algorithm; IBIS = International
Breast Cancer Intervention Study.
a: Gail 2 model (Chen et al., 2006) includes body weight, not body mass index.
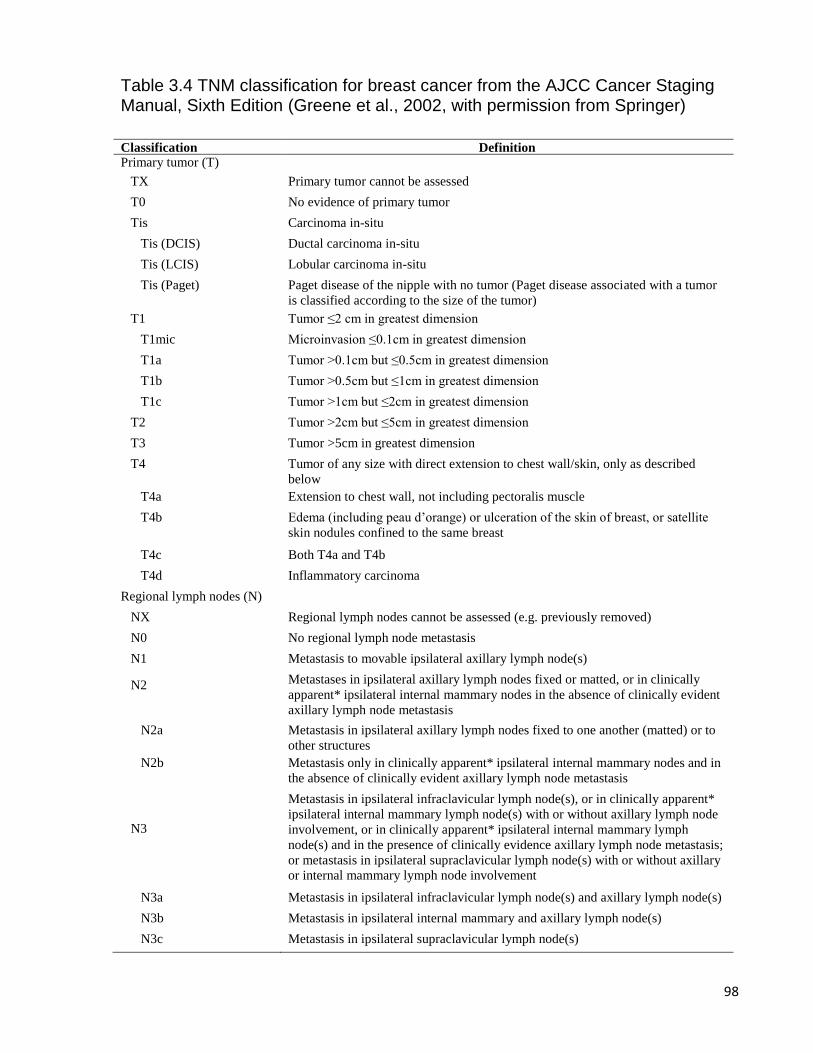
98
Table 3.4 TNM classification for breast cancer from the AJCC Cancer Staging Manual, Sixth Edition (Greene et al., 2002, with permission from Springer)
Classification Definition Primary tumor (T)
TX Primary tumor cannot be assessed
T0 No evidence of primary tumor
Tis Carcinoma in-situ
Tis (DCIS) Ductal carcinoma in-situ
Tis (LCIS) Lobular carcinoma in-situ
Tis (Paget) Paget disease of the nipple with no tumor (Paget disease associated with a tumor
is classified according to the size of the tumor)
T1 Tumor ≤2 cm in greatest dimension
T1mic Microinvasion ≤0.1cm in greatest dimension
T1a Tumor >0.1cm but ≤0.5cm in greatest dimension
T1b Tumor >0.5cm but ≤1cm in greatest dimension
T1c Tumor >1cm but ≤2cm in greatest dimension
T2 Tumor >2cm but ≤5cm in greatest dimension
T3 Tumor >5cm in greatest dimension
T4 Tumor of any size with direct extension to chest wall/skin, only as described
below
T4a Extension to chest wall, not including pectoralis muscle
T4b Edema (including peau d’orange) or ulceration of the skin of breast, or satellite
skin nodules confined to the same breast
T4c Both T4a and T4b
T4d Inflammatory carcinoma
Regional lymph nodes (N)
NX Regional lymph nodes cannot be assessed (e.g. previously removed)
N0 No regional lymph node metastasis
N1 Metastasis to movable ipsilateral axillary lymph node(s)
N2 Metastases in ipsilateral axillary lymph nodes fixed or matted, or in clinically
apparent* ipsilateral internal mammary nodes in the absence of clinically evident
axillary lymph node metastasis
N2a Metastasis in ipsilateral axillary lymph nodes fixed to one another (matted) or to
other structures
N2b Metastasis only in clinically apparent* ipsilateral internal mammary nodes and in
the absence of clinically evident axillary lymph node metastasis
N3
Metastasis in ipsilateral infraclavicular lymph node(s), or in clinically apparent*
ipsilateral internal mammary lymph node(s) with or without axillary lymph node
involvement, or in clinically apparent* ipsilateral internal mammary lymph
node(s) and in the presence of clinically evidence axillary lymph node metastasis;
or metastasis in ipsilateral supraclavicular lymph node(s) with or without axillary
or internal mammary lymph node involvement
N3a Metastasis in ipsilateral infraclavicular lymph node(s) and axillary lymph node(s)
N3b Metastasis in ipsilateral internal mammary and axillary lymph node(s)
N3c Metastasis in ipsilateral supraclavicular lymph node(s)
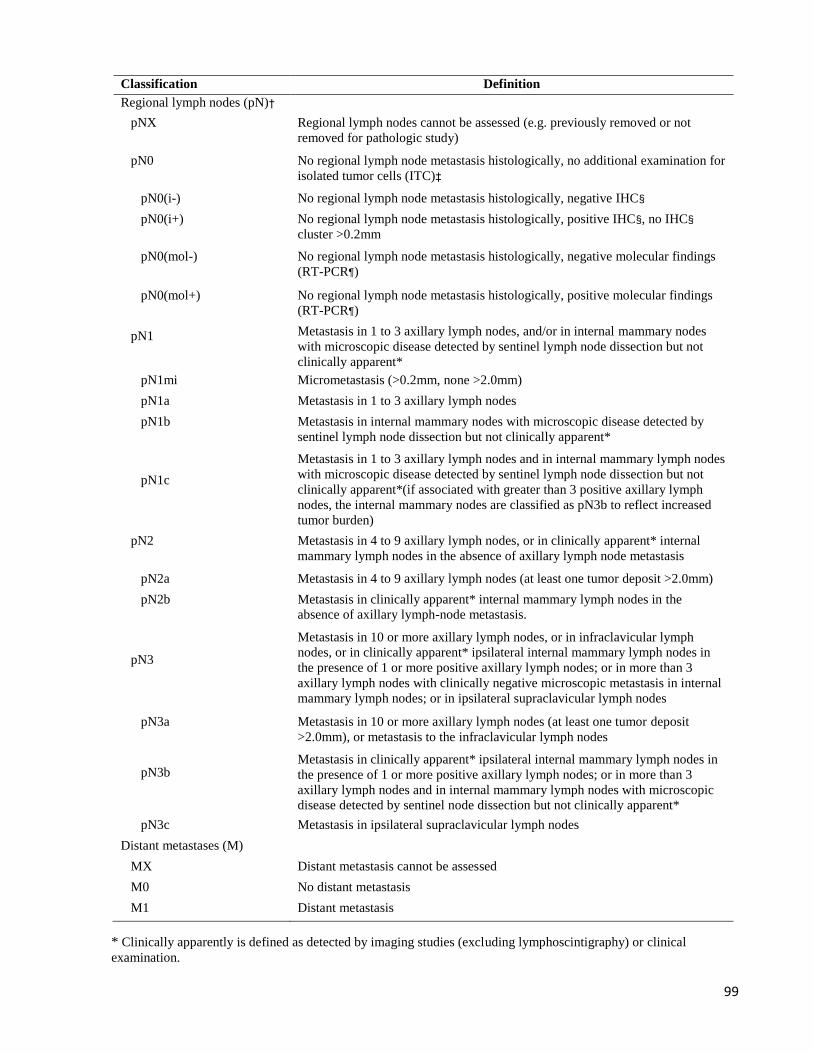
99
Classification Definition
Regional lymph nodes (pN)†
pNX Regional lymph nodes cannot be assessed (e.g. previously removed or not
removed for pathologic study)
pN0 No regional lymph node metastasis histologically, no additional examination for
isolated tumor cells (ITC)‡
pN0(i-) No regional lymph node metastasis histologically, negative IHC§
pN0(i+) No regional lymph node metastasis histologically, positive IHC§, no IHC§
cluster >0.2mm
pN0(mol-) No regional lymph node metastasis histologically, negative molecular findings
(RT-PCR¶)
pN0(mol+) No regional lymph node metastasis histologically, positive molecular findings
(RT-PCR¶)
pN1 Metastasis in 1 to 3 axillary lymph nodes, and/or in internal mammary nodes
with microscopic disease detected by sentinel lymph node dissection but not
clinically apparent*
pN1mi Micrometastasis (>0.2mm, none >2.0mm)
pN1a Metastasis in 1 to 3 axillary lymph nodes
pN1b Metastasis in internal mammary nodes with microscopic disease detected by
sentinel lymph node dissection but not clinically apparent*
pN1c
Metastasis in 1 to 3 axillary lymph nodes and in internal mammary lymph nodes
with microscopic disease detected by sentinel lymph node dissection but not
clinically apparent*(if associated with greater than 3 positive axillary lymph
nodes, the internal mammary nodes are classified as pN3b to reflect increased
tumor burden)
pN2 Metastasis in 4 to 9 axillary lymph nodes, or in clinically apparent* internal
mammary lymph nodes in the absence of axillary lymph node metastasis
pN2a Metastasis in 4 to 9 axillary lymph nodes (at least one tumor deposit >2.0mm)
pN2b Metastasis in clinically apparent* internal mammary lymph nodes in the
absence of axillary lymph-node metastasis.
pN3
Metastasis in 10 or more axillary lymph nodes, or in infraclavicular lymph
nodes, or in clinically apparent* ipsilateral internal mammary lymph nodes in
the presence of 1 or more positive axillary lymph nodes; or in more than 3
axillary lymph nodes with clinically negative microscopic metastasis in internal
mammary lymph nodes; or in ipsilateral supraclavicular lymph nodes
pN3a Metastasis in 10 or more axillary lymph nodes (at least one tumor deposit
>2.0mm), or metastasis to the infraclavicular lymph nodes
pN3b Metastasis in clinically apparent* ipsilateral internal mammary lymph nodes in
the presence of 1 or more positive axillary lymph nodes; or in more than 3
axillary lymph nodes and in internal mammary lymph nodes with microscopic
disease detected by sentinel node dissection but not clinically apparent*
pN3c Metastasis in ipsilateral supraclavicular lymph nodes
Distant metastases (M)
MX Distant metastasis cannot be assessed
M0 No distant metastasis
M1 Distant metastasis
* Clinically apparently is defined as detected by imaging studies (excluding lymphoscintigraphy) or clinical
examination.

100
† Classification is based on axillary lymph node dissection with or without sentinel lymph node dissection.
Classification based solely on sentinel lymph node dissection without subsequent axillary lymph node dissection is
designated (sn) for “sentinel node,” such as pN0(i+)(sn).
‡ Isolated tumor cells are defined as single tumor cells or small cell clusters ≤0.2mm, usually detected only by
immunohistochemical or molecular methods but which may be verified on hematoxylin and eosin stains. Isolated
tumor cells do not usually show evidence of metastatic activity (e.g. proliferation or stromal reaction).
§ IHC = immunohistochemical. ¶ RT-PCT = reverse transcriptase/polymerase chain reaction.
Note: used with permission of the American Joint Committee on Cancer (AJCC), Chicago, Illinois. The original
source for this material is the AJCC Cancer Staging Manual, Sixth Edition (2003) published by Springer Science
and Business Media LLC, www.springer.com.
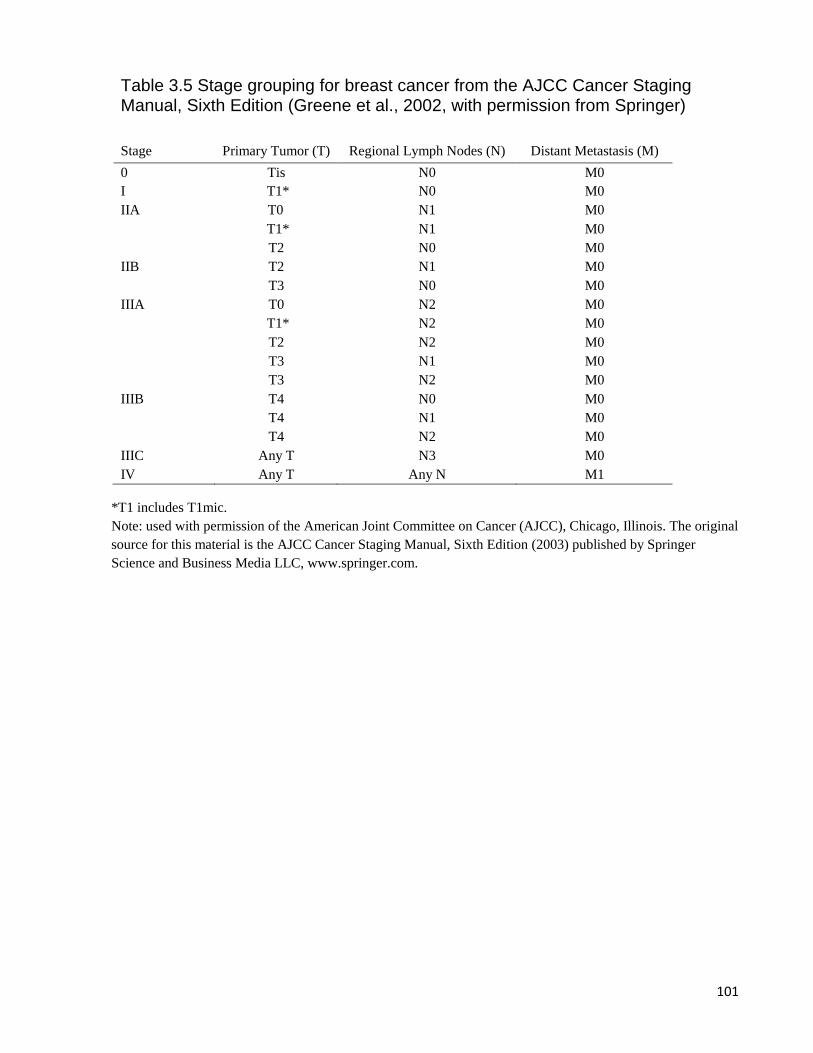
101
Table 3.5 Stage grouping for breast cancer from the AJCC Cancer Staging Manual, Sixth Edition (Greene et al., 2002, with permission from Springer)
Stage Primary Tumor (T) Regional Lymph Nodes (N) Distant Metastasis (M)
0 Tis N0 M0
I T1* N0 M0
IIA T0 N1 M0
T1* N1 M0
T2 N0 M0
IIB T2 N1 M0
T3 N0 M0
IIIA T0 N2 M0
T1* N2 M0
T2 N2 M0
T3 N1 M0
T3 N2 M0
IIIB T4 N0 M0
T4 N1 M0
T4 N2 M0
IIIC Any T N3 M0
IV Any T Any N M1
*T1 includes T1mic.
Note: used with permission of the American Joint Committee on Cancer (AJCC), Chicago, Illinois. The original
source for this material is the AJCC Cancer Staging Manual, Sixth Edition (2003) published by Springer
Science and Business Media LLC, www.springer.com.
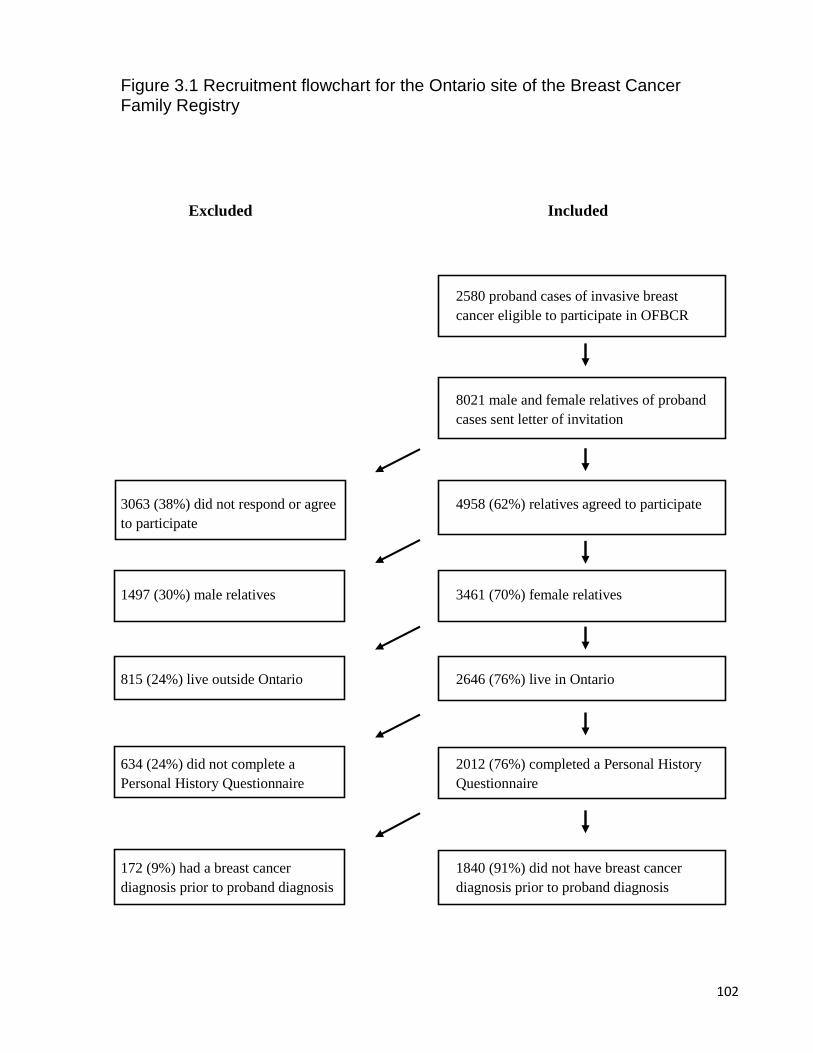
102
Figure 3.1 Recruitment flowchart for the Ontario site of the Breast Cancer Family Registry
Excluded Included
2580 proband cases of invasive breast
cancer eligible to participate in OFBCR
8021 male and female relatives of proband
cases sent letter of invitation
3063 (38%) did not respond or agree 4958 (62%) relatives agreed to participate
to participate
1497 (30%) male relatives 3461 (70%) female relatives
815 (24%) live outside Ontario 2646 (76%) live in Ontario
634 (24%) did not complete a 2012 (76%) completed a Personal History
Personal History Questionnaire Questionnaire
172 (9%) had a breast cancer 1840 (91%) did not have breast cancer
diagnosis prior to proband diagnosis diagnosis prior to proband diagnosis
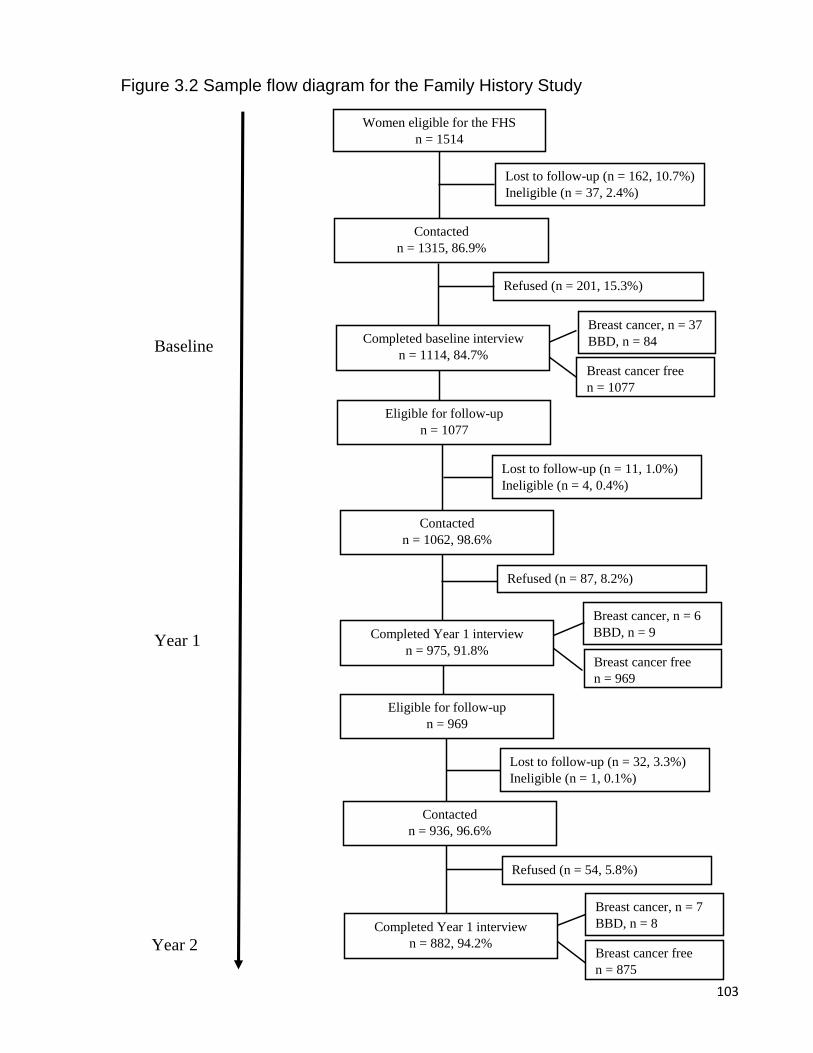
103
Figure 3.2 Sample flow diagram for the Family History Study
Baseline
Year 1
Year 2
Women eligible for the FHS
n = 1514
Lost to follow-up (n = 162, 10.7%)
Ineligible (n = 37, 2.4%)
Contacted
n = 1315, 86.9%
Refused (n = 201, 15.3%)
Completed baseline interview
n = 1114, 84.7%
Eligible for follow-up
n = 1077
Lost to follow-up (n = 11, 1.0%)
Ineligible (n = 4, 0.4%)
Breast cancer, n = 37
BBD, n = 84
Breast cancer free
n = 1077
Contacted
n = 1062, 98.6%
Refused (n = 87, 8.2%)
Completed Year 1 interview
n = 975, 91.8%
Breast cancer, n = 6
BBD, n = 9
Breast cancer free
n = 969
Eligible for follow-up
n = 969
Lost to follow-up (n = 32, 3.3%)
Ineligible (n = 1, 0.1%)
Contacted
n = 936, 96.6%
Refused (n = 54, 5.8%)
Completed Year 1 interview
n = 882, 94.2%
Breast cancer, n = 7
BBD, n = 8
Breast cancer free
n = 875
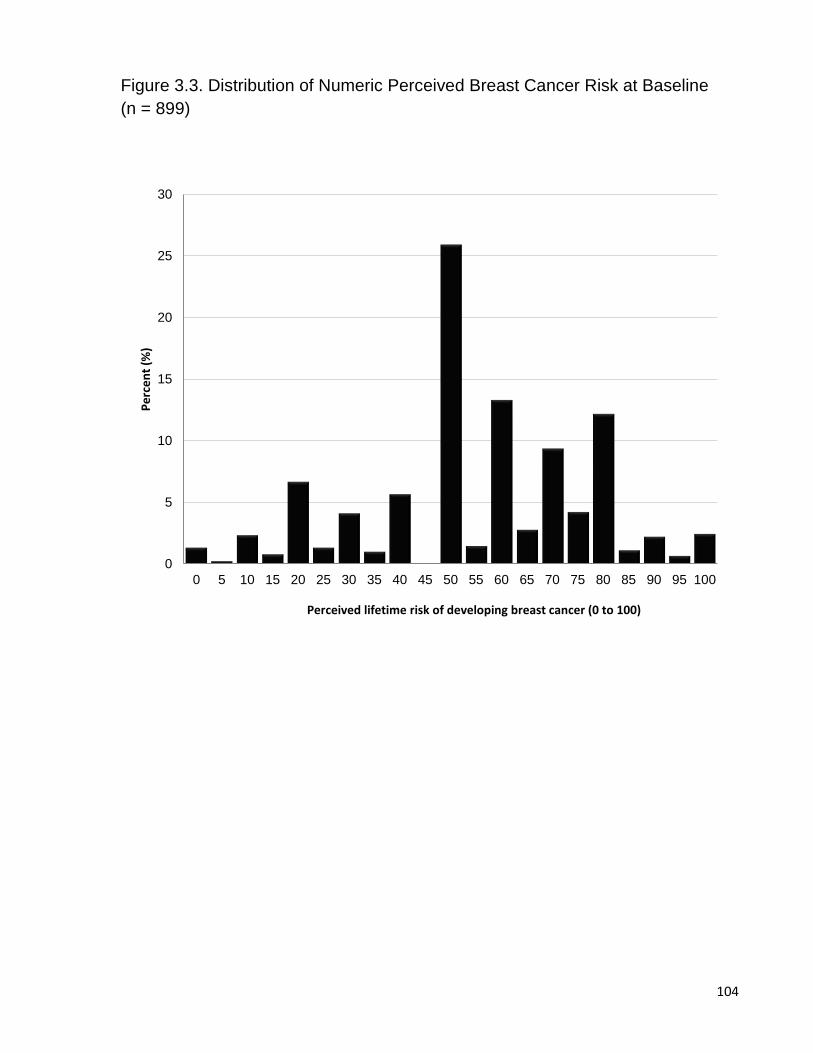
104
Figure 3.3. Distribution of Numeric Perceived Breast Cancer Risk at Baseline
(n = 899)
0
5
10
15
20
25
30
0 5 10 15 20 25 30 35 40 45 50 55 60 65 70 75 80 85 90 95 100
Pe
rce
nt
(%)
Perceived lifetime risk of developing breast cancer (0 to 100)
105
Chapter 4 Results
4.1 Overview of Results
The results of this thesis are presented in manuscript format, comprising 4 independent
papers. While the research papers have multiple authors, the candidate was responsible for
developing the research objectives, conducting literature reviews, performing statistical data
analysis, and drafting each manuscript in full. Additional detail regarding the candidate’s role in
the project can be found in Chapter 6.
The first manuscript is contained within Chapter 2, and describes the results of a
systematic review of observational studies examining the relationship between perceived breast
cancer risk and adherence to breast cancer screening guidelines for mammography, CBE, and
BSE in women with a family history of breast and/or ovarian cancer (Objective 2). The second
manuscript evaluated the effect of level of familial breast cancer risk and mammography
screening on diagnoses and prognostic features of breast cancer and benign breast disease in
women with familial breast cancer risk (Objective 1). The third manuscript was written in direct
response to the findings of the systematic review paper, and prospectively examined the
relationship between perceived breast cancer risk and use of screening mammography, CBE,
and genetic testing, as well as assessed the presence of effect modification by level of familial
risk (Objective 2). The fourth manuscript details the results of a data quality assessment, which
evaluated the validity of self-reported screening mammography dates in women with varying
levels of familial risk in our study population (Objective 4).
106
4.2 Manuscript 2: Impact of familial risk and mammography screening on
prognostic indicators of breast disease among women from the Ontario
site of the Breast Cancer Family Registry
Walker MJ, Mirea L, Cooper K, Nabavi M, Glendon G, Andrulis IL, Knight JA, O’Malley FP,
Chiarelli AM.
Published in Familial Cancer. 2014; 13(2): 163-172.
ABSTRACT
Although several studies have found screen-detected cancers in women with familial breast
cancer risk have favorable prognostic features compared with symptomatic cancers, the impact
of level of familial risk is unknown. A cohort of 899 first-degree female relatives of cases of
breast cancer from the Ontario site of the Breast Cancer Family Registry was followed for
2 years. Logistic regression analyses compared diagnoses of breast cancer or benign breast
disease (BBD) between women at high (n = 258, 28.7%) versus low/moderate (n = 641, 71.3%)
familial risk. Similar analyses compared prognostic features of invasive cancers and BBD by
level of familial risk and mammography screening status. Among 899 women, 44 (4.9%) were
diagnosed with invasive breast cancer and/or ductal carcinoma in situ, and 56 (6.2%) with BBD.
Women with high familial risk were significantly more likely to be diagnosed with breast cancer
[odds ratio (OR) = 2.84, 95% confidence interval (CI) 1.50-5.38] than low/moderate risk
women, particularly if diagnosed at age ≥50 (OR = 2.99, 95% CI 1.37-6.56) or screened with
mammography (OR = 3.33, 95% CI 1.54-7.18). High risk women were more likely to be
diagnosed with BBD (OR = 1.94, 95% CI 1.03-3.66). Level of familial risk was not associated
with prognostic features. Cancers among unscreened women were larger (OR = 9.72, 95% CI
1.01-93.61) and diagnosed at stage II or above (OR = 7.80, 95% CI 1.18-51.50) compared with
107
screen-detected cancers. Screening mammography may be effective for women with a first-
degree family history of breast cancer, irrespective of level of familial risk.
Keywords: Breast cancer; benign breast disease; mammography screening; prognosis; family
history
Introduction
Having a family history of breast cancer has been established as one of the most
important risk factors for the development of breast cancer. Women with one affected first-
degree relative are about twice as likely to develop breast cancer compared with women who
have no affected relatives, and risks are higher when more than one first-degree relative is
affected or the relative is younger at diagnosis [1–3]. A woman with a first-degree relative
diagnosed with ovarian cancer is approximately twice as likely to develop breast cancer [4].
There is evidence that a significant reduction in breast cancer mortality can be achieved
through mammography screening [5]. The Canadian Task Force on Preventive Health Care
recommends screening for breast cancer with mammography every 2–3 years for average risk
women aged 50–74 [6]. In Ontario, mammography is available to women aged 50–74 through
the Ontario Breast Screening Program (OBSP), and opportunistically through facilities outside
of the screening program [7]. In 2011, the OBSP was expanded to include annual combined
MRI and mammographic screening for women aged 30–69 considered to be at very high risk
(i.e. BRCA1/2 mutation carriers or family history suggestive of hereditary breast cancer)
(Cancer Care Ontario, Internal Communication, 2011).
Although breast cancer screening guidelines for women with a family history
recommend screening before age 50 and at more frequent intervals [8–14], the impact of
screening on reducing mortality in these women is unknown. There is evidence that cancer
108
detection rates are greater in women with a family history compared to women without a family
history [15, 16]. Some studies have also shown that screen-detected tumors among women with
a family history of breast cancer are smaller [17], less likely to demonstrate nodal or distant
metastases [17–20], and diagnosed at an earlier stage [20] when compared with symptomatic
cancers.
Benign breast disease (BBD) represents changes in normal breast tissue that can indicate
an increased risk of invasive breast cancer or may behave as a non-obligate precursor lesion
[21]. Specific histologic abnormalities based on pathologic examination have a range of relative
risks for subsequent invasive breast cancer. For example, mild hyperplasia without atypia has no
increased risk, while risk is increased four- to five-fold when atypical hyperplasia is present
[22]. Women with a family history have been found to have an increased risk of high-risk types
of BBD (such as atypical hyperplasia) and women with both a family history and atypical
hyperplasia have a greater risk of breast cancer [23, 24].
A few studies examining screening outcomes have shown that women with a family
history may benefit from regular breast screening, reporting higher cancer detection rates and
favorable prognostic features of screen detected cancers. However, few studies have examined
screening outcomes by varying levels of familial risk [25]. This evidence is required for the
development of definitive screening guidelines for women with a range of increased risks of
breast cancer due to familial history. The purpose of this study was to compare diagnoses of
breast disease and prognostic indicators by varying levels of familial risk and mammography
screening status in a population-cohort of Ontario women aged 26–73 years, who had at least
one first-degree relative diagnosed with breast or ovarian cancer.
109
Methods
Study population
This study identified a cohort of female relatives of incident cases of invasive breast
cancer from the Ontario site of the Breast Cancer Family Registry (BCFR) funded by the United
States National Cancer Institute (NCI). The details of the BCFR and the Ontario site of the
BCFR have been previously described [26, 27]. Briefly, cases of invasive breast cancer
(probands), pathologically confirmed, and diagnosed between 1996 and 1998 were identified
from the Ontario Cancer Registry (OCR). Physicians were contacted to obtain permission to
mail their patients a cancer Family History Questionnaire (FHQ). Respondents meeting a
defined set of genetic risk criteria, and a random sample (25%) of those not meeting criteria
were asked to participate in the Ontario site of the BCFR. Of those eligible at this stage (n =
2,587), 1,851 (72%) probands participated. Probands were asked for permission to contact
specific living relatives (all first-degree relatives, any other relatives affected with breast,
ovarian or certain other cancers and their first-degree relatives). An invitation letter to
participate in the Ontario site of the BCFR was sent to relatives (n = 8,416), and those who
agreed to be contacted (n = 5,122) were mailed an Epidemiology Questionnaire (EQ) between
1998 and 2004.
Our study was conducted several years after initial recruitment of relatives to the BCFR.
In this study, we identified all first-degree female relatives enrolled in the Ontario site of the
BCFR who had completed the EQ, were alive and unaffected by breast cancer at the time of the
proband’s diagnosis, and residents of Ontario. These 1,289 eligible women were aged 20–69
years as of January 1st, 2006 and sent a baseline Personal History and Screening Questionnaire
(PHSQ) between 2005 and 2007. Of these women, 201 did not complete the baseline PHSQ, 87
did not complete a year 1 PHSQ, 54 did not complete a year 2 PHSQ, 43 were lost to follow-up
110
and 5 were deceased or ineligible due to health issues. The final cohort consisted of 899 women.
This study was approved by the Research Ethics Boards of Mount Sinai Hospital and the
University Health Network, and written informed consent was obtained from all participants.
Data collection
The women in this study were initially contacted by mailed questionnaire during
recruitment to the BCFR. Since several years had elapsed, PHSQs were telephone-administered
to update changes in health behaviors and key demographic characteristics. In addition, detailed
information on breast screening examinations and diagnosis of any breast outcomes (breast
cancer or BBD) was collected. Further details of the questionnaire instruments have been
previously described [27–29].
Age at interview, age at menarche, parity, menopausal status, use of hormone
replacement therapy, mammogram use since completion of the EQ, and number of months since
last mammogram were determined using responses to the baseline PHSQ. Total number of
lifetime mammograms was determined using combined responses from the EQ and baseline
PHSQ. PHSQs asked women to give the date (month and year) of their last mammogram, or age
at the time of last examination. Additionally, women were asked whether their mammogram
was for screening (part of a regular check-up or family history of breast cancer) or nonscreening
(breast problem or symptom). Classification of family history of breast and/or ovarian cancer
was based on information collected from the FHQ completed by the relative’s proband using
previously referenced groups for familial breast cancer risk [9, 30], with modifications based on
key evidence [1, 3, 31–34] and expert opinion due to the range of familial breast and/or ovarian
cancer histories in the study cohort. Table 1 shows criteria for classifying women as having low,
moderate or high familial risk of breast and/or ovarian cancer.
111
Tumor characteristics
The self-reported date and location of any breast diagnosis were obtained from the
PHSQ, and written informed consent was obtained granting access to pathology and surgical
records. Copies of relevant reports were requested from the OCR or medical record departments
of hospitals and/or clinics. Reports were obtained and reviewed for all diagnoses of breast
cancer or BBD by the pathology consultant (MN). Invasive breast cancer includes the diagnosis
of primary invasive breast cancer of any histologic type. Ductal carcinoma in situ (DCIS)
includes intraductal carcinoma and Paget’s disease of the nipple with no invasive component.
Tumor size was defined as the largest diameter of the primary invasive carcinoma.
Among women who had axillary assessment with either sentinel lymph node biopsy or axillary
node dissection, lymph node status was defined as positive if the cancer had invaded the sentinel
or other nodes. The 6th Edition of the TNM staging classification scheme [35] was used for the
staging of breast cancers. Histopathologic grading of invasive carcinomas was performed using
the Nottingham grading system [36], which takes into account architectural differentiation,
nuclear pleomorphism and mitotic rate. Tumors were considered well-differentiated if the
overall score was 3–5 (grade I), moderately-differentiated if the score was 6–7 (grade II) or
poorly-differentiated if the score was 8–9 (grade III). Mitotic index was determined by assessing
the number of mitoses per 10 high powered fields, which were standardized to the field diameter
of the high power objective and classified as low (score 1), intermediate (score 2) or high (score
3). The absence or presence of lymphovascular invasion within the endothelial-lined channels of
the breast was also recorded. Estrogen receptor (ER) and progesterone receptor (PR) status was
defined as positive if immunohistochemical assays showed >1% tumor cell positivity [37].
Cases of BBD were categorized according to their relative risk for subsequent breast
cancer, into the following severity groups: mild (fibrocystic changes or proliferative disease
112
without atypia), moderate (proliferative disease with atypical hyperplasia) or severe (lobular
carcinoma in situ).
Statistical analysis
The distributions of breast cancer risk factors and screening mammography practices
were compared by level of familial risk and screening status using general linear (for continuous
measures) and logistic regression (for binary measures), adjusting for age at interview. Odds
ratios (OR) and 95% confidence intervals (CI) were estimated from logistic regression to test
associations between level of familial risk and diagnosis of breast cancer (invasive and/or DCIS)
and BBD in all women adjusting for age, as well as stratified by age at interview or diagnosis
and screening mammography status. Similar analyses examined associations between familial
risk and screening mammography status, and prognostic characteristics of invasive breast
cancers and BBD, adjusting for age at diagnosis. All analyses compared women at high familial
risk to women at low/moderate risk. It was not necessary to adjust for breast MRI and
ultrasound screening use, as very few women without a breast outcome and no women with a
breast outcome were screened with these modalities during the study period. As many study
participants were related, robust variance estimation techniques were applied to adjust P values
and CIs for familial clustering [38, 39]. Analyses were conducted using SAS, Version 9.2 (SAS
Institute Inc., 2004), and significance was evaluated using two-sided P values at the 5% testing
level.
Results
Participants included 899 women from 599 families, of which 399 (66.6%) had one
family member, 124 (20.7%) had two family members, and 76 (12.7%) had three to seven
family members. Using our familial risk definitions, 429 (47.7%) women were low risk, 212
113
(23.6%) were moderate risk and 258 (28.7%) were high risk. Of 899 women, 799 (88.9%)
remained free of a breast outcome. There were 46 self-reported cases of breast cancer, 44
(95.6%) of which were pathologically-confirmed. Of cancers with pathological confirmation, 38
(86.4%) had an invasive component, while 6 were DCIS-only (13.6%). There were 75 self-
reported cases of BBD, 56 (74.7 %) of which were pathologically-confirmed.
Women at high familial risk were significantly older at interview (P <0.0001), more
often post-menopausal (P = 0.04), and had a higher number of total lifetime mammograms (P =
0.003) than women at low/moderate risk (Table 2). Screened women were also significantly
older at interview (P <0.0001).
Women at high familial risk were significantly more likely to be diagnosed with breast
cancer (OR = 2.84; 95% CI 1.50-5.38) or BBD (OR = 1.94; 95% CI 1.03-3.66) compared with
women at low/moderate risk (Table 3). This association was significant for invasive breast
cancer (OR = 2.95; 95% CI 1.51-5.78), but not for DCIS. Women at high familial risk were
significantly more likely to be diagnosed with breast cancer at age 50 or above (OR = 2.99; 95%
CI 1.36-6.59), while diagnosis of BBD was borderline significant among women at high familial
risk below age 50 (OR = 2.26; 95% CI 0.98-5.20). Among women screened with
mammography, those at high familial risk were more likely to be diagnosed with breast cancer
(OR = 3.33; 95% CI 1.54-7.18) than women at low/moderate risk.
Prognostic features did not differ significantly by level of familial risk (Table 4).
Invasive cancers in unscreened women were significantly more likely to be larger than 15 mm
(OR = 9.72; 95% CI 1.01-93.61), and diagnosed at stage II–IV versus I (OR = 7.80; 95% CI
1.18-51.50) compared with screened women. Unscreened women also had proportionally more
tumors with metastases to the lymph nodes, higher histological grade, higher mitotic index,
lymphovascular invasion, and ER- and PR-negativity compared to screened women, however
114
these differences were not significant after adjusting for age.
Discussion
Overall, our study found that women with high familial risk were significantly more
likely to be diagnosed with invasive breast cancer and BBD than women at low/moderate risk.
While prognostic features of invasive breast cancers and BBD did not differ by level of familial
breast cancer risk, women screened with mammography had more favorable prognostic profiles.
Tumors in unscreened women were significantly larger and diagnosed at a later stage compared
with screen-detected tumors.
Women at high familial risk were approximately three times more likely to be diagnosed
with breast cancer in our study. Findings are in line with two meta-analyses, demonstrating that
women with a first-degree family history have twice the risk of developing breast cancer, while
risk increases three- to four-fold when the number of affected first-degree relatives increases
[1, 2]. Women at high familial risk were approximately twice as likely to be diagnosed with
BBD compared with low/moderate risk women. This association was more pronounced in
women below age 50, though not statistically significant. To our knowledge, this study is the
first to examine diagnoses of BBD by gradients of familial risk. However, previous
studies have found women with a first-degree family history are two to three times more likely
to be diagnosed with BBD than women without a family history [24, 40–45] and several studies,
which stratified by age, noted this association was more important in younger or premenopausal
women [24, 40–43].
Only one previous study has examined prognostic features of screen-detected breast
cancers by gradients of familial risk, similarly finding women at moderate/high risk had
proportionally fewer tumors larger than 20 mm, however statistical significance was not
reported [25]. Many studies that examined differences in prognostic features between women
115
with a first- or second-degree family history of breast cancer and women without a family
history have noted no significant differences [46–53]. However, a few studies have reported that
tumors in women with familial risk are smaller [54, 55], and more often node-negative [56, 57]
and ER+ [55] than tumors in women without a family history. These results may explain why
some studies have observed a survival benefit in women with familial risk compared with
family history negative women [54, 56, 57]. However, familial breast cancers, particularly in
BRCA1 mutation carriers, are more likely to be of a higher grade and ER- than are sporadic
cancers [58, 59]. Severity of BBD did not differ by familial risk in our study. While it has been
demonstrated that women with familial risk are more likely to develop high-risk types of BBD
compared with women without a family history [23, 24, 44], no differences in the degree of
atypia have been reported [40, 45].
Our study found that tumors among unscreened women were significantly more likely to
be larger in size (≥ 15 vs. <15 mm) and of a higher stage (stage II–IV vs. I) compared with
tumors in screened women. These findings are in line with other studies that have reported
screen detected cancers among women with familial risk tend to be smaller [17], less often
metastasized to the lymph nodes or distantly metastasized [17–20] and diagnosed at an early
stage [20] compared with symptomatic cancers. Studies in women with population-level breast
cancer risk have similarly reported that screen-detected cancers are significantly smaller [60–
64], node negative [60–62, 64], and of a lower stage [60, 61] and grade [61–64] at diagnosis
than symptomatic cancers.
Findings should be interpreted in light of several limitations. First, the number of
invasive cancers was small, reducing statistical power to detect small differences in prognostic
features by level of familial risk and screening status. Second, cases of breast cancer and BBD
were identified by self-report, and women may have been misclassified as being free of a breast
116
outcome if the outcome was unreported. High rates of sensitivity (90%) for self-reported breast
cancers have been demonstrated [65–68], and one study found higher sensitivity for women
with a family history of breast cancer compared with women without a family history, and
higher sensitivity for self-reported invasive breast cancers compared with DCIS [69]. Similarly,
data on family history of breast cancer was self-reported by probands and may be subject to
misclassification. However, studies have shown patient-reported family cancer histories for
first-degree relatives are highly accurate for breast cancer risk assessments [70]. Third, although
self-reported data is accurate for determining whether a woman has had a mammogram, it is less
accurate for determining the precise timing of screening [71,72]. To estimate recall error, we
validated self-reported mammogram dates against imaging reports, finding over 95% of women
accurately reported their mammogram use in the previous 12 months [73]. Fourth, the majority
of data on human epidermal growth factor receptor-2 (HER-2) status was missing and we were
unable to examine distributions of HER-2 expression or tumor subtypes. Phipps et al. [74]
observed increased risk of triple-negative breast tumors in women with stronger familial
histories, which is associated with poorer survival [75, 76]. Fifth, breast cancers were not
limited to those detected after the index screen (incident cancers), thus results could be subject
to length bias [77]. As the majority (88.8%) of screened women in our study had undergone two
or more mammograms, the effect of length bias was likely minimal. Finally, women who were
younger in age, less educated, single, pre-menopausal, users of hormone replacement therapy,
and smokers, were significantly less likely to participate in the study. As such, self-referral bias
cannot be excluded.
A notable strength of this study is its novel examination of prognostic features of breast
outcomes in a population of women with differing levels of familial risk, with at least a first
degree familial history. Participants were identified from a large population-based cohort of
117
relatives of cases of breast cancer, with a range of familial breast/ovarian cancer histories. The
population-based recruitment also limits self-referral bias. Additionally, the province of Ontario
has a comprehensive network of cancer treatment centers, where the majority of breast cancers
are treated and medical charts contained extensive pathology data that were consistently
complete.
Breast cancers in women screened with mammography were significantly smaller and
diagnosed at an early stage compared with unscreened women, suggesting that screening
mammography may be effective for women with a first-degree familial history, irrespective of
level of familial risk. Level of familial risk was not significantly associated with prognostic
features of invasive breast cancers or severity of BBD. Thus, women at high familial risk would
not be predicted to demonstrate poorer survival compared to women at lower familial risk. It is
also important to note that women younger in age have lower mammographic sensitivity
compared with women aged 50 years or above [78, 79]. Few studies have examined the
effectiveness of mammography screening specifically in younger women with a family history
of breast cancer; however, one recent study reported interim findings which demonstrated
favorable prognostic characteristics, and a predicted survival benefit of 20% for women younger
than 50 years of age with a moderate or high family history of breast cancer, attributable to
annual screening with mammography [80]. Future studies with longer follow-up which examine
breast cancer mortality among larger samples of women with a range of familial breast/ovarian
cancer histories and age groups must be conducted to determine whether screening
mammography is effective for all women with a family history of breast cancer. This future
work will inform optimal breast cancer screening guidelines for women with varying levels of
familial risk.
118
Acknowledgments: The authors thank the study staff: Nada Abdel-Malek, Elizabeth Arbour,
Lindsay Stewart, Sabiha Faruqui, Jennifer Kohn, Elaine Maloney and Nayana Weerasooriya.
The authors also thank the participants of the Ontario site of the Breast Cancer Family Registry.
This work was supported by the Canadian Breast Cancer Research Alliance (Grant 016270).
This work was also supported by grant UM1 CA164920 from the National Cancer Institute. The
content of this manuscript does not necessarily reflect the views or policies of the National
Cancer Institute or any of the collaborating centers in the Breast Cancer Family Registry
(BCFR), nor does mention of trade names, commercial products, or organizations imply
endorsement by the US Government or the BCFR.
Conflict of interest: The authors declare that they have no conflict of interest.
119
References
1. Collaborative Group on Hormonal Factors in Breast Cancer (2001) Familial breast cancer:
collaborative reanalysis of individual data from 52 epidemiological studies including 58,209
women with breast cancer and 101,986 women without the disease. Lancet 358:1389-1399
2. Pharoah PD, Day NE, Duffy S, Easton DF, Ponder BA (1997) Family history and the risk of
breast cancer: a systematic review and meta-analysis. Int J Cancer 71:800-809
3. Bevier M, Sundquist K, Hemminki K (2012) Risk of breast cancer in families of multiple
affected women and men. Breast Cancer Res Treat 132:723-728
4. Ziogas A, Gildea M, Cohen P, et al (2000) Cancer risk estimates for family members of a
population-based family registry for breast and ovarian cancer. Cancer Epidemiol
Biomarkers Prev 9:103-111
5. Nelson HD, Tyne K, Naik A, Bougatsos C, Chan BK, Humphrey L, U.S. Preventive
Services Task Force (2009) Screening for breast cancer: an update for the U. S. Preventive
Services Task Force. Ann Intern Med 151:727-737
6. Canadian Task Force on Preventive Health Care, Tonelli M, Connor Gorber S, et al (2011)
Recommendations on screening for breast cancer in average-risk women aged 40-74 years.
CMAJ 183:1991-2001
7. Chiarelli AM, Halapy E, Nadalin V, Shumak R, O’Malley F, Mai V (2006) Performance
measures from 10 years of breast screening in the Ontario Breast Screening Program,
1990/91 to 2000. Eur J Cancer Prev 15:34-42
8. Evans DG, Lalloo F (2002) Risk assessment and management of high risk familial breast
cancer. J Med Genet 39:865-871
9. Eccles DM, Evans DG, Mackay J (2000) Guidelines for a genetic risk based approach to
advising women with a family history of breast cancer. UK Cancer Family Study Group
(UKCFSG). J Med Genet 37:203-209
10. Eisinger F, Alby N, Bremond A, et al (1998) Recommendations for medical management of
hereditary breast and ovarian cancer: the French National Ad Hoc Committee. Ann Oncol
9:939-950
11. Møller P, Evans G, Haites N, et al (1999) Guidelines for follow-up of women at high risk for
inherited breast cancer: consensus statement from the Biomed 2 Demonstration Programme
on Inherited Breast Cancer. Dis Markers 15:207-211
12. Warner E, Heisey RE, Goel V, Carroll JC, McCready DR (1999) Hereditary breast cancer.
Risk assessment of patients with a family history of breast cancer. Can Fam Physician
45:104-112
120
13. Chart PL, Franssen E (1997) Management of women at increased risk for breast cancer:
preliminary results from a new program. CMAJ 157:1235-1242
14. Horsman D, Wilson BJ, Avard D, et al (2007) Clinical management recommendations for
surveillance and risk-reduction strategies for hereditary breast and ovarian cancer among
individuals carrying a deleterious BRCA1 or BRCA2 mutation. J Obstet Gynaecol Can
29:45-60
15. Halapy EE, Chiarelli AM, Klar N, Knight J (2004) Breast screening outcomes in women
with and without a family history of breast and/or ovarian cancer. J Med Screen 11:32-38
16. Kerlikowske K, Carney P, Geller B, et al (2000) Performance of screening mammography
among women with and without a first-degree relative with breast cancer. Ann Intern Med
133:855-863
17. Randall D, Morrell S, Taylor R, Hung WT (2009) Annual or biennial mammography
screening for women at a higher risk with a family history of breast cancer: prognostic
indicators of screen-detected cancers in New South Wales, Australia. Cancer Causes Control
20:559-566
18. Møller P, Reis MM, Evans G, et al (1999) Efficacy of early diagnosis and treatment in
women with a family history of breast cancer. Dis Markers 15:179-186
19. Møller P, Maehle L, Heimdal K, et al (1998) Prospective findings in breast cancer kindreds:
annual incidence rates according to age, stage at diagnosis, mean sojourn time, and
incidence rates for contralateral cancer. Breast 7:55-59
20. Tilanus-Linthorst MM, Bartels CC, Obdeijn AI, Oudkerk M (2000) Earlier detection of
breast cancer by surveillance of women at familial risk. Eur J Cancer 36:514-519
21. Bodian CA. Benign breast diseases, carcinoma in situ, and breast cancer risk. Epidemiologic
Reviews. 1993;15(1):177-187.
22. Fitzgibbons PL, Henson DE, Hutter RV (1998) Benign breast changes and the risk for
subsequent breast cancer. An update of the 1985 consensus statement. Arch Pathol Lab Med
122:1053-1055
23. Dupont WD, Page DL (1985) Risk factors for breast cancer in women with proliferative
breast disease. N Engl J Med 312:146-151
24. Webb PM, Byrne C, Schnitt SJ, Connolly JL, Jacobs T, Peiro G, Willett W, Colditz GA
(2002) Family history of breast cancer, age and benign breast disease. Int J Cancer 100:375-
378
25. Gui GP, Hogben RK, Walsh G, A’Hern R, Eeles R (2001) The incidence of breast cancer
from screening women according to predicted family history risk: does annual clinical
examination add to mammography? Eur J Cancer 37:1668-1673
121
26. Knight JA, Sutherland HJ, Glendon G, Boyd NF, Andrulis IL, Ontario Cancer Genetics
Network (2002) Characteristics associated with participation at various stages at the Ontario
site of the cooperative family registry for breast cancer studies. Ann Epidemiol 12:27-33
27. John EM, Hopper JL, Beck JC, et al (2004) The Breast Cancer Family Registry: an
infrastructure for cooperative multinational, interdisciplinary and translational studies of the
genetic epidemiology of breast cancer. Breast Cancer Res 6:R375-R389
28. Campitelli MA, Chiarelli AM, Mirea L, Stewart L, Glendon G, Ritvo P, Andrulis IL, Knight
JA (2011) Adherence to breast and ovarian cancer screening guidelines for female relatives
from the Ontario site of the Breast Cancer Family Registry. Eur J Cancer Prev 20:492-500
29. Zhang LR, Chiarelli AM, Glendon G, Mirea L, Edwards S, Knight JA, Andrulis IL, Ritvo P
(2011) Influence of perceived breast cancer risk on screening behaviors of female relatives
from the Ontario site of the Breast Cancer Family Registry. Eur J Cancer Prev 20:255-262
30. Cortesi L, Turchetti D, Marchi I, Fracca A, Canossi B, Rachele B, Silvia R, Rita PA, Pietro
T, Massimo F (2006) Breast cancer screening in women at increased risk according to
different family histories: an update of the Modena Study Group experience. BMC Cancer
6:210
31. Vencken PM, Kriege M, Hooning M, et al (2013) The risk of primary and contralateral
breast cancer after ovarian cancer in BRCA1/BRCA2 mutation carriers: Implications for
counseling. Cancer 119:955-962
32. National Institute for Health and Care Excellence (2013) Familial breast cancer:
classification and care of people at risk of familial breast cancer and management of breast
cancer and related risks in people with a family history of breast cancer. NICE clinical
guideline 164. http://guidance.nice.org.uk/CG164. Accessed 20 August 2013
33. Egan KM, Newcomb PA, Longnecker MP, Trentham-Dietz A, Baron JA, Trichopoulos D,
Stampfer MJ, Willett WC (1996) Jewish religion and risk of breast cancer. Lancet 347:1645-
1646
34. Toniolo PG, Kato I (1996) Jewish religion and risk of breast cancer. Lancet 348:760
35. American Joint Committee on Cancer (2002) Cancer Staging Manual. 6th ed. Springer-
Verlag, New York
36. Elston CW, Ellis IO (1991) Pathological prognostic factors in breast cancer. I. The value of
histological grade in breast cancer: experience from a large study with long-term follow-up.
Histopathology 19:403-410
122
37. Hammond ME, Hayes DF, Dowsett M, et al (2010) American Society of Clinical
Oncology/College of American Pathologists guideline recommendations for
immunohistochemical testing of estrogen and progesterone receptors in breast cancer
(unabridged version). Arch Pathol Lab Med 134:e48-e72
38. Binder DA (1983) On the variances of asymptotically normal estimators from complex
surveys. Int Stat Rev 51:279-292
39. Morel G (1989) Logistic regression under complex survey designs. Surv Method 15:203-222
40. Berkowitz GS, Kelsey JL, LiVolsi VA, Holford TR, Merino MJ, Ort S, O’Connor TZ,
White C (1985) Risk factors for fibrocystic breast disease and its histopathologic
components. J Natl Cancer Inst 75:43-50
41. Hislop TG, Elwood JM (1981) Risk factors for benign breast disease: a 30-year cohort
study. Can Med Assoc J 124:283-291
42. Berkey CS, Tamimi RM, Rosner B, Frazier AL, Colditz GA (2012) Young women with
family history of breast cancer and their risk factors for benign breast disease. Cancer
118:2796-2803
43. Bertelson L, Mellemkjaer L, Balslev E, Olsen JH (2008) Benign breast disease among first-
degree relatives of young breast cancer patients. Am J Epidemiol 168:261-267
44. Minami Y, Ohuchi N, Taeda Y, Fukao A, Hisamichi S (1998) Risk factors for benign breast
disease according to histopathological type: comparisons with risk factors for breast cancer.
Jpn J Cancer Res 89:116-123
45. Pastides H, Kelsey JL, Holford TR, LiVolsi VA (1985) An epidemiologic study of
fibrocystic breast disease with reference to ductal epithelial atypia. Am J Epidemiol
121:440-447
46. Figueiredo JC, Ennis M, Knight JA, McLaughlin JR, Hood N, O’Malley F, Andrulis IL,
Goodwin PJ (2007) Influence of young age at diagnosis and family history of breast or
ovarian cancer on breast outcomes in a population-based cohort study. Breast Cancer Res
Treat 105:69-80
47. Margolin S, Johansson H, Rutqvist LE, Lindblom A, Fornander T (2006) Family history,
and impact on clinical presentation and prognosis, in a population-based breast cancer
cohort from the Stockholm County. Fam Cancer 5:309-321
48. Verhoog LC, Brekelmans CT, Seynaeve C, et al (1998) Survival and tumour characteristics
of breast-cancer patients with germline mutations of BRCA1. Lancet 351:316-321
49. Ruder AM, Moodie PF, Nelson NA, Choi NW (1988) Does family history of breast cancer
improve survival among patients with breast cancer? Am J Obstet Gynecol 158:963-968
123
50. Israeli D, Tartter PI, Brower ST, Mizrachy B, Bratton J (1994) The significance of family
history of patients with carcinoma of the breast. J Am Coll Surg 179:29-32
51. Jobsen JJ, Meerwaltd JH, van der Palen J (2000) Family history in breast cancer is not a
prognostic factor? Breast 9:83-87
52. Russo A, Herd-Smith A, Gestri D, Bianchi S, Vezzosi V, Rosselli Del Turco M, Cardona G
(2002) Does family history influence survival in breast cancer cases? Int J Cancer 99:427-
430
53. Thalib L, Wedrén S, Granath F, Adami HO, Rydh B, Magnusson C, Hall P (2004) Breast
cancer prognosis in relation to family history of breast and ovarian cancer. Br J Cancer
90:1378-1381
54. Malone KE, Daling JR, Doody DR, O’Brien C, Resler A, Ostrander EA, Porter PL (2011)
Family history of breast cancer in relation to tumor characteristics and mortality in a
population-based study of young women with invasive breast cancer. Cancer Epidemiol
Biomarkers Prev 20:2560-2571
55. Molino A, Giovannini M, Pedersini R, Frisinghelli M, Micciolo R, Mandarà M, Pavarana
M, Cetto GL (2004) Correlations between family history and cancer characteristics in 2256
breast cancer patients. Br J Cancer 91:96-98
56. Fukutomi T, Kobayashi Y, Nanasawa T, Yamamoto H, Tsuda H (1993) A
clinicopathological analysis of breast cancer in patients with a family history. Surg Today
23:849-854
57. Mohammed SN, Smith P, Hodgson SV, Fentiman IS, Miles DW, Barnes DM, Millis RR,
Rubens RD (1998) Family history and survival in premenopausal breast cancer. Br J Cancer
77:2252-2256
58. Goodwin PJ, Phillips KA, West DW et al (2012) Breast cancer prognosis in BRCA1 and
BRCA2 mutation carriers: an International Prospective Breast Cancer Family Registry
population-based cohort study. J Clin Oncol 30:19-26
59. Mavaddat N, Barrowdale D, Andrulis IL, et al (2012) Pathology of breast and ovarian
cancers among BRCA1 and BRCA2 mutation carriers: results from the Consortium of
Investigators of Modifiers of BRCA1/2 (CIMBA). Cancer Epidemiol Biomarkers Prev
21:134-147
60. Nagtegaal ID, Duffy SW (2013) Reduction in rate of node metastases with breast screening:
consistency of association with tumor size. Breast Cancer Res Treat 137:653-663
61. Chiarelli AM, Edwards SA, Sheppard AJ, Mirea L, Chong N, Paszat L, Shumak RS,
O’Malley FP, Breast Screening Study Group (2012) Favourable prognostic factors of
subsequent screen-detected breast cancers among women aged 50-69. Eur J Cancer Prev
21:499-506
124
62. Burke JP, Power C, Gorey TF, Flanagan F, Kerin MJ, Kell MR (2008) A comparative study
of risk factors and prognostic features between symptomatic and screen detected breast
cancer. Eur J Surg Oncol 34:149-153
63. Clayforth C, Fritschi L, McEvoy S, Byrne MJ, Wylie E, Threlfall T, Sterrett G, Harvey JM,
Jamrozik K (2005) Assessing the effectiveness of a mammography screening service. ANZ J
Surg 75:631-636
64. Dillon MF, Hill AD, Quinn CM, O’Doherty A, Crown J, Fleming FJ, McDermott EW,
O’Higgins N (2004) Surgical intervention in screen-detected patients versus symptomatic
patients with breast cancer. J Med Screen 11:130-134
65. Bergmann MM, Calle EE, Mervis CA, Miracle-McMahill HL, Thun MJ, Heath CW (1998)
Validity of self-reported cancers in a prospective cohort study in comparison with data from
state cancer registries. Am J Epidemiol 147:556-562
66. Parikh-Patel A, Allen M, Wright WE, California Teachers Study Steering Committee (2003)
Validation of self-reported cancers in the California Teachers Study. Am J Epidemiol
157:539-545.
67. Manjer J, Merlo J, Berglund G (2004) Validity of self-reported information on cancer:
determinants of under- and over-reporting. Eur J Epidemiol 19:239-247.
68. Dominguez FJ, Lawrence C, Halpern EF, et al (2007) Accuracy of self-reported personal
history of cancer in an outpatient breast center. J Genet Couns 16:341-345.
69. Abraham L, Geller BM, Yankaskas BC, Bowles EJ, Karliner LS, Taplin SH, Miglioretti DL
(2009) Accuracy of self-reported breast cancer among women undergoing mammography.
Breast Cancer Res Treat 118:583-592.
70. Murff HJ, Spigel DR, Syngal S (2004) Does this patient have a family history of breast
cancer? An evidence-based analysis of the accuracy of family cancer history. JAMA
292:1480-1489
71. Rauscher GH, Johnson TP, Cho YI, Walk JA (2008) Accuracy of self-reported cancer-
screening histories: A meta-analysis. Cancer Epidemiol Biomarkers Prev 17:748-757
72. Howard M, Agarwal G, Lytwyn A (2009) Accuracy of self-reports of Pap and
mammography screening compared to medical records: a meta-analysis. Cancer Causes
Control 20:1-13
73. Walker MJ, Chiarelli AM, Mirea L, Glendon G, Ritvo P, Andrulis IL, Knight JA (2013)
Accuracy of self-reported screening mammography use: Examining recall among female
relatives from the Ontario site of the Breast Cancer Family Registry. ISRN Oncol.
doi:10.1155/2013/810573
74. Phipps AI, Buist DS, Malone KE, Barlow WE, Porter PL, Kerlikowske K, Li CI (2011)
Family history of breast cancer in first-degree relatives and triple-negative breast cancer
risk. Breast Cancer Res Treat 126:671-678
125
75. Bauer KR, Brown M, Cress RD, Parise CA, Caggiano V (2007) Descriptive analysis of
estrogen receptor (ER)-negative, progesterone receptor (PR)-negative, and HER2-negative
invasive breast cancer, the so-called triple-negative phenotype: a population-based study
from the California cancer Registry. Cancer 109:1721-1728
76. Carey LA, Perou CM, Livasy CA, et al (2006) Race, breast cancer subtypes, and survival in
the Carolina Breast Cancer Study. JAMA 295:2492-2502
77. Miller AB (1996) Fundamental issues in screening for cancer. In: Schottenfeld D, Fraumeni
JF Jr (eds) Cancer epidemiology and prevention. Oxford University Press, New York, pp
1433-1452
78. Buist DS, Porter PL, Lehman C, Taplin SH, White E (2004) Factors contributing to
mammography failure in women aged 40-49 years. J Natl Cancer Inst 96:1432-1440
79. Carney PA, Miglioretti DL, Yankaskas BC, et al (2003) Individual and combined effects of
age, breast density, and hormone replacement therapy use on the accuracy of screening
mammography. Ann Intern Med 138:168-175
80. FH01 collaborative teams (2010) Mammographic surveillance in women younger than 50
years who have a family history of breast cancer: tumour characteristics and projected effect
on mortality in the prospective, single arm, FH01 study. Lancet Oncol 11:1127-1134
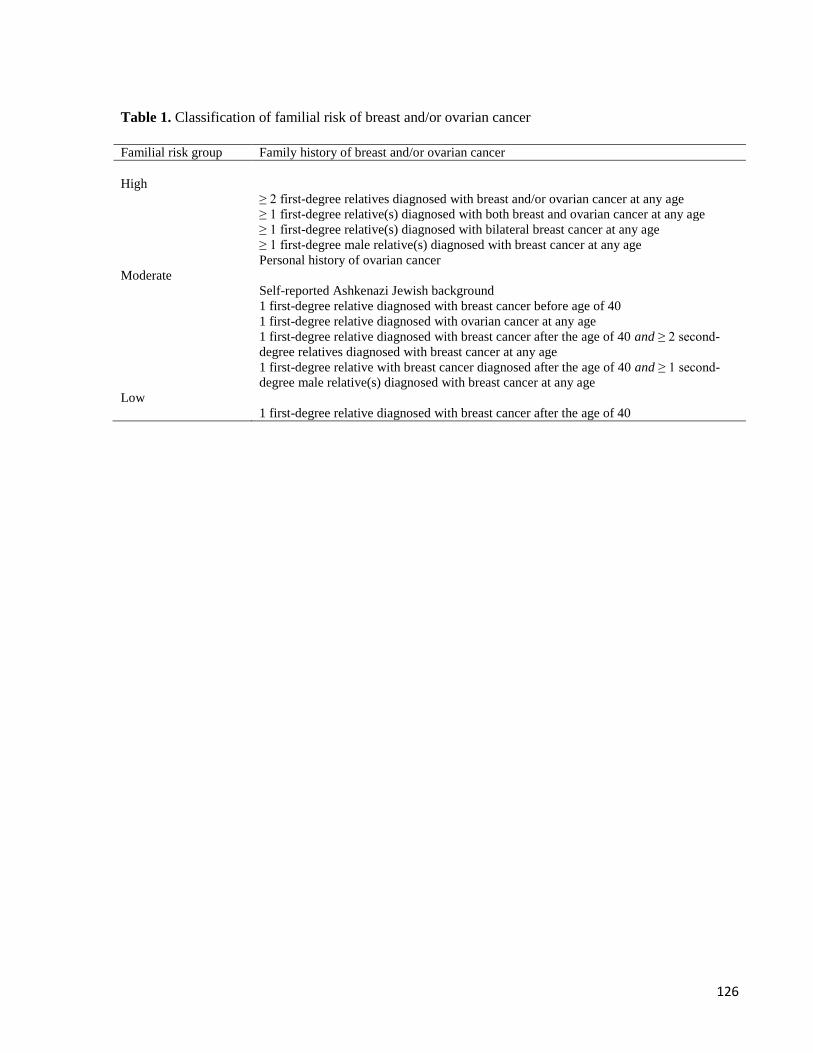
126
Table 1. Classification of familial risk of breast and/or ovarian cancer
Familial risk group Family history of breast and/or ovarian cancer
High
≥ 2 first-degree relatives diagnosed with breast and/or ovarian cancer at any age
≥ 1 first-degree relative(s) diagnosed with both breast and ovarian cancer at any age
≥ 1 first-degree relative(s) diagnosed with bilateral breast cancer at any age
≥ 1 first-degree male relative(s) diagnosed with breast cancer at any age
Personal history of ovarian cancer
Moderate
Self-reported Ashkenazi Jewish background
1 first-degree relative diagnosed with breast cancer before age of 40
1 first-degree relative diagnosed with ovarian cancer at any age
1 first-degree relative diagnosed with breast cancer after the age of 40 and ≥ 2 second-
degree relatives diagnosed with breast cancer at any age
1 first-degree relative with breast cancer diagnosed after the age of 40 and ≥ 1 second-
degree male relative(s) diagnosed with breast cancer at any age
Low
1 first-degree relative diagnosed with breast cancer after the age of 40
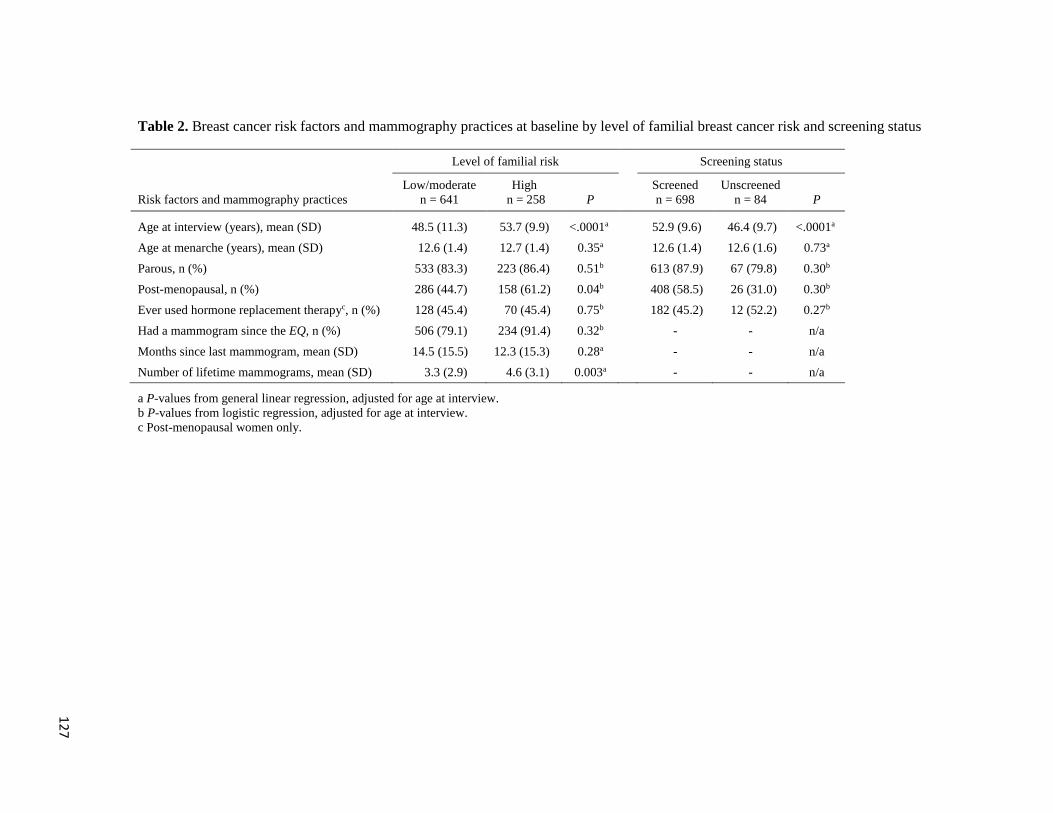
12
7
Table 2. Breast cancer risk factors and mammography practices at baseline by level of familial breast cancer risk and screening status
Level of familial risk Screening status
Risk factors and mammography practices
Low/moderate
n = 641
High
n = 258 P
Screened
n = 698
Unscreened
n = 84 P
Age at interview (years), mean (SD) 48.5 (11.3) 53.7 (9.9) <.0001a 52.9 (9.6) 46.4 (9.7) <.0001a
Age at menarche (years), mean (SD) 12.6 (1.4) 12.7 (1.4) 0.35a 12.6 (1.4) 12.6 (1.6) 0.73a
Parous, n (%) 533 (83.3) 223 (86.4) 0.51b 613 (87.9) 67 (79.8) 0.30b
Post-menopausal, n (%) 286 (44.7) 158 (61.2) 0.04b 408 (58.5) 26 (31.0) 0.30b
Ever used hormone replacement therapyc, n (%) 128 (45.4) 70 (45.4) 0.75b 182 (45.2) 12 (52.2) 0.27b
Had a mammogram since the EQ, n (%) 506 (79.1) 234 (91.4) 0.32b - - n/a
Months since last mammogram, mean (SD) 14.5 (15.5) 12.3 (15.3) 0.28a - - n/a
Number of lifetime mammograms, mean (SD) 3.3 (2.9) 4.6 (3.1) 0.003a - - n/a
a P-values from general linear regression, adjusted for age at interview.
b P-values from logistic regression, adjusted for age at interview.
c Post-menopausal women only.
128
Table 3. Adjusted odds ratios (OR) and 95% confidence intervals (CI) for associations between level of
familial breast cancer risk and diagnosis of breast cancer or benign breast disease
a Adjusted for age at interview (women without a diagnosed breast outcome) or age at diagnosis (excluding age-stratified
models) and familial clustering.
b Ductal carcinoma in situ only; breast cancer diagnoses including components of both ductal carcinoma in situ and
invasive breast cancer are classified as invasive cancers.
Level of familial risk
Breast outcome
Low/moderate
n (%)
High
n (%)
High vs. low/
moderate risk
OR (95% CI)a P
All breast cancers
No 579 (96.3) 210 (90.5) 1.00
Yes 22 (3.7) 22 (9.5) 2.84 (1.50-5.38) 0.001
Ductal carcinoma in situb
No 579 (99.5) 210 (98.6) 1.00
Yes 3 (0.5) 3 (1.4) 2.31 (0.37-14.49) 0.37
Invasive breast cancer
No 579 (96.8) 210 (91.7) 1.00
Yes 19 (3.2) 19 (8.3) 2.95 (1.51-5.78) 0.002
Aged < 50 years
No 288 (96.3) 51 (92.7) 1.00
Yes 11 (3.7) 4 (7.3) 2.26 (0.68-7.45) 0.18
Aged ≥ 50 years
No 291 (96.4) 159 (89.8) 1.00
Yes 11 (3.6) 18 (10.2) 2.99 (1.37-6.56) 0.006
Screened
No 440 (97.1) 181 (90.9) 1.00
Yes 13 (2.9) 18 (9.1) 3.33 (1.54-7.18) 0.002
Unscreened
No 45 (83.3) 10 (71.4) 1.00
Yes 9 (16.7) 4 (28.6) 2.70 (0.52-13.92) 0.23
Benign breast disease (BBD)
No 579 (94.1) 210 (91.3) 1.00
Yes 36 (5.9) 20 (8.7) 1.94 (1.03-3.66) 0.04
Aged < 50 years
No 288 (92.0) 51 (83.6) 1.00
Yes 25 (8.0) 10 (16.4) 2.26 (0.98-5.20) 0.05
Aged ≥ 50 years
No 291 (96.4) 159 (94.1) 1.00
Yes 11 (3.6) 10 (5.9) 1.66 (0.69-3.99) 0.25
Screened
Yes 440 (95.2) 181 (93.8) 1.00
No 22 (4.8) 12 (6.2) 1.66 (0.76-3.64) 0.20
Unscreened
Yes 45 (78.9) 10 (62.5) 1.00
No 12 (21.1) 6 (37.5) 3.23 (0.74-14.08) 0.12
12
9
Table 4. Prognostic characteristics of pathologically-confirmed breast outcomes by level of familial breast cancer risk and screening status
Familial risk Screening status
Characteristic
Low/moderate
n (%)
High
n (%)
High vs.
low/moderate
OR (95% CI)a
Screened
n (%)
Unscreened
n (%)
Unscreened
vs. screened
OR (95% CI)a
Invasive breast cancer cases 19 19 25 13
Tumor size (mm)
≤ 15 6 (31.6) 9 (47.4) 1.00 13 (52.0) 2 (15.4) 1.00
> 15 13 (68.4) 10 (52.6) 0.51 (0.11-2.33) 12 (48.0) 11 (84.6) 9.72 (1.01-93.61)*
Nodal involvementb
Negative 10 (62.5) 8 (61.5) 1.00 12 (63.2) 5 (50.0) 1.00
Positive 6 (37.5) 5 (38.5) 3.16 (0.38-26.48) 7 (36.8) 5 (50.0) 1.77 (0.36-8.63)
Stage at diagnosisb
I 6 (33.3) 9 (52.9) 1.00 13 (59.1) 2 (15.4) 1.00
II-IV 12 (66.7) 8 (47.1) 0.54 (0.10-2.77) 9 (40.9) 11 (84.6) 7.80 (1.18-51.50)**
Histologic grade
I 5 (26.3) 4 (21.1) 1.00 6 (24.0) 3 (23.1) 1.00
II 4 (21.1) 10 (52.6) 2.19 (0.25-18.94) 10 (40.0) 4 (30.8) 1.64 (0.13-21.52)
III 10 (52.6) 5 (26.3) 0.55 (0.06-4.74) 9 (36.0) 6 (46.1) 1.69 (0.13-21.61)
Mitotic scoreb
Low 8 (42.1) 11 (68.7) 1.00 13 (59.1) 6 (46.1) 1.00
Intermediate 5 (26.3) 2 (12.5) 0.24 (0.02-2.58) 5 (22.7) 2 (15.4) 1.00 (0.12-8.71)
High 6 (31.6) 3 (18.8) 0.40 (0.04-3.58) 4 (18.2) 5 (38.5) 2.47 (0.26-23.56)
Lymphovascular invasionb
Absent 12 (66.7) 13 (76.5) 1.00 17 (73.9) 8 (66.7) 1.00
Present 6 (33.3) 4 (23.5) 0.67 (0.13-3.53) 6 (26.1) 4 (33.3) 1.24 (0.21-7.29)
Estrogen receptor†
Positive 12 (80.0) 13 (81.2) 1.00 17 (85.0) 8 (72.7) 1.00
Negative 3 (20.0) 3 (18.8) 1.03 (0.10-10.58) 3 (15.0) 3 (27.3) 1.95 (0.20-19.35)
Progesterone receptorb
Positive 11 (73.3) 11 (68.7) 1.00 16 (80.0) 6 (54.5) 1.00
Negative 4 (26.7) 5 (31.3) 1.30 (0.19-8.90) 4 (20.0) 5 (45.5) 3.88 (0.55-27.28)
13
0
Low/moderate
n = 615
n (%)
High
n = 230
n (%)
High vs.
low/moderate
OR (95% CI)
Screened
n = 655
n (%)
Unscreened
n = 77
n (%)
Unscreened
vs. screened
OR (95% CI)
Benign breast disease 36 20 34 22
Severity
Mild 27 (75.0) 17 (85.0) 1.00 25 (73.5) 15 (83.3) 1.00
Moderate/severe 9 (25.0) 3 (15.0) 0.50 (0.11-2.22) 9 (26.5) 3 (16.7) 0.62 (0.13-2.99)
a: P-values from logistic regression, adjusted for age at diagnosis and familial clustering.
b: Frequencies do not add to stated totals due to undetermined status; percentages based on non-missing values.
* P = 0.049.
** P = 0.033.
131
4.3 Manuscript 3: Does perceived risk predict breast cancer screening
use? Findings from a prospective cohort study of female relatives from the
Ontario site of the Breast Cancer Family Registry
Walker MJ, Mirea L, Glendon G, Ritvo P, Andrulis IL, Knight JA, Chiarelli AM.
Published in The Breast. 2014; 23(4): 482-488.
ABSTRACT
While the relationship between perceived risk and breast cancer screening use has been studied
extensively, most studies are cross-sectional. We prospectively examined this relationship
among 913 women, aged 25-72 with varying levels of familial breast cancer risk from the
Ontario site of the Breast Cancer Family Registry. Associations between perceived lifetime
breast cancer risk and subsequent use of mammography, clinical breast examination (CBE) and
genetic testing were assessed using logistic regression. Overall, perceived risk did not predict
subsequent use of mammography, CBE or genetic testing. Among women at moderate/high
familial risk, those reporting a perceived risk greater than 50% were significantly less likely to
have a CBE (odds ratio (OR) = 0.52, 95% confidence interval (CI): 0.30–0.91, p = 0.04), and
non-significantly less likely to have a mammogram (OR = 0.70, 95% CI: 0.40–1.20, p = 0.70) or
genetic test (OR = 0.61, 95% CI: 0.34–1.10, p = 0.09) compared to women reporting a
perceived risk of 50%. In contrast, among women at low familial risk, those reporting a
perceived risk greater than 50% were non-significantly more likely to have a mammogram
(OR = 1.13, 95% CI: 0.59–2.16, p = 0.78), CBE (OR = 1.11, 95% CI: 0.63–1.95, p = 0.74) or
genetic test (OR = 1.29, 95% CI: 0.50–3.33, p = 0.35) compared to women reporting a
perceived risk of 50%. Perceived risk did not significantly predict screening use overall,
however this relationship may be moderated by level of familial risk. Results may inform risk
132
education and management strategies for women with varying levels of familial breast cancer
risk.
Keywords: breast cancer; perceived risk; breast cancer screening; familial risk
Introduction
Family history is one of the most important risk factors for the development of breast
cancer. Women with one affected first-degree relative are about twice as likely to develop breast
cancer compared with women who have no affected relatives, and risks are higher when more
than one first-degree relative is affected or the relative is younger at diagnosis [1-3].
A reduction in breast cancer mortality attributable to mammography screening among
women aged 50–74 has been demonstrated [4]. In Ontario, mammography is freely available to
average-risk women aged 50–74 every 2–3 years through the Ontario Breast Screening Program
(OBSP), or with physician referral through imaging facilities outside of the OBSP [5]. The
impact of mammography on reducing mortality in women with a family history of breast cancer
is unknown; however, some studies have shown that screen-detected tumors in women with a
family history are smaller [6,7], less likely to demonstrate nodal or distant metastases [6,8,9],
and diagnosed at an earlier stage [7,9] compared to symptomatic cancers. Breast screening
guidelines for women with a family history of breast cancer are based on expert opinion, and
typically include screening mammography, clinical breast examination (CBE) and/or MRI on an
annual basis starting at age 40 or 10 years prior to the earliest age of diagnosis in the family, or
as young as age 25 for BRCA mutation carriers [10-16]. Certain women with a strong family
history of breast or ovarian cancer are also eligible for referral to a specialist genetic clinic
where genetic testing may be performed [17]. In 2011, the OBSP was expanded to include
annual combined MRI and mammography for women aged 30–69 considered to be at very high
133
risk of breast cancer (i.e. BRCA1/2 mutation carriers or family history suggestive of hereditary
breast cancer) [18].
While there is a positive association between family history of breast cancer and
mammogram use [19], rates of adherence to screening guidelines in women with familial risk
remain suboptimal. One Australian population-based study of women with familial risk
demonstrated high adherence (74%) to mammography guidelines, but lower adherence (55%) to
CBE guidelines [20]. Several North American population-based studies have demonstrated
lower rates of adherence; in one study, 40% of women with familial risk screened with
mammography in the previous 11 months [21], while another study reported 36% of women at
low familial risk and 55% at moderate/high risk screened with mammography in the previous
year [22]. An inverted U-shaped relationship has also been suggested [23], wherein women at
the extreme ends of risk may screen less, in a relationship mediated by worry [24,25].
The relationship between perceived risk of breast cancer and breast cancer screening
behaviors has been widely studied. The construct of perceived risk is central to health behavior
theories, including the Health Belief Model (HBM) [26], and Protection Motivation Theory
[27]. Briefly, it is suggested that a realistic perception of risk motivates individuals to engage in
health behaviors appropriate to the level of risk [28,29]. Two meta-analyses found a small,
significant association between perceived risk and mammogram use in women with population-
level breast cancer risk [19,30]. This was confirmed for women with familial risk in our recent
review [31].
We previously conducted a cross-sectional study examining the relationship between
perceived risk and breast cancer screening behaviors in this study population, finding a
significant positive relationship between higher levels of perceived risk and annual use of
screening mammography [32]. Few prospective studies among women with familial risk have
134
been conducted [20,33-35], and are necessary to confirm previous cross-sectional findings. The
few prospective studies may not generalize to the broader population of women with familial
risk. As in many previous studies, Diefenbach et al. [35] recruited women with strong family
histories from a clinical setting, and Lemon et al. [34] examined screening in the year following
relative's breast cancer diagnosis when screening behaviors may be modified. The objective of
the present study was to prospectively assess the influence of perceived risk of breast cancer on
subsequent breast cancer screening practices and genetic test use in women with varying levels
of familial breast cancer risk.
Materials and Methods
Study population
This study utilized data from a cohort of female relatives of incident cases of invasive
breast cancer identified from the Ontario site of the Breast Cancer Family Registry (BCFR),
funded by the United States National Cancer Institute. Details of the BCFR and the Ontario site
of the BCFR have been previously described [36,37]. Briefly, cases of pathologically-confirmed
invasive breast cancer (probands), diagnosed between 1996 and 1998 were identified from the
Ontario Cancer Registry. Physicians were contacted to obtain permission to mail their patients a
cancer Family History Questionnaire (FHQ). Respondents meeting a defined set of high-risk
criteria [37] and a random sample (25%) of those not meeting these criteria were asked to
participate in the Ontario site of the BCFR. Of the 2587 eligible probands, 1851 (71.5%)
participated. Probands were then asked for permission to contact specific living relatives (all
first-degree relatives, any other relatives affected with breast, ovarian or certain other cancers
and their first-degree relatives). An invitation letter to participate in the Ontario site of the
BCFR was sent to all relatives (n = 8416), and the 5122 who agreed to be contacted were mailed
an Epidemiology Questionnaire (EQ) between 1998 and 2004.
135
This prospective cohort study was conducted several years after the initial recruitment of
relatives to the Ontario site of the BCFR. All female relatives enrolled in the Ontario site who
completed an EQ, were 20–69 years of age and unaffected by breast cancer at the time of the
proband's diagnosis were eligible to participate. From the 3374 participating female relatives,
1514 met these study criteria. A baseline Personal History and Screening Questionnaire
(PHSQ) was sent between November 2005 and March 2007 to the 1514 eligible women, of
which 1308 (86.4%) could be contacted and 1114 (85.2%) were interviewed. A follow-up
questionnaire was sent to 1077 eligible women approximately one year following the baseline
PHSQ, of which 1062 could be contacted and 975 (91.8%) were interviewed. We further
excluded 6 women diagnosed with breast cancer, 26 women without a first-degree family
history of breast/ovarian cancer, 5 women who had undergone bilateral mastectomy, 10 women
who were pregnant or breastfeeding, and 15 women missing data on their perceived breast
cancer risk. The final cohort consisted of 913 women. This study was approved by the Mount
Sinai Hospital, the University Health Network and the University of Toronto Research Ethics
Boards, and written informed consent was obtained from all women.
Data collection
Information was obtained from three questionnaires. The first (EQ) was self-
administered during recruitment of female relatives to the Ontario site of the BCFR and
collected detailed information on demographics and key behavioral risk factors for
breast/ovarian cancer. As several years had elapsed since recruitment to the registry, subsequent
questionnaires (baseline and year 1 PHSQ) with similar content were telephone-administered to
update changes in demographic and health behavior characteristics, and collect detailed
information on cancer screening. Eligible participants were sent a copy of the PHSQ
approximately two weeks prior to contact by telephone. This allowed time for participants to
136
recall specific dates and events, and allowed reference to the questionnaire during the interview.
Further details of the questionnaire instruments have been previously described [22,32,36].
Data measures
Perceived risk was assessed in the baseline PHSQ with two questions adapted from
Lipkus et al. [38]. The first asked, “On a scale from 0 to 100%, where 0 = certain not to happen
and 100 = certain to happen, how likely are you to get breast cancer in your lifetime?” The
second asked, “Compared with other women your age, how likely are you to get breast cancer in
your lifetime?” Responses ranged from “much below average” to “much above average.” The
outcomes of interest were use of screening mammography and CBE within 15 months, as well
as genetic testing. Extending the screening interval for mammography and CBE beyond the
standard 12 months allows flexibility for factors such as wait-times at imaging facilities [39,40].
Self-reported dates and reasons for screening examinations were obtained from the year 1
PHSQ. Women were asked to provide the date (month and year) or their age at last examination.
Women were also asked to indicate if the main reason for the last exam was for screening
(regular check-up or family history of breast cancer) or non-screening (breast symptom or
participation in a research study). Women were asked at year 1 whether they ever had a genetic
test for mutation of the breast and ovarian cancer susceptibility genes BRCA1/BRCA2.
Classifications of familial breast cancer risk were based on data collected by the cancer
FHQ completed by the proband, using previously referenced groups for familial breast cancer
risk [12,41], with modifications based on key evidence [1,2,17,42-44], and expert opinion.
Table 1 shows the criteria for classifying women as low, moderate or high risk. Age at interview
was calculated as the difference in years between date of birth and date of year 1 interview.
Education, frequency of visiting a healthcare professional, and use of screening mammography
or CBE within the 15 months prior to baseline, were determined using responses from the
137
baseline PHSQ. Menopausal status, history of benign breast disease, and use of genetic testing
and counseling was derived from responses to questions from the EQ, baseline and year 1 PHSQ
interviews.
Statistical analysis
Distributions of socio-demographic characteristics and health behaviors were compared
among levels of perceived breast cancer risk using overall Chi-square tests or Fisher's exact tests
where cell counts were <5. Logistic regression was used to estimate adjusted odds ratios for
associations between perceived risk (numeric and comparative) at baseline and use of screening
mammography, CBE and BRCA1/2 genetic testing at year 1. As results from the numeric and
comparative models were similar, only the models using numeric estimates of perceived risk are
shown. The relationship between numeric perceived risk as a continuous predictor and screening
use was also modeled. As results did not differ substantially from the main results, and women
demonstrated a strong preference for reporting perceived risk of exactly 50%, the categorized
perceived risk measure was used for final models. To test for non-linearity of the associations
between perceived risk and screening use, likelihood ratio tests were conducted to compare the
models using continuous perceived risk (0–100%) with the models using categorized perceived
risk (<50%, 50%, >50%). As familial risk was identified as a potential effect modifier of the
association between perceived risk and screening use, analyses were stratified by level of
familial risk (low familial risk, and moderate/high familial risk). Final multivariate models were
adjusted for age at interview, education, annual frequency of health care visits, menopausal
status, and history of benign breast disease. Models for screening mammography and CBE were
also adjusted for the corresponding baseline screening behavior and history of genetic
counseling. All models were also adjusted for breast cancer worry; however, as this did not
result in any change to the estimates, it was left out of final models. As women are clustered
138
within families, techniques for robust variance estimation were applied to estimate p-values and
confidence intervals (CI) in all regression models [45,46]. Analyses were conducted using SAS,
Version 9.2 (SAS Institute Inc., 2004) and the significance of all statistical tests was evaluated
using two-sided p-values at the 5% testing level.
Results
Participants included 913 women from 597 families, of which 394 (66.0%) had 1 family
member, 127 (21.3%) had 2 family members and 76 (12.7%) had 3–8 family members. On the
numeric scale, 211 (23.7%) women perceived their risk as <50%, 231 (25.9%) perceived their
risk as exactly 50% and 449 (50.4%) perceived their risk as >50%. Those reporting the highest
risk estimates were significantly younger (p < 0.0001), more educated (p = 0.03), pre-
menopausal (p = 0.006), visited health care professionals more frequently (p = 0.05), and more
often underwent genetic counseling (p = 0.01) (Table 2).
At follow-up, 503 (55.8%) women reported having a mammogram, 621 (68.8%) women
reported having a CBE, and 132 (14.7%) women reported having a genetic test. Women at low
familial risk were non-significantly more likely to screen with mammography if they reported
their risk as <50% vs. 50% (odds ratio (OR) = 1.48, 95% CI: 0.69–3.16, p = 0.30) or >50% vs.
50% (OR = 1.13, 95% CI: 0.59–2.16, p = 0.78) (Table 3). In contrast, women at moderate/high
familial risk were less likely to undergo mammography if their reported risk was <50% vs. 50%
(OR = 0.58, 95% CI: 0.30–1.12, p = 0.20) or >50% vs. 50% (OR = 0.70, 95% CI: 0.40–1.20,
p = 0.70). Although likelihood ratio tests could not exclude a linear relationship, our results are
consistent with a U-shaped relationship with higher mammography use for women at low
familial risk with perceived risk of <50% or >50%, and an inverted U-shaped relationship with
lower mammography use for women at moderate/high familial risk with perceived risk of <50%
or >50%.
139
Women at low familial risk were similarly likely to screen with CBE if they reported
their risk as <50% vs. 50% (OR = 1.04; 95% CI: 0.53–2.03, p = 0.96), and non-significantly
more likely to screen with CBE if they reported their risk as >50% vs. 50% (OR = 1.11; 95%
CI: 0.63–1.95, p = 0.74). A similar pattern of reduced OR estimates was observed in women at
moderate/high familial risk for CBE and genetic testing comparing women reporting their risk
as >50% vs. 50%. Women at moderate/high familial risk were non-significantly less likely to
screen with CBE if they reported their risk as <50% vs. 50% (OR = 0.76; 95% CI: 0.38–1.51,
p = 0.86), and significantly less likely to screen with CBE if they reported their risk as >50 vs.
50% (OR = 0.52, 95% CI: 0.30–0.91, p = 0.04) compared to women who perceived their risk as
exactly 50%.
Discussion
In our prospective study, baseline perceived risk of breast cancer did not predict
subsequent use of mammography, CBE or genetic testing in the overall cohort. We found some
evidence to suggest this relationship may be modified by familial breast cancer risk. Among
women at low risk, women who perceived their risk as less than 50% or greater than 50% were
non-significantly more likely to report screening with mammography and CBE compared with
women who perceived their risk as 50% (U-shaped relationship). A curvilinear (inverted U-
shaped) relationship between perceived risk and screening use was observed among women at
moderate/high familial risk; women were non-significantly less likely to have a screening
mammogram, or genetic test, and significantly less likely to have a CBE if they perceived their
risk to be less than 50% or greater than 50% compared with women who perceived their risk as
50%.
Studies examining the relationship between perceived risk and adherence to
mammography guidelines in women with familial breast cancer risk have reported mixed
140
results. Several cross-sectional studies examining annual or biennial screening mammogram use
found a positive relationship between higher levels of perceived risk and adherence [47-51]. An
earlier cross-sectional analysis in the same cohort described in the present study found that
women with higher levels of perceived risk were significantly more likely to report an annual
mammogram [32]. Alternatively, other cross-sectional studies did not observe an association
[52-56]. One prospective study reported a significant positive correlation between perceived risk
and adherence [33], while another prospective study found women with ‘higher’ perceived risk
(but not ‘much higher’) were significantly more likely to have a mammogram than women with
lower perceived risk in the year following their relative's diagnosis [34]. Consistent with our
overall results, two prospective studies found perceived risk did not predict mammogram use
[20,35].
Most previous studies, mainly cross-sectional [32,49,52,57] and one prospective study
[20], have not observed a significant association between perceived risk and CBE adherence in
women with familial breast cancer risk. Few studies have examined the influence of perceived
risk on genetic testing, instead focussing on intention to undergo testing. In our study, perceived
risk was not associated with undergoing genetic testing. In Ontario, genetic testing requires
referral by a physician based on a strong familial cancer history, and thus it is not expected that
perceived risk would influence use of genetic testing.
It is likely that different study designs and screening guidelines account for much of the
inconsistency in findings across studies. The simultaneous measurement of perceived risk and
screening use in cross-sectional research makes the direction of this relationship impossible to
establish. It is probable that women's recent breast cancer screening histories influence their
perceived risk. This reverse influence likely explains why many cross-sectional studies
(including the earlier cross-sectional analysis of this cohort) have observed associations, while
141
perceived risk did not predict subsequent screening in our study overall, as well as a few other
prospective studies [20,35]. Factors such as physician recommendation or other individual-level
characteristics such as breast cancer worry likely have a more direct impact on screening
behaviors.
There is also a lack of consensus regarding the most valid approach to measuring risk
perception, leading to differences in the measurement scales employed across studies, and the
risk estimates produced [30,58,59]. A recent study which asked study participants to explain
their reported numeric mortality risk estimates demonstrated that 50% was significantly more
likely than other probabilities to be reflective of one being unaware of their risk, particularly
among those with lower education and numeracy [60]. It should be noted that approximately
26% of women in our study reported a perceived risk of 50%, and these women tended to have
lower levels of education and no history of genetic counseling.
Due to the wide range of familial breast cancer histories in our cohort, we were able to
examine the influence of perceived risk on screening use within strata of familial risk. To our
knowledge, this is the first study to examine this relationship among subgroups of objective
breast cancer risk. Women with strong family histories may hold exaggerated risk perceptions
and disproportionately experience worry about developing cancer, which could influence
screening behaviors. It has been demonstrated that highly elevated levels of cancer anxiety or
worry may deter breast cancer screening in women with familial risk [25,47,53,56], and there is
some evidence that the relationship is curvilinear [24,61-63], where moderately elevated levels
of worry are most predictive of screening. It is plausible that highly elevated levels of perceived
risk may negatively impact coping abilities and promote avoidance of screening in a similar way
to breast cancer worry, deterring the regular use of breast cancer screening, as our findings in
women with moderate/high familial risk suggest.
142
The main strength of this study is the prospective design, which limits reverse causality.
This study was conducted within a population-based cohort of relatives of cases of breast
cancer, thus generalizability is extended to the larger population of women with familial risk. As
the mortality benefits of breast screening are afforded through regular use, we investigated
screening within 15 months, while previous studies have often examined ever-screening. To
avoid underestimating screening use, our analyses excluded women who were pregnant,
breastfeeding or had undergone mastectomy and thus have modified breast screening practices.
Limitations include possible misclassification resulting from use of self-reported data to
measure screening use. While self-reported mammogram data is valid for determining if a
woman has had a mammogram, it is less accurate for determining timing of screening [64,65].
To estimate the magnitude of recall error, we validated self-reported mammogram dates against
medical records. We found that self-reported mammogram use within the previous 12 months
was accurate for over 95% of women across all study years [66]. Additionally, we had low
statistical power to detect small differences in screening behaviors by level of perceived and
familial risk in stratified analyses. Finally, we note that our finding regarding the influence of
perceived risk on screening behaviors may be different in populations with different breast
cancer screening recommendations or healthcare systems.
Breast cancer screening requires behavioral action at the individual level. Understanding
the factors which influence screening is needed to develop strategies to increase rates of regular
use. In this cohort of women with familial breast cancer risk, perceived risk did not predict
subsequent use of screening mammography, CBE or genetic testing overall. Among women at
high familial risk, an inverted U-shaped curvilinear relationship was suggested. Women at high
familial risk were less likely to screen with any modality if they perceived their risk as less than
or greater than 50% compared with women who perceived their risk as exactly 50%. Low, and
143
highly elevated risk perceptions may deter appropriate screening use in women with high
familial risk. Further investigation of the concordance between objective and subjective
measures of risk, and the influence of perceived risk on breast screening in women with varying
levels of familial risk is needed. This will allow researchers and clinicians to understand where
appropriate risk management efforts should be focused in women with familial breast cancer
risk.
Sources of funding
This work was supported by the Canadian Breast Cancer Foundation – Ontario Region, and the
Canadian Breast Cancer Research Alliance (Grant 016270). This work was also supported by
grant UM1 CA164920 from the National Cancer Institute. The content of this manuscript does
not necessarily reflect the views or policies of the National Cancer Institute or any of the
collaborating centers in the Breast Cancer Family Registry (BCFR), nor does mention of trade
names, commercial products, or organizations imply endorsement by the US Government or the
BCFR. There was no involvement of the study sponsors in the study design, collection, analysis
and interpretation of data; the writing of the manuscript; or the decision to submit the
manuscript for publication.
Conflict of interest statement
None declared.
Acknowledgements
The authors thank the study staff and participants of the Ontario site of the Breast Cancer
Family Registry.
144
References
1. Bevier M, Sundquist K, Hemminki K. Risk of breast cancer in families of multiple affected
women and men. Breast Cancer Res Treat 2012; 132:723-728.
2. Collaborative Group on Hormonal Factors in Breast Cancer. Familial breast cancer:
Collaborative reanalysis of individual data from 52 epidemiological studies including
58,209 women with breast cancer and 101,986 women without the disease. Lancet 2001;
358:1389-1399.
3. Pharoah PD, Day NE, Duffy S, Easton DF, Ponder BA. Family history and the risk of breast
cancer: a systematic review and meta-analysis. Int J Cancer 1997; 71:800-809.
4. Nelson HD, Tyne K, Naik A, Bougatsos C, Chan BK, Humphrey L. Screening for breast
cancer: an update for the U. S. Preventive Services Task Force. Ann Intern Med 2009;
151:727-737.
5. Chiarelli AM, Halapy E, Nadalin V, Shumak R, O’Malley F, Mai V. Performance measures
from 10 years of breast screening in the Ontario Breast Screening Program, 1990/91 to 2000.
Eur J Cancer Prev 2006; 15:34-42.
6. Randall D, Morrell S, Taylor R, Hung WT. Annual or biennial mammography screening for
women at a higher risk with a family history of breast cancer: prognostic indicators of
screen-detected cancers in New South Wales, Australia. Cancer Causes Control 2009;
20:559-566.
7. Walker MJ, Mirea L, Cooper K, et al. Impact of familial risk and mammography screening
on prognostic indicators of breast disease among women from the Ontario site of the Breast
Cancer Family Registry. Fam Cancer 2013; doi:10.1007/s10689-013-9689-9.
8. Møller P, Reis MM, Evans G, et al. Efficacy of early diagnosis and treatment in women with
a family history of breast cancer. Dis Markers 1999;15: 179-186.
9. Tilanus-Linthorst MM, Bartels CC, Obdeijn AI, Oudkerk M. Earlier detection of breast
cancer by surveillance of women at familial risk. Eur J Cancer 2000; 36:514-519.
10. Horsman D, Wilson BJ, Avard D, et al. Clinical management recommendations for
surveillance and risk-reduction strategies for hereditary breast and ovarian cancer among
individuals carrying a deleterious BRCA1 or BRCA2 mutation. J Obstet Gynaecol Can
2007; 29:45-60.
11. Evans DG, Lalloo F. Risk assessment and management of high risk familial breast cancer. J
Med Genet 2002; 39:865-871.
12. Eccles DM, Evans DG, Mackay J. Guidelines for a genetic risk based approach to advising
women with a family history of breast cancer. UK Cancer Family Study Group (UKCFSG).
J Med Genet 2000; 37:203-209.
145
13. Møller P, Evans G, Haites N, et al. Guidelines for follow-up of women at high risk for
inherited breast cancer: consensus statement from the Biomed 2 Demonstration Programme
on Inherited Breast Cancer. Dis Markers 1999; 15:207-211.
14. Warner E, Heisey RE, Goel V, Carroll JC, McCready DR. Hereditary breast cancer: Risk
assessment of patients with a family history of breast cancer. Can Fam Physician 1999;
45:104-112.
15. Eisinger F, Alby N, Bremond A, et al. Recommendations for medical management of
hereditary breast and ovarian cancer: the French National Ad Hoc Committee. Ann Oncol
1998; 9:939-950.
16. Chart PL, Franssen E. Management of women at increased risk for breast cancer:
preliminary results from a new program. CMAJ 1997; 157:1235-1242.
17. National Institute for Health and Care Excellence. Familial breast cancer: classification and
care of people at risk of familial breast cancer and management of breast cancer and related
risks in people with a family history of breast cancer. NICE clinical guideline 164. 2013;
http://guidance.nice.org.uk/CG164. Accessed 20 Aug 2013.
18. Chiarelli AM, Prummel MV, Muradali D, et al. (In Press). Effectiveness of screening with
annual magnetic resonance imaging and mammography: Results of the initial screen from
the Ontario High Risk Breast Screening Program. J Clin Oncol 2014.
19. McCaul KD, Branstetter AD, Schroeder DM, Glasgow RE. What is the relationship between
breast cancer risk and mammography screening? A meta-analytic review. Health Psychol
1996; 15:423-429.
20. Price MA, Butow PN, Charles M, et al. Predictors of breast cancer screening behavior in
women with a strong family history of the disease. Breast Cancer Res Treat 2010; 124:509-
519.
21. Madlensky L, Vierkant RA, Vachon CM, et al. Preventive health behaviors and familial
breast cancer. Cancer Epidemiol Biomarkers Prev 2005; 14:2340-2345.
22. Campitelli MA, Chiarelli AM, Mirea L, et al. Adherence to breast and ovarian cancer
screening recommendations for female relatives from the Ontario site of the Breast Cancer
Family Registry. Eur J Cancer Prev 2011; 20:492-500.
23. Hailey BJ. Family history of breast cancer and screening behavior: An inverted U-shaped
curve? Med Hypotheses 1991; 36:397-403.
24. Andersen MR, Smith R, Meischke H, Bowen D, Urban N. Breast cancer worry and
mammography use by women with and without a family history in a population-based
sample. Cancer Epidemiol Biomarkers Prev 2003; 12:314-320.
25. Kash KM, Holland JC, Halper MS, Miller DG. Psychological distress and surveillance
behaviors of women with a family history of breast cancer. J Natl Cancer Inst 1992; 84:24-
30.
26. Becker MH. The Health Belief Model and personal health behavior. Thorofare: C.B. Slack
Inc., 1974.
146
27. Rogers RW. A protection motivation theory of fear appeals and attitude change. J Psychol
1975; 91:93-114.
28. Leventhal H, Kelly K, Leventhal EA. Population risk, actual risk, perceived risk, and cancer
control: A discussion. J Natl Cancer Inst Monogr 1999; 25:81-85.
29. Rosenstock, IM. Historical origins of the health belief model. Health Educ Monogr 1974;
2:328-335.
30. Katapodi MC, Lee KA, Facione NC, Dodd MJ. Predictors of perceived breast cancer risk
and the relation between perceived risk and breast cancer screening: a meta-analytic review.
Prev Med 2004; 38:388-402.
31. Walker MJ, Chiarelli AM, Knight JA, Mirea L, Glendon G, Ritvo P. Perceived risk and
adherence to breast cancer screening guidelines among women with a familial history of
breast cancer: A review of the literature. Breast 2013; 22:395-404.
32. Zhang LR, Chiarelli AM, Glendon G, et al. Influence of perceived breast cancer risk on
screening behaviors of female relatives from the Ontario site of the Breast Cancer Family
Registry. Eur J Cancer Prev 2011; 20:255-262.
33. Somers TJ, Michael JC, Klein WM, Baum A. Cancer genetics service interest in women
with a limited family history of breast cancer. J Genet Couns 2009; 18:339-349.
34. Lemon SC, Zapka JG, Clemow L, Estabrook B, Fletcher K. Mammography screening after
breast cancer diagnosis in a first degree female relative: age group differences (United
States). Cancer Causes Control 2006; 17:1053-1065.
35. Diefenbach MA, Miller SM, Daly MB. Specific worry about breast cancer predicts
mammography use in women at risk for breast and ovarian cancer. Health Psychol 1999;
18:532-536.
36. John EM, Hopper JL, Beck JC, et al. The Breast Cancer Family Registry: an infrastructure
for cooperative multinational, interdisciplinary and translational studies of the genetic
epidemiology of breast cancer. Breast Cancer Res 2004; 6:R375-389.
37. Knight J, Sutherland HJ, Glendon G, Boyd NF, Andrulis IL, Ontario Cancer Genetics
Network. Characteristics associated with participation at various stages at the Ontario site of
the cooperative family registry for breast cancer studies. Ann Epidemiol 2002; 12:27-33.
38. Lipkus IM, Kuchibhatla M, McBride CM, et al. Relationships among breast cancer
perceived absolute risk, comparative risk, and worries. Cancer Epidemiol Biomarkers Prev
2000; 9:973-975.
39. Boudreau DM, Luce CL, Ludman E, Bonomi AE, Fishman PA. Concordance of population-
based estimates of mammography screening. Prev Med 2007; 45:262-266.
40. Clark MA, Rakowski W, Bonacore, LB. Repeat mammography: prevalence estimates and
considerations for assessment. Ann Behav Med 2003; 26:201-211.
147
41. Cortesi L, Turchetti D, Marchi I, et al. Breast cancer screening in women at increased risk
according to different family histories: an update of the Modena Study Group experience.
BMC Cancer 2006; 6:210.
42. Vencken PM, Kriege M, Hooning M et al. The risk of primary and contralateral breast
cancer after ovarian cancer in BRCA1/BRCA2 mutation carriers: implications for
counseling. Cancer 2013; 119:955–962.
43. Egan KM, Newcomb PA, Longnecker MP, et al. Jewish religion and risk of breast cancer.
Lancet 1996; 347:1645–1646.
44. Toniolo PG, Kato I. Jewish religion and risk of breast cancer. Lancet 1996; 348:760.
45. Morel JG. Logistic regression under complex survey designs. Survey Methodol 1989;
15:203-223.
46. Binder DA. On the variances of asymptotically normal estimators from complex surveys. Int
Stat Rev 1983; 51:279-292.
47. Schwartz MD, Taylor KL, Willard KS, Siegel JE, Lamdan RM, Moran K. Distress,
personality, and mammography utilization among women with a family history of breast
cancer. Health Psychol 1999; 18:327-332.
48. Finney Rutten LJ & Iannotti RJ. Health beliefs, salience of breast cancer family history, and
involvement with breast cancer issues: adherence to annual mammography screening
recommendations. Cancer Detect Prev 2003; 27:353-359.
49. Isaacs C, Peshkin BN, Schwartz M, Demarco TA, Main D, Lerman C. Breast and ovarian
cancer screening practices in healthy women with a strong family history of breast or
ovarian cancer. Breast Cancer Res Treat 2002; 71:103-112.
50. Schildkraut JM, Lerman C, Lustbader E, Rimer BK. Adherence to mammography among
subgroups of women at high risk for breast cancer. J Womens Health 1995; 4:645-654.
51. Bowen DJ, Helmes A, Powers D, et al. Predicting breast cancer screening intentions and
behavior with emotion and cognition. J Soc Clin Psychol 2003; 22:213-232.
52. Martin W, Degner L. Perception of risk and surveillance practices of women with a family
history of breast cancer. Cancer Nurs 2006; 29:227-235.
53. Lindberg NM, Wellisch D. Anxiety and compliance among women at high risk for breast
cancer. Ann Behav Med 2001; 23:298-303.
54. Drossaert CC, Boer H, Seydel ER. Perceived risk, anxiety, mammogram uptake, and breast
self-examination of women with a family history of breast cancer: the role of knowing to be
at increased risk. Cancer Detect Prev 1996; 20:76-85.
55. Audrain J, Lerman C, Rimer B, Cella D, Steffens R, Gomez-Caminero A. Awareness of
heightened breast cancer risk among first-degree relatives of recently diagnosed breast
cancer patients. Cancer Epidemiol Biomarkers Prev 1995; 4:561-565.
148
56. Lerman C, Daly M, Sands C, et al. Mammography adherence and psychological distress
among women at risk for breast cancer. J Natl Cancer Inst 1993; 85:1074-1080.
57. Benedict S, Goon G, Hoomani J, Holder P. Breast cancer detection by daughters of women
with breast cancer. Cancer Pract 1997; 5:213-219.
58. Taylor KL, Shelby RA, Schwartz MD, et al. The impact of item order on ratings of cancer
risk perception. Cancer Epidemiol Biomarkers Prev 2002; 11:654-659.
59. Gurmankin Levy A, Shea J, Williams SV, Quistberg A, Armstrong K. Measuring
perceptions of breast cancer risk. Cancer Epidemiol Biomarkers Prev 2006; 15:1893-1898.
60. Bruine de Bruin W, Carman KG. Measuring risk perceptions: what does the excessive use of
50% mean? Med Decis Making 2012; 32:232-236.
61. Bowen DJ, Alfano CM, McGregor BA, Andersen MR. The relationship between perceived
risk, affect, and health behaviors. Cancer Detect Prev 2004; 28:409-417.
62. Sutton S, Bickler G, Sancho-Aldridge J, Saidi G. Prospective study of predictors of
attendance for breast screening in inner London. J Epidemiol Community Health 1994;
48:65-73.
63. Zhang LR, Chiarelli AM, Glendon G, et al. Worry is good for breast cancer screening: a
study of female relatives from the Ontario site of the Breast Cancer Family Registry. J
Cancer Epidemiol 2012; doi:10.1155/2012/545062.
64. Rauscher GH, Johnson TP, Cho YI, Walk JA. Accuracy of self-reported cancer-screening
histories: A meta-analysis. Cancer Epidemiol Biomarkers Prev 2008; 17:748-757.
65. Howard M, Agarwal G, Lytwyn A. Accuracy of self-reports of Pap and mammography
screening compared to medical record: a meta-analysis. Cancer Causes Control 2009; 20:1-
13.
66. Walker MJ, Chiarelli AM, Mirea L, et al. Accuracy of self-reported screening
mammography use: Examining recall among female relatives from the Ontario site of the
Breast Cancer Family Registry. ISRN Oncol 2013; doi:10.1155/2013/810573.
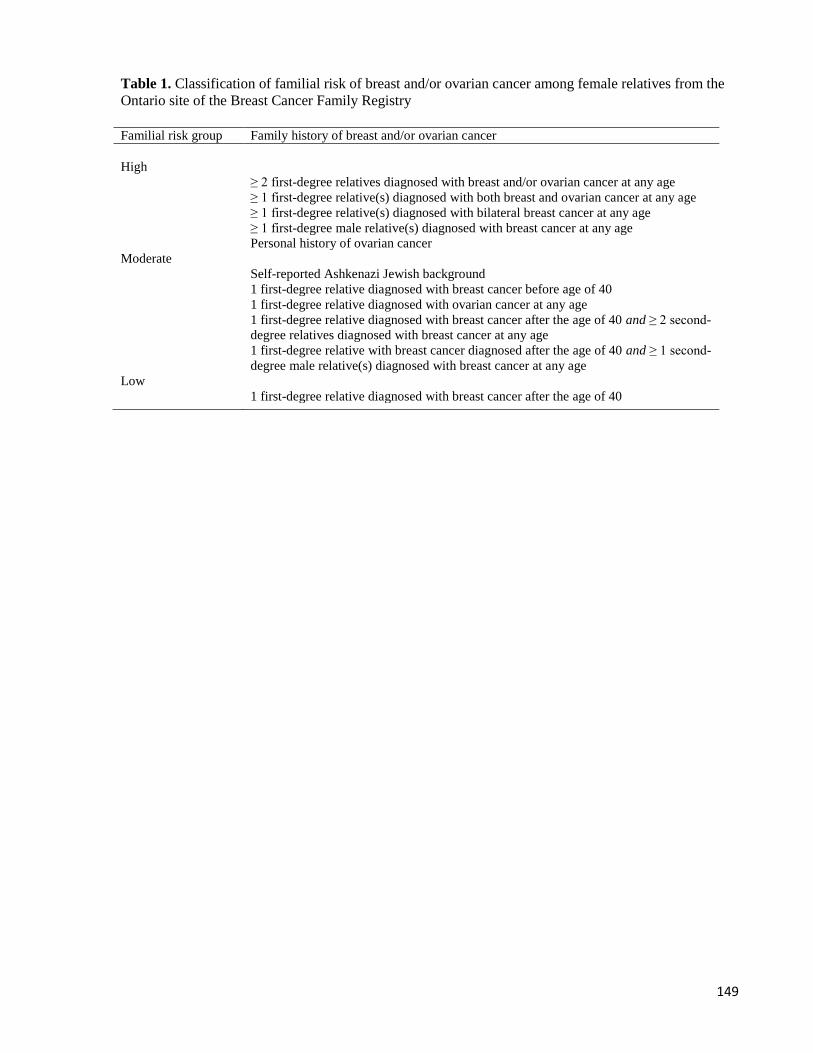
149
Table 1. Classification of familial risk of breast and/or ovarian cancer among female relatives from the
Ontario site of the Breast Cancer Family Registry
Familial risk group Family history of breast and/or ovarian cancer
High
≥ 2 first-degree relatives diagnosed with breast and/or ovarian cancer at any age
≥ 1 first-degree relative(s) diagnosed with both breast and ovarian cancer at any age
≥ 1 first-degree relative(s) diagnosed with bilateral breast cancer at any age
≥ 1 first-degree male relative(s) diagnosed with breast cancer at any age
Personal history of ovarian cancer
Moderate
Self-reported Ashkenazi Jewish background
1 first-degree relative diagnosed with breast cancer before age of 40
1 first-degree relative diagnosed with ovarian cancer at any age
1 first-degree relative diagnosed with breast cancer after the age of 40 and ≥ 2 second-
degree relatives diagnosed with breast cancer at any age
1 first-degree relative with breast cancer diagnosed after the age of 40 and ≥ 1 second-
degree male relative(s) diagnosed with breast cancer at any age
Low
1 first-degree relative diagnosed with breast cancer after the age of 40
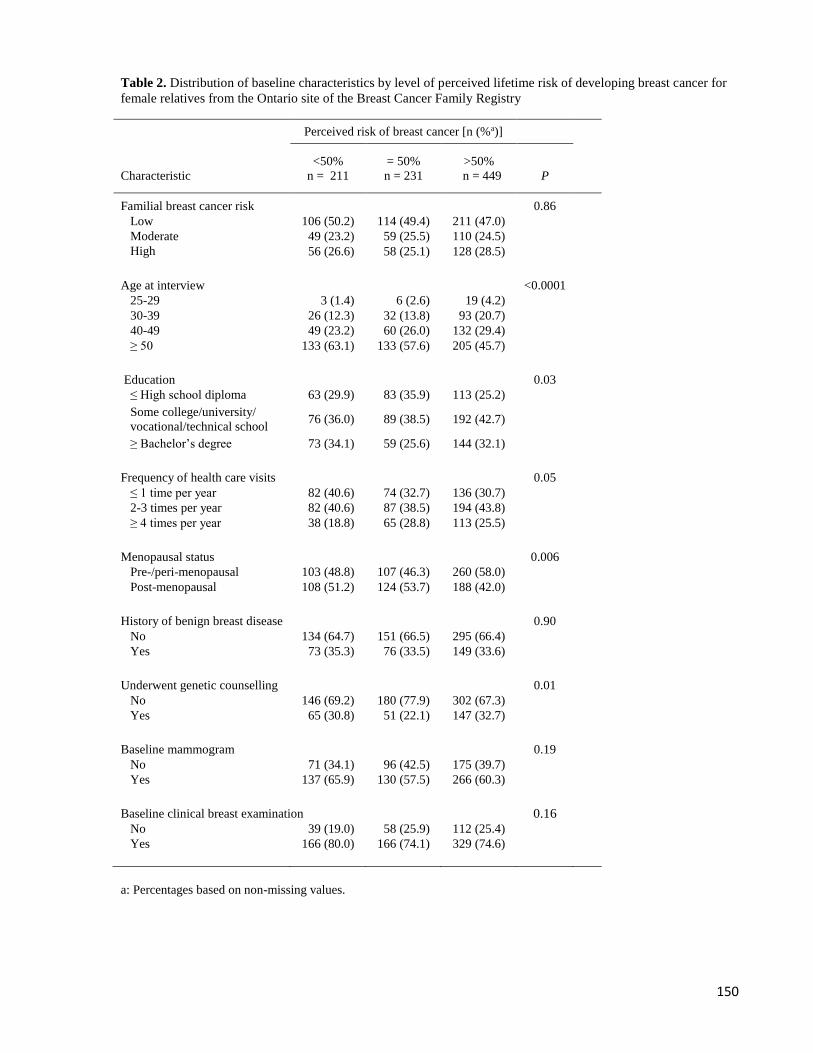
150
Table 2. Distribution of baseline characteristics by level of perceived lifetime risk of developing breast cancer for
female relatives from the Ontario site of the Breast Cancer Family Registry
Perceived risk of breast cancer [n (%a)]
Characteristic
<50%
n = 211
= 50%
n = 231
>50%
n = 449 P
Familial breast cancer risk 0.86
Low 106 (50.2) 114 (49.4) 211 (47.0)
Moderate 49 (23.2) 59 (25.5) 110 (24.5)
High
A 56 (26.6) 58 (25.1) 128 (28.5)
Age at interview <0.0001
25-29 3 (1.4) 6 (2.6) 19 (4.2)
30-39 26 (12.3) 32 (13.8) 93 (20.7)
40-49 49 (23.2) 60 (26.0) 132 (29.4)
≥ 50 133 (63.1) 133 (57.6) 205 (45.7)
Education 0.03
≤ High school diploma 63 (29.9) 83 (35.9) 113 (25.2)
Some college/university/
vocational/technical school 76 (36.0) 89 (38.5) 192 (42.7)
≥ Bachelor’s degree 73 (34.1) 59 (25.6) 144 (32.1)
Frequency of health care visits 0.05
≤ 1 time per year 82 (40.6) 74 (32.7) 136 (30.7)
2-3 times per year 82 (40.6) 87 (38.5) 194 (43.8)
≥ 4 times per year 38 (18.8) 65 (28.8) 113 (25.5)
Menopausal status 0.006
Pre-/peri-menopausal 103 (48.8) 107 (46.3) 260 (58.0)
Post-menopausal 108 (51.2) 124 (53.7) 188 (42.0)
History of benign breast disease 0.90
No 134 (64.7) 151 (66.5) 295 (66.4)
Yes 73 (35.3) 76 (33.5) 149 (33.6)
Underwent genetic counselling 0.01
No 146 (69.2) 180 (77.9) 302 (67.3)
Yes 65 (30.8) 51 (22.1) 147 (32.7)
Baseline mammogram 0.19
No 71 (34.1) 96 (42.5) 175 (39.7)
Yes 137 (65.9) 130 (57.5) 266 (60.3)
Baseline clinical breast examination 0.16 No 39 (19.0) 58 (25.9) 112 (25.4)
Yes 166 (80.0) 166 (74.1) 329 (74.6)
a: Percentages based on non-missing values.
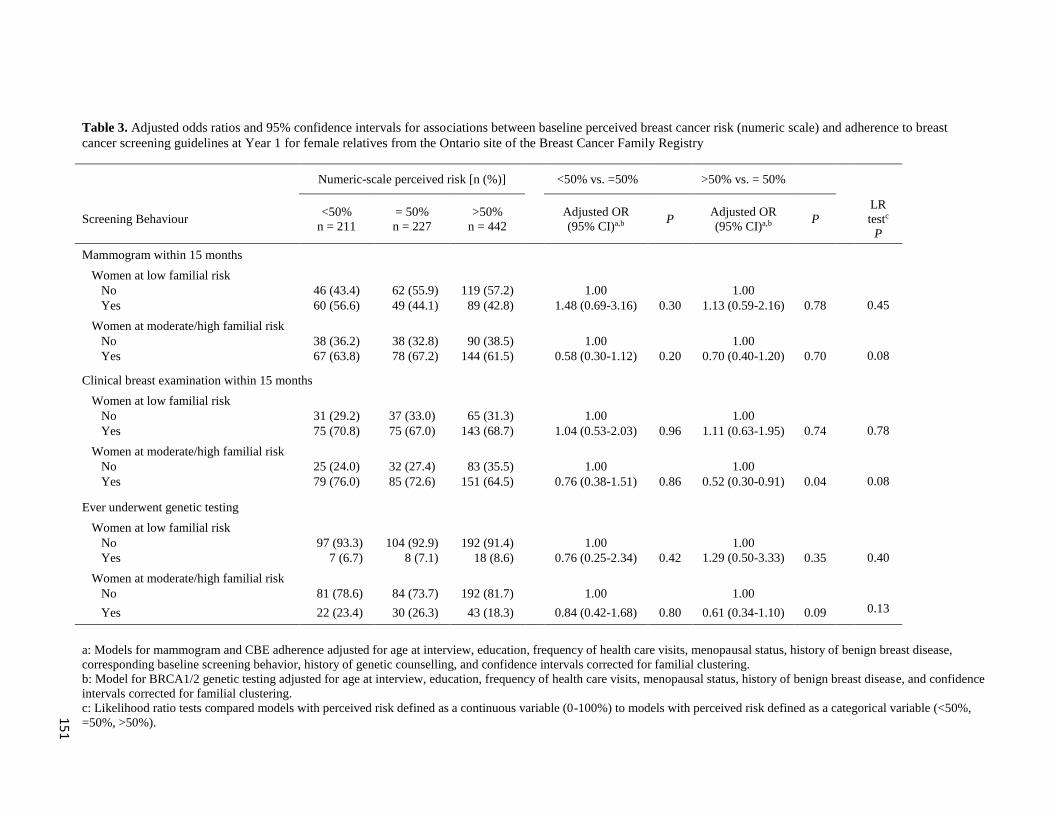
15
1
Table 3. Adjusted odds ratios and 95% confidence intervals for associations between baseline perceived breast cancer risk (numeric scale) and adherence to breast
cancer screening guidelines at Year 1 for female relatives from the Ontario site of the Breast Cancer Family Registry
a: Models for mammogram and CBE adherence adjusted for age at interview, education, frequency of health care visits, menopausal status, history of benign breast disease,
corresponding baseline screening behavior, history of genetic counselling, and confidence intervals corrected for familial clustering.
b: Model for BRCA1/2 genetic testing adjusted for age at interview, education, frequency of health care visits, menopausal status, history of benign breast disease, and confidence
intervals corrected for familial clustering.
c: Likelihood ratio tests compared models with perceived risk defined as a continuous variable (0-100%) to models with perceived risk defined as a categorical variable (<50%,
=50%, >50%).
Numeric-scale perceived risk [n (%)] <50% vs. =50% >50% vs. = 50%
Screening Behaviour <50%
n = 211
= 50%
n = 227
>50%
n = 442
Adjusted OR
(95% CI)a,b P Adjusted OR
(95% CI)a,b P
LR
testc
P
Mammogram within 15 months
Women at low familial risk
No 46 (43.4) 62 (55.9) 119 (57.2) 1.00 1.00
Yes 60 (56.6) 49 (44.1) 89 (42.8) 1.48 (0.69-3.16) 0.30 1.13 (0.59-2.16) 0.78 0.45
Women at moderate/high familial risk
No 38 (36.2) 38 (32.8) 90 (38.5) 1.00 1.00
Yes 67 (63.8) 78 (67.2) 144 (61.5) 0.58 (0.30-1.12) 0.20 0.70 (0.40-1.20) 0.70 0.08
Clinical breast examination within 15 months
Women at low familial risk
No 31 (29.2) 37 (33.0) 65 (31.3) 1.00 1.00
Yes 75 (70.8) 75 (67.0) 143 (68.7) 1.04 (0.53-2.03) 0.96 1.11 (0.63-1.95) 0.74 0.78
Women at moderate/high familial risk
No 25 (24.0) 32 (27.4) 83 (35.5) 1.00 1.00
Yes 79 (76.0) 85 (72.6) 151 (64.5) 0.76 (0.38-1.51) 0.86 0.52 (0.30-0.91) 0.04 0.08
Ever underwent genetic testing
Women at low familial risk
No 97 (93.3) 104 (92.9) 192 (91.4) 1.00 1.00
Yes 7 (6.7) 8 (7.1) 18 (8.6) 0.76 (0.25-2.34) 0.42 1.29 (0.50-3.33)
)((03.03)
0.35 0.40
Women at moderate/high familial risk
No 81 (78.6) 84 (73.7) 192 (81.7) 1.00 1.00
Yes 22 (23.4) 30 (26.3) 43 (18.3) 0.84 (0.42-1.68) 0.80 0.61 (0.34-1.10) 0.09 0.13
152
4.4 Manuscript 4: Accuracy of self-reported screening mammography use:
examining recall among female relatives from the Ontario site of the Breast
Cancer Family Registry.
Walker MJ, Chiarelli AM, Mirea L, Glendon G, Ritvo P, Andrulis IL, Knight JA.
Published in ISRN Oncology, 2013. doi: 10.1155/2013/810573.
ABSTRACT
Evidence of the accuracy of self-reported mammography use among women with familial breast
cancer risk is limited. This study examined the accuracy of self-reported screening
mammography dates in a cohort of 1,114 female relatives of breast cancer cases, aged 26 to 73
from the Ontario site of the Breast Cancer Family Registry. Self-reported dates were compared
to dates abstracted from imaging reports. Associations between inaccurate recall and subject
characteristics were assessed using multinomial regression. Almost all women (95.2% at
baseline, 98.5% at year 1, 99.8% at year 2) accurately reported their mammogram use within the
previous 12 months. Women at low familial risk (OR = 1.77, 95% CI: 1.00–3.13), who reported
1 or fewer annual visits to a health professional (OR = 1.97, 95% CI: 1.15, 3.39), exhibited a
lower perceived breast cancer risk (OR = 1.90, 95% CI: 1.15, 3.15), and reported a mammogram
date more than 12 months previous (OR = 5.22, 95% CI: 3.10, 8.80), were significantly more
likely to inaccurately recall their mammogram date. Women with varying levels of familial risk
are accurate reporters of their mammogram use. These results present the first evidence of self-
reported mammography recall accuracy among women with varying levels of familial risk.
153
1. Introduction
Having a family history of breast cancer has been established as one of the most
important risk factors for the development of breast cancer [1–3]. A reduction in breast cancer
mortality attributable to mammography among women aged 50 to 74 has been demonstrated [4–
6]. In Canada, average-risk women aged 50 to 74 are recommended to undergo screening
mammography every 2 to 3 years [7]. In Ontario, mammography is available to women aged 50
to 74 through the Ontario Breast Screening Program (OBSP), and with physician referral
through imaging facilities outside of the screening program [8]. Screening guidelines for high-
risk women, based on expert opinion, typically include annual mammography and/or MRI
starting at age 40 or 10 years prior to the earliest age of onset observed in the family, or as
young as age 25 for BRCA mutation carriers [9–15]. In 2011, the OBSP was expanded to
include annual combined MRI and mammography screening for women aged 30 to 69
considered to be at very high risk of breast cancer (i.e., BRCA1/2 mutation carriers or family
history suggestive of hereditary breast cancer) (Cancer Care Ontario, Internal Communication,
2011).
Self-reported data is often used in epidemiologic research evaluating the use of cancer
screening. The validity of self-reported mammography use has been studied extensively in
women with population-level breast cancer risk [16–18]. Overall, the validity of self-reported
data has been demonstrated [17,18]; however, it is less accurate in determining the precise
timing of screening. Women often underestimate the amount of time since their last
mammogram [17–23]. This phenomenon, known as “telescoping,” occurs when events are
reported as being more recent than when they actually occurred [24].
154
Few studies have validated self-reported mammogram data among women with familial
risk [25, 26]. These two studies have only included women with very strong familial breast
cancer histories, who likely differ in their breast cancer screening behaviors or recall of these
behaviors compared to women in the broader population with familial risk. To the authors'
knowledge, the accuracy of screening mammography recall among women with varying levels
of familial history has not previously been examined. The objectives of the present study were
to examine the accuracy of self-reported screening mammogram dates among women with
varying levels of familial breast cancer risk, determine the direction of inaccurate recall, and
examine factors associated with inaccurate recall.
2. Materials and Methods
2.1. Study Population
This study utilized data from a cohort of female relatives of incident cases of invasive
breast cancer identified from the Ontario site of the Breast Cancer Family Registry (BCFR)
funded by the United States National Cancer Institute. Details of the BCFR and the Ontario site
have been previously described [27, 28]. Briefly, cases of pathologically-confirmed invasive
breast cancer (probands), diagnosed between 1996 and 1998, were identified from the Ontario
Cancer Registry. Physicians were contacted to obtain permission to mail their patients a cancer
Family History Questionnaire (FHQ). Respondents meeting a defined set of genetic risk criteria
and a random sample (25%) of those not meeting criteria were asked to participate in the
Ontario site of the BCFR. Of the 2,587 eligible women, 1,851 (71.5%) probands participated.
Probands were then asked for permission to contact specific living relatives (first-degree, those
affected with breast, ovarian or certain other cancers, and their first-degree relatives). An
invitation letter to participate in the Ontario site of the BCFR was sent to all relatives (n = 8,
155
416), and the 5,122 who agreed to be contacted were mailed an Epidemiology Questionnaire
(EQ) from 1998 to 2004.
This prospective cohort study was conducted several years after initial recruitment of
relatives to the Ontario site of the BCFR. Baseline, year 1, and year 2 Personal History and
Screening Questionnaires (PHSQ) were administered to update changes in demographic
characteristics, cancer screening behaviors and breast outcomes. All female relatives enrolled in
the Ontario site of the BCFR, who completed an EQ and were 20 to 69 years of age and
unaffected by breast cancer at the time of the proband's diagnosis, were eligible to participate.
From the 3,374 participating female relatives, 1,514 met all study criteria. A baseline PHSQ was
sent between 2005 and 2007 to the 1,514 eligible women. Of these women, 1,114 (73.6%)
completed the baseline PHSQ. A year 1 PHSQ was sent to 1,077 eligible women approximately
one year following the baseline PHSQ and 975 (90.5%) completed it. A year 2 PHSQ was sent
to 969 eligible women and 882 (91.0%) completed it.
2.2. Validation Sample
Women who completed baseline (n = 1114), year 1 (n = 975), and year 2 (n = 882)
PHSQs and reported having a mammogram since their previous interview (n = 885 at baseline,
n = 557 at year 1, n = 544 at year 2) were eligible. Women were excluded if they had a personal
breast cancer diagnosis, they did not have a first-degree family history of breast or ovarian
cancer, they did not provide consent to release the imaging report, the imaging report was not
available from the imaging centre, or the indication for the mammogram was for nonscreening
purposes. Final sample sizes included 699 women at baseline, 469 at year 1 and 456 at year 2.
This study was approved by the Research Ethics Boards of Mount Sinai Hospital, the University
Health Network, and University of Toronto.
156
2.3. Data Collection
Information was obtained from four questionnaires. The first (EQ) was self-administered
during recruitment of female relatives to the Ontario site of the BCFR and collected detailed
information on demographics and key behavioral risk factors for breast and ovarian cancer. As
several years had elapsed since completion of the EQ, three subsequent questionnaires (baseline,
year 1, and year 2 PHSQ) of similar contents were telephone-administered to update changes in
key demographic and health behavior characteristics and collect detailed information on breast
cancer screening. Eligible participants were sent an introductory letter with a copy of the PHSQ
approximately two weeks prior to being contacted by telephone. This allowed participants to
recall dates and events and allowed reference to the questionnaire during the interview. This
method was found to result in higher response rates and more complete data than achieved by
self-administered questionnaires [29]. The questionnaire instruments have been previously
described [28, 30, 31].
2.4. Data Measures
Self-reported dates and reasons for mammograms were obtained from PHSQ interviews.
The baseline PHSQ asked women if they had a mammogram since EQ completion. The year 1
and 2 PHSQs asked women if they had a mammogram since completing the last PHSQ. Women
were asked to provide the date (month and year) or their age at last mammogram. Women were
also asked to indicate if the main reason for the last exam was for screening (part of a regular
checkup, the OBSP, or have a family history of breast cancer), or nonscreening (breast
problem/symptom, follow-up of a previous breast problem, or participation in a research study).
For women who provided consent, imaging reports were obtained from the imaging facility and
157
abstracted for: (i) imaging date (day, month, and year); (ii) indication (screening or diagnostic);
and (iii) breast imaging-reporting and data system (BI-RADS) classification [32].
Classifications of familial breast cancer risk were based on data collected by the cancer FHQ
completed by the proband, using a modified definition of previously referenced groups for
familial breast cancer risk [10, 33].Table 1 shows the criteria for classifying women as low,
moderate, or high familial risk. Age at interview was calculated as the difference in years
between date of birth and date of the interview. Descriptive analyses used categories of less than
40 years, 40 to 49 years, 50 years and above, while all models were adjusted for age as a
continuous variable. Marital status (married/common law, single), education (high-school or
less, some college, university, vocational or technical school, Bachelor's degree, or higher), and
frequency of visiting a healthcare professional in the past 2 years (once per year or less, 2 to 3
times per year, 4 or more times per year) were determined using responses from the baseline
PHSQ. Use of clinical breast examination (CBE) and BRCA1/2 genetic testing was updated at
each PHSQ and based on self-reported use since the previous interview. Perceived risk of
developing breast cancer (much below or below average, same as average, above or much above
average) was updated at each PHSQ and determined using a question adopted from Lipkus et al.
[34]. Women were asked, “compared with other women your age, how likely are you to get
breast cancer in your lifetime?” Time since last mammogram was calculated as the difference in
days between the date on the imaging report and interview date. Descriptive analyses used
categories of within 12 months and more than 12 months ago, while models were adjusted using
days since last mammogram.
158
2.5. Statistical Analysis
Distributions of sample characteristics at each PHSQ were summarized. Self-reported
screening mammogram dates and abstracted imaging dates (“gold standard”) were compared to
assess rates of agreement. Inaccurate recall was classified as overestimation or underestimation
of the time since last mammogram. The difference in months between self-reported and
abstracted mammogram dates was compared among women who inaccurately reported
mammogram dates. Multinomial logistic regression was used to estimate adjusted associations
between inaccurate recall and a number of sociodemographic, health behavior and cancer
screening characteristics. All models included familial breast cancer risk, age at interview, and
number of days since last mammogram (except for models including time since last
mammogram in categories). As women are clustered within families, robust variance estimation
was used to estimate all confidence intervals (CI) [35, 36]. All analyses were conducted using
SAS, Version 9.2 (SAS Institute Inc., 2004) and the significance of statistical tests was
evaluated using two-sided P values at a 5% testing level.
3. Results
At baseline, 42.6% of women were classified as low familial risk, while 26.2% and 31.2%
were moderate and high risk, respectively (Table 2). The majority of women were 50 years of
age or older (63.0%), while 31.3% were aged 40 to 49 and 5.7% were under the age of 40.
Almost all women (97.7%) reported a CBE but had not undergone genetic testing (82.9%) since
completion of the EQ. Most women (61.5%) perceived their lifetime breast cancer risk to be
higher than average. Since completion of the EQ, 34.3% reported a mammogram within the
previous 6 months, 33.1% reported a mammogram 7 to 12 months prior, and 32.6% reported
159
that their last mammogram was more than 12 months prior. Distributions of sociodemographic
and health behavior characteristics were similar at years 1 and 2.
Most women were able to report the month and year (73.8% at baseline, 88.7% at year 1,
and 93.0% at year 2) of their last mammogram, while 24.2% at baseline, 11.1% at year 1 and
6.6% at year 2 were only to report the year or their age (Table 3). Among women who reported
the month and year, the majority were accurate, though rates of accuracy were higher at year 1
(78.9%) and year 2 (80.4%) than at baseline (61.8%), as the recall period at baseline (time
between completing the EQ and PHSQ) was longer (5 to 7 years). Among women who
inaccurately recalled the date of their last mammogram, proportions of women who
underestimated and overestimated this time interval were approximately equal at baseline and
year 1, but more women overestimated at year 2. Women who underestimated this interval did
so by a longer amount of time at baseline and year 2, compared with women who overestimated
(5.48 months versus 3.54 months at baseline, 2.35 months versus 1.56 months at year 2). This
difference was statistically significant at baseline (P = 0.036).
At baseline, women with low familial risk were more likely to overestimate the time since
last mammography compared to high-risk women (OR = 1.77; 95% CI: 1.00, 3.13). Women
who reported an average of 1 or fewer visits to a health professional per year were almost twice
as likely to overestimate the time since last mammogram (OR = 1.97; 95% CI: 1.15, 3.39)
compared to women with 2 to 3 visits per year, as were women who perceived their breast
cancer risk to be below or the same as average (OR = 1.90; 95% CI: 1.15, 3.15) (Table 5).
Women who had mammograms more than 12 months prior were more than five times as likely
to underestimate the time since last mammogram (OR = 5.22; 95% CI: 3.10, 8.80). At year 1
and year 2, only time since last mammogram remained statistically significant following
adjustment (results not shown).
160
4. Discussion
Our study presents some of the first evidence of the accuracy of self-reported screening
mammography use among women with varying levels of familial risk. We found that self-
reported screening mammogram use within a 12-month period is highly accurate (over 95%).
Additionally, 62% of women at baseline, 79% at year 1, and 80% at year 2 accurately reported
the exact timing (month and year) of their last screening mammogram. While we did not find
systematic evidence of telescoping, we found that the difference in months between self-
reported and abstracted dates was significantly larger in women who telescoped the date at
baseline. Fewer visits to a health professional per year, lower perceived breast cancer risk, and
having a mammogram more than 12 months prior were significantly associated with inaccurate
recall, while the association between inaccurate recall and level of familial risk approached
significance.
The high rates of recall accuracy we observed differ from previous studies, most of which
focused on women in the general population. For example, two studies [21, 37] reported that
approximately 70% of women who reported undergoing mammography in the past year had
actually done so. Lower levels (48%) of recall accuracy for mammogram use in the previous
year among low-income minority populations have also been reported [38, 39]. Our finding was
not unanticipated, as women with heightened risk are likely to be more conscious of their
screening behaviors than women in the general population. Accordingly, Larouche et al. [26],
who examined recall among a population of women with high familial breast cancer risk, found
corresponding administrative records for 85% of women who reported a mammogram in the 12
months following genetic testing.
161
Telescoping has been one of the most consistent findings of previous studies [17–23]. Pijpe
et al. [25], who examined the validity of self-reported lifetime mammogram histories among
BRCA1/2 mutation carriers, found that women underestimated the time since last mammogram.
While telescoping was minimal in our study, we did find that women who underestimated the
time since their last screening mammogram did so by a significantly longer period of time
compared with women who overestimated this interval.
Studies which have previously examined predictors of mammogram recall have reported
inconsistent results, likely due to differences in study populations and definitions of accurate
recall. When examining predictors of recall, most previous studies have not further classified
inaccurate recall as overestimation or underestimation of the time since last mammogram. Pijpe
et al. [25], who did, examined recall among BRCA1/2 mutation carriers and similarly found that
a longer recall period was associated with greater likelihood of underestimating time since last
mammogram. While our results at years 1 and 2 are similar to those observed by Pijpe et al.
[25], we also found that the odds of overestimating the time since last mammogram were
approximately twofold higher for women who reported fewer visits to a health professional and
had a lower perceived breast cancer risk at baseline. Two studies similarly found that women
with higher perceived risk more accurately report their mammogram use; however, these
relationships were not statistically significant [20, 26]. We found that women with a lower
familial risk were more likely to overestimate the time since last mammogram. While no studies
have previously evaluated mammogram recall by gradients of risk, two studies have
demonstrated that women with a first-degree familial breast cancer history are more likely to
accurately recall their mammogram use compared to women without a family history [20, 40].
Our study is unique in that it is one of the first to examine the accuracy of self-reported
mammography data among a population of women with a range of family histories of breast
162
cancer. The population-based recruitment, large sample size, longer follow-up period, and
exclusion of diagnostic mammograms are also notable strengths. This study has several
limitations. Due to the challenge of verifying reports from multiple service providers, this study
was not designed to assess recall among women who reported nonuse of mammography.
Previous evidence suggests women are unlikely to falsely report the nonuse of mammography
[20, 22, 23]. In a small number of cases where women reported a mammogram, imaging centres
could not provide a report. As it was not possible to distinguish reports missing because the
woman did not have a mammogram, from reports missing because the respondent incorrectly
recalled the screening facility, these participants were excluded (n = 3 at baseline, n = 22 at year
1, n = 16 at year 2). As women were mailed a copy of the questionnaire approximately two
weeks before being contacted by study staff, they could have checked their personal records or
otherwise verified the date of their last mammogram prior to completing the questionnaire. This
may have inflated rates of recall accuracy. Finally, it should be noted that the accuracy of recall
may differ in populations with different breast cancer screening recommendations and systems
of healthcare.
Self-reported mammography use data is widely relied upon in epidemiologic research for
measuring adherence to breast cancer screening guidelines. Overall, our study found women
with familial breast cancer risk to be extremely accurate reporters of their mammogram use
within 12 months and reasonably reliable reporters of the exact timing of their mammogram
attendance. Recall was poorer among women with low familial breast cancer risk and lower
perceived breast cancer risk, and when asked to recall screening episodes more than one year
prior. Where possible, strategies demonstrated to improve the accuracy of self-reported data
should be employed by researchers [16]. Women who cannot recall the timing of their
mammograms continue to present a challenge to clinicians with regard to medical management,

163
researchers, and to breast cancer surveillance efforts. Caution must be exercised when relying
exclusively on self-reported data for the purposes of medical decision making and reporting of
surveillance statistics.
Conflicts of interest: The authors declare that there are no conflicts of interest.
Acknowledgements: This work was supported by the Canadian Breast Cancer Foundation,
Ontario Region. This work was also supported by the Canadian Breast Cancer Research
Alliance (Grant 016270) and Grant UM1 CA164920 from the National Cancer Institute. The
content of this paper does not necessarily reflect the views or policies of the National Cancer
Institute or any of the collaborating centers in the Breast Cancer Family Registry (BCFR), nor
does mention of trade names, commercial products, or organizations imply endorsement by the
US Government or the BCFR. The authors also thank the study staff and participants of the
Ontario site of the Breast Cancer Family Registry.
164
References
1. Collaborative Group on Hormonal Factors in Breast Cancer. Familial breast cancer:
collaborative reanalysis of individual data from 52 epidemiological studies including 58 209
women with breast cancer and 101 986 women without the disease. Lancet.
2001;358(9291):1389–1399.
2. Pharoah PD, Day NE, Duffy S, Easton DF, Ponder BA. Family history and the risk of breast
cancer: a systematic review and meta-analysis. International Journal of Cancer.
1997;71(5):800–809.
3. Bevier M, Sundquist K, Hemminki K. Risk of breast cancer in families of multiple affected
women and men. Breast Cancer Research and Treatment. 2012;132(2):723–728.
4. Humphrey LL, Helfand M, Chan BKS, Woolf SH. Breast cancer screening: a summary of the
evidence for the U.S. Preventive Services Task Force. Annals of Internal Medicine. 2002;137(5,
part 1):347–360.
5. Nelson HD, Tyne K, Naik A, Bougatsos C, Chan BK, Humphrey L. Screening for breast
cancer: an update for the U.S. Preventive Services Task Force. Annals of Internal Medicine.
2009;151(10):727–737.
6. Kerlikowske K, Grady D, Rubin SM, Sandrock C, Ernster VL. Efficacy of screening
mammography: a meta-analysis. Journal of the American Medical Association.
1995;273(2):149–154.
7. Canadian Task Force on Preventive Health Care, Tonelli M, Connor Gorber S, et al.
Recommendations on screening for breast cancer in average-risk women aged 40–74 years.
Canadian Medical Association Journal. 2011;183(17):1991–2001.
8. Chiarelli AM, Halapy E, Nadalin V, Shumak R, O’Malley F, Mai V. Performance measures
from 10 years of breast screening in the Ontario Breast Screening Program, 1990/91 to 2000.
European Journal of Cancer Prevention. 2006;15(1):34–42.
9. Evans DGR, Lalloo F. Risk assessment and management of high risk familial breast cancer.
Journal of Medical Genetics. 2002;39(12):865–871.
10. Eccles DM, Evans DGR, Mackay J. Guidelines for a genetic risk based approach to advising
women with a family history of breast cancer. Journal of Medical Genetics. 2000;37(3):203–
209.
11. Eisinger F, Alby N, Bremond A, et al. Recommendations for medical management of
hereditary breast and ovarian cancer: the French National Ad Hoc Committee. Annals of
Oncology. 1998;9(9):939–950.
12. Møller P, Evans G, Haites N, et al. Guidelines for follow-up of women at high risk for
inherited breast cancer: consensus statement from the Biomed 2 Demonstration Programme on
inherited breast cancer. Disease Markers. 1999;15(1–3):207–211.
165
13. Warner E, Heisey RE, Goel V, Carroll JC, McCready DR. Hereditary breast cancer: risk
assessment of patients with a family history of breast cancer. Canadian Family Physician.
1999;45:104–112.
14. Chart PL, Franssen E. Management of women at increased risk for breast cancer:
preliminary results from a new program. Canadian Medical Association Journal.
1997;157(9):1235–1242.
15. Horsman D, Wilson BJ, Avard D, et al. Clinical management recommendations for
surveillance and risk-reduction strategies for hereditary breast and ovarian cancer among
individuals carrying a deleterious BRCA1 or BRCA2 mutation. Journal of Obstetrics and
Gynaecology Canada. 2007;29(1):45–60.
16. Newell SA, Girgis A, Sanson-Fisher RW, Savolainen NJ. The accuracy of self-reported
health behaviors and risk factors relating to cancer and cardiovascular disease in the general
population: a critical review. American Journal of Preventive Medicine. 1999;17(3):211–229.
17. Rauscher GH, Johnson TP, Young IC, Walk JA. Accuracy of self-reported cancer-screening
histories: a meta-analysis. Cancer Epidemiology Biomarkers and Prevention. 2008;17(4):748–
757.
18. Howard M, Agarwal G, Lytwyn A. Accuracy of self-reports of Pap and mammography
screening compared to medical record: a meta-analysis. Cancer Causes and Control.
2009;20(1):1–13.57.
19. Paskett ED, Tatum CM, Mack DW, Hoen H, Case LD, Velez R. Validation of self-reported
breast and cervical cancer screening tests among low-income minority women. Cancer
Epidemiology Biomarkers and Prevention. 1996;5(9):721–726.
20. Caplan LS, Mandelson MT, Anderson LA. Validity of self-reported mammography:
examining recall and covariates among older women in a health maintenance organization.
American Journal of Epidemiology. 2003;157(3):267–272.
21. McGovern PG, Lurie N, Margolis KL, Slater JS. Accuracy of self-report of mammography
and Pap smear in a low-income urban population. American Journal of Preventive Medicine.
1998;14(3):201–208.
22. Gordon NP, Hiatt RA, Lampert DI. Concordance of self-reported data and medical record
audit for six cancer screening procedures. Journal of the National Cancer Institute.
1993;85(7):566–570.
23. Degnan D, Harris R, Ranney J, Quade D, Earp JA, Gonzalez J. Measuring the use of
mammography: two methods compared. American Journal of Public Health.
1992;82(10):1386–1388.
24. Sudman S, Bradburn NM. Effects of time and memory factors on response in surveys.
Journal of the American Statistical Association. 1973;68(344):805–815.
166
25. Pijpe A, Mulder RL, Manders P, van Leeuwen FE, Rookus MA. Validation study suggested
no differential misclassification of self-reported mammography history in BRCA1/2 mutation
carriers. Journal of Clinical Epidemiology. 2011;64(12):1434–1443.
26. Larouche G, Bouchard K, Chiquette J, Desbiens C, Simard J, Dorval M. Self-reported
mammography use following BRCA1/2 genetic testing may be overestimated. Familial Cancer.
2012;11(1):27–32.
27. Knight JA, Sutherland HJ, Glendon G, Boyd NF, Andrulis IL. Characteristics associated
with participation at various stages at the Ontario site of the Cooperative Family Registry for
Breast Cancer Studies. Annals of Epidemiology. 2002;12(1):27–33.
28. John EM, Hopper JL, Beck JC, et al. The Breast Cancer Family Registry: an infrastructure
for cooperative multinational, interdisciplinary and translational studies of the genetic
epidemiology of breast cancer. Breast Cancer Research. 2004;6(4):R375–389.
29. Chiarelli AM, Marrett LD, Darlington GA. Pregnancy outcomes in females after treatment
for childhood cancer. Epidemiology. 2000;11(2):161–166.
30. Zhang LR, Chiarelli AM, Glendon G, et al. Influence of perceived breast cancer risk on
screening behaviors of female relatives from the Ontario site of the Breast Cancer Family
Registry. European Journal of Cancer Prevention. 2011;20(4):255–262.
31. Campitelli MA, Chiarelli AM, Mirea L, et al. Adherence to breast and ovarian cancer
screening recommendations for female relatives from the Ontario site of the Breast Cancer
Family Registry. European Journal of Cancer Prevention. 2011;20(6):492–500.
32. Balleyguier C, Ayadi S, van Nguyen K, Vanel D, Dromain C, Sigal R. BIRADS
classification in mammography. European Journal of Radiology. 2007;61(2):192–194.
33. Cortesi L, Turchetti D, Marchi I, et al. Breast cancer screening in women at increased risk
according to different family histories: an update of the Modena Study Group experience. BMC
Cancer. 2006;6(article 210).
34. Lipkus IM, Rimer BK, Strigo TS. Relationships among objective and subjective risk for
breast cancer and mammography stages of change. Cancer Epidemiology Biomarkers and
Prevention. 1996;5(12):1005–1011.
35. Binder DA. On the variances of asymptotically normal estimators from complex surveys.
International Statistical Review. 1983;51:279–292.
36. Morel JG. Logistic regression under complex survey designs. Survey Methodol.
1989;15:203–223.
37. Armstrong K, Long JA, Shea JA. Measuring adherence to mammography screening
recommendations among low-income women. Preventive Medicine. 2004;38(6):754–760.

167
38. Champion VL, Menon U, McQuillen DH, Scott C. Validity of self-reported mammography
in low-income African-American women. American Journal of Preventive Medicine.
1998;14(2):111–117.
39. Suarez L, Goldman DA, Weiss NS. Validity of Pap smear and mammogram self-reports in a
low-income Hispanic population. American Journal of Preventive Medicine. 1995;11(2):94–98.
40. Baron-Epel O, Friedman N, Lernau O. Validity of self-reported mammography in a
multicultural population in Israel. Preventive Medicine. 2008;46(6):489–491.
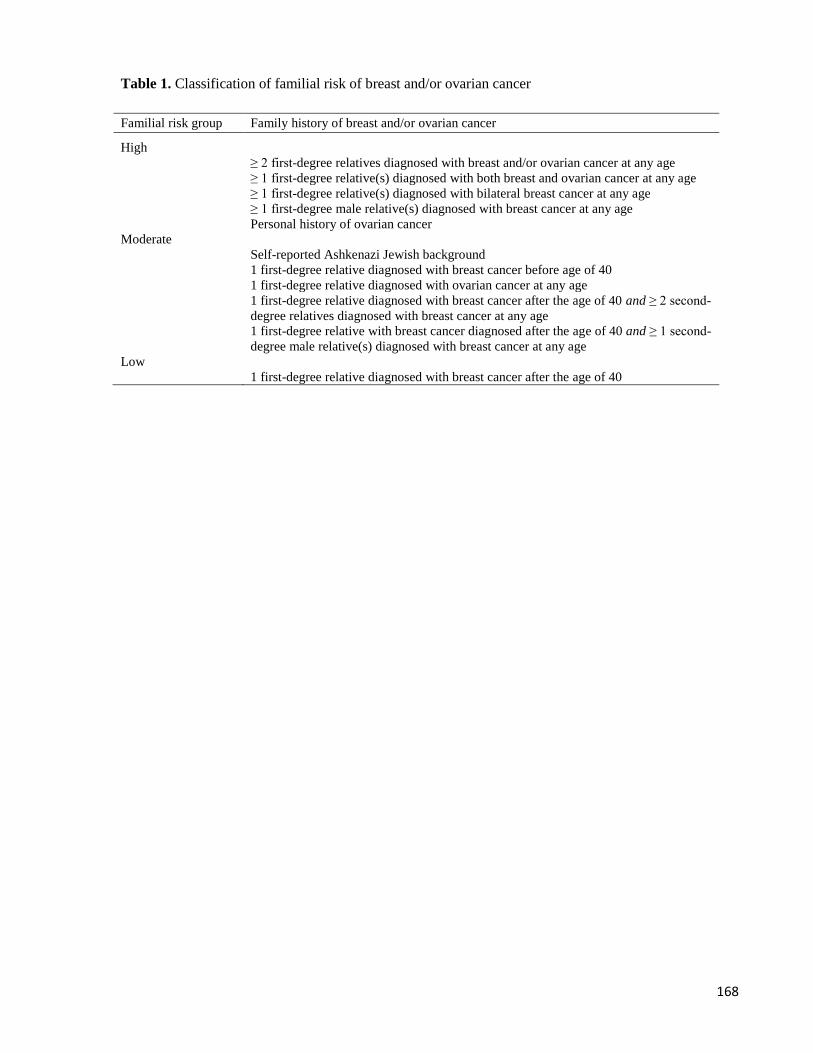
168
Table 1. Classification of familial risk of breast and/or ovarian cancer
Familial risk group Family history of breast and/or ovarian cancer
High
≥ 2 first-degree relatives diagnosed with breast and/or ovarian cancer at any age
≥ 1 first-degree relative(s) diagnosed with both breast and ovarian cancer at any age
≥ 1 first-degree relative(s) diagnosed with bilateral breast cancer at any age
≥ 1 first-degree male relative(s) diagnosed with breast cancer at any age
Personal history of ovarian cancer
Moderate
Self-reported Ashkenazi Jewish background
1 first-degree relative diagnosed with breast cancer before age of 40
1 first-degree relative diagnosed with ovarian cancer at any age
1 first-degree relative diagnosed with breast cancer after the age of 40 and ≥ 2 second-
degree relatives diagnosed with breast cancer at any age
1 first-degree relative with breast cancer diagnosed after the age of 40 and ≥ 1 second-
degree male relative(s) diagnosed with breast cancer at any age
Low
1 first-degree relative diagnosed with breast cancer after the age of 40
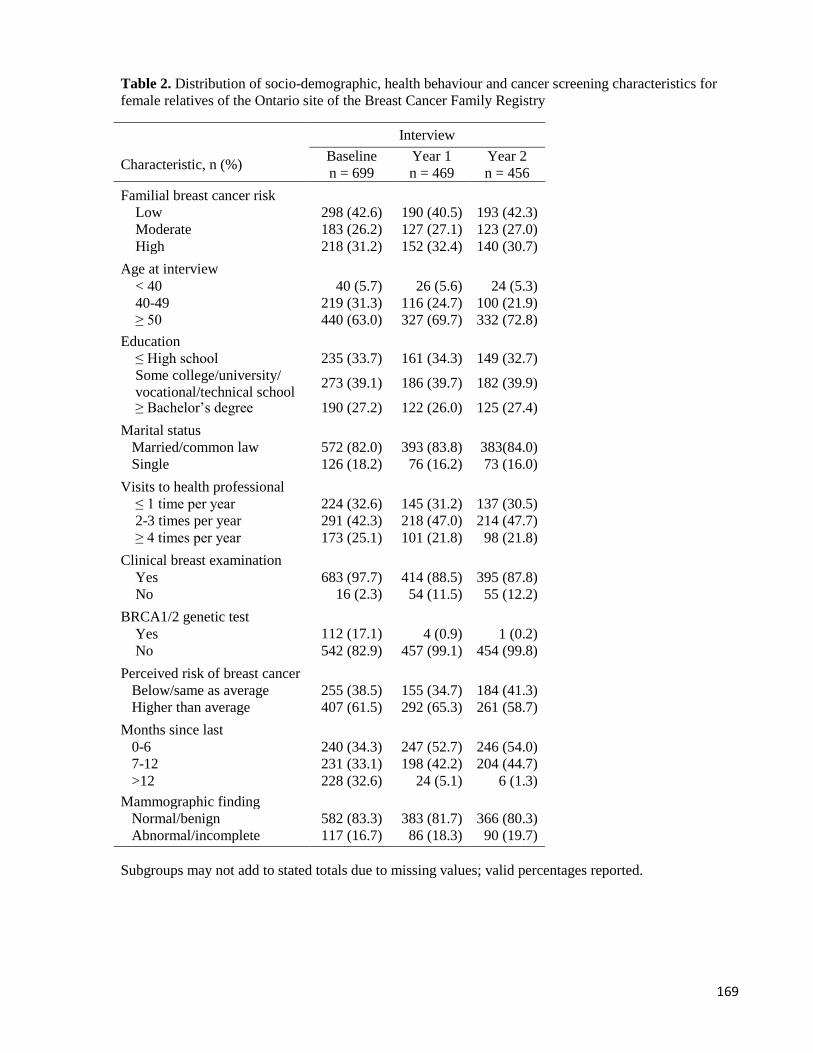
169
Table 2. Distribution of socio-demographic, health behaviour and cancer screening characteristics for
female relatives of the Ontario site of the Breast Cancer Family Registry
Subgroups may not add to stated totals due to missing values; valid percentages reported.
Interview
Characteristic, n (%) Baseline
n = 699
Year 1
n = 469
Year 2
n = 456
Familial breast cancer risk
Low 298 (42.6) 190 (40.5) 193 (42.3)
Moderate 183 (26.2) 127 (27.1) 123 (27.0)
High 218 (31.2) 152 (32.4) 140 (30.7)
Age at interview
< 40 40 (5.7) 26 (5.6) 24 (5.3)
40-49 219 (31.3) 116 (24.7) 100 (21.9)
≥ 50 440 (63.0) 327 (69.7) 332 (72.8)
Education
≤ High school 235 (33.7) 161 (34.3) 149 (32.7)
Some college/university/
vocational/technical school 273 (39.1) 186 (39.7) 182 (39.9)
≥ Bachelor’s degree 190 (27.2) 122 (26.0) 125 (27.4)
Marital status
Married/common law 572 (82.0) 393 (83.8) 383(84.0)
Single 126 (18.2) 76 (16.2) 73 (16.0)
Visits to health professional
≤ 1 time per year 224 (32.6) 145 (31.2) 137 (30.5)
2-3 times per year 291 (42.3) 218 (47.0) 214 (47.7)
≥ 4 times per year 173 (25.1) 101 (21.8) 98 (21.8)
Clinical breast examination
Yes 683 (97.7) 414 (88.5) 395 (87.8)
No 16 (2.3) 54 (11.5) 55 (12.2)
BRCA1/2 genetic test
Yes 112 (17.1) 4 (0.9) 1 (0.2)
No 542 (82.9) 457 (99.1) 454 (99.8)
Perceived risk of breast cancer
Below/same as average 255 (38.5) 155 (34.7) 184 (41.3)
Higher than average 407 (61.5) 292 (65.3) 261 (58.7)
Months since last
mammogram 0-6 240 (34.3) 247 (52.7) 246 (54.0)
7-12 231 (33.1) 198 (42.2) 204 (44.7)
>12 228 (32.6) 24 (5.1) 6 (1.3)
Mammographic finding
Normal/benign 582 (83.3) 383 (81.7) 366 (80.3)
Abnormal/incomplete 117 (16.7) 86 (18.3) 90 (19.7)
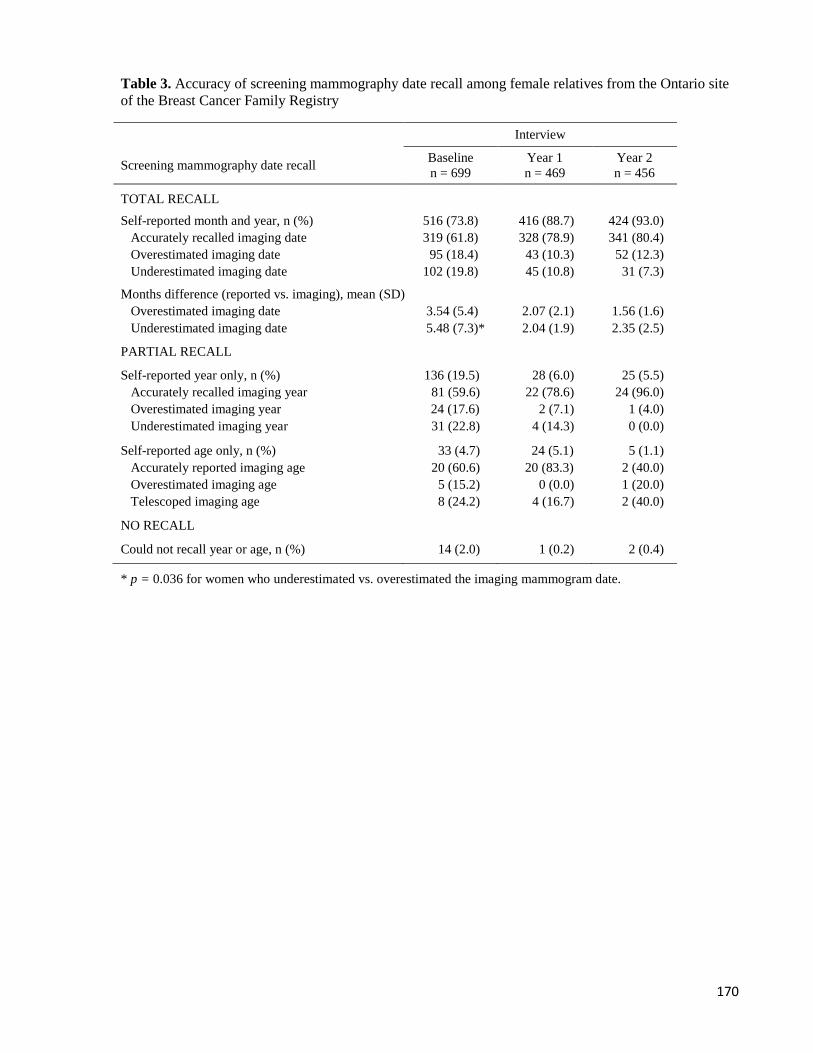
170
Table 3. Accuracy of screening mammography date recall among female relatives from the Ontario site
of the Breast Cancer Family Registry
Interview
Screening mammography date recall Baseline
n = 699
Year 1
n = 469
Year 2
n = 456
TOTAL RECALL
Self-reported month and year, n (%) 516 (73.8) 416 (88.7) 424 (93.0)
Accurately recalled imaging date 319 (61.8) 328 (78.9) 341 (80.4)
Overestimated imaging date 95 (18.4) 43 (10.3) 52 (12.3)
Underestimated imaging date 102 (19.8) 45 (10.8) 31 (7.3)
Months difference (reported vs. imaging), mean (SD)
Overestimated imaging date 3.54 (5.4) 2.07 (2.1) 1.56 (1.6)
Underestimated imaging date 5.48 (7.3)* 2.04 (1.9) 2.35 (2.5)
PARTIAL RECALL
Self-reported year only, n (%) 136 (19.5) 28 (6.0) 25 (5.5)
Accurately recalled imaging year 81 (59.6) 22 (78.6) 24 (96.0)
Overestimated imaging year 24 (17.6) 2 (7.1) 1 (4.0)
Underestimated imaging year 31 (22.8) 4 (14.3) 0 (0.0)
Self-reported age only, n (%) 33 (4.7) 24 (5.1) 5 (1.1)
Accurately reported imaging age 20 (60.6) 20 (83.3) 2 (40.0)
Overestimated imaging age 5 (15.2) 0 (0.0) 1 (20.0)
Telescoped imaging age 8 (24.2) 4 (16.7) 2 (40.0)
NO RECALL
Could not recall year or age, n (%) 14 (2.0) 1 (0.2) 2 (0.4)
* p = 0.036 for women who underestimated vs. overestimated the imaging mammogram date.
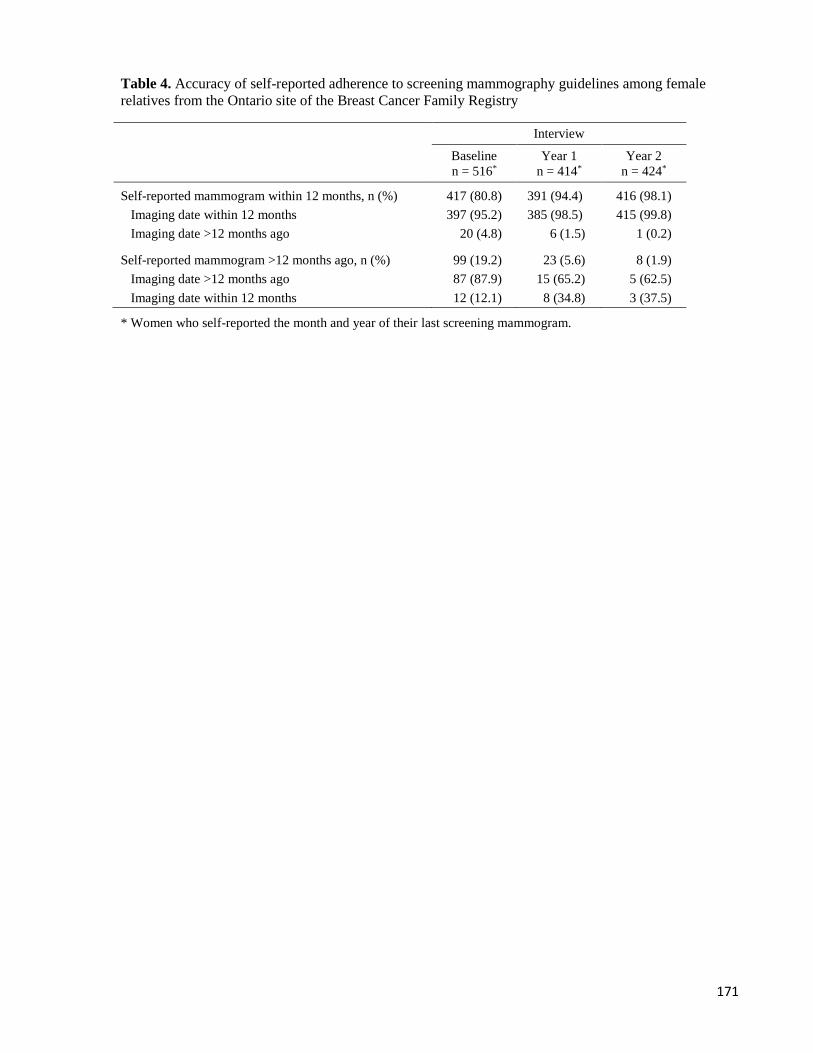
171
Table 4. Accuracy of self-reported adherence to screening mammography guidelines among female
relatives from the Ontario site of the Breast Cancer Family Registry
Interview
Baseline
n = 516*
Year 1
n = 414*
Year 2
n = 424*
Self-reported mammogram within 12 months, n (%) 417 (80.8) 391 (94.4) 416 (98.1)
Imaging date within 12 months 397 (95.2) 385 (98.5) 415 (99.8)
Imaging date >12 months ago 20 (4.8) 6 (1.5) 1 (0.2)
Self-reported mammogram >12 months ago, n (%) 99 (19.2) 23 (5.6) 8 (1.9)
Imaging date >12 months ago 87 (87.9) 15 (65.2) 5 (62.5)
Imaging date within 12 months 12 (12.1) 8 (34.8) 3 (37.5)
* Women who self-reported the month and year of their last screening mammogram.
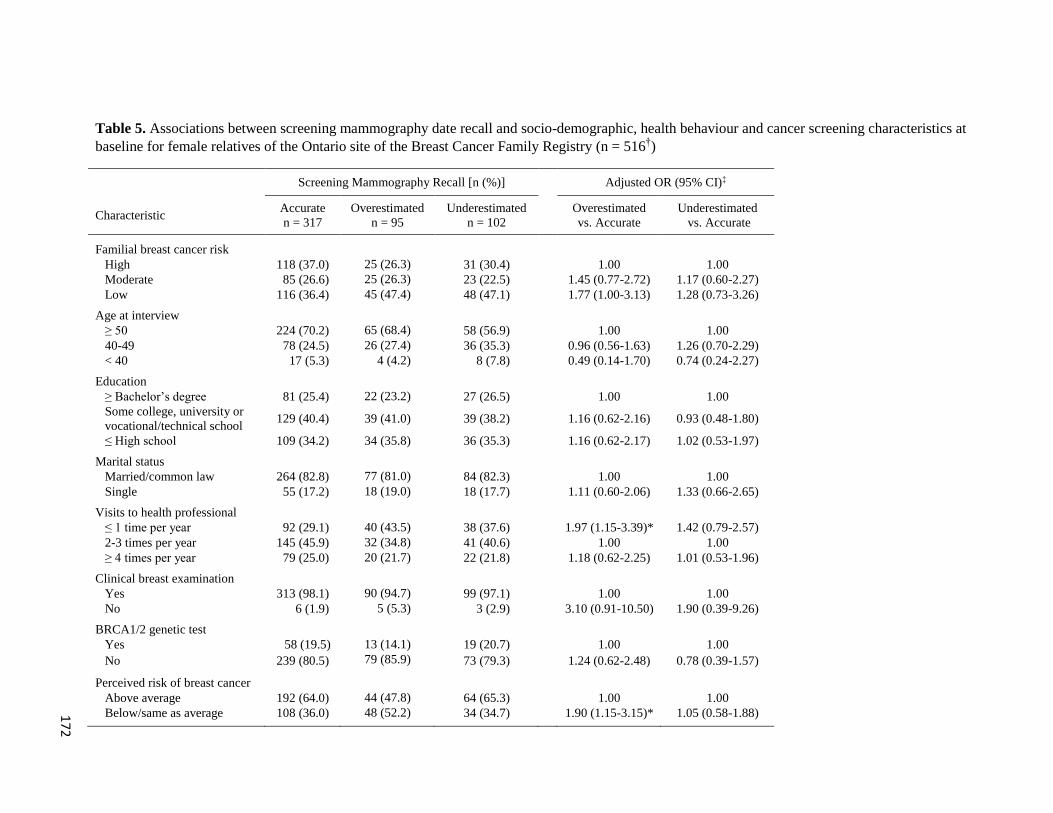
17
2
Table 5. Associations between screening mammography date recall and socio-demographic, health behaviour and cancer screening characteristics at
baseline for female relatives of the Ontario site of the Breast Cancer Family Registry (n = 516†)
Screening Mammography Recall [n (%)] Adjusted OR (95% CI)‡
Characteristic Accurate
n = 317
Overestimated
n = 95
Underestimated
n = 102
Overestimated
vs. Accurate
Underestimated
vs. Accurate
Familial breast cancer risk
High 118 (37.0) 25 (26.3) 31 (30.4) 1.00 1.00
Moderate 85 (26.6) 25 (26.3) 23 (22.5) 1.45 (0.77-2.72) 1.17 (0.60-2.27)
Low 116 (36.4) 45 (47.4) 48 (47.1) 1.77 (1.00-3.13) 1.28 (0.73-3.26)
Age at interview
≥ 50 224 (70.2) 65 (68.4) 58 (56.9) 1.00 1.00
40-49 78 (24.5) 26 (27.4) 36 (35.3) 0.96 (0.56-1.63) 1.26 (0.70-2.29)
< 40 17 (5.3) 4 (4.2) 8 (7.8) 0.49 (0.14-1.70) 0.74 (0.24-2.27)
Education
≥ Bachelor’s degree 81 (25.4) 22 (23.2) 27 (26.5) 1.00 1.00
Some college, university or
vocational/technical school 129 (40.4) 39 (41.0) 39 (38.2) 1.16 (0.62-2.16) 0.93 (0.48-1.80)
≤ High school 109 (34.2) 34 (35.8) 36 (35.3) 1.16 (0.62-2.17) 1.02 (0.53-1.97)
Marital status
Married/common law 264 (82.8) 77 (81.0) 84 (82.3) 1.00 1.00
Single 55 (17.2) 18 (19.0) 18 (17.7) 1.11 (0.60-2.06) 1.33 (0.66-2.65)
Visits to health professional
≤ 1 time per year 92 (29.1) 40 (43.5) 38 (37.6) 1.97 (1.15-3.39)* 1.42 (0.79-2.57)
2-3 times per year 145 (45.9) 32 (34.8) 41 (40.6) 1.00 1.00
≥ 4 times per year 79 (25.0) 20 (21.7) 22 (21.8) 1.18 (0.62-2.25) 1.01 (0.53-1.96)
Clinical breast examination
Yes 313 (98.1) 90 (94.7) 99 (97.1) 1.00 1.00
No 6 (1.9) 5 (5.3) 3 (2.9) 3.10 (0.91-10.50) 1.90 (0.39-9.26)
BRCA1/2 genetic test
Yes 58 (19.5) 13 (14.1) 19 (20.7) 1.00 1.00
No 239 (80.5) 79 (85.9) 73 (79.3) 1.24 (0.62-2.48) 0.78 (0.39-1.57)
Perceived risk of breast cancer
Above average 192 (64.0) 44 (47.8) 64 (65.3) 1.00 1.00
Below/same as average 108 (36.0) 48 (52.2) 34 (34.7) 1.90 (1.15-3.15)* 1.05 (0.58-1.88)
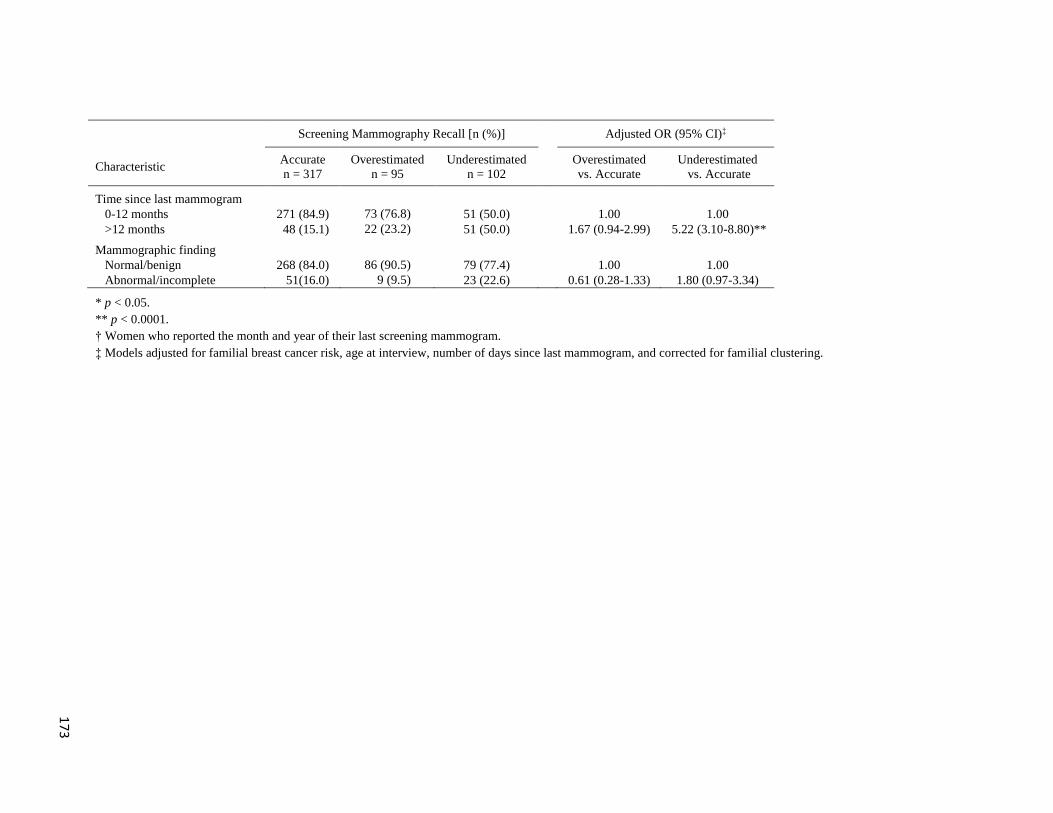
17
3
Screening Mammography Recall [n (%)] Adjusted OR (95% CI)‡
Characteristic Accurate
n = 317
Overestimated
n = 95
Underestimated
n = 102
Overestimated
vs. Accurate
Underestimated
vs. Accurate
Time since last mammogram
0-12 months 271 (84.9) 73 (76.8) 51 (50.0) 1.00 1.00
>12 months 48 (15.1) 22 (23.2) 51 (50.0) 1.67 (0.94-2.99) 5.22 (3.10-8.80)**
Mammographic finding
Normal/benign 268 (84.0) 86 (90.5) 79 (77.4) 1.00 1.00
Abnormal/incomplete 51(16.0) 9 (9.5) 23 (22.6) 0.61 (0.28-1.33) 1.80 (0.97-3.34)
* p < 0.05.
** p < 0.0001.
† Women who reported the month and year of their last screening mammogram.
‡ Models adjusted for familial breast cancer risk, age at interview, number of days since last mammogram, and corrected for familial clustering.
174
Chapter 5 Discussion and Conclusions
This chapter adds to the discussion section of each manuscript contained in Chapters 3
and 4, by providing a summary of main results, a detailed discussion of methodological issues,
clinical implications and contribution to the fields of public health and epidemiology, and
suggestions for future research. For detailed discussion of findings for Objective 1 (impact of
mammography screening and familial risk on breast outcomes) see Manuscript 2 in Chapter 4,
Section 4.2. For detailed discussion of findings for Objective 2 (relationship between perceived
risk and breast cancer screening use) see Manuscript 1 in Chapter 2, Section 2.3.4 and
Manuscript 3 in Chapter 4, Section 4.3. For detailed discussion of Objective 3 (validity of self-
reported screening mammogram data) see Manuscript 4 in Chapter 4, Section 4.4.
5.1 Summary of Key Findings
Study Cohort
This prospective, population-based cohort study followed 1114 women with a family
history of breast and/or ovarian cancer from the Ontario site of the Breast Cancer Family
Registry over two years. Data on breast cancer risk factors, breast outcomes, and breast cancer
screening behaviours were collected by telephone-administered questionnaires, and abstracted
from surgical, pathology, and imaging reports. The 1114 women in the FHS were from 677
unique families, and ranged in age from 25 to 73 years over the study period. Nearly half
(48.7%) of the women in the cohort were classified as low familial risk, while 23.5% and 27.8%
were classified as moderate and high familial risk, respectively. Over the study period, 38 cases
of pathologically-confirmed breast cancer with an invasive component developed in 37 unique
175
families (two cases in one family), 6 cases of pathologically-confirmed DCIS developed in 6
unique families, and 56 cases of pathologically-confirmed BBD developed in 54 unique families
(two families with two cases each).
Manuscript 2
This study found that women with high familial risk are nearly three times more likely to
be diagnosed with invasive breast cancer compared with women with low/moderate familial
risk. These findings are in line with the results of two previous meta-analyses (Collaborative
Group on Hormonal Factors in Breast Cancer, 2001; Pharoah et al., 1997). Women with high
familial risk were nearly twice as likely to be diagnosed with BBD compared to women at
low/moderate familial risk, and the association was more pronounced in women below age 50
years. To our knowledge, ours is the first study to examine diagnoses of BBD by gradients of
familial risk.
Significant associations between level of familial risk and prognostic features of cases of
invasive breast cancer or benign breast disease were not detected. While differences were not
statistically significant, women with high familial risk had proportionally fewer tumors that
were larger than 15mm, diagnosed at stage II or above, histologic grade III, or demonstrated
lymphovascular invasion compared to women with low/moderate familial risk, after adjusting
for age. Tumors among unscreened women were significantly larger, and diagnosed at a later
stage compared to screen-detected tumors, irrespective of level of familial risk. A similar trend
was observed with the other prognostic features examined; tumors in unscreened women were
more often node-positive, had a higher histologic grade, had a higher mitotic activity index,
demonstrated lymphovascular invasion, and were ER- and PR-, however these differences were
not statistically significant. Similar to our results, several studies in women with average risk of
176
breast cancer have found screen-detected invasive breast cancers are significantly smaller in size
(Nagtegaal & Duffy et al., 2013; Chiarelli et al., 2012; Burke et al., 2008; Clayforth et al., 2005;
Dillon et al., 2004), node-negative (Nagtegaal & Duffy et al., 2013; Chiarelli et al., 2012; Burke
et al., 2008; Dillon et al., 2004), diagnosed at an earlier stage (Nagtegaal & Duffy et al., 2013;
Chiarelli et al., 2012), and lower grade (Chiarelli et al., 2012; Burke et al., 2008; Clayforth et al.,
2005; Dillon et al., 2004), compared with symptomatic cancers.
Manuscripts 1 and 3
The relationship between perceived risk of breast cancer and breast cancer screening in
women with familial risk has been widely studied, but never reviewed. Findings of our
systematic review suggest there is a weak positive relationship between higher levels of
perceived risk and adherence to mammography screening guidelines in women with a family
history of breast and/or ovarian cancer. Consistent associations were not observed for CBE or
BSE. Our review identified a number of important limitations, including the lack of consistency
in measurement of perceived risk, limited generalizability, and the lack of prospective research.
In our prospective study, perceived risk did not predict use of breast cancer screening or
genetic testing in the overall cohort. Two previous meta-analyses in women at average-risk
suggest there is a small but significant positive relationship between perceived risk and
mammogram use (Katapodi et al., 2004; McCaul et al., 1996). In contrast to our study, many of
these studies were cross-sectional and measured ever-use of mammography. The results of this
study suggest the findings of previous cross-sectional studies may be explained by temporal
bias. We observed some evidence which suggests the relationship between perceived risk and
breast cancer screening use may be modified by level of familial risk. Among women at low
familial risk, women who perceived their risk as greater than 50% were non-significantly more
177
likely to have a mammogram, CBE or genetic test compared with women who perceived their
risk as 50%. In women at moderate/high familial risk, women who perceived their risk as
greater than 50% were non-significantly less likely to have a mammogram and genetic test, and
significantly less likely to have a CBE compared to women who perceived their risk as 50%.
Manuscript 4
To our knowledge, ours is the first study to examine the accuracy of self-reported
mammogram use in women with varying levels of familial risk. Our validation study found that
over 95% of women accurately reported their screening mammogram use in the previous 12
months. Over 70% of women were able to provide the month and year of their examination.
These high rates of recall accuracy differ from the rates observed in studies of women at
average-risk of breast cancer; two studies reported that only 70% of women who reported a
mammogram in the last 12 months had actually had a mammogram (McGovern et al., 1998;
Armstrong et al., 2004), and lower rates have also been reported (Champion et al., 1998; Suarez
et al., 1995). We found that the proportions of women who overestimated and underestimated
the time since their last mammogram were approximately equal. These findings also contrast
with findings from studies conducted in average-risk women, which have consistently found
that women underestimate the time since their last mammogram (Rauscher et al., 2008; Howard
et al., 2009). Recall was significantly poorer in women with low familial breast cancer risk,
lower perceived risk, those who visited health care professionals less frequently, and when the
screening episode occurred more than 12 months prior.
178
5.2 Limitations and Methodological Issues
5.2.1 Selection Bias
Subjects who participate in research often differ from those who do not on important
socio-demographic, lifestyle and medical characteristics (Gordis, 2014; Elwood, 2007), which
may be related to the exposure and outcome of interest. Selection bias occurs when individuals
have different probabilities of being selected for or participating in a study, and those
probabilities are dependent on both the exposure and outcome (Szklo & Nieto, 2007).
One method of reducing potential selection bias is ensuring nonresponse and attrition is
minimal. Numerous methods for obtaining high response rates have been developed and proven
effective (Dillman et al., 2008). The women identified as eligible for the FHS were motivated to
participate; they were all members of the Ontario site of the BCFR, had given permission to be
contacted for related research, and due to their family history of cancer likely had a vested
interest in participating in research on this topic. Several methods described by Dillman et al.
(2008) were employed to maximize participation in the FHS, including: pre-notification of
eligible women about the research project using letters with original signatures from the PI (Dr.
Anna Chiarelli), providing hard-copies of the questionnaire by mail in advance to being
contacted over the telephone, using coloured questionnaires instead of black-and-white,
providing stamped return envelopes for consent forms, and attempting several rounds of follow-
up contact during various days of the week and times of the day when subjects could not be
contacted on first attempt. As shown in Figure 3.2, we obtained high response rates. Of women
in the sampling frame, 73.6% participated. Rates of attrition over the study period were also
relatively low (9.0% at year 1, and 8.9% at year 2). While there is no consensus on what
constitutes an acceptable follow-up rate, rates of 50% to 80% have been suggested as acceptable
179
by several authors in the context of observational epidemiologic studies (Kristman et al., 2004;
Babbie, 1973). Some suggest that 80% should be used as the minimum acceptable follow-up
(Altman, 2000). While follow-up in our study well-exceeded these minimal acceptable rates, the
validity of these thresholds for follow-up is not known. Kristman et al. (2004), conducted a
simulation study to investigate whether varying rates of attrition are associated with biased odds
ratios in cohort studies. While rates of attrition from 5% to 60% did not bias true odds ratios
(OR) when observations were missing completely at random (MCAR), or missing at random
(MAR), ORs were biased even at low rates of attrition (5% to 20%) where data were missing
not at random (MNAR) (Kristman et al., 2004). For example, with 20% attrition, the OR was
underestimated by approximately 50% of its true value when observations were MNAR
(Kristman et al., 2004).
In many studies, no information is available for non-participants, so assessing whether
participation or attrition occurs differentially or at random is not possible. As we identified
women eligible for the FHS from a pre-existing cohort of women, we had access to data from
the Ontario site of the BCFR for our full sampling frame, and were able to examine factors
associated with non-participation and loss to follow-up. We compared both women who were
unreachable (lost to follow-up), and women who refused to participate, to women who
participated in the FHS on a number of socio-demographic factors, breast cancer risk factors,
medical/health behaviours, and lifestyle characteristics (Appendix E). Compared to women who
participated, women who refused to participate were significantly more likely to be 50 years or
older, have a personal history of cancer (any type), or be a current smoker. Compared to women
who participated, women who were lost to follow-up were significantly more likely to be less
than 40 years of age, single, post-menopausal or current drinkers. Despite high response rates,
and the relatively few differences between participants and non-participants, selection bias
180
cannot be excluded as we do not have outcome data for women who did not participate. For
example in Objective 1, if those who were exposed (high familial risk, or not screened with
mammography prior to diagnosis) and had the outcome (diagnosed with breast cancer/BBD, or
had less favourable prognostic features, respectively) were more likely to be non-participants or
lost to follow-up, our results would be biased toward the null. Alternatively, if non-participation
or loss to follow-up occurred disproportionately among those who were not exposed
(low/moderate familial risk, or screened with mammography prior to diagnosis) and had the
outcome (diagnosed with breast cancer/BBD, or had less favourable prognostic features,
respectively), our estimates would be biased upward. Encouragingly, FHS participation status
did not differ by level of familial risk, or history of ever use of mammography prior to the FHS.
Furthermore, the nearly three-fold increase in breast cancer risk for women with high familial
risk compared to women with low to moderate risk reported in Manuscript 2, and rates of
mammography screening (55.8%) and CBE (68.8%) reported in Manuscript 3, are consistent
with previous literature, suggesting selection bias is likely minimal.
Survival bias (Neyman bias) may lead to biased estimates where non-surviving
individuals are excluded at the outset of a study, and exposure status is linked to mortality
(Szklo & Nieto, 2007; Delgado-Rodríguez & Llorca, 2004). Participants of the FHS were
limited to women from the Ontario site of the BCFR still alive at the start of the study. Thus, it
is possible that the associations observed were subject to survival bias. For example, if women
with high familial risk and a breast diagnosis were more likely to experience mortality during
the period between recruitment to the Ontario site of the BCFR and start of the FHS, our results
would be biased toward the null. Alternatively, if women with low familial risk and a breast
diagnosis were more likely to be non-survivors, our results would be biased upwards. Survival
bias was likely minimal in this study, as the time between recruitment to the Ontario site of the
181
BCFR and being contacted to participate in the FHS ranged from two to seven years, and the 5-
year survival rate for breast cancer in Ontario from 2006 to 2010 was 86.5% (Cancer Quality
Council of Ontario, 2014).
Self-selection bias is of particular concern when evaluating observational research which
investigates the benefits of screening. Many studies have shown those who choose to participate
in screening tend to be healthier and more likely to comply with medical recommendations
compared to the general population (Gordis, 2014). As a result, more favourable outcomes may
be observed in the screened group even if there is no causal relationship between screening and
prognosis. Alternatively, people at high risk of disease may self-select into the screening group
more often than those at lower or average risk. It is difficult to estimate how this type of
selection bias might potentially bias results.
Length bias
Length bias occurs because diseases which exist for a longer period of time in the
preclinical phase before progressing to the clinical phase are more likely to be detected by
periodic screening compared with diseases which rapidly progress from the point of biologic
onset to the clinical phase. Diseases with a long preclinical phase are thought to be less
biologically aggressive and have more favourable prognosis than diseases with a short pre-
clinical phase, irrespective of screening status. Length bias has the greatest effect for cases
detected at initial screening (Herman et al., 2002). We did not exclude prevalent cases (women
diagnosed with breast cancer following an abnormal index screening mammogram) from our
analyses in Objective 1, thus length bias cannot be excluded, which may have led to the
overestimation of the association between screening and prognostic characteristics. However, as
182
the majority of screened women in our study (88.8%) had undergone two or more screening
mammograms prior to diagnosis, the effect of length bias was likely minimal.
5.2.2 Information Bias
Misclassification
Information bias is present when the means for obtaining data about study subjects are
inadequate, and information gathered regarding exposure and outcome status is incorrect
(Gordis, 2014). Two types of misclassification (or measurement error), exist. Non-differential
misclassification, when measurement error is not different for the groups being compared, is
generally considered less of a concern because it typically (for dichotomous variables) biases
study results toward the null. Differential misclassification, when measurement error is different
for the groups being compared, can bias results either toward or away from the null.
Measurement error in exposure and outcome measures was minimized by using data
abstracted from medical records for a number of variables in this thesis project. Cases of breast
cancer and BBD were identified initially by self-report. For all women who self-reported a
breast outcome, diagnoses were pathologically-confirmed by obtaining pathology and surgical
reports. Data on prognostic features of cases of breast cancer and BBD were largely obtained
from pathology and surgical reports. Medical charts contained extensive pathology data that
were consistently complete, and these data were also supplemented with stage data obtained
from the OCR. Historically, only regional cancer centers submitted TNM stage data to Cancer
Care Ontario for patients diagnosed and/or treated within those centers, thus stage data was not
routinely available from the OCR prior to 2007 (Cancer Care Ontario, 2012). A province-wide
stage capture project was initiated by Cancer Care Ontario in 2007, and the stage capture rate
for breast cancer across Ontario has met or exceeded the Cancer Care Ontario target of 90% of
183
cases from 2007 onwards (Cancer Quality Council of Ontario, 2014). In our study, cases on
invasive breast cancer with missing data on cancer stage were diagnosed prior to 2007.
Furthermore, while it is possible that some women may have been misclassified as being
free of breast cancer or BBD if they did not report an outcome, high rates of sensitivity and
specificity (>90%) for self-reported breast cancers have been demonstrated (Bergmann et al.,
1998; Parikh-Patel et al., 2003; Stavrou et al., 2011; Dominguez et al., 2007), and one study
found higher sensitivity for women with a family history of breast cancer compared to women
without a family history (Abraham et al., 2009). We used women’s self-reported use of
mammography screening prior to diagnosis to initially determine whether their breast outcome
was screen-detected or symptomatic. We confirmed self-reports using data abstracted from
imaging reports obtained from the imaging departments of hospitals or Independent Health
Facilities (IHF). For women who were not diagnosed with a breast outcome, self-reported
screening mammogram use was used. As demonstrated by our results in Manuscript 4, women’s
self-report of their screening mammogram use in the previous year is highly accurate.
Furthermore, women are unlikely to falsely report the non-use of mammography (Caplan et al.,
2003a; Gordon et al., 1993; Etzi et al., 1994).
Where medical records were not used, previously-referenced and validated measures
were used wherever possible for the measurement of variables. Classifications for familial
breast and/or ovarian cancer risk are based on data collected from the FHQ, which was
completed by the relative’s proband during the period of recruitment to the Ontario site of the
BCFR, as well as updated information from ongoing contact with the family. Studies have
previously demonstrated that patient-reported family cancer histories for first-degree relatives
are highly accurate for breast cancer risk assessments (Murff et al., 2004). The classification of
women as low, moderate, or high was based on previously referenced groups for familial breast
184
cancer risk (Eccles et al., 2000; Cortesi et al., 2006), with minimal modifications based on key
evidence (Collaborative Group on Hormonal Factors in Breast Cancer et al., 2001; Bevier et al.,
2011; Vencken et al., 2013; NICE, 2013; Egan et al., 1996; Toniolo et al., 1996), to ensure that
women with the wide range of family histories in our study cohort were accurately classified.
Familial risk was defined at baseline of the FHS and was not updated over the course of the
study, so it is possible that some women may have moved to a higher risk classification if there
were additional diagnoses of breast or ovarian cancer in their families during the study period.
Given the short period of follow-up, this misclassification was likely minimal.
Temporal bias
The appropriate temporal sequence, that is, that the risk factor proceeds the outcome of
interest, is needed to establish causality. Temporal bias occurs when inference about the
appropriate temporal sequence of cause and effect is erroneous, and is often a major concern in
cross-sectional research (Delgado-Rodríguez & Llorca, 2004). In our prospective cohort study,
we can definitively establish that the exposures of interest did precede the outcomes. In
Objective 1, through the use of medical records, we can be certain about whether women were
screened with mammography prior to diagnosis of breast cancer or BBD. We were particularly
interested in prospectively evaluating the relationship between perceived risk and use of
screening mammography, CBE, and genetic testing to address the limitations of previous
research. By using baseline measurements of perceived risk, and looking at subsequent
screening behaviours, we limited temporal ambiguity.
Hawthorne effect
The Hawthorne effect was originally observed during studies undertaken at the
Hawthorne plant of the Western Electric Company in Illinois in the 1920s (Roethlisberger &
185
Dickson, 1939). In the context of epidemiologic research, the Hawthorne effect refers to the
phenomenon wherein subject’s knowledge that they are taking part in an experiment or being
studied alters their behavior (McCambridge et al., 2014; Delgado-Rodríguez & Llorca, 2004). A
recent review of experimental and observational studies evaluated the presence of the
Hawthorne effect in health sciences research, finding that the majority (63.1%) of studies
reported some evidence of the Hawthorne effect (McCambridge et al., 2014). As described in
Section 3.5.4, we examined the frequency of reporting that participating in the FHS influenced
the use of screening mammography or CBE. When asked to list the main reasons for having
mammogram, no women at year 1, and only 2 women at year 2 reported ‘being part of this
study’ as the only reason they had a mammogram. However, 45 (8.0%) women at year 1, and 53
(9.7%) women at year 2 reported that it was one of the main reasons they had a mammogram (in
addition to ‘routine screening’). Women who reported that being part of the study was one of
the main reasons for having a mammogram were significantly older (p = 0.041), had high
familial risk (p = 0.011), were less educated (p = 0.024), and had a higher number of annual
health care visits (p = 0.036). When asked to list factors which encouraged them to have a
mammogram, 6 (1.1%) women at year 1, and 9 (1.6%) women at year 2 reported that ‘being a
part of this study’ was the only encouragement to have a mammogram, while 71 (12.7%)
women at year 1, and 84 (15.3%) women at year 2 reported it as one of several encouragements.
Women who reported that being part of the study encouraged them to have a mammogram were
significantly older (p = 0.005).
When asked to list the main reasons they had a CBE, 26 (3.6%) women at year 1, and 26
(4.1%) women at year 2 reported that ‘being part of this study’ was the only reason they had a
CBE. A similar proportion of women at year 1 (3.9%) and year 2 (3.2%) reported it as one of
the main reasons they had a CBE (in addition to ‘routine screening’). Women who reported that
186
being part of the study was one of the main reasons they had a CBE had significantly higher
levels of breast cancer worry (p = 0.0004), and higher number of health care visits (p = 0.03).
Encouragingly, few women reported that the only reason they had a mammogram or
CBE was because they were part of the FHS. However, 8-10% of women reported that being
part of the FHS was one of the main reasons they had a mammogram, and 3-4% of women
reported that study participation was one of the main reasons they had a CBE. These findings
suggest that the rates of annual participation in mammography and CBE observed in the FHS at
year 1 (57.4% for mammography, 72.9% for CBE) and year 2 (62.1% for mammography,
71.3% for CBE) may be slightly elevated compared to rates of screening in the target
population.
Publication bias
The findings of our systematic review (Manuscript 1) were based solely on data
published in peer-reviewed, English-language publications. Publication bias may lead to an
over-representation of positive and statistically significant results, as these studies are more
likely to be published than studies with null, or non-statistically significant findings (Elwood,
2007). Furthermore, studies with positive results are more likely to be published in English-
language journals (Khan et al., 2003), which are often easiest to find (language bias) (Elwood,
2007). Thus, the studies included in our review might not be reflective of all studies conducted
that have examined the relationship between perceived risk and breast cancer screening
behaviours. It is worthy of note that differences in study results also exist across different
electronic databases for scientific literature. The two primary databases of scientific literature in
health are Medline and Embase. These databases differ in their coverage; Embase covers
European journals more comprehensively than Medline (Elwood, 2007). One study examined
187
all RCTs included in both Medline and Embase, and found that trials reported in Embase had
29% smaller effects on average than the trials reported in Medline (Sampson et al., 2003),
suggesting that only searching Medline could bias a meta-analysis or systematic review by only
including studies that show larger estimates. To ensure we maximized the number of relevant
studies included in our review, we searched a number of databases including Medline, Embase,
PsychInfo, and the Cochrane Library, as well as conducted thorough hand-searches of
bibliographies of numerous manuscripts.
5.2.3 Confounding
Confounding occurs when a noncausal association is observed or causal association is
not observed between an exposure and outcome as a result of the influence of a third variable, or
group of variables (Szklo & Nieto, 2007). To be classified as a confounder, the variable must be
related to both the risk factor and outcome under study, and not be an intermediate step on the
causal pathway between the exposure and outcome (Rothman et al., 2008). Confounding can
result when known and/or unknown confounders are not adjusted for, or when included
confounders are not adequately measured (Szklo & Nieto, 2007).
Despite adjusting for important potential confounders in our analyses, it is possible that
our results are affected by residual confounding. Studies that have previously examined the
association between perceived risk and breast cancer screening behaviours have adjusted for
having a usual source of medical care, and physician recommendation to screen (Price et al.,
2010; Diefenbach et al., 1999; Bowen et al., 2003). Not having a regular source of medical care
(Shields & Wilkins, 2009; Rakowski et al., 2010; Scheuler et al., 2008; Maxwell et al., 2001)
and physician recommendation (Scheuler et al., 2008; Hanson et al., 2009) have shown to be the
most important predictors of mammography. It is likely that differences in screening
188
recommendations women received from physicians or other sources accounted for some of the
variability in screening behaviours observed in the FHS. We did not collect follow-up data for
all women on whether they had a regular source of medical care, or whether they received a
physician recommendation to screen, so could not adjust our models for these potential
confounders. In the PHSQ, women who reported that they did not have a mammogram were
asked to report the reasons for not having an examination. At year 1, 42.5% of non-screening
women said they did not have a mammogram because their doctor did not recommend it. While
the majority of these women were younger than 50 years (80.8%), and had low familial risk
(67.1%), it is noteworthy that nearly 20% of women who reported not screening because their
doctor didn’t recommend it were 50 or older, and almost 17% had high familial risk.
Knowledge about breast cancer and breast cancer screening, along with beliefs regarding
the efficacy of screening, appropriate age to begin and stop screening, and screening intervals
may also be important in influencing screening behaviours. While these factors were not
adjusted for, a previous study of the women in the FHS cohort demonstrated that 92% of women
believed they should start screening with mammography prior to age 50 years, and 77% women
believed they should screen annually (Ritvo et al., 2012).
Women aged 50 years or older who have a family history of breast cancer and are part of
the OBSP receive annual reminder letters when screening is due, and may be more likely to
attend screening than women who are not part of the OBSP. As we did not conduct a linkage to
OBSP data, we could not adjust for participation in the OBSP. Several Canadian studies in
women with population risk of breast cancer have also reported that women residing in rural
areas are significantly less likely to report having a mammogram in the previous two years
compared with women residing in urban areas (McDonald & Sherman, 2010; Shields &
189
Wilkins, 2009; Mah & Bryant, 1997; Bryant & Mah, 1992). As we did not conduct a linkage to
Statistics Canada data holdings, we could not adjust for place of residence.
In our examination of the relationship between familial risk and prognostic features of
invasive breast cancers, we did not adjust for screening history. As shown in Manuscript 1,
women at high familial risk had a significantly higher number of lifetime mammograms (p =
0.003). Therefore, it is highly plausible that the trend of more favourable prognostic features we
observed in women at high familial risk is partially explained by having more lifetime
mammograms. However, certain types of breast cancer with a favourable prognosis have been
reported to be more common in women with a family history of breast cancer, including
medullary, tubular and lobular carcinoma (Vainio & Bianchini, 2002; Pereira et al., 1995). A
study by Malone et al. (2011) also observed that women with a first-degree family history of
breast cancer had more favourable prognostic profiles compared with women with no family
history or a second-degree family history, and these differences were not explained by
screening.
5.2.4 Effect Modification & Statistical Interaction
In contrast to quantitative interaction (when the association between risk factor and
outcome is of the same direction within each stratum of the potential effect modifier, but the
strength of association varies across strata), qualitative interaction is present when the effects of
the risk factor on the outcome are in opposite directions (crossover) within each stratum of the
potential effect modifier (Szklo & Nieto, 2007). When qualitative interaction is present, it can
always be seen in both the additive and multiplicative scale (Szklo & Nieto, 2007). The results
presented in Manuscript 3, which examine whether level of familial risk modifies the
relationship between perceived breast cancer risk and breast cancer screening use, are
190
suggestive of qualitative interaction. Among women at low familial risk, a curvilinear u-shaped
relationship was observed with mammography; women were more likely to screen if they
perceived their risk as <50% (OR = 1.48) or >50% (OR = 1.13) vs. 50%. No consistent
relationship between perceived risk and use of CBE or genetic testing was observed in women
at low familial risk. In contrast, in women at moderate/high familial risk, a curvilinear inverted
u-shaped relationship was observed; women were less likely to screen with mammography,
CBE and genetic testing if they perceived their risk as <50% or >50% vs. 50% (ORs ranging
from 0.52-0.84).
The statistical significance of interaction terms entered into regression models is often
used to assess the presence of interaction. While we observed marked heterogeneity in the
strata-specific ORs for level of familial risk (crossover), the product terms entered into the
regression models to assess interaction between perceived risk and familial risk were not
statistically significant at p < 0.05. Statistical testing of homogeneity of effects, while of value,
is not sufficient to comprehensively assess the presence or absence of interaction (Szklo &
Nieto, 2007). When sample size is very large, even minimal heterogeneity which has little or no
clinical or biological relevance may be statistically significant. In contrast, estimates that
demonstrate marked heterogeneity may not be significant at the statistical cut-point chosen in
small samples (Szklo & Nieto, 2008). Ideally, results which demonstrate marked heterogeneity
across strata of a potential effect modifier that are unaccompanied by statistically significant
interaction terms (such as the findings from our study), should be confirmed in subsequent
studies which have ample statistical power to detect this interaction. As such, future studies with
larger sample sizes of women with varying levels of familial breast cancer risk are needed to
confirm our findings.
191
5.2.5 Analytical Issues
Missing data
The magnitude of missing data for variables used in each of the three manuscripts is
shown in Appendix G. In Manuscript 1, missing data was minimal (<5%) for the overall cohort.
Missing data was greatest for prognostic features of invasive breast cancer; 23.5% of cases were
missing data on lymph node status, 18.4% of cases were missing data on ER/PR receptor status,
and 7.9% of cases were missing data on TNM stage, as well as lymphovascular invasion and
mitotic score. As the majority (57.9%) of data on HER-2/neu were missing, it was not included
in analyses. As such, we could not examine the distribution of tumor subtypes (i.e. luminal A,
luminal B, and triple-negative) by level of familial risk or mammography screening status.
Phipps et al. (2011) demonstrated that women with stronger family histories are at increased risk
of having triple-negative breast tumors, which is associated with poorer survival (Bauer et al.,
2007; Carey et al., 2006). It should also be noted that while we received pathological
confirmation for 44 of 46 cases (95.6%) of self-reported breast cancer, we only received
pathological confirmation for 56 of 75 cases (74.7%) of self-reported BBD. For Objective 2
analyses, missing data was minimal (<4%) for all variables. For Objective 3 analyses, missing
data was greatest for genetic test use at baseline (6.4%), and perceived risk measured on the
verbal Likert-type scale (5.3% at baseline, 4.7% at year 1). The majority of other variables were
missing <1% of data.
Analyses were conducted on subjects with complete exposure, outcome and covariate
data using a complete case analysis approach. Multiple imputation was not used to replace
missing data for several important reasons: bias may be introduced where data are not MCAR or
192
MAR, the majority of multiple imputation procedures assume data are normally distributed, and
the performance of multiple imputation is unclear for small samples (Sterne et al., 2009).
With regards to Objective 1, data from the pre-diagnosis mammogram was used to
classify all women with a diagnosis of breast cancer into the screened (routine screening) and
unscreened (symptomatic) groups. An additional limitation of this study is that interval cancers
could not be systematically identified because the full mammogram history (including date,
indication, and/or mammographic finding for mammograms prior to the pre-diagnosis
mammogram) was not available for all breast cancer cases.
With regard to Objective 3, some data limitation was present. Data abstracted from
imaging reports was used as the ‘gold standard,’ and these reports were obtained from the
imaging centers in hospitals or IHFs which were self-reported by women in the PHSQ. In
Ontario, screening mammography is available through over 260 OBSP and non-OBSP sites. As
it was not possible to verify with each of these facilities that women did not have a mammogram
when they self-reported that they did not, we could not validate the non-use of screening
mammography. Thus, standard measures of validity including sensitivity, specificity, and
Cohen’s kappa could not be tabulated, as true-negative and false-negative values were not
available. Fortunately, previous evidence suggests women are unlikely to falsely report the non-
use of mammography (Caplan et al., 2003a; Gordon et al., 1993; Etzi et al., 1994).
Statistical Methods
When prospective data are available, relative risk is typically estimated because it is a
more easily understood measure of association than the odds ratio (Szklo & Nieto, 2007). For
Objective 1, we used the OR as an estimate of the RR of being diagnosed with breast cancer or
benign breast disease. Due to the complexity of the FHS design (clustered sample), ORs were
193
estimated instead of RRs, because more tailored techniques for robust variance estimation (i.e.
small sample size correction) are available for the logistic regression model than for other
regression models which can directly estimate RR (i.e. log-binomial or modified Poisson) in the
statistical software package used. While in many cases the OR offers an accurate approximation
of RR, the OR can overestimate the true RR (Szklo & Nieto, 2007). When the incidence of the
outcome is rare (4.9% of women had breast cancer and 6.2% had BBD in our study) this bias is
negligible, however it can be substantial when incidence is not rare (≥10%) (Szklo & Nieto,
2007). While incidence of the outcome was not rare in Manuscript 3 (55.8% women reported a
mammogram, 68.8% reported a CBE, and 14.7% reported a genetic test), ORs were estimated to
ensure comparability with previously conducted studies.
Study Power
During the design phase of the FHS, power was calculated for Objective 1 using PS
(Dupont & Plummer, 1997), and it was estimated that the study would have 80% power to
detect a RR of 3.3 comparing women with moderate familial risk to women with low familial
risk, and 80% power to detect a RR of 3.7 comparing women with high familial risk to women
with low familial risk. It was initially estimated that 90 breast cancers would be diagnosed over
the study; however, only 44 breast cancers (38 invasive, 6 DCIS only) were diagnosed. This
could be related to the higher likelihood of non-participation for women 50 years of age or
older, and post-menopausal women noted in Section 5.2.1. The magnitude of missing data for
lymph node status, and ER/PR receptor status for invasive cancers further reduced sample size
and power for these sub-group analyses. While we observed a similar trend across prognostic
features (symptomatic cancers were more likely to have poorer prognostic profiles compared
with screen-detected cancers, and women with high familial risk were more likely to have
favourable prognostic features compared with women at low and moderate familial risk), type II
194
error was a concern. Our ability to detect these differences was limited due to the small overall
numbers of invasive cancers, and missing data. We were also unable to examine features of
DCIS (architectural type, nuclear grade, necrosis, lesion size) due to the small number of cases
of DCIS without invasive component.
For Objectives 2 and 3, power was calculated using Power, Version 3.0.0 (Lubin & Gail,
1990; Garcia-Closas & Lubin, 1999). As discussed in Section 3.5.3, the clustered design of the
FHS, and resulting intracluster correlation of observations, led to a reduction in statistical
power. It is necessary to account for clustering during both the design and analysis phases of the
study (Liu & Liang, 1997). To account for clustering during the design phase, power was
calculated with the total sample size equal to both the number of families, and number of
relatives. True statistical power was likely situated between these conservative (families) and
liberal (relatives) estimates. For Objective 2, we estimated that we would have 79.3% to 90.3%
power (given a range of outcome probabilities) to detect an OR of 1.65 among relatives, and
69.5 to 82.7% power to detect an OR of 1.65 among families. However, it is important to note
that these calculations reflected pre-study assumptions regarding expected probabilities of
exposure and outcome based on estimates from previous literature, as well as a binary
categorization of perceived risk. These assumptions did not reflect the observed exposure or
outcome probabilities. Given the lower true exposure probabilities in our data, our decision to
use a 3-level exposure variable given the distribution of our data, and the smaller observed
effect sizes, the power of our study for this objective was likely substantially lower than the
initial estimate. As post-hoc power calculations based on observed effect sizes which are smaller
for those for which the study was originally designed will always underestimate prospective
study power (Goodman & Berlin, 1994; Smith & Bates, 1992), post hoc power was not
195
calculated. For Objective 3, we estimated that we would have 77.3 to 88.2% power to detect an
OR of 2.00 among relatives, and 67.8 to 80.1% power to detect an OR of 2.00 among families.
5.2.6 General Limitations
Perhaps the most important limitation of the thesis project was that we could not obtain
complete pedigree data (full family history of breast and ovarian cancers, including age at
diagnosis and/or death, and BRCA1/2 mutation carrier status) in a useable format to allow the
use of one of the validated, widely-used breast cancer risk estimation tools discussed in Section
3.4.1, such as the BOADICEA (Lee at al., 2014) or IBIS (Tyrer et al., 2004) models, to calculate
numeric lifetime breast cancer risk for each of the women in our study cohort. While the
classification system of familial breast cancer risk that we employed was rigorously developed
based on pre-existing models, and revised according to subsequent seminal studies and
resources in the field, deriving a numeric breast cancer risk using one of the standard risk
estimation algorithms would allow us to validate our measure. Importantly, this also would have
allowed a comparison of women’s perceived numeric breast cancer risk and objective numeric
breast cancer risk. As such, it would be possible to identify how accurate women with familial
breast and/or ovarian cancer risk in Ontario are with regard to numerically estimating their
personal risk, and identify specific sub-populations where risk management and messaging
efforts may need to be focused to bring perceived breast cancer risk in line with actual risk.
Another limitation of the thesis was the short follow-up period of the FHS. The
prospective cohort design afforded a number of important advantages for our research
objectives, including the ability to investigate multiple exposures and outcomes, and the ability
to definitively establish the appropriate temporal sequence (critical to both Objectives 1 and 2).
However, the limited follow-up of only two years precluded our ability to examine long-term
196
outcomes for Objective 1. While our results from Objective 1 are an important starting point, to
determine whether mammography screening is beneficial for all women with varying levels of
familial breast cancer risk, the examination of long-term outcomes is needed.
5.2.7 External Validity
Our findings on the influence of level of familial breast cancer risk, and screening
mammography status on prognostic features of invasive breast cancer and benign breast disease
likely apply to most women with a family history of breast cancer, thus our findings can likely
be extended to a much broader population of women with familial risk. It is unclear how our
findings may generalize specifically to younger women, and women with BRCA1/2 mutations,
as the mutation carrier prevalence in the FHS was estimated to be approximately 10% (Ontario
Cancer Genetics Network, Internal Communication, 2012). Few studies have examined the
effectiveness of mammography screening specifically in younger women with a family history
of breast cancer; however, one study reported interim findings which predict a 10-year mortality
reduction of 20% from annual mammography for women younger than 50 years with a
moderate or high familial breast cancer risk (FH01 collaborative teams, 2010). Some studies
have suggested BRCA1/2-associated breast cancers are more likely to be of a higher grade and
ER- compared to sporadic cancers (Goodwin et al., 2012; Mavaddat et al., 2012; Breast Cancer
Linkage Consortium, 1997). These histological differences may suggest a different natural
history for breast cancers due to BRCA mutations, which has important implications for
screening. If breast cancers in BRCA1 or BRCA2 mutation carriers spend a shorter amount of
time than sporadic cancers in the preclinical phase, they are less likely to be detected by periodic
screening mammography. Furthermore, a few studies have demonstrated that African-American
and Hispanic women are significantly more likely to have basal-like, or triple-negative breast
tumors compared with Caucasian women (Howlader et al., 2014; Carey et al., 2006), which may

197
partially account for the increased risk of mortality in these populations. Given that over 96% of
women in our study were Caucasian, future studies should include varying ethnic groups to
determine if our findings are applicable to these populations.
Our findings regarding the relationship between perceived risk and breast screening use
likely apply to the broader population of women with familial breast cancer risk, with several
limitations. All women in our study were Ontario residents, where universal healthcare coverage
is available, and an organized breast cancer screening program is in place. While healthcare
coverage is universal in Canada, and all provinces and territories have organized breast
screening programs (with the exception of Nunavut), our findings may not apply to populations
where health care is not universal or breast cancer screening sites are more difficult to access.
Factors such as the cost of mammography, not having health insurance, long wait-times or
distance of the screening facility may impose barriers to attending screening that Canadian
women do not generally experience. Additionally, there may be differences in breast cancer
screening guidelines, specifically for women under 50 years of age with familial breast cancer
risk outside of Canada.
5.3 Study Strengths
This thesis project has a number of notable strengths. Participants of the FHS were
identified from a large, population-based cohort of relatives of cases of breast cancer. The
population-based nature of the study allows for broad generalizability to women with a family
history of breast and/or ovarian cancer, and limits self-selection bias. The population-based
design also allowed for the inclusion of women with a very wide range of familial breast or
ovarian cancer histories, allowing for us to examine potential differences among women with
varying levels of increased breast cancer risk. While many studies have compared women with a

198
family history of breast cancer to women without a family history, few studies have compared
women with varying levels of familial breast cancer risk. Another major strength of this study is
the prospective design, which limited reverse causality in assessing the relationship between
perceived risk and breast cancer screening use.
The high initial response rate obtained (73.6%) limited selection bias within the cohort.
Furthermore, our analyses which demonstrated that participation status was not associated with
familial breast cancer risk, or screening mammogram history suggest that the women in our
study are likely similar to women in the target population on these main exposure and outcome
measures. We collected detailed baseline and follow-up data for a large number variables, thus
were able to adjust for a number of important confounders. Our ability to validate self-reported
mammogram use and diagnoses of breast cancer and benign breast disease using data from
imaging and pathology/surgical reports ensured that misclassification was kept to a minimum.
Our familial risk classification scheme was also rigorously developed using the most recent and
seminal evidence to ensure all women were accurately classified.
5.4 Implications for Epidemiology and Public Health, and Future Directions
This thesis project provides new evidence regarding prognostic features of breast cancer
and risk of BBD in women with varying levels of familial breast cancer risk. While much is
known about the risk and prognosis of breast cancer in average-risk women and women at very
high risk of breast cancer (BRCA1/2 mutation carriers), much less is known about women with
intermediate levels of familial risk. In our cohort, symptomatic invasive breast cancers were
significantly larger in size and diagnosed at a later stage compared with screen-detected cancers.
While our results suggest that all women with a first-degree family history of breast and/or
ovarian cancer may benefit from annual mammography screening, a mortality benefit cannot be
199
inferred. Breast cancers which exist in the preclinical phase for a longer period (and may have
more favourable prognosis) are more likely to be detected during screening compared with
cancers that progress rapidly to the symptomatic phase (length bias). It is possible then, that the
increased likelihood of small, localized invasive cancers detected by mammography screening
in the FHS is partially representative of overdiagnosed cases. However, the overall magnitude of
overdiagnosis may be less in women with familial risk, given that some of these women may
experience poorer prognosis relative to average-risk women. Having a first-degree relative
diagnosed with breast cancer before age 50 years is a strong risk factor for early-onset breast
cancer (Althuis et al., 2003), and 5-year breast cancer survival rates are lowest in women
diagnosed prior to age 40 years (Freedman & Partridge, 2013). Women with strong family
histories also have higher risk of triple-negative breast tumors (Phipps et al., 2011), which
demonstrate poorer survival. A study combining data from several high-risk screening studies
also found the rate of tumor growth in BRCA mutation carriers was double that of non-carriers
(Tilanus-Linthorst et al., 2007).
To determine whether mammography screening is effective for all women with a family
history of breast and/or ovarian cancer, studies with extensive periods of follow-up that assess
the effect of mammography screening on breast cancer mortality are necessary. Future research
should also include larger samples of women to be able to detect small differences in prognostic
features between familial risk groups, focus specifically on younger women with familial breast
cancer risk, and include women of different ethnic backgrounds. A recent US study found that
the rate of breast MRI for breast cancer screening increased from 1.5 per 10,000 women in
2003, to 32.3 per 10,000 women in 2011 (Stout et al., 2014). While 82.0% of women screened
with breast MRI had a family history of breast cancer, only 5.9% had a known BRCA mutation
(Stout et al., 2014). Studies which examine the efficacy and cost-effectiveness of screening for
200
breast cancer using MRI in addition to mammography in women with varying levels of familial
risk are also critical, given the increased use of breast MRI within broader populations of
women at intermediate and high breast cancer risk. Several countries have revised breast cancer
screening protocols for carriers of BRCA1/2 mutations to exclude mammography, in response to
the concerns about increased radiosensitivity and risk of radiation-induced breast cancer due to
accumulated exposure to ionizing radiation in this population (Pijpe et al., 2012). As such,
investigation of the efficacy of breast screening with MRI alone compared with combined MRI
and mammography in women at very high risk may be warranted. This evidence is needed
before definitive risk-based breast cancer screening guidelines can be developed. Developing
tailored risk-based screening strategies for women with varying levels of breast cancer risk may
maximize detection of early-stage breast cancers, which may ultimately improve breast cancer
prognosis.
This thesis project also provides an important contribution to the body of literature
concerning the relationship between perceived risk and breast cancer screening behaviours in
women with a family history of breast cancer. As discussed, the majority of studies in this area
are cross-sectional, and it is highly plausible that their results are explained by temporal bias. In
our overall cohort, perceived risk did not predict breast cancer screening in the following year.
We hypothesized that level of familial risk may moderate this relationship, and our stratified
findings suggested some evidence to support this. Importantly, women at moderate/high familial
risk were less likely to screen with any modality if they perceived their risk as greater than 50%,
compared to women who perceived their risk as exactly 50%, suggesting that highly-elevated
levels of perceived risk may deter regular screening use. Notably, nearly half (47%) of the
women who perceived their lifetime breast cancer risk to be greater than 50% were classified as
low familial risk, suggesting many of these women greatly overestimated their risk. Women
201
with such elevated risk perceptions may disproportionately experience anxiety about developing
cancer, which may in turn promote avoidance of regular screening. Given that rates of annual
mammography screening in North American women with familial risk are lower than 60%
(Campitelli et al., 2011; Madlensky et al., 2005), understanding the factors which influence
screening is critical to developing strategies to increase participation. Further clarification of
how women with a family history perceive their risk, the accuracy of perceived risk estimates,
and the influence of perceived risk on screening will guide the development of risk education
and management strategies to promote informed decision-making regarding optimal breast
screening use, and to identify populations where these strategies should be targeted. Due to the
lack of statistical significance of our results, studies with larger samples of women with varying
levels of perceived risk are needed to confirm our findings.
Finally, this project also provided some of the first evidence of the accuracy of self-
reported mammogram use in women with varying levels of familial risk, and identified sub-
groups of women with reduced recall accuracy. Understanding the validity of self-reported
mammogram data is essential for researchers given the wide use of these data for measuring
adherence to breast screening guidelines in epidemiologic research studies. These findings may
also be important in the clinical setting, where patient’s self-reported use of cancer screening
examinations may be considered during the process of medical decision-making and referral.
Taken together, the studies that form this thesis contribute significantly to the body of
knowledge regarding the effectiveness and use of breast cancer screening in women with
familial risk. Understanding the differences in screening participation and effectiveness, as well
as breast cancer prognosis that exist for women with varying levels of familial risk is critical, as
we shift towards models of medicine and healthcare that are increasingly personalized. The
potential harms of breast cancer screening must always be weighed against the potential clinical

202
benefits, and robust evidence that allows women and their physicians to make informed
decisions regarding the modalities they are screened with, the optimal age to begin screening,
and appropriate screen intervals is needed. Future research which builds upon our results will
guide the continued development of risk-tailored screening strategies, along with interventions
to increase regular use of breast cancer screening in women with familial risk, with the ultimate
goal of reducing the burden of breast cancer in this high-risk population. As breast cancer is the
leading incident cancer and second leading cause of cancer death among Canadian women, and
given that as many as 1 million Canadian women aged 20 years or older are estimated to have a
first-degree family history of breast cancer, developing screening strategies which more
effectively detect early-stage cancers, and increasing breast cancer screening participation in
this population is essential.
203
Chapter 6 Contribution to the Design and Conduct of the Thesis Project
The FHS was designed and data collection underway prior to the candidate’s initial
involvement in the project. However, the candidate was responsible for explicitly developing the
thesis objectives in collaboration with the PhD advisory committee. The candidate also secured
a two-year Doctoral Fellowship from the Canadian Breast Cancer Foundation - Ontario Region
to support completion of the project, and was responsible for initially obtaining and maintaining
ethical approval. The idea to conduct a systematic review (Objective 2), to identify important
methodological issues and limitations which our original study would subsequently address, was
that of the candidate. Upon completion of data collection in March 2011, the candidate assumed
full responsibility for managing the FHS database, and all study materials. The candidate was
independently responsible for creating a final, complete dataset incorporating data files from all
years of FHS follow-up, data from the Ontario site of the BCFR, as well as pathology and
imaging data. The candidate also undertook a comprehensive quality assessment of the FHS
database, and partially re-abstracted and re-entered data from imaging reports. The candidate
also updated the familial risk classification scheme based on emerging seminal evidence. The
candidate was responsible for processing data from raw database format to cleaned and derived
versions of data, and independently responsible for conducing all statistical analyses in the
thesis project. The candidate drafted all versions of the manuscripts in full, and made all
revisions as suggested by the manuscript co-authors. The candidate also submitted all resulting
manuscripts for peer-review, made appropriate revisions as suggested by peer-reviewers, and
presented all results at relevant scientific meetings locally, nationally and internationally.
204
References
Abraham L, Geller BM, Yankaskas BC, Bowles EJ, Karliner LS, Taplin SH, et al. Accuracy of
self-reported breast cancer among women undergoing mamography. Breast Cancer Res Treat
2009; 118(3):583-592.
Ajzen I. Attitudes, personality and behavior. Chicago, IL: Dorsey Press; 1988.
Althuis MD, Brogan DD, Coates RJ, Daling JR, Gammon MD, Malone KE, et al. Breast cancers
among very young premenopausal women (United States). Cancer Causes Control 2003;
14(2):151-160.
Altman DG. Statistics in medical journals. Stat Med 2000; 19(23):3275-3289.
American Cancer Society. Breast Cancer Early Detection: American Cancer Society
recommendations for early breast cancer detection in women without breast symptoms. Retrived
28 June 2014 from:
http://www.cancer.org/cancer/breastcancer/moreinformation/breastcancerearlydetection/breast-
cancer-early-detection-acs-recs
Amir E, Freedman OC, Seruga B, Evans DG. Assessing women at high risk of breast cancer: a
review of risk assessment models. J Natl Cancer Inst 2010; 102(10):680-691.
Amir E, Evans DG, Shenton A, Lalloo F, Moran A, Boggis C, et al. Evaluation of breast cancer
risk assessment packages in the family history evaluation and screening programme. J Med
Genet 2003; 40(11):807-814.
Andersen MR, Smith R, Meischke H, Bowen D, Urban N. Breast cancer worry and
mammography use by women with and without a family history in a population-based sample.
Cancer Epidemiol Biomarkers Prev 2003; 12(4):314-320.
Andersson I, Aspergren K, Janzon L, Landberg T, Lindholm K, Linell F, et al. Mammographic
screening and mortality from breast cancer: the Malmö mammographic screening trial. BMJ
1988; 297(6654):943-948.
Antill YC, Reynolds J, Young MA, Kirk JA, Tucker KM, Bogstra TL, et al. Screening behavior
in women at increased familial risk for breast cancer. Fam Cancer 2006; 5(4):359-368.
Antoniou A, Pharoah PD, Narod S, Risch HA, Eyfjord JE, Hopper JL, et al. Average risks of
breast and ovarian cancer associated with BRCA1 or BRCA2 mutations detected in case series
unselected for family history: a combined analysis of 22 studies. Am J Hum Genet 2003;
72(5):1117-1130.
Arason A, Jonasdottir A, Barkardottir RB, Bergthorsson JT, Teare MD, Easton DF, et al. A
population study of mutations and LOH at breast cancer gene loci in tumours from sister pairs:
two recurrent mutations seem to account for all BRCA1/BRCA2 linked breast cancer in Iceland.
J Med Genet 1998; 35(6):446-449.
205
Armstrong K, Long JA, Shea JA. Measuring adherence to mammography screening
recommendations among low-income women. Prev Med 2004; 38(6):754–760.
Babbie ER. Survey research methods. Belmont, CA: Wadsworth; 1973.
Bailar JC 3rd. The promise and problems of meta-analysis. N Engl J Med 1997; 337(8):559-561.
Baker LH. Breast Cancer Detection Demonstration Project: five-year summary report. CA
Cancer J Clin 1982; 32(4):194-225.
Balleyguier C, Ayadi S, van Nguyen K, Vanel D, Dromain C, Sigal R. BIRADS classification in
mammography. Eur J Radiol 2007; 61(2):192-194.
Ballinger GA. Using generalized estimating equations for longitudinal data analysis. Organ Res
Methods 2004; 7:127.
Bancej CM, Maxwell CJ, Snider J. Inconsistent self-reported mammography history:
findings from the National Population Health Survey longitudinal cohort. BMC Health Serv Res
2004; 4(1):32.
Bancej C, Decker K, Chiarelli AM, Harrison M, Turner D, Brisson J. Contribution of clinical
breast examination to mammography screening in the early detection of breast cancer. J Med
Screen 2003; 10(1):16-21.
Banks E. Hormone replacement therapy and the sensitivity and specificity of breast cancer
screening: a review. J Med Screen 2001; 8(1):29-34.
Barton MB, Harris R, Fletcher SW. The rational clinical examination. Does this patient have
breast cancer? The screening cliinical breast examination: should it be done? How? JAMA
1999; 282(13):1270-1280.
Bauer KR, Brown M, Cress RD, Parise CA, Caggiano V. Descriptive analysis of estrogen
receptor (ER)-negative, progesterone receptor (PR)-negative, and HER2-negative invasive
breast cancer, the so-called triple-negative phenotype: a population-based study from the
California cancer Registry. Cancer 2007; 109(9):1721-1728.
Baxter N, Canadian Task Force on Preventive Health Care. Preventive health care, 2001 update:
should women be routinely taught breast self-examination to screen for breast cancer? CMAJ
2001; 164(13):1837-1846.
Beahrs OH, Henson DE, Hutter RVP, Myers MH (eds). Manual for Staging of Cancer, 3rd edn.
Philadelpha, PA: J.B. Lippincott Company; 1988.
Becker MH (ed). The health belief model and personal health behavior. Thorofare, NJ: Charles
B. Slack Inc; 1974.
206
Bell BA, Morgan GB, Kromrey JD, Ferron JM. The impact of small cluster size on multilevel
models; a Monte Carlo examination of two-level models with binary and continuous predictors.
Paper presented at the Joint Statistical Meetings (Canada) August 2010; Vancouver, British
Columbia:4057-4067.
Bennett IC, Gattas M, Teh BT. The genetic basis of breast cancer and its clinical implications.
Aust N Z J Surg 1999; 69(2):95-105.
Berg WA, Zhang Z, Lehrer D, Jong RA, Pisano ED, Barr RG, et al. Detection of breast cancer
with addition of annual screening ultrasound or a single screening MRI to mammography in
women with elevated breast cancer risk. JAMA 2012; 307(13):1394-1404.
Bergmann MM, Calle EE, Mervis CA, Miracle-McMahill HL, Thun MJ, Heath CW. Validity of
self-reported cancers in a prospective cohort study in comparison with data from state cancer
registries. Am J Epidemiol 1998; 147(6):556-562.
Berkowitz GS, Kelsey JL, LiVolsi VA, Holford TR, Merino MJ, Ort S, et al. Risk factors for
fibrocystic breast disease and its histopathologic components. J Natl Cancer Inst 1985;
75(1):4350.
Bertelsen L, Mellemkjaer L, Balslev E, Olsen JH. Benign breast disease among first-degree
relatives of young breast cancer patients. Am J Epidemiol 2008; 168(3):261-267.
Bevier M, Sundquist K, Hemminki K. Risk of breast cancer in families of multiple affected
women and men. Breast Cancer Res Treat 2012; 132(2):723-728.
Biesheuvel C, Barratt A, Howard K, Houssami N, Irwig L. Effects of study methods and biases
on estimates of invasive breast cancer overdetection with mammography screening: a systematic
review. Lancel Oncol 2007; 8(12):1129-1138.
Binder DA. On the variances of asymptotically normal estimators from complex surveys. Int
Stat Rev 1983; 51:279-292.
Bjurstam N, Björneld L, Duffy SW, Smith TC, Cahlin E, Eriksson O, et al. The Gothenburg
breast screening trial: first results on mortality, incidence, and mode of detection for women
ages 39-49 years at randomization. Cancer 1997; 80(11):2091-2099.
Bodian CA. Benign breast diseases, carcinoma in situ, and breast cancer risk. Epidemiol Rev
1993; 15(1):177-187.
Bond M, Pavey T, Welch K, Cooper C, Garside R, Dean S, et al. Systematic review of the
psychological consequences of false-positive screening mammograms. Health Technol Assess
2013; 17(13):1-170.
Bonadona V, Dussart-Moser S, Voirin N, Sinilnikova OM, Mignotte H, Mathevet P, et al.
Prognosis of early-onset breast cancer based on BRCA1/2 mutation status in a French
population-based cohort and review. Breast Cancer Res Treat 2007; 101(2):233-245.
207
Bordeleau L, Panchal S, Goodwin P. Prognosis of BRCA-associated breast cancer: a summary
of evidence. Breast Cancer Res Treat 2010; 119(1):13-24.
Bove BA. BRCA1, BRCA2 and hereditary breast cancer. In: Pasqualini JR (ed). Breast cancer:
Prognosis, treatment, and prevention, 2nd ed. New York, NY: Informa Healthcare; 2008.
Bowen DJ, Helmes A, Powers D, Andersen MR, Burke W, McTiernan A, et al. Predicting
breast cancer screening intentions and behavior with emotion and cognition. J Soc Clin Pyschol
2003; 22(2):213-232.
Bray F, McCarron P, Parkin DM. The changing global patterns of female breast cancer
incidence and mortality. Breast Cancer Res 2004; 6(6):229-239.
Breast Cancer Linkage Consortium. Cancer risks in BRCA2 mutation carriers. J Natl Cancer
Inst 1999; 91(15):1310-1316.
Breast Cancer Linkage Consortium. Pathology of familial breast cancer: differences between
breast cancers in carriers of BRCA1 or BRCA2 mutations and sporadic cases. Breast Cancer
Linkage Consortium. Lancet 1997; 349(9064):1505-1510.
Brekelmans CT, Tilanus-Linthorst MM, Seynaeve C, vd Ouweland A, Menke-Pluymers MB,
Bartels CC, et al. Tumour characteristics, survival and prognostic factors of hereditary breast
cancer from BRCA2-, BRCA1- and non-BRCA1/2 families as compared to sporadic breast
cancer cases. Eur J Cancer 2007; 43(5):867-876.
Brown JB, Adams ME. Patients as reliable reporters of medical care process. Recall of
ambulatory encounter events. Med Care 1992; 30(5):400-411.
Bryant H, Mah Z. Breast cancer screening attitudes and behaviors of rural and urban women.
Prev Med 1992; 21(4):405-418.
Budroni M, Cesaraccio R, Coviello V, Sechi O, Pirino D, Cossu A, et al. Role of BRCA2
mutation status on overall survival among breast cancer patients from Sardinia. BMC Cancer
2009; 9:62.
Burke JP, Power C, Gorey TF, Flanagan F, Kerin MJ, Kell MR. A comparative study of risk
factors and prognostic features between symptomatic and screen detected breast cancer. Eur J
Surg Oncol 2008; 34(2):149-153.
Burke W, Daly M, Garber J, Botkin J, Kahn MJ, Lynch P, et al. Recommendations for follow-
up care of individuals with an inherited predisposition to cancer. II. BRCA1 and BRCA2.
Cancer Genetics Studies Consortium. JAMA 1997; 277(12):997-1003.
Burrell HC, Sibbering DM, Wilson AR, Pinder SE, Evans AJ, Yeoman LJ, et al. Screening
interval breast cancers: mammographic features and prognosis factors. Radiology 1996;
199(3):811-817.
Buzdar AU. Advances in endocrine treatments for postmenopausal women with metastatic and
early breast cancer. Oncologist 2003; 8(4):335-341.
208
Campitelli MA, Chiarelli AM, Mirea L, Stewart L, Glendon G, Ritvo P, et al. Adherence to
breast and ovarian cancer screening recommendations for female relatives from the Ontario site
of the Breast Cancer Family Registry. Eur J Cancer Prev 2011; 20(6):492-500.
Canadian Breast Cancer Foundation - Ontario Region. The healthy breast: The structure of the
breast; 2013. Retrieved 19 July 2013 from:
http://www.cbcf.org/ontario/AboutBreastHealth/BreastAwareness/Pages/TheHealthyBreast.aspx
Canadian Cancer Society’s Advisory Committee on Cancer Statistics. Canadian Cancer
Statistics 2013. Toronto, ON: Canadian Cancer Society; 2013.
Canadian Partnership Against Cancer. Organized Breast Screening Programs in Canada: Report
on Program Performance in 2007 and 2008. Toronto, ON: Canadian Partnership Against
Cancer; 2013.
Canadian Task Force on Preventive Health Care, Tonelli M, Connor Gorber S, Joffres M,
Dickinson J, Singh H, et al. Recommendations on screening for breast cancer in average-risk
women aged 40-74 years. CMAJ 2011; 183(17):1991-2001.
Cancer Care Ontario. Ontario Breast Screening Program 2011 Report. Toronto, ON: Cancer
Care Ontario; 2013.
Cancer Care Ontario. Stage Capture: How do we capture stage data? 2012. Retrieved 10 April
2014 from: https://www.cancercare.on.ca/ocs/clinicalprogs/pathnlabmed/stageproj_prof/
Cancer Care Ontario. Ontario Breast Screening Program 20th Anniversary Report 1990-2010.
Toronto, ON: Cancer Care Ontario; 2010.
Cancer Quality Council of Ontario. Cancer System Quality Index 2014. Retrieved 10 July 2014
from: http://www.csqi.on.ca/
Caplan LS, Mandelson MT, Anderson LA, Health Maintenance Organization. Validity of self-
reported mammography: examining recall and covariates among older women in a Health
Maintenance Organization. Am J Epidemiol 2003a; 157(3):267-272.
Caplan LS, McQueen DV, Qualters JR, Leff M, Garrett C, Calonge N. Validity of women’s
self-reports of cancer screening test utilization in a managed care population. Cancer Epidemiol
Biomarkers Prev 2003b; 12(11 Pt 1):1182-1187.
Carey LA, Perou CM, Livasy CA, Dressler LG, Cowan D, Conway K, et al. Race, breast cancer
subtypes, and survival in the Carolina Breast Cancer Study. JAMA 2006; 295(21):2492-2502.
Carney PA, Miglioretti DL, Yankaskas BC, Kerlikowske K, Rosenberg R, Rutter CM, et al.
Individual and combined effects of age, breast density, and hormone replacement therapy use on
the accuracy of screening mammography. Ann Intern Med 2003; 138(3):168-175.
Champion VL, Menon U, McQuillen DH, Scott C. Validity of self-reported mammography in
low-income African-American women. Am J Prev Med 1998; 14(2):111–117.
Chart PL, Franssen E. Management of women at increased risk for breast cancer: preliminary
results from a new program. CMAJ 1997; 157(9):1235-1242.
209
Chiarelli AM, Prummel MV, Muradali D, Majpruz V, Horgan M, Carroll JC, et al.
Effectiveness of screening with annual magnetic resonance imaging and mammography: results
of the initial screen from the Ontario High Risk Breast Screening Program. J Clin Oncol 2014;
32(21):2224-2230.
Chiarelli AM, Edwards SA, Prummel MV, Muradali D, Majpruz V, Done SJ, et al. Digital
compared with screen-film mammography: performance measures in concurrent cohorts within
an organized breast screening program. Radiology 2013; 268(3):684-693.
Chiarelli AM, Edwards SA, Sheppard AJ, Mirea L, Chong N, Paszat L, et al. Favourable
prognostic factors of subsequent screen-detected breast cancers among women aged 50-69. Eur
J Cancer Prev 2012; 21(6):499-506.
Chiarelli AM, Majpruz V, Brown P, Thériault M, Shumak R, Mai V. The contribution of
clinical breast examination to the accuracy of breast screening. J Natl Cancer Inst 2009;
101(18):1236-1243.
Chiarelli AM, Kirsh VA, Klar NS, Shumak R, Jong R, Fishell E, et al. Influence of patterns of
hormone replacement therapy use and mammographic density on breast cancer detection.
Cancer Epidemiol Biomarkers Prev 2006a; 15(10):1856-1862.
Chiarelli AM, Halapy E, Nadalin V, Shumak R O’Malley F, Mai V. Performance measures
from 10 years of breast screening in the Ontario Breast Screening Program, 1990/91 to 2000.
Eur J Cancer Prev 2006b; 15(1):34-42.
Chiarelli AM, Marrett LD, Darlington GA. Pregnancy outcomes in females after treatment for
childhood cancer. Epidemiol 2000; 11(2):161-166.
Chiarelli AM, Marrett LD, Darlington G. Early menopause and infertility in females after
treatment for childhood cancer diagnosed in 1964-1988 in Ontario, Canada. Am J Epidemiol,
1999; 150(3):245-254.
Chen J, Pee D, Ayyagari R, Graubard B, Schairer C, Byrne C, et al. Projecting absolute invasive
breast cancer risk in white women with a model that includes mammographic density. J Natl
Cancer Inst 2006; 98(17):1215-1226.
Clarke P, Wheaton B. Addressing data sparseness in contextual population research: using
cluster analysis to create synthetic neighborhoods. Sociol Method Res 2007; 35(3):311-351.
Claus EB, Risch N, Thompson WD. Genetic analysis of breast cancer and steroid hormone
study. Am J Hum Genet 1991; 48(2):232-242.
Clayforth C, Fritschi L, McEvoy S, Byrne MJ, Wylie E, Threlfall T, et al. Assessing the
effectiveness of a mammography screening service. ANZ J Surg 2005; 75(8):631-636.
Colditz GA, Baer HJ, Tamimi RM. Breast cancer. In: Schottenfeld D, Fraumeni JF
(eds), Cancer epidemiology and prevention, 3rd ed. Cary, NC: Oxford University Press; 2006.
Collaborative Group on Hormonal Factors in Breast Cancer. Familial breast cancer:
collaborative reanalysis of individual data from 52 epidemiological studies including 58,209
women with breast cancer and 101,986 women without the disease. Lancet 2000;
358(9291):1389-1399.
210
Collins LC, Baer HJ, Tamimi RM, Connolly JL, Colditz GA, Schnitt SJ. Magnitude and
laterality of breast cancer risk according to histologic type of atypical hyperplasia: results from
the Nurses’ Health Study. Cancer 2007; 109(2):180-187.
Collins LC, Baer HJ, Tamimi RM, Connolly JL, Colditz GA, Schnitt SJ. The influence of
family history on breast cancer risk in women with biopsy-confirmed benign breast disease:
results from the Nurses’ Health Study. Cancer 2006; 107(6):1240-1247.
Cortesi L, Turchetti D, Marchi I, Fracca A, Canossi B, Rachele B, et al. Breast cancer screening
in women at increased risk according to different family histories: an update of the Modena
Study Group experience. BMC Cancer 2006; 6:210.
Costantino JP, Gail MH, Pee D, Anderson S, Redmond CK, Benichou J, et al. Validation studies
for models projecting the risk of invasive and total breast cancer incidece. J Natl Cancer Inst
1999; 91(18):1541-1548.
Craig BM, Quinn GP, Vadaparampil ST. Sensitivity of self-report mammography use in older
women. Am J Prev Med 2009; 37(5):441-444.
Cronin KA, Miglioretti DL, Krapcho M, Yu B, Geller BM, Carney PA, et al. Bias associated
with self-report of prior screening mammography. Cancer Epidemiol Biomarkers Prev 2009;
18(6):1699-1705.
Cummings SR. Tice JA, Bauer S, Browner WS, Cuzick J, Ziv E, et al. Prevention of breast
cancer in postmenopausal women: approaches to estimating and reducing risk. J Natl Cancer
Inst 2009; 101(6):384-398.
Davidson A, Chia S, Olson R, Nichol A, Speers C, Coldman AJ, et al. Stage, treatment and
outcomes for patients with breast cancer in British Columbia in 2002: a population-based cohort
study. CMAJ Open 2013; 1(4):e134-141.
Delgado-Rodríguez M, Llorca J. Bias. J Epidemiol Community Health 2004; 58(8):635-641.
D’Orsi CJ, Newell MS. Digital mammography: clinical implementation and clinical trials.
Semin Roentgenol 2007; 42(4):236-242.
Degnan D, Harris R, Ranney J, Quade D, Earp JA, Gonzalez J. Measuring the use of
mammography: two methods compared. Am J Public Health 1992; 82(10):1386-1388.
Dershaw DD. Status of mammography after the Digital Mammography Imaging Screening
Trial: digital versus film. Breast J 2006; 12(2):99-102.
Diefenbach MA, Miller SM, Daly MB. Specific worry about breast cancer predicts
mammography use in women at risk for breast and ovarian cancer. Health Psychol 1999;
18(5):532-536.
Diggle PJ, Heagerty P, Liang K, Zeger, SL. Analysis of Longitudinal Data, 2nd ed. Oxford, UK:
Oxford University Press; 2002.
211
Dillman DA, Smyth JD, Christian LM (eds). Internet, mail and mixed-mode surveys: The
Tailored Design Method, 3rd ed. Hoboken, NJ, USA. John Wiley and Sons, Inc.; 2008.
Dillon MF, Hill AD, Quinn CM, O’Doherty A, Crown J, Fleming FJ, et al. Surgical intervention
in screen-detected patients versus symptomatic patients with breast cancer. J Med Screen 2004;
11(3):130-134.
Dominguez FJ, Lawrence C, Halpern EF, Drohan B, Grinstein G, Black DM, et al. Accuracy of
self-reported personal history of cancer in an outpatient breast center. J Genet Couns 2007;
16(3):341-345.
Donenberg T, Lunn J, Curling D, Turnquest T, Krill-Jackson E, Royer R, et al. A high
prevalence of BRCA1 mutations among breast cancer patients from the Bahamas. Breast Cancer
Res Treat 2011; 125(2):591-596.
Dupont WD, Plummer WD. PS power and sample size program available for free on the
Internet. Controlled Clin Trials 1997; 18:274.
Dupont WD, Page DL. Risk factors for breast cancer in women with proliferative breast disease.
N Engl J Med 1985; 312(3):146-151.
Early Breast Cancer Trialists’ Collaborative Group. Effects of chemotherapy and hormonal
therapy for early breast cancer on recurrence and 15-year survival: an overview of the
randomised trials. Lancet 2005; 365(9472):1687-1717.
Easton D, Ford D, Peto J. Inherited susceptibility to breast cancer. Cancer Surv 1993; 18:95-
113.
Eccles DM, Evans DG, Mackay J. Guidelines for a genetic risk based approach to advising
women with a family history of breast cancer. J Med Genet 2000; 37(3):203-209.
Edge S, Byrd DR, Compton CC, Fritz AG, Greene FL, Trotti A (eds). AJCC Cancer Staging
Manual, 7th edn. New York, NY: Springer; 2010.
Egan KM, Newcomb PA, Longnecker MP, Trentham-Dietz A, Baron JA, Trichopoulos D, et al.
Jewish religion and risk of breast cancer. Lancet 1996; 347(9016):1645-1646.
Einbeigi Z, Bergman A, Kindblom LG, Martinsson T, Meis-Kindblom JM, Nordling M, et al. A
founder mutation of the BRCA1 gene in Western Sweden associated with a high incidence of
breast and ovarian cancer. Eur J Cancer 2001; 37(15):1904-1909.
Eisinger F, Alby N, Bremond A, Dauplat J, Espié M, Janiaud, et al. Recommendations for
medical management of hereditary breast and ovarian cancer: the French National Ad Hoc
Committee. Ann Oncol 1998; 9(9):939-950.
Ellis IO, Schnitt SJ, Sastre-Garau X, Bussolati G, Tavassoli Fa, Eusebi V, et al. Invasive breast
carcinoma. In: Tavassoli FA, Devilee P (eds). WHO Classification of Tumours Pathology and
Genetics of Tumours of the Breast and Female Genital Organs. Lyon; 2003.

212
Ellis IO, Galea M, Broughton N, Locker A, Blamey RW, Elston CW. Pathological prognostic
factors in breast cancer. II. Histological type. Relationship with survival in a large study with
long-term follow-up. Histopathology 1992; 20(6);479-489.
Elston CW, Ellis IO. Pathological prognostic factors in breast cancer. I. The value of
histological grade in breast cancer: experience from a large study with long-term follow-up.
Histopathology 1991; 19(5):403-410.
Elwood M. Critical appraisal of epidemiological studies and clinical trials, 3rd ed. New York,
NY: Oxford University Press; 2007.
Etzi S, Lane DS, Grimson R. The use of mammography vans by low-income women: the
accuracy of self-reports. Am J Public Health 1994; 84(1):107-109.
Figueiredo JC, Ennis M, Knight JA, McLaughlin JR, Hood N, O’Malley F, et al. Influence of
young age at diagnosis and family history of breast or ovarian cancer on breast cancer outcomes
in a population-based cohort study. Breast Cancer Res Treat 2007; 105(1):69-80.
Filippini SE, Vega A. Breast cancer genes: beyond BRCA1 and BRCA2. Front Biosci
(Landmark Ed) 2013; 18:1358-1372.
Fischer U, Hermann KP, Baum F. Digital mammography: current state and future aspects. Eur
Radiol 2006; 16(1):38-44.
Fishbein M, Ajzen I. Belief, attitude, intention and behavior: An introduction to theory and
research. Reading: Addison-Wesley. 1975.
Fitzgibbons PL, Page DL, Weaver D, Thor AD, Allred DC, Clark GM, et al. Prognostic factors
in breast cancer. College of American Pathologists Consensus Statement 1999. Arch Pathol Lab
Med 2000; 124(7):966-978.
Fitzgibbons PL, Henson DE, Hutter RV. Benign breast changes and the risk for subsequent
breast cancer: an update of the 1985 consensus statement. Cancer Committee of the College of
American Pathologists. Arch Pathol Lab Med 1998; 122(12):1053-1055.
Ford D, Easton DF, Stratton M, Narod S, Goldgar D, Devilee P, et al. Genetic heterogeneity and
penetrance analysis of the BRCA1 and BRCA2 genes in breast caner families. The Breast
Cancer Linkage Consortium. Am J Hum Genet 1998; 62(3):676-689.
Ford D, Easton DF, Peto J. Estimates of the gene frequency of BRCA1 and its contribution to
breast and ovarian cancer incidence. Am J Hum Genet 1995; 57(6):1457-1462.
Ford D, Easton DF, Bishop DT, Narod SA, Goldgar DE. Risks of cancer in BRCA1-mutation
carriers. Breast Cancer Linkage Consortium. Lancet 1994; 343(8899):692-695.
Freedman RA, Partridge AH. Management of breast cancer in very young women. Breast 2013;
22(Suppl 2):S176-179.
213
Frissell J, Glas U, Hellström L, Somell A. Randomized mammographic screening for breast
cancer in Stockholm. Design, first round resutls and comparisons. Breast Cancer Res Treat
1986; 8(1):45-54.
Fukutomi T, Kobayashi Y, Nanasawa T, Yamamoto H, Tsuda H. A clinicopathological analysis
of breast cancer in patients with a family history. Surg Today 1993; 23(10):849-854.
Fulton-Kehoe D, Burg MA, Lane DS. Are self-reported dates of mammograms accurate? Public
Health Rev 1992-1993; 20(3-4):233-240.
Gaffney DK, Brohet RM, Lewis CM, Holden JA, Buys SS, Neuhausen SL, et al. Response to
radiation therapy and prognosis in breast cancer patients with BRCA1 and BRCA2 mutations.
Radiother Oncol 1998; 47(2):129-136.
Gail MH, Brinton LA, Byar DP, Corle DK, Green SB, Schairer C, et al. Projecting
individualized probabilities of developing breast cancer for while females who are being
examined. J Natl Cancer Inst 1989; 81(24):1879-1886.
García-Closas M, Lubin JH. Power and sample size calculations in case-control studies of gene-
environment interactions: comments on different approaches. Am J Epidemiol 1999;
149(8):689-692.
Ghayad S, Cohen PA. Steroid receptors and associated transcriptional cofactors in predicting the
response to endocrine therapy. In: Walker RA, Thompson AM (eds). Prognostic and predictive
factors in breast cancer, 2nd ed. London, UK: Informa UK Ltd.; 2008.
Giannakeas V, Lubinski J, Gronwald J, Moller P, Armel S, Lynch HT, et al. Mammography
screening and the risk of breast cancer in BRCA1 and BRCA2 mutation carriers: a prospective
study. Breast Cancer Res Treat 2014; 147(1):113-118.
Goldfrank D, Chuai S, Bernstein JL, Ramon Y Cajal T, Lee JB, Alonso MC, et al. Effect of
mammography on breast cancer risk in women with mutations in BRCA1 and BRCA2. Cancer
Epidemiol Biomarkers Prev 2006; 15(11):2311-2313.
Goldschmidt RA, Victor TA. Lobular carcinoma in situ of the breast. Semin Surg Oncol 1996;
12(5):314-320.
Goodman SN, Berlin JA. The use of predicted confidence intervals when planning experiments
and the misuse of power when interpreting results. Ann Intern Med 1994; 121(3):200-206.
Goodwin PJ, Phillips KA, West DW, Ennis M, Hopper JL, John EM, et al. Breast cancer
prognosis in BRCA1 and BRCA2 mutation carriers: an International Prospective Breast Cancer
Family Registry population-based cohort study. J Clin Oncol 2012; 30(1):19-26.
Gordis L. Epidemiology, 5th ed. Philadelphia, PA: Elsevier Saunders; 2014.
Gordon NP, Hiatt RA, Lampert DI. Concordance of self-reported data and medical record audit
for six cancer screening procedures. J Natl Cancer Inst 1993; 85(7):566-570.
214
Greene FL, Page DL, Fleming ID, Fritz AG, Balch CM, Haller DG, et al. (eds). AJCC Cancer
Staging Manual, 6th edn. New York, NY: Springer; 2002.
Gui GP, Hogben RK, Walsh G, A’Hern R, Eeles R. The incidence of breast cancer from
screening women according to predicted family history risk: Does annual clinical examination
add to mammography? Eur J Cancer 2001; 37(13):1668-1673.
Gurmankin Levy A, Shea J, Williams SV, Quistberg A, Armstrong K. Measuring perceptions of
breast cancer risk. Cancer Epidemiol Biomarkers Prev 2006; 15(10):1893-1898.
Hackshaw AK, Paul EA. Breast self-examination and death from breast cancer: a meta-analysis.
Br J Cancer 2003; 88(7):1047-1053.
Hailey BJ. Family history of breast cancer and screening behavior: an inverted U-shaped curve?
Med Hypotheses 1991; 36(4):397-403.
Halapy EE, Chiarelli AM, Klar N, Knight JA. Accuracy of breast screening among women with
and without a family history of breast and/or ovarian cancer. Breast Cancer Res Treat 2005;
90(30):299-305.
Halapy EE, Chiarelli AM, Klar N, Knight J. Breast cancer screening outcmes in women with
and without a family history of breast and/or ovarian cancer. J Med Screen 2004; 11(1):32-38.
Hammond ME, Hayes DF, Dowsett M, Allred DC, Hagerty KL, Badve S, et al. American
Society of Clinical Oncology/College of American Pathologists guideline recommendations for
immunohistochemical testing of estrogen and progesterone receptors in breast cancer
(unabridged version). Arch Pathol Lab Med 2010; 134(7):e48-72.
Hankinson S, Tamimi R, Hunter D. Breast cancer. In: Adami HO, Hunter D, Trichopoulos
(eds). Textbook of Cancer Epidemiology, 2nd ed. New York, NY: Oxford University Press;
2008.
Hanley JA, Negassa A, Edwardes MD, Forrester JE. Statistical analysis of correlated data using
generalized estimating equations: an orientation. Am J Epidemiol 2003; 157(4):364-375.
Hanson K, Montgomery P, Bakker D, Conlon M. Factors influencing mammography
participation in Canada: an integrative review of the literature. Curr Oncol 2009; 16(5):65-75.
Harms SE, Flamig DP, Hesley KL, Meiches, MD, Jensen RA, Evans WP, et al. MR imaging of
the breast with rotating delivery of excitation off resonsance: clinical experience with pathologic
correlation. Radiology 1993; 187(2):493-501.
Hartmann LC, Sellers TA, Frost MH, Lingle WL, Degnim AC, Ghosh K, et al. Benign breast
disease and the risk of breast cancer. N Engl J Med 2005; 353(3):229-237.
Health Canada. Radiation Protection and Quality Standards in Mammography: Safety
Procedures for the Installation, Use and Control of Mammographic X-ray Equipment - Safety
Code 36. Ottawa, ON: Health Canada; 2013.
215
Heeringa SG, West BT, Berglund PA. Applied Survey Data Analysis. Boca Raton, FL:
Chapman & Hall, CRC Press; 2010.
Hendrick RE, Pisano ED, Averbukh A, Moran C, Berns EA, Yaffe MJ, et al. Comparison of
acquisition parameters and breast dose in digital mammography and screen-film mammography
in the American College of Radiology Imaging Network digital mammographic imaging
screening trial. AJR Am J Roentgenol 2010; 194(2):362-369.
Herman CR, Gill HK, Eng J, Fajardo LL. Screening for preclinical disease: test and disease
characteristics. AJR Am J Roentgenol 2002; 179(4):825-831.
Hiatt RA, Pérez-Stable EJ, Quesenberry C Jr, Sabogal F, Otero-Sabogal R, McPhee SJ.
Agreement between self-reported early cancer detection practices and medical audits among
Hispanic and non-Hispanic white health plan members in northern California. Prev Med 1995;
24(3):278-285.
Higgins JPT, Green S. Chapter 9: Analysing data and undertaking meta-analyses. Cochrane
Handbook for Systematic Reviews of Interventions, Version 5.1.0. West Sussex, England:
Wiley; 2011.
Holford TR, Cronin KA, Mariotto AB, Feuer EJ. Changing patterns in breast cancer incidence
trends. J Natl Cancer Inst Monogr 2006; 36:19-25.
Horsman D, Wilson BJ, Avard D, Meschino WS, Kim Sing C, Plante M, et al. Clinical
management recommendations for surveillance and risk-reduction strategies for hereditary
breast and ovarian cancer among individuals carrying a deleterious BRCA1 or BRCA2
mutation. J Obstet and Gynaecol Can 2007; 29(1):45-60.
Howard M, Agarwal G, Lytwyn A. Accuracy of self-reports of Pap and mammography
screening compared to medical records: a meta-analysis. Cancer Causes Control 2009; 20(1):1-
13.
Howlader N, Altekruse SF, Li CI, Chen VW, Clarke CA, Ries LA, et al. US incidence of breast
cancer subtypes defined by joint hormone receptor and HER2 status. J Natl Cancer Inst 2014;
106(5), doi:10.1093/jnci/dju055.
Hox JJ. Multilevel modeling: when and why? In Balderjahn I, Mathar R, Schader M (eds).
Classification, data analysis, and data highways. New York: Springer Verlag; 1998.
Hughes KS, Roche C, Campbell CT, Siegel N, Salisbury L, Chekos A, et al. Prevalence of
family history of breast and ovarian cancer in a single primary care practice using a self-
administered questionnaire. Breast J 2003; 9(1):19-25.
Humphrey LL, Helfand M, Chan BK, Woolf SH. Breast cancer screening: a summary of the
evidence for the U.S. Preventive Services Task Force. Ann Intern Med 2002; 137(5 Part 1):347-
360.
Ikeda DM, Andersson I, Wattsgård C, Janzon L, Linell F. Interval carcinomas in the Malmö
Mammographic Screening Trial: radiographic appearance and prognostic considerations. AJR
Am J Roentgenol 1992; 159(2):287-294.
216
Independent UK Panel on Breast Cancer Screening. The benefits and harms of breast cancer
screening: an independent review. Lancet 2012; 380(9855):1778-1786.
Isaacs C, Peshkin BN, Schwartz M, Demarco TA, Main D, Lerman C. Breast and ovarian
cancer screening practices in healthy women with a strong family history of breast or ovarian
cancer. Breast Cancer Res Treat 2002; 71(2):103-112.
Israeli D, Tartter PI, Brower ST, Mizrachy B, Bratton J. The significance of family history for
patients with carcinoma of the breast. J Am Coll Surg 1994; 179(1):29-32.
Jacobi CE, de Bock GH, Siegerink B, van Asperen CJ. Differences and similarities in breast
caner risk assessment models in clinical practice: which model to choose? Breast Cancer Res
Treat 2009; 115(2):381-390.
Janz NK, Becker MH. The Health Belief Model: a decade later. Health Educ Q 1984; 11(1):1-
47.
Jatoi I, Hilsenbeck SG, Clark GM, Osborne CK. Significance of axillary lymph node metastasis
in primary breast cancer. J Clin Oncol 1999; 17(8):2334-2340.
Jobsen JJ, Meerwaldt JH, van der Palen J. Family history in breast cancer is not a prognostic
factor? Breast 2000; 9(2):83-87.
John EM, Hopper JL, Beck JC, Knight JA, Neuhausen SL, Senie RT, et al. The Breast Cancer
Family Registry: an infrastructure for cooperative multinational, interdisciplinary and
translational studies of the genetic epidemiology of breast cancer. Breast Cancer Res 2004;
6(4):R375-389.
Jonker MA, Jacobi CE, Hoogendoorn WE, Nagelkerke NJ, de Bock GH, van Houwelingen JC.
Modeling familial clustered breast cancer using published data. Cancer Epidemiol Biomarkers
Prev 2003; 12(12):1479-1485.
Kash KM, Holland JC, Halper MS, Miller DG. Psychological distress and surveillance
behaviors of women with a family history of breast cancer. J Natl Cancer Inst 1992; 84(1):24-
30.
Katapodi MC, Lee KA, Facione NC, Dodd MJ. Predictors of perceived breast cancer risk and
the relation between perceived risk and breast cancer screening: a meta-analytic review. Prev
Med 2004; 38(4):388-402.
Kavanagh AM, Mitchell H, Giles GG. Hormone replacement therapy and accuracy of
mammographic screening. Lancet 2000; 355(9200):270-274.
Kelly CM, Buzdar AU. Using multiple targeted therapies in oncology: considerations for use,
and progress to date in breast cancer. Drugs 2013; 73(6):505-515.
217
Kerlikowske K, Carney PA, Geller B, Mandelson MT, Taplin SH, Malvin K, et al. Performance
of screening mammography among women with and without a first-degree relative with breast
cancer. Ann Intern Med 2000; 133(11):855-863.
Kerlikowske K, Grady D, Barclay J, Sickles EA, Ernster V. Effect of age, breast density, and
family history on the sensitivity of first screening mammography. JAMA 1996; 276(1):33-38.
Kerlikowske K, Grady D, Rubin SM, Sandrock C, Ernster VL. Efficacy of screening
mammography. A meta-analysis. JAMA 1995; 273(2):149-154.
Khan KS. Kunz R, Kleijnen J, Antes G. Systematic reviews to support evidence-based
medicine: how to review and apply findings on healthcare research. London: Royal Society of
Medicine Press, Lt.; 2003.
Knight JA, Sutherland HJ, Glendon G, Boyd NF, Andrulis IL, Ontario Cancer Genetics
Network. Characteristics associated with participation at various stages at the Ontario site of the
cooperative family registry for breast cancer studies. Ann Epidemiol 2002; 12(1):27-33.
Kriege M, Seynaeve C, Meijers-Heijboer H, Collee JM, Menke-Pluymers MB, Bartels CC, et al.
Distant disease-free interval, site of first relapse and post-relapse survival in BRCA1- and
BRCA2-associated compared to sporadic breast cancer patients. Breast Cancer Res Treat 2008;
111(2):303-311.
Kristman V, Manno M, Côté P. Loss to follow-up in cohort studies: how much is too much? Eur
J Epidemiol 2004; 19(8):751-760.
Kolb TM, Lichy J, Newhouse JH. Occult cancer in women with dense breasts: detection with
screening US: diagnostic yield and tumor characteristics. Radiology 1998; 207(1):191-199.
Kuhl CK. Current status of breast MR imaging. Part 2. Clinical applications. Radiology 2007;
244(3):672-691.
Kuhl CK, Schrading S, Leutner CC, Morakkabati-Spitz N, Wardelmann E, Fimmers R, et al.
Mammography, breast ultrasound, and magnetic resonsance imaging for surveillance of women
at high familial risk for breast cancer. J Clin Oncol 2005; 23(33):8469-8476.
Lakhani SR. In-situ lobular neoplasia: time for an awakening. Lancet 2003; 361(9352):96.
Lalloo F, Evans DG. Familial breast cancer. Clin Genet 2012; 82(2):105-113.
Larouche G, Bouchard K, Chiquette J, Desbiens C, Simard J, Dorval M. Self-reported
mammography use following BRCA1/2 genetic testing may be overestimated. Fam Cancer
2012; 11(1):27-32.
Lawrence VA, De Moor C, Glenn ME. Systematic differences in validity of self-reported
mammography behavior: A problem for intergroup comparisons? Prev Med 1999; 29(6 Pt
1):577-580.
218
Leach MO, Boggis CR, Dixon AK, Easton DF, Eeles RA, Evans DG, et al. Screening with
magnetic resonsance imaging and mammography of a UK population at high familial risk of
breast cancer: a prospective multicentre cohort study (MARIBS). Lancet 2005; 365(9473):1769-
1778.
Lee AH, Pinder SE, Macmillan RD, Mitchell M, Ellis IO, Elston CW, et al. Prognostic value of
lymphovascular invasion in women with lymph node negative invasive breast carcinoma. Eur J
Cancer 2006; 42(3):357-362.
Lee AJ, Cunningham AP, Kuchenbaecker KB, Mavaddat N, Easton DF, Antoniou AC, et al.
BOADICEA breast cancer risk prediction model: updates to cancer incidences, tumor pathology
and web interface. Br J Cancer 2014: 110(2):535-545.
Lemon SC, Zapka JG, Clemow L, Estabrook B, Fletcher K. Mammography screening after
breast cancer diagnosis in a first degree relative: age group differences (United States). Cancer
Causes Control 2006; 17(18):1053-1065.
Lerman C, Hughes C, Croyle RT, Main D, Durham C, Snydr C, et al. Prophylactic surgery
decisions and surveillance practices one year following BRCA1/2 testing. Prev Med 2000;
31(1):75-80.
Levanthal H, Kelly K, Levanthal EA. Population risk, actual risk, pereived risk, and cancer
control: a discussion. J Natl Cancer Inst Monogr 1999; 25:81-85.
Li FP, Fraumeni JF Jr, Mulvihill JJ, Blattner WA, Dreyfus MG, Tucker MA, et al. A cancer
family syndrome in twenty-four kindreds. Cancer Res 1988; 48(18):5358-5362.
Lipkus IM, Kuchibhatla M, McBride CM, Bosworth HB, Pollak KI, Siegler IC, et al.
Relationships among breast cancer perceived absolute risk, comparative risk, and worries.
Cancer Epidemiol Biomarkers Prev 2000; 9(9):973-975.
Liu G, Liang KY. Sample size calculations for studies with correlated observations. Biometrics
1997; 53(3):937-947.
Lubin JH, Gail MH. On power and sample size for studying features of the relative odds of
disease. Am J Epidemiol 1990; 131(3):552-566.
Maas CJ, Hox JJ. Sufficient sample sizes for multilevel modeling. Methodol 2005; 1(3):86-92.
Maas CJ, Hox JJ. Robustness issues in multilevel regression analysis. Stat Neerl 2004;
58(2):127-137.
Madlensky L, Vierkant RA, Vachon CM, Pankratz VS, Cerhan JR, Vadaparampil ST, et al.
Preventive health behaviours and familial breast cancer. Cancer Epidemiol Biomarkers Prev
2005; 14(10):2340-2345.
Mah Z, Bryant HE. The role of past mammography and future intentions in screening
mammography usage. Cancer Detect Prev 1997; 21(3):213-220.
219
Mai PL, Garceau AO, Graubard BI, Dunn M, McNeel TS, Gonsalvez L, et al. Confirmation of
family cancer history reported in a population-based survey. J Natl Cancer Inst 2011;
103(10):788-797.
Mai V, Sullivan T, Chiarelli AM. Breast cancer screening program in Canada: successes and
challenges. Salud Publica Mex 2009; 51(Suppl 2):s228-235.
Malone KE, Daling JR, Doody DR, O’Brien C, Resler A, Ostrander EA, et al. Family history of
breast cancer in relation to tumor characteristics and mortality in a population-based study of
young women with invasive breast cancer. Cancer Epidemiol Biomarkers Prev 2011;
20(12):2560-2571.
Mandelson MT, Oestreicher N, Porter PL, White D, Finder CA, Taplin SH, et al. Breast density
as a predictor of mammographic detection: comparison of interval- and screen-detected cancers.
J Natl Cancer Inst 2000; 92(13):1081-1087.
Marcus JN, Watson P, Page DL, Narod SA, Lenoir GM, Tonin P, et al. Hereditary breast
cancer: pathobiology, prognosis, and BRCA1 and BRCA2 gene linkage. Cancer 1996;
77(4):697-709.
Margolin S, Johansson H, Rutqvist LE, Lindblom A, Forander T. Family history, and impact on
clinical presentation and prognosis, in a population-based breast cancer cohort from the
Stockholm County. Fam Cancer 2006; 5(4):309-321.
Marmot MG, Altman DG, Cameron DA, Dewar JA, Thompson SG, Wilcox M. The benefits and
harms of breast cancer screening: an independent review. Br J Cancer 2013; 108(11):2205-2240.
Mavaddat N, Barrowdale D, Andrulis IL, Domchek SM, Eccles D, Nevanlinna H, et al.
Pathology of breast and ovarian cancers among BRCA1 and BRCA2 mutation carriers: results
from the Consortium of Investigators of Modifiers of BRCA1/2 (CIMBA). Cancer Epidemiol
Biomarkers Prev 2012; 21(1):134-147.
Maxwell CJ, Bancej CM, Snider J. Predictors of mammography use among Canadian women
aged 50-69: findings from the 1996/97 National Population Health Survey. CMAJ 2001;
164(3):329-334.
McCambridge J, Witton J, Elbourne DR. Systematic review of the Hawthorne effect: new
concepts are needed to study research participation effects. J Clin Epidemiol 2014; 67(3):267-
277.
McCaul KD, Branstetter AD, Schroeder DM, Glasgow RE. What is the relationship between
breast cancer risk and mammography screening? A meta-analytic review. Health Psychol 1996;
15(6):423-429.
McDonald JT, Sherman A. Determinants of mammography use in rural and urban regions of
Canada. Can J Rural Med 2010; 15(2):52-60.
McGovern PG, Lurie N, Margolis KL, Slater JS. Accuracy of self-report of mammography and
Pap smear in a low-income urban population. Am J Prev Med 1998; 14(3):201-208.
220
McLaughlin JR, Kreiger N, Marrett LD, Holowaty EJ. Cancer incidence registration and trends
in Ontario. Eur J Cancer 1991; 27(11):1520-1524.
Mehta TS, Raza S, Baum JK. Use of Doppler ultrasound in the evaluation of breast carcinoma.
Semin Ultrasound CT MR 2000; 21(4):297-307.
Meiser B, Butow P, Barratt A, Friedlander M, Kirk J, Gaff C, et al. Breast cancer screening
uptake in women at increased risk of developing hereditary breast cancer. Breast Cancer Res
Treat 2000; 59(2): 101-111.
Metcalfe K, Lynch HT, Ghadirian P, Tung N, Olivotto I, Warner E, et al. Contralateral breast
cancer in BRCA1 and BRCA2 mutation carriers. J Clin Oncol 2004; 22(12):2328-2335.
Mickey RM, Greenland S. The impact of confounder selection criteria on effect estimation. Am
J Epidemiol 1989; 129(1):125-137.
Miller AB, To T, Baines CJ, Wall C. The Canadian National Breast Screening Study-1: breast
cancer mortality after 11 to 16 years of follow-up. A randomized screening trial of
mammography in women age 40 to 49 years. Ann Intern Med 2002; 137(5 Part 1):305-312.
Miller AB, To T, Baines CJ, Wall C. Canadian National Breast Screening Study-2: 13-year
results of a randomized trial in women aged 50-59 years. J Natl Cancer Inst 2000; 92(18):1490-
1499.
Miller AB, Baines CJ, To T, Wall C. Canadian National Breast Screening Study: 1. Breast
cancer detection and death rates among women aged 40 to 49 years. CMAJ 1992a;
147(10):1459-1476.
Miller AB, Baines CJ, To T, Wall C. Canadian National Breast Screening Study: 2. Breast
cancer detection and death rates among women aged 50 to 59 years. CMAJ 1992b:
147(10):1477-1488.
Millikan RC, Player JS, Decotret AR, Tse CK, Keku T. Polymorphisms in DNA repair genes,
medical exposure to ionzing radiation, and breast cancer risk. Cancer Epidemiol Biomarkers
Prev 2005; 14(10):2326-2334.
Mohammed SN, Smith P, Hodgson SV, Fentiman IS, Miles DW, Barnes DM, et al. Family
history and survival in premenopausal breast cancer. Br J Cancer 1998; 77(12):2252-2256.
Molino A, Giovannini M, Pedersini R, Frisinghelli M, Micciolo R, Mandarà M, et al.
Correlations between family history and cancer characteristics in 2256 breast cancer patients. Br
J Cancer 2004; 91(1):96-98.
Møller P, Reis MM, Evans G Vasen H, Haites N, Anderson E, et al. Efficacy of early diagnosis
and treatment in women with a family history of breast cancer. European Familial Breast Cancer
Collaborative Group. Dis Markers 1999a; 15(1-3):179-186.
221
Møller P, Evans G, Haites N, Vasen H, Reis MM, Anderson E, et al. Guidelines for follow-up of
women at high risk for inherited breast cancer: consensus statement from the Biomed 2
Demonstration Programme on Inherited Breast Cancer. Dis Markers 1999b; 15(1-3):207-211.
Møller P, Maehle L, Heimdal K, Dørum A, Apold J, Engebretsen LF, et al. Prospective findings
in breast cancer kindreds: annual incidence rates according to age, stage at diagnosis, mean
sojourn time, and incidence rates for contralateral cancer. Breast 1998; 7(1):55-59.
Moran A, O’Hara C, Khan S, Shack L, Woodward E, Maher ER, et al. Risk of cancer other than
breast or ovarian in individuals with BRCA1 and BRCA2 mutations. Fam Cancer 2012;
11(2):235-242.
Morel G. Logistic regression under complex survey designs. Surv Method 1989; 15:203-222.
Morrison BJ. Screening for breast cancer. In: Canadian Task Force on the Periodic Health
Examination. The Canadian guide to clinical preventive health care. Ottawa: Canada;
Communications Group; 1994.
Murff HJ, Spigel DR, Syngal S. Does this patient have a family history of cancer? An evidence-
based analysis of the accuracy of family cancer history. JAMA 2004; 292(12):1480-1489.
Nagtegaal ID, Duffy SW. Reduction in rate of node metastases with breast screening:
consistency of association with tumor size. Breast Cancer Res Treat 2013; 137(3):653-663.
Narod SA, Lubinski J, Ghadirian P, Lynch HT, Moller P, Foulkes WD, et al. Screening
mammography and risk of breast cancer in BRCA1 and BRCA2 mutation carriers: a case-
control study. Lancet Oncol 2006; 7(5):402-406.
Narod SA. Modifiers of risk of hereditary breast and ovarian cancer. Nat Rev Cancer 2002;
2(2):113-123.
Nassar H, Wallis T, Andea A, Dey J, Adsay V, Visscher D. Clinicopathologic analysis of
invasive micropapillary differentiation in breast carcinoma. Mod Pathol 2001;14(9):836-841.
National Institute for Health and Care Excellence. Familial breast cancer: classification and care
of people at risk of familial breast cancer and management of breast cancer and related risks in
people with a family history of breast cancer. NICE clinical guideline 164. 2013. Accessed 20
August 2013 from http://guidance.nice.org.uk/CG164.
Nelson HD, Tyne K, Naik A, Bougatsos C, Chan BK, Humphrey L, et al. Screening for breast
cancer: an update for the U.S. Preventive Services Task Force. Ann Intern Med 2009;
151(10):w237-242.
Newell SA, Girgis A, Sanson-Fisher RW, Savolainen NJ. The accuracy of self-reported health
behaviors and risk factors relating to cancer and cardiovascular disease in the general
population: a critical review. Am J Prev Med 1999; 17(3):211-229.
Norman SA, Localio AR, Zhou L, Bernstein L, Coates RJ, Flagg EW, et al. Validation of self-
reported screening mammography histories among women with and without breast cancer. Am J
Epidemiol 2003; 158(3):264-271.
222
O’Brien KM, Cole SR, Tse CK, Perou CM, Carey LA, Foulkes WD, et al. Intrinsic breast tumor
subtypes, race, and long-term survival in the Carolina Breast Cancer Study. Clin Cancer Res
2010; 16(24):6100-6110.
Odueyungbo A, Browne D, Akhtar-Danesh N, Thabane L. Comparison of generalized
estimating equations and quadratic inference functions using data from the National
Longitudinal Survey of Children and Youth (NLSCY) database. BMC Med Res Methodol 2008;
8:28.
Onitilo AA, Engel JM, Greenlee RT, Mukesh BN. Breast cancer subtypes based on ER/PR and
Her2 expression: comparison of clinicopathologic features and survival. Clin Med Res 2009;
7(1-2):4-13.
Orel SG, Schnall MD, LiVolsi VA, Troupin RH. Suspicious breast leions: MR imaging with
radiologic-pathologic correlation. Radiol 1994; 190(2):485-493.
Pace LE, Keating NL. A systematic assessment of benefits ad risks to guide breast cancer
screening decisions. JAMA 2014; 311(13):1327-1335.
Page DL, Schuyler PA, Dupont WD, Jensen RA, Plummer WD Jr, Simpson JF. Atypical lobular
hyperplasia as a unilateral predictor of breast cancer risk: a retrospective cohort study. Lancet
2003; 361(9352):125-129.
Page DL, Dupont WD, Rogers LW, Jensen RA, Schuyler PA. Continued local recurrence of
carcinoma 15-25 years after a diagnosis of low grade ductal carcinoma in situ of the breast
treated only by biopsy. Cancer 1995; 76(7):1197-1200.
Page DL, Kidd TE Jr, Dupont WD, Simpson JF, Rogers LW. Lobular neoplasia of the breast:
higher risk for subsequent invasive cancer predicted by more extensive disease. Hum Pathol
1991; 22(12):1232-1239.
Parikh-Patel A, Allen M, Wright WE, California Teachers Study Steering Committee.
Validation of self-reported cancers in the California Teachers Study. Am J Epidemiol 2003;
157(6):539-545.
Parmigiani G, Berry D, Aguilar O. Determining carrier probabilities for breast cancer-
susceptibility genes BRCA1 and BRCA2. Am J Hum Genet 1998; 62(1):145-158.
Paskett ED, Tatum CM, Mack DW, Hoen H, Case LD, Velez R. Validation of self-reported
breast and cervical cancer screening tests among low-income minority women. Cancer
Epidemiol Biomarkers Prev 1996; 5(9):721-726.
Peelen T, van Vliet M, Petrij-Bosch A, Mieremet R, Szabo C, van den Ouweland AM, et al. A
high proportion of novel mutations in BRCA1 with strong founder effects among Dutch and
Belgian hereditary breast and ovarian cancer families. Am J Hum Genet 1997; 60(5):1041-1049.
223
Pereira H, Pinder SE, Sibbering DM, Galea MH, Elston CW, Blamey RW, et al. Pathological
prognostic factors in breast cancer. IV: Should you be a typer or a grader? A comparative study
of two histological prognostic features in operable breast carcinoma. Histopathology
1995;27(3):219-226.
Peto J, Collins N, Barfoot R, Seal S, Warren W, Rahman N, et al. Prevalence of BRCA1 and
BRCA2 gene mutations in patients with early-onset breast cancer. J Natl Cancer Inst 1999;
91(11):943-999.
Pharoah PD, Day NE, Duffy S, Easton DF, Ponder BA. Family history and the risk of breast
cancer: a systematic review and meta-analysis. Int J Cancer 1997; 71(5):800-809.
Phipps AI, Buist DS, Malone KE, Barlow WE, Porter PL, Kerlikowske K, et al. Family history
of breast cancer in first-degree relatives and triple-negative breast cancer risk. Breast Cancer
Res Treat 2011; 126(3):671-678.
Pijpe A, Andrieu N, Easton DF, Kesminiene A, Cardis E, Noquès C, et al. Exposure to
diagnostic radiation and risk of breast cancer among carriers of BRCA1/2 mtuations:
retrospective cohort study (GENE-RAD-RISK). BMJ 2012; 345:e5660.
Pijpe A, Mulder RL, Manders P, van Leeuwen FE, Rookus MA. Validation study suggested no
differential misclassification of self-reported mammography history in BRCA1/2 mutation
carriers. J Clin Oncol 2011; 64(12):1434-1443.
Pinder SE, Harris GC, Elston CW. The role of the pathologist in assessing prognostic factors for
breast cancer. In: Walker RA, Thompson AM (eds). Prognostic and predictive factors in breast
cancer, 2nd ed. London, UK: Informa Healthcare; 2008.
Pisano ED, Gatsonis C, Hendrick E, Yaffe M, Baum JK, Acharyya S, et al. Diagnostic
performance of digital versus film mammography for breast-cancer screening. N Engl J Med
2005; 353(17):1773-1783.
Porter DE, Cohen BB, Wallace MR, Smyth E, Chetty U, Dixon JM, et al. Breast cancer
incidence, penetrance and survival in probable carriers of BRCA1 gene mutation families linked
to BRCA1 on chromosome 17q12-21. Br J Surg 1994; 81(10):1512-1515.
Powell SN, Kachnic LA. Roles of BRCA1 and BRCA2 in homologous recombination, DNA
replication fidelity and the cellular response to ionizing radiation. Oncogene 2003; 22(37):5784-
5791.
Preston DL, Mattsson A, Holmberg E, Shore R, Hildreth NG, Boice JD, Jr. Radiation effects on
breast cancer risk: a pooled analysis of eight cohorts. Radiat Res 2002; 158(2):220-235.
Price MA, Butow PN, Charles M, Bullen T, Meiser B, McKinley JM, et al. Predictors of breast
cancer screening behavior in women with a strong family history of the disease. Breast Cancer
Res Treat 2010; 124(2):509-519.
Public Health Agency of Canada. Organized Breast Cancer Screening Programs in Canada:
Report on Program Performance in 2005 and 2006. Ottawa: Canada: Public Health Agency of
Canada; 2011.
224
Ragage F, Debled M, MacGrogan G, Brouste V, Desrousseaux M, Soubeyran I, et al. Is it useful
to detect lymphovascular invasion in lymph node-positive patients with primary operable breast
cancer? Cancer 2010; 116(13):3093-3101.
Rakha EA, Martin S, Lee AH, Morgan D, Pharoah PD, Hodi Z, et al. The prognostic
significance of lymphovascular invasion in invasive breast carcinoma. Cancer 2012;
118(15):3670-3680.
Rakha EA, El-Sayed ME, Lee AH, Elston CW, Grainge MJ, Hodi Z, et al. Prognostic
significance of Nottingham Histologic Grade in invasive breast carcinoma. J Clin Oncol 2008;
26(19):3153-3158.
Rakowski W, Wyn R, Breen N, Meissner H, Clark MA. Prevalence and correlates of recent and
repeat mammography among California women ages 55-79. Cancer Epidemiol 2010; 34(2):168-
177.
Rampaul RS, Pinder SE, Elston CW, Ellis IO, Nottingham Breast Team. Prognostic and
predictive factors in primary breast cancer and their role in patient management: The
Nottingham Breast Team. Eur J Surg Oncol 2001; 27(3):229-238.
Ramsey SD, Yoon P, Moonesinghe R, Khoury MJ. Population-based study of the prevalence of
family history of cancer: implications for cancer screening and prevention. Genet Med 2006;
8(9):571-575.
Randall D, Morrell S, Taylor R, Hung WT. Annual or biennial mammography screening for
women at a higher risk with a family history of breast cancer: prognostic indicators of screen-
detected cancers in New South Wales, Australia. Cancer Causes Control 2009; 20(5):559-566.
Rauscher GH, Johnson TP, Cho YI, Walk JA. Accuracy of self-reported cancer-screening
histories: a meta-analysis. Cancer Epidemiol Biomarkers Prev 2008; 17(4):748-757.
Ringash J, Canadian Task Force on Preventive Health Care. Preventive health care, 2001
update: screening mammography among women aged 40-49 years at average risk of breast
cancer. CMAJ 2001; 164(4):469-476.
Risch HA, McLaughlin JR, Cole DE, Rosen B, Bradley L, Fan I, et al. Population BRCA1 and
BRCA2 mutation frequencies and cancer penetrances: a kin-cohort study in Ontario, Canada. J
Natl Cancer Inst 2006; 98(23):1694-1706.
Ritvo P, Edwards SA, Glendon G, Mirea L, Knight JA, Andrulis IL, Chiarelli AM. Beliefs
about optimal age and screening frequency predict breast screening adherence in a prospective
study of female relatives from the Ontario site of the Breast Cancer Family Registry 2012;
12:518.
Rivera S, Vernon SW, Tiro JA, Coan S, Del Junco D, Chan W, et al. Test-retest
reliability of self-reported mammography in women veterans. Prev Med 2006; 42(4):320-326.
Roa BB, Boyd AA, Volcik K, Richards CS. Ashkenazi Jewish population frequencies for
common mutations in BRCA1 and BRCA2. Nat Genet 1996; 14(2):185-187.
Roberts MM, Alexander FE, Anderson TJ, Chetty U, Donnan PT, Forrest P, et al. Edinburgh
trial of screening for breast cancer: mortality at seven years. Lancet 1990; 335(8684):241-246.
225
Robson ME, Chappuis PO, Satagopan J, Wong N, Boyd J, Goffin JR, et al. A combined analysis
of outcome following breast cancer: differences in survival based on BRCA1/BRCA2 mutation
status and administration of adjuvant treatment. Breast Cancer Res Treat 2004; 6(1):R8-17.
Rogers RW. A protection motivation theory of fear appears and attitude change. J Psychol 1975;
91(1):93-114.
Roethlisberger FJ, Dickson WJ. Management and the worker. Cambridge, MA: Harvard
University Press; 1939.
Ronckers CM, Erdmann CA, Land CE. Radiation and breast cancer: a review of current
evidence. Breast Cancer Res 2005; 7(1):21-32.
Rosenberg RD, Hunt WC, Williamson MR, Gililand FD, Wiest PW, Kelsey CA, et al. Effects of
age, breast density, ethnicity, and estrogen replacement therapy on screening mammographic
sensitivity and cancer stage at diagnosis: review of 183,134 screening mammograms in
Albuquerque, New Mexico. Radiology 1998; 209(2):511-518.
Rosenstock IM. Historical origins of the health belief model. Health Educ Behav 1974; 2(4):
328-335.
Rothman KJ, Greenland S, Lash TL. Modern epidemiology, 3rd ed. Philadelphia, PA: Wolters
Kluwer Health/Lippincott Williams & Wilkins; 2008.
Ruder AM, Moodie PF, Nelson NA, Choi NW. Does family history of breast cancer improve
survival among patients with breast cancer? Am J Obstet Gynecol 1988; 158(4):963-968.
Russo A, Calò V, Bruno L, Rizzo S, Bazan V, Di Fede G. Hereditary ovarian cancer. Crit Rev
Oncol Hematol 2009; 69(1):28-44.
Russo A, Herd-Smith A, Gestri D, Bianchi S, Vezzosi V, Rosselli Del Turco M, et al. Does
family history influence survival in breast cancer cases? Int J Cancer 2002; 99(3):427-430.
Russo J, Russo IH. Mechanisms involved in carcinogenesis of the breast. In: JR Pasqualini, ed.
Breast cancer: Prognosis, treatment, and prevention. New York, NY: Marcel Dekker, Inc.; 2002.
SAS Institute. SAS 9.2 Users Guide, 2nd ed. SAS Institute; 2010.
Sala E, Warren R, McCann J, Duffy S, Day N, Luben R. Mammographic parenchymal patterns
and mode of detection: implications for the breast screening programme. J Med Screen 1998;
5(4):207-212.
Sampson M, Barrowman NJ, Moher D, Klassen TP, Pham B, Platt R, et al. Should meta-
analysts search Embase in addition to Medline? J Clin Epidemiol 2003; 56(10):943-955.
Saslow D, Boetes C, Burke W, Harms S, Leach MO, Lehman CD, et al. American Cancer
Society guidelines for breast screening with MRI as an adjunct to mammography. CA Cancer J
Clin 2007; 57(2):75-89.
Schnitt SJ, Connolly JL. Pathology of benign breast disorders. In: Harris JR, Lippman ME, Morrow
M, Osborne CK (eds). Diseases of the breast. Philadelphia: Lippincott Williams & Wilkins; 2004.
226
Schoppmann SF, Bayer G, Aumayr K, Taucher S, Geleff S, Rudas M, et al. Prognostic value of
lymphangiogenesis and lymphovascular invasion in invasive breast cancer. Ann Surg 2004;
240(2):306-312.
Schueler KM, Chu PW, Smith-Blindman R. Factors associated with mammography utilization:
a systematic quantitative review of the literature. J Womens Health (Larchmt) 2008;
17(9):1477-1498.
Shapiro S, Venet W, Strax P, Venet L, Roeser R. Ten- to fourteen-year effect of screening on
reducing breast cancer mortality. J Natl Cancer Inst 1982; 69(2):349-355.
Shields M, Wilkins K. An update on mammography in Canada. Health Rep 2009; 20(3):7-19.
Sims AH, Clarke RB, Howell A, Howell SJ. The cellular origins of breast cancer subtypes. In:
Pasqualini JR (ed). Breast cancer: Prognosis, treatment, and prevention, 2nd ed. Informa
Healthcare, New York; 2008.
Smith AH, Bates MN. Confidence limit analyses should replace power calculations in the
interpretation of epidemiologic studies. Epidemiology 1992; 3(5):449-452.
Soerjomataram I, Louwman MW, Ribot JG, Roukema JA, Coebergh JW. An overview of
prognostic factors for long-term survivors of breast cancer. Breast Cancer Res Treat 2008;
107(3):309-330.
Somers TJ, Michael JC, Klein WM, Baum A. Cancer genetics service interest in women with a
limited family history of breast cancer. J Genet Couns 2009; 18(4):339-349.
Statistics Canada. Table 051-0001 - Estimates of population, by age group and sex for July 1,
Canada, provinces and territories, annual (persons unless otherwise noted), CANSIM (database).
Accessed December 5, 2013 from: http://www4.hrsdc.gc.ca/[email protected]?iid=35.
Stavrou E, Vajdic CM, Loxton D, Pearson SA. The validity of self-reported cancer diagnoses
and factors associated with accurate reporting in a cohort of older Australian women. Cancer
Epidemiol 2011; 35(6):e75-80.
Steckler A, McLeroy KR, Holtzman D. Godfrey H. Hochbaum (1916-1999): from social
psychology to health behavior and health education. Am J Public Health 2010; 100(10):1864.
Sterne JA, White IR, Carlin JB, Spratt M, Royston P, Kenward MG, et al. Multiple imputation
for missing data in epidemiological and clinical research: potentials and pitfalls. BMJ 2009;
338:b2393.
Stout NK, Nekhlyudov L, Li L, Malin ES, Ross-Degnan D, Buist DS, et al. Rapid increase in
breast magnetic resonance imaging use: trends from 2000 to 2011. JAMA Intern Med 2014;
174(1):114-121.
Struewing JP, Abeliovich D, Peretz T, Avishai N, Kaback MM, Collins FS, et al. The carrier
frequency of the BRCA1 185delAG mutation is approximately 1 percent in Ashkenazi Jewish
individuals. Nat Genet 1995; 11(2):198-200.
Suarez L, Goldman DA, Weiss NS. Validity of Pap smear and mammogram self-reports in a
low-income Hispanic population. Am J Prev Med 1995; 11(2):94-98.
227
Sudman S, Bradburn NM. Effects of time and memory factors on response in surveys. J
American Stat Assoc 1973; 68(344):805-815.
Sutherland HJ, Lacroix J, Knight J, Andrulis IL, Boyd NF, Ontario Cancer Genetics Network.
The Cooperative Familial Registry for Breast Cancer Studies: design and first year recruitment
rates in Ontario. J Clin Epidemiol 2001; 54(1):93-98.
Szklo M & Nieto FJ. Epidemiology: beyond the basics, 2nd ed. Boston, MA: Jones and Bartlett
Publishers; 2007.
Tabár L, Fagerberg CJ, Gad A, Baldetorp L, Holmberg LH, Gröntoft O, et al. Reduction in
mortality from breast cancer after mass screening with mammography. Randomised trial from
the Breast Cancer Screening Working Group of the Swedish National Board of Health and
Welfare. Lancet 1985; 1(8433):829-832.
Taylor KL, Shelby RA, Schwartz MD, Ackerman J, LaSalle VH, Gelmann EP, et al. The impact
of item order on ratings of cancer risk perception. Cancer Epidemiol Biomarkers Prev 2002;
11(7):654-659.
Teerenstra S, Lu B, Preisser JS, van Achterberg T, Borm GF. Sample size considerations for
GEE analyses of three-level cluster randomized trials. Biometrics 2010; 66(4):1230-1237.
Thalib L, Wedrén S, Granath F, Adami HO, Rydh B, Magnusson C, et al. Breast cancer
prognosis in relation to family history of breast and ovarian cancer. Br J Cancer 2004;
90(7):1378-1381.
Thorlacius S, Olafsdottir G, Tryggvadottir L, Neuhausen S, Jonasson JG, Tavtigian SV, et al. A
single BRCA2 mutation in male and female breast cancer families from Iceland with varied
cancer phenotypes. Nat Genet 1996; 13(1):117-119.
Tilanus-Linthorst MM, Obdeijn IM, Hop WC, Causer PA, Leach MO, Warner E, et al. BRCA1
mutation and young age predict fast breast cancer growth in the Dutch, United Kingdom, and
Canadian magnetic resonance imaging trials. Clin Cancer Res 2007; 13(24):7357-7362.
Tilanus-Linthorst MM, Bartels CC, Objeijn AI, Oudkerk M. Earlier detection of breast cancer
by surveillance of women at familial risk. Eur J Cancer 2000; 36(4):514-519.
Toniolo PG, Kato I. Jewish religion and risk of breast cancer. Lancet 1996; 348(9029):760.
Tyrer J, Duffy SW, Cuzick J. A breast cancer prediction model incorporating familial and
personal risk factors. Stat Med 2004; 23(7):1111-1130.
US Preventive Services Task Force. Screening for breast cancer: U.S. Preventive Services Task
Force recommendation statement. Ann Intern Med 2009; 151(10):716-726.
van Asperen CJ, Brohet RM, Meijers-Heijboer EJ, Hoogerbrugge N, Verhoef S, Vasen HF, et
al. Cancer risks in BRCA2 families: estimates for sites other than breast and ovary. J Med Genet
2005; 42(9):711-719.
van Diest PJ, van der Wall E, Baak JP. Prognostic value of proliferation in invasive breast
cancer: a review. J Clin Pathol 2004; 57(7):675-681.
228
van Gils CH, Otten JD, Verbeek AL, Hendriks JH, Holland R. Effect of mammographic breast
density on breast cancer screening performance: a study in Nijmegen, The Netherlands. J
Epidemiol Community Health 1998; 52(4):267-271.
Vanio H, Bianchini F. IARC Handbooks of Cancer Prevention, Volume 7: Breast Cancer
Screening. Lyon, France: IARC Press; 2002.
Verhoog LC, Brekelmans CT, Seynaeve C, van den Bosch LM, Dahmen G, van Geel AN, et al.
Survival and tumour characteristics of breast-cancer patients with germline mutations of
BRCA1. Lancet 1998, 351(9099):316-321.
Vencken PM, Kriege M, Hooning M, Menke-Pluymers MB, Heemskerk-Gerritsen BA, van
Doorn LC, et al. The risk of primary and contralateral breast cancer after ovarian cancer in
BRCA1/2 mutation carriers: implications for counseling. Cancer 2013; 119(5):955-962.
Warner E, Messersmith H, Causer P, Eisen A, Shumak R, Plewes D. Magnetic resonance
imaging screening of women at high risk for breast cancer. Program in Evidence-Based Care
Evidence-Based Guideline No.: 15-11 Version 2. Toronto: Cancer Care Ontario; 2012.
Warner E, Plewes DB, Hill KA, Causer PA, Zubovits JT, Jong RA, et al. Surveillance of BRCA1
and BRCA2 mutation carriers with magnetic resonance imaging, ultrasound, mammography, and
clinical breast examination. JAMA 2004; 292(11):1317-1325.
Warner E, Plewes DB, Shumak RS, Catzavelos GC, Di Prospero LS, Yaffe MJ, et al.
Comparison of breast magnetic resonance imaging, mammography, and ultrasound for
surveillance of women at high risk for hereditary breast cancer. J Clin Oncol 2001; 19(5):3524-
3531.
Warner E, Heisey RE, Goel V, Carroll JC, McCready DR. Hereditary breast cancer. Risk assessment
of patients with a family history of breast cancer. Can Fam Physician 1999a; 45:104-112.
Warner E, Foulkes W, Goodwin P, Meschino W, Blondal J, Paterson C, et al. Prevalence and
penetrance of BRCA1 and BRCA2 gene mutations in unselected Ashkenazi Jewish women with
breast cancer. J Natl Cancer Inst 1999b; 91(14):1241-1247.
Webb PM, Byrne C, Schnitt SJ, Connolly JL, Jacobs T, Peiro G, et al. Family history of breast
cancer, age and benign breast disease. Int J Cancer 2002; 100(3):375-378.
Weiss RB, Woolf SH, Demakos E, Holland JF, Berry DA, Falkson G, et al. Natural history of
more than 20 years of node-positive primary breast carcinoma treated with cyclophosphamide,
methotrexate, and fluorouracil-based adjuvant chemotherapy: a study by the Cancer and
Leukemia Group B. J Clin Oncol 2003; 21(9):1825-1835.
Whittemore AS, Gong G, Itnyre J. Prevalence and contribution of BRCA1 mutations in breast
cancer and ovarian cancer: results from three U.S. population-based case-control studies of
ovarian cancer. Am J Hum Genet 1997; 60(3):496-504.
Woolf SH. United States Preventive Services Task Force recommendations on breast cancer
screening. Cancer 1992; 69(7 Suppl):1913-1918.
Yaffe MJ, Mainprize JG. Risk of radiation-induced breast cancer from mammographic
screening. Radiology 2011; 258(1):98-105.
229
Yorkshire Breast Cancer Group. Critical assessment of the clinical TNM system in breast
cancer. Report from the Yorkshire Breast Cancer Group. Br Med J 1980; 281(6233):134-136.
Youlden DR, Cramb SM, Dunn NA, Muller JM, Pyke CM, Baade PD. The descriptive
epidemiology of female breast cancer: an international comparison of screening, incidence,
survival and mortality. Cancer Epidemiol 2012; 36(3):237-248.
Zackrisson S, Andersson I, Janzon L, Manjer J, Game JP. Rate of over-diagnosis of breast
cancer 15 years after end of Malmö mammographic screening trial: follow-up study. BMJ 2006;
332(7543):689-692.
Zapka JG, Bigelow C, Hurley T, Ford LD, Egelhofer J, Cloud WM, et al. Mammography use
among sociodemographically diverse women: the accuracy of self-report. Am J Public Health
1996; 86(7):1016-1021.
Ziogas A, Gildea M, Cohen P, Bringman D, Taylor TH, Seminara D, et al. Cancer risk estimates
for family members of a population-based family registry for breast and ovarian cancer. Cancer
Epidemiol Biomarkers Prev 2000; 9(1):103-111.
Zorn C. Comparing GEE and robust standard errors for conditionally dependent data. Polit Res
Q 2006; 59(3):329-341.
230
Appendix A. Family History Study Grant Abstract

231
Appendix B. Family History Study - Baseline Personal History and Screening Questionnaire
Follow-up
Personal History and Screening
Questionnaire
Several years ago you completed a personal history
questionnaire (PHQ) about factors that may relate to a
person’s risk of developing breast cancer. It is important to
update this information and collect additional information for
scientific research. We encourage you to answer all questions.
Should you wish to speak with someone about this
questionnaire, please call 416-217-1228 or our toll-free
number 1-866-989-0031.
An interviewer will be calling you to record your answers.
You can keep this questionnaire for your records.

232
Although an interviewer will be calling to record your answers, you may find
it helpful to fill out the questionnaire ahead of time. You may write your
answers in the space provided or check the appropriate circles.
If you come to a question that you do not want to answer, please skip that
question and continue to answer the remaining questions.
We last heard from you when you completed a Personal History Questionnaire
(PHQ) for this study on_________________________. Where appropriate,
please think back to that date and age when answering the questions below.
Background Information
1. What is your date of birth? ______/______/19_____
month day year
2. How much do you currently weigh? If you are currently pregnant please give your pre-
pregnancy weight.
_______ pounds or _______ kilograms
3. What is the highest level of education you have completed?
Less than high school
Some or all of high school
Vocational or technical school
Some college or university
Bachelor's degree or higher
4. What is your current marital status?
Married or common law
Widowed
Divorced or separated
Never married

233
Breast Investigation
5. Since you last completed the PHQ, has a doctor ever told you that you had breast cancer
(a malignant or in situ tumour)?
Yes
No
Don't know
Please go to question 10
Please go to question 10
6. Did you have a breast biopsy (breast tissue removed by a core needle biopsy or open surgical
biopsy) to find your breast cancer (a malignant or in situ tumour)?
Yes, the right breast
Yes, the left breast
Yes, both breasts
No
Don't know
Please go to question 8
Please go to question 8
7. Where and when did you have your breast biopsy (ies) done? Please indicate your age and/or
date of surgery (ies).
Biopsy No. 1
Hospital: __________________________/ Age_____ or Date_____ /_____
years month year
Biopsy No. 2
Hospital: __________________________/ Age_____ or Date_____ /_____
years month year
Don't know
234
8. Did you have a lumpectomy (breast lump removed by surgery) to find or treat your breast
cancer (a malignant or in situ tumour)?
Yes, the right breast
Yes, the left breast
Yes, both breasts
No
Don't know
Please go to question 10
Please go to question 10
9. Where and when did you have your lumpectomy (ies) done? Please indicate your age and/or
date of surgery (ies).
Lumpectomy No. 1
Hospital: __________________________/ Age_____ or Date_____ /_____
years month year
Lumpectomy No. 2
Hospital: __________________________/ Age_____ or Date_____ /_____
years month year
Don't know
10. Since you last completed the PHQ, has a doctor ever told you that you had benign breast
disease (non-cancerous cyst or breast lump) that was not breast cancer?
Yes
No
Don't know
Please go to question 13
Please go to question 13
11. Did you have a breast biopsy (breast tissue removed by a core needle biopsy or open
surgical biopsy) to find your benign breast disease (non-cancerous cyst or breast lump), that
was not breast cancer?
Yes, the right breast
Yes, the left breast
Yes, both breasts
No
Don’t know
Please go to question 13
Please go to question 13
235
12. Where and when did you have your surgical breast biopsy (ies) done? Please indicate your
age and/or date of surgery (ies).
Biopsy No. 1
Hospital: ________________________/ Age_____ or Date_____ /_____
years month year
Biopsy No. 2
Hospital: ________________________/ Age_____ or Date_____ /_____
years month year
Don't know
Surgical and Medical History
13. Since you last completed the PHQ, has a doctor told you that you had a disease such as
cancer, leukemia or malignant tumour, other than breast cancer?
Yes Type of cancer ______________________ and _____ years of age
Type of cancer ______________________ and _____ years of age
Type of cancer ______________________ and _____ years of age
No
Don’t know
14. Since you last completed the PHQ, have you had one or both breasts completely removed?
Yes, the right breast
Yes, the left breast
Yes, both breasts
No
Don’t know
At what age was this? _____ years of age
At what age was this? _____ years of age
At what age was this? _____ years of age
Please go to question 16
Please go to question 16
236
15. Why did you have your breast(s) removed? Please check all that apply.
To treat breast cancer
To prevent breast cancer
Other, please specify ____________________________________
Don't know
16. Have you ever had a hysterectomy (uterus or womb removed)?
Yes At what age was this? _____ years of age
No
Don't know
17. Since you last completed the PHQ, has a doctor told you that you had cysts in one or both
ovaries?
Yes At what age was this first diagnosed? _____ years of age
No
Don't know
18. Since you last completed the PHQ, have you had one or both ovaries completely removed?
If your ovaries were removed at different times, please give your age at the most recent
operation.
Yes, one ovary
Yes, both ovaries
Yes, unsure if 1 or both ovaries
No
Don't know
At what age was this? ____ years of age
At what age was this? ____ years of age
At what age was this? ____ years of age
Please go to question 20
Please go to question 20

237
19. Why did you have one or both of your ovaries removed? Please check all that apply.
Gynecological problem (abnormal bleeding, missed periods, cysts)
To treat ovarian cancer
To prevent ovarian cancer
As part of treatment of breast cancer
As part of prevention of breast cancer
Other, please specify____________________________________
Don't know
Breast Examination
20. Since you last completed the PHQ, have you had a mammogram (x-ray examination of the
breasts)?
Yes
No
Don’t know
How many mammograms did you have in total?____
Please go to question 24
Please go to question 24
21. Where and when did you have your last mammogram done? Please indicate your age
and/or date of your last mammogram.
Hospital/Clinic:___________________/ Age_____ or Date_____ /_____
years month year
Don't know
22. What was the main reason you had your last mammogram? Please check all that apply.
Part of a regular check-up or routine screening
Part of the Ontario Breast Screening Program
Family history of breast cancer
Breast problem or symptom
Other, please specify __________________________________
Don't know

238
23. Did anyone or anything encourage you to have a mammogram? Please check all that apply.
Family physician
Familial cancer genetic clinic (genetic counselor, geneticist)
Family member
Friend
Family member with breast cancer
Someone with breast cancer
Media (television, radio, magazine)
Community presentation
Other, please specify ____________________________________
Please go to question 25
24. What are your reasons for not having a mammogram? Please check all that apply.
Not old enough
Have not gotten around to it
Not needed or no problems
Doctor has not recommended it
Personal or family responsibilities
Transportation problems
Language problems
Hate or dislike having one done
Fear (painful, embarrassing, may find something wrong)
Other, please specify____________________________________
25. Have you ever had your breasts examined (physical breast exam) for lumps (tumours or
cysts) by a doctor, nurse or other health professional?
Yes
No
Don't know
Please go to question 28
Please go to question 28
26. When did you have your last physical breast exam? Please indicate your age and/or date of
your last physical breast exam.
_____ years of age or ______/______
month year
Don't know

239
27. What was the main reason you had your last physical breast exam? Please check all that
apply.
Part of a regular check-up or routine screening
Part of the Ontario Breast Screening Program
Family history of breast cancer
Breast problem or symptom
Other, please specify ____________________________________
Please go to question 29
28. What are your reasons for not having a physical breast exam? Please check all that apply.
Not old enough
Have not gotten around to it
Not needed or no problems
Doctor has not recommended it
Personal or family responsibilities
Transportation problems
Language problems
Hate or dislike having one done
Fear (painful, embarrassing, may find something wrong)
Other, please specify____________________________________
29. Have you ever examined your own breasts (breast self exam or BSE) for lumps (tumours,
cysts)?
Yes
No
Don’t know
Please go to question 31
Please go to question 31
30. On average, how often do you examine your own breasts (breast self exam or BSE) for
lumps (tumours, cysts)?
Once a month or more
Every 2-3 months
Every 4-6 months
Once a year
Other, please specify ____________________________________
Don’t know
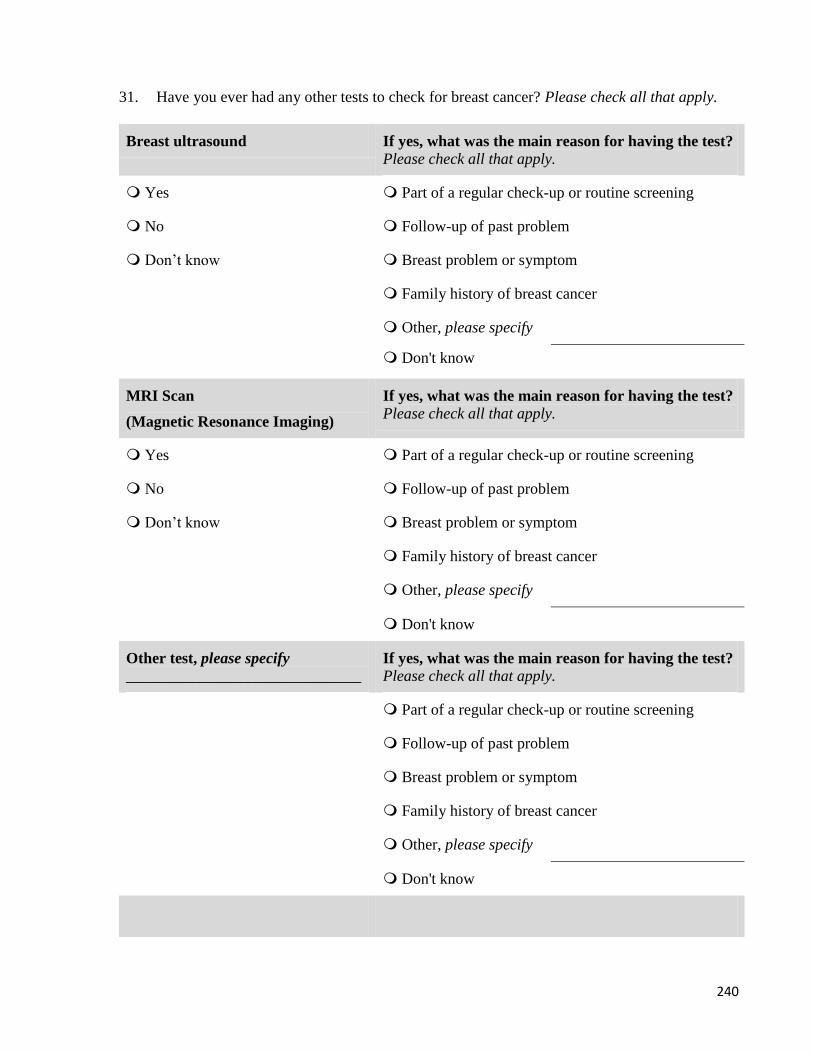
240
31. Have you ever had any other tests to check for breast cancer? Please check all that apply.
Breast ultrasound If yes, what was the main reason for having the test?
Please check all that apply.
Part of a regular check-up or routine screening Yes
No
Don’t know
Follow-up of past problem
Breast problem or symptom
Family history of breast cancer
Other, please specify
Don't know
If yes, what was the main reason for having the test?
Please check all that apply. MRI Scan
(Magnetic Resonance Imaging)
Yes
No
Don’t know
Part of a regular check-up or routine screening
Follow-up of past problem
Breast problem or symptom
Family history of breast cancer
Other, please specify
Don't know
Other test, please specify
______________________________
If yes, what was the main reason for having the test?
Please check all that apply.
Part of a regular check-up or routine screening
Follow-up of past problem
Breast problem or symptom
Family history of breast cancer
Other, please specify
Don't know
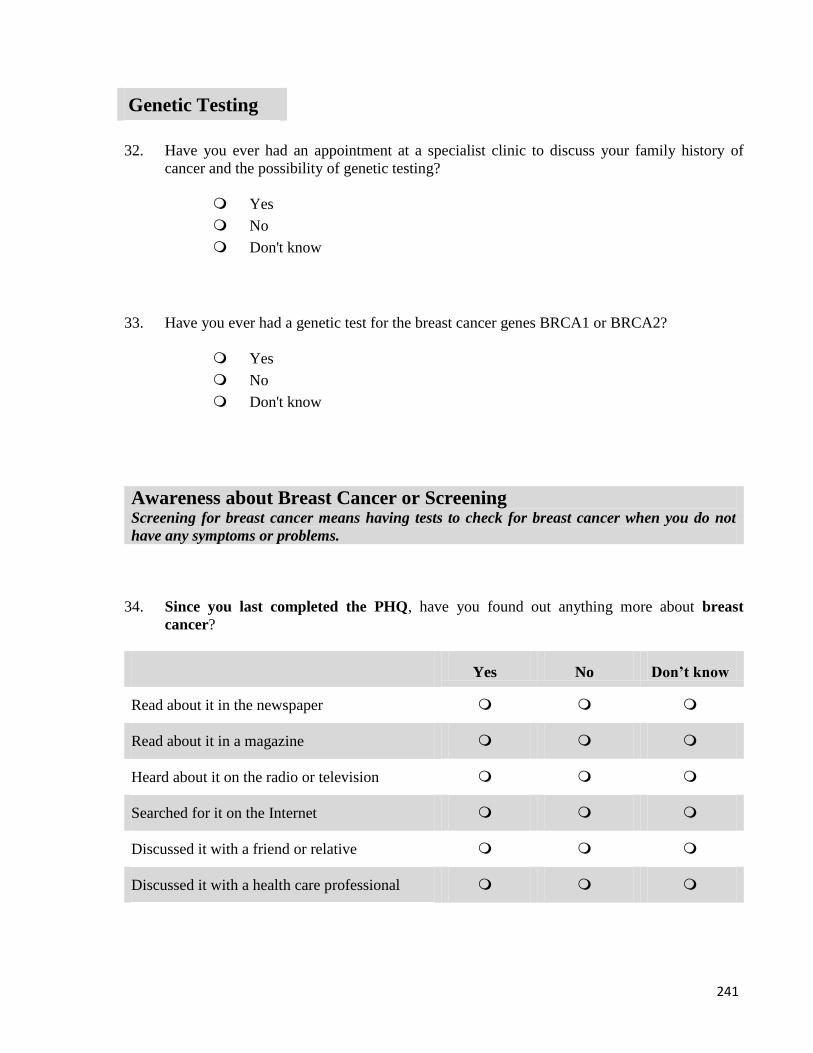
241
32. Have you ever had an appointment at a specialist clinic to discuss your family history of
cancer and the possibility of genetic testing?
Yes
No
Don't know
33. Have you ever had a genetic test for the breast cancer genes BRCA1 or BRCA2?
Yes
No
Don't know
Awareness about Breast Cancer or Screening Screening for breast cancer means having tests to check for breast cancer when you do not
have any symptoms or problems.
34. Since you last completed the PHQ, have you found out anything more about breast
cancer?
Yes No Don’t know
Read about it in the newspaper
Read about it in a magazine
Heard about it on the radio or television
Searched for it on the Internet
Discussed it with a friend or relative
Discussed it with a health care professional
Genetic Testing
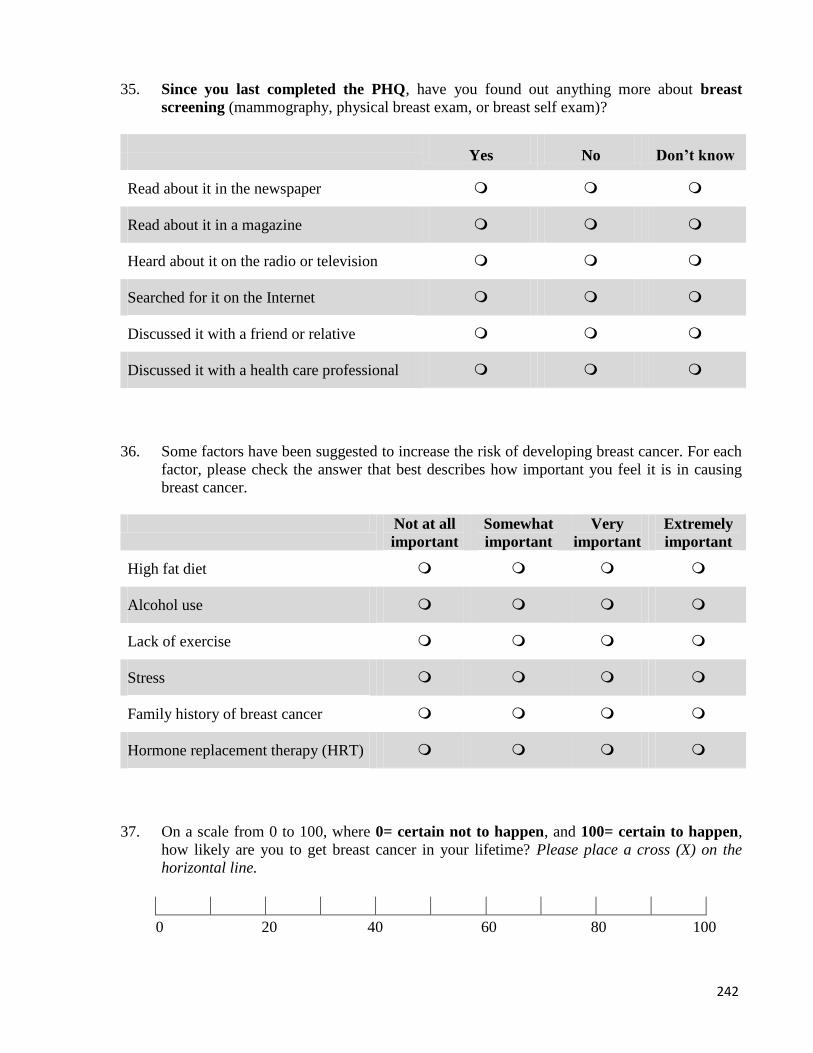
242
35. Since you last completed the PHQ, have you found out anything more about breast
screening (mammography, physical breast exam, or breast self exam)?
Yes No Don’t know
Read about it in the newspaper
Read about it in a magazine
Heard about it on the radio or television
Searched for it on the Internet
Discussed it with a friend or relative
Discussed it with a health care professional
36. Some factors have been suggested to increase the risk of developing breast cancer. For each
factor, please check the answer that best describes how important you feel it is in causing
breast cancer.
Not at all
important
Somewhat
important
Very
important
Extremely
important
High fat diet
Alcohol use
Lack of exercise
Stress
Family history of breast cancer
Hormone replacement therapy (HRT)
37. On a scale from 0 to 100, where 0= certain not to happen, and 100= certain to happen,
how likely are you to get breast cancer in your lifetime? Please place a cross (X) on the
horizontal line.
0 20 40 60 80 100
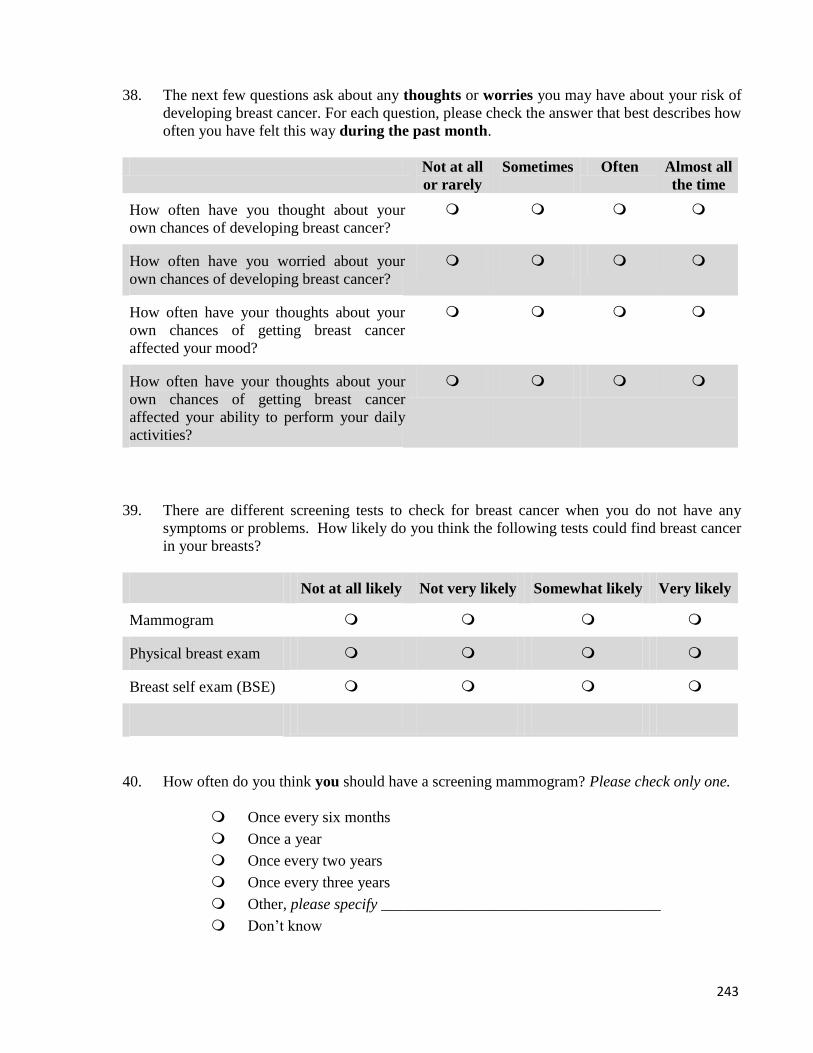
243
38. The next few questions ask about any thoughts or worries you may have about your risk of
developing breast cancer. For each question, please check the answer that best describes how
often you have felt this way during the past month.
Not at all
or rarely
Sometimes Often Almost all
the time
How often have you thought about your
own chances of developing breast cancer?
How often have you worried about your
own chances of developing breast cancer?
How often have your thoughts about your
own chances of getting breast cancer
affected your mood?
How often have your thoughts about your
own chances of getting breast cancer
affected your ability to perform your daily
activities?
39. There are different screening tests to check for breast cancer when you do not have any
symptoms or problems. How likely do you think the following tests could find breast cancer
in your breasts?
Very likely Not at all likely
Not very likely
Somewhat likely
Mammogram
Physical breast exam
Breast self exam (BSE)
40. How often do you think you should have a screening mammogram? Please check only one.
Once every six months
Once a year
Once every two years
Once every three years
Other, please specify ____________________________________
Don’t know

244
41. At what age do you think you should start having screening mammograms? Please check
only one.
Less than 30
30 to 39
40 to 49
50 to 59
Other, please specify ____________________________________
Don’t know
42. At what age do you think you should stop having screening mammograms? Please check
only one.
50 to 59
60 to 69
70 and over
Other, please specify ____________________________________
Never
Don’t know
43. Compared to other women your age, how likely are you to get breast cancer in your
lifetime? Please check only one.
Much below average
Below average
Same average risk
Above average
Much above average
Don’t know
Cancer Screening Screening for cancer means having tests to check for cancer when you do not have any
symptoms or problems.
44. Doctors have many screening tests to check for cancer. Have you ever had a Pap test to
check for cervical cancer, a trans-vaginal ultrasound or CA-125 blood test to check for
ovarian cancer or a stool blood test to check for colorectal cancer? Check all that apply.
Yes No Don’t know
Yes No
Yes No
Pap test (cervical cancer)
Trans-vaginal ultrasound (ovarian cancer)
CA-125 blood test (ovarian cancer)
Stool blood test (colorectal cancer) Yes No
Don’t know
Don’t know
Don’t know
If you answered no or don’t know to all of the above, please go to question 46.
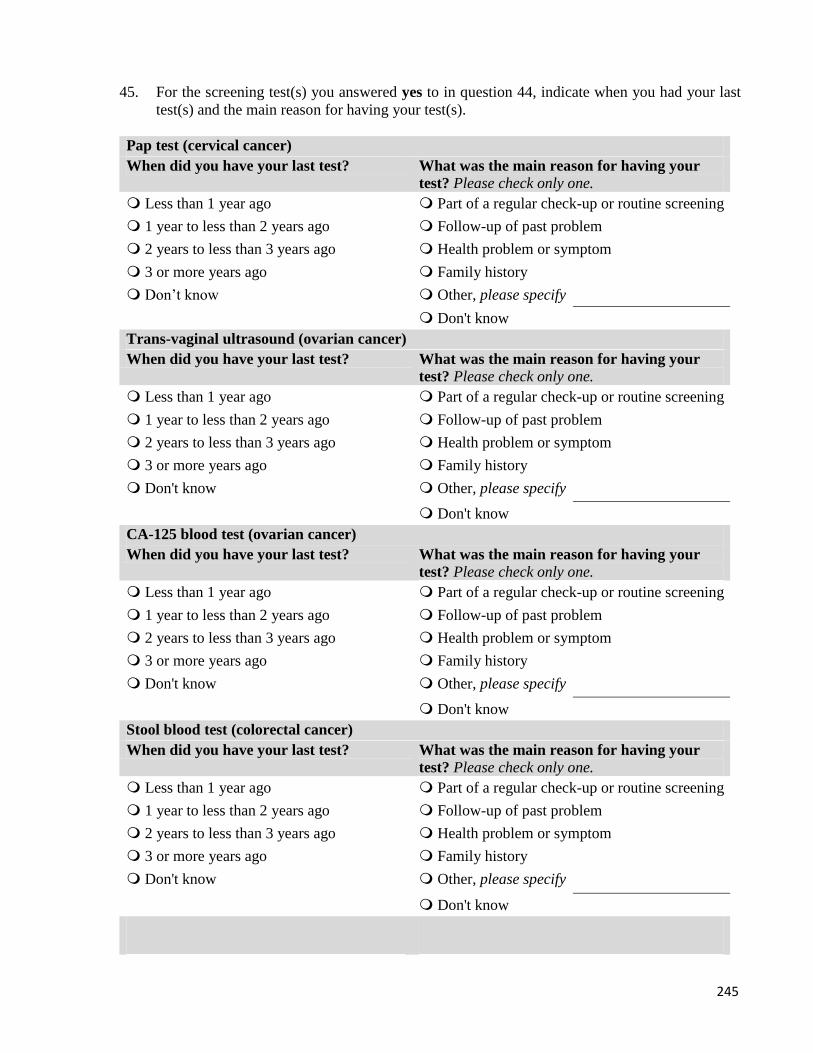
245
45. For the screening test(s) you answered yes to in question 44, indicate when you had your last
test(s) and the main reason for having your test(s).
Pap test (cervical cancer)
When did you have your last test?
Less than 1 year ago
1 year to less than 2 years ago
2 years to less than 3 years ago
3 or more years ago
Don’t know
What was the main reason for having your
test? Please check only one.
Part of a regular check-up or routine screening
Follow-up of past problem
Health problem or symptom
Family history
Other, please specify
Don't know
Trans-vaginal ultrasound (ovarian cancer)
When did you have your last test?
Less than 1 year ago
1 year to less than 2 years ago
2 years to less than 3 years ago
3 or more years ago
Don't know
What was the main reason for having your
test? Please check only one.
Part of a regular check-up or routine screening
Follow-up of past problem
Health problem or symptom
Family history
Other, please specify
Don't know
CA-125 blood test (ovarian cancer)
When did you have your last test?
Less than 1 year ago
1 year to less than 2 years ago
2 years to less than 3 years ago
3 or more years ago
Don't know
What was the main reason for having your
test? Please check only one.
Part of a regular check-up or routine screening
Follow-up of past problem
Health problem or symptom
Family history
Other, please specify
Don't know
Stool blood test (colorectal cancer)
When did you have your last test?
Less than 1 year ago
1 year to less than 2 years ago
2 years to less than 3 years ago
3 or more years ago
Don't know
What was the main reason for having your
test? Please check only one.
Part of a regular check-up or routine screening
Follow-up of past problem
Health problem or symptom
Family history
Other, please specify
Don't know
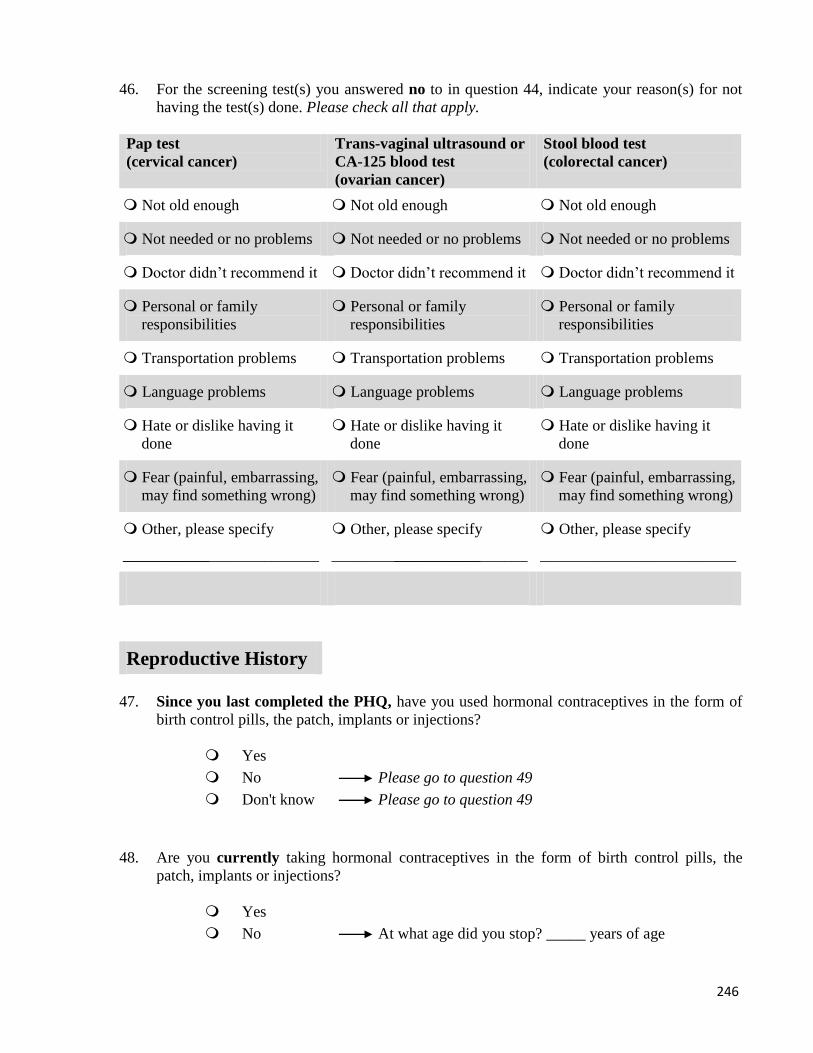
246
46. For the screening test(s) you answered no to in question 44, indicate your reason(s) for not
having the test(s) done. Please check all that apply.
Pap test
(cervical cancer)
Trans-vaginal ultrasound or
CA-125 blood test
(ovarian cancer)
Stool blood test
(colorectal cancer)
Not old enough Not old enough
Not needed or no problems Not needed or no problems
Not old enough
Not needed or no problems
Doctor didn’t recommend it Doctor didn’t recommend it Doctor didn’t recommend it
Personal or family
responsibilities
Personal or family
responsibilities
Personal or family
responsibilities
Transportation problems Transportation problems Transportation problems
Language problems Language problems Language problems
Hate or dislike having it
done
Hate or dislike having it
done
Hate or dislike having it
done
Fear (painful, embarrassing,
may find something wrong)
Fear (painful, embarrassing,
may find something wrong)
Fear (painful, embarrassing,
may find something wrong)
Other, please specify
____________________________
Other, please specify
________ ____________________________
Other, please specify
________ _________________________
Reproductive History
47. Since you last completed the PHQ, have you used hormonal contraceptives in the form of
birth control pills, the patch, implants or injections?
Yes
No
Don't know
Please go to question 49
Please go to question 49
48. Are you currently taking hormonal contraceptives in the form of birth control pills, the
patch, implants or injections?
Yes
No At what age did you stop? _____ years of age
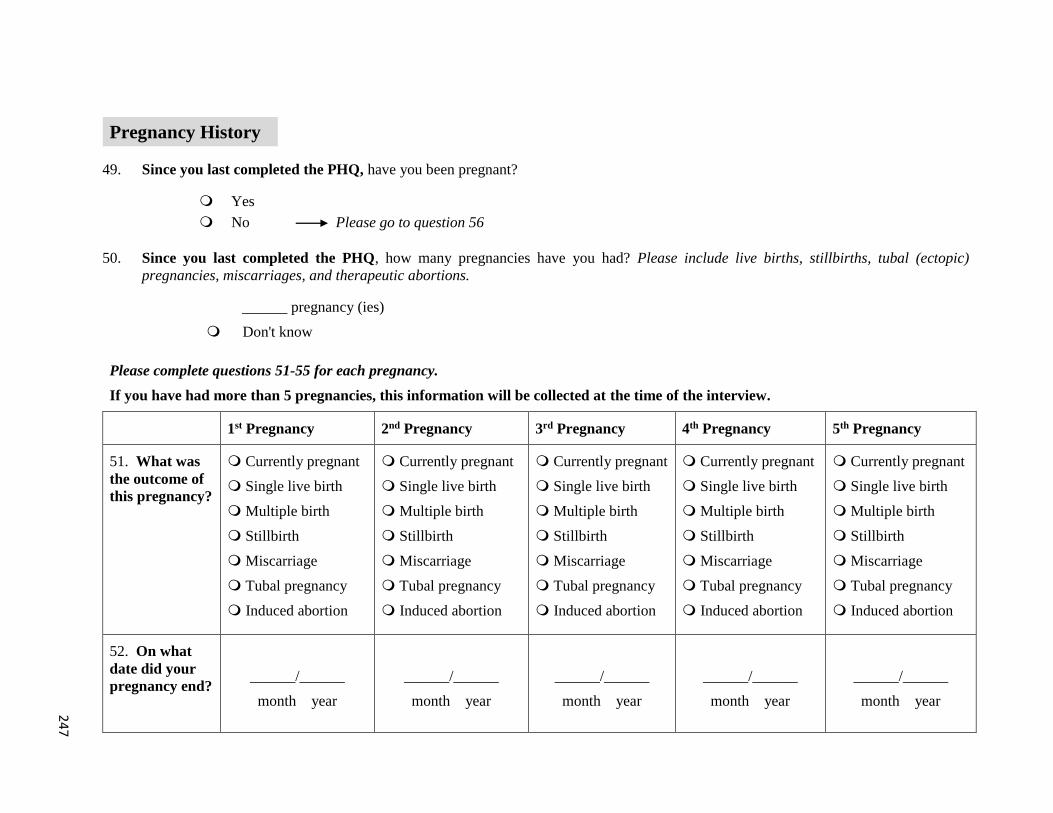
24
7
49. Since you last completed the PHQ, have you been pregnant?
Yes
No Please go to question 56
50. Since you last completed the PHQ, how many pregnancies have you had? Please include live births, stillbirths, tubal (ectopic)
pregnancies, miscarriages, and therapeutic abortions.
______ pregnancy (ies)
Don't know
Please complete questions 51-55 for each pregnancy.
If you have had more than 5 pregnancies, this information will be collected at the time of the interview.
1st Pregnancy 2nd Pregnancy 3rd Pregnancy 4th Pregnancy 5th Pregnancy
51. What was
the outcome of
this pregnancy?
Currently pregnant
Single live birth
Multiple birth
Stillbirth
Miscarriage
Tubal pregnancy
Induced abortion
Currently pregnant
Single live birth
Multiple birth
Stillbirth
Miscarriage
Tubal pregnancy
Induced abortion
Currently pregnant
Single live birth
Multiple birth
Stillbirth
Miscarriage
Tubal pregnancy
Induced abortion
Currently pregnant
Single live birth
Multiple birth
Stillbirth
Miscarriage
Tubal pregnancy
Induced abortion
Currently pregnant
Single live birth
Multiple birth
Stillbirth
Miscarriage
Tubal pregnancy
Induced abortion
52. On what
date did your
pregnancy end? ______/______
month year
______/______
month year
______/______
month year
______/______
month year
______/______
month year
Pregnancy History
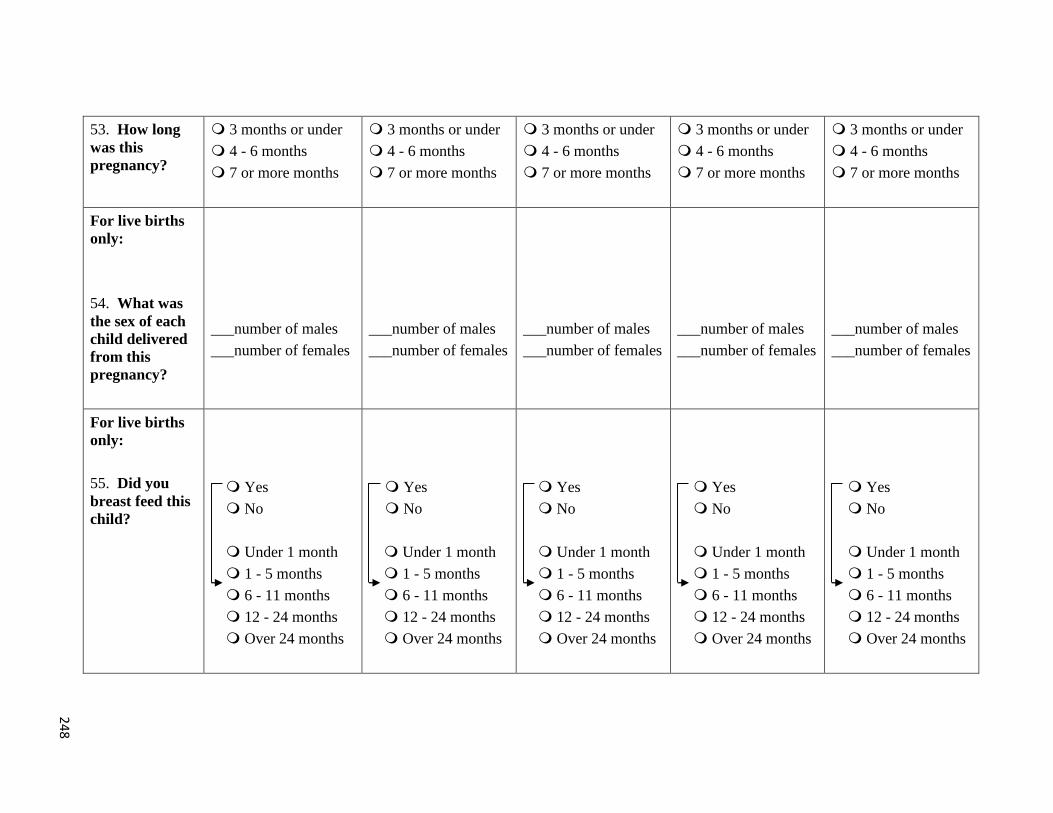
24
8
53. How long
was this
pregnancy?
3 months or under
4 - 6 months
7 or more months
3 months or under
4 - 6 months
7 or more months
3 months or under
4 - 6 months
7 or more months
3 months or under
4 - 6 months
7 or more months
3 months or under
4 - 6 months
7 or more months
For live births
only:
54. What was
the sex of each
child delivered
from this
pregnancy?
___number of males
___number of females
___number of males
___number of females
___number of males
___number of females
___number of males
___number of females
___number of males
___number of females
For live births
only:
55. Did you
breast feed this
child?
Yes
No
Under 1 month
1 - 5 months
6 - 11 months
12 - 24 months
Over 24 months
Yes
No
Under 1 month
1 - 5 months
6 - 11 months
12 - 24 months
Over 24 months
Yes
No
Under 1 month
1 - 5 months
6 - 11 months
12 - 24 months
Over 24 months
Yes
No
Under 1 month
1 - 5 months
6 - 11 months
12 - 24 months
Over 24 months
Yes
No
Under 1 month
1 - 5 months
6 - 11 months
12 - 24 months
Over 24 months
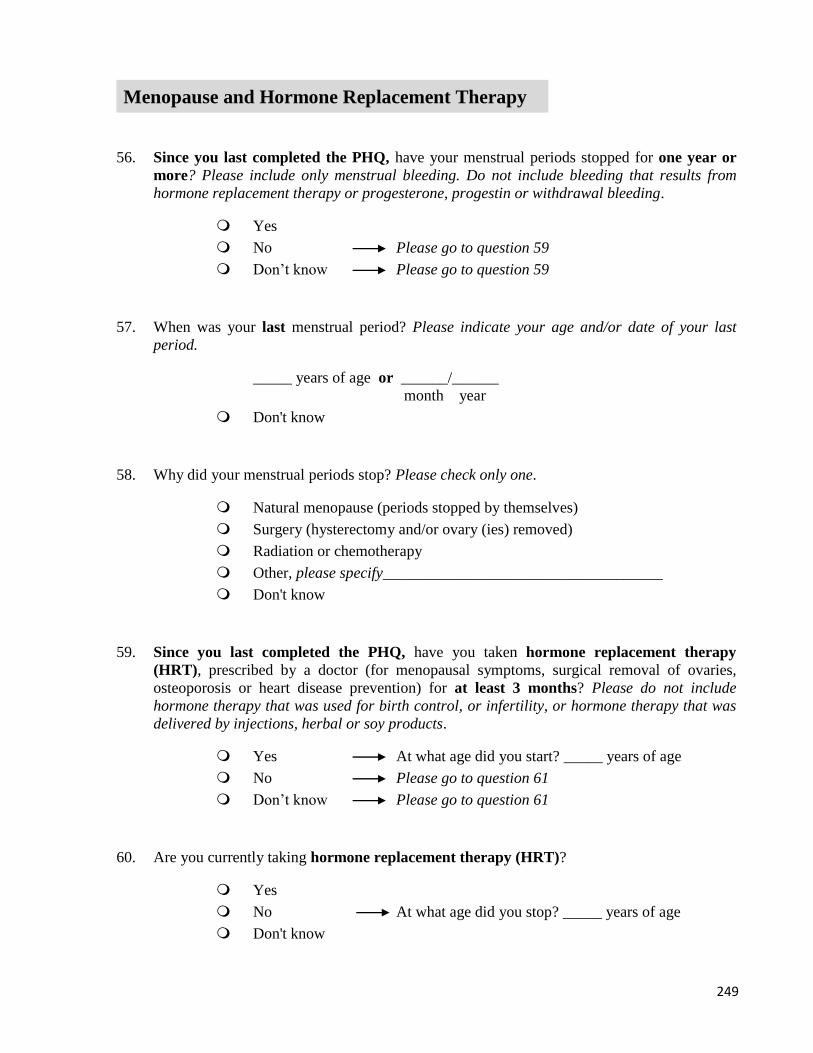
249
Menopause and Hormone Replacement Therapy
56. Since you last completed the PHQ, have your menstrual periods stopped for one year or
more? Please include only menstrual bleeding. Do not include bleeding that results from
hormone replacement therapy or progesterone, progestin or withdrawal bleeding.
Yes
No
Don’t know
Please go to question 59
Please go to question 59
57. When was your last menstrual period? Please indicate your age and/or date of your last
period.
_____ years of age or ______/______
month year
Don't know
58. Why did your menstrual periods stop? Please check only one.
Natural menopause (periods stopped by themselves)
Surgery (hysterectomy and/or ovary (ies) removed)
Radiation or chemotherapy
Other, please specify____________________________________
Don't know
59. Since you last completed the PHQ, have you taken hormone replacement therapy
(HRT), prescribed by a doctor (for menopausal symptoms, surgical removal of ovaries,
osteoporosis or heart disease prevention) for at least 3 months? Please do not include
hormone therapy that was used for birth control, or infertility, or hormone therapy that was
delivered by injections, herbal or soy products.
Yes
No
Don’t know
At what age did you start? _____ years of age
Please go to question 61
Please go to question 61
60. Are you currently taking hormone replacement therapy (HRT)?
Yes
No At what age did you stop? _____ years of age
Don't know
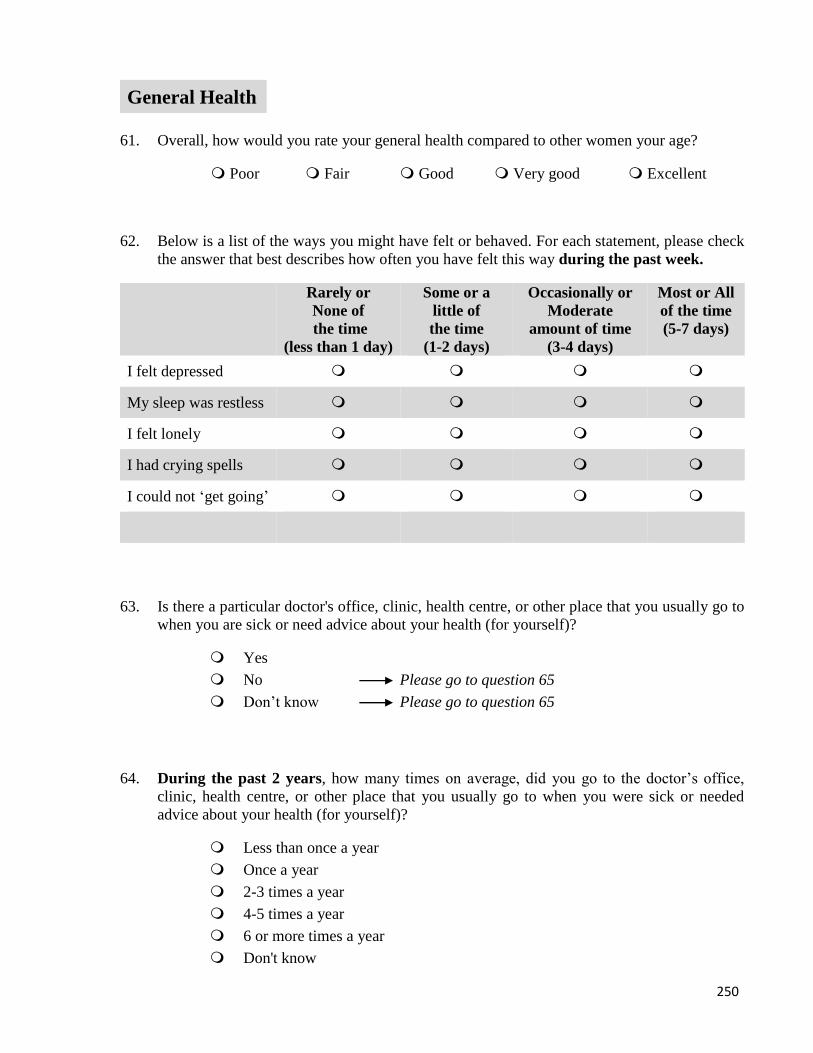
250
General Health
61. Overall, how would you rate your general health compared to other women your age?
Poor Fair Good Very good Excellent
62. Below is a list of the ways you might have felt or behaved. For each statement, please check
the answer that best describes how often you have felt this way during the past week.
Some or a
little of
the time
(1-2 days)
Most or All
of the time
(5-7 days)
Rarely or
None of
the time
(less than 1 day)
Occasionally or
Moderate
amount of time
(3-4 days)
I felt depressed
My sleep was restless
I felt lonely
I had crying spells
I could not ‘get going’
63. Is there a particular doctor's office, clinic, health centre, or other place that you usually go to
when you are sick or need advice about your health (for yourself)?
Yes
No
Don’t know
Please go to question 65
Please go to question 65
64. During the past 2 years, how many times on average, did you go to the doctor’s office,
clinic, health centre, or other place that you usually go to when you were sick or needed
advice about your health (for yourself)?
Less than once a year
Once a year
2-3 times a year
4-5 times a year
6 or more times a year
Don't know
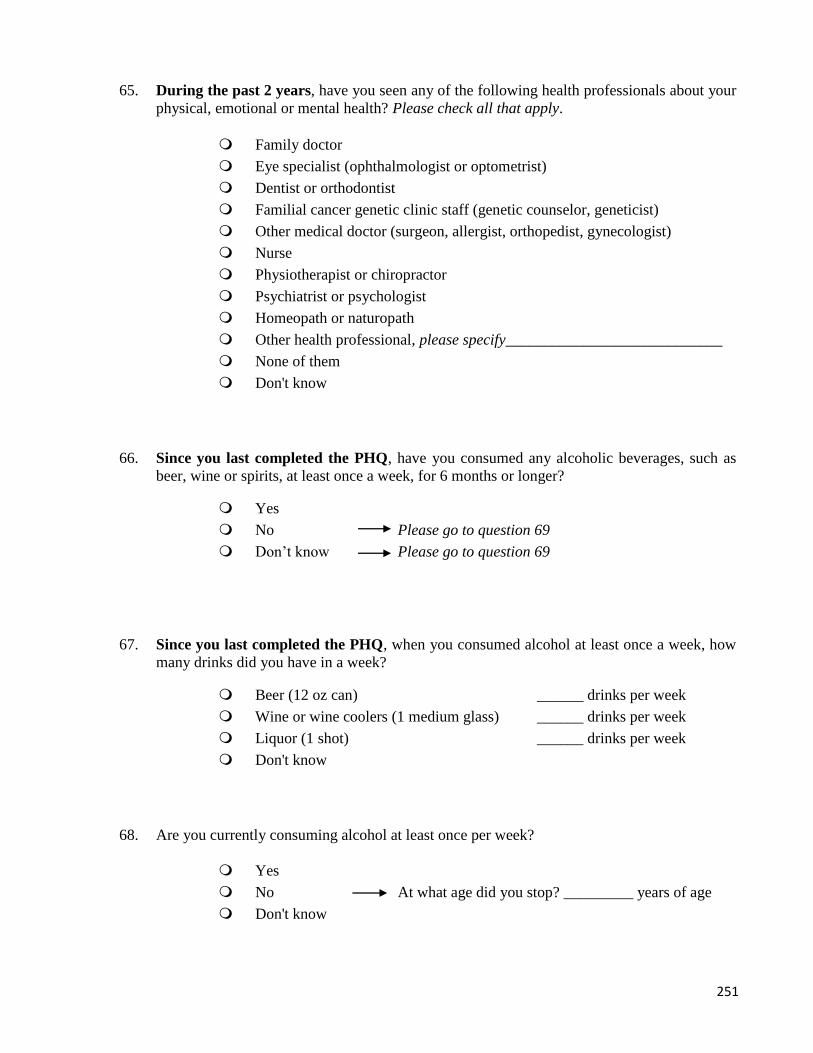
251
65. During the past 2 years, have you seen any of the following health professionals about your
physical, emotional or mental health? Please check all that apply.
Family doctor
Eye specialist (ophthalmologist or optometrist)
Dentist or orthodontist
Familial cancer genetic clinic staff (genetic counselor, geneticist)
Other medical doctor (surgeon, allergist, orthopedist, gynecologist)
Nurse
Physiotherapist or chiropractor
Psychiatrist or psychologist
Homeopath or naturopath
Other health professional, please specify____________________________
None of them
Don't know
66. Since you last completed the PHQ, have you consumed any alcoholic beverages, such as
beer, wine or spirits, at least once a week, for 6 months or longer?
Yes
No
Don’t know
Please go to question 69
Please go to question 69
67. Since you last completed the PHQ, when you consumed alcohol at least once a week, how
many drinks did you have in a week?
______ drinks per week
______ drinks per week
______ drinks per week
Beer (12 oz can)
Wine or wine coolers (1 medium glass)
Liquor (1 shot)
Don't know
68. Are you currently consuming alcohol at least once per week?
Yes
No At what age did you stop? _________ years of age
Don't know
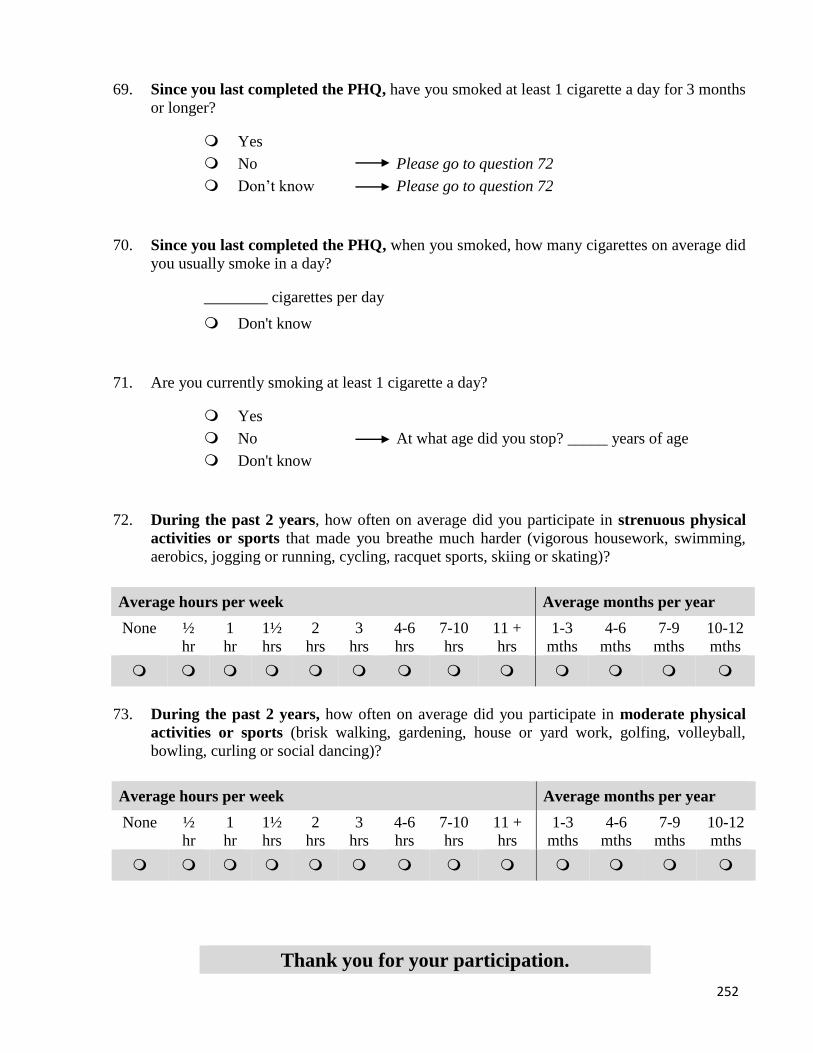
252
69. Since you last completed the PHQ, have you smoked at least 1 cigarette a day for 3 months
or longer?
Yes
No
Don’t know
Please go to question 72
Please go to question 72
70. Since you last completed the PHQ, when you smoked, how many cigarettes on average did
you usually smoke in a day?
________ cigarettes per day
Don't know
71. Are you currently smoking at least 1 cigarette a day?
Yes
No At what age did you stop? _____ years of age
Don't know
72. During the past 2 years, how often on average did you participate in strenuous physical
activities or sports that made you breathe much harder (vigorous housework, swimming,
aerobics, jogging or running, cycling, racquet sports, skiing or skating)?
73. During the past 2 years, how often on average did you participate in moderate physical
activities or sports (brisk walking, gardening, house or yard work, golfing, volleyball,
bowling, curling or social dancing)?
Average hours per week Average months per year
None ½
hr
1
hr
1½
hrs
2
hrs
3
hrs
4-6
hrs
7-10
hrs
11 +
hrs
1-3
mths
4-6
mths
7-9
mths
10-12
mths
Average hours per week Average months per year
None ½
hr
1
hr
1½
hrs
2
hrs
3
hrs
4-6
hrs
7-10
hrs
11 +
hrs
1-3
mths
4-6
mths
7-9
mths
10-12
mths
Thank you for your participation.

ONTARIO FAMILIAL BREAST CANCER REGISTRY Director: Irene L. Andrulis, PhD
610 University Avenue, Toronto, ON M5G 2M9 T: 416-946-4409 1-800-832-5949 F: 416-946-4410
AFFILIATED CENTRES: Juranvinski Cancer Centre London Regional Cancer Program Ottawa Regional Cancer Centre Windsor Regional Cancer Centre
Credit Valley Hospital Mount Sinai Hospital North York General Hospital Princess Margaret Hospital Women’s College Hospital
Cancer Centre of Southeastern Ontario Grand River Regional Cancer Centre Northeastern Ontario Regional Cancer Centre Northwestern Ontario Regional Cancer Centre Toronto Sunnybrook Regional Cancer Centre
Authorization For Release of Medical Information/Tissue
I, hereby authorize the Ontario Cancer Registry or Medical Record Department at
Name of Hospital where surgery was performed
Street address of Hospital where surgery was performed
City Province Postal Code
to release information/tissue pertaining to the diagnosis of cancer or a benign breast condition to Dr. Irene Andrulis,
Principal Investigator, Cancer Care Ontario, 610 University Ave, Toronto, ON M5G 2M9.
Name of Patient: Date of Birth:
Date of diagnosis/surgery:
Type of cancer/surgery:
**Please sign and date this form**
Signature: Date:
Witness: Date:
RE: Patient File #: Study ID#:
For Medical Department **Please return a copy of this authorization form with the medical records**
253
Appendix C. Family History Study - Pathology Consent Form

254
Appendix D. Family History Study - Imaging Consent Form
ONTARIO FAMILIAL BREAST CANCER REGISTRY Director: Irene L. Andrulis, PhD
610 University Avenue, Toronto, ON M5G 2M9 T: 416-946-4409 1-800-832-5949 F: 416-946-4410
AFFILIATED CENTRES: Juranvinski Cancer Centre London Regional Cancer Program Ottawa Regional Cancer Centre Windsor Regional Cancer Centre
Credit Valley Hospital Mount Sinai Hospital North York General Hospital Princess Margaret Hospital Women’s College Hospital
Cancer Centre of Southeastern Ontario Grand River Regional Cancer Centre Northeastern Ontario Regional Cancer Centre Northwestern Ontario Regional Cancer Centre Toronto Sunnybrook Regional Cancer Centre
Authorization For Release of Imaging Information
I, hereby authorize the Medical/Radiology Record Department at
Name of Hospital/clinic where a mammogram was performed
Street address of Hospital/clinic where mammogram was performed
City Province Postal Code
to release any imaging information pertaining to mammography examination to Dr. Anna Chiarelli, Principal Investigator,
Cancer Care Ontario, 610 University Ave, Toronto, ON M5G 2M9.
Name of Patient: Date of Birth:
Date of Mammogram:
**Please sign and date this form**
Signature: Date:
Witness: Date:
RE: Patient File #: Study ID#:
For Medical Department **Please return a copy of this authorization form with the medical records**
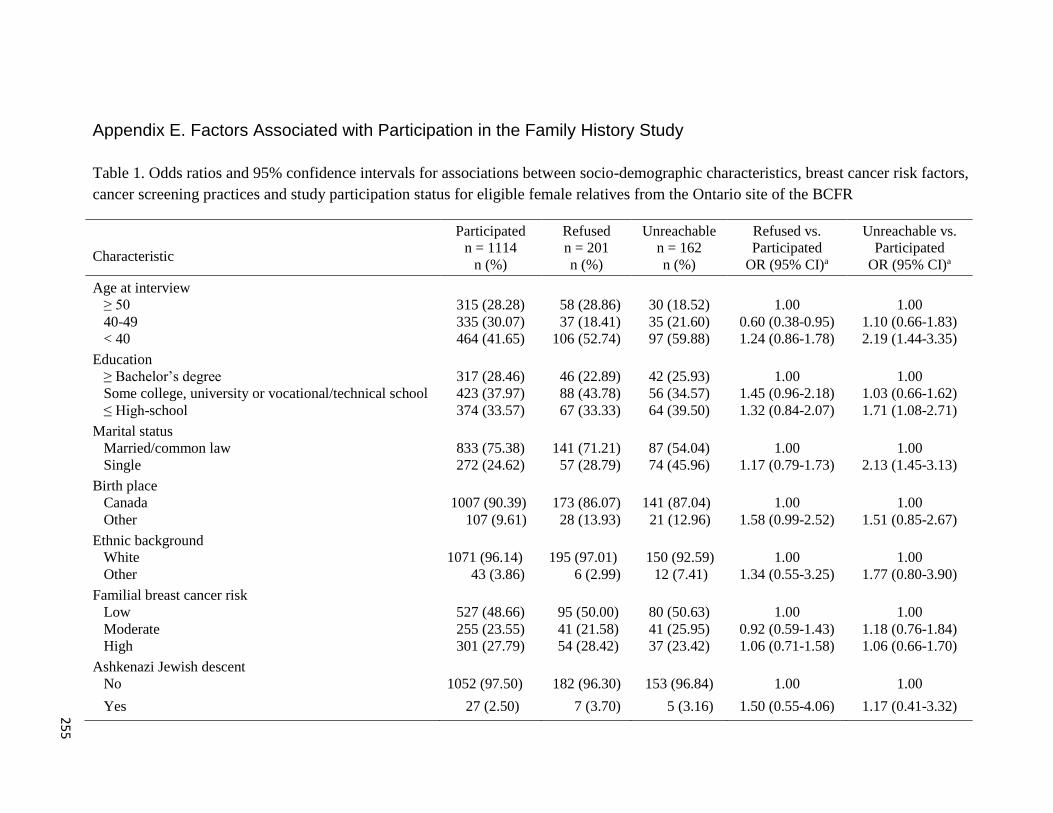
25
5
Appendix E. Factors Associated with Participation in the Family History Study
Table 1. Odds ratios and 95% confidence intervals for associations between socio-demographic characteristics, breast cancer risk factors,
cancer screening practices and study participation status for eligible female relatives from the Ontario site of the BCFR
Characteristic
Participated
n = 1114
n (%)
Refused
n = 201
n (%)
Unreachable
n = 162
n (%)
Refused vs.
Participated
OR (95% CI)a
Unreachable vs.
Participated
OR (95% CI)a
Age at interview
≥ 50 315 (28.28) 58 (28.86) 30 (18.52) 1.00 1.00
40-49 335 (30.07) 37 (18.41) 35 (21.60) 0.60 (0.38-0.95) 1.10 (0.66-1.83)
< 40 464 (41.65) 106 (52.74) 97 (59.88) 1.24 (0.86-1.78) 2.19 (1.44-3.35)
Education
≥ Bachelor’s degree 317 (28.46) 46 (22.89) 42 (25.93) 1.00 1.00
Some college, university or vocational/technical school 423 (37.97) 88 (43.78) 56 (34.57) 1.45 (0.96-2.18) 1.03 (0.66-1.62)
≤ High-school 374 (33.57) 67 (33.33) 64 (39.50) 1.32 (0.84-2.07) 1.71 (1.08-2.71)
Marital status
Married/common law 833 (75.38) 141 (71.21) 87 (54.04) 1.00 1.00
Single 272 (24.62) 57 (28.79) 74 (45.96) 1.17 (0.79-1.73) 2.13 (1.45-3.13)
Birth place
Canada 1007 (90.39) 173 (86.07) 141 (87.04) 1.00 1.00
Other 107 (9.61) 28 (13.93) 21 (12.96) 1.58 (0.99-2.52) 1.51 (0.85-2.67)
Ethnic background
White 1071 (96.14) 195 (97.01) 150 (92.59) 1.00 1.00
Other 43 (3.86) 6 (2.99) 12 (7.41) 1.34 (0.55-3.25) 1.77 (0.80-3.90)
Familial breast cancer risk
Low 527 (48.66) 95 (50.00) 80 (50.63) 1.00 1.00
Moderate 255 (23.55) 41 (21.58) 41 (25.95) 0.92 (0.59-1.43) 1.18 (0.76-1.84)
High 301 (27.79) 54 (28.42) 37 (23.42) 1.06 (0.71-1.58) 1.06 (0.66-1.70)
Ashkenazi Jewish descent
No 1052 (97.50) 182 (96.30) 153 (96.84) 1.00 1.00
Yes 27 (2.50) 7 (3.70) 5 (3.16) 1.50 (0.55-4.06) 1.17 (0.41-3.32)
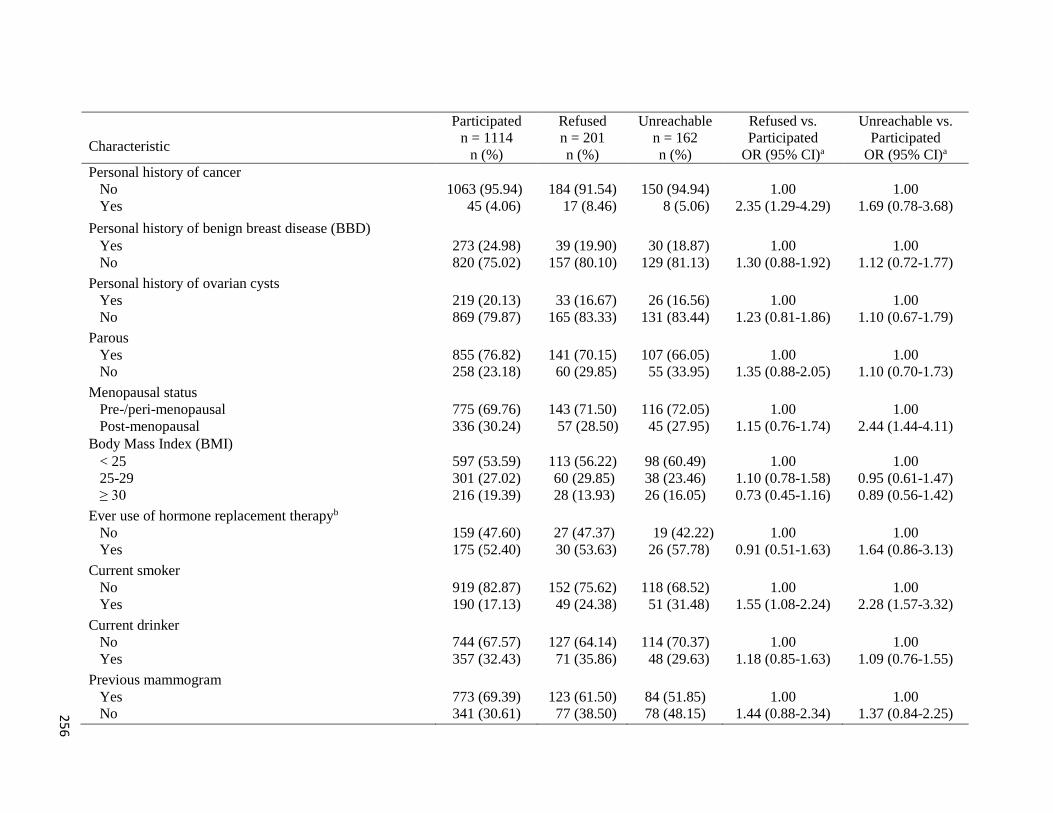
25
6
Characteristic
Participated
n = 1114
n (%)
Refused
n = 201
n (%)
Unreachable
n = 162
n (%)
Refused vs.
Participated
OR (95% CI)a
Unreachable vs.
Participated
OR (95% CI)a
Personal history of cancer
No 1063 (95.94) 184 (91.54) 150 (94.94) 1.00 1.00
Yes 45 (4.06) 17 (8.46) 8 (5.06) 2.35 (1.29-4.29) 1.69 (0.78-3.68)
Personal history of benign breast disease (BBD)
Personal history of BBD
Yes 273 (24.98) 39 (19.90) 30 (18.87) 1.00 1.00
No 820 (75.02) 157 (80.10) 129 (81.13) 1.30 (0.88-1.92) 1.12 (0.72-1.77)
Personal history of ovarian cysts
Yes 219 (20.13) 33 (16.67) 26 (16.56) 1.00 1.00
No 869 (79.87) 165 (83.33) 131 (83.44) 1.23 (0.81-1.86) 1.10 (0.67-1.79)
Parous
Yes 855 (76.82) 141 (70.15) 107 (66.05) 1.00 1.00
No 258 (23.18) 60 (29.85) 55 (33.95) 1.35 (0.88-2.05) 1.10 (0.70-1.73)
Menopausal status
Pre-/peri-menopausal 775 (69.76) 143 (71.50) 116 (72.05) 1.00 1.00
Post-menopausal 336 (30.24) 57 (28.50) 45 (27.95) 1.15 (0.76-1.74) 2.44 (1.44-4.11)
Body Mass Index (BMI)
< 25 597 (53.59) 113 (56.22) 98 (60.49) 1.00 1.00
25-29 301 (27.02) 60 (29.85) 38 (23.46) 1.10 (0.78-1.58) 0.95 (0.61-1.47)
≥ 30 216 (19.39) 28 (13.93) 26 (16.05) 0.73 (0.45-1.16) 0.89 (0.56-1.42)
Ever use of hormone replacement therapyb
No 159 (47.60) 27 (47.37) 19 (42.22) 1.00 1.00
Yes 175 (52.40) 30 (53.63) 26 (57.78) 0.91 (0.51-1.63) 1.64 (0.86-3.13)
Current smoker
No 919 (82.87) 152 (75.62) 118 (68.52) 1.00 1.00
Yes 190 (17.13) 49 (24.38) 51 (31.48) 1.55 (1.08-2.24) 2.28 (1.57-3.32)
Current drinker
No 744 (67.57) 127 (64.14) 114 (70.37) 1.00 1.00
Yes 357 (32.43) 71 (35.86) 48 (29.63) 1.18 (0.85-1.63) 1.09 (0.76-1.55)
Previous mammogram
Yes 773 (69.39) 123 (61.50) 84 (51.85) 1.00 1.00
No 341 (30.61) 77 (38.50) 78 (48.15) 1.44 (0.88-2.34) 1.37 (0.84-2.25)
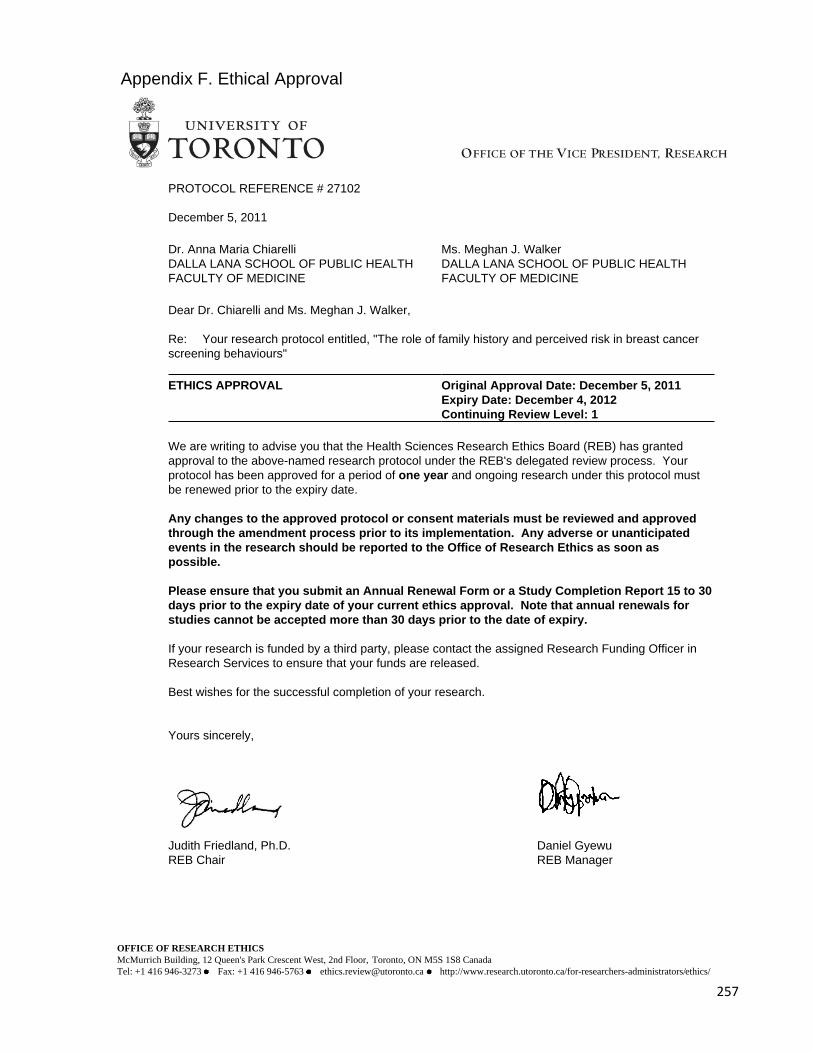
257
Appendix F. Ethical Approval
PROTOCOL REFERENCE # 27102
December 5, 2011
Dr. Anna Maria ChiarelliDALLA LANA SCHOOL OF PUBLIC HEALTHFACULTY OF MEDICINE
Ms. Meghan J. WalkerDALLA LANA SCHOOL OF PUBLIC HEALTHFACULTY OF MEDICINE
Dear Dr. Chiarelli and Ms. Meghan J. Walker,
Re: Your research protocol entitled, "The role of family history and perceived risk in breast cancerscreening behaviours"
ETHICS APPROVAL Original Approval Date: December 5, 2011Expiry Date: December 4, 2012Continuing Review Level: 1
We are writing to advise you that the Health Sciences Research Ethics Board (REB) has grantedapproval to the above-named research protocol under the REB's delegated review process. Yourprotocol has been approved for a period of one year and ongoing research under this protocol mustbe renewed prior to the expiry date.
Any changes to the approved protocol or consent materials must be reviewed and approvedthrough the amendment process prior to its implementation. Any adverse or unanticipatedevents in the research should be reported to the Office of Research Ethics as soon aspossible.
Please ensure that you submit an Annual Renewal Form or a Study Completion Report 15 to 30days prior to the expiry date of your current ethics approval. Note that annual renewals forstudies cannot be accepted more than 30 days prior to the date of expiry.
If your research is funded by a third party, please contact the assigned Research Funding Officer inResearch Services to ensure that your funds are released.
Best wishes for the successful completion of your research.
Yours sincerely,
Judith Friedland, Ph.D.REB Chair
Daniel GyewuREB Manager
OFFICE OF RESEARCH ETHICSMcMurrich Building, 12 Queen's Park Crescent West, 2nd Floor, Toronto, ON M5S 1S8 CanadaTel: +1 416 946-3273 Fax: +1 416 946-5763 [email protected] http://www.research.utoronto.ca/for-researchers-administrators/ethics/
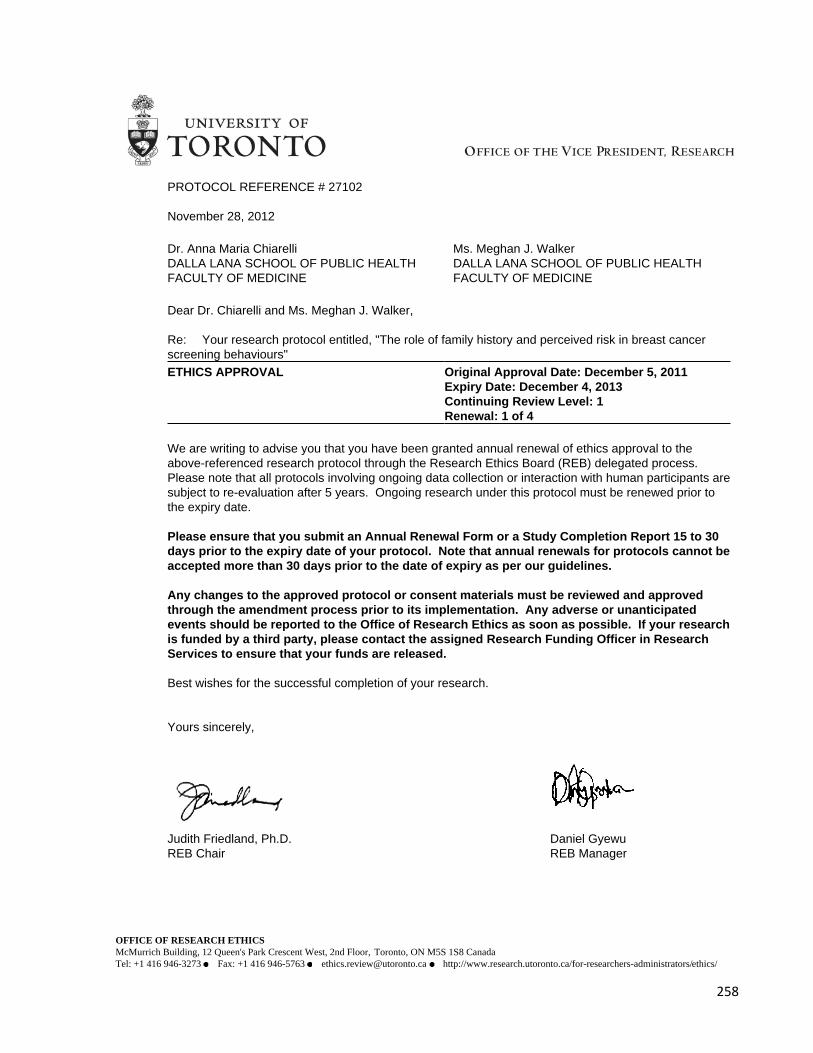
258
PROTOCOL REFERENCE # 27102
November 28, 2012
Dr. Anna Maria ChiarelliDALLA LANA SCHOOL OF PUBLIC HEALTHFACULTY OF MEDICINE
Ms. Meghan J. WalkerDALLA LANA SCHOOL OF PUBLIC HEALTHFACULTY OF MEDICINE
Dear Dr. Chiarelli and Ms. Meghan J. Walker,
Re: Your research protocol entitled, "The role of family history and perceived risk in breast cancerscreening behaviours"
ETHICS APPROVAL Original Approval Date: December 5, 2011Expiry Date: December 4, 2013Continuing Review Level: 1Renewal: 1 of 4
We are writing to advise you that you have been granted annual renewal of ethics approval to theabove-referenced research protocol through the Research Ethics Board (REB) delegated process.Please note that all protocols involving ongoing data collection or interaction with human participants aresubject to re-evaluation after 5 years. Ongoing research under this protocol must be renewed prior tothe expiry date.
Please ensure that you submit an Annual Renewal Form or a Study Completion Report 15 to 30days prior to the expiry date of your protocol. Note that annual renewals for protocols cannot beaccepted more than 30 days prior to the date of expiry as per our guidelines.
Any changes to the approved protocol or consent materials must be reviewed and approvedthrough the amendment process prior to its implementation. Any adverse or unanticipatedevents should be reported to the Office of Research Ethics as soon as possible. If your researchis funded by a third party, please contact the assigned Research Funding Officer in ResearchServices to ensure that your funds are released.
Best wishes for the successful completion of your research.
Yours sincerely,
Judith Friedland, Ph.D.REB Chair
Daniel GyewuREB Manager
OFFICE OF RESEARCH ETHICSMcMurrich Building, 12 Queen's Park Crescent West, 2nd Floor, Toronto, ON M5S 1S8 CanadaTel: +1 416 946-3273 Fax: +1 416 946-5763 [email protected] http://www.research.utoronto.ca/for-researchers-administrators/ethics/
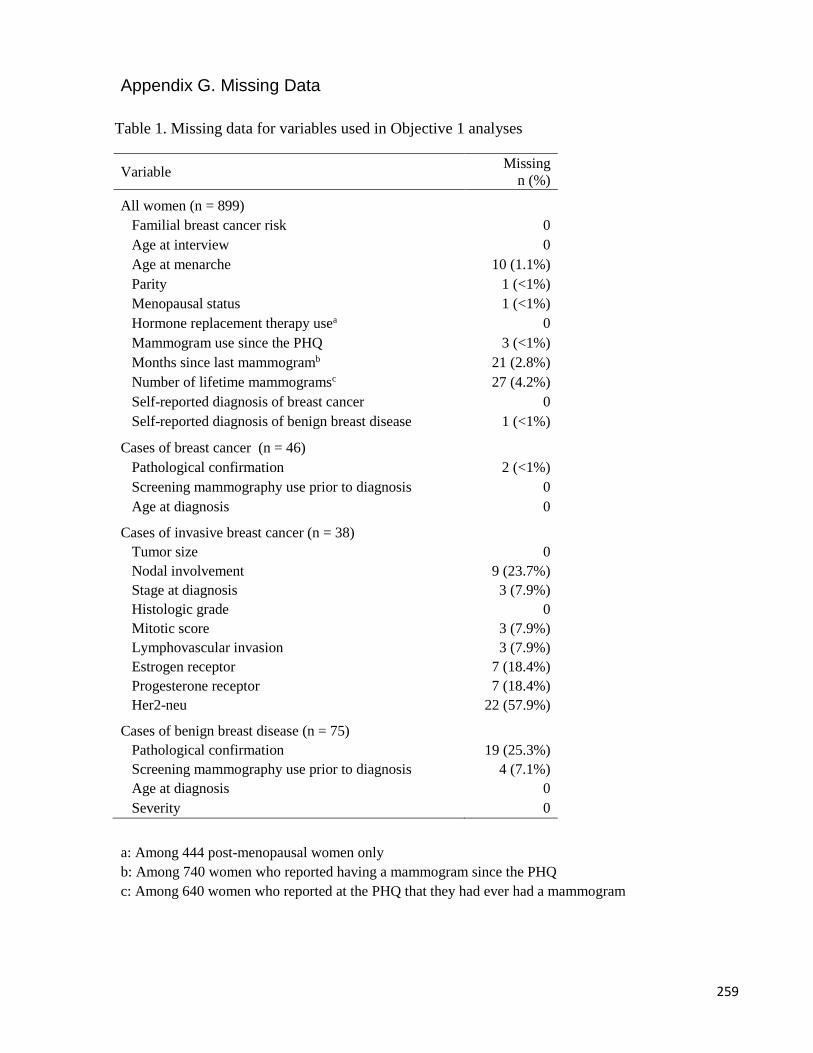
259
Appendix G. Missing Data
Table 1. Missing data for variables used in Objective 1 analyses
a: Among 444 post-menopausal women only
b: Among 740 women who reported having a mammogram since the PHQ
c: Among 640 women who reported at the PHQ that they had ever had a mammogram
Variable Missing
n (%)
All women (n = 899)
Familial breast cancer risk 0
Age at interview 0
Age at menarche 10 (1.1%)
Parity 1 (<1%)
Menopausal status 1 (<1%)
Hormone replacement therapy usea 0
Mammogram use since the PHQ 3 (<1%)
Months since last mammogramb 21 (2.8%)
Number of lifetime mammogramsc 27 (4.2%)
Self-reported diagnosis of breast cancer 0
Self-reported diagnosis of benign breast disease 1 (<1%)
Cases of breast cancer (n = 46)
Pathological confirmation 2 (<1%)
Screening mammography use prior to diagnosis 0
Age at diagnosis 0
Cases of invasive breast cancer (n = 38)
Tumor size 0
Nodal involvement 9 (23.7%)
Stage at diagnosis 3 (7.9%)
Histologic grade 0
Mitotic score 3 (7.9%)
Lymphovascular invasion 3 (7.9%)
Estrogen receptor 7 (18.4%)
Progesterone receptor 7 (18.4%)
Her2-neu 22 (57.9%)
Cases of benign breast disease (n = 75)
Pathological confirmation 19 (25.3%)
Screening mammography use prior to diagnosis 4 (7.1%)
Age at diagnosis 0
Severity 0
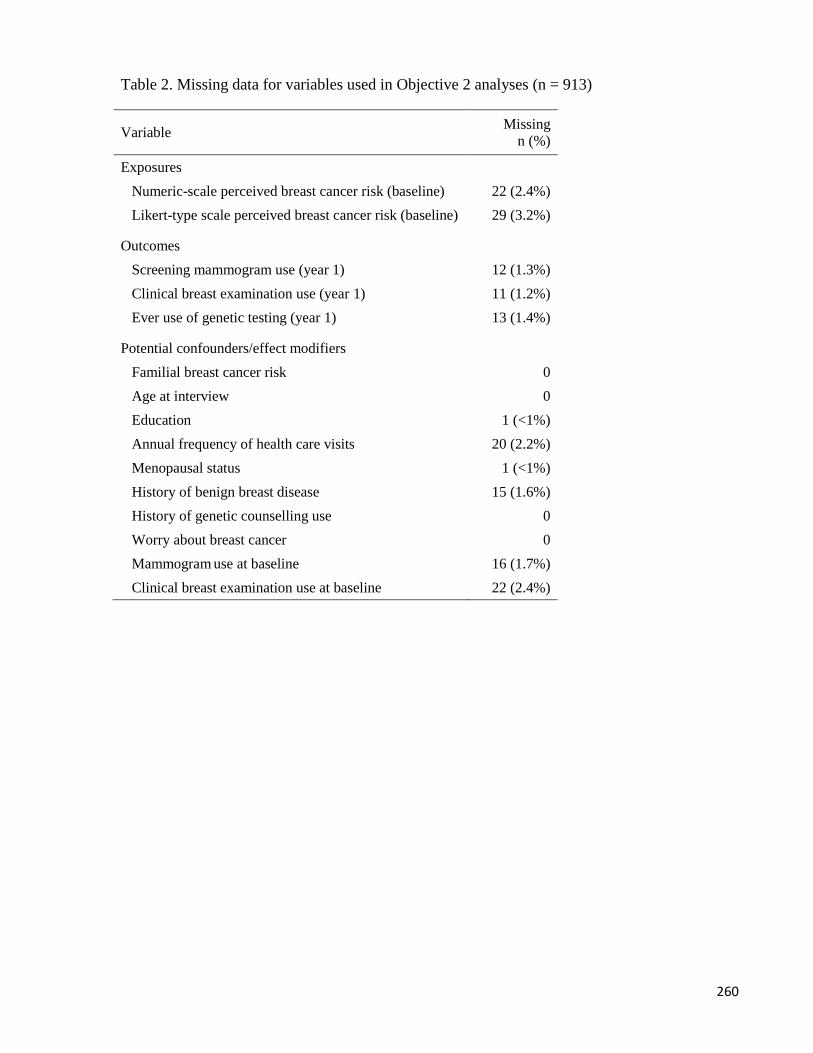
260
Table 2. Missing data for variables used in Objective 2 analyses (n = 913)
Variable Missing
n (%)
Exposures
Numeric-scale perceived breast cancer risk (baseline) 22 (2.4%)
Likert-type scale perceived breast cancer risk (baseline) 29 (3.2%)
Outcomes
Screening mammogram use (year 1) 12 (1.3%)
Clinical breast examination use (year 1) 11 (1.2%)
Ever use of genetic testing (year 1) 13 (1.4%)
Potential confounders/effect modifiers
Familial breast cancer risk 0
Age at interview 0
Education 1 (<1%)
Annual frequency of health care visits 20 (2.2%)
Menopausal status 1 (<1%)
History of benign breast disease 15 (1.6%)
History of genetic counselling use 0
Worry about breast cancer 0
Mammogram use at baseline 16 (1.7%)
Clinical breast examination use at baseline 22 (2.4%)
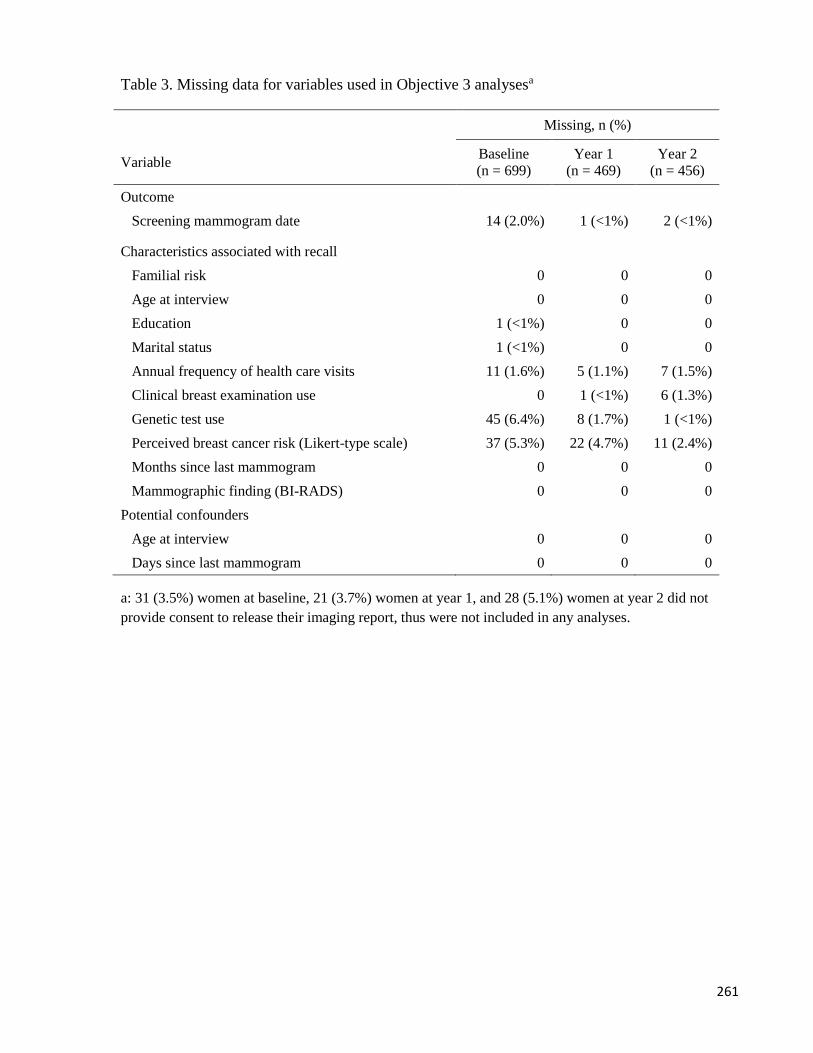
261
Table 3. Missing data for variables used in Objective 3 analysesa
a: 31 (3.5%) women at baseline, 21 (3.7%) women at year 1, and 28 (5.1%) women at year 2 did not
provide consent to release their imaging report, thus were not included in any analyses.
Missing, n (%)
Variable Baseline
(n = 699)
Year 1
(n = 469)
Year 2
(n = 456)
Outcome
Screening mammogram date 14 (2.0%) 1 (<1%) 2 (<1%)
Characteristics associated with recall
Familial risk 0 0 0
Age at interview 0 0 0
Education 1 (<1%) 0 0
Marital status 1 (<1%) 0 0
Annual frequency of health care visits 11 (1.6%) 5 (1.1%) 7 (1.5%)
Clinical breast examination use 0 1 (<1%) 6 (1.3%)
Genetic test use 45 (6.4%) 8 (1.7%) 1 (<1%)
Perceived breast cancer risk (Likert-type scale) 37 (5.3%) 22 (4.7%) 11 (2.4%)
Months since last mammogram 0 0 0
Mammographic finding (BI-RADS) 0 0 0
Potential confounders
Age at interview 0 0 0
Days since last mammogram 0 0 0