Embed Size (px)
Citation preview
BioOne sees sustainable scholarly publishing as an inherently collaborative enterprise connecting authors, nonprofit publishers, academic institutions, researchlibraries, and research funders in the common goal of maximizing access to critical research.
Breakdown rates, nutrient concentrations, and macroinvertebrate colonization ofbluejoint grass litter in headwater streams of the Kenai Peninsula, AlaskaAuthor(s): Rebecca S. Shaftel, Ryan S. King, and Jeffrey A. BackSource: Journal of the North American Benthological Society, 30(2):386-398. 2011.Published By: The Society for Freshwater ScienceDOI: http://dx.doi.org/10.1899/10-086.1URL: http://www.bioone.org/doi/full/10.1899/10-086.1
BioOne (www.bioone.org) is a nonprofit, online aggregation of core research in the biological, ecological, andenvironmental sciences. BioOne provides a sustainable online platform for over 170 journals and books publishedby nonprofit societies, associations, museums, institutions, and presses.
Your use of this PDF, the BioOne Web site, and all posted and associated content indicates your acceptance ofBioOne’s Terms of Use, available at www.bioone.org/page/terms_of_use.
Usage of BioOne content is strictly limited to personal, educational, and non-commercial use. Commercial inquiriesor rights and permissions requests should be directed to the individual publisher as copyright holder.
Breakdown rates, nutrient concentrations, and macroinvertebratecolonization of bluejoint grass litter in headwater streams of the
Kenai Peninsula, Alaska
Rebecca S. Shaftel1, Ryan S. King2, AND Jeffrey A. Back3
Department of Biology, Center for Reservoir and Aquatic Systems Research, Baylor University,One Bear Place #97388, Waco, Texas 76798 USA
Abstract. Grass litter can be a dominant detritus type in many streams. However, use of this C source instream food webs often is viewed as insignificant because of its relatively slow breakdown rates and lownutritional quality. We deployed leaf packs containing senesced bluejoint grass (Calamagrostis canadensis)across a natural nutrient gradient of 6 salmon-rearing headwater streams on the lower Kenai Peninsula,Alaska. We hypothesized that litter-colonizing microbes would use dissolved stream nutrients andenhance breakdown rates, litter nutrient concentrations, and densities of macroinvertebrates acrossstreams. Leaf-pack mass and nutrient concentrations were measured on the material at 0 (predeployment),2, 4, 6, and 8 wk in all streams. Breakdown rates were calculated from the mass measurements with anexponential decay model. Macroinvertebrate composition and abundance were measured at 8 wk in allstreams and every 2 wk in 1 stream. Breakdown rates of bluejoint litter were relatively low (20–30% massloss over 2 mo), but similar to rates found in previous studies of senesced grass litter. Weighted regressionsshowed that bluejoint breakdown rates in the 6 streams were significantly (p , 0.05) related to dissolvedstream nutrient concentrations (r2
= 0.94 and 0.67 for dissolved inorganic N and PO4-P, respectively), litternutrient concentration (r2
= 0.72 and 0.96 for leaf % N and % P, respectively), total macroinvertebrates/g(r2
= 0.73), and nonmetric multidimensional scaling-axis-1 scores of macroinvertebrate communitystructure (r2
= 0.80). Litter nutrients changed after just 2 wk and were increasingly and significantly relatedto stream nutrient concentrations over time. NMS ordination showed that succession of macroinvertebrateson leaf packs from one stream followed a distinct direction over time, and a large shift inmacroinvertebrate community structure occurred between weeks 6 and 8, a result potentially indicatinga consumer response to microbial conditioning. The abundance and diversity of macroinvertebrate taxausing bluejoint litter provide evidence that it is an important habitat and energy pathway for consumers inheadwater streams of the Kenai Peninsula. In addition, climate change has the potential to changeterrestrial vegetation assemblages, which drive differences in stream nutrient concentrations in this region.If N-fixing shrubs become more abundant in the future, litter-decomposition rates will be positivelyaffected by increases in both stream and leaf-litter nutrient concentrations.
Key words: leaf decomposition, food quality, nitrogen, phosphorus, juvenile salmonids, riparianwetlands, Alnus.
Energy inputs to headwater streams are dominatedby allochthonous sources because of their narrowchannels and overhanging vegetation (Benfield 1997,Richardson and Danehy 2007). These inputs are animportant C source for microbial and macroinverte-brate consumers that use leaf litter directly (Cumminset al. 1989, Graca 2001, Findlay 2010) and for highertrophic levels, such as macroinvertebrate predators
and fish (Junger and Planas 1994, Doucett et al. 1996,Perry et al. 2003). Most studies in which the fate ofterrestrial litter inputs in headwater streams havebeen examined focused on deciduous shrub and treeleaves (Wipfli et al. 2007, Tank et al. 2010), althoughother organic matter inputs, such as woody debris,mosses, and grasses, also may contribute to theorganic matter budget in small streams (McTammanyet al. 2008, Leberfinger and Bohman 2010).
Grasses have received little attention as an al-lochthonous resource, most likely because of conclu-sions from several studies that their low nutrient
1 E-mail addresses: [email protected] [email protected] [email protected]
J. N. Am. Benthol. Soc., 2011, 30(2):386–398’ 2011 by The North American Benthological SocietyDOI: 10.1899/10-086.1Published online: 1 March 2011
386
concentration makes them a poor food resource formacroinvertebrate consumers (e.g., Webster and Ben-field 1986, Menninger and Palmer 2007). However,many streams, including large grassland streams(Huryn et al. 2001, Zeug and Winemiller 2008),agricultural streams with deforested riparian areas(Menninger and Palmer 2007), or small open-cano-pied streams (Niyogi et al. 2003, Leberfinger andBohman 2010), receive substantial inputs of allochtho-nous grass litter. No consensus currently existsregarding the importance of grasses to streamconsumers. Results of some studies suggest thatgrasses are a poor food resource or habitat (Scars-brook and Townsend 1994) or are minimally con-sumed by macroinvertebrates relative to deciduous-tree litter (Leberfinger and Bohman 2010), but otherresults suggest that grass litter can be an important Csource, contributing a large proportion of the energyused in biomass formation by macroinvertebrates(Huryn et al. 2001) and fish (Zeug and Winemiller2008). Despite their poor nutritional quality, grassesmay be an important energy resource when theydominate the riparian communities of stream ecosys-tems.
Litter nutrient concentrations play an importantrole in initial colonization by microbes (Barlocher1985) and subsequent consumption by macroinverte-brates (Haapala et al. 2001, Hladyz et al. 2009). Low-nutrient litter tends to break down slowly (Gessnerand Chauvet 1994, Richardson et al. 2004), but ratescan be enhanced by dissolved nutrients in the streamwater (Suberkropp and Chauvet 1995). Experimentalnutrient additions of N and P can increase decompo-sition rates (Robinson and Gessner 2000, Gulis andSuberkropp 2003) and increase macroinvertebrate(Robinson and Gessner 2000), bacterial (Gulis andSuberkropp 2003), and fungal biomass (Gulis andSuberkropp 2003). Breakdown rates of nutrient-poorC sources, such as grass, may be particularlyenhanced by dissolved nutrient subsidies (Ferreira etal. 2006, Greenwood et al. 2007). Thus, dissolvednutrient concentrations in streams may be an impor-tant factor driving use of grasses as a C source tomicrobes and higher tropic levels.
Our study was conducted in 6 small, 1st-orderstreams on the lower Kenai Peninsula, Alaska (USA).Headwater streams in this region are frequently open-canopied and bordered by extensive riparian wet-lands dominated by bluejoint grass (Calamagrostiscanadensis). Because of their small size, these streamsreceive little to no subsidies of marine-derivednutrients or C from adult salmon. However, theysupport juvenile salmonids, particularly coho salmon(Oncorhynchus kisutch) and Dolly Varden (Salvelinus
malma) that disperse upstream from spawning areasin larger reaches downstream. Grass is the dominantriparian plant species and a potential source ofterrestrial organic matter, so it could be an importantenergy source for macroinvertebrate consumers andthe juvenile salmonids that feed on them.
The 6 streams spanned a nutrient gradient causedmostly by differences in alder cover, a N-fixing shrubthat contributes most of the dissolved NO3 to streamsin this region (Shaftel et al. 2010). The objectives of ourstudy were to: 1) estimate breakdown rates of blue-joint grass, 2) contrast breakdown rates and nutrientconcentrations of litter across a nutrient gradientspanning the 6 streams, and 3) evaluate macroinver-tebrate colonization and temporal succession ofcommunity structure on leaf packs. We hypothesizedthat bluejoint breakdown rate, litter nutrient concen-trations, and macroinvertebrate abundance would bepositively associated with higher stream nutrientconcentrations.
Methods
Study area
Headwater streams of the lower Kenai Peninsulaare part of 5 major watersheds that flow westerly intoCook Inlet: Ninilchik River, Deep Creek, StariskiCreek, and the North and South Forks of the AnchorRiver. The lower Kenai Peninsula is largely undevel-oped. The region has 2 small cities (population ,5000in 2005 census estimates), and ,1% of its area is inagricultural land (2007 Census of Agriculture; http://www.agcensus.usda.gov/index.asp). The closest weatherstation to the study area is the Homer Airport, wheretotal precipitation from 1932 to 2005 averaged 63 cmannually, ,13 to 18 cm of which were snow. Theaverage maximum temperature occurs in July at16.1uC, and the minimum occurs in January at28.5uC (Western Region Climate Center; http://www.wrcc.dri.edu/summary/climsmak.html).
The headwater streams included in our study are inthe interior of the lower Kenai Peninsula andprobably experience warmer temperatures and moreprecipitation in the form of snow than Homer, whichis on the coast. Vegetation consists of mixed forestsdominated by lutz spruce (Picea lutzii), white spruce(Picea glauca), and paper birch (Betula papyrifera),interspersed with willow (Salix spp.) and alder (Alnusspp.) thickets and meadows dominated by bluejointgrass and fireweed (Chamerion angustifolium) (Rey-nolds 1990, Viereck et al. 1992). Wetlands cover 43%
of the area (Gracz et al. 2004). Terrestrial P originatesfrom volcanic ash layers deposited in soils (Dugdaleand Dugdale 1961, Ping and Michaelson 1986).
2011] GRASS DECOMPOSITION IN HEADWATER STREAMS 387
Terrestrial N sources include several genera of N-fixing plants (for example, Myrica, Shepherdia, andDryas), but primarily Alnus spp. Atmospheric Ndeposition in Alaska is low, averaging 0.58 kg ha21 y21
(sum of NH4-N and NO3-N deposition for DenaliNational Park; National Trends Network; http://nadp.sws.uiuc.edu/NTN/).
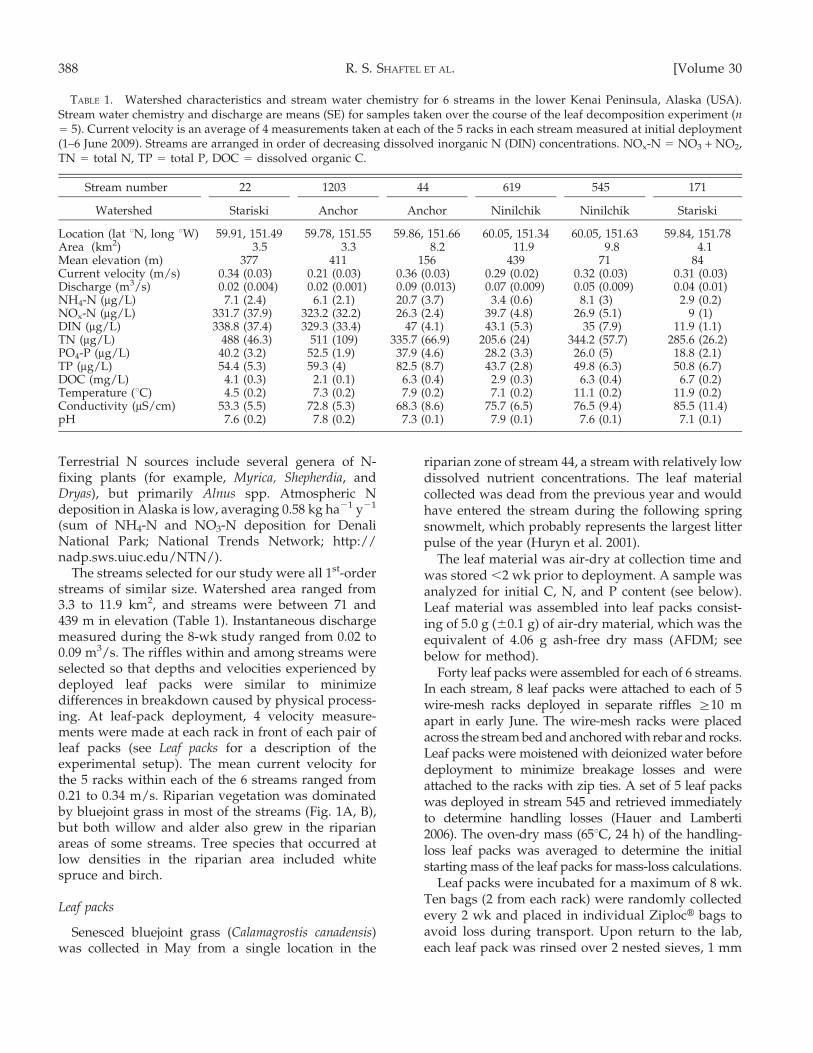
The streams selected for our study were all 1st-orderstreams of similar size. Watershed area ranged from3.3 to 11.9 km2, and streams were between 71 and439 m in elevation (Table 1). Instantaneous dischargemeasured during the 8-wk study ranged from 0.02 to0.09 m3/s. The riffles within and among streams wereselected so that depths and velocities experienced bydeployed leaf packs were similar to minimizedifferences in breakdown caused by physical process-ing. At leaf-pack deployment, 4 velocity measure-ments were made at each rack in front of each pair ofleaf packs (see Leaf packs for a description of theexperimental setup). The mean current velocity forthe 5 racks within each of the 6 streams ranged from0.21 to 0.34 m/s. Riparian vegetation was dominatedby bluejoint grass in most of the streams (Fig. 1A, B),but both willow and alder also grew in the riparianareas of some streams. Tree species that occurred atlow densities in the riparian area included whitespruce and birch.
Leaf packs
Senesced bluejoint grass (Calamagrostis canadensis)was collected in May from a single location in the
riparian zone of stream 44, a stream with relatively lowdissolved nutrient concentrations. The leaf materialcollected was dead from the previous year and wouldhave entered the stream during the following springsnowmelt, which probably represents the largest litterpulse of the year (Huryn et al. 2001).
The leaf material was air-dry at collection time andwas stored ,2 wk prior to deployment. A sample wasanalyzed for initial C, N, and P content (see below).Leaf material was assembled into leaf packs consist-ing of 5.0 g (60.1 g) of air-dry material, which was theequivalent of 4.06 g ash-free dry mass (AFDM; seebelow for method).
Forty leaf packs were assembled for each of 6 streams.In each stream, 8 leaf packs were attached to each of 5wire-mesh racks deployed in separate riffles §10 mapart in early June. The wire-mesh racks were placedacross the stream bed and anchored with rebar and rocks.Leaf packs were moistened with deionized water beforedeployment to minimize breakage losses and wereattached to the racks with zip ties. A set of 5 leaf packswas deployed in stream 545 and retrieved immediatelyto determine handling losses (Hauer and Lamberti2006). The oven-dry mass (65uC, 24 h) of the handling-loss leaf packs was averaged to determine the initialstarting mass of the leaf packs for mass-loss calculations.
Leaf packs were incubated for a maximum of 8 wk.Ten bags (2 from each rack) were randomly collectedevery 2 wk and placed in individual ZiplocH bags toavoid loss during transport. Upon return to the lab,each leaf pack was rinsed over 2 nested sieves, 1 mm
TABLE 1. Watershed characteristics and stream water chemistry for 6 streams in the lower Kenai Peninsula, Alaska (USA).Stream water chemistry and discharge are means (SE) for samples taken over the course of the leaf decomposition experiment (n= 5). Current velocity is an average of 4 measurements taken at each of the 5 racks in each stream measured at initial deployment(1–6 June 2009). Streams are arranged in order of decreasing dissolved inorganic N (DIN) concentrations. NOx-N = NO3 + NO2,TN = total N, TP = total P, DOC = dissolved organic C.
Stream number 22 1203 44 619 545 171
Watershed Stariski Anchor Anchor Ninilchik Ninilchik Stariski
Location (lat uN, long uW) 59.91, 151.49 59.78, 151.55 59.86, 151.66 60.05, 151.34 60.05, 151.63 59.84, 151.78Area (km2) 3.5 3.3 8.2 11.9 9.8 4.1Mean elevation (m) 377 411 156 439 71 84Current velocity (m/s) 0.34 (0.03) 0.21 (0.03) 0.36 (0.03) 0.29 (0.02) 0.32 (0.03) 0.31 (0.03)Discharge (m3/s) 0.02 (0.004) 0.02 (0.001) 0.09 (0.013) 0.07 (0.009) 0.05 (0.009) 0.04 (0.01)NH4-N (mg/L) 7.1 (2.4) 6.1 (2.1) 20.7 (3.7) 3.4 (0.6) 8.1 (3) 2.9 (0.2)NOx-N (mg/L) 331.7 (37.9) 323.2 (32.2) 26.3 (2.4) 39.7 (4.8) 26.9 (5.1) 9 (1)DIN (mg/L) 338.8 (37.4) 329.3 (33.4) 47 (4.1) 43.1 (5.3) 35 (7.9) 11.9 (1.1)TN (mg/L) 488 (46.3) 511 (109) 335.7 (66.9) 205.6 (24) 344.2 (57.7) 285.6 (26.2)PO4-P (mg/L) 40.2 (3.2) 52.5 (1.9) 37.9 (4.6) 28.2 (3.3) 26.0 (5) 18.8 (2.1)TP (mg/L) 54.4 (5.3) 59.3 (4) 82.5 (8.7) 43.7 (2.8) 49.8 (6.3) 50.8 (6.7)DOC (mg/L) 4.1 (0.3) 2.1 (0.1) 6.3 (0.4) 2.9 (0.3) 6.3 (0.4) 6.7 (0.2)Temperature (uC) 4.5 (0.2) 7.3 (0.2) 7.9 (0.2) 7.1 (0.2) 11.1 (0.2) 11.9 (0.2)Conductivity (mS/cm) 53.3 (5.5) 72.8 (5.3) 68.3 (8.6) 75.7 (6.5) 76.5 (9.4) 85.5 (11.4)pH 7.6 (0.2) 7.8 (0.2) 7.3 (0.1) 7.9 (0.1) 7.6 (0.1) 7.1 (0.1)
388 R. S. SHAFTEL ET AL. [Volume 30
and 250 mm, to remove adhering debris and macro-invertebrates. Leaf material collected from the 1-mmsieve consisted of coarse particulate organic matter(CPOM; §1 mm) that had not yet decomposed to fineparticulate organic matter (FPOM; ,1 mm). CPOMwas transferred from the 1-mm sieve to a plastic boat,dried at 65uC for 24 h, placed in a desiccator to cool,and weighed to obtain oven-dry mass. Large macro-invertebrates picked from the 1-mm sieve, and allorganic material and organisms in the 250-mm sievewere preserved in 10% buffered formalin.
Oven-dried leaf material was homogenized initiallyin a coffee grinder. A subsample was subjected tosecondary homogenization to a powder in a Mini-BeadbeaterTM (Biospec Products, Bartlesville, Okla-homa). Subsamples of powdered leaf material (20–600 mg depending on amount of leaf materialremaining) were placed in aluminum weigh pans,dried at 60uC overnight, placed in a desiccator to cool,and weighed to obtain an initial sample mass forAFDM calculations. Samples were then ignited at550uC for 2 h and weighed again (Heiri et al. 2001).The proportion of AFDM was calculated for eachsubsample by subtracting the final mass (ash) fromthe initial sample mass and dividing by the initialsample mass. To calculate final AFDM, the oven-drymass for each leaf pack was multiplied by theproportion of AFDM. Percentage remaining leaf masswas calculated by dividing the final AFDM by theinitial AFDM. Approximately 6 to 8 mg of powdered
leaf material were weighed into 5 3 9-mm aluminumtins and % C and % N were estimated on aThermoQuest Flash EATM 1112 elemental analyzer(CE Instruments, Hindley Green, UK). Percent P wasestimated from digestions of 1 to 3 mg of material on aQuikChem 8500 flow-injection autoanalyzer (LachatInstruments, Loveland, Colorado) with the molybdatecolorimetric method (Faerovig and Hessen 2003).
Preserved macroinvertebrates were identified andcounted from all leaf packs collected at 8 wk and fromleaf packs collected from stream 1203 at 2, 4, and 6 wk.Stream 1203 was selected for evaluation of macroin-vertebrate colonization because its high nutrientconcentrations were expected to stimulate highdiversity and abundance of macroinvertebrates onthe leaf packs. Macroinvertebrates in most insectorders were identified to genus, except for Chirono-midae (subfamily), Simuliidae (family), and earlyinstars that could not be identified below order orfamily, with keys in Wiederholm 1983, Wiggins 1996,and Merritt et al. 2008. The remaining macroinverte-brates were identified to class or order (e.g., bivalves,gastropods, hydracaranids; Thorp and Covich 2001,Voshell 2002). Taxonomic references also were used toassign feeding habits for the macroinvertebrate taxa.
Stream physical and chemical variables
Water-temperature data loggers (HOBOH Pro v2;Onset Corporation, Bourne, Massachusetts) deployed
FIG. 1. Headwater stream valley bottom (A) and study reach (B). Bluejoint grass is a dominant riparian vegetation species, anddead litter reaches streams through lateral transport or from overhanging banks.
2011] GRASS DECOMPOSITION IN HEADWATER STREAMS 389
in each stream recorded temperature every 15 min forthe duration of the decomposition study. In addition,water samples were collected for nutrient analysis,and in-situ water chemistry and stream dischargewere measured simultaneously with leaf pack de-ployment and retrieval. A YSI 556 Multiprobe System(Yellow Springs Instruments, Yellow Springs, Ohio)was calibrated before each biweekly field event andwas used to measure pH and conductivity. Instanta-neous discharge was measured using a Marsh–McBirney Flo-MateTM flow meter and a top-settingwading rod (Marsh–McBirney, Frederick, Maryland).Water samples were analyzed for total N (TN), NO3 +NO2 (NOx-N), NH4-N, total P (TP), orthophosphate(PO4-P), and dissolved organic C (DOC). Samples fordissolved nutrients were filtered in the field with a0.45-mm filter and syringe. All water samples exceptfor DOC were analyzed according to standardmethods (APHA 2005) on a flow-injection autoana-lyzer (Lachat QuikChem 8500 and Series 520 XYZAutosampler). Analysis for NOx-N followed thecadmium-reduction method. NH4-N was analyzedusing the phenelate method. TN was digested inpersulfate and sodium hydroxide, buffered in boricacid, and run as above for NOx-N. Stream NOx-N andNH4-N were summed to determine dissolved inor-ganic N (DIN). Water samples were analyzed for PO4-P using the ammonium-molybdate method. TPsamples were digested in persulfate and analyzed asabove for PO4-P. DOC samples were acidified using50 mL of 6N HCl and analyzed with the high-temperature combustion method on a ShimadzuTOC-VCSH Analyzer and ASI-V Autosampler (Shi-madzu, Kyoto, Japan) (APHA 2005).
Data analysis
All leaf decomposition endpoints (leaf mass, % C,% N, % P, and macroinvertebrate abundances) wereaveraged for the 2 leaf packs collected from each rackfor a single time period. This procedure simplified thedata set to 5 replicates each in 6 streams for everybiweekly sampling period. Mass loss was approxi-mated using an exponential decay model: Mt =
M0e2kt, where Mt is the mass at time t, M0 is theinitial mass, and k is the exponential decay coefficient(Graca et al. 2005). Decay coefficients were calculatedas a function of time in days and degree days. Degreedays were calculated by summing the average dailytemperature for each incubation period in theindividual streams.
Mean leaf % N and % P were compared todissolved stream nutrient concentrations (DIN andPO4-P) for each sampling period (2, 4, 6, and 8 wk) to
examine the relationship between dissolved nutrientavailability and microbial colonization (Barlocher1985). To determine whether changes in litter nutrientconcentrations were the result of microbial immobi-lization of dissolved nutrients or leaching of Ccompounds, changes in the mass of nutrients alsowere evaluated (Findlay 2010). DIN was log(x)-transformed to improve normality. Stream nutrientconcentrations were means of the samples collectedbefore the sampling period (e.g., mean of 0 and 2 wkfor the 2-wk regression, mean of 0, 2, and 4 wk for the4-wk regression). A weighted regression model wasused with stream nutrient concentrations predictingleaf % N and % P for each sampling period. The meanleaf % N and % P were weighted by 1/s2. Variancewas based on the 5 racks in each stream.
Weighted regression also was used to examine theimportance of stream nutrient concentrations, leafnutrient concentrations, and macroinvertebrate indices(total no./g and total taxa/leaf pack) as predictors ofthe breakdown rate for all 6 streams. Means over the 8-wk study were used for stream nutrient concentrationsand leaf nutrient concentrations. Macroinvertebrateindices were based on data from week 8.
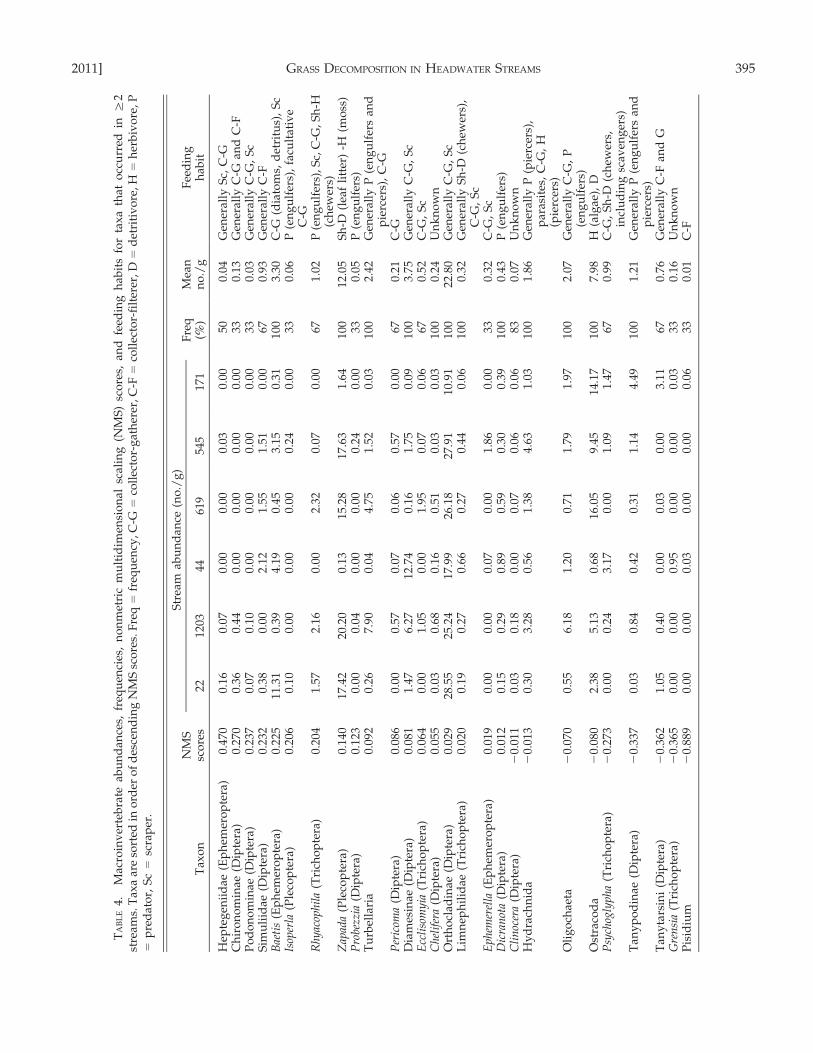
Individual taxon abundances counted on each leafpack at week 8 were standardized to numbers/massremaining (g AFDM) and log(x + 1)-transformed.Nonmetric multidimensional scaling (NMS) was usedto ordinate the multivariate macroinvertebrate com-munity abundance data for the 5 racks in each of the 6streams at 8 wk. The Bray–Curtis distance measurewas used to transform the species matrix. Theordination was rotated to match the breakdown rate.The arrangement of sites along the 2nd axis wasstrongly driven by unique taxa present in 1 site.Therefore, NMS axis-1 scores were used to describedifferences in macroinvertebrate community structureamong the 6 streams in remaining analyses. The NMSaxis-1 scores were used to predict the breakdown ratein a weighted regression to examine the relationshipbetween macroinvertebrates and leaf decomposition.In addition, weighted averages were calculated fromthe NMS ordination for the 27 taxa that occurred in§1 stream. The weighted-average scores from NMSaxis 1 were used to examine species locations alongthe stream gradient.
NMS was run (as described above) on the taxonabundances for the 2-, 4-, 6-, and 8-wk samplingperiods to evaluate macroinvertebrate communitysuccession over time on the leaf packs in stream1203. Successional vectors showed the change indirection and magnitude of colonization from 2 to8 wk. A multivariate permutation procedure wasused to assess differences in community composition
390 R. S. SHAFTEL ET AL. [Volume 30
between time periods. Indicator species analysis (ISA)was used to evaluate taxa significantly associatedwith each time period. ISA combines the relativeabundance (concentration of abundance into a partic-ular group) and relative frequency (proportion of sitesin each group that contain the species) to calculate anindicator value for each species (McCune and Grace2002). A species is assigned to the group for which ithas the highest indicator value, and a permutationtest (n = 500) is run to evaluate the probability thatthe indicator value is higher than would be obtainedby chance.
All data analyses were done in the R statisticalprogram (version 2.10.1; R Development Core Team,Vienna, Austria). The nlme library was used for themixed models (Pinheiro et al. 2009), vegan and ecodistlibraries were used for the multivariate macroinver-tebrate analysis (Goslee and Urban 2007, Oksanen etal. 2009), labdsv was used for ISA (Roberts 2010), andplotrix and stringr were used for graphical functions(Lemon et al. 2009, Wickham 2010).
Results
Stream water chemistry
Mean stream DIN concentrations ranged from 11.9to 338.8 mg/L, and PO4-P concentrations ranged from18.8 to 52.5 mg/L among streams (Table 1). StreamDIN was correlated with stream PO4-P (r2
= 0.79, p =
0.02). DOC concentrations were relatively high in allstreams and ranged from 2.1 to 6.7 mg/L. DOC wasnot correlated with DIN or PO4-P (p . 0.05). Averagedaily stream temperatures ranged from 4.5 to 11.9uC.Velocity was similar among streams.
Leaf-pack breakdown rates among streams
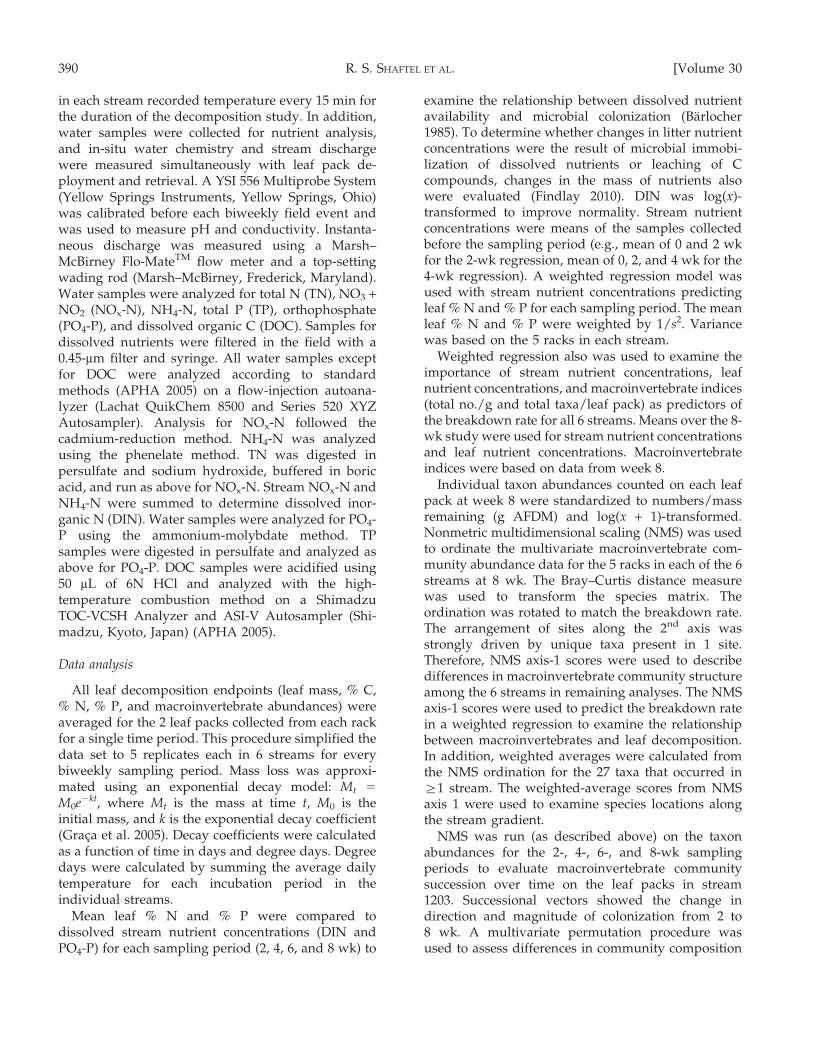
The amount of leaf material remaining among the 6streams ranged from 71 to 82% at the end of the 8-wkstudy (Fig. 2A, B). Total degree days for the 6 streamsranged from 260 to 670. Breakdown rates per day (d21)ranged from 0.0035 to 0.0060 (Table 2), whereas ratesper degree day (dd21) ranged from 0.0003 to 0.0009.
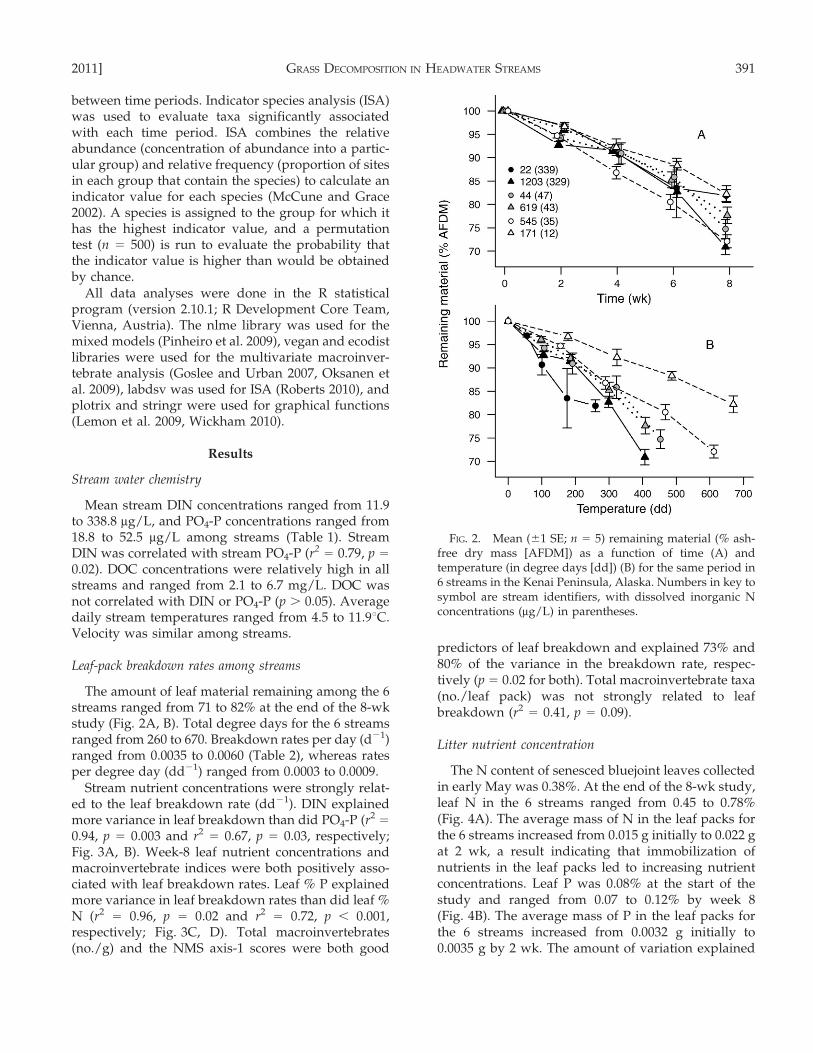
Stream nutrient concentrations were strongly relat-ed to the leaf breakdown rate (dd21). DIN explainedmore variance in leaf breakdown than did PO4-P (r2
=
0.94, p = 0.003 and r2= 0.67, p = 0.03, respectively;
Fig. 3A, B). Week-8 leaf nutrient concentrations andmacroinvertebrate indices were both positively asso-ciated with leaf breakdown rates. Leaf % P explainedmore variance in leaf breakdown rates than did leaf %
N (r2= 0.96, p = 0.02 and r2
= 0.72, p , 0.001,respectively; Fig. 3C, D). Total macroinvertebrates(no./g) and the NMS axis-1 scores were both good
predictors of leaf breakdown and explained 73% and80% of the variance in the breakdown rate, respec-tively (p = 0.02 for both). Total macroinvertebrate taxa(no./leaf pack) was not strongly related to leafbreakdown (r2
= 0.41, p = 0.09).
Litter nutrient concentration
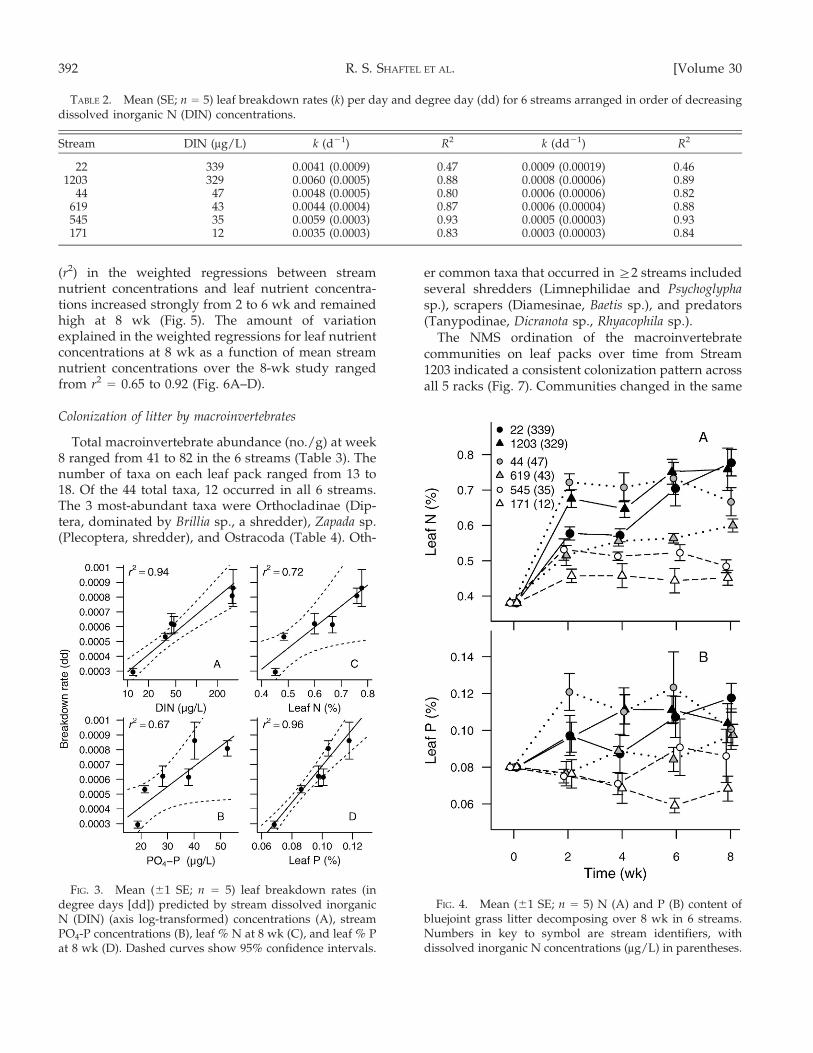
The N content of senesced bluejoint leaves collectedin early May was 0.38%. At the end of the 8-wk study,leaf N in the 6 streams ranged from 0.45 to 0.78%
(Fig. 4A). The average mass of N in the leaf packs forthe 6 streams increased from 0.015 g initially to 0.022 gat 2 wk, a result indicating that immobilization ofnutrients in the leaf packs led to increasing nutrientconcentrations. Leaf P was 0.08% at the start of thestudy and ranged from 0.07 to 0.12% by week 8(Fig. 4B). The average mass of P in the leaf packs forthe 6 streams increased from 0.0032 g initially to0.0035 g by 2 wk. The amount of variation explained
FIG. 2. Mean (61 SE; n = 5) remaining material (% ash-free dry mass [AFDM]) as a function of time (A) andtemperature (in degree days [dd]) (B) for the same period in6 streams in the Kenai Peninsula, Alaska. Numbers in key tosymbol are stream identifiers, with dissolved inorganic Nconcentrations (mg/L) in parentheses.
2011] GRASS DECOMPOSITION IN HEADWATER STREAMS 391
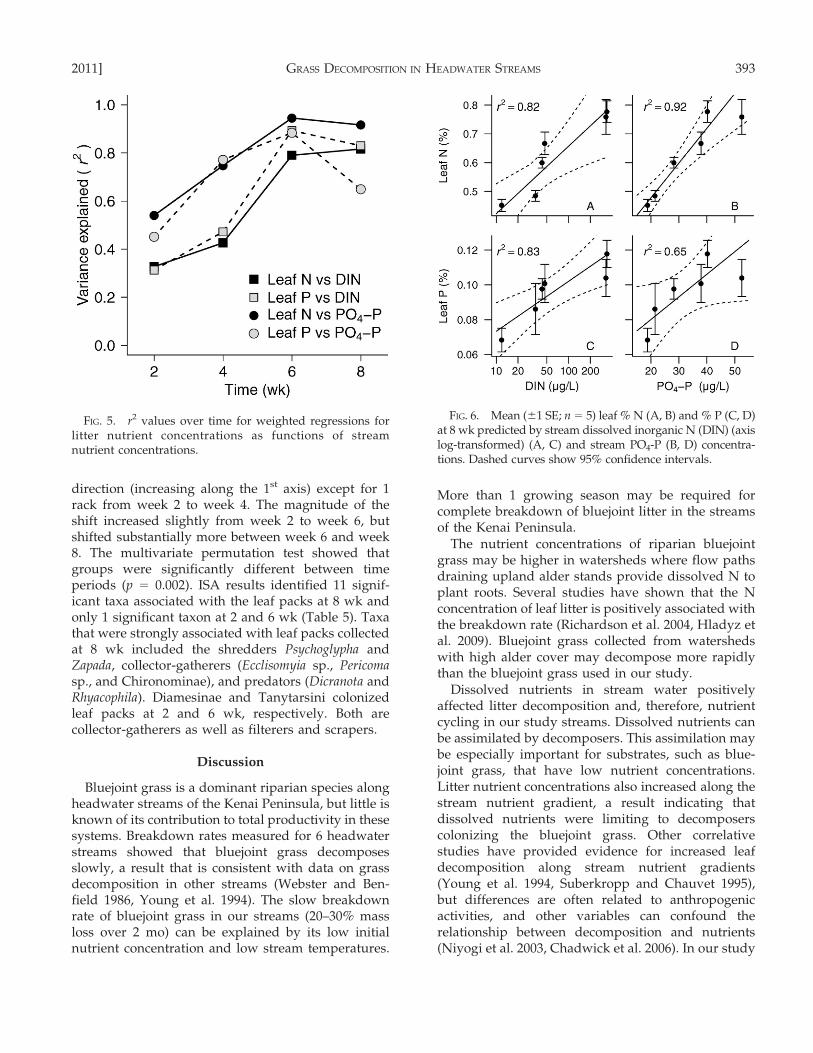
(r2) in the weighted regressions between streamnutrient concentrations and leaf nutrient concentra-tions increased strongly from 2 to 6 wk and remainedhigh at 8 wk (Fig. 5). The amount of variationexplained in the weighted regressions for leaf nutrientconcentrations at 8 wk as a function of mean streamnutrient concentrations over the 8-wk study rangedfrom r2
= 0.65 to 0.92 (Fig. 6A–D).
Colonization of litter by macroinvertebrates
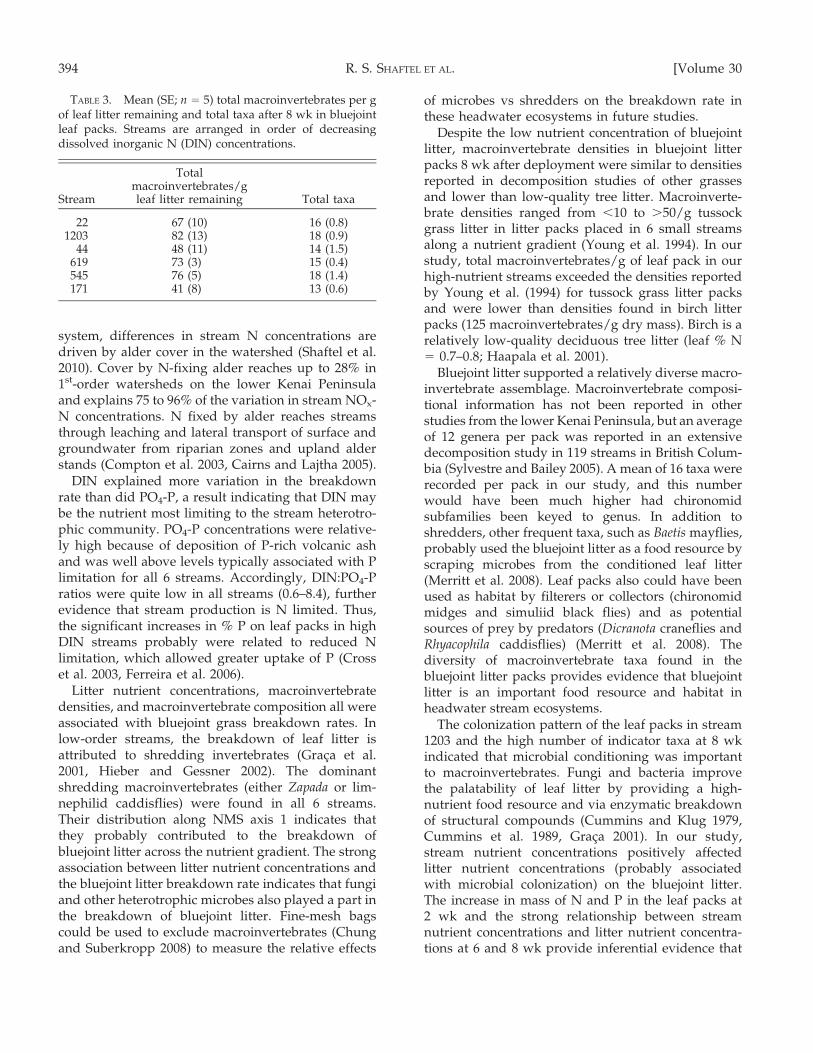
Total macroinvertebrate abundance (no./g) at week8 ranged from 41 to 82 in the 6 streams (Table 3). Thenumber of taxa on each leaf pack ranged from 13 to18. Of the 44 total taxa, 12 occurred in all 6 streams.The 3 most-abundant taxa were Orthocladinae (Dip-tera, dominated by Brillia sp., a shredder), Zapada sp.(Plecoptera, shredder), and Ostracoda (Table 4). Oth-
er common taxa that occurred in §2 streams includedseveral shredders (Limnephilidae and Psychoglyphasp.), scrapers (Diamesinae, Baetis sp.), and predators(Tanypodinae, Dicranota sp., Rhyacophila sp.).
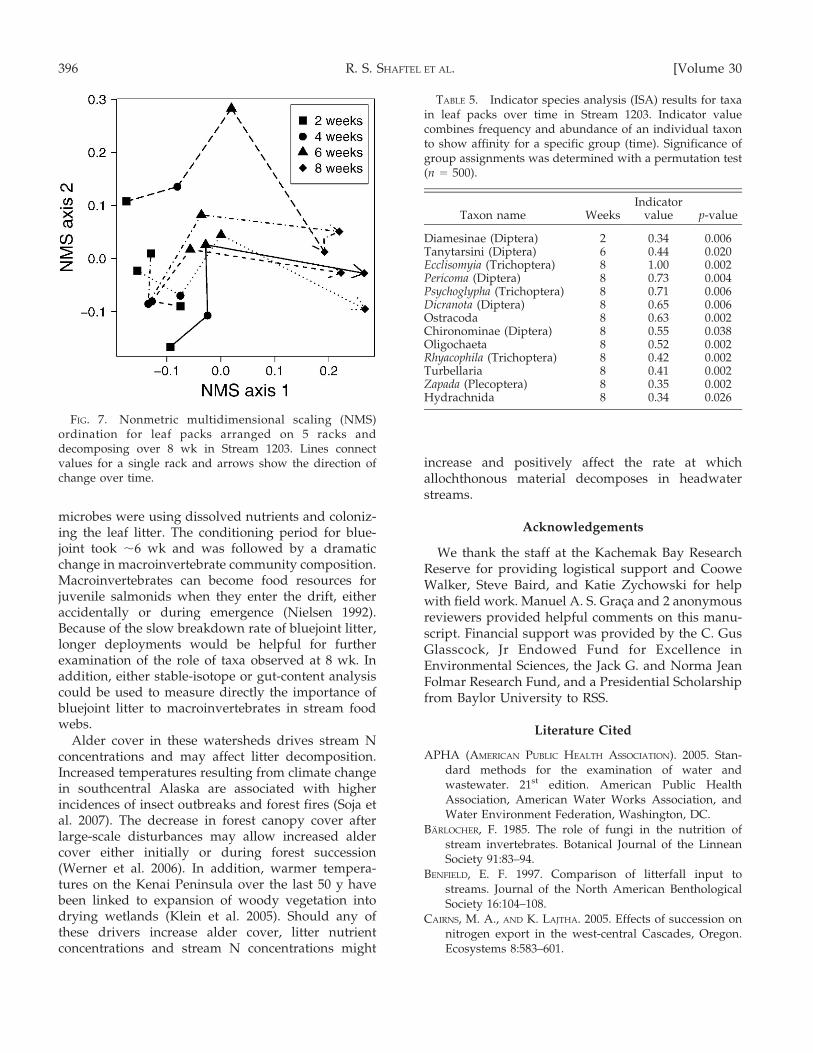
The NMS ordination of the macroinvertebratecommunities on leaf packs over time from Stream1203 indicated a consistent colonization pattern acrossall 5 racks (Fig. 7). Communities changed in the same
TABLE 2. Mean (SE; n = 5) leaf breakdown rates (k) per day and degree day (dd) for 6 streams arranged in order of decreasingdissolved inorganic N (DIN) concentrations.
Stream DIN (mg/L) k (d21) R2 k (dd21) R2
22 339 0.0041 (0.0009) 0.47 0.0009 (0.00019) 0.461203 329 0.0060 (0.0005) 0.88 0.0008 (0.00006) 0.89
44 47 0.0048 (0.0005) 0.80 0.0006 (0.00006) 0.82619 43 0.0044 (0.0004) 0.87 0.0006 (0.00004) 0.88545 35 0.0059 (0.0003) 0.93 0.0005 (0.00003) 0.93171 12 0.0035 (0.0003) 0.83 0.0003 (0.00003) 0.84
FIG. 3. Mean (61 SE; n = 5) leaf breakdown rates (indegree days [dd]) predicted by stream dissolved inorganicN (DIN) (axis log-transformed) concentrations (A), streamPO4-P concentrations (B), leaf % N at 8 wk (C), and leaf % Pat 8 wk (D). Dashed curves show 95% confidence intervals.
FIG. 4. Mean (61 SE; n = 5) N (A) and P (B) content ofbluejoint grass litter decomposing over 8 wk in 6 streams.Numbers in key to symbol are stream identifiers, withdissolved inorganic N concentrations (mg/L) in parentheses.
392 R. S. SHAFTEL ET AL. [Volume 30
direction (increasing along the 1st axis) except for 1rack from week 2 to week 4. The magnitude of theshift increased slightly from week 2 to week 6, butshifted substantially more between week 6 and week8. The multivariate permutation test showed thatgroups were significantly different between timeperiods (p = 0.002). ISA results identified 11 signif-icant taxa associated with the leaf packs at 8 wk andonly 1 significant taxon at 2 and 6 wk (Table 5). Taxathat were strongly associated with leaf packs collectedat 8 wk included the shredders Psychoglypha andZapada, collector-gatherers (Ecclisomyia sp., Pericomasp., and Chironominae), and predators (Dicranota andRhyacophila). Diamesinae and Tanytarsini colonizedleaf packs at 2 and 6 wk, respectively. Both arecollector-gatherers as well as filterers and scrapers.
Discussion
Bluejoint grass is a dominant riparian species alongheadwater streams of the Kenai Peninsula, but little isknown of its contribution to total productivity in thesesystems. Breakdown rates measured for 6 headwaterstreams showed that bluejoint grass decomposesslowly, a result that is consistent with data on grassdecomposition in other streams (Webster and Ben-field 1986, Young et al. 1994). The slow breakdownrate of bluejoint grass in our streams (20–30% massloss over 2 mo) can be explained by its low initialnutrient concentration and low stream temperatures.
More than 1 growing season may be required forcomplete breakdown of bluejoint litter in the streamsof the Kenai Peninsula.
The nutrient concentrations of riparian bluejointgrass may be higher in watersheds where flow pathsdraining upland alder stands provide dissolved N toplant roots. Several studies have shown that the Nconcentration of leaf litter is positively associated withthe breakdown rate (Richardson et al. 2004, Hladyz etal. 2009). Bluejoint grass collected from watershedswith high alder cover may decompose more rapidlythan the bluejoint grass used in our study.
Dissolved nutrients in stream water positivelyaffected litter decomposition and, therefore, nutrientcycling in our study streams. Dissolved nutrients canbe assimilated by decomposers. This assimilation maybe especially important for substrates, such as blue-joint grass, that have low nutrient concentrations.Litter nutrient concentrations also increased along thestream nutrient gradient, a result indicating thatdissolved nutrients were limiting to decomposerscolonizing the bluejoint grass. Other correlativestudies have provided evidence for increased leafdecomposition along stream nutrient gradients(Young et al. 1994, Suberkropp and Chauvet 1995),but differences are often related to anthropogenicactivities, and other variables can confound therelationship between decomposition and nutrients(Niyogi et al. 2003, Chadwick et al. 2006). In our study
FIG. 5. r2 values over time for weighted regressions forlitter nutrient concentrations as functions of streamnutrient concentrations.
FIG. 6. Mean (61 SE; n = 5) leaf % N (A, B) and % P (C, D)at 8 wk predicted by stream dissolved inorganic N (DIN) (axislog-transformed) (A, C) and stream PO4-P (B, D) concentra-tions. Dashed curves show 95% confidence intervals.
2011] GRASS DECOMPOSITION IN HEADWATER STREAMS 393
system, differences in stream N concentrations aredriven by alder cover in the watershed (Shaftel et al.2010). Cover by N-fixing alder reaches up to 28% in1st-order watersheds on the lower Kenai Peninsulaand explains 75 to 96% of the variation in stream NOx-N concentrations. N fixed by alder reaches streamsthrough leaching and lateral transport of surface andgroundwater from riparian zones and upland alderstands (Compton et al. 2003, Cairns and Lajtha 2005).
DIN explained more variation in the breakdownrate than did PO4-P, a result indicating that DIN maybe the nutrient most limiting to the stream heterotro-phic community. PO4-P concentrations were relative-ly high because of deposition of P-rich volcanic ashand was well above levels typically associated with Plimitation for all 6 streams. Accordingly, DIN:PO4-Pratios were quite low in all streams (0.6–8.4), furtherevidence that stream production is N limited. Thus,the significant increases in % P on leaf packs in highDIN streams probably were related to reduced Nlimitation, which allowed greater uptake of P (Crosset al. 2003, Ferreira et al. 2006).
Litter nutrient concentrations, macroinvertebratedensities, and macroinvertebrate composition all wereassociated with bluejoint grass breakdown rates. Inlow-order streams, the breakdown of leaf litter isattributed to shredding invertebrates (Graca et al.2001, Hieber and Gessner 2002). The dominantshredding macroinvertebrates (either Zapada or lim-nephilid caddisflies) were found in all 6 streams.Their distribution along NMS axis 1 indicates thatthey probably contributed to the breakdown ofbluejoint litter across the nutrient gradient. The strongassociation between litter nutrient concentrations andthe bluejoint litter breakdown rate indicates that fungiand other heterotrophic microbes also played a part inthe breakdown of bluejoint litter. Fine-mesh bagscould be used to exclude macroinvertebrates (Chungand Suberkropp 2008) to measure the relative effects
of microbes vs shredders on the breakdown rate inthese headwater ecosystems in future studies.
Despite the low nutrient concentration of bluejointlitter, macroinvertebrate densities in bluejoint litterpacks 8 wk after deployment were similar to densitiesreported in decomposition studies of other grassesand lower than low-quality tree litter. Macroinverte-brate densities ranged from ,10 to .50/g tussockgrass litter in litter packs placed in 6 small streamsalong a nutrient gradient (Young et al. 1994). In ourstudy, total macroinvertebrates/g of leaf pack in ourhigh-nutrient streams exceeded the densities reportedby Young et al. (1994) for tussock grass litter packsand were lower than densities found in birch litterpacks (125 macroinvertebrates/g dry mass). Birch is arelatively low-quality deciduous tree litter (leaf % N= 0.7–0.8; Haapala et al. 2001).
Bluejoint litter supported a relatively diverse macro-invertebrate assemblage. Macroinvertebrate composi-tional information has not been reported in otherstudies from the lower Kenai Peninsula, but an averageof 12 genera per pack was reported in an extensivedecomposition study in 119 streams in British Colum-bia (Sylvestre and Bailey 2005). A mean of 16 taxa wererecorded per pack in our study, and this numberwould have been much higher had chironomidsubfamilies been keyed to genus. In addition toshredders, other frequent taxa, such as Baetis mayflies,probably used the bluejoint litter as a food resource byscraping microbes from the conditioned leaf litter(Merritt et al. 2008). Leaf packs also could have beenused as habitat by filterers or collectors (chironomidmidges and simuliid black flies) and as potentialsources of prey by predators (Dicranota craneflies andRhyacophila caddisflies) (Merritt et al. 2008). Thediversity of macroinvertebrate taxa found in thebluejoint litter packs provides evidence that bluejointlitter is an important food resource and habitat inheadwater stream ecosystems.
The colonization pattern of the leaf packs in stream1203 and the high number of indicator taxa at 8 wkindicated that microbial conditioning was importantto macroinvertebrates. Fungi and bacteria improvethe palatability of leaf litter by providing a high-nutrient food resource and via enzymatic breakdownof structural compounds (Cummins and Klug 1979,Cummins et al. 1989, Graca 2001). In our study,stream nutrient concentrations positively affectedlitter nutrient concentrations (probably associatedwith microbial colonization) on the bluejoint litter.The increase in mass of N and P in the leaf packs at2 wk and the strong relationship between streamnutrient concentrations and litter nutrient concentra-tions at 6 and 8 wk provide inferential evidence that
TABLE 3. Mean (SE; n = 5) total macroinvertebrates per gof leaf litter remaining and total taxa after 8 wk in bluejointleaf packs. Streams are arranged in order of decreasingdissolved inorganic N (DIN) concentrations.
Stream
Totalmacroinvertebrates/gleaf litter remaining Total taxa
22 67 (10) 16 (0.8)1203 82 (13) 18 (0.9)
44 48 (11) 14 (1.5)619 73 (3) 15 (0.4)545 76 (5) 18 (1.4)171 41 (8) 13 (0.6)
394 R. S. SHAFTEL ET AL. [Volume 30
TA
BL
E4.
Mac
roin
ver
teb
rate
abu
nd
ance
s,fr
equ
enci
es,
no
nm
etri
cm
ult
idim
ensi
on
alsc
alin
g(N
MS
)sc
ore
s,an
dfe
edin
gh
abit
sfo
rta
xa
that
occ
urr
edin
§2
stre
ams.
Tax
aar
eso
rted
ino
rder
of
des
cen
din
gN
MS
sco
res.
Fre
q=
freq
uen
cy,C
-G=
coll
ecto
r-g
ath
erer
,C-F
=co
llec
tor-
filt
erer
,D=
det
riti
vo
re,H
=h
erb
ivo
re,P
=p
red
ato
r,S
c=
scra
per
.
Tax
on
NM
Ssc
ore
s
Str
eam
abu
nd
ance
(no
./g
)F
req
(%)
Mea
nn
o./
gF
eed
ing
hab
it22
1203
4461
954
517
1
Hep
teg
enii
dae
(Ep
hem
ero
pte
ra)
0.47
00.
160.
070.
000.
000.
030.
0050
0.04
Gen
eral
lyS
c,C
-GC
hir
on
om
inae
(Dip
tera
)0.
270
0.36
0.44
0.00
0.00
0.00
0.00
330.
13G
ener
ally
C-G
and
C-F
Po
do
no
min
ae(D
ipte
ra)
0.23
70.
070.
100.
000.
000.
000.
0033
0.03
Gen
eral
lyC
-G,
Sc
Sim
uli
idae
(Dip
tera
)0.
232
0.38
0.00
2.12
1.55
1.51
0.00
670.
93G
ener
ally
C-F
Bae
tis
(Ep
hem
ero
pte
ra)
0.22
511
.31
0.39
4.19
0.45
3.15
0.31
100
3.30
C-G
(dia
tom
s,d
etri
tus)
,S
cIs
oper
la(P
leco
pte
ra)
0.20
60.
100.
000.
000.
000.
240.
0033
0.06
P(e
ng
ulf
ers)
,fa
cult
ativ
eC
-GR
hy
acop
hil
a(T
rich
op
tera
)0.
204
1.57
2.16
0.00
2.32
0.07
0.00
671.
02P
(en
gu
lfer
s),S
c,C
-G,
Sh
-H(c
hew
ers)
Zap
ada
(Ple
cop
tera
)0.
140
17.4
220
.20
0.13
15.2
817
.63
1.64
100
12.0
5S
h-D
(lea
fli
tter
)-H
(mo
ss)
Pro
bezz
ia(D
ipte
ra)
0.12
30.
000.
040.
000.
000.
240.
0033
0.05
P(e
ng
ulf
ers)
Tu
rbel
lari
a0.
092
0.26
7.90
0.04
4.75
1.52
0.03
100
2.42
Gen
eral
lyP
(en
gu
lfer
san
dp
ierc
ers)
,C
-GP
eric
oma
(Dip
tera
)0.
086
0.00
0.57
0.07
0.06
0.57
0.00
670.
21C
-GD
iam
esin
ae(D
ipte
ra)
0.08
11.
476.
2712
.74
0.16
1.75
0.09
100
3.75
Gen
eral
lyC
-G,
Sc
Ecc
liso
my
ia(T
rich
op
tera
)0.
064
0.00
1.05
0.00
1.95
0.07
0.06
670.
52C
-G,
Sc
Ch
elif
era
(Dip
tera
)0.
055
0.03
0.68
0.16
0.51
0.03
0.03
100
0.24
Un
kn
ow
nO
rth
ocl
adin
ae(D
ipte
ra)
0.02
928
.55
25.2
417
.99
26.1
827
.91
10.9
110
022
.80
Gen
eral
lyC
-G,
Sc
Lim
nep
hil
idae
(Tri
cho
pte
ra)
0.02
00.
190.
270.
660.
270.
440.
0610
00.
32G
ener
ally
Sh
-D(c
hew
ers)
,C
-G,
Sc
Ep
hem
erel
la(E
ph
emer
op
tera
)0.
019
0.00
0.00
0.07
0.00
1.86
0.00
330.
32C
-G,
Sc
Dic
ran
ota
(Dip
tera
)0.
012
0.15
0.29
0.89
0.59
0.30
0.39
100
0.43
P(e
ng
ulf
ers)
Cli
noc
era
(Dip
tera
)2
0.01
10.
030.
180.
000.
070.
060.
0683
0.07
Un
kn
ow
nH
yd
rach
nid
a2
0.01
30.
303.
280.
561.
384.
631.
0310
01.
86G
ener
ally
P(p
ierc
ers)
,p
aras
ites
,C
-G,
H(p
ierc
ers)
Oli
go
chae
ta2
0.07
00.
556.
181.
200.
711.
791.
9710
02.
07G
ener
ally
C-G
,P
(en
gu
lfer
s)O
stra
cod
a2
0.08
02.
385.
130.
6816
.05
9.45
14.1
710
07.
98H
(alg
ae),
DP
sych
ogly
ph
a(T
rich
op
tera
)2
0.27
30.
000.
243.
170.
001.
091.
4767
0.99
C-G
,S
h-D
(ch
ewer
s,in
clu
din
gsc
aven
ger
s)T
any
po
din
ae(D
ipte
ra)
20.
337
0.03
0.84
0.42
0.31
1.14
4.49
100
1.21
Gen
eral
lyP
(en
gu
lfer
san
dp
ierc
ers)
Tan
yta
rsin
i(D
ipte
ra)
20.
362
1.05
0.40
0.00
0.03
0.00
3.11
670.
76G
ener
ally
C-F
and
GG
ren
sia
(Tri
cho
pte
ra)
20.
365
0.00
0.00
0.95
0.00
0.00
0.03
330.
16U
nk
no
wn
Pis
idiu
m2
0.88
90.
000.
000.
030.
000.
000.
0633
0.01
C-F
2011] GRASS DECOMPOSITION IN HEADWATER STREAMS 395
microbes were using dissolved nutrients and coloniz-ing the leaf litter. The conditioning period for blue-joint took ,6 wk and was followed by a dramaticchange in macroinvertebrate community composition.Macroinvertebrates can become food resources forjuvenile salmonids when they enter the drift, eitheraccidentally or during emergence (Nielsen 1992).Because of the slow breakdown rate of bluejoint litter,longer deployments would be helpful for furtherexamination of the role of taxa observed at 8 wk. Inaddition, either stable-isotope or gut-content analysiscould be used to measure directly the importance ofbluejoint litter to macroinvertebrates in stream foodwebs.
Alder cover in these watersheds drives stream Nconcentrations and may affect litter decomposition.Increased temperatures resulting from climate changein southcentral Alaska are associated with higherincidences of insect outbreaks and forest fires (Soja etal. 2007). The decrease in forest canopy cover afterlarge-scale disturbances may allow increased aldercover either initially or during forest succession(Werner et al. 2006). In addition, warmer tempera-tures on the Kenai Peninsula over the last 50 y havebeen linked to expansion of woody vegetation intodrying wetlands (Klein et al. 2005). Should any ofthese drivers increase alder cover, litter nutrientconcentrations and stream N concentrations might
increase and positively affect the rate at whichallochthonous material decomposes in headwaterstreams.
Acknowledgements
We thank the staff at the Kachemak Bay ResearchReserve for providing logistical support and CooweWalker, Steve Baird, and Katie Zychowski for helpwith field work. Manuel A. S. Graca and 2 anonymousreviewers provided helpful comments on this manu-script. Financial support was provided by the C. GusGlasscock, Jr Endowed Fund for Excellence inEnvironmental Sciences, the Jack G. and Norma JeanFolmar Research Fund, and a Presidential Scholarshipfrom Baylor University to RSS.
Literature Cited
APHA (AMERICAN PUBLIC HEALTH ASSOCIATION). 2005. Stan-dard methods for the examination of water andwastewater. 21st edition. American Public HealthAssociation, American Water Works Association, andWater Environment Federation, Washington, DC.
BARLOCHER, F. 1985. The role of fungi in the nutrition ofstream invertebrates. Botanical Journal of the LinneanSociety 91:83–94.
BENFIELD, E. F. 1997. Comparison of litterfall input tostreams. Journal of the North American BenthologicalSociety 16:104–108.
CAIRNS, M. A., AND K. LAJTHA. 2005. Effects of succession onnitrogen export in the west-central Cascades, Oregon.Ecosystems 8:583–601.
FIG. 7. Nonmetric multidimensional scaling (NMS)ordination for leaf packs arranged on 5 racks anddecomposing over 8 wk in Stream 1203. Lines connectvalues for a single rack and arrows show the direction ofchange over time.
TABLE 5. Indicator species analysis (ISA) results for taxain leaf packs over time in Stream 1203. Indicator valuecombines frequency and abundance of an individual taxonto show affinity for a specific group (time). Significance ofgroup assignments was determined with a permutation test(n = 500).
Taxon name WeeksIndicator
value p-value
Diamesinae (Diptera) 2 0.34 0.006Tanytarsini (Diptera) 6 0.44 0.020Ecclisomyia (Trichoptera) 8 1.00 0.002Pericoma (Diptera) 8 0.73 0.004Psychoglypha (Trichoptera) 8 0.71 0.006Dicranota (Diptera) 8 0.65 0.006Ostracoda 8 0.63 0.002Chironominae (Diptera) 8 0.55 0.038Oligochaeta 8 0.52 0.002Rhyacophila (Trichoptera) 8 0.42 0.002Turbellaria 8 0.41 0.002Zapada (Plecoptera) 8 0.35 0.002Hydrachnida 8 0.34 0.026
396 R. S. SHAFTEL ET AL. [Volume 30
CHADWICK, M. A., D. R. DOBBERFUHL, A. C. BENKE, A. D.HURYN, K. SUBERKROPP, AND J. E. THIELE. 2006. Urbaniza-tion affects stream ecosystem function by alteringhydrology, chemistry, and biotic richness. EcologicalApplications 16:1796–1807.
CHUNG, N., AND K. SUBERKROPP. 2008. Influence of shredderfeeding and nutrients on fungal activity and communitystructure in headwater streams. Fundamental andApplied Limnology 173:35–46.
COMPTON, J. E., M. R. CHURCH, S. T. LARNED, AND W. E.HOGSETT. 2003. Nitrogen export from forested water-sheds in the Oregon Coast Range: the role of N2-fixingred alder. Ecosystems 6:773–785.
CROSS, W. F., J. P. BENSTEAD, A. D. ROSEMOND, AND J. B.WALLACE. 2003. Consumer-resource stoichiometry indetritus-based streams. Ecology Letters 6:721–732.
CUMMINS, K. W., AND M. J. KLUG. 1979. Feeding ecology ofstream invertebrates. Annual Review of Ecology andSystematics 10:147–172.
CUMMINS, K. W., M. A. WILZBACH, D. M. GATES, J. B. PERRY,AND W. B. TALIAFERRO. 1989. Shredders and riparianvegetation. BioScience 39:24–30.
DOUCETT, R. R., G. POWER, D. R. BARTON, R. J. DRIMMIE, AND R.A. CUNJAK. 1996. Stable isotope analysis of nutrientpathways leading to Atlantic salmon. Canadian Journalof Fisheries and Aquatic Sciences 53:2058–2066.
DUGDALE, R. C., AND V. A. DUGDALE. 1961. Sources ofphosphorus and nitrogen for lakes on Afognak Island.Limnology and Oceanography 6:13–23.
FAERØVIG, P. J., AND D. O. HESSEN. 2003. Allocation strategiesin crustacean stoichiometry: the potential role ofphosphorus in the limitation of reproduction. Freshwa-ter Biology 48:1782–1792.
FERREIRA, V., V. GULIS, AND M. A. S. GRACA. 2006. Whole-streamnitrate addition affects litter decomposition and associatedfungi but not invertebrates. Oecologia (Berlin) 149:718–729.
FINDLAY, S. 2010. Stream microbial ecology. Journal of theNorth American Benthological Society 29:170–181.
GESSNER, M. O., AND E. CHAUVET. 1994. Importance of streammicrofungi in controlling breakdown rates of leaf litter.Ecology 75:1807–1817.
GOSLEE, S. C., AND D. L. URBAN. 2007. The ecodist package fordissimilarity-based analysis of ecological data. Journalof Statistical Software 22:1–19.
GRACA, M. A. S. 2001. The role of invertebrates on leaf litterdecomposition in streams – a review. InternationalReview of Hydrobiology 86:383–393.
GRACA, M. A. S., F. BARLOCHER, AND M. O. GESSNER (EDITORS).2005. Methods to study litter decomposition. Springer,Dordrecht, The Netherlands.
GRACA, M. A. S., R. C. F. FERREIRA, AND C. N. COIMBRA. 2001.Litter processing along a stream gradient: the role ofinvertebrates and decomposers. Journal of the NorthAmerican Benthological Society 20:408–420.
GRACZ, M., P. NORTH, K. NOYES, G. TANDE, AND D. VAN PATTEN.2004. Wetlands of the Kenai Lowlands: a landscape-level wetland management tool. Kenai WatershedForum, Fritz Creek, Alaska. (Available from: http://www.kenaiwetlands.net/)
GREENWOOD, J. L., A. D. ROSEMOND, J. B. WALLACE, W. F. CROSS,AND H. S. WEYERS. 2007. Nutrients stimulate leaf break-down rates and detritivore biomass: bottom-up effects viaheterotrophic pathways. Oecologia (Berlin) 151:637–649.
GULIS, V., AND K. SUBERKROPP. 2003. Leaf litter decompositionand microbial activity in nutrient-enriched and unal-tered reaches of a headwater stream. FreshwaterBiology 48:123–134.
HAAPALA, A., T. MUOTKA, AND A. MARKKOLA. 2001. Break-down and macroinvertebrate and fungal colonization ofalder, birch, and willow leaves in a boreal forest stream.Journal of the North American Benthological Society 20:395–407.
HAUER, R. F., AND G. A. LAMBERTI (EDITORS). 2006. Methods instream ecology. 2nd edition. Academic Press, San Diego,California.
HEIRI, O., A. F. LOTTER, AND G. LEMCKE. 2001. Loss on ignitionas a method for estimating organic and carbonatecontent in sediments: reproducibility and comparabilityof results. Journal of Paleolimnology 25:101–110.
HIEBER, M., AND M. O. GESSNER. 2002. Contribution of streamdetritivores, fungi, and bacteria to leaf breakdownbased on biomass estimates. Ecology 83:1026–1038.
HLADYZ, S., M. O. GESSNER, P. S. GILLER, J. POZO, AND G.WOODWARD. 2009. Resource quality and stoichiometricconstraints on stream ecosystem functioning. Freshwa-ter Biology 54:957–970.
HURYN, A. D., R. H. RILEY, R. G. YOUNG, C. J. ARBUCKLE, K.PEACOCK, AND G. LYON. 2001. Temporal shift in contri-bution of terrestrial organic matter to consumer pro-duction in a grassland river. Freshwater Biology 46:213–226.
JUNGER, M., AND D. PLANAS. 1994. Quantitative use of stablecarbon-isotope analysis to determine the trophic base ofinvertebrate communities in a boreal forest lotic system.Canadian Journal of Fisheries and Aquatic Sciences 51:52–61.
KLEIN, E., E. E. BERG, AND R. DIAL. 2005. Wetland drying andsuccession across the Kenai Peninsula Lowlands, south-central Alaska. Canadian Journal of Forest Resources 35:1931–1941.
LEBERFINGER, K., AND I. BOHMAN. 2010. Grass, mosses, algae, orleaves? Food preference among shredders from open-canopy streams. Aquatic Ecology 44:195–203.
LEMON, J., B. BOLKER, S. OOM, E. KLEIN, B. ROWLINGSON, H.WICKHAM, A. TYAGI, O. ETERRADOSSI, G. GROTHENDIECK, AND
M. TOEWS. 2009. plotrix: various plotting functions. Rpackage version 2.7-2. R Project for Statistical Comput-ing, Vienna, Austria.
MCCUNE, B., AND J. B. GRACE. 2002. Analysis of ecologicalcommunities. MjM Software Design, Gleneden Beach,Oregon.
MCTAMMANY, M. E., E. F. BENFIELD, AND J. R. WEBSTER. 2008.Effects of agriculture on wood breakdown and micro-bial biofilm respiration in southern Appalachianstreams. Freshwater Biology 53:842–854.
MENNINGER, H. L., AND M. A. PALMER. 2007. Herbs andgrasses as an allochthonous resource in open-canopyheadwater streams. Freshwater Biology 52:1689–1699.
2011] GRASS DECOMPOSITION IN HEADWATER STREAMS 397
MERRITT, R. W., K. W. CUMMINS, AND M. B. BERG (EDITORS).2008. An introduction to the aquatic insects of NorthAmerica. 4th edition. Kendall/Hunt, Dubuque, Iowa.
NIELSEN, J. L. 1992. Microhabitat-specific foraging behavior,diet, and growth of juvenile coho salmon. Transactionsof the American Fisheries Society 121:617–634.
NIYOGI, D. K., K. S. SIMON, AND C. R. TOWNSEND. 2003.Breakdown of tussock grass in streams along a gradientof agricultural development in New Zealand. Freshwa-ter Biology 48:1698–1708.
OKSANEN, J., K. ROELAND, P. LEGENDRE, B. O’HARA, G. L.SIMPSON, P. SOLYMOS, M. H. H. STEVENS, AND H. WAGNER.2009. vegan: community ecology package. R packageversion 1.15-4. R Project for Statistical Computing,Vienna, Austria.
PERRY, R. W., M. J. BRADFORD, AND J. A. GROUT. 2003. Effects ofdisturbance on contribution of energy sources to growthof juvenile chinook salmon (Oncorhynchus tshawytscha)in boreal streams. Canadian Journal of Fisheries andAquatic Sciences 60:390–400.
PING, C. L., AND G. J. MICHAELSON. 1986. Phosphorus sorptionby major agricultural soils of Alaska. Communicationsin Soil Science and Plant Analysis 17:299–320.
PINHEIRO, J., D. BATES, S. DEBROY, S. DEEPAYAN, R CORE TEAM.2009. nlme: linear and nonlinear mixed effectsmodels. R package version 3.1-96. R Project forStatistical Computing, Vienna, Austria.
REYNOLDS, K. M. 1990. Preliminary classification of forestvegetation of the Kenai Peninsula, Alaska. ResearchPaper PNW-RP-424. Pacific Northwest Research Station,US Department of Agriculture Forest Service, Portland,Oregon. (Available from: http://www.fs.fed.us/pnw/pubs/pnw_rp424)
RICHARDSON, J. S., AND R. J. DANEHY. 2007. A synthesis of theecology of headwater streams and their riparian zonesin temperate forests. Forest Science 53:131–147.
RICHARDSON, J. S., C. R. SHAUGHNESSY, AND P. G. HARRISON.2004. Litter breakdown and invertebrate associationwith three types of leaves in a temperate rainforeststream. Archiv fur Hydrobiologie 159:309–325.
ROBERTS, D. W. 2010. labdsv: ordination and multivariateanalysis for ecology. R package version 1.4-1. R Projectfor Statistical Computing, Vienna, Austria.
ROBINSON, C. T., AND M. O. GESSNER. 2000. Nutrient additionaccelerates leaf breakdown in an alpine springbrook.Oecologia (Berlin) 122:258–263.
SCARSBROOK, M. R., AND C. R. TOWNSEND. 1994. The roles ofgrass leaf litter in streams draining tussock grassland inNew Zealand: retention, food supply and substratestabilization. Freshwater Biology 32:429–443.
SHAFTEL, R. S., R. S. KING, AND J. A. BACK. 2010. Alder coverdrives nitrogen availability in Kenai lowland headwaterstreams, Alaska. Biogeochemistry doi:10.1007/s10533-010-9541-3
SOJA, A. J., N. M. TCHEBAKOVA, N. H. F. FRENCH, M. D.FLANNIGAN, H. H. SHUGART, B. J. STOCKS, A. I. SUKHININ, E.I. PARFENOVA, F. S. CHAPIN, AND P. W. STACKHOUSE. 2007.Climate-induced boreal forest change: predictions ver-
sus current observations. Global and Planetary Change56:274–296.
SUBERKROPP, K., AND E. CHAUVET. 1995. Regulation of leafbreakdown by fungi in streams: influences of waterchemistry. Ecology 76:1433–1445.
SYLVESTRE, S., AND R. C. BAILEY. 2005. Ecology of leaf packmacroinvertebrate communities in streams of the FraserRiver Basin, British Columbia. Freshwater Biology 50:1094–1104.
TANK, J. L., E. J. ROSI-MARSHALL, N. A. GRIFFITHS, S. A.ENTREKIN, AND M. L. STEPHEN. 2010. A review ofallochthonous organic matter dynamics and metabolismin streams. Journal of the North American BenthologicalSociety 29:118–146.
THORP, J. H., AND A. P. COVICH (EDITORS). 2001. Ecology andclassification of North American freshwater invertebrates.2nd edition. Academic Press, San Diego, California.
VIERECK, L. A., C. T. DYRNESS, A. R. BATTEN, AND K. J. WENZLICK.1992. The Alaska vegetation classification. GeneralTechnical Report PNW-GTR-286. Pacific NorthwestResearch Station, US Department of Agriculture ForestService, Portland, Oregon. (Available from: http://www.fs.fed.us/pnw/publications/pnw_gtr286/)
VOSHELL, J. R. 2002. A guide to common freshwaterinvertebrates of North America. McDonald and Wood-ward Publishing Company, Blacksburg, Virginia.
WEBSTER, J. R., AND E. F. BENFIELD. 1986. Vascular plantbreakdown in freshwater ecosystems. Annual Review ofEcology and Systematics 17:567–594.
WERNER, R. A., E. H. HOLSTEN, S. M. MATSUOKA, AND R. E.BURNSIDE. 2006. Spruce beetles and forest ecosystems insouth-central Alaska: a review of 30 years of research.Forest Ecology and Management 227:195–206.
WICKHAM, H. 2010. stringr: make it easier to work withstrings. R package version 0.3. R package version 1.15-4.R Project for Statistical Computing, Vienna, Austria.
WIEDERHOLM, T. (EDITOR). 1983, Chironomidae of the HolarcticRegion. Keys and diagnoses. Part 1. Larvae. Entomolo-gica Scandinavica Supplement 19.
WIGGINS, G. B. 1996. Larvae of the North American caddisflygenera (Trichoptera). 2nd edition. University of TorontoPress, Toronto, Ontario.
WIPFLI, M. S., J. S. RICHARDSON, AND R. J. NAIMAN. 2007.Ecological linkages between headwaters and down-stream ecosystems: transport of organic matter, inver-tebrates, and wood down headwater channels. Journalof the American Water Resources Association 43:72–85.
YOUNG, R. G., A. D. HURYN, AND C. R. TOWNSEND. 1994. Effectsof agricultural development on processing of tussockleaf litter in high country New Zealand streams.Freshwater Biology 32:413–427.
ZEUG, S. C., AND K. O. WINEMILLER. 2008. Evidence supportingthe importance of terrestrial carbon in a large-river foodweb. Ecology 89:1733–1743.
Received: 22 June 2010Accepted: 13 December 2010
398 R. S. SHAFTEL ET AL. [Volume 30