Embed Size (px)
Citation preview
Brazil’s Zero Hunger Program in the Context of
Social Policy1
Walter Belik2
Mauro Del Grossi3
1 This paper was prepared for the 25th International Conference of Agricultural Economists in Durban, South Africa, August 2003. The authors wish to thank for the comments of Benjamin Davis and the helpful revision of Gisele Noce and Caitlin Houston . 2Assistant Professor at the Instituto de Economia and Coordinator of Núcleo de Economia Agrícola at the State University of Campinas - Unicamp ([email protected]). 3 Researcher at IAPAR and Cabinet Advisor in the Ministry of Food Security and Hunger Prevention in Brazil ([email protected])

2

3
ABSTRACT
The article analyzes the possibilities of implementation of a social policy dedicated to
Food Security in Brazil. It presents the main proposals taken for the Brazilian ZHP -
Program Hunger Zero tracing some parallel between its design and the Mexican
PROGRESA - Oportunidades. We utilized a hybrid profile for the ZHP, considering the
selection of possible beneficiaries at that time by combining characteristics of a
universal program regarding the right to adequate food guarantee with geographic
targeting. Finally, the article presents some elements of analysis for the structural
policies, which are being implemented, showing the effort of the ZHP in order to
promote changes in the life conditions for those benefited families.
Keywords: Food Security, Social Policy, Poverty.
4
PRESENTATION
The goal of this work is to discuss the methodology established for the Zero Hunger
Program (ZHP) of Lula’s government, presenting its positions regarding the interplay
between social policy and the its measures for fighting hunger. The text begins with a
challenge to present a program that intends to provide attention to a citizen’s universal
right, which is the right to adequate food. Simultaneously, the program seeks to apply
“targeting” techniques to identify the largest in-need population, in order to achieve that
aim.
The work is divided into three parts, followed by a conclusion. In the first section, we
discuss the characteristics of a social program for combating hunger in a country similar
to Brazil, where almost one-third of the population is in a vulnerable situation
concerning malnutrition. Next, we present the main characteristics of ZHP, adopted as
a governmental priority beginning in 2003. In this section, we compare parts of the ZHP
to the Programa Oportunidades (ex-PROGRESA) adopted in Mexico in 1997 to utilize
as a social program model. Finally, in the text’s third section, we present some
justifications explaining the options adopted by the ZHP. In the last section in
particular, we are working specifically with data from IBGE’s Demographic Census of
2002, in order to demonstrate some characteristics of poverty in Brazil and its
connection to differing regions.
5
1 FOCUSING OR UNIVERSALIZING SOCIAL POLICIES?
“Social Policies” are, by definition, necessary concerning society’s normal functions.
They arise in order to compensate for the distortions resulting from the capitalist
development process, which creates an ever-widening gap between rich and poor
people. Families in a capitalist society do not begin with equal conditions, and the
poorest families tend to continuously reproduce the cycle of poverty: low educational
levels, poor nourishment and health, job impermanence and low income. By creating
social policies, the State seeks to equalize the opportunities between poor and rich
people, closing the gap between these two groups and allowing the next generations to
take a step forward, breaking the poverty cycle.
On the other hand, many social policies must fit the requirement of responding to
constitutionally-established universal rights. Through tax collection, the State collects
funds with the intention of ensuring society’s well-being. Diverging priorities require
these public funds. The government faces the always-difficult decision to decide
whether to spend money working to correct the problems from the past or to accumulate
reserves and invest money to assure the economic situation of future generations. For
the poor countries this disjunction is fundamental. The backwardness provoked by
unequal development requires an intensified effort to correct the distortions that arose
long ago while simultaneously acquiring space, disputing the markets competitively.
The International Bill of Human Rights and the Constitution of several countries ensure
universal rights such as education, health care and employment. More than assuring
rights, however, the state’s action in these fields theoretically assures equal opportunity
for individuals to act in society. In 1993, the right to adequate food was added to the list
of human rights established in the International Bill of Human Rights of 1948.4 That
essential change in the manner of facing nutritional challenges puts the State in a
position of providing for basic citizens’ rights. Therefore, much more than paying
attention to the individual, the State would be accomplishing a constitutional function it
has already promised to fulfill, which is to assure food security to its population.
4 In Brazil there is a Proposal of Constitutional Rectification of 2001 that modifies the article 6 of our Constitution, including the right to adequate food among the fundamental human rights. Nowadays, the Brazilian Constitution refers to the right to life, making merely implicit the right to food.

6
It is interesting to point out that a large percentage of the world’s population does not
experience a direct lack of food, but rather society has difficulties in providing “physical
and economic accessibility, continuously, of adequate food or of the means to its
acquisition,” pursuant to General Comment 12 of Commission on Human Rights (Sub-
Commission on the Promotion and Protection of Human Rights - 1999) on the article 11
of the International Convention on Economic, Social and Cultural Rights of 1966. It
means that any State is subject to international warnings for not assuring the
accessibility of food to its population; that is institutionally unjustifiable, in cases of
food production surplus. This is the nature of the universal policies that were created.
Education and health care are well-known social rights and are available to all. In
Brazil, all municipalities have schools for children and for elementary-level education
(for children from zero to fourteen years old), ensuring education. Health care is also
democratically distributed through a system of hospitals, maternity wards and clinics.
However, it is obvious that citizens having higher incomes continue to have access to
better education and health care. They are able to employ a private system, which is
superior to the State’s situation. The State must contend with a public revenue crisis,
and the abandonment of education and health care systems
Regarding food welfare programs, when food is constitutionally added with the same
priority as previously mentioned necessities, the situation is not the same. In Brazil, as
well as in other poor countries, there is not a “public food system.” That is to say, there
is not a public protection network for assuring the maintenance of individuals’
nutritional conditions. In the case of food, no filtering system exists for defining the
limits of a private system. Because of this, the procedures are based entirely on private
methods: the system is private and all individuals can be considerate as private food
“consumers”.
In third world countries where the needs of the poor are enormous, the State has not the
means to care for every essential right of each person simultaneously. In the case of
education and health care, household income appears as a selection variable, which
shows that wealthier citizens choose not to seek their constitutional rights in favor of
better private services. The group with highest income seeks better-quality private
7
services, leaving the poorer-quality public education and health care to the low-income
classes.
Concerning the issue of food, this selection formula tends to recur and it remains a
responsibility of the public powers to focus to the households which are most vulnerable
to food insecurity, in a proprietary and compensatory manner. Poverty is spread
throughout all of society in third world countries. Whenever we analyze the possibilities
in ensuring access to food while having few resources, we do not usually see another
possibility except to create a tiered list in order to discern which are the poorest citizens
and to make sure they are taken care of.
It is important to say that in rich countries, considering the existent resources and the
relatively low number of very people in need, it is much easier to find focus and to
organize the “line of coverture”. However, in countries where poverty is disseminated
throughout society – as in the third world – it is difficult to find one focus. In the case of
food, society does not have the means to assure equal opportunities for all. A social trap
is set, in which the individual strategies become decisive concerning the household’s
survival.
Motivated by the proposal of universalizing all rights, liberal economists Friedrick Von
Hayek and later Milton Friedman worked on the idea of creating a minimum income for
all citizens would become “public services buyers”.5 All services would come from this
income. From a procedural point of view of, this proposal would be relatively easy to
implement, but in practice, it would lead to the necessity of redirecting all government
resources revenues to a single and universal provider. In possession of these resources,
the citizen would decide which type of education, health care or food he would utilize;
he would analyze costs and make the best choice. The idea of universal income comes
form the presumption that the State is inefficient at distributing resources efficiently,
leading to wastefulness and deviations. 5 Suplicy (2002) emphasizes that there is a strong resistance to the proposal for minimum income, as the authors that proposed it became celebrities defending the capitalism. The author, on the contrary, wants to show that before those writers, other philosophers economists, most of them progressives, have presented the minimum income thesis too. Among the defenders of minimum income proposal, it is interesting to mention the contribution of J. K. Galbraith, James Tobin and Philippe Van Parijs that worked on the possibility of instituting the minimum income as an negative income tax, in which the income transfers for poor people would cover only a part of what would be missing to complete the total of a minimum wage.

8
However, the universal income for all citizens does not ensure universal social rights.
By eliminating the State’s possibility to provide benefits by the simple termination of
revenue, nothing ensures that the “social benefits market” will be large enough to
supply the lowest class with the social services that it requires.
Another important current opinion concerning the treatment of social policies, in
opposition to the universalizing of benefits, brings the idea of focusing beneficiaries.
Focusing is based on two sensible criteria, as follows: a) the financial resources for the
management of social policies are restricted and (therefore); b) the policies must
prioritize with maximum efficiency how to provide for the citizens in very critical
situations. We must note that the strategy of focusing recognizes citizens’ social rights
but assumes that the resources are not large enough to address the needs of all people.
According to Paes de Barros, Henriques and Mendonça (2000:20), admitting that the
Brazilian State has the conditions to identify all the individuals “with perfect focusing
and precise calibration for all families,” it would be possible to totally eradicate poverty
at a cost of R$ 29 billion per year6. In other words, focusing seeks “to organize the line
of coverture” if it were possible to have the most efficient system with the lowest
amount of wastefulness of resources.
Nevertheless, despite appearances, focusing is also an expensive policy for the State.
Transferring resources in an aleatory manner, as the minimum income programs
propose, creates highly reduced planning costs for the public power. Identifying the
most impoverished segments of population and controlling this kind of transfer can cost
much more. In fact, in a country where the majority of the population can be considered
poor, how is it possible to select the poorest among the poor? How could we assure that
the “less poor” will not belong to the poorest contingent in the future? All these actions
require a large quantity of financial and human resources for researches and for
constantly reviewing those policies.
According to Cohn (1995), the debate regarding universalizing and focusing social
policies based on the scarcity of public resources “loses substantive continuity,
6 This is equivalent to US$ 10 billion
9
denudating the ideological dimension, which at this time is not the central matter”
(Cohn, 1995:6). Cohn’s argument states that this is the case for making distinctions
between the social policies directed at alleviating poverty and those which seek to
overcome poverty. In the first case, we have immediate social welfare assistance
policies directed to the highly “vulnerable to hunger” groups. In the second case, we
seek a pattern of sustainable growth along with social equity. In order to overcome this
strategic predicament, Cohn (1995) suggests that social policy planners must seek “the
articulation between those (actions) for short term, of more immediate character,
focused on that groups identified as the poorest ones, and those for long term, of
permanent character, universalizing ones, directed to the equity of citizen’s access to
social rights, independently on income level or one’s work market insertion” (Cohn,
1995:6).
Another problem that results from focusing is that poverty has several faces; therefore, a
poor household could be considered “needy” in terms of health, but could have access
to education or food. This is a common situation comparing the case of poor people
living in rural areas to those from metropolitan urban areas. Another common example
is the difference between families with jobless householders compared to families in
disaggregated situation or having their members in marginal situations. Gender
treatment can also influence the level of help that social policy can provide to the
poorest people. It is difficult to make only one choice or to select only one public
beneficiary. The social policies should present multiple areas of treatment and must
fulfill and provide – beside an entrance door – an opportunity to change social position
as well.

10
2 THE ZERO HUNGER PROGRAM
The Zero Hunger Program arises as a proposal formulated by the Instituto Cidadania of
São Paulo, in 2001. The program was elaborated pursuant to a study made by almost
100 technicians, academics and policy operators, who had three main objectives: a) to
evaluate the situation of hunger combat programs in Brazil, in accordance with the
commitments signed by the country in the World Food Summit in 1996; b) to restart the
mobilization of society concerning the theme of food security; and c) to involve federal,
sub-national and municipal governments, NGOs and civil society in a feasible proposal
to fight hunger.
As Counselor for Instituto Cidadania and inspiration for the proposal, President Lula
embraced the theme in his political campaign, placing it later, after his election, as a
priority for his government. The ZHP has as a guiding principle the right to adequate
food, which gives the matter universal treatment.7
In order to make an estimate possible to measure the size of the program that would be
designed, the definition of “vulnerable to food insecurity”, underwent several
calculations, the bases of which included information regarding individuals’ incomes.
According to the PNAD/ IBGE (Brazilian Geography and Statistics Institute – National
Household Sample Research) micro-data, we estimated the per capita income available
for each household, adding family income to an estimated production income from the
self-consumption by farmers, and deducted rental-home or own-home mortgage
expenses from the family’s income. With that estimation of home income, we sought to
define the available income for food acquisition (Takagi, Graziano da Silva e Del
Grossi, 2001).
We estimated a population of 9.3 million households vulnerable to food insecurity in
2001, which amounts to a total of 46 million people. This estimate takes into account
the differing regional poverty lines by estimating the cost of consumption of several
food drivers. The base line was R$ 71.53 per month based in the Northeast. These 7 President Lula’s phrase, presented in a speech in his election’s day, that became famous, expresses very well this universal character of the ZHP: “The first year of my mandate will have the hunger combat mark… If, at the end of my mandate, each Brazilian could eat three times a day, I will have realized my life mission”.

11
values corresponded to nearly US$ 1 current/capita/day (Takagi, Graziano da Silva e
Del Grossi, 2001:1). Compared to 1995, the annual growth rate of “vulnerable to food
insecurity” households increased 3.1%. The largest growth rates were found in
metropolitan areas (6.7% per year).
Brazil’s poor population is concentrated in the Northeast part of the country (47.5% of
all poor people in the country). The poor rural population in the Northeast combined
with the population of poor in small and medium-sized towns in that region account for
40.2% of the total population (poor and non-poor) of Brazil. These percentages illustrate
that a highly concentrated population of people lives in the Northeast. The people have
insufficient income – one of two inhabitants of rural and non-metropolitan urban areas
in that region earn insufficient income, which is detrimental in the aims of proper
nourishment.
In its initial steps in the program, the ZHP tried to take advantage of this information,
initiating action by seeking to focus on the northeastern rural and non-metropolitan
populations, dealing with the other rural and metropolitan areas of the country later.
This movement occurred at the same time that structural changes were taking place in
local development, along with efforts at self-sustainability in local economies.
However, before presenting the ZHP operations to address the issue of needy
households, it would be opportune to present an international spectrum of poverty
combat programs that can be compared to the programs being implemented in Brazil.

12
2.1 THE “OPORTUNIDADES” PROGRAM OF MEXICO
The Human Development Program Oportunidades (Opportunities) started in Mexico in
1997, named PROGRESA, in concurrence with suggestions and proposals from
Santiago Levy, a former professor at Boston who also worked at the World Bank. The
objective of PROGRESA was to establish a program that could embrace education,
health care and food fields, which were previously addressed by less efficient programs.
PROGRESA is considered a second-generation poverty combat program because: 1) it
transfers resources directly to the beneficiary public; 2) the transfer is made directly to
the female-householder; and 3) the transfer is conditional on beneficiary actions,
concerning education (keeping children in school), health care (basic care for the whole
family) and nutrition (classes in the community, public health assistance). According to
World Bank authorities, the traditional poverty combat programs were not effective in
Mexico due to public system corruption in resource transfers, misdirected focus
resulting in wasted resources, and excess control of the beneficiary public (Parker e
Scott, 2001).
Currently, “Oportunidades” is installed in nearly all Mexico, and has quickly expanded
under the President Zedillo’s government and has expanded on Fox administration. In
total, Opportunities serves 4.2 million households. Six hundred thousand live in urban
areas, at a cost of almost US$ 1 billion per year. It is relevant to note that Mexico’s
population numbers 103 million inhabitants, 25% of which live in rural areas.
According to Gundersen and Kelly (2001), the implementation of Oportunidades in
Mexico was a hallmark, because it accounted for certain limitations that existed in
previous programs. The emphasis of Opportunities on farming households, which
addresses 50% of rural households but only 0,8% of urban ones, makes it essentially a
non-farm rural program, in spite of the fact that there continue to be other important
income programs for Mexican farmers, such as PROCAMPO (Sadoulet, De Janvry e
Davis, 2001).
In order to put the program into operation, over one year was spent in studies and
simulations, which consumed nearly one-third of the planning budget. Two years were
spent in planning based on sample of 24,000 households from 506 localities in seven

13
states (see www.ifpri.org/data/mexico01.htm ) . Ernesto Zedillo’s presidential mandate
(1994-2000) made this extended planning period possible because there was a long time
during the planning period which begun in the six months between the election of
presidential candidates and the candidate-elect taking power (from July to December)
and continued during the three first years.
PROGRESA – “Oportunidades” was created in 3 phases: 1) An exclusion index based
on the demographic census was created, and considered data regarding education, health
care, life quality, accessibility to public services, etc. The exclusion index would be
valid for the community and therefore – at the beginning – did not take into account
income levels; 2) household selection in the community based on income levels; and 3)
a list of the selected households would be analyzed by assemblies and representatives
(female heads of family) of the proper community (Gundersen et al., 2000). In addition,
some tests were made allowing benefits distribution to some households, compared to
other families in the same situation and locality. Those distributions, in experimental
design, where monitored and evaluated observing progress in terms of education and
health.
Begun in distant communities all around the country (mainly Guerrero, Hidalgo,
Michoacán etc.), government officials disseminated PROGRESA to other rural areas,
mainly communities with abundant ejidos. Presently, the program covers the whole and
several communities around Mexico City, but has not yet reached the capital. Our
evaluation supports the conclusion that the program would not be adaptable to benefit
the urban poor.
The efforts and expenses in creating a list of the poor population were so great, that the
program currently has no efficient system to update their records for society’s “new”
poor people. The records of the population were made only at the beginning of the
program, and because of the costs and time, the indispensable update has not been
realized.
The results of PROGRESA – Oportunidades shown by Davis (2001) are optimistic. The
researchers’ data highlight increasing student registration, greater incidence of
children’s permanence of in schools, less incidence of disease, lower rates of work
14
absence, and an increase in average food expenses, 13% of which is spent on meat and
vegetables. With regard to costs, it is estimated that management overhead remained at
8.9% of the overall program costs. Simulations demonstrate that if the program were
implemented to every household in the community without discrimination, costs would
reduce by 6.2%. If we eliminated both controls and conditions for receiving aid, the
costs would decrease by 6.6% of total expenditures. If the government undertook both
measures (elimination of household’s selection and expenditure’s control), the cost
could diminish to just 3.9 cents per each 100 pesos distributed.
In the same manner, an evaluation made by Parker and Scott (2001) demonstrates that
for each peso transferred to the beneficiaries of the Opportunities program, 91 cents
effectively arrive at their destination. These values are significantly higher than the 64
cents that were distributed by the Liconsa poverty program.8
PROGRESA – Oportunidades utilizes the same resources and has come to substitute the
universal subsidies that used to be given to poor people in Mexico. The previous
tortibonus (universal subsidy on the price of tortilla) and tortivales (stamps distributed
by the government) had nearly-restricted accessibility. Moreover, the subsidies
benefited primarily the urban masses located in Mexico City.9 With the reassignment of
resources to the PROGRESA program, it became the single benefit package for
populations in rural and distant localities (where 50% of the poverty in Mexico exists),
but continued to provide little – or little help – to the poor populations in urban and
industrialized areas.
Although Opportunities includes a food plan among its policies, it is not a food security
program, though it does have a food consume impact10. The resource transfers made
within the framework of the program are directed towards food purchase and in the
health module, the program incorporates food supply assistance to children. Pursuant to
Gordillo (2003), in 2002, the Mexican government and FAO signed an agreement to 8 Liconsa is based on the subsidy to the powder milk purchase for the needy households. Each family having children under 12 years old and income under ½ minimum wage is qualified for receiving the benefit (Gundersen et al., 2000). 9 In 1997 the Tortibono Program has distributed 47 millions kg of tortillas a month to 1,9 millions of households living in 1000 towns and 400 rural localities in all over Mexico. In that year, the program had a total cost of US$ 135 millions. None assessment about the program’s economical or nutritional impacts were made. 10 Considering the diversity and the increasingly food caloric consumption.
15
implement a food security program for the excluded populations. Furthermore,
Mexicans also rely upon an emergency attention program for food distribution to
vulnerable populations.
For the purpose of our work, we note in Opportunities the following elements:
- The Mexican Opportunities program proved to an extreme the necessity of clearly
defining its future public beneficiaries. The investments made in the program’s
preparations and design have consumed considerable resources, but management
expenses and possible deviations where minimized.
- The program sought to “organize the line of coverture” for the rural areas’
populations, but did not find yet the best method to ascertain poverty levels in large
urban centers. Furthermore, Opportunities demonstrated that single attention programs
will not work, but instead must be complemented by other specific programs for each
situation.
- The program sought to creatively avoid some of the negative incentives that often arise
in social programs, including: 1) movement of inhabitants from one area to the other
who aimed to take advantage of benefits in other regions and 2) deliberately reducing
household income or increasing the number of children and dependents in order to
obtain greater benefits.
Even considering all of PROGRESA’s positive aspects, the problem remains that
planners have spent a lot of money to benefit few people. For instance, in 1997,
PROGRESA spent the equivalent to 1% of Mexico’s Gross Domestic Product, or R$
1.51 billion at 1999 rates (Camargo e Ferreira, 2001). Castañeda (1998:13) calculates
that the average amount of money transferred in 1997 was 233 Mexican pesos (nearly
US$ 29) per household, corresponding to 34% of those families’ income. Castañeda
criticizes, “In Mexico as in Brazil, the program is vulnerable to deficiencies regarding
services offered because the regions with larger numbers of beneficiaries have the worst
educational and health care infrastructure problems” (Camargo e Ferreira, 2001:19). In
addition, PROGRESA’s focus criteria are satisfactorily reaching the poorest districts, but

16
are failing in find the poorest households (Camargo e Ferreira, 2001:20; Botello, 2003:
12).
3 SOCIAL POLICIES: UNIVERSALIZED AND EFFICIENT
As illustrated, policies ensuring universal rights, including the right to adequate food
foreseen in ZHP, contradict the necessity of establishing action focused a specific
section of the public. Moreover, we demonstrated that focusing on food security could
be slightly different from focusing on combating poverty. It is a fact that not every poor
individual is vulnerable to food insecurity, and not every person vulnerable to food
insecurity is necessarily poor, though there is a high probability that the mutual
situations exist. Therefore, the major question that will be presented in this section is:
How can find more efficiency in the selection of beneficiaries in a food program?
Public programs in Brazil and in other less-developed countries provide for social
rights, including access to health care and education. However, in the case of food,
either the household income is enough to provide a minimum of recommended calories
and nutrients, or the individuals are automatically vulnerable to food insecurity, because
households with public attention programs do not traditionally exist. Public actions in
this field are still restricted to certain municipalities, or else the food-drive distribution
is sporadic and has electoral aims.
The problems begin with beneficiary selection. In the case of food security, selecting
“vulnerable to food insecurity” households becomes quite complicated, since the single
criterion, ample and available through research on a national level, is the income.
Nevertheless, in order to counter this problem, it is possible to establish a hybrid
method for social program design, in which we determine by secondary attributes how
to seek the households which are most vulnerable to food insecurity.
Pursuant to recent studies made by Hoffmann (2003) based on PNAD – IBGE’s 1999
survey results, we observe the prevalence of the following characteristics among
workers when the effects of other variables are left out, as follows:

17
- Women earn systematically less than men: a woman’s expected income is 27% lower
than men;
- Housekeepers (house servants) have an expected income 19% lower than other
wageworkers, while employers have an expected income 62% higher than
wageworkers;
- Non-whites (blacks and mulattoes) have an expected income 12% lower than white
people;
- Northeastern workers systematically have the lowest expected income: 15% lower
than the North region, 23% lower than Minas Gerais (MG) state + Rio de Janeiro (RJ) +
Espírito Santo (ES), 46% lower than the State of São Paulo, 24% lower than the
Southern region and 26% lower than the Center-West region;
- Rural workers have an expected income 10% lower than urban workers.
The characteristics above indicate groups of populations and regions with higher
probability of being effected by poverty, but it the problem is spread throughout all of
Brazil at differing levels.
Food security programs that aim to ensure food on the tables of the poor have to attack
with priority the problem of the poorest. Among the research in the field of food
security, it is a current idea that a vulnerable situation exists in households of all income
levels (Silveira et al., 2002). However, it is definite that the poorest households have the
biggest problems with hunger. Hunger is more evident and more readily manifest in
poverty situations. For this reason, any hunger program must concentrate in regions
where there is a high concentration of poor people and where poverty appears in a more
profound manner.
We are attempting to define, using secondary data, which areas would have priority in
the development of a program against hunger. Statistical exercises with data of IBGE’s
demographic census of 2000 were made. In order to simplify the calculation while also
considering that the census results do not present data about self-consumption and about
rental-home expenses (that could “improve” the poorest ones’ income), we decided to
utilize a single poverty line based in the per capita household income, linear for all of
Brazil. This line was arbitrated on the value of ½ minimum wage per capita in
18
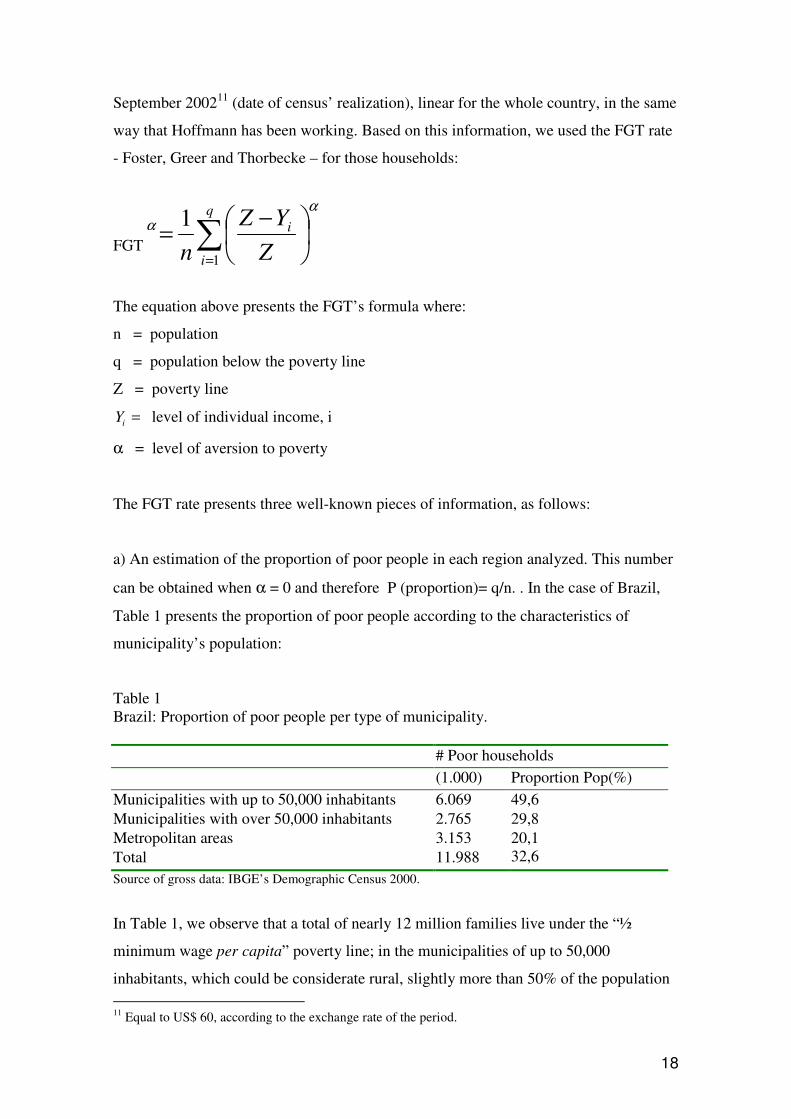
September 200211 (date of census’ realization), linear for the whole country, in the same
way that Hoffmann has been working. Based on this information, we used the FGT rate
- Foster, Greer and Thorbecke – for those households:
FGT
α
α
−= ∑
=Z
YZ
ni
q
i 1
1
The equation above presents the FGT’s formula where:
n = population
q = population below the poverty line
Z = poverty line
Yi = level of individual income, i
α = level of aversion to poverty
The FGT rate presents three well-known pieces of information, as follows:
a) An estimation of the proportion of poor people in each region analyzed. This number
can be obtained when α = 0 and therefore P (proportion)= q/n. . In the case of Brazil,
Table 1 presents the proportion of poor people according to the characteristics of
municipality’s population:
Table 1 Brazil: Proportion of poor people per type of municipality. # Poor households (1.000) Proportion Pop(%) Municipalities with up to 50,000 inhabitants 6.069 49,6 Municipalities with over 50,000 inhabitants 2.765 29,8 Metropolitan areas 3.153 Total 11.988
20,1 32,6
Source of gross data: IBGE’s Demographic Census 2000.
In Table 1, we observe that a total of nearly 12 million families live under the “½
minimum wage per capita” poverty line; in the municipalities of up to 50,000
inhabitants, which could be considerate rural, slightly more than 50% of the population 11 Equal to US$ 60, according to the exchange rate of the period.
19
is poor people. Also in the smaller municipalities, the proportion of poor people is
larger. We observe that in the first category of municipalities a proportion of 49,6% of
households live below the poverty line in the municipalities with less than 50,000
inhabitants. This proportion is much larger than that observed in the larger
municipalities (29,8%), and also higher than that found in large cities (20,1%).
b) Another known property of the FGT is that when α = 1, simultaneously the
proportion of poor people and the poverty intensity are known, by calculating income
insufficiency.12 The income insufficiency is high in the three groups, but is most acute
in the group of individuals living in municipalities with less than 50,000 inhabitants
(Table 2). In these small municipalities, the poor people’s medium income is 53% under
the poverty line. This means that these individuals’ incomes must at least double in
order to reach the poverty line. In the other groups, while the percent below the poverty
line is relatively less, it is still high.
The FGT’s calculations compares these differences, in which we observe that when α =
1, municipalities have a high level of insufficiency - 0.26, which is half the number of
individuals living in bigger municipalities (0,14), and half again for those populations in
metropolises. Table 2 illustrates this.
The FGT’s comparison when α = 1 allows us to distinguish the “poor” group from the
“very poor.” The higher the rate, the graver the situation is for these individuals. In this
particular instance, it is interesting to notice inside of each of the two groups mentioned,
the states where the situation is most critical, before measuring a third level of analysis.
c) We attribute to α the value 2; this illustrates the critical situation. This rate attributes
proportionally more weight to poor people. For this reason it considers also unequal
income distribution.
12 Also known as income gap.

20
Table 2 Brazil: Depth of Poverty according to the FGT index.
Insufficiency of income (%)
FGT rate α= 1
FGT rate α= 2
Municipalities - less than 50,000 inhabitants 52,8 0,26 0.185 Municipalities with over 50,000 inhabitants 46,6 0,14 0,092 Metropolitan areas 45,9 0,09 0,065 Source of gross data: IBGE’s Demographic Census 2000.
The FGT rate shows that, with α = 2, we give weigh the poor populations more heavily;
the smallest municipalities have inhabitants in the worst situation. That means that the
largest contingent with insufficient income is located in the Brazilian municipalities
with fewer than 50,000 inhabitants. The depth of income insufficiency is the largest and
also has more income inequality. The next step, based on these elements, is to define the
geographic areas where the income situation is worst. The question is: Where should we
start?
Based on the FGT’s rate calculation when α = 2, we note in Table 3 that the North and
Northeast regions present the most acute situation. The highest level is in the Northeast,
where the people live in municipalities less than 50,000 inhabitants; second, are the
households in small northern municipalities, followed by the northeastern municipalities
with more than 50,000 inhabitants. In fourth place among the municipalities having the
biggest inequality are the northeastern metropolitan areas. These data direct us to reason
that it is important to act in the most problematic regions with directed social policies.
We emphasize that the small municipalities of São Paulo state and the southern regions
in Brazil were where we verified the smallest income insufficiencies among poor
populations. Even the metropolitan areas of São Paulo city present much less acute
differences between the situation of the poor and the poor found in the Northeast.
21
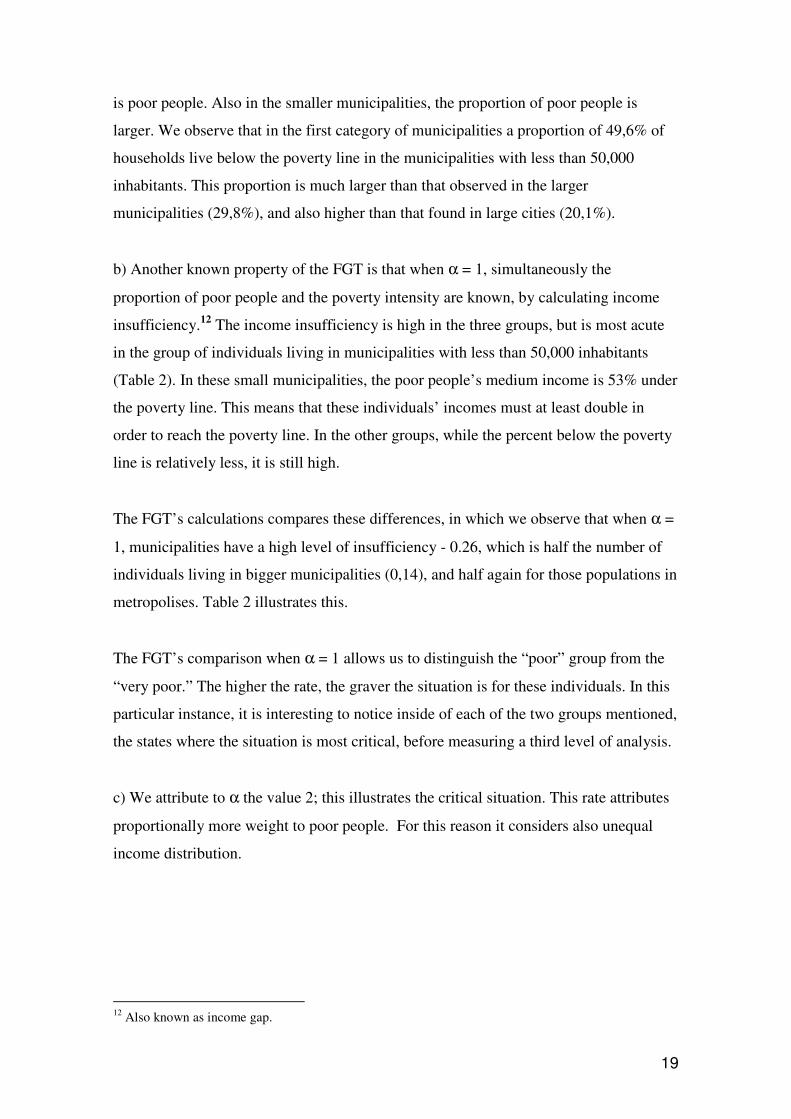
Table 3 Brazil: FGT rate –specific regions (parameter α= 2). Regions of the country Inhabitants of municipalities with Metropolitan up to 50,000 over 50,000 areas North 0,252 0,142 0,090 Northeast 0,294 0,168 0,114 RJ+ES+MG 0,113 0,056 0,059 São Paulo 0,051 0,035 0,053 South 0,078 0,049 0,038 Centre-West 0,097 0,057 0,054 Source of gross data: IBGE’s Demographic Census 2000.
In Table 4, the states with the largest proportion of poor population in small
municipalities are presented. We observe that in this list of ten states, eight of them are
part of the Northeast region, and the state with largest number of poor households
among the small municipalities is Bahia (908,400 households), followed by seven other
states in the northeastern region. Among the ten selected states, only Amazonas and
Acre have high poverty levels. However both are among the states with the smallest
populations.
We also observe in Table 4 that all the levels of income insufficiency in those states are
over 54.7% and the parameter α= 2 is always greater than 0.259, which is five times
higher than that found in São Paulo state.
22
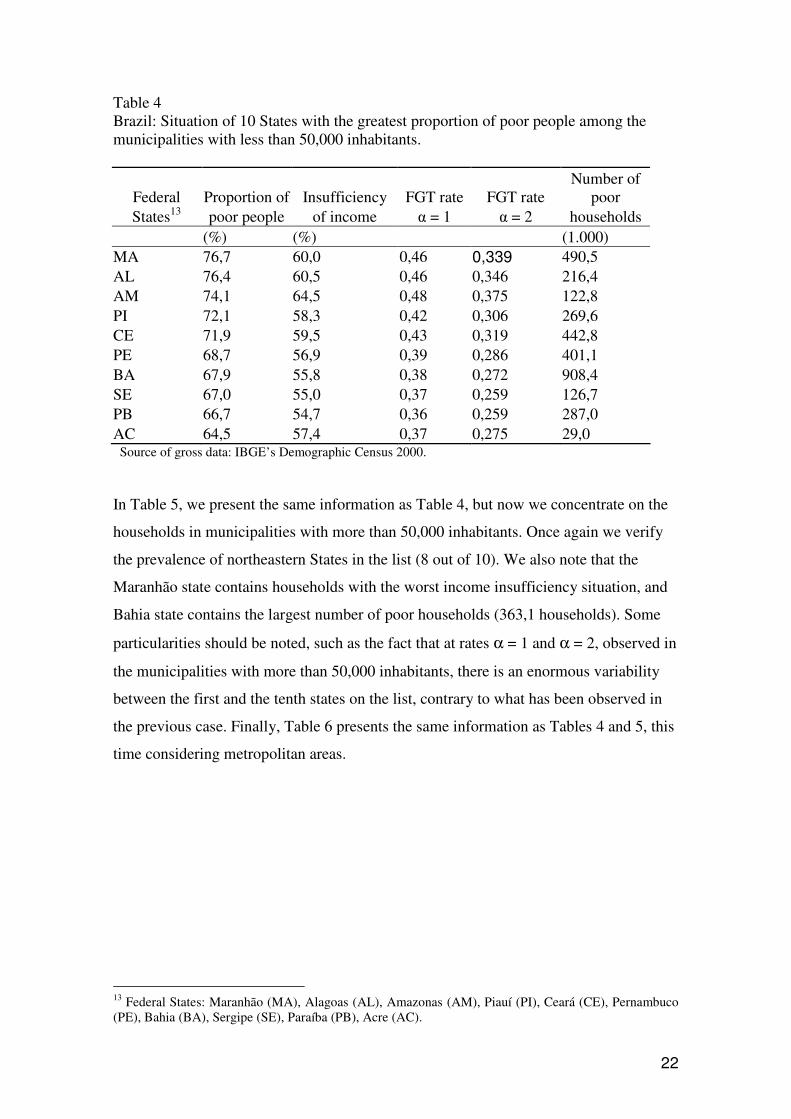
Table 4 Brazil: Situation of 10 States with the greatest proportion of poor people among the municipalities with less than 50,000 inhabitants.
Federal Proportion of Insufficiency FGT rate FGT rate Number of
poor States13 poor people of income α = 1 α = 2 households
(%) (%) (1.000) MA 76,7 60,0 0,46 0,339 490,5 AL 76,4 60,5 0,46 0,346 216,4 AM 74,1 64,5 0,48 0,375 122,8 PI 72,1 58,3 0,42 0,306 269,6 CE 71,9 59,5 0,43 0,319 442,8 PE 68,7 56,9 0,39 0,286 401,1 BA 67,9 55,8 0,38 0,272 908,4 SE 67,0 55,0 0,37 0,259 126,7 PB 66,7 54,7 0,36 0,259 287,0 AC 64,5 57,4 0,37 0,275 29,0 Source of gross data: IBGE’s Demographic Census 2000.
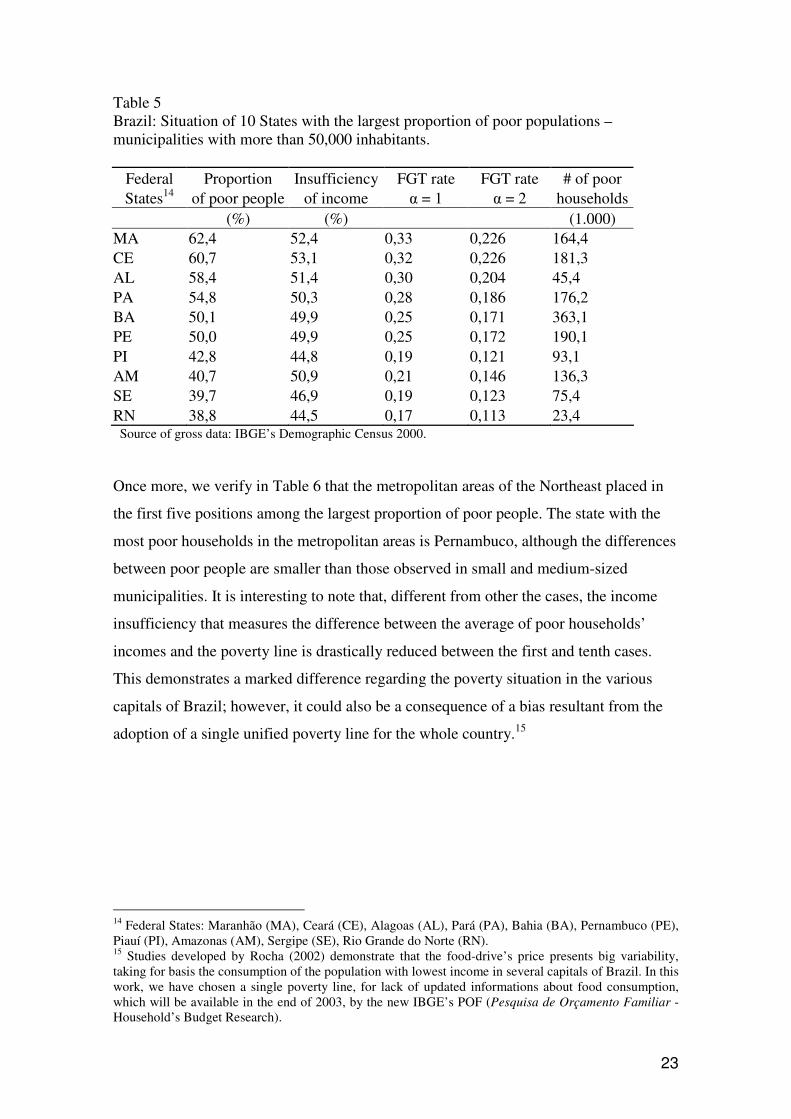
In Table 5, we present the same information as Table 4, but now we concentrate on the
households in municipalities with more than 50,000 inhabitants. Once again we verify
the prevalence of northeastern States in the list (8 out of 10). We also note that the
Maranhão state contains households with the worst income insufficiency situation, and
Bahia state contains the largest number of poor households (363,1 households). Some
particularities should be noted, such as the fact that at rates α = 1 and α = 2, observed in
the municipalities with more than 50,000 inhabitants, there is an enormous variability
between the first and the tenth states on the list, contrary to what has been observed in
the previous case. Finally, Table 6 presents the same information as Tables 4 and 5, this
time considering metropolitan areas.
13 Federal States: Maranhão (MA), Alagoas (AL), Amazonas (AM), Piauí (PI), Ceará (CE), Pernambuco (PE), Bahia (BA), Sergipe (SE), Paraíba (PB), Acre (AC).
23
Table 5 Brazil: Situation of 10 States with the largest proportion of poor populations – municipalities with more than 50,000 inhabitants.
Federal Proportion Insufficiency FGT rate FGT rate # of poor States14 of poor people of income α = 1 α = 2 households
(%) (%) (1.000) MA 62,4 52,4 0,33 0,226 164,4 CE 60,7 53,1 0,32 0,226 181,3 AL 58,4 51,4 0,30 0,204 45,4 PA 54,8 50,3 0,28 0,186 176,2 BA 50,1 49,9 0,25 0,171 363,1 PE 50,0 49,9 0,25 0,172 190,1 PI 42,8 44,8 0,19 0,121 93,1 AM 40,7 50,9 0,21 0,146 136,3 SE 39,7 46,9 0,19 0,123 75,4 RN 38,8 44,5 0,17 0,113 23,4 Source of gross data: IBGE’s Demographic Census 2000.
Once more, we verify in Table 6 that the metropolitan areas of the Northeast placed in
the first five positions among the largest proportion of poor people. The state with the
most poor households in the metropolitan areas is Pernambuco, although the differences
between poor people are smaller than those observed in small and medium-sized
municipalities. It is interesting to note that, different from other the cases, the income
insufficiency that measures the difference between the average of poor households’
incomes and the poverty line is drastically reduced between the first and tenth cases.
This demonstrates a marked difference regarding the poverty situation in the various
capitals of Brazil; however, it could also be a consequence of a bias resultant from the
adoption of a single unified poverty line for the whole country.15
14 Federal States: Maranhão (MA), Ceará (CE), Alagoas (AL), Pará (PA), Bahia (BA), Pernambuco (PE), Piauí (PI), Amazonas (AM), Sergipe (SE), Rio Grande do Norte (RN). 15 Studies developed by Rocha (2002) demonstrate that the food-drive’s price presents big variability, taking for basis the consumption of the population with lowest income in several capitals of Brazil. In this work, we have chosen a single poverty line, for lack of updated informations about food consumption, which will be available in the end of 2003, by the new IBGE’s POF (Pesquisa de Orçamento Familiar - Household’s Budget Research).

24
Table 6 Brazil: Situation of 10 States with the largest proportion of poor population – urban area municipalities. Federal Proportion Insufficiency FGT rate FGT rate Poor States16 of poor people of income α = 1 α = 2 households (%) (%) (per 1.000) AL 42,7 49,1 0,21 0,144 91,0 MA 41,7 45,3 0,19 0,122 91,6 CE 38,8 45,4 0,18 0,115 245,1 PE 36,4 46,2 0,17 0,113 273,7 RN 34,1 44,6 0,15 0,099 74,5 BA 32,8 47,0 0,15 0,106 222,8 PA 31,7 43,5 0,14 0,090 117,7 GO 22,3 42,2 0,09 0,063 128,6 ES 21,3 42,9 0,09 0,061 70,6 MG 21,2 41,6 0,09 0,058 263,0 Source of gross data: IBGE’s Demographic Census 2000. These numbers demonstrate that choosing areas within the northeastern semi-árido
region (the driest region) as a starting point for initiating the ZHP programs of benefit
distribution covers perfectly the demand for focusing social policies. Actually, studies
demonstrate that economic growth policies without correct regional focusing have
reduced impacts.
To close the section showing the critical situation of poverty in the Northeast region of
Brazil, it would be relevant to reinforce some information about rural areas. Therefore,
we will take the data obtained through the Farming Census 1995/1996 regarding
farming establishments.
According to the research O novo retrato da agricultura familiar no Brasil (The new
portrait of household agriculture in Brazil), based on the Farming Census of 1995/1996,
52,2% of northeastern farmers belonged to the type “D” (the poorest people, whose
“Total Property Income” rate is lower than half of their “Opportunity Cost Value” rate,
measured by the state daily pay, which is the daily value plus 20% increase). Given that
information shows that there are 1,215,064 type D establishments in the Northeast,
which represents 29.3% of household establishments of Brazil and 63.4% of all type D
establishments. These are the most undercapitalized producers, with an annual total 16 Federal States: Alagoas (AL), Maranhão (MA), Ceará (CE), Pernambuco (PE), Rio Grande do Norte (RN), Bahia (BA), Pará (PA), Goiás (GO), Espírito Santo (ES), Minas Gerais (MG).
25
income average of R$ 226.00 and a monetary income of R$ 54.00, which certainly put
those households under any poverty line that we could construct.
In accordance with Lustig, Arias e Rigolini (2002), “while in some countries and in
certain periods, poverty decreases significantly because of the economic growth, in
other countries the response is much less pleasant…The speed at which growth reduces
poverty depends on the distribution of initial benefits and also on its evolution over
time. In unequal societies, the same growth rate produces a much smaller poverty
reduction” (2002:2). This is the case in Brazil, which has a Gini coefficient at about 0,6,
which causes the economic growth to reduce poverty at a rate equivalent to half the
speed observed in countries with a Gini coefficient at 0,2.
The authors also warn of another point: growth can be little successful concerning
poverty reduction, if it does not include certain geographic areas and poor sectors, or if
it does not utilize technology of intensive manpower (Lustig, Arias e Rigolini, 2002:5).
They demonstrate that the improvements of human capital must join with intervention
programs in health, nutrition, basic sanitation and infrastructure, because children
suffering malnutrition have a much lower learning levels (2002:10).
Contrary to the Mexican “Oportunidades” program, in which has the comfortable
situation of spending many months in detailed planning and used one-third of the annual
budget to identify its beneficiary public in the first year, the ZHP decided to search for a
program’s hybrid shape, in which there is more direct focus while simultaneously
working to ensure universal social rights guarantees. For these reasons, the initial choice
of geographic areas where the program should start fell directly to the northeast states,
due the generalized poverty situation of their population and the high levels of
inequality17.
In the second phase of the selection process, it was necessary to analyze the income
situation of poor households in the municipalities of northeastern semi-árido region, in
order to define which would be the beneficiary households for the resources transfers.
17 Contrary to Mexico that has begun its program focusing the poorest families covering the whole territory
26
As was done in Mexico, we intended to utilize databases tool to select the poorest
families among the poor.
Due to the need to work rapidly and for the lack of ample research on the nutritional
situations of northeastern households, we have chosen a single registry (Cadastro Único
– Cadúnico) of households, initiated in 2001, by the federal government18.
The Cadúnico – Cadastro Único of federal government was created by decree in 2001
orientated the beneficiary household selection of Bolsa Renda (income-help), Bolsa
Escola (scholarships), PETI – Programa de Erradicação do Trabalho Infantil (Child
Labor Eradication Program), Agente Jovem (young agent) and Bolsa Alimentação
(food-help). The database became an obligatory reference for the program managers
upon which to base grants to the households.
The task of compiling a single registry fell to the Caixa Econômica Federal (Federal
Savings Bank), which the organization improved jointly with municipality offices, local
governments, religious entities and other groups, in order to establish households and
create a registry. According to information from MPAS (Public Ministry of Social
Assistance – 2002), up to November 2002, the single registry had covered 5,112
municipalities of Brazil (92% of total), registering 22,3 million people in 5,3 million
poor households (57% of the estimated total). Each family was given an NIS – Social
Identification Number – and a benefit card.
Prior survey results based on the Single Registry show that the actions involved in the
preparing the list were extremely expensive19 and inefficient. Due to the complexity of
the registry and to its tendency to quickly become obsolete, the information quickly
went out of date. According to sources in the recently-created Special Ministry of Food
Security and Fight against Hunger,20 responsible for benefit distribution (food stamps),
in some Northeast localities nearly 90% of the sampled households did not live at the
address declared on the single registry list; in another municipality, only one-third of
18 Which is known for its poor quality of information. 19 Caixa Econômica Federal received R$ 6,00 per digitalized form, R$ 0,70 per attributed NIS or R$ 0,20 per localized and modified NIS. Besides, the beneficiary was obliged to pay taxes to the institution, as R$ per identification and password registered, R$ 1,20 per received benefit and R$ 1,20 per issued card. These values compare roughly with the US dollar at a rate of US$ 1 for R$ 3 as of 2003 July. 20 Based on results taken from TCU – Tribunal de Contas da União (Federal Budget Accounts Court).

27
listed households had municipality functionaries among their integrants. Those elements
demonstrate that the inefficiency of that instrument was allowing a big quantity of
frauds to happen.
Keeping in mind those difficulties, we again looked for a model for household selection
that could skip certain steps with respect to the Mexican model previously described.
For this reason, the ZHP has chosen an efficient and cheap method to attract local
participation, instead of a database superstructure for the local identification of
“vulnerable to food insecurity” households. This turns to be a great advantage of Zero
Hunger.
In the present legislation, all households must be listed on the single registry in order to
receive any type of benefit transfer from federal government. Therefore, we determined
that the members of local committees should select the households that will receive
food-stamp benefits to begin the ZHP program in municipalities. The Local Committees
are also responsible for including needy households that are not yet listed in the single
registry.
The Local Committees consist of between seven and nine members, preferably female
householders, with a majority of civil society representatives. It falls to the Committee
to select the households and to arrange the follow-up process of resource transfers with
the beneficiaries’ counterparts. These counterparts encompass several types:
maintenance of children in the school, attendance at literacy courses, participation at
capacity building courses, community services, proof of being under public health
assistance (children’s vaccination), and proof of spending the stamps on food purchases.
The resources transfer involved in the food stamp program is the main policy of ZHP,
since it is linked to the specific necessity of ensuring food consumption. However, it is
not the only policy: it complements the other structural programs that have been
developed since the ZHP was launched.
The next section describes these programs, showing how the program’s strategy of
acting sought to embrace several possibilities, and ensuring the focusing aims without
losing their universal character.

28
29
3.1 STRUCTURAL ACTIONS OF THE ZERO HUNGER PROGRAM
The ZHP is part of a collection of actions in the structural field, created to ensure that
populations vulnerable to food insecurity can enter into a self-sustainable process of
development (Graziano da Silva, Belik e Takagi, 2002). The Brazilian government
launched a series of programs seeking to support these transformations in poorer areas,
while keeping in mind that the resources transfer to the poor households through the
food stamp presupposes a set of counterparts involving education, health care and
infrastructure. Simultaneously, another group of programs was arranged, directed
towards areas where poverty is growing at a rapid pace, as is the case in Brazilian
metropolitan regions.
General actions were arranged in the education field, such as adult literacy programs,
professional capacity building courses and digital inclusion. In the field of health care,
the government intensified work towards basic health attention by initiating a monthly
follow-up program to the beneficiary households. Simultaneously they worked on
sanitation programs and endemic disease control. Finally, in respect to income and
employment creation policies, we started to work in a synergic framework on food
production and infrastructure in those communities.
In the rural areas and small communities, the object of priority government action is to
address the neediest areas, two initiatives should be mentioned: the incentive for
household farming and the construction of cisterns to supply drinking water.
As a way to improve household income, examining not only the specific actions but
also the structural actions, is possible to articulate programs which can directly convey
the wanted effects without resource deviations, as follows:
- Household farming requires support. It was once a major part of life in these rural
households, who practice subsistence agriculture without looking towards future
development. Indicators taken from PNAD 2001 show that 38.9% of poor rural
households have some capacity for producing foods for self-consumption. In addition,
the research shows that 41,7% of autonomous families whose primary income is from
30
farming can be considered poor. Also taking into account the households with other
financial activities, 38,1% of families involved in farming can be taken as poor.
Because of those characteristics, the ZHP set up a policy of ample credits towards
household farming, which includes the government’s guarantee to purchase some of the
food produced. They will purchase at differential minimum prices which should
strengthen official technical assistance in the producers’ municipalities.21 This policy is
connected to an increase in food consumption along with the resources transfers in the
food stamp program. For this reason, in the municipalities where the food stamp
program is being implemented, we plan to increase household farming production,
providing for sustainable development.
- Micro-credit policies directed towards the improvement of housing conditions and to
the development of small business. As was expected, the PNAD’s data show that 33,9%
of poor households contained at least one member searching for a job during the
reference week. This is without considering that the “effective search for a job during
the reference week” is very restrictive, and also excluding the knowledge that a
discouraging situation results from underemployment, a situation that directly affects
rural families. The policies connected to the micro-finance work directly on income and
employment creation for the poorest communities.
- Adult’s literacy, educational level improvement and professional capacity building are
also priority policies linked to the ZHP. Considering that 44,5% of poor households
have one illiterate member (as opposed to 19,6% of non-poor households, according to
PNAD 2001), several policies were implemented with the support of UNESCO,
universities and local institutions, to give households the means to receive support along
with the food stamp resource transfers.
Sanitation infrastructure, water supply, and public works are also being examined to add
to ZHP policies. These actions are particularly important in the Northeast, where it is
necessary to break links between needy communities and corrupt politicians, who
21 There will be an increase of 28,7% in credits for household farming totalizing R$ 5,4 billions in the harvest of 2003/2004. Besides, the credit line Pronaf-food was created, restricted to the cultivation of rice, beans and manioc, having interests much more reduced.

31
control the water supply with water trucks. This break represents great social and
political progress. It ensures better health conditions and increased income to these
populations. In the urban and rural areas, PNAD data show that the homes of 11,7% of
poor families did not have piped water (compared to only 2,7% of non-poor families).
In this sense, the hunger combat is also linked to the actions in the health care field and
to rural housing. Therefore, it is interesting to mention the “one million cisterns”
program (P1MC) that is being implemented in the Northeast, in conjunction with NGOs
and rural workers’ syndicates.
Other structuring actions for the rural areas of Brazil’s Northeast that should be noted
are: the strengthening of legal dispossessions for the Land Reform (Reforma Agrária)
process and the constitution of property owners’ rights, aiming to redistribute assets
(Paes de Barros, Henriques e Mendonça, 2000:28; De Janvry e Sadoulet, 2001:476),
maintaining children in school through the Bolsa Escola (scholarship) program, creating
and supporting the maintenance of local open air markets as a manner for ensuring the
farming production’s commercialization, or preferential storage in the public system of
governmental storehouses.

32
CONCLUSION
In this work, we analyzed the characteristics of ZHP and its capacity to articulate
sustainable growth models in the municipalities selected as priority in the Northeast
region of Brazil. We also made a brief comparison between the ZHP and the
PROGRESA – Opportunities, which is being implemented in Mexico and shares similar
goals with the ZHP.
We observed that ZHP, shares similarities with PROGRESA – Opportunities. Both
incorporate in the planning and implementing system some concerns related to the
efficient utilization of public resources. They also show the possibilities and the results
that could be obtained from a group of structural actions and specific actions regarding
food, nutrition and health care policies. However, contrary to the Mexican program, the
ZHP seeks to cut back some of the planning stages of the program concerning the
definition of its priority beneficiary public and also the follow-up of resource transfers.
Previously, we observed that the rural and non-metropolitan areas in the Northeast
region contain the country’s largest concentration of poor people and it is there that the
poverty gap is greatest. The urgency that causes us to skip some of the steps is justified
by the necessity of providing a rapid response to the expectations created by President
Lula after he was elected. We find further urgency due to aggravation caused by
drought in the Northeast region, affecting 975 municipalities in the semi-árido region
and resulting in an emergency situation.
Furthermore, the ZHP establishes a hybrid design assuring the universal right to
adequate food and simultaneously directs efforts to answer the demands established by
priority geographic areas. The policies involved with focusing usually ignore the causes
of poverty. The ZHP seeks not to fall victim to this mistake, promoted by academicism
and by the lack of sense of urgency. Nevertheless, the price paid by bypassing phases in
the process of selecting beneficiary households has increasingly been the responsibility
of Local Management Committees, charged with household selection and follow-up.
In effect, considering that the household selection in the municipalities chosen as
priority is based on the utilization of the Single Registry, Cadastro Único - Cadúnico,

33
created in 2001 and having several problems, the Committees’ actions have enormous
importance.
Although empowerment and the strengthening of communities are some of the social
policy’s aims, the Local Management Committee is currently responsible for selecting
the poorest families among the poor, based on inefficient and incomplete information.
This can, in short or long term, affect the reputation of that Committee’s control.
Therefore, we must promote, as quickly as possible, the verification and the update of
this database. At the same time we must combine the utilization of this policy with other
informational sources such as the official civil register, information given by social
welfare and health care public local entities, the list of public services users, and others.
The integration of social government programs can also help; the ministries’ technical
teams are currently discussing it. Integration is based on the need to integrate tools for
transferring resources, unified mechanisms to follow-up, and also databases and
committees for following-up. Integration of programs does not mean the unification of
structures nor the hierarchy of social priorities, but only the rationalization of tools, the
synergy and the unity of objectives.
Finally, it is necessary to note that the assessments and the follow-up of the research
play a crucial role in correcting the direction and implementation of ZHP in new areas.
As in the previous phases, the evaluation phase can be successful only if reliable
monitoring systems support it. Once more, the ZHP must apply creativity mixing
quantitative and qualitative assessments related to food issues that are already employed
in Mexican and North American social programs, which provide information that can
evaluate the conditions for economic and social inclusion of those populations.

34
BIBLIOGRAPHIC REFERENCES
Botello, N. A. (2003) El Futuro Llegará : El Abatimiento de la probreza desde la perspectiva del Gobierno federal en México (2000-2006) Worksho Internacional “Papel do Estado na Luta Contra a Pobreza” Fundação Joaquim Nabuco, Recife. (mimeo) Camargo, J. M ; Ferreira, F.H.G. (2001). O Benefício Social Único: Uma proposta de Reforma da Política Social no Brasil. Texto para Discussão no. 443. Rio de janeiro: Depto de Economia PUC (mimeo). Castañeda, T. (1998). The Design, implementation and impact of Food Stamp programas in developing countries - relatório do Banco Mundial (mimeo). Cohn, A. (1995). Políticas Sociais e Pobreza no Brasil. Planejamento e Políticas Públicas no. 12 jun/dez 1995. Davis, B. (2001) A experiência de intervenções de transferência de renda no México rural: Evidências dos Programas PROGRESA e PROCAMPO In: Takagi, M; Graziano da Silva e Belik, W. Combate à Fome e à Pobreza Rural. São Paulo: Instituto Cidadania Gordillo, G. (2003) Fome: A Resposta Brasileira. Valor Econômico pg..A11 Graziano da Silva, J.; Belik, W. e Takagi, M. (2002). O que o Brasil pode fazer para combater a fome In: Takagi, M; Graziano da Silva e Belik, W. Combate à Fome e à Pobreza Rural. São Paulo: Instituto Cidadania, pp. 131-152. Gundersen, C. e Kelly, T. (2001). Food assistance programs and poverty in Mexico. (preparado para o encontro da Latin America Studies Association). Washington: 2001). Hoffmann, R. Distribuição de renda no Brasil em 1999. 2003, (mimeo). Lustig, N.; Arias O. & Rigolini, J. (2002). Reducción de la Pobreza y Crecimiento Económico: la Doble Causalidad. Washington: BID (Serie de informes técnicos del departamento de Desarrollo Sostenible). MDA – Ministério do Desenvolvimento Agrário / INCRA (2000). O Novo Retrato da Agricultura Familiar – O Brasil Redescoberto. Brasília: fevereiro de 2000. MPAS – Ministério da Previdência e Assistência Social (2002). Cadastro Único para Programas Sociais do Governo Federal. Brasília: MPAS – Secretaria de Estado da Previdência Social. Paes de Barros, R.; Henriques, R. e Mendonça, R. (2000). Evolução recente da pobreza e da desigualdade: marcos preliminares para a política social no Brasil In: Paes de Barros, R. et al. Pobreza e Política Social. São Paulo: Fundação Konrad Adenauer. Rocha, S. (2000). Opções metodológicas para a estimação de linhas de indigência e de pobreza no Brasil. Rio de Janeiro, IPEA, abril (Texto para Discussão no. 720).
35
Sadoulet, E.; De Janvry, A. e Davis, B. (2001). Cash transfer programs with income multipliers: PROCAMPO in Mexico. World Development Vol. 29, no. 6 pp. 1043-1056. Silveira, F. G. et al. (2002). Insuficiência alimentar nas grandes regiões urbanas brasileiras. Brasília: IPEA (Texto para Discussão no. 884). Suplicy, E. M. (2002). Renda de Cidadania: a saída é pela porta. São Paulo: Cortez. Takagi, M.; Graziano da Silva, J. e Del Grossi, M. (2001). Pobreza e Fome: em busca de uma metodologia para quantificação do problema no Brasil. Campinas: Instituto de Economia (Texto para Discussão 101).