Embed Size (px)
Citation preview

BRAZIL MEANS BUSINESS

Brazil is the Country of the futureand always will be

Brazil ‘s future is today
1. Inflation control
2. Development of policies focused on social assistance.
3. Increase in investments
4. Informal economy reduction / Formal job positions increase
5. Wages increase
6. Credit and consumption expansion
7. Purchasing power
8. Demographics
Source: Estadao Newspaper August 2010

Historical Inflation rate 1980 - 2010
The inflation rate in Brazil was last reported at 5.91 percent in December of 2010.
From 1980 until 2010, the average inflation rate in Brazil was 445.98 percent
reaching an historical high of 6821.31 percent in April of 1990 and a record low of
1.65 percent in December of 1998.

BRAZILIAN CURRENCY
THROUGHOUT THE YEARS
…1942 42-67 67-70 70-86
R$Réis
Cr$Cruzeiro
Cr$Cruzeiro
Cz$Cruzado
NCz$Cruzado Novo
Cr$Cruzeiro
CR$Cruzeiro Real R$
REAL
86-89 89-90 90-93 93-94
1994-2010
NCr$Cruzeiro Novo

Brazil Exports Worldwide (US$ billion)
Source: MDIC

Imports from USA (US$ million)
Source: CENSUS

Source: Census
Brazil Exports to US – (US$ million)

EXCHANGE RATE
The Brazilian Real exchange rate (USDBRL) depreciated 10.83 percent during the
last 12 months. From 1992 until 2011 the USDBRL exchange averaged 1.79
reaching an historical high of 3.95 in October of 2002 and a record low of 0.00 in
January of 1992.
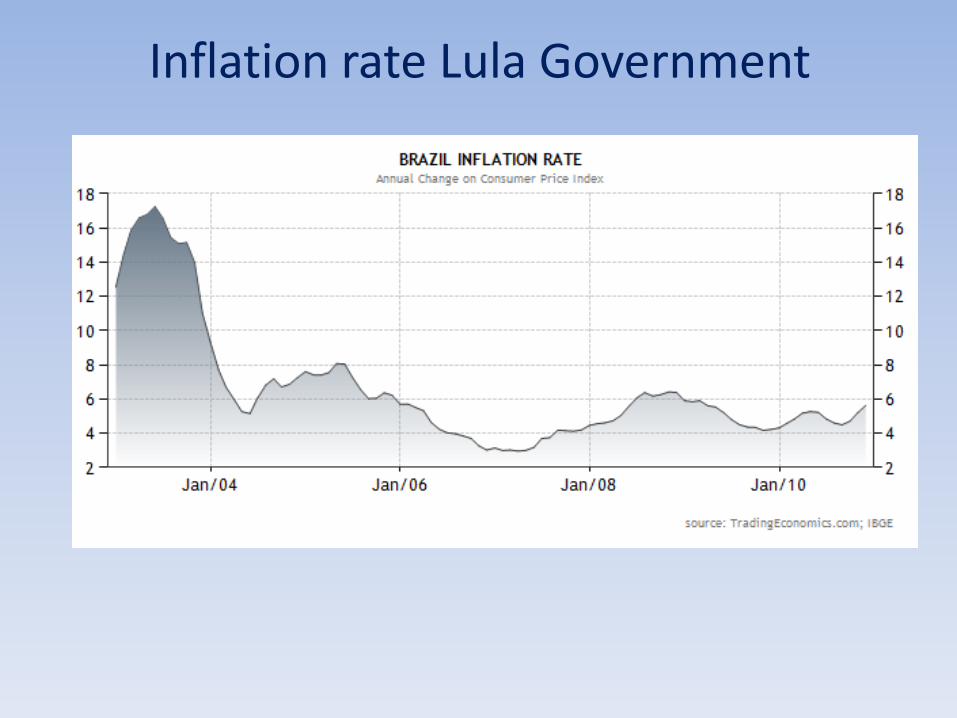
Inflation rate Lula Government

Brazil Interest rate Lula Government
Source: Trade Economics.com (from BCB)
From 1999 until 2010, Brazil's average interest rate was 17.22 percent
reaching an historical high of 45.00 percent in March of 1999 and a record
low of 8.75 percent in July of 2009.
11,25% in January 2011.

Brazil Unemployment Rate (Lula Government)
Source: Trade Economics.com (from IBGE)
The unemployment rate in Brazil was last reported at 5.30 percent in December of
2010. From 2001 until 2010, Brazil's Unemployment Rate averaged 9.95 percent
reaching an historical high of 13.10 percent in August of 2003 and a record low of
6.80 percent in December of 2008

GDP (PPP) - Purchasing power parity
(U$ bi)
Source: IMF

•More than 10 million new jobs created in formal sector.
•The lowest inflation rates in decades 2000-10.
•Expansion of purchasing power and credit and for millions
•Emphasis on lowering public debt and reducing real interest rates
expands bank credit to businesses for investment.
•Spreads (the difference between banks’ cost of funds and their
lending rates) is highest in the world.
UNDER LULA - ACCESS TO CREDIT

INTEREST RATES
• The SELIC rate is currently 11.25 % (per year).
• Mortgage loans range from 8% to 12% per year for up to 25 year loans plus inflation.
• Businesses generally pay from 2% to 4.5% (per month), depending on creditworthiness.
• Checking account rates are about 140 % year.
• Credit Card rates are 233 % per year.
Source: Central Bank Brazil

CONSUMER CREDIT as a % of GDP 2000 - 2010/
Month of comparison on the chart: January.
49% in December 2010Source: Central Bank Brazil

Evolution of family consumption (USD bi)

Brazilian Barriers to Business
Custo Brazil
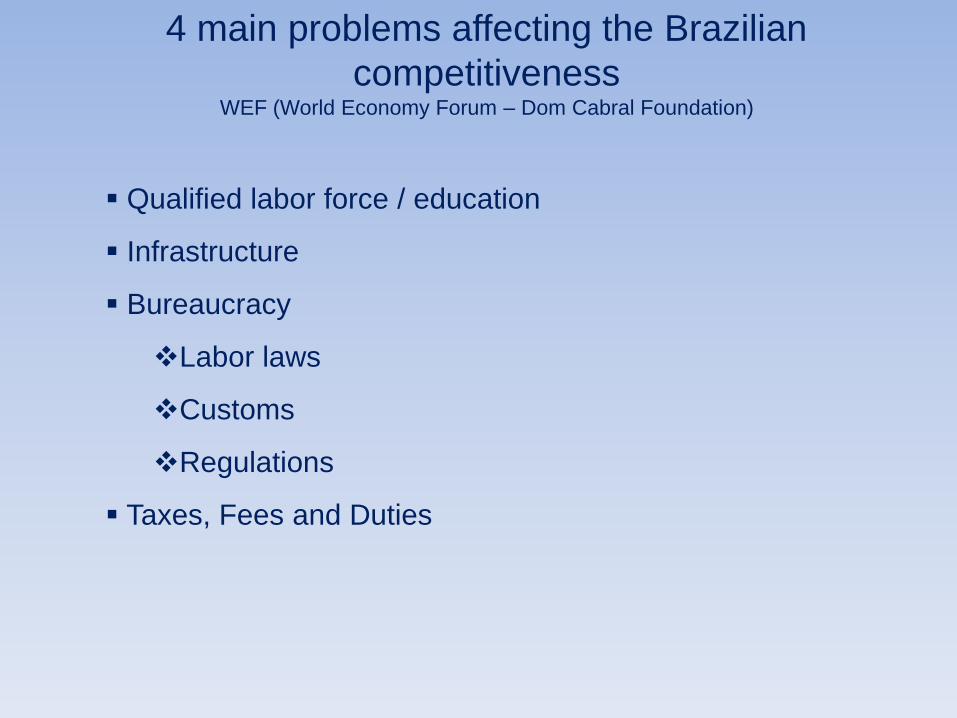
4 main problems affecting the Brazilian
competitivenessWEF (World Economy Forum – Dom Cabral Foundation)
Qualified labor force / education
Infrastructure
Bureaucracy
Labor laws
Customs
Regulations
Taxes, Fees and Duties

CUSTO BRAZIL: THE TAX SYSTEM
STATE
FEDERAL
MUNICIPAL
Import – II
Export – IE
Industrialized Products – IPI
Credit Operations – IOF
Rural Property – ITR
Fortune
Heritage and Donation – ITCMS
Circulation of Goods and Services – ICMS
Property of Vehicles – IPVA
Urban Property – IPTU
Transmission of Property – ITBI
Services of any Nature – ISS (*) Pending of regulation

Hypothetical Cost Buildup for an Imported
Machine in US Dollars
FOB price of Product 100,000
Freight 2,400
Insurance (1%) 1,000
CIF Price of Product 103,400
Import Duty Rate: 19% -- applied to CIF 19,646
IPI: 5% -- applied to CIF + import duty 6,152
ICMS: 18% -- applied to CIF + import duty + IPI 23,256
Merchant Marine Tax: 25% of ocean freight cost 600
Warehouse: 0.65% of CIF; or min. US$ 170, max US$ 235 235
Terminal Handling Charges: average US$ 100 per container 100
Contribution to Custom Broker's union 2.2% CIF; or min of US$ 71, max US$ 160 160
Custom Brokerage Fee: average 0.65% of CIF or min US$ 170, max US$ 450 450
SISCOMEX Fee 30
Typical Cargo Transportation charge 35
Typical Bank Costs: 2% of FOB 2,000
FINAL COST 156,064

IPOD INDEX


Infrastructure Matters in Brazil
BR US Difference
• Soy production costs 187 238 51 dollars cheaper in Brazil
• Transportation costs 97 26 71 dollars cheaper in U.S.
• Port costs 7 3 4 dollars cheaper in U.S.
• Total 291 267 24 dollars in favor of USA
• Conclusion:
To produce soy in Brazil is 51 dollars cheaper than in the US. Cost of logistics in Brazil eliminates this advantage and inverts the equation. Total FOB cost in Brazil is 24 dollars cheaper in the US.

Transportation – Logistics costs
Estadao Newspaper, Aug. 2010
Transportation costs
In dollars per ton
BRAZIL USA ARGENTINA
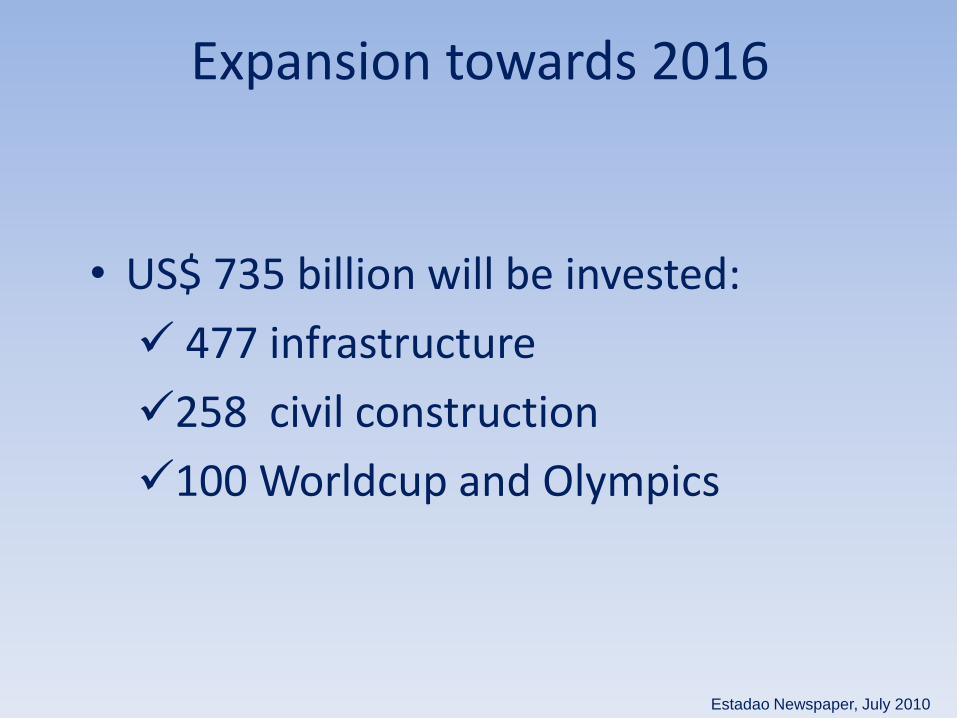
Expansion towards 2016
• US$ 735 billion will be invested:
477 infrastructure
258 civil construction
100 Worldcup and Olympics
Estadao Newspaper, July 2010

Pre-Salt ReservesThe New Frontier: 100 Billion Barrels?

KEY PAC PROJECTS (in USD)
SECTOR MINISTRY FUNDING
Infrastructure
Civil Cabinet, Ministry of
Transportation and Ministry of
Finance
USD 240 billion
Sanitation Ministry of Cities USD 19 billion
Science and TechnologyMinistry of Science and
TechnologyUSD 16 billion
Education Ministry of Education USD 3.8 billion
Security Ministry of Justice USD 3 billion
Youth Programs Ministry of Labor USD 2.5 billion
Heath Care National Health Foundation USD 1.9 billion
Transportation Ministry of Cities USD 214 million
TOTAL PLANNED PAC
EXPENDITURESUSD 287 billion

• Aerospace and Aviation• Airports• ACE
• IT• Telecom• Transportation• Electrical Power• Oil and Gas• Safety and Security• Environmental Technologies• Medical Equipment
Leading Sectors for U.S. Exports and Investment
- Brazil is ranked as the fifth largest aviation market in
the world.
- Demand for this sector is driven by the country’s
high economic growth.
- Continue to expand as a result of the WorldCup in
2014 and Olympic Games in 2016.
Aerospace and Aviation

Aerospace and Aviation
- Imports of parts and components will continue to
increase, representing good business opportunities for U.S.
suppliers.
- Most potential:
-Airplane
- Helicopter parts and components
- Law enforcement segment prepares for the World
Cup in 2014 and the Olympic Games, e.g helicopters.

Airports
- 2011 – 2014: US$ 3 billion dollars to improve
14 airports in 12 host cities of 2014 World Cup.
- These 14 airports generate 87% of Brazilian air traffic.

AIRPORT LOCATION CONSTRUCTION
INVESTMEN
T US$
MILLION
Guarrulhos Sao Paulo
Third Terminal, expansion of tarmac and
runway, Temporary Operational Modules
(MOP)
689
Viracopos Campinas New passenger terminal and Tarmac 419
Galeão Rio de JaneiroRefurbishment of Passenger Terminal 1 and
conclusion of TPS 2388
Confins Belo HorizonteExpansion Passenger Terminal Tarmac and
runway230
JK BrasiliaExpansion South Passenger Terminal and
Tarmac422.5
Salgado Filho Porto Alegre Expansion Passenger Terminal and Tarmac 195
Afonso Pena Curitiba Expansion Passenger Terminal and Tarmac 40
Luis Eduardo
MagalhaesSalvador
Refurbishment passenger Terminal, Tarmac
expansion and control tower25
Pinto Martins Fortaleza Expansion Passenger Terminal 157.5
Eduardo Gomes Manaus Expansion Passenger Terminal 184
Marechal Rondon CuiabaRefurbishment and expansion of Passenger
Terminal49
Guararapes Recife Control Tower 10.5
- Opportunities for U.S. products:
- passenger bridges
- baggage handling systems
- check-in conveyors
- X-ray machines and
- safety and security equipment.
Airports
IT BRAZIL- Second-largest IT market after China
- Brazil largest market in Lat America
- 35% of region’s revenues.
- Balance between consumer and business IT spending
- IT end-user spending in Brazil of $134 billion in 2014.
- Compound annual growth rate (CAGR) of 7.3% thru
2014.
- Largest share of market in 2010 is telecom at 72 % of
market
- IT services very strong
- Computing hardware 11.9% but will grow to 15.4% by
2014,
- 2014 World Cup and 2016 Olympic Games will require
strong investments in IT

Telecom-
- Services drive sector
-revenues of US$60.1 billion
- Fixed carriers (28%),
- Mobile carriers (38%),
- General services (22%)
- Manufactured products
-US$ 7.9 billion (12%).
- Telecom sector - drastic consolidation last 2 years
- Merger of Brasil Telecom and Oi
- Vivendi buying into GVT
- Telefônica taking control of Vivo
- Launch of national broadband plan

Telecom
- Opportunities :
-3G-network maintenance,
- WiMax services and applications
- Broadband internet infrastructure
- Application software
- Wireless communication networks.

Transportation
-Transportation infrastructure faces many challenges:
- Roads and ports need to be upgraded.
- Trucks are the most common method of transportation.
- Use of trains for long distance transportation of
passengers is restricted to a few urban tourist routes,
while train cargo is mostly restricted to minerals.
Investments : US$ 220 billion between 2008 and 2023.
- extension of highways,
- interconnect North-South regions with Southeast
- ferries to cover North-South regions
- port construction.
- urban transit in 12 host cities of World Cup 2014

Electrical Power
- 10th largest power operator in world.
- Electricity generation in the hands of the Federal / State
Governments.
- Federally owned power company.
- Eletrobras controls 40 percent of installed generation
capacity.
- State Governments control 35 percent; remaining 25
percent generating capacity privatized.
-

Electrical Power
- Forecast 19 percent growth in the GTD segment in 2011.
- Power Expansion Plan investments of US$99 billion,
additional 63,482 MW of power generation capacity.
- 2010 to 2014, Eletrobras invest US$25.4 billion.
- 2009 and 2019 - power transmission grow from 95,582
km to 132,379 km, a 38 percent increase.
- construction of the world’s largest high voltage direct
current Power Trasmission Line
- 2,383 km-long power line with 5,000 transmission
towers, 20,000 km of cables, 433,000 insulators

- Power distribution subsector - sales potential :
lightning arresters, ground and surge protection systems,
relays, insulated electric conductors, surge suppressors,
innovative technologies , including smart grid technologies.
- Longer term - Brazil will need to invest US$15 billion -
implement a smart grid network to increase Brazil’s
interconnected power grid’s .
- Electronic meters
- Seven R&D smart grid projects currently underway
with investment of US$15 million.

Oil and Gas- Brazil 16th in proven reserves
- 9th oil production
- Not a member of the Organization of Petroleum Exporting
Countries (OPEC).
- In 2010, Brazil produced 2.05 million barrels of oil per day
(bpd) and 62.8 million cubic meters of gas per day.
- Brazil’s 2010 proven oil reserves reached 12.9 billion
barrels
- Brazil’s 2010 gas reserves totaled to 377 billion m3.
- 92 % of Brazil’s oil production in 2010 originated from
offshore fields, mostly at extreme depths

Oil and Gas - Opportunities
- Longer-term equipment service procurement and
operational expenses exceed one trillion dollars through 2020.
2011 estimates
Oil and Gas
Equip. and
Services
US$ 55.3 bi - total
US$ 27.4 bi - imports
US$ 13.7 bi- imports from USA

Safety and Security- Security market average annual growth - 15-20%
- Annual sales around US$29 billion.
- Fifth-largest security market in the world.
- Foreign products - 50% of total market share – 40 % are
U.S. products
- Market worth - US$300 million.
- Major foreign competitors - Israel, Korea and Japan, each
responsible for 10-15% of the import market share.
in US$ millions 2009 2010 2011 est*
Market Size $20 $24 29
Imports (Global) $3 $3,6 5
Imports from
United States
$1,5 $ 1,8 2
The above statistics are unofficial estimates. (*) Source ABESE - 2010. Estimated Exchange
rates are values expressed in U.S. dollars - US$ 1. 00 = R$ 1. 77 (January 2011)

Environmental Technologies
US$ Billions 2009
(estimated)
2010
(estimated)
2011
(estimated)
Total Market Size 9 10 10
Total Imports 1.8 2 2
Imports from the U.S. 0.55 0.60 0.63
Source: All figures were estimated by market analysts
- Brazil’s environmental technologies market (including equipment,
engineering / consulting services, instrumentation, construction and
clean up services) - US$ 10 billion:
- US$ 5.5 billion - water and wastewater subsector
- US$ 3.5 billion - solid waste management
- US$ 1 billion – air pollution control
- Suppliers of water treatment stations incorporate specific
imported equipment
- Laboratory and analytical equipment are also imported.

Environmental Technologies - Opportunites- Effluent treatment and energy/water saving technologies,
- Specialized consulting services for high-tech solutions, such as
advanced water treatment (filtration), water loss prevention solutions,
“intelligent valves,” efficient water distribution and reuse projects,
water saving devices, and rain water systems, and Membranes used
in ultra, micro, nano filtration and reverse osmosis.
- Laboratory and analytical equipment.
- Solutions related to water distribution systems, including services
and equipment.
- Incinerator technologies for solid waste treatment.
- Air pollution control products, gas emission monitoring
technologies and gas analyzers.

Medical EquipmentIn US$ billions 2009 2010
(estimated)
2011
(estimated)
Total Market Size 4.50 5.00 5.50
Total Imports 2.71 3.11 3.57
Imports from the U.S. 0.788 0.966 1.79
Source: Secex, Abimed, ABIMO
- Brazil is the largest medical equipment market in South
America.
- Continue to expand 10% through 2011.
- U.S. sales mainly through local agents, distributors and
importers who sell to hospitals and clinics.
- The market for electro medicine equipment is US$200 million.
- Represents 50% of total sales in Latin America.
- In 2010, imports for In Vitro Diagnostics reagents and devices
increased 55% as demand recovery from 2008 economic downturn.
- Market for home health increasing.

RIO DE JANEIRO
HOSTS
World Military Games 2012
World Cup 2014
Olympic Games 2016

- Rio Olympic Games in Aug./Sept. 2016.
- July 2011 World Military Games.
- 2014 Soccer World Cup.
- Investments in Brazil / Rio from 2011 to 2016 (US$ 50
billion):
- Sustainable and Green Building Technologies
- Sports facilities (Rio)
- Transportation
- Public security
- Education
- Catering
- Leasing
- Insurance
- Stadiums and Airports (Brazil wide)
-Hotel/Hospitals (Brazil wide)
Architecture/Engineering/Construction

Architecture/Engineering/Construction
- Procurement directly related to Olympic Games not yet begun.
- Brazilian Olympic Public Authority not yet assembled .
- Procurement for Olympic Games by the Rio City, State
Governments and Brazilian International Olympic Committee.
- All governmental purchases, at Federal, State and
Municipal levels through public tenders.
- Law requires any and all official bidders have a legal
presence in Brazil.
- Need a qualified local rep/distributor or Brazilian JV
partner to participate in public tenders for the Games.

Investments in Sport Facilities
• Half of Rio 2016 venues are ready
• 20 new facilities are to be built:
– Aquatic sports stadium with 18,000 seats (US$40 million)
– Olympic Park: gymnastics, cycling, etc. (US$200 mil.)
– Olympic Village of 32 buildings 12 floors each with 17,000 beds (US$450 million).
– Tennis Center with 16 courts (US$45 million).
– Renovated rowing stadium $2 million.
– Beach volley arena (US$7 million).
– Renovation of Maracanã Stadium (Opening and closing Olympic ceremonies as well as soccer games) US$400 million (completion for 2014 Soccer World Cup).

Investments in City Infrastructure
Upgrades at seaports and airports ($5 Billion)
• Modernization and enlargement of two International Airport terminals (increase capacity from 15 million to 25 million passengers)
• Highway widening
• Port area revitalization of 300,000 sq. ft. featuring bars, restaurants, amphitheater, multi-use space and parking
• Port dredging
• Construction of two new subway lines
• Creation of a Bus Rapid Transit (BRT) system
• Housing projects (including low income housing)
• Water sanitation.