Embed Size (px)
DESCRIPTION
Brazil: Economic Ooutlook, Opportunities and Challenges. Andrea Goldstein. Brazil has resumed growth after a long hibernation, and is bound to grow above the global average over the coming years. GDP per capita (constant prices 2009). GDP per capita has been increasing since 2004 - PowerPoint PPT Presentation
Citation preview
1
Brazil: Economic Ooutlook,
Opportunities and Challenges
Andrea Goldstein
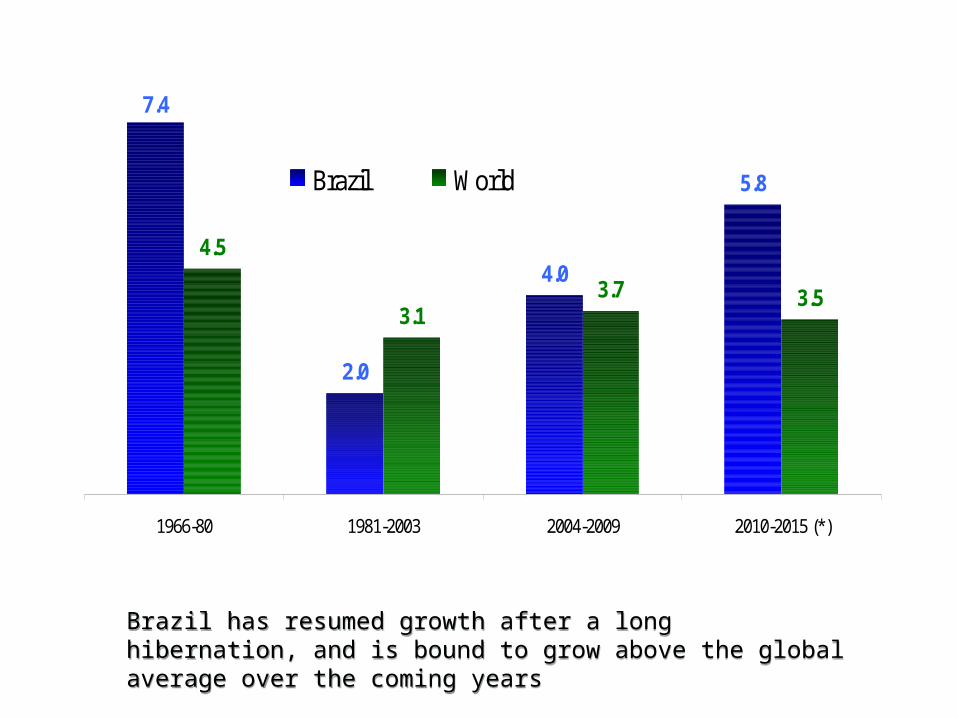
7.4
2.0
4.0
5.8
4.5
3.13.7 3.5
1966-80 1981-2003 2004-2009 2010-2015 (*)
Brazil World
Brazil has resumed growth after a long hibernation, and is bound to grow above the global average over the coming yearsBrazil has resumed growth after a long hibernation, and is bound to grow above the global average over the coming years
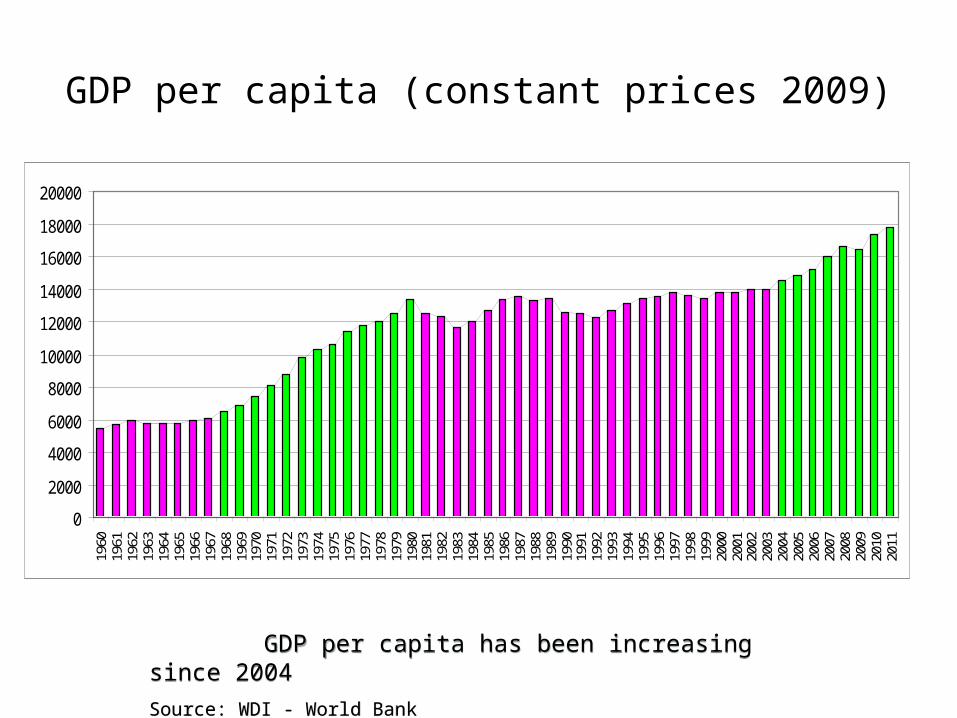
GDP per capita (constant prices 2009)
0
2000
4000
6000
8000
10000
12000
14000
16000
18000
20000
1960
1961
1962
1963
1964
1965
1966
1967
1968
1969
1970
1971
1972
1973
1974
1975
1976
1977
1978
1979
1980
1981
1982
1983
1984
1985
1986
1987
1988
1989
1990
1991
1992
1993
1994
1995
1996
1997
1998
1999
2000
2001
2002
2003
2004
2005
2006
2007
2008
2009
2010
2011
GDP per capita has been increasing since 2004
Source: WDI - World Bank
GDP per capita has been increasing since 2004
Source: WDI - World Bank
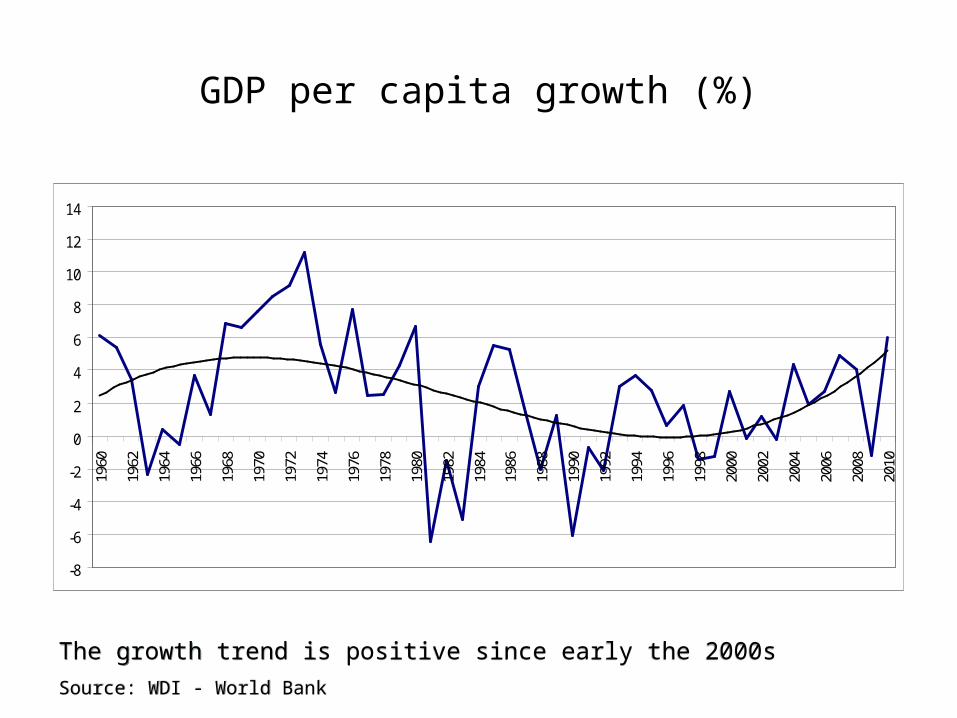
GDP per capita growth (%)
-8
-6
-4
-2
0
2
4
6
8
10
12
14
1960
1962
1964
1966
1968
1970
1972
1974
1976
1978
1980
1982
1984
1986
1988
1990
1992
1994
1996
1998
2000
2002
2004
2006
2008
2010
The growth trend is positive since early the 2000s
Source: WDI - World Bank
The growth trend is positive since early the 2000s
Source: WDI - World Bank
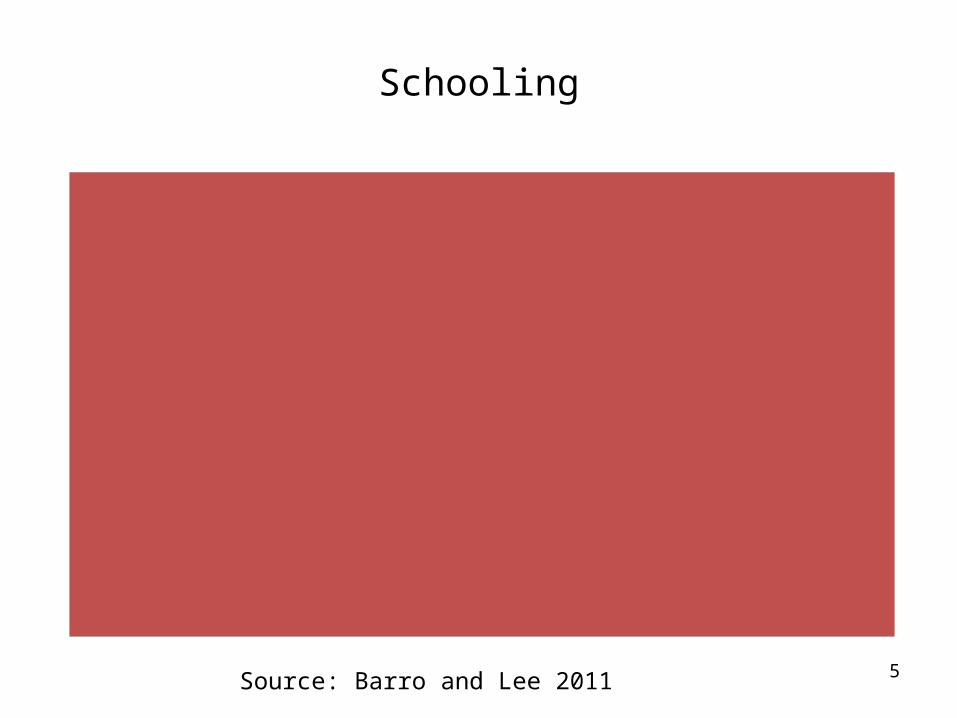
5
Schooling5,
1 6,2
6,2 6,5 7,
5
7,5 8,
2
8,4 9,
1
9,3 9,
8 10,1 11
,2
11,3
21,4
19,2
10,7
18,2
17,2
23,0
15,5
14,9
19,7
6,9
12,6
11,0
5,6
13,0
0
5
10
15
20
25
Schooling 15+ in 2010 Growth rate 2000-2010
Source: Barro and Lee 2011
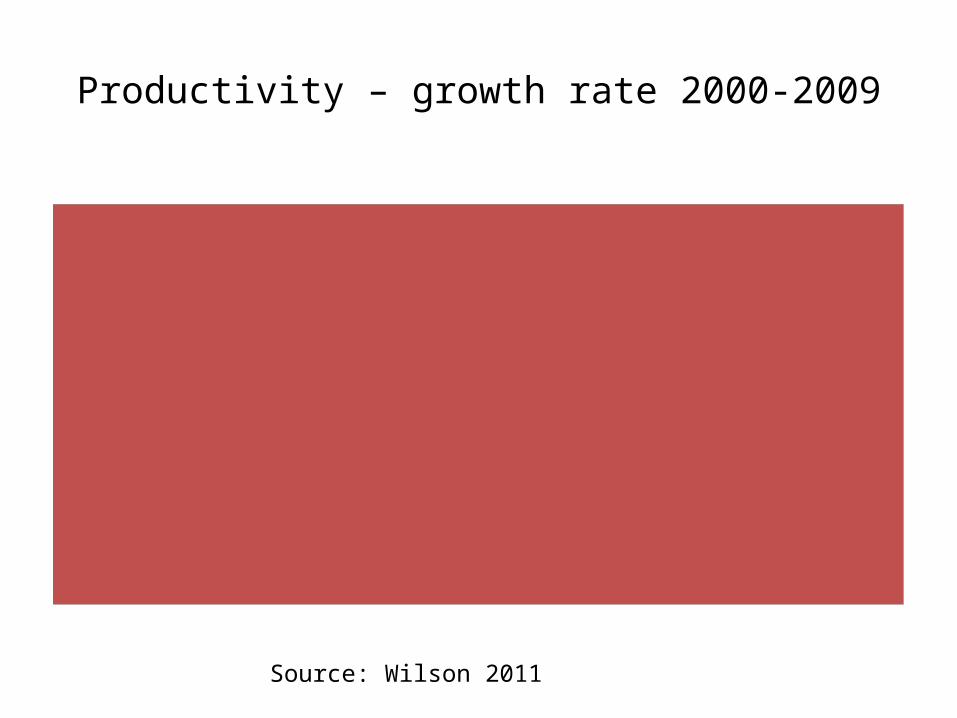
Productivity – growth rate 2000-2009
0,7
9,1
5,2
4,1
0,4
5,2
2,8
4,8
0
1
2
3
4
5
6
7
8
9
10
Brazil China India Russia
Labor productivity Total factor productivity
Source: Wilson 2011
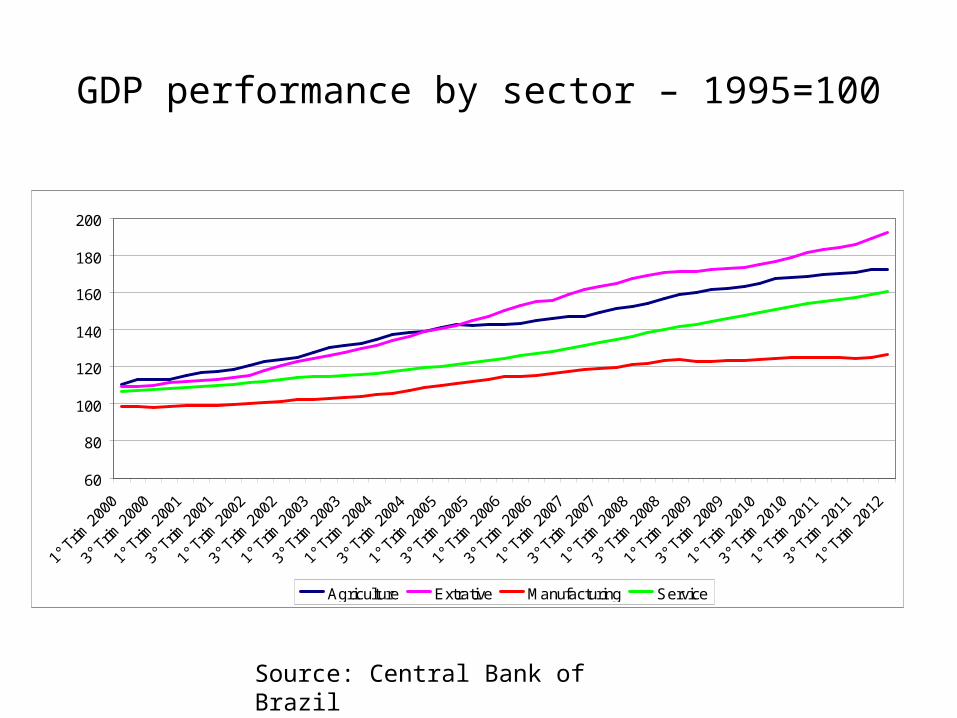
GDP performance by sector – 1995=100
60
80
100
120
140
160
180
200
1° T
rim.2
000
3° T
rim.2
000
1° T
rim.2
001
3° T
rim.2
001
1° T
rim.2
002
3° T
rim.2
002
1° T
rim.2
003
3° T
rim.2
003
1° T
rim.2
004
3° T
rim.2
004
1° T
rim.2
005
3° T
rim.2
005
1° T
rim.2
006
3° T
rim.2
006
1° T
rim.2
007
3° T
rim.2
007
1° T
rim.2
008
3° T
rim.2
008
1° T
rim.2
009
3° T
rim.2
009
1° T
rim.2
010
3° T
rim.2
010
1° T
rim.2
011
3° T
rim.2
011
1° T
rim.2
012
Agriculture Extrative Manufacturing Service
Source: Central Bank of Brazil
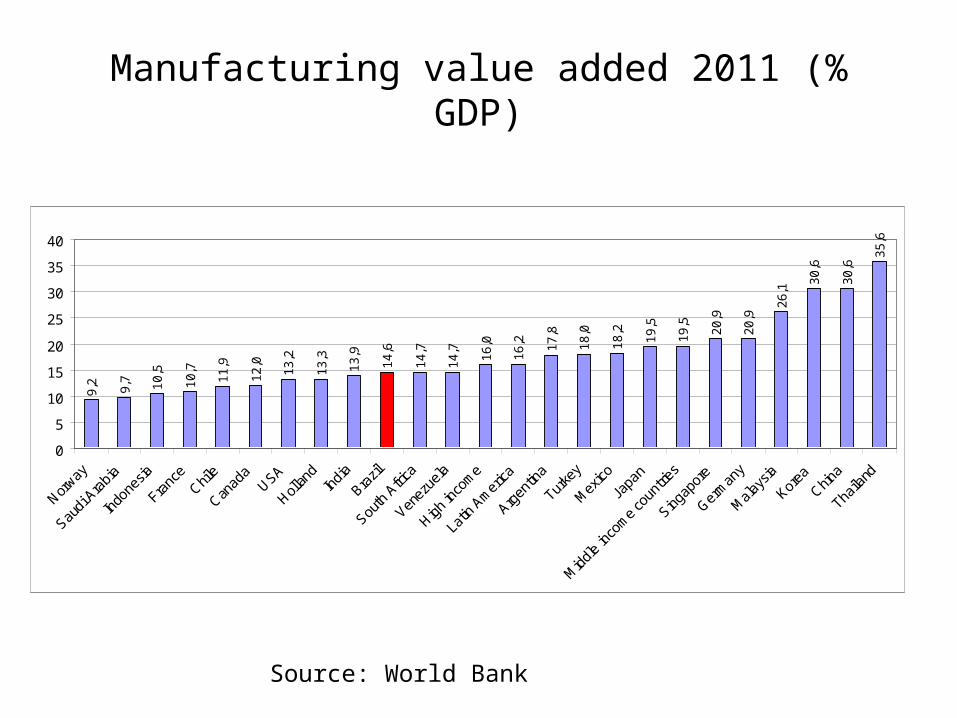
Manufacturing value added 2011 (% GDP)
Source: World Bank
9,2 9,7 10
,5
10
,7
11
,9
12
,0
13
,2
13
,3
13
,9
14
,6
14
,7
14
,7
16
,0
16
,2 17
,8
18
,0
18
,2
19
,5
19
,5
20
,9
20
,9
26
,1
30
,6
30
,6
35
,6
0
5
10
15
20
25
30
35
40
Norway
Saudi
Ara
bia
Indo
nesia
Franc
eChil
e
Canad
aUSA
Hollan
dIn
dia
Brazil
South
Afri
ca
Venez
uela
High in
com
e
Latin
Am
erica
Argen
tina
Turke
y
Mex
ico
Japa
n
Mid
dle in
com
e co
untri
es
Singap
ore
Germ
any
Mal
aysia
Korea
China
Thaila
nd
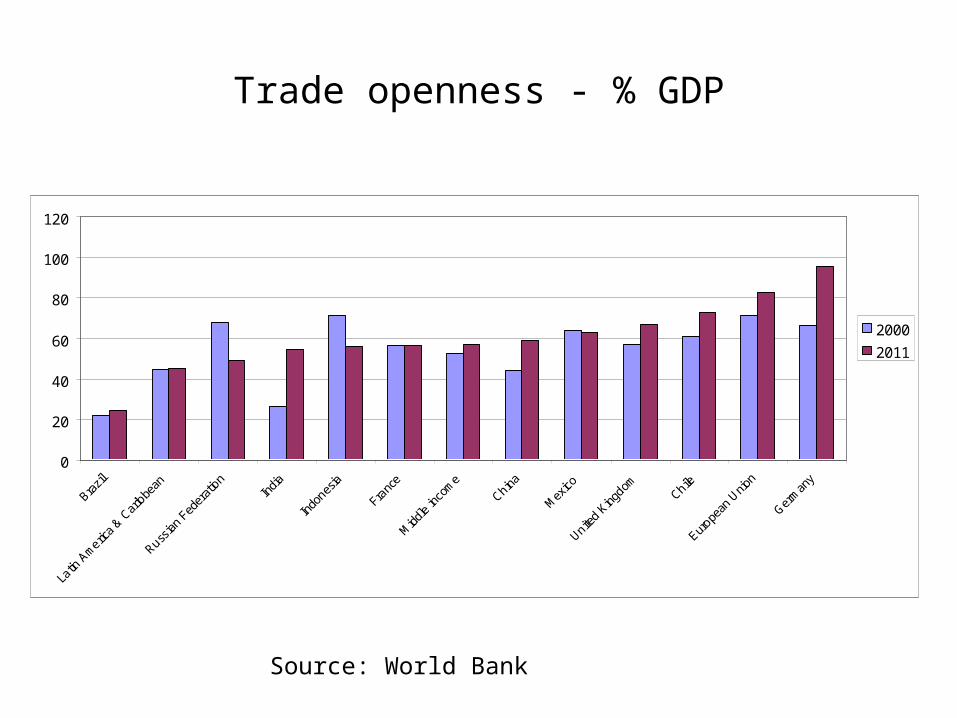
Trade openness - % GDP
0
20
40
60
80
100
120
Brazil
Latin
Americ
a & C
arib
bean
Russian
Fed
erat
ionIn
dia
Indo
nesia
Franc
e
Midd
le inc
ome
China
Mex
ico
United K
ingdom
Chile
Europe
an U
nion
Germ
any
2000
2011
Source: World Bank
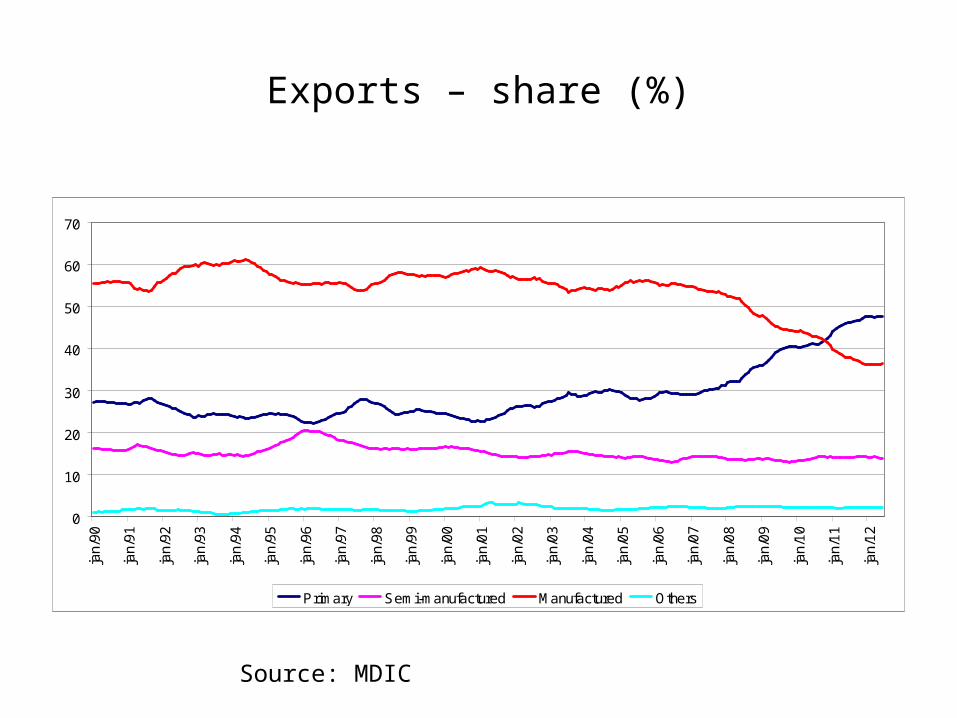
Exports – share (%)
0
10
20
30
40
50
60
70
jan
/90
jan
/91
jan
/92
jan
/93
jan
/94
jan
/95
jan
/96
jan
/97
jan
/98
jan
/99
jan
/00
jan
/01
jan
/02
jan
/03
jan
/04
jan
/05
jan
/06
jan
/07
jan
/08
jan
/09
jan
/10
jan
/11
jan
/12
Primary Semi-manufactured Manufactured Others
Source: MDIC
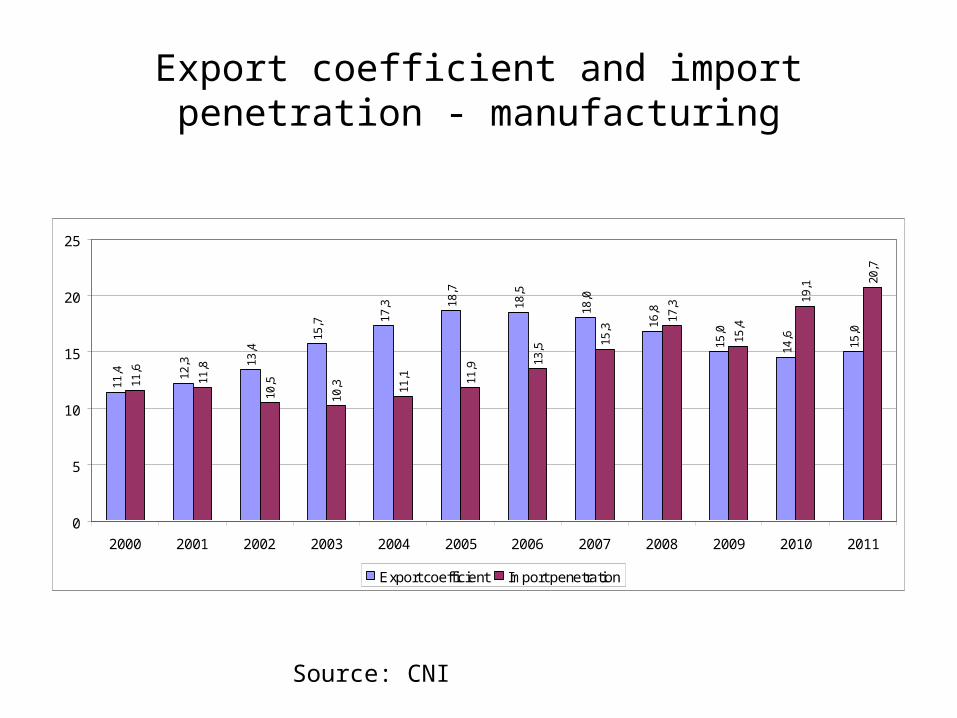
Export coefficient and import penetration - manufacturing
11,4 12
,3 13,4
15,7 17
,3 18,7
18,5
18,0
16,8
15,0
14,6
15,0
11,6
11,8
10,5
10,3 11
,1 11,9 13
,5
15,3
17,3
15,4
19,1 20
,7
0
5
10
15
20
25
2000 2001 2002 2003 2004 2005 2006 2007 2008 2009 2010 2011
Export coefficient Import penetration
Source: CNI
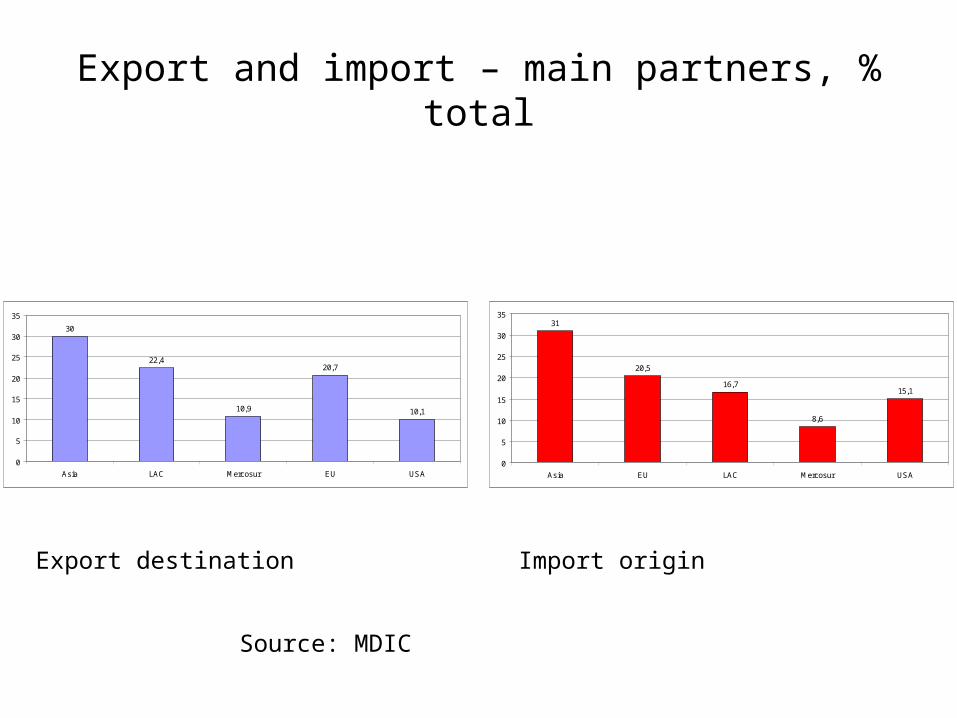
Export and import – main partners, % total
30
22,4
10,9
20,7
10,1
0
5
10
15
20
25
30
35
Asia LAC Mercosur EU USA
31
20,5
16,7
8,6
15,1
0
5
10
15
20
25
30
35
Asia EU LAC Mercosur USA
Source: MDIC
Export destination Import origin
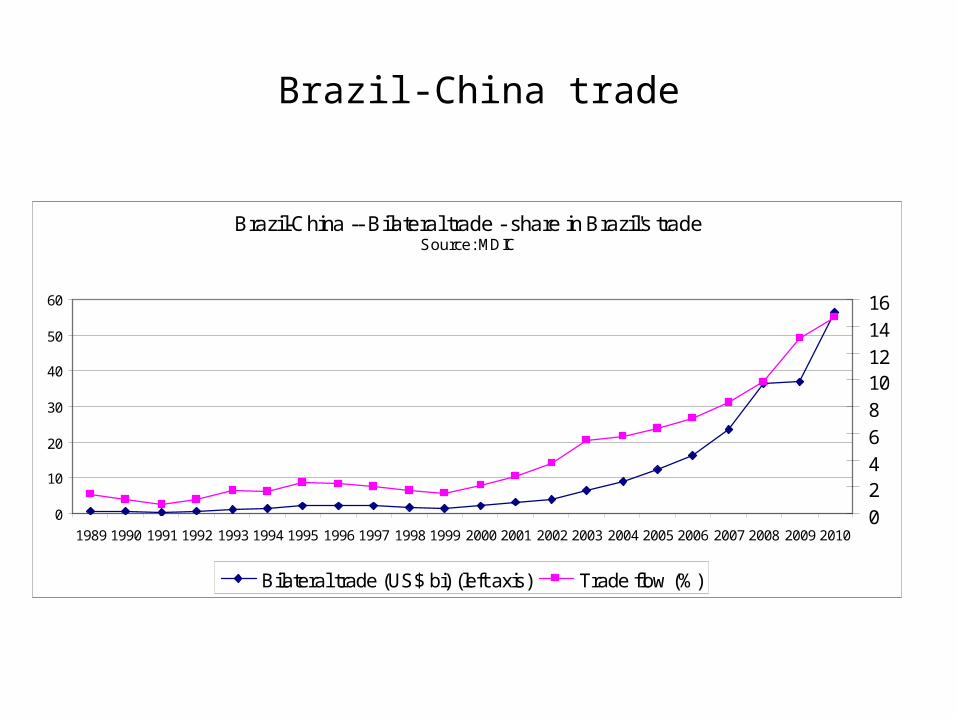
Brazil-China trade
Brazil-China -- Bilateral trade - share in Brazil's tradeSource: MDIC
0
10
20
30
40
50
60
1989 1990 1991 1992 1993 1994 1995 1996 1997 1998 1999 2000 2001 2002 2003 2004 2005 2006 2007 2008 2009 20100
24
6
8
1012
14
16
Bilateral trade (US$ bi) (left axis) Trade flow (%)
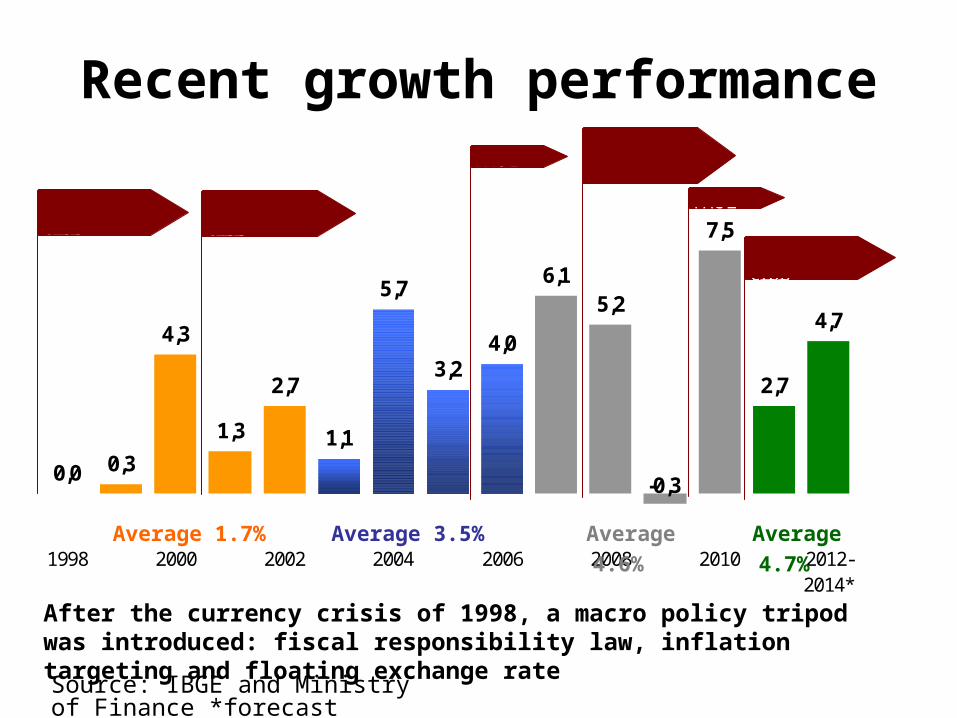
Recent growth performance
Source: IBGE and Ministry of Finance *forecast
0,3
4,3
1,3
2,7
1,1
5,7
3,2
6,15,2
7,5
2,7
0,0
4,04,7
-0,3
1998 2000 2002 2004 2006 2008 2010 2012-2014*
PAC 1
PAC 2
International Crisis
International Crisis
International Crisis
International Crisis
Average 1.7% Average 3.5% Average 4.6% Average 4.7%
After the currency crisis of 1998, a macro policy tripod was introduced: fiscal responsibility law, inflation targeting and floating exchange rate
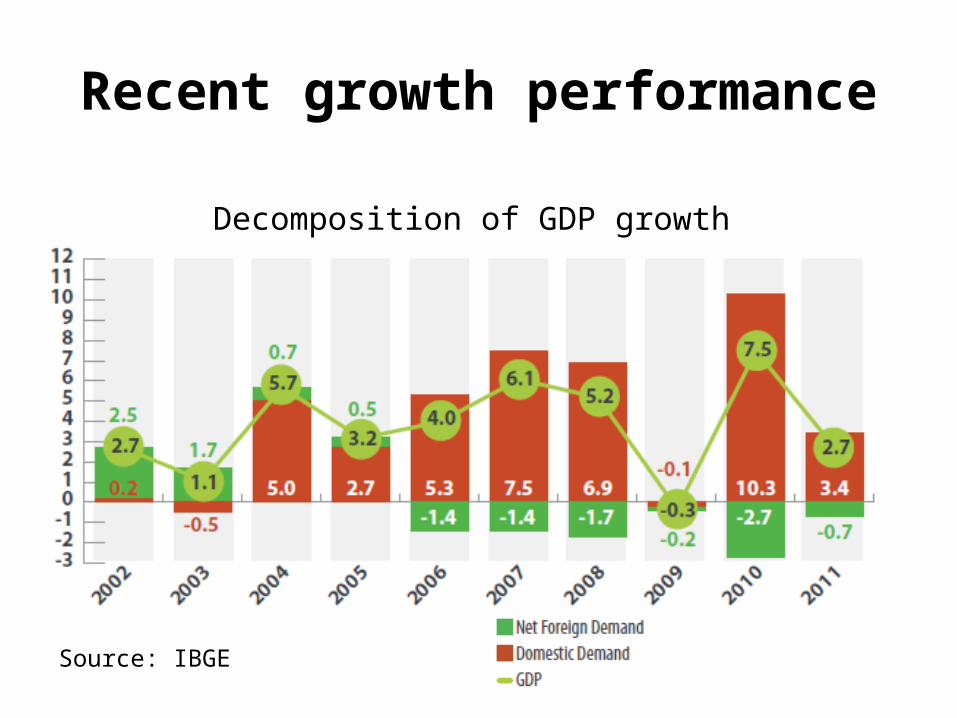
Recent growth performance
Source: IBGE
Decomposition of GDP growth
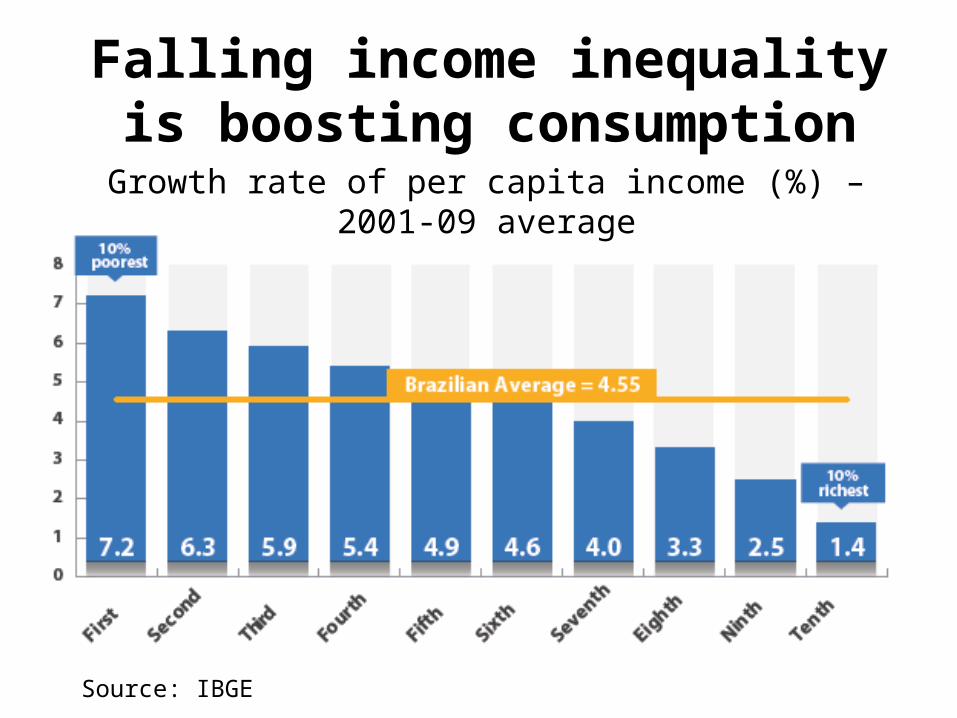
Falling income inequality is boosting consumption
Growth rate of per capita income (%) – 2001-09 average
Source: IBGE
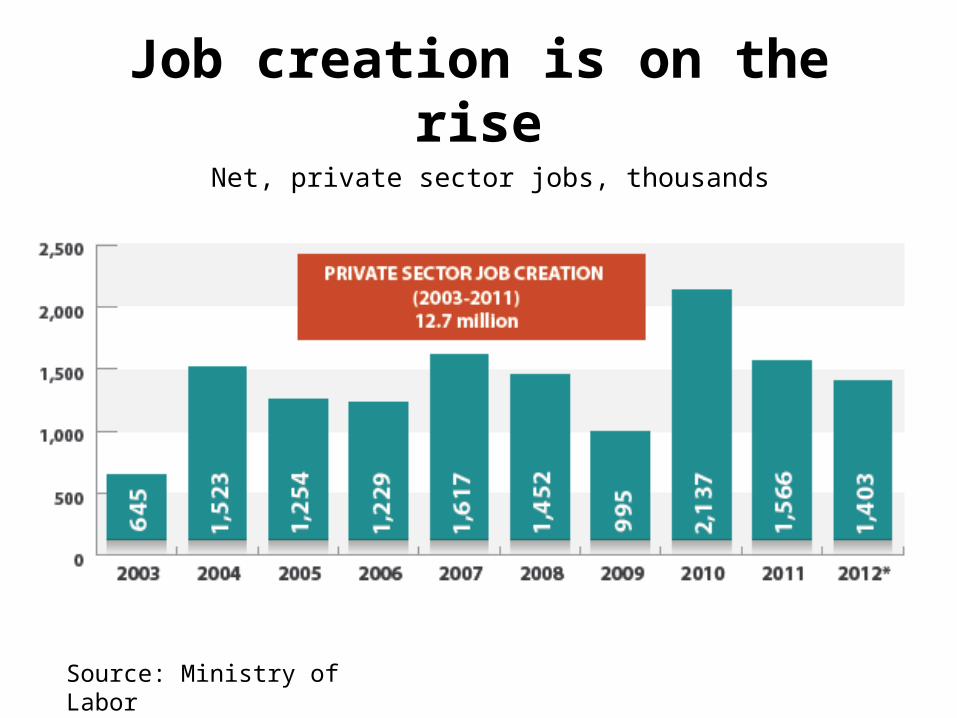
Job creation is on the rise
Source: Ministry of Labor
Net, private sector jobs, thousands
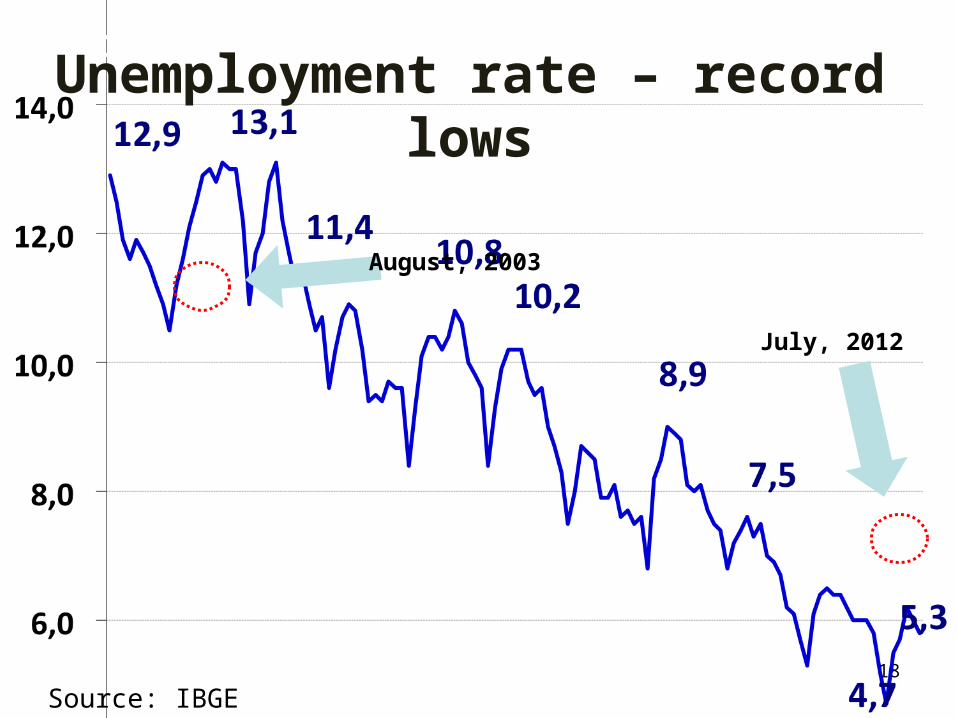
18
Falling unemploymentUnemployment rate – record lows
August, 2003
July, 2012
Source: IBGE
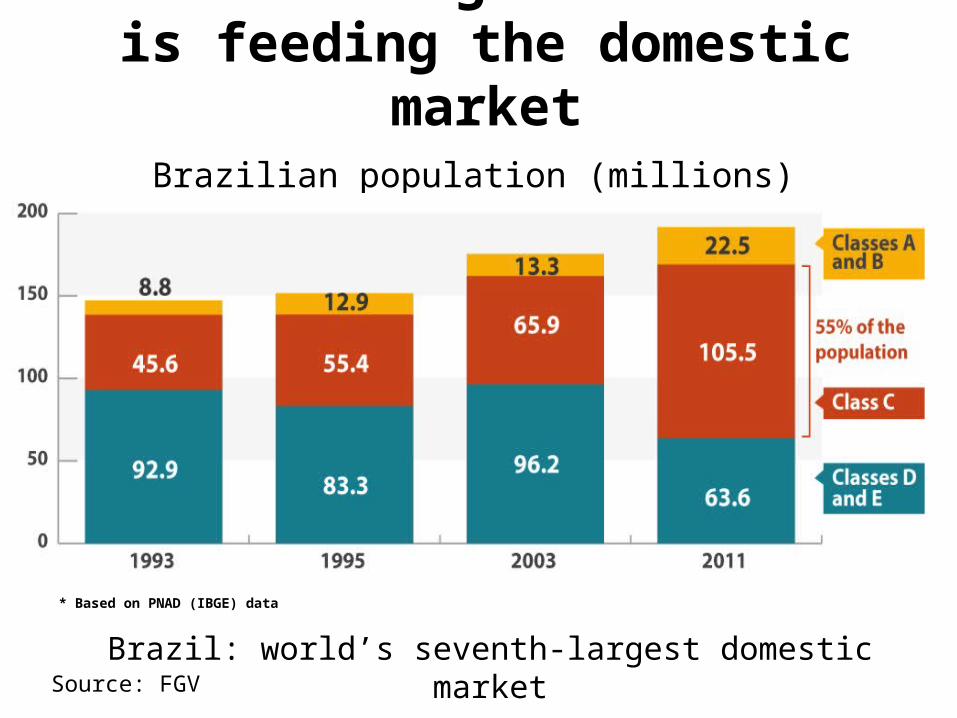
Brazilian population (millions)
Source: FGV
* Based on PNAD (IBGE) data
An increasing middle class is feeding the domestic market
Brazil: world’s seventh-largest domestic market
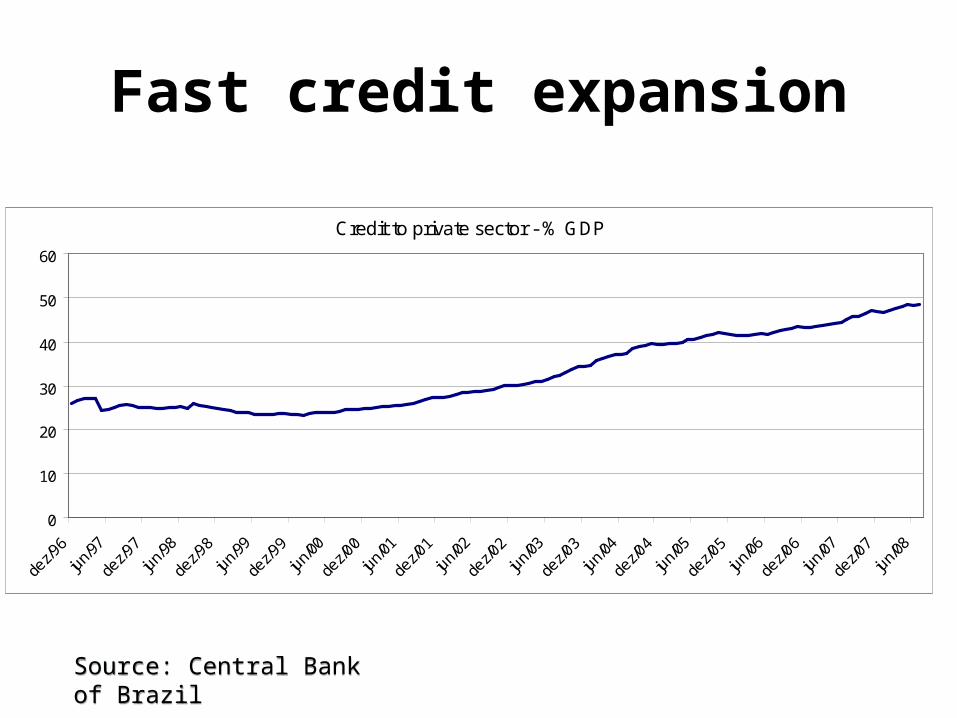
Fast credit expansion
Credit to private sector - % GDP
0
10
20
30
40
50
60
dez/9
6
jun/
97
dez/9
7
jun/
98
dez/9
8
jun/
99
dez/9
9
jun/
00
dez/0
0
jun/
01
dez/0
1
jun/
02
dez/0
2
jun/
03
dez/0
3
jun/
04
dez/0
4
jun/
05
dez/0
5
jun/
06
dez/0
6
jun/
07
dez/0
7
jun/
08
Source: Central Bank of BrazilSource: Central Bank of Brazil
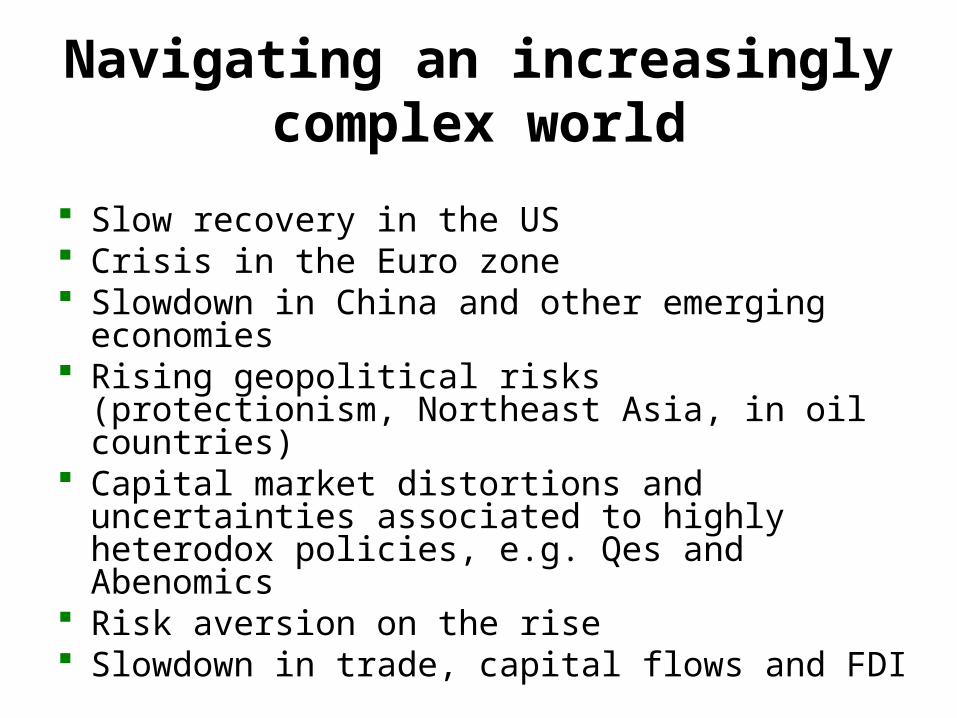
Navigating an increasingly complex world
Slow recovery in the US Crisis in the Euro zone Slowdown in China and other emerging
economies Rising geopolitical risks (protectionism, Northeast
Asia, in oil countries) Capital market distortions and uncertainties
associated to highly heterodox policies, e.g. Qes and Abenomics
Risk aversion on the rise Slowdown in trade, capital flows and FDI
Output growth forecast – 2013
Source: WEO Oct 2012, IMF
Output growth 2013 - WEO IMF (Oct 2012)
8,2
6,0
4,0 3,8 3,53,0 2,8
2,1 2,01,5 1,2 1,1 0,9
0,4 0,20123456789
China
Indi
a
Brazil
Russia
Mex
ico
South
Afri
ca
Wor
ld o
utpu
t
United
Sta
tes
Canad
a
Advan
ced
econ
omie
s
Japa
n
United
Kin
gdom
Germ
any
Franc
e
Euro
Area
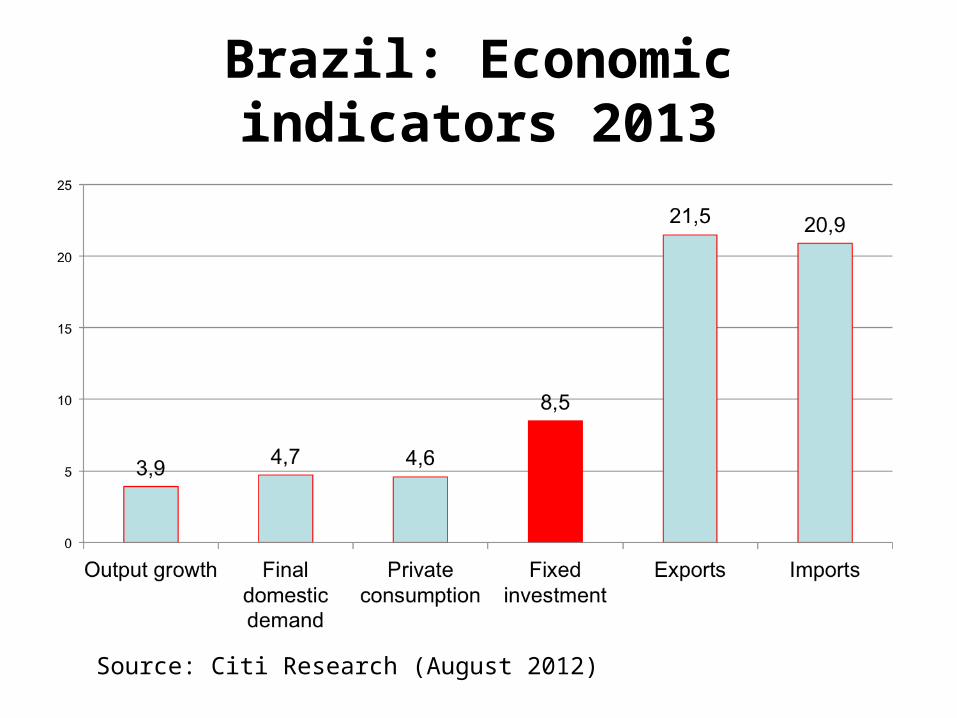
Brazil: Economic indicators 2013
Source: Citi Research (August 2012)
24
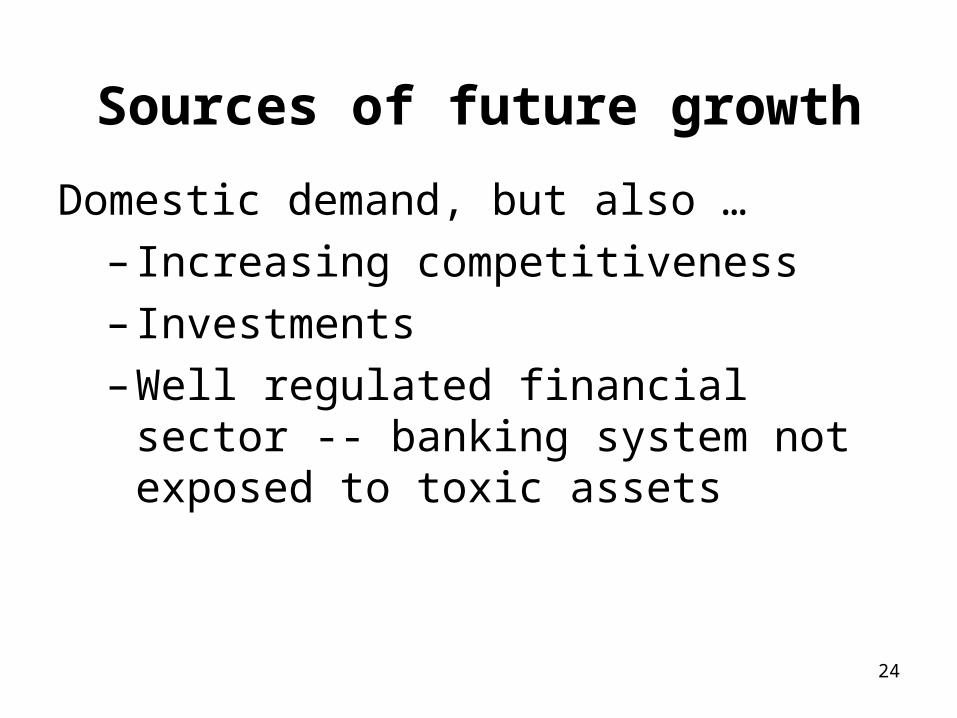
Sources of future growth
Domestic demand, but also …
– Increasing competitiveness
– Investments
– Well regulated financial sector -- banking system not exposed to toxic assets
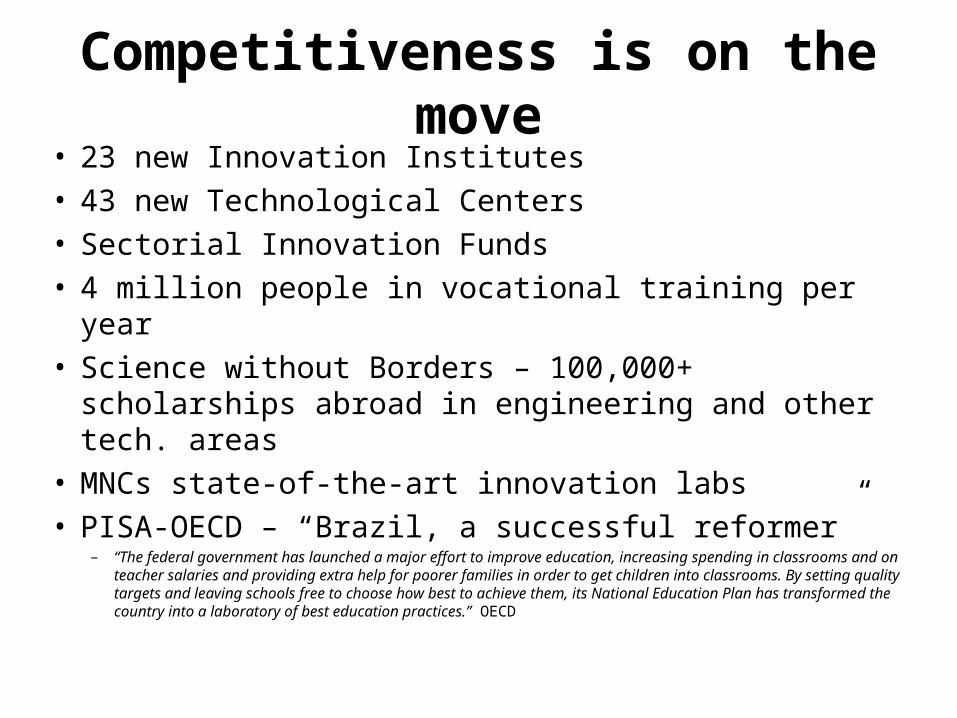
Competitiveness is on the move• 23 new Innovation Institutes• 43 new Technological Centers• Sectorial Innovation Funds• 4 million people in vocational training per year• Science without Borders – 100,000+ scholarships
abroad in engineering and other tech. areas• MNCs state-of-the-art innovation labs• PISA-OECD – “Brazil, a successful reformer”
– “The federal government has launched a major effort to improve education, increasing spending in classrooms and on teacher salaries and providing extra help for poorer families in order to get children into classrooms. By setting quality targets and leaving schools free to choose how best to achieve them, its National Education Plan has transformed the country into a laboratory of best education practices.” OECD
Other policies that will enhance competitiveness
• Electricity tax cut and new regulatory framework• Payroll tax cuts• Temporary and targeted business tax cuts• Huge investments in public services• Concessions and PPPs – ports, railways, roads,
airports• Active exchange rate policy• SELIC down by 500 b.p.
26
New sources of savings and long-term funding
• New long-term funding instruments, secondary market, buy out markets
• New public pension fund (FUNPRESP) and rapid expansion of private pension funds
• FDI has been picking up – US$ 66 billion in 2011– 10% of total going to developing countries
27
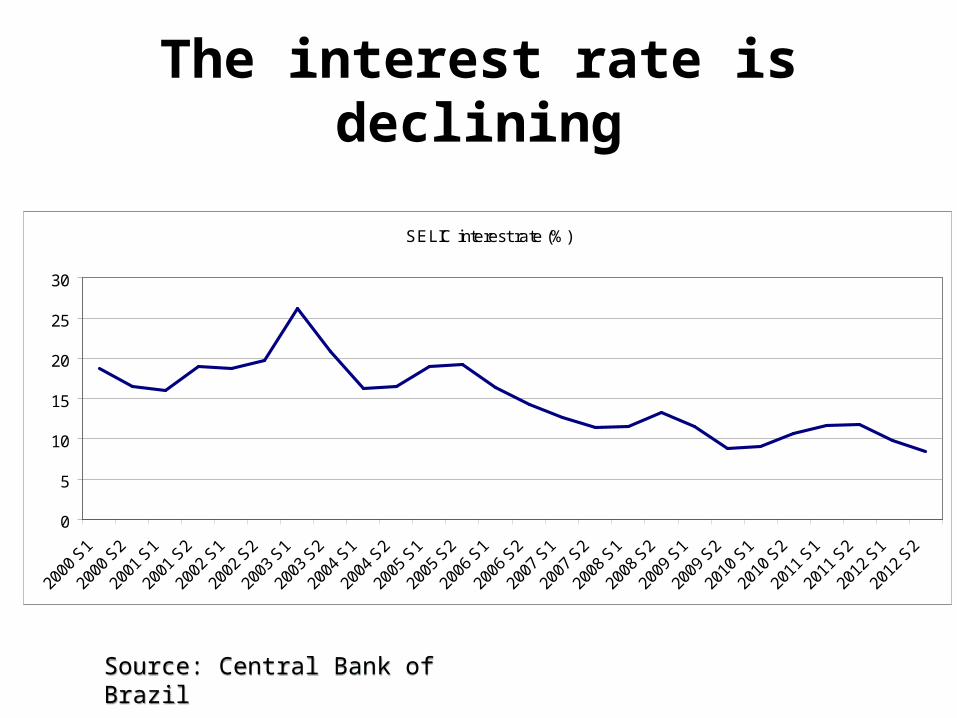
The interest rate is declining
SELIC interest rate (%)
0
5
10
15
20
25
30
2000
S1
2000
S2
2001
S1
2001
S2
2002
S1
2002
S2
2003
S1
2003
S2
2004
S1
2004
S2
2005
S1
2005
S2
2006
S1
2006
S2
2007
S1
2007
S2
2008
S1
2008
S2
2009
S1
2009
S2
2010
S1
2010
S2
2011
S1
2011
S2
2012
S1
2012
S2
Source: Central Bank of BrazilSource: Central Bank of Brazil
29
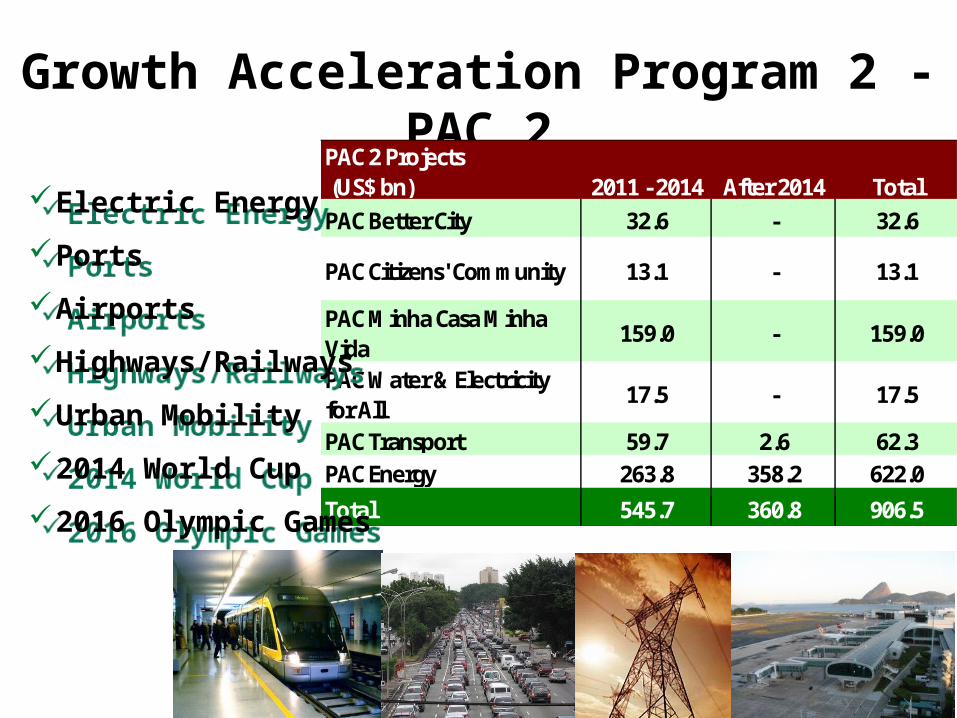
Growth Acceleration Program 2 - PAC 2
PAC 2 Projects (US$ bn) 2011 - 2014 After 2014 TotalPAC Better City 32.6 - 32.6
PAC Citizens' Community 13.1 - 13.1
PAC Minha Casa Minha Vida
159.0 - 159.0
PAC Water & Electricity for All
17.5 - 17.5
PAC Transport 59.7 2.6 62.3PAC Energy 263.8 358.2 622.0
Total 545.7 360.8 906.5
Electric Energy
Ports
Airports
Highways/Railways
Urban Mobility
2014 World Cup
2016 Olympic Games
Electric Energy
Ports
Airports
Highways/Railways
Urban Mobility
2014 World Cup
2016 Olympic Games
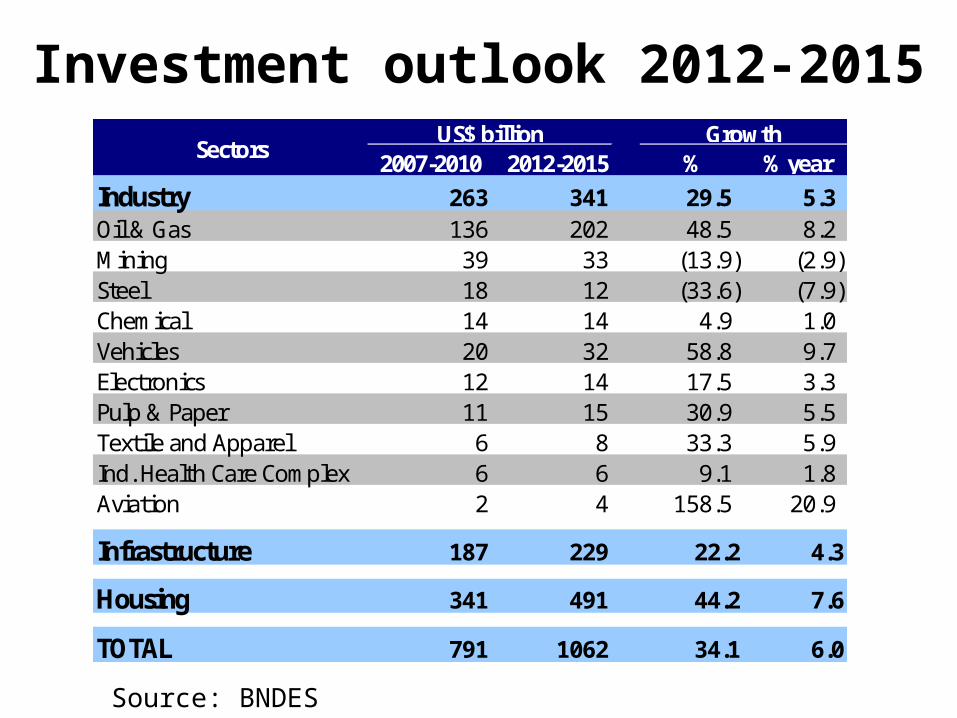
2007-2010 2012-2015 % % yearIndustry 263 341 29.5 5.3Oil & Gas 136 202 48.5 8.2Mining 39 33 (13.9) (2.9)Steel 18 12 (33.6) (7.9)Chemical 14 14 4.9 1.0Vehicles 20 32 58.8 9.7Electronics 12 14 17.5 3.3Pulp & Paper 11 15 30.9 5.5Textile and Apparel 6 8 33.3 5.9Ind. Health Care Complex 6 6 9.1 1.8Aviation 2 4 158.5 20.9
Infrastructure 187 229 22.2 4.3
Housing 341 491 44.2 7.6
TOTAL 791 1062 34.1 6.0
SectorsUS$ billion Growth
Investment perspectives are firmInvestment outlook 2012-2015
Source: BNDES
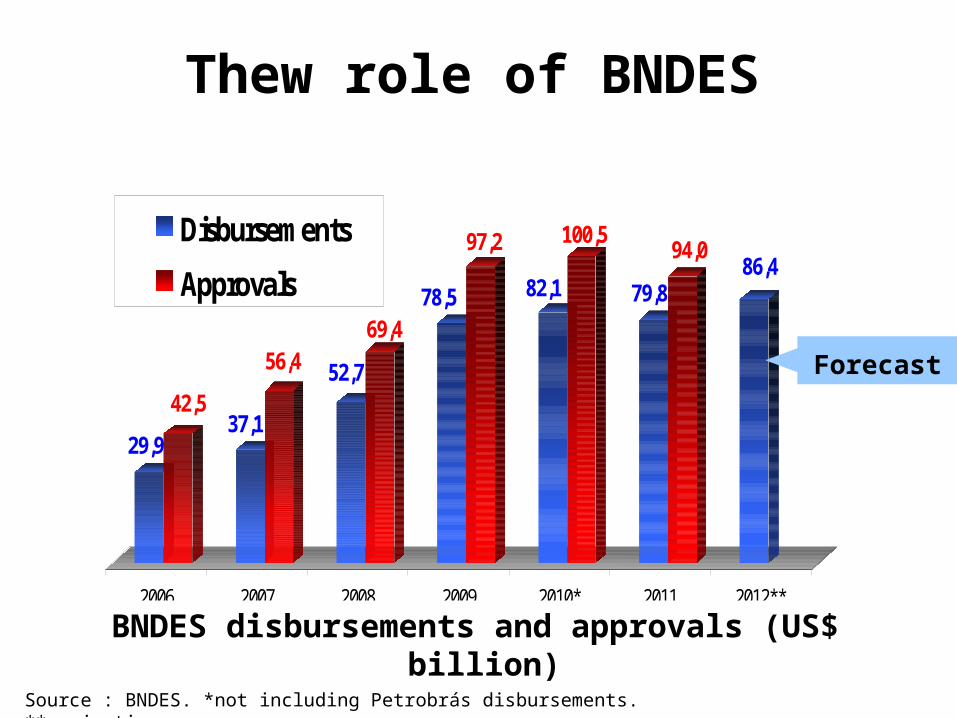
29,9
42,537,1
56,4 52,7
69,478,5
97,2
82,1
100,5
79,8
94,086,4
2006 2007 2008 2009 2010* 2011 2012**
Disbursements
Approvals
BNDES disbursements and approvals (US$ billion)
Source : BNDES. *not including Petrobrás disbursements. **projection
Forecast
Thew role of BNDES
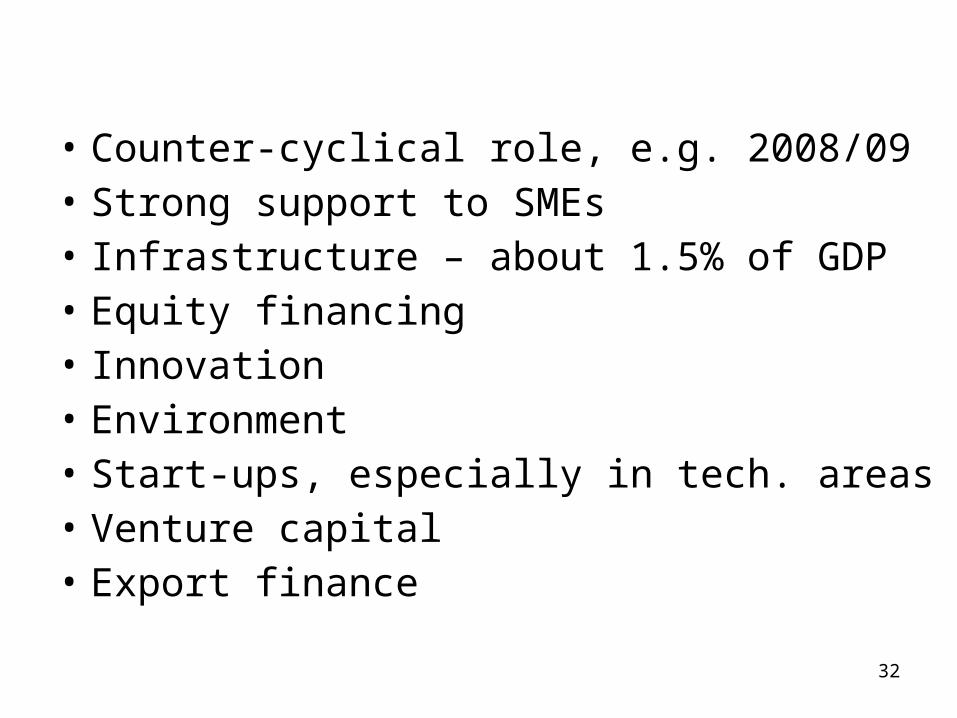
• Counter-cyclical role, e.g. 2008/09• Strong support to SMEs• Infrastructure – about 1.5% of GDP• Equity financing• Innovation• Environment• Start-ups, especially in tech. areas• Venture capital• Export finance
32
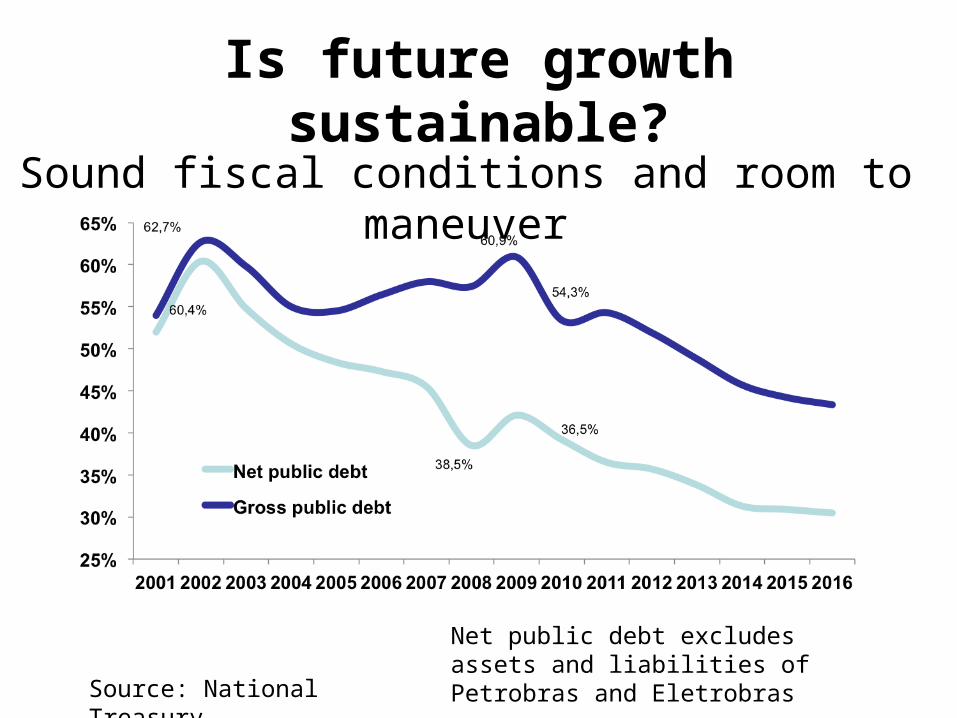
Is future growth sustainable?
Source: National Treasury
Sound fiscal conditions and room to maneuver
Net public debt excludes assets and liabilities of Petrobras and Eletrobras
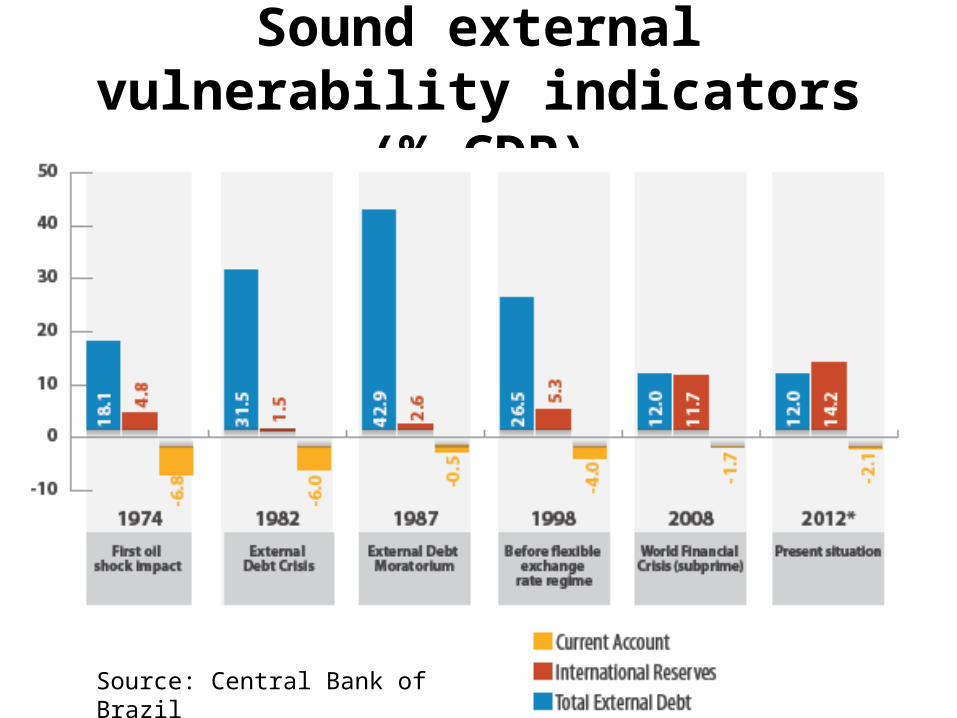
Sound external vulnerability indicators (% GDP)
Source: Central Bank of Brazil
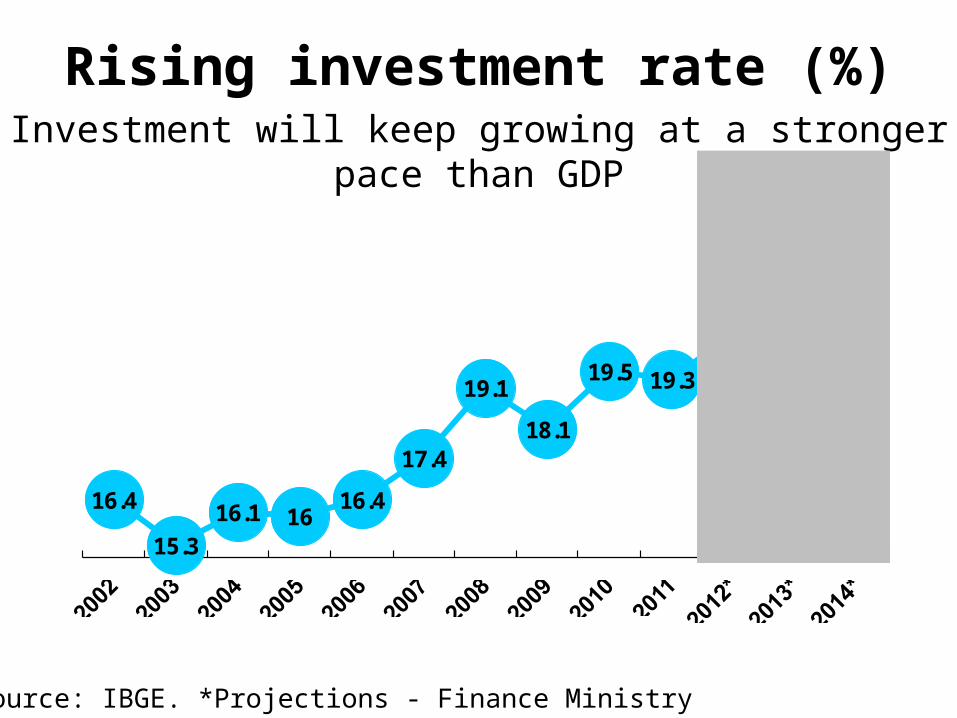
Rising investment rate (%)Investment will keep growing at a stronger pace than GDP
Source: IBGE. *Projections - Finance Ministry
16.4
15.3
16.1 1616.4
17.4
19.1
18.1
19.5 19.3
20.4
22.0
24.0
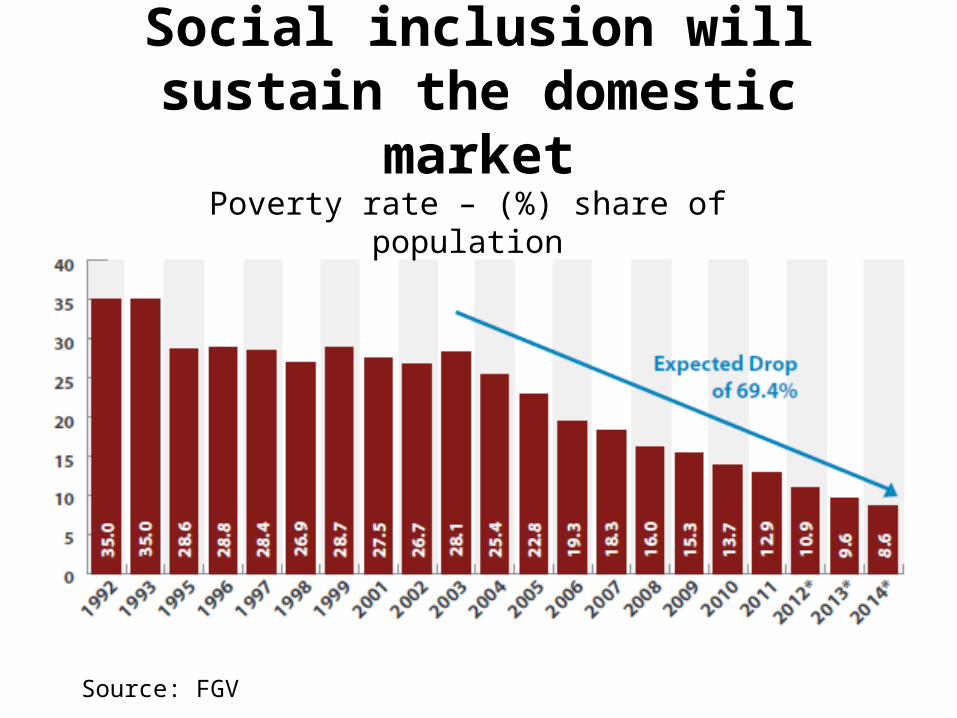
Social inclusion will sustain the domestic market
Source: FGV
Poverty rate – (%) share of population
37
Risks
• China/Asia slowdown
• Stagnation in the US and Europe
• Protectionism, uncertainties and market distortions created by unconventional policies
• Tightening of international credit
38
The way forward – challenges and reform agenda
• Accelerate labor productivity
• Increase savings and investments
• Improve competitiveness in manufacturing
• Tackle infrastructure bottlenecks
• Accelerate the transition towards a
knowledge-based economy
Structural reforms
• Diversify sources of long-term funding
• Foster innovation
• Fiscal reform – ICMS (VAT)
• Pension reform
• Labor legislation reform
• Diversify exports and reduce dependency
on commodities39
Conclusions
• Domestic market will enlarge further
• Investments and increasing
competitiveness will also drive growth
• Expanding investment opportunities in
several areas
40
• A bumpy road ahead: poor international environment and uncertainties
• But plenty of room for policy activism at the Government disposal
• Government is aware of the need to address a reform agenda to foster competitiveness and to foment sustained growth
41

Obrigado!!
42