Embed Size (px)
Citation preview

Pak. J. Bot., 50(2): 775-784, 2018.
BRASSICA OLERACEAL. VAR. ITALICA PLENCKAND CASSIA ABSUS L.EXTRACTS
REDUCE OXIDATIVE STRESS, ALLOXAN INDUCED HYPERGLYCEMIA
AND INDICES OF DIABETIC COMPLICATIONS
SIDRA KHALID1, SHAHZAD HUSSAIN2, HUSSAIN ALI 2, MUHAMMAD KHALID TIPU1, HUMAIRA
FATIMA1, MADIHA AHMED1 AND TOFEEQ UR-REHMAN 1*
1Department of Pharmacy, Faculty of Biological Sciences, Quaid-i-Azam University, Islamabad 45320, Pakistan 2Drugs Control and Traditional Medicine Division, National Institute of Health, Islamabad, 45500, Pakistan
*Corresponding author’s email: [email protected]; Tel: +92-51-90644136
Abstract
The nature’s endowment of medicinal plants in successful management of diabetes necessitates their further
exploration. Therefore, the present study was designed to comprehend ameliorating role of Brassica oleracea var. italic
(BO) and Cassia absus (CA) in oxidative stress, hyperglycemia and indices of diabetic complications. Among all the
extracts of BO and CA, aqueous extract was the most proficient in terms of extract recovery (9.0 and 10.2%) and DPPH
radical scavenging efficiency (IC50 = 11.90 ± 1.70 and 8.26 ± 1.20 μg/ml) respectively. Maximum phenolic content [BO =
184.0 ± 0.17 and CA = 406.7 ± 0.08 μg gallic acid equivalent/mg extract (E)], flavonoid content (BO = 160.9 ± 0.1 and CA
= 361.9 ± 0.09 μg quercetin equivalent/mg E) and total antioxidant capacity (BO = 223.7 ± 0.20 and CA = 257.2 ± 3.30 μg
ascorbic acid equivalent/mg E) was recorded in their ethanol extract. Highest reducing power potential was quantified in BO
ethanol and CA aqueous extractsas 427.9 ± 0.10 and 480.0 ± 2.10μg ascorbic acid equivalent/mg E respectively. Brine
shrimp assay expounded petroleum ether extract of BO and CA to have some cytotoxicity (LC50 = 200± 2.3 and 86.6 ± 3.1
µg/ml respectively). In vivo studies established their aqueous extract as proficient in reducing the serum glucose (BO =
142.3 ± 7.10 and CA = 161.5 ± 4.40 mg/dl at day 21) as well as blood cholesterol, ALT and urea levels. Findings of the
present study prospects BO and CA a useful treatment of diabetes and its escorting complications.
Key words: Brassica oleracea, Cassia absus, Hyperglycemia, Diabetes mellitus, Oxidaive stress.
Introduction
Diabetes mellitus (DM), a multifactorial disease, is
characterized by impaired insulin secretion or its action
for glucose regulation (Zimmet et al., 2001). The
wrecking effects of DM qualifies it as an ailment of
foremost public health concern. Epidemiological data
revealed it as the seventh leading cause of death
worldwide and is estimated to be the principal cause of
morbidity and mortality within the next 25 years,
especially in Asia and Africa. The disease if neglected can
lead to the problems like cardiovascular anomalies, nerve
damage and nephropathies (Ojiako et al., 2016). The
curbs allied with contemporary antidiabetics such as
adverse effects, high cost of treatment and development of
resistance have encouraged complementary therapy as
more efficient alternative for the management of diabetes
epidemic. Moreover, scientific literature shows that
medicinal plants used in traditional systems of medicine
as hypoglycemic agents have also proved experimental or
clinical antidiabetic potential (Pandey et al., 2011).
Numerous hypotheses about the onset and progression of diabetic complications have been proposed by a number of researchers, but one of the most important is the role of reactive oxygen species (ROS). ROS can directly impose molecular as well as cellular damage through activation of a cascade of stress-sensitive pathways and ultimately result in chronic complications of the disease (Khan et al., 2015). The origin of some of the contemporary treatments from nature’s hub such as voglibose, acarbose and miglitol highlights the need to further explore other natural sources for the provision of better treatment options (Newman & Cragg, 2012). Ethnopharmacological approach is
particularly a valuable strategyto limit the gigantic multiplicity of possible leads to more valuable hits. Therefore, Brassica oleracea L. var. italic Plenck. (Family: Brassicaceae) and Cassia absus L. (Family: Fabaceae, subfamily: Caesalpiniaceae), the two important antidiabetic folklores have been evaluated to determine their antihyperglycemic role as well as their effects on DM associated anomalies such as oxidative stress, disorders in lipid metabolism, kidney and liver damage have also been studied. Brassica oleracea var. italic (BO) commonly known as broccoli is an Italian native plant and a cool weather crop. It is cultivated ubiquitously these days (Mukherjee & Mishra, 2012). BO is mostly used as a food source and is reported to harbor a number of bioactive compounds with anticancer, anti-arthritic and skin healing capabilities (Lehman, 2014). Cassia absus (CA) locally known as Chaksuis an Asian native herb or undershrub and is widely distributed in tropical areas of the world especially South Asia and is used locally for the management of various conditions such as snake bite, asthma, bronchitis, for cough and as detoxifier and purgative (Aftab et al., 1996). Most common phytochemicals reported from CA are alkaloids (chaksine and isochaksine), galactomannans, oils, fatty acids, sterols, glycosides, gums and resins (Pandya et al., 2010).
Despite of the several ethnomedicinal claims, scientific profiling of bioactivity of the subject plants is still in paucity. To the best of our knowledge this is the first comprehensive report of CA seed extracts exploring their antioxidant potential, cytotoxic profile, In vitro antidiabetic and In vivo antihyperglycemic effect. Furthermore, the antihyperglycemic effect of BO extracts employing solvents of escalating polarities in alloxan induced diabetic model has not been reported previously.
SIDRA KHALID ET AL., 776
Materials and Methods
Solvents and reagents: All solvents and reagents
employed in the current study were of analytical grade.
Organic solvents included chloroform, petroleum ether
(pet-ether), ethanol, dimethyl sulfoxide (DMSO), Folin-
Ciocalteu reagent, 2, 2-diphenyl-1-picrylhydrazyl
(DPPH), sea salt, doxorubicin and alloxan monohydrate
were purchased from Sigma-Aldrich (Germany).
Phosphate buffer, gallic acid, quercetin, potassium
acetate, aluminium chloride, ascorbic acid, aluminium
molybdate, potassium ferricyanide, trichloroacetic acid,
ferric chloride and alpha amylase enzyme were acquired
from Merck (Darmstadt, Germany). Brine shrimp eggs
were purchased from Ocean Star Int. (USA).
Collection and extraction: The flowering heads of BO
and CA seeds were collected in August and September,
2014 from Islamabad region, Pakistan and were
authenticated by Prof. Dr. Rizwana A. Qureshi,
Department of Plant Sciences, Quaid-i-Azam University
Islamabad, Pakistan. Voucher specimens PHM-492
(Brassica oleracea var. italica) and PHM-493 (Cassia
absus) were deposited in the herbarium of medicinal
plants, Department of Pharmacy, Quaid-i-Azam
University, Islamabad. The plant parts were washed,
shade dried and grounded to a fine powder. Accurately
weighed 250 g of each powdered plant material was
subjected to sonication aided maceration in 1000 ml of
water, ethanol, chloroform and petroleum ether (pet-ether)
for 24 hours at room temperature in separate Erlenmeyer
flasks. The Same procedure was used to extract the marc
thrice. The extracts were combined, concentrated by
vacuum evaporation in rotary evaporator (Buchi,
Switzerland) and dried in vacuum oven (Yamato, Japan)
at 45°C to obtain final crude extracts. Percentage yields
were calculated and dried extracts were stored at -20oC
for further testing. The percentage yield of the extracts
was determined gravimetrically using the following
formula:
Extract recovery (%) = (A / B) × 100
where, A = Weight of crude extract obtained after drying
and B = Weight of powdered plant material taken for each
extraction i.e., 250 g (Fatima et al., 2015).
Phytochemical analysis
Estimation of total phenolic content (TPC): Folin-
Ciocalteu (FC) reagent protocol was employed for the
assessment of total phenols (Zafar et al., 2016). Concisely,
20 µl from sample stock solution and FC (90 µl) reagent
was kept for 5 min at room temperature trailed by the
transfer of sodium carbonate solution (90 µl) in 96 well
plate. Absorbance of the assay plate was measured at 630
nm using microplate reader (Biotech USA, microplate
reader Elx 800). A calibration curve (y = 0.0136x + 0.0845,
R2 = 0.9861) of gallic acid (6.25-50 µg/ml) as positive
standard was attained and the protocol was executed as
triplicate analysis. The results are stated as µg gallic acid
equivalent per mg extract (µg GAE/mg E).
Determination of total flavonoid content (TFC):
Aluminum chloride colorimetric method was employed
for the estimation of total flavonoid content of the test
samples (Khan et al., 2015). Concisely, 20 µl from each
test extract stock solution (4 mg/ml DMSO), 10 µl of
aluminum chloride (10% w/v in H2O), 10 µl of 1.0 M
potassium acetate and 160 µl of distilled water were
added in 96 well plate which was kept at room
temperature for 30 min. The absorbance of the plate was
recorded at 415 nm using microplate reader (Biotech
USA, microplate reader Elx 800). The calibration curve
equation obtained for quercetin (2.5-40 µg/ml) as positive
control was y = 0.0268x + 0.00764 (R2 = 0.9851) and the
resultant flavonoid content is articulated as µg of
quercetin equivalent/mg of extract (µg QE/mg E).
Biological evaluation
In vitro assays
Free radical scavenging activity (FRSA): The FRSA of
the crude extracts was monitored by measuring their
capability to satiate the stable 2, 2-diphenyl-1-
picrylhydrazyl (DPPH) free radical (Ihtisham et al., 2013).
Briefly, 20 µl of each test sample at a final concentration of
200 µg/ml, was mixed with 180 µl of DPPH solution (9.2
mg/100 ml methanol) in 96 well plate. After incubation for
30 min at 37°C, the absorbance of the plate was measured
at 517 nm. Percent radical scavenging activity (%FRSA)
was calculated by using the formula:
% FRSA = (1-Abe/Abn) ×100
where Abe is the absorbance of test extracts, whereas Abn
is the absorbance of negative control containing the
DMSO instead of sample (Fatima et al., 2015). Ascorbic
acid was used as positive control and the assay was
performed in triplicate. Afterwards samples with
significant radical scavenging efficiency (> 50%) were
further tested at lower concentrations of 66.66, 22.22 and
7.41 µg/ml and IC50 was also calculated by using Table
curve 2D v5.01 software.
Total reducing power (TRP) determination: The total
reducing power (TRP) of both the plants was determined
according to the ferric reducing power assay as described
previously (Jafri et al., 2014). Briefly, an aliquot of 200 µl
of test extracts from 4 mg/ml stock solution, 400 µl each
of phosphate buffer (0.2 mol/l, pH 6.6) and potassium
ferricyanide (1% w/v in H2O) were mixed together in
Eppendorf tubes. The aforementioned mixture was
incubated for 20 min at 50°C followed by addition of 400
µl of trichloroacetic acid (10% w/v in H2O). Afterwards,
it was centrifuged at 3000 rpm at room temperature for 10
min. The upper layer of solution (500 µl) was mixed with
distilled water (500 µl) and 100 µl of FeCl3 (0.1% w/v in
H2O). From this mixture, 200 µl was transferred to 96
well plate and the absorbance of the reaction mixture was
measured at 630 nm. Blank was prepared by substituting
200 µl of DMSO instead of test sample to the
aforementioned reaction mixture. A calibration curve (y =
0.038x + 0.7484, R2 = 0.9967) of ascorbic acid as positive
ROLE OF BRASSICA OLERACEA AND CASSIA ABSUS IN DIABETES 777
control was drawn at final concentrations of 100, 50, 25,
12.5, 6.25, 3.12 µg/ml and the resultant reducing power is
expressed as µg of ascorbic acid equivalent/mg of extract
(µg AAE/mg E). The assay was performed in triplicate.
Total antioxidant capacity assay (TAC): Total
antioxidant capacity was evaluated by employing
phosphomolybdenum based colorimetric assay and the
results were expressed as µg ascorbic acid equivalent per
mg of extract (µg AAE/mg E) as described previously
(Haq et al., 2012). An aliquot of 0.1 ml of each test
sample (4 mg/ml DMSO) and positive control (at final
concentrations of 100-3.12 µg/ml) was mixed with 0.9 ml
of reagent (0.6 M sulphuric acid, 28 mM sodium
phosphate and 4 mM ammonium molybdate solution in
H2O) in Eppendorf tubes. Blank was prepared by mixing
0.9 ml of reagent solution and 0.1 ml of DMSO without
extract. The tubes were incubated in water bath for 90 min
at 95°C and were cooled to room temperature from which
200 µl was shifted to 96 well plate and the absorbance
was measured at 630 nm. A calibration curve (y = 0.0212x
+ 0.0926, R2 = 0.9913) of ascorbic acid was obtained and
the experiment was performed in triplicate.
Brine shrimp lethality assay: A 24 hour lethality assay
was executed using brine shrimp (Artemia salina Linnaeus)
larvae in a 96 well plate in accordance with the formerly
described procedure (Nasir et al., 2017). A. salina eggs
(Ocean Star 90, USA) were hatched by incubating for 24-
48 hour in simulated sea water (38 g/l sea salt
supplemented with 6 mg/l dried yeast) in a precisely
designed two compartment plastic tray kept under warmth
(30-32°C) and light. Ten nauplii were reaped using Pasteur
pipette and were transferred to 96 well plate.
Corresponding volume of each extract comprising ≤ 1%
DMSO in sea water at final doses of 500, 250, 125 and 62.5
µg/ml was instilled to the wells containing shrimp larvae
and sea water. Positive (doxorubicin) and negative (1%
DMSO in sea water) control wells were included to exclude
false positive and negative results. After 24 hours
incubation, the surviving nauplii were counted and the
percentage of deaths was determined. Median lethal
concentration (LC50) of the test extracts with 50% mortality
was calculated using Table curve 2D v5.01 software. The
test was performed in triplicate.
α-Amylase inhibition assay: Antidiabetic activity of test
samples was assessed by α-amylase inhibition assay using
standard protocol with minor modifications (Kim et al.,
2000). The reaction plate containing 25 μl α-amylase
enzyme (0.14 U/ml), 15 μl of phosphate buffer (pH 6.8),
10 μl of test samples (4 mg/ml DMSO) and 40 μl of
starch solution (2 mg/ml in potassium phosphate buffer)
was kept at 50°C for 30 min in 96 well plate trailed by
addition of 20 μl of 1 M HCl to halt the reaction.
Afterwards 90 μl of iodine reagent (5 mM potassium
iodide, 5 mM iodine) was transferred to each well and
Acarbose (250 µM) served as positive control. Negative
control was prepared without plant extracts whereas blank
was prepared without extracts and amylase enzyme; each
being substituted by equal quantities of buffer.
Absorbance of reaction mixture was recorded at 540 nm.
Inhibitory activity was expressed as % α-amylase
inhibition/mg of extract and calculated as follows:
% α-amylase inhibition = (As - An) / (Ab - An) × 100
where An = Absorbance of negative control, As =
Absorbance of sample and Ab = Absorbance of blank well.
In vivo studies
Experimental animals: Sprague-Dawley albino, 5-10
months old rats of both male and female sex (250-300 g)
were used to study the antidiabetic activity. Animals were
housed under standard laboratory conditions (temperature
22 ± 2ºC and 45 ± 5% relative humidity with 12 hour
day/night cycle at the animal house of National Institute
of Health, Islamabad, Pakistan. All animals received
standard laboratory pellet diet and water ad libitum. The
study was approved by the Bioethical committee of
Quaid-i-Azam University Islamabad (protocol # BEC-
FBS-QAU-04).
Induction of alloxan induced diabetes: Previously
refrigerated (4ºC) alloxan monohydrate was dissolved in
normal saline at room temperature and injected
intraperitoneally at a dose of 120 mg/kg to the overnight
fasted rats (Ojiako et al., 2016). In order to prevent
alloxan induced severe hypoglycaemia, rats were
supplemented with 20% glucose solution for the first 6
hours and were then kept with free access to 5% glucose
solution for the next 24 hours.After 72 hours of alloxan
injection, the rats with fasting blood glucose level > 250
mg/dl were considered hyperglycemic and were selected
for the In vivo studies. The animals were randomly
divided into 9 groups (n = 6) and were designated on the
basis of treatments received at regular intervals of 7 days
for 21 days as follows:
Group A; Control, normal healthy rats.
Group B; Untreated diabetic rats.
Group C; Diabetic rats were given standard
glibenclamide (0.6 mg/kg, p.o.).
Groups D, E and F; Diabetic rats received 300 mg/kg,
p.o. of aqueous, ethanol and chloroform extracts of
BO flowering heads, respectively.
Groups G, H and I; Diabetic rats received 300 mg/kg,
p.o of aqueous, ethanol and chloroform extracts of
CA seeds, respectively.
Extracts selected from In vitro studies were
administered by the oral gavage to rats. Aqueous and
ethanolic extracts were dissolved in normal saline
(extract vehicle) whereas, <1% DMSO was used as
extract vehicle in case of glibenclamide and chloroform
extract. The solutions were freshly prepared before oral
administration on each day. The body weight and fasting
blood glucose level were checked at day 0, 7, 14 and 21
by digital weighing balance (Ohaus corporation
PA214C, USA) and On-call plus ® glucometer (Acon
lab, USA) respectively. At the end of the study all the
animals were euthanized with excess (120 mg/kg) of
sodium pentobarbital IV injection.

SIDRA KHALID ET AL., 778
Biochemical analysis: At day 22, all the rats were deeply anesthetized with chloroform and blood from the horizontal axis of the sternum was collected in vacuumed blood collection tubes (plain Red, BD Vacutainer, USA) (Haq et al., 2012). The separated serum was stored in Eppendorf tubes at -20ºC for further analysis of biochemical parameters. For the determination of fasting plasma glucose, total cholesterol, alanine transaminase (ALT) and serum urea levels, the samples were analysed using a semi-automated biochemical analyser (Tecno 786 audit diagnostic, Ireland) using commercial kits according to manufact.
(a). Fasting plasma glucose level (FPGL): Enzymatic
glucose oxidase colorimetric method using commercially
available kit (Live diagnostic Inc, Canada) was employed
for FPGL determination (Ojiako et al., 2016).
(b). Total cholesterol (TC): Commercially available kit
(Live diagnostic Inc, Canada) containing reagent
(cholesterol oxidase, cholesterol esterase, peroxidase, 4-
aminoantipyrine, phenol and buffer) was employed for the
estimation of TC (Atawodi et al., 2014).
(c). Alanine transaminase (ALT): For the photometric
determination of serum ALT level, commercial kit (ALT
Activity Assay Kit MAK055 Merck, France) was used
(Luan & Sun, 2015).
(d). Serum urea: Commercially available kit (Live
diagnostic Inc, Canada) for the estimation of serum urea
level was used (Luan & Sun, 2015).
Statistical analysis
All In vitro assays were performed in triplicate; mean
and standard deviation were calculated. For LC50 and IC50
Table curve 2D v5.01 software was used. One way
analysis of variance (ANOVA) followed by least
significant difference (LSD) test was applied for
antioxidant assays. For In vivo testing, One way analysis
of variance (ANOVA) followed by LSD test was applied
for ALT, total cholesterol and serum urea estimation
studies. Two way ANOVA was applied for blood glucose
level and body weight (where n = 6) determination
studies. For ANOVA, SPSS (SPSS for Windows, V16.0.
Chicago, SPSS Inc., Chicago, IL) were used. P value of
<0.05 was used to assign level of significance.
Results and Discussion
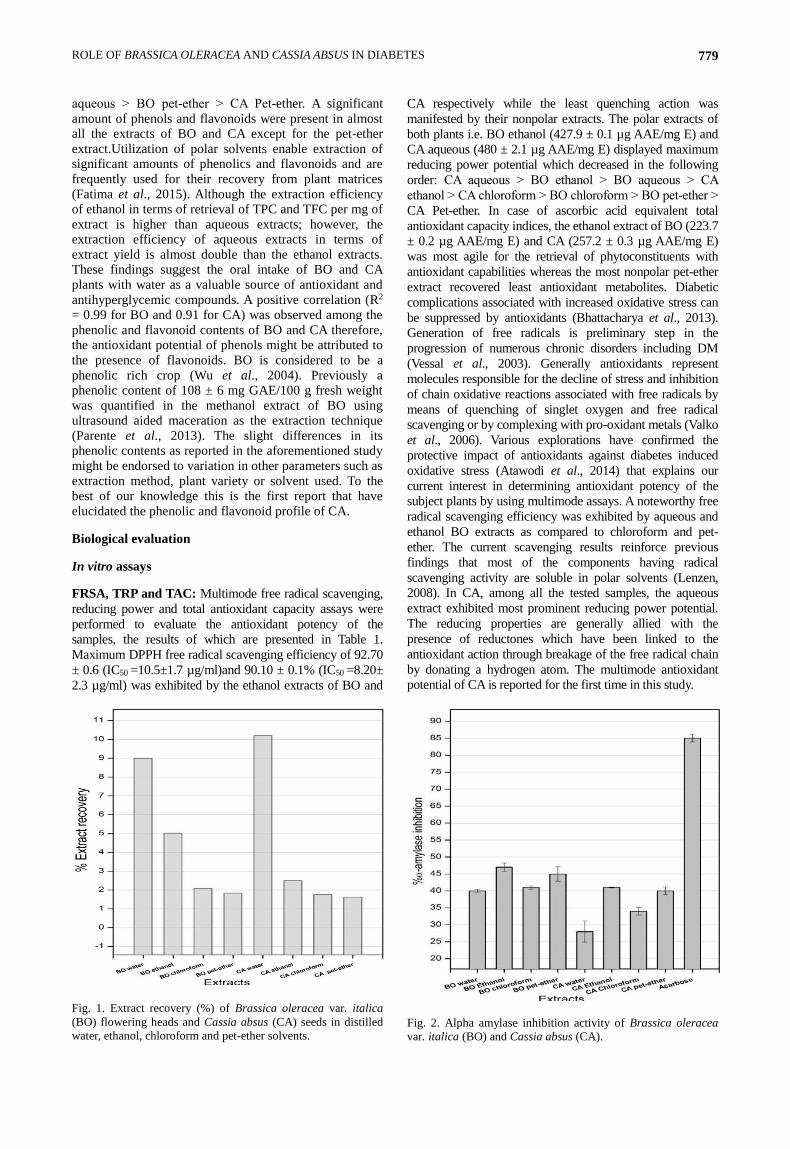
Extract recovery: The percentage of BO and CA extracts recovered from solvents of escalating polarity is summarized in Fig. 1. Highest extraction efficiency in terms of extract yield was observed in the aqueous extract of CAand BO i.e. 10.2% and 9.0% respectively followed by ethanol extracts. For both the plants, lowest extract yield was obtained when pet-ether (BO = 1.83% and CA = 1.63%) was used as the extraction solvent. Selection of an appropriate extraction procedure is imperative for the standardization of herbal preparations as it results in the amputation of necessary soluble constituents, is a critical parameter for upscaling the bench scale to pilot plant level (Dhanani et al., 2013)
and is usually different for different plant matrices (Złotek et al., 2016). Sonication aided maceration, the extraction technique employed in this study utilizes high frequency and high intensity sound waves and solvents to recover desirable compounds from plant matrices. Chemical and physical characteristics of the materials are transformed due to the interaction and dissemination of ultrasound waves disrupting the cell walls, thereby, augmenting solvent’s mass transport across the plant cells (Dhanani et al., 2013). The ultimate objective of the present study was to evaluate the efficacy of four solvent systems: water, ethanol, chloroform and pet-ether in terms of the influence of their polarity on the extractability of bioactive molecules possessing particular effectiveness in diabetes therapeutics. A previous study to optimize extraction parameters for Brassica oleracea L. (cauliflower) demonstrated a significant difference in the extractability of each type of solvent employed and it was observed that aqueous solvent was most proficient across a number of parameters including extract yield, phenolic content as well as antioxidant activity which was in agreement with the results of our present study (Anwar et al., 2013).
Phytochemical analysis
TPC and TFC: Polyphenols play a significant role in the management of diabetes as they modify lipid and carbohydrate metabolism, dyslipidemia, reduce hyperglycemia, and insulin resistance, reduce oxidative stress, improve adipose tissue metabolism and stress sensitive signaling pathways as well as other inflammatory conditions (Atawodiet al., 2014). They can also deter the development of long term complications of diabetes including nephropathy, cardiovascular disease, neuropathy, and retinopathy (Ojiako et al., 2016). Flavonoids improve, stabilize and sustain the insulin secretion, pancreatic cells and human islets respectively (Ghasemi Pirbalouti et al., 2014). They are among the listed several antidiabetic compounds, which exercise their hypoglycaemic properties via extra pancreatic mechanism of α-glucosidase modulation (Algariri et al., 2013), α-amylase inhibition and have unveiled glycaemic control in streptozocin-induced rat model of type I DM (Ojiako et al., 2015) . Therefore, TPC and TFC was quantified in various solvent soluble extracts of BO and CA in order to extrapolate their antidiabetic prospective.
In the present study, a comparative analysis of the
phenolic and flavonoid profile shows that CA extracts has
a higher content of these phytochemicals than BO (Table 1). The total gallic acid equivalent phenols ranged from
184 ± 0.1-80.7 ± 1.1μg GAE/mg E for BO extracts and 406 ± 0.1-80.7 ± 2.2 μg GAE/mg E in case of CA
extracts. Highest amount of total phenolic content was quantified in the ethanol extracts of the subject
plantswhereas it was lowest in their pet-ether extracts.
Phenolic content of BO in descending order is as follows; BO ethanol ˃ BO aqueous ˃ BO chloroform ˃ BO pet-
ether while the phenolic content of CA in in descending order is CA ethanol ˃ CA chloroform ˃ CA aqueous ˃ CA
Pet-ether. The highest TFC in terms of quercetin
equivalent was quantified in the ethanol extract of CA (361.9 ± 0.1 µg QE/mg of E) followed by CA chloroform
˃ BO ethanol ˃ BO aqueous ˃ BO chloroform ˃ CA
ROLE OF BRASSICA OLERACEA AND CASSIA ABSUS IN DIABETES 779
aqueous ˃ BO pet-ether ˃ CA Pet-ether. A significant
amount of phenols and flavonoids were present in almost all the extracts of BO and CA except for the pet-ether
extract.Utilization of polar solvents enable extraction of significant amounts of phenolics and flavonoids and are
frequently used for their recovery from plant matrices
(Fatima et al., 2015). Although the extraction efficiency of ethanol in terms of retrieval of TPC and TFC per mg of
extract is higher than aqueous extracts; however, the extraction efficiency of aqueous extracts in terms of
extract yield is almost double than the ethanol extracts. These findings suggest the oral intake of BO and CA
plants with water as a valuable source of antioxidant and
antihyperglycemic compounds. A positive correlation (R2 = 0.99 for BO and 0.91 for CA) was observed among the
phenolic and flavonoid contents of BO and CA therefore, the antioxidant potential of phenols might be attributed to
the presence of flavonoids. BO is considered to be a
phenolic rich crop (Wu et al., 2004). Previously a phenolic content of 108 ± 6 mg GAE/100 g fresh weight
was quantified in the methanol extract of BO using ultrasound aided maceration as the extraction technique
(Parente et al., 2013). The slight differences in its phenolic contents as reported in the aforementioned study
might be endorsed to variation in other parameters such as
extraction method, plant variety or solvent used. To the best of our knowledge this is the first report that have
elucidated the phenolic and flavonoid profile of CA.
Biological evaluation
In vitro assays
FRSA, TRP and TAC: Multimode free radical scavenging,
reducing power and total antioxidant capacity assays were
performed to evaluate the antioxidant potency of the
samples, the results of which are presented in Table 1.
Maximum DPPH free radical scavenging efficiency of 92.70
± 0.6 (IC50 =10.5±1.7 µg/ml)and 90.10 ± 0.1% (IC50 =8.20±
2.3 µg/ml) was exhibited by the ethanol extracts of BO and
CA respectively while the least quenching action was
manifested by their nonpolar extracts. The polar extracts of
both plants i.e. BO ethanol (427.9 ± 0.1 µg AAE/mg E) and
CA aqueous (480 ± 2.1 µg AAE/mg E) displayed maximum
reducing power potential which decreased in the following
order: CA aqueous ˃ BO ethanol ˃ BO aqueous ˃ CA
ethanol > CA chloroform ˃ BO chloroform ˃ BO pet-ether ˃
CA Pet-ether. In case of ascorbic acid equivalent total
antioxidant capacity indices, the ethanol extract of BO (223.7
± 0.2 µg AAE/mg E) and CA (257.2 ± 0.3 µg AAE/mg E)
was most agile for the retrieval of phytoconstituents with
antioxidant capabilities whereas the most nonpolar pet-ether
extract recovered least antioxidant metabolites. Diabetic
complications associated with increased oxidative stress can
be suppressed by antioxidants (Bhattacharya et al., 2013).
Generation of free radicals is preliminary step in the
progression of numerous chronic disorders including DM
(Vessal et al., 2003). Generally antioxidants represent
molecules responsible for the decline of stress and inhibition
of chain oxidative reactions associated with free radicals by
means of quenching of singlet oxygen and free radical
scavenging or by complexing with pro-oxidant metals (Valko
et al., 2006). Various explorations have confirmed the
protective impact of antioxidants against diabetes induced
oxidative stress (Atawodi et al., 2014) that explains our
current interest in determining antioxidant potency of the
subject plants by using multimode assays. A noteworthy free
radical scavenging efficiency was exhibited by aqueous and
ethanol BO extracts as compared to chloroform and pet-
ether. The current scavenging results reinforce previous
findings that most of the components having radical
scavenging activity are soluble in polar solvents (Lenzen,
2008). In CA, among all the tested samples, the aqueous
extract exhibited most prominent reducing power potential.
The reducing properties are generally allied with the
presence of reductones which have been linked to the
antioxidant action through breakage of the free radical chain
by donating a hydrogen atom. The multimode antioxidant
potential of CA is reported for the first time in this study.
Fig. 1. Extract recovery (%) of Brassica oleracea var. italica
(BO) flowering heads and Cassia absus (CA) seeds in distilled
water, ethanol, chloroform and pet-ether solvents.
Fig. 2. Alpha amylase inhibition activity of Brassica oleracea
var. italica (BO) and Cassia absus (CA).
SIDRA KHALID ET AL., 780
Table 1. TPC, TFC, FRSA, TAC, TRP and α-amylase inhibition potential of aqueous, ethanol, chloroform and pet-ether
extracts of Brassica oleracea var. italica (BO) and Cassia absus (CA).
Samples TPC TFC FRSA IC50 TAC TRP α-Amylase assay
µg GAE/mg E µg QE/mg E % FRSA µg/ml µg AAE/mg E µg AAE/mg E % Inhibition
BO water 161 ± 1.2 139.7 ± 0.2 81.50 ± 0.8 * 11.9 ± 3.2 109.1 ± 1.2 # 374.3 ± 0.2# 40 ± 0.4
BO ethanol 184 ± 0.1 160.9 ± 0.1 * 92.70 ± 0.6 * 10.5 ± 1.7 223.7 ± 0.2* 427.9 ± 0.1# 47 ± 1.3*
BO chloroform 146.4 ± 0.1 133.8 ± 0.1 48.40 ± 0.6 - 87 ± 0.2 267.4 ± 0.1 41 ± 0.1
BO pet-ether 80.7 ± 1.1 72.8 ± 1.1 47.0 ± 1.4 - 40.3 ± 1.3 200 ± 1.7 45 ± 2.2*
CA water 207 ± 0.1 89.5 ± 0.3 75.00 ± 0.1# 8.26 ± 1.2 189.6 ± 0.1 480 ± 2.1* 28 ± 3.1
CA ethanol 406.7± 0.1 361.9 ± 0.1 * 90.10 ± 0.1 * 8.2 ± 2.3 257.2 ± 3.3 * 371.7 ± 0.1 # 41 ± 0.1
CA chloroform 351.5 ± 0.6 214.7 ± 0.9* 42.30 ± 1.3 - 181.6 ± 0.9 339.7 ± 1.9 # 34 ± 1.1
CA pet-ether 80.7 ± 2.2 21.7 ± 1.0 47.90 ± 0.6 - 72.1 ± 1.1 198.3 ± 0.9 40 ±1.1
Acarbose - - - - - - 80.3 ±1.1
Extracts with statistically significant results are indicated by a superscript. In all of the results* indicate (p<0.01) and # indicate (p<0.05). Acarbose
IC50 = 33.73 ± 0.12 µg/ml
α-Amylase inhibition potential: Control of postprandial
hyperglycaemia is a practical approach for the management
of diabetes and could be achieved through inhibition of
enzymes that regulate carbohydrate hydrolysis such as α-
glucosidase and α-amylase (Thenmozhi et al., 2015). The
contemporary carbohydrate hydrolysing enzymes such as
miglitol, metformin and voglibose are associated with a
number of adverse effects such as diarrhoea, flatulence and
abdominal distention (You et al., 2012). Therefore, quest
for benign and operative inhibitors from natural sources is
of paramount importance. The α-amylase inhibitory
potential of BO and CA extracts is shown in Fig. 2. In vitro
studies demonstrated that all the crude BO and CA extracts
screened for this activity possess varied α-amylase
inhibitory potential. BO extracts displayed greater enzyme
inhibition as compared to CA. Among all the extracts,
BOethanol showed the highest activity (47 ± 1.25%) in
comparison to Acarbose (80.34 ± 1.12% of α-amylase
enzyme’s activity with an IC50 of 33.73 ± 0.12 µg/ml). The
order of decreasing activity in terms of percentage of
amylase inhibition is as follows: BO ethanol ˃ BO pet-
ether ˃ BO chloroform = CA ethanol ˃ BO aqueous = CA
pet-ether ˃ CA chloroform ˃ CA aqueous.
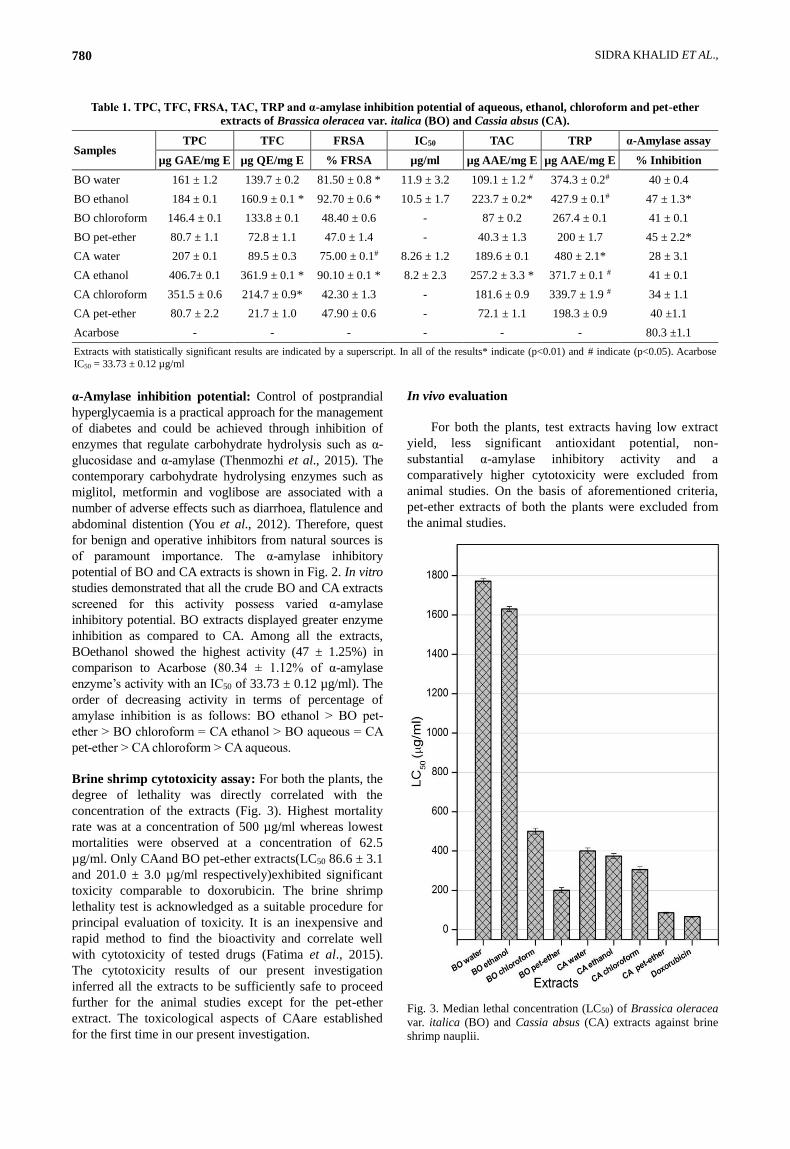
Brine shrimp cytotoxicity assay: For both the plants, the
degree of lethality was directly correlated with the
concentration of the extracts (Fig. 3). Highest mortality
rate was at a concentration of 500 µg/ml whereas lowest
mortalities were observed at a concentration of 62.5
µg/ml. Only CAand BO pet-ether extracts(LC50 86.6 ± 3.1
and 201.0 ± 3.0 µg/ml respectively)exhibited significant
toxicity comparable to doxorubicin. The brine shrimp
lethality test is acknowledged as a suitable procedure for
principal evaluation of toxicity. It is an inexpensive and
rapid method to find the bioactivity and correlate well
with cytotoxicity of tested drugs (Fatima et al., 2015).
The cytotoxicity results of our present investigation
inferred all the extracts to be sufficiently safe to proceed
further for the animal studies except for the pet-ether
extract. The toxicological aspects of CAare established
for the first time in our present investigation.
In vivo evaluation
For both the plants, test extracts having low extract
yield, less significant antioxidant potential, non-
substantial α-amylase inhibitory activity and a
comparatively higher cytotoxicity were excluded from
animal studies. On the basis of aforementioned criteria,
pet-ether extracts of both the plants were excluded from
the animal studies.
Fig. 3. Median lethal concentration (LC50) of Brassica oleracea
var. italica (BO) and Cassia absus (CA) extracts against brine
shrimp nauplii.
ROLE OF BRASSICA OLERACEA AND CASSIA ABSUS IN DIABETES 781
Table 2. Effect of Brassica oleracea var. italica (BO) and Cassia absus (CA) extracts on fasting blood glucose
level and body weight in alloxan induced diabetic rats.
Groups Parameters Day 0 Day 7 Day 14 Day 21
Group A
(Normal Control)
Blood glucose (mg/dl) 99.00 ± 2.0 95.7 ± 2.6* 95.5 ± 1.4* 94.2 ± 3.0*
Body weight (g) 282.30 ± 6.5# 294.50 ± 3.9 302.8 ± 3.9 305 ± 4.2
#
Group B
(Diabetic Control)
Blood glucose (mg/dl) 366.70 ± 9.5 358.7 ± 6.84 316.0 ± 3.1# 297.2 ± 4.8
#
Body weight (g) 285.3 ± 5.2# 273.00 ± 4.3 270.2 ± 5.3* 270.2 ± 5.3*
Group C
(Glibenclamide)
Blood glucose (mg/dl) 356.0 ± 3.3 161.3 ± 7.5 ͊ 156.0 ± 3.9* 153 ± 9.4*
Body weight (g) 279.2 ± 3.2# 279.2 ± 3.2
# 293.3 ± 4.4
# 297.2 ± 4.0
Group D
(BO Water treated
Blood glucose (mg/dl) 286.2 ± 3.5 173.5 ± 6.1 ͊ 164 ± 4.3 ͊ 161.5 ± 4.4 ͊
Body weight (g) 285.0 ± 1.3# 285.0 ± 3.2
# 287.2 ± 1.4
# 290.8 ± 2.1
Group E
(BO Ethanol treated)
Blood glucose (mg/dl) 348 ± 5.4 238 ± 9.4§ 237.2 ± 3.2
§ 223.3 ± 10.3
§
Body weight (g) 274.8 ± 6.3# 274.8 ± 5.2 284.8 ± 2.2 294.3 ± 2.2
Group F
(BO Chloroform treated)
Blood glucose (mg/dl) 293 ± 9.6 281 ± 6.8§ 271.8 ± 7.4
§ 251.5 ± 8.7
§
Body weight (g) 283.0 ± 3.5# 283 ± 4.5
# 283.8 ± 3.8 285.7 ± 8.8
Group G
(CA Water treated)
Blood glucose (mg/dl) 374.7 ± 8.2 186.7 ± 5.6 ͊ 164 ± 5.7 ͊ 142.3 ± 7.1*
Body weight (g) 278.5 ± 4.2# 296.8 ± 3.0 305.3 ± 3.9 ͊ 305.3 ± 3.0 ͊
Group H
(CA Ethanol treated)
Blood glucose (mg/dl) 299.8 ± 7.9 219.7 ± 4.6 § 195.2 ± 5.8
§ 186.2 ± 8.7
#
Body weight (g) 281.0 ± 3.8# 300.3 ± 3.1
# 292.3 ± 2.2 292.3 ± 4.0
#
Group I
(CA Chloroform treated)
Blood glucose (mg/dl) 350.80 ± 9.7 188.8 ± 16.8# 169.5 ± 6.1
# 158 ± 7.4 ͊
Body weight (g) 281.0 ± 4.2# 295.7 ± 4.4 298.7 ± 2.7
# 298.7 ± 2.7
Two way ANOVA along with multiple comparison test was applied. All data are expressed as mean ± SE (n = 6). Where * < 0.001 compared to normal control; ͊ < 0.001 compared to diabetic control. # indicated that there is non-significant difference between the groups. Similarly for blood
glucose level, multiple comparison test of normal control and different extracts of BO and CA (300 mg/kg) at different time intervals were applied where * indicates p<0.05, ͊ p<0.01, # p<0.001, § P = .000
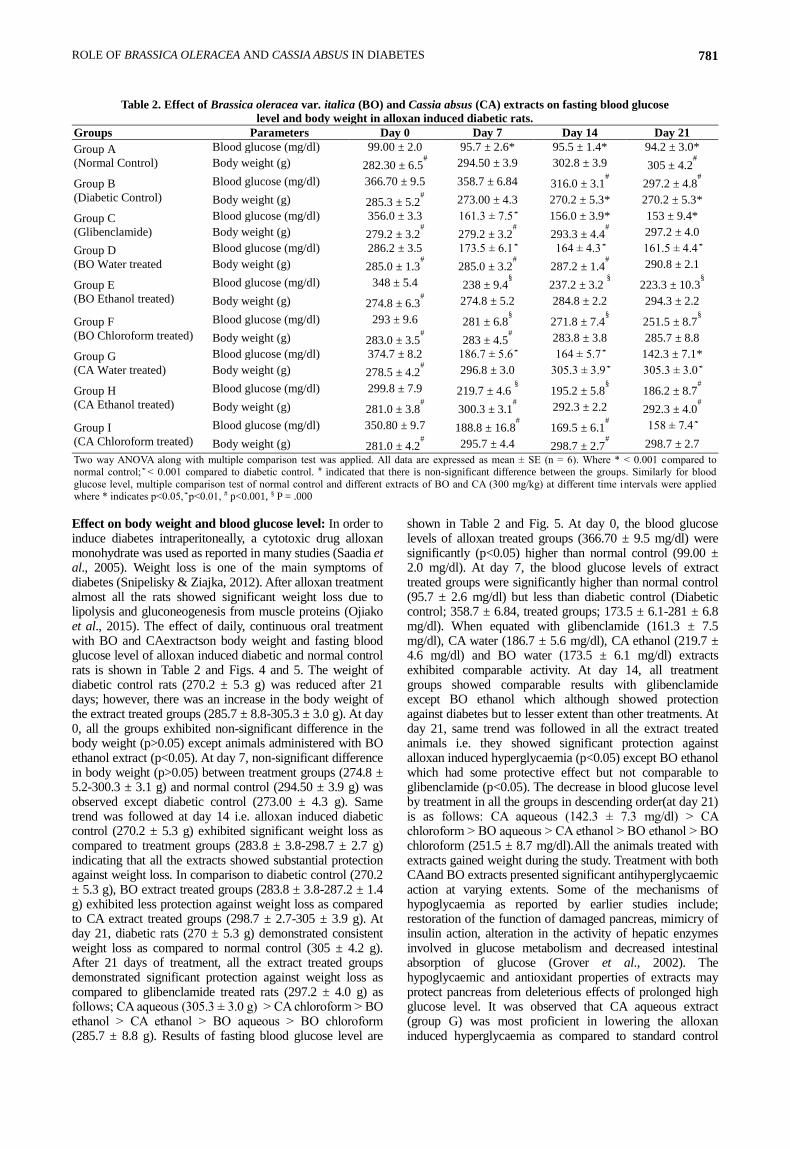
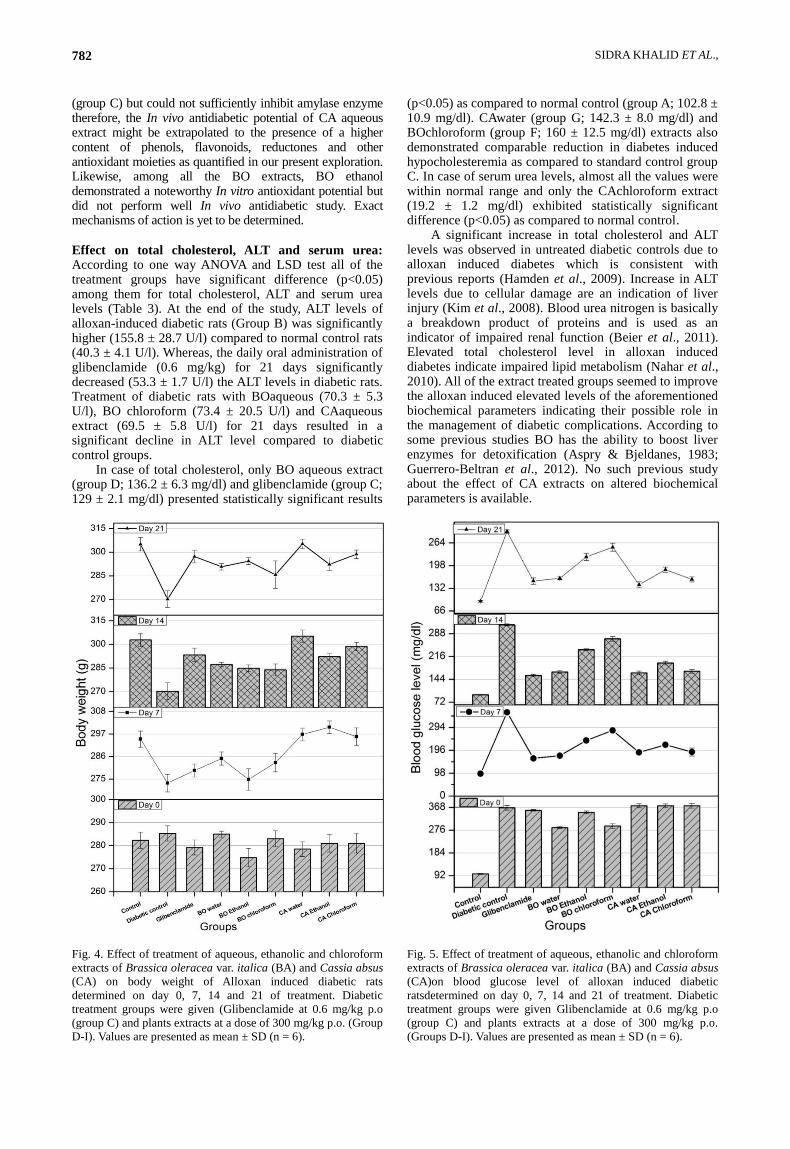
Effect on body weight and blood glucose level: In order to induce diabetes intraperitoneally, a cytotoxic drug alloxan monohydrate was used as reported in many studies (Saadia et al., 2005). Weight loss is one of the main symptoms of diabetes (Snipelisky & Ziajka, 2012). After alloxan treatment almost all the rats showed significant weight loss due to lipolysis and gluconeogenesis from muscle proteins (Ojiako et al., 2015). The effect of daily, continuous oral treatment with BO and CAextractson body weight and fasting blood glucose level of alloxan induced diabetic and normal control rats is shown in Table 2 and Figs. 4 and 5. The weight of diabetic control rats (270.2 ± 5.3 g) was reduced after 21 days; however, there was an increase in the body weight of the extract treated groups (285.7 ± 8.8-305.3 ± 3.0 g). At day 0, all the groups exhibited non-significant difference in the body weight (p>0.05) except animals administered with BO ethanol extract (p<0.05). At day 7, non-significant difference in body weight (p>0.05) between treatment groups (274.8 ± 5.2-300.3 ± 3.1 g) and normal control (294.50 ± 3.9 g) was observed except diabetic control (273.00 ± 4.3 g). Same trend was followed at day 14 i.e. alloxan induced diabetic control (270.2 ± 5.3 g) exhibited significant weight loss as compared to treatment groups (283.8 ± 3.8-298.7 ± 2.7 g) indicating that all the extracts showed substantial protection against weight loss. In comparison to diabetic control (270.2 ± 5.3 g), BO extract treated groups (283.8 ± 3.8-287.2 ± 1.4 g) exhibited less protection against weight loss as compared to CA extract treated groups (298.7 ± 2.7-305 ± 3.9 g). At day 21, diabetic rats (270 ± 5.3 g) demonstrated consistent weight loss as compared to normal control (305 ± 4.2 g). After 21 days of treatment, all the extract treated groups demonstrated significant protection against weight loss as compared to glibenclamide treated rats (297.2 ± 4.0 g) as follows; CA aqueous (305.3 ± 3.0 g) ˃ CA chloroform ˃ BO ethanol ˃ CA ethanol ˃ BO aqueous ˃ BO chloroform (285.7 ± 8.8 g). Results of fasting blood glucose level are
shown in Table 2 and Fig. 5. At day 0, the blood glucose levels of alloxan treated groups (366.70 ± 9.5 mg/dl) were significantly (p<0.05) higher than normal control (99.00 ± 2.0 mg/dl). At day 7, the blood glucose levels of extract treated groups were significantly higher than normal control (95.7 ± 2.6 mg/dl) but less than diabetic control (Diabetic control; 358.7 ± 6.84, treated groups; 173.5 ± 6.1-281 ± 6.8 mg/dl). When equated with glibenclamide (161.3 ± 7.5 mg/dl), CA water (186.7 ± 5.6 mg/dl), CA ethanol (219.7 ± 4.6 mg/dl) and BO water (173.5 ± 6.1 mg/dl) extracts exhibited comparable activity. At day 14, all treatment groups showed comparable results with glibenclamide except BO ethanol which although showed protection against diabetes but to lesser extent than other treatments. At day 21, same trend was followed in all the extract treated animals i.e. they showed significant protection against alloxan induced hyperglycaemia (p<0.05) except BO ethanol which had some protective effect but not comparable to glibenclamide (p<0.05). The decrease in blood glucose level by treatment in all the groups in descending order(at day 21) is as follows: CA aqueous (142.3 ± 7.3 mg/dl) ˃ CA chloroform ˃ BO aqueous ˃ CA ethanol ˃ BO ethanol ˃ BO chloroform (251.5 ± 8.7 mg/dl).All the animals treated with extracts gained weight during the study. Treatment with both CAand BO extracts presented significant antihyperglycaemic action at varying extents. Some of the mechanisms of hypoglycaemia as reported by earlier studies include; restoration of the function of damaged pancreas, mimicry of insulin action, alteration in the activity of hepatic enzymes involved in glucose metabolism and decreased intestinal absorption of glucose (Grover et al., 2002). The hypoglycaemic and antioxidant properties of extracts may protect pancreas from deleterious effects of prolonged high glucose level. It was observed that CA aqueous extract (group G) was most proficient in lowering the alloxan induced hyperglycaemia as compared to standard control
SIDRA KHALID ET AL., 782
(group C) but could not sufficiently inhibit amylase enzyme therefore, the In vivo antidiabetic potential of CA aqueous extract might be extrapolated to the presence of a higher content of phenols, flavonoids, reductones and other antioxidant moieties as quantified in our present exploration. Likewise, among all the BO extracts, BO ethanol demonstrated a noteworthy In vitro antioxidant potential but did not perform well In vivo antidiabetic study. Exact mechanisms of action is yet to be determined.
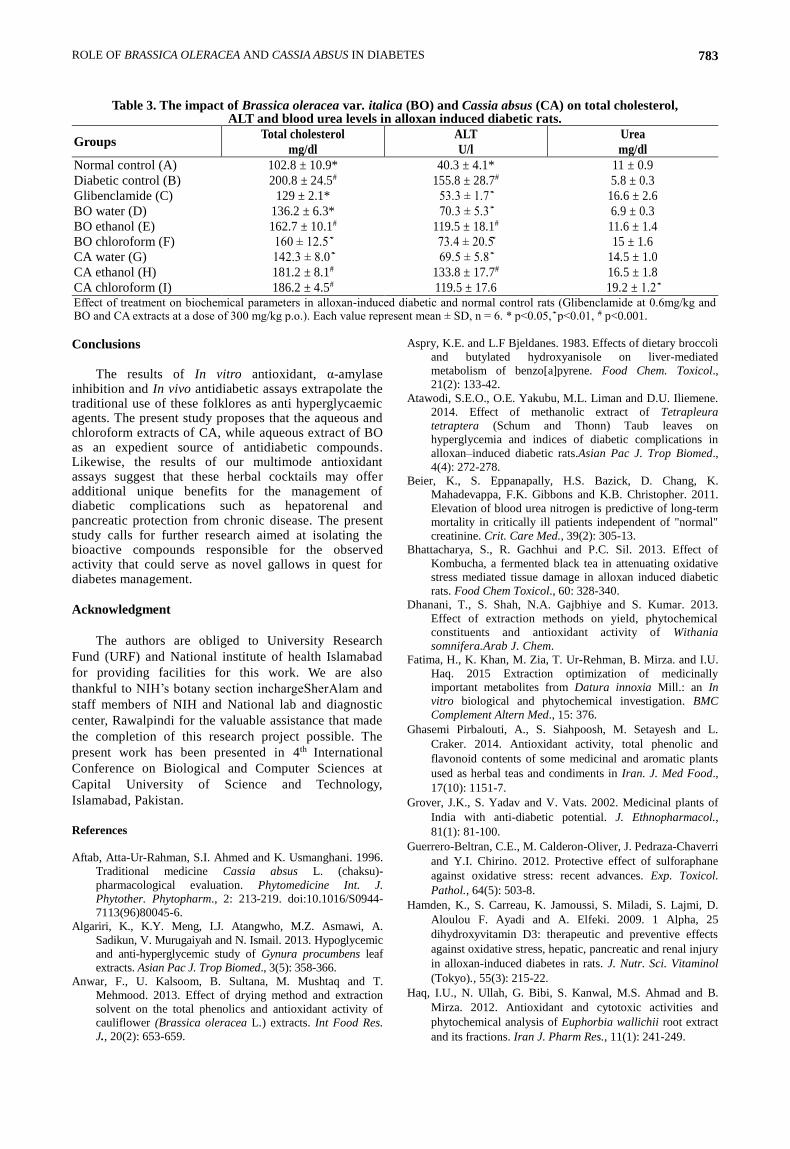
Effect on total cholesterol, ALT and serum urea: According to one way ANOVA and LSD test all of the treatment groups have significant difference (p<0.05) among them for total cholesterol, ALT and serum urea levels (Table 3). At the end of the study, ALT levels of alloxan-induced diabetic rats (Group B) was significantly higher (155.8 ± 28.7 U/l) compared to normal control rats (40.3 ± 4.1 U/l). Whereas, the daily oral administration of glibenclamide (0.6 mg/kg) for 21 days significantly decreased (53.3 ± 1.7 U/l) the ALT levels in diabetic rats. Treatment of diabetic rats with BOaqueous (70.3 ± 5.3 U/l), BO chloroform (73.4 ± 20.5 U/l) and CAaqueous extract (69.5 ± 5.8 U/l) for 21 days resulted in a significant decline in ALT level compared to diabetic control groups.
In case of total cholesterol, only BO aqueous extract (group D; 136.2 ± 6.3 mg/dl) and glibenclamide (group C; 129 ± 2.1 mg/dl) presented statistically significant results
(p<0.05) as compared to normal control (group A; 102.8 ± 10.9 mg/dl). CAwater (group G; 142.3 ± 8.0 mg/dl) and BOchloroform (group F; 160 ± 12.5 mg/dl) extracts also demonstrated comparable reduction in diabetes induced hypocholesteremia as compared to standard control group C. In case of serum urea levels, almost all the values were within normal range and only the CAchloroform extract (19.2 ± 1.2 mg/dl) exhibited statistically significant difference (p<0.05) as compared to normal control.
A significant increase in total cholesterol and ALT levels was observed in untreated diabetic controls due to alloxan induced diabetes which is consistent with previous reports (Hamden et al., 2009). Increase in ALT levels due to cellular damage are an indication of liver injury (Kim et al., 2008). Blood urea nitrogen is basically a breakdown product of proteins and is used as an indicator of impaired renal function (Beier et al., 2011). Elevated total cholesterol level in alloxan induced diabetes indicate impaired lipid metabolism (Nahar et al., 2010). All of the extract treated groups seemed to improve the alloxan induced elevated levels of the aforementioned biochemical parameters indicating their possible role in the management of diabetic complications. According to some previous studies BO has the ability to boost liver enzymes for detoxification (Aspry & Bjeldanes, 1983; Guerrero-Beltran et al., 2012). No such previous study about the effect of CA extracts on altered biochemical parameters is available.
Fig. 4. Effect of treatment of aqueous, ethanolic and chloroform
extracts of Brassica oleracea var. italica (BA) and Cassia absus
(CA) on body weight of Alloxan induced diabetic rats
determined on day 0, 7, 14 and 21 of treatment. Diabetic
treatment groups were given (Glibenclamide at 0.6 mg/kg p.o
(group C) and plants extracts at a dose of 300 mg/kg p.o. (Group
D-I). Values are presented as mean ± SD (n = 6).
Fig. 5. Effect of treatment of aqueous, ethanolic and chloroform
extracts of Brassica oleracea var. italica (BA) and Cassia absus
(CA)on blood glucose level of alloxan induced diabetic
ratsdetermined on day 0, 7, 14 and 21 of treatment. Diabetic
treatment groups were given Glibenclamide at 0.6 mg/kg p.o
(group C) and plants extracts at a dose of 300 mg/kg p.o.
(Groups D-I). Values are presented as mean ± SD (n = 6).
ROLE OF BRASSICA OLERACEA AND CASSIA ABSUS IN DIABETES 783
Conclusions
The results of In vitro antioxidant, α-amylase
inhibition and In vivo antidiabetic assays extrapolate the traditional use of these folklores as anti hyperglycaemic agents. The present study proposes that the aqueous and chloroform extracts of CA, while aqueous extract of BO as an expedient source of antidiabetic compounds. Likewise, the results of our multimode antioxidant assays suggest that these herbal cocktails may offer additional unique benefits for the management of diabetic complications such as hepatorenal and pancreatic protection from chronic disease. The present study calls for further research aimed at isolating the bioactive compounds responsible for the observed activity that could serve as novel gallows in quest for diabetes management.
Acknowledgment
The authors are obliged to University Research
Fund (URF) and National institute of health Islamabad
for providing facilities for this work. We are also
thankful to NIH’s botany section inchargeSherAlam and
staff members of NIH and National lab and diagnostic
center, Rawalpindi for the valuable assistance that made
the completion of this research project possible. The
present work has been presented in 4th International
Conference on Biological and Computer Sciences at
Capital University of Science and Technology,
Islamabad, Pakistan.
References
Aftab, Atta-Ur-Rahman, S.I. Ahmed and K. Usmanghani. 1996.
Traditional medicine Cassia absus L. (chaksu)-
pharmacological evaluation. Phytomedicine Int. J.
Phytother. Phytopharm., 2: 213-219. doi:10.1016/S0944-
7113(96)80045-6.
Algariri, K., K.Y. Meng, I.J. Atangwho, M.Z. Asmawi, A.
Sadikun, V. Murugaiyah and N. Ismail. 2013. Hypoglycemic
and anti-hyperglycemic study of Gynura procumbens leaf
extracts. Asian Pac J. Trop Biomed., 3(5): 358-366.
Anwar, F., U. Kalsoom, B. Sultana, M. Mushtaq and T.
Mehmood. 2013. Effect of drying method and extraction
solvent on the total phenolics and antioxidant activity of
cauliflower (Brassica oleracea L.) extracts. Int Food Res.
J., 20(2): 653-659.
Aspry, K.E. and L.F Bjeldanes. 1983. Effects of dietary broccoli
and butylated hydroxyanisole on liver-mediated
metabolism of benzo[a]pyrene. Food Chem. Toxicol.,
21(2): 133-42.
Atawodi, S.E.O., O.E. Yakubu, M.L. Liman and D.U. Iliemene.
2014. Effect of methanolic extract of Tetrapleura
tetraptera (Schum and Thonn) Taub leaves on
hyperglycemia and indices of diabetic complications in
alloxan–induced diabetic rats.Asian Pac J. Trop Biomed.,
4(4): 272-278.
Beier, K., S. Eppanapally, H.S. Bazick, D. Chang, K.
Mahadevappa, F.K. Gibbons and K.B. Christopher. 2011.
Elevation of blood urea nitrogen is predictive of long-term
mortality in critically ill patients independent of "normal"
creatinine. Crit. Care Med., 39(2): 305-13.
Bhattacharya, S., R. Gachhui and P.C. Sil. 2013. Effect of
Kombucha, a fermented black tea in attenuating oxidative
stress mediated tissue damage in alloxan induced diabetic
rats. Food Chem Toxicol., 60: 328-340.
Dhanani, T., S. Shah, N.A. Gajbhiye and S. Kumar. 2013.
Effect of extraction methods on yield, phytochemical
constituents and antioxidant activity of Withania
somnifera.Arab J. Chem.
Fatima, H., K. Khan, M. Zia, T. Ur-Rehman, B. Mirza. and I.U.
Haq. 2015 Extraction optimization of medicinally
important metabolites from Datura innoxia Mill.: an In
vitro biological and phytochemical investigation. BMC
Complement Altern Med., 15: 376.
Ghasemi Pirbalouti, A., S. Siahpoosh, M. Setayesh and L.
Craker. 2014. Antioxidant activity, total phenolic and
flavonoid contents of some medicinal and aromatic plants
used as herbal teas and condiments in Iran. J. Med Food.,
17(10): 1151-7.
Grover, J.K., S. Yadav and V. Vats. 2002. Medicinal plants of
India with anti-diabetic potential. J. Ethnopharmacol.,
81(1): 81-100.
Guerrero-Beltran, C.E., M. Calderon-Oliver, J. Pedraza-Chaverri
and Y.I. Chirino. 2012. Protective effect of sulforaphane
against oxidative stress: recent advances. Exp. Toxicol.
Pathol., 64(5): 503-8.
Hamden, K., S. Carreau, K. Jamoussi, S. Miladi, S. Lajmi, D.
Aloulou F. Ayadi and A. Elfeki. 2009. 1 Alpha, 25
dihydroxyvitamin D3: therapeutic and preventive effects
against oxidative stress, hepatic, pancreatic and renal injury
in alloxan-induced diabetes in rats. J. Nutr. Sci. Vitaminol
(Tokyo)., 55(3): 215-22.
Haq, I.U., N. Ullah, G. Bibi, S. Kanwal, M.S. Ahmad and B.
Mirza. 2012. Antioxidant and cytotoxic activities and
phytochemical analysis of Euphorbia wallichii root extract
and its fractions. Iran J. Pharm Res., 11(1): 241-249.
Table 3. The impact of Brassica oleracea var. italica (BO) and Cassia absus (CA) on total cholesterol, ALT and blood urea levels in alloxan induced diabetic rats.
Groups Total cholesterol
mg/dl
ALT
U/l
Urea
mg/dl
Normal control (A) 102.8 ± 10.9* 40.3 ± 4.1* 11 ± 0.9
Diabetic control (B) 200.8 ± 24.5# 155.8 ± 28.7# 5.8 ± 0.3
Glibenclamide (C) 129 ± 2.1* 53.3 ± 1.7 ͊ 16.6 ± 2.6
BO water (D) 136.2 ± 6.3* 70.3 ± 5.3 ͊ 6.9 ± 0.3
BO ethanol (E) 162.7 ± 10.1# 119.5 ± 18.1# 11.6 ± 1.4
BO chloroform (F) 160 ± 12.5 ͊ 73.4 ± 20.5͊ 15 ± 1.6
CA water (G) 142.3 ± 8.0 ͊ 69.5 ± 5.8 ͊ 14.5 ± 1.0
CA ethanol (H) 181.2 ± 8.1# 133.8 ± 17.7# 16.5 ± 1.8
CA chloroform (I) 186.2 ± 4.5# 119.5 ± 17.6 19.2 ± 1.2 ͊ Effect of treatment on biochemical parameters in alloxan-induced diabetic and normal control rats (Glibenclamide at 0.6mg/kg and BO and CA extracts at a dose of 300 mg/kg p.o.). Each value represent mean ± SD, n = 6. * p<0.05, ͊ p<0.01, # p<0.001.
SIDRA KHALID ET AL., 784
Haq, S., M. Asad, T.A. Munir and N. Afzal. 2012. Comparison
of methanolic extract of Acacia modesta leaves and
glibenclamide on hyperlipidemia in alloxan induced
diabetic rats. IMJ., 4(4): 198-204.
Ihtisham, M., Ihsan-ul-Haq, S. Sarwar and B. Mirza. 2013.
HPLC-DAD Analysis and Free Radical Scavenging
Potential of Quercus Dilatata L. Pak. J. Bot., 45 (S1): 577-
581.
Jafri, L., S. Saleem, I.U. Haq, N. Ullah and B. Mirza. 2014. In
vitro assessment of antioxidant potential and determination
of polyphenolic compounds of Hedera nepalensis K.
Koch'. Arabian J. Chem.
Khan, K., H. Fatima, M.M. Taqi, M. Zia, T. ur-Rehman, B.
Mirza. and I.U. Haq. 2015. Phytochemical and In vitro
biological evaluation of Artemisia scoparia Waldst. &
Kit for enhanced extraction of commercially significant
bioactive compounds. J. Appl. Res. Med. Aromat Plants.,
2(3): 77-86.
Kim, J.S., C.S. Kwon and K.H. Son. 2000. Inhibition of alpha-
glucosidase and amylase by luteolin, a flavonoid. Biosci.
Biotechnol. Biochem., 64(11): 2458-2461.
Kim, W.R., S.L. Flamm, A.M. Di Bisceglie and H.C.
Bodenheimer. 2008. Serum activity of alanine
aminotransferase (ALT) as an indicator of health and
disease. Hepatology, 47(4): 1363-70.
Lehman, S. 2014. Broccoli nutrition facts and health benefits.
Nutr. Youcom., available: URL http://www.nutrition-and-you.com/broccoli.html [accessed 10.13.14.].
Lenzen, S. 2008. The mechanisms of alloxan- and streptozotocin-
induced diabetes. Diabetologia, 51(2): 216-26.
Luan, B. and C. Sun. 2015. Protective effects of dimedone
pyrone on podocytes in rats with diabetic nephropathy.
Trop J. Pharm. Res., 14(9): 1643-1649.
Mukherjee, V. and P.K. Mishra. 2012. Broccoli-An
Underexploited Neutraceutical. Sci. Res.,
Nahar, L., F.A. Ripa, A.H.M. Zulfiker, M. Rokonuzzaman, M.
Haque and D.K.M.S. Islam. 2010. Comparative study of
antidiabetic effect of Abroma augusta and Syzygium cumini
on alloxan induced diabetic rat. Agric. Biol. J. N. Am., 1(6):
1268-1272.
Nasir, B., M. Ahmed, S. Zahra, T. Ur-Rehman and H. Fatima.
2017. Pharmacological evaluation of Fumaria indica, a
traditionally important medicinal plant. Pak. J. Bot., 49(SI):
119-132.
Newman, D.J. and G.M. Cragg. 2012. Natural products as
sources of new drugs over the 30 years from 1981 to 2010.
J. Natural Products, 75(3): 311-335.
Ojiako, O., P. Chikezie and A. Ogbuji. 2015. Glycemic
indices/renal and hepatic antioxidant status of
hyperglycemic rats treated with single and combinatorial
herbal formulations. J. Diabetes Metab., 6(508):
Ojiako, O.A., P.C. Chikezie and A.C. Ogbuji. 2016. Blood
glucose level and lipid profile of alloxan-induced
hyperglycemic rats treated with single and combinatorial
herbal formulations. J. Tradit Compl. Med., 6(2): 184-192.
Pandey, A., P. Tripathi, R. Pandey, R. Srivatava and S.
Goswami. 2011. Alternative therapies useful in the
management of diabetes: A systematic review. J. Pharm.
Bioall. Sci., 3(4): 504-512.
Pandya, H., Y. Kachwala, L. Sawant and N. Pandita. 2010.
Pharmacognostical screening of seeds of Cassia absus.
Pharmacognosy J., 2(11): 419-426.
Parente, C.P., M.J.R. Lima, E. Teixeira-Lemos, M.M. Moreira,
A.A. Barros and L.F. Guido. 2013. Phenolic content and
antioxidant activity determination in broccoli and lamb’s
lettuce. Int. J. Biol., Biomol., Agri., Food and Biotechnol.
Eng., 7(7): 562-565.
Patel, O.P.S., A. Mishra, R. Maurya, D. Saini, J. Pandey, I.
Taneja, K.S.R. Raju, S. Kanojiya, S.K. Shukla, M.N.
Srivastava, M. Wahajuddin, A.K. Tamrakar, A.K.
Srivastava and P.P. Yadav. 2016. Naturally Occurring
Carbazole Alkaloids from Murraya koenigii as Potential
Antidiabetic Agents. J. Nat. Prod., 9(5): 1276-1284.
Saadia, S. Alam, A.K. Khan, G.A. Sirhindi and S. Khan. 2005.
Alloxan induced diabetes in rabbits. Pak. J. Pharmacol.,
22(2): 41-45.
Snipelisky, D. and P. Ziajka. 2012. Diabetes and
hyperlipidemia: A direct quantitative analysis-A direct
analysis of the effects of insulin resistance on lipid levels in
relation to atherosclerotic coronary artery disease. World J.
Cardiovasc Dis., 2: 20-25.
Thenmozhi, K., S. Jamuna, K. Karthika, S. Manian, S. Paulsamy
and C.C. 2015. HPTLC finger printing profile and
evaluation of In vitro antidiabetic potential of medicinally
important plant Cassia obtusa L. (Caesalpiniaceae). J.
Appl. Pharm. Sci., 53: 73-79.
Valko, M., C.J. Rhodes, J. Moncol, M. Izakovic and M. Mazur.
2006. Free radicals, metals and antioxidants in oxidative
stress-induced cancer. Chem. Biol. Interact., 160(1): 1-40.
Vessal, M., M. Hemmati and M. Vasei. 2003. Antidiabetic
effects of quercetin in streptozocin-induced diabetic rats.
Comparative Biochemistry and Physiology Part C:
Toxicology & Pharmacology., 135(3): 357-364.
Wu, X., L. Gu, J. Holden, D.B. Haytowitz, S.E. Gebhardt, G.
Beecher and R.L. Prior. 2004. Development of a database
for total antioxidant capacity in foods: a preliminary study.
J. Food Compos. Anal., 17, 407-422.
You, Q., F. Chen, X. Wang, Y. Jiang and S. Lin. 2012. Anti-
diabetic activities of phenolic compounds in muscadine
against alpha-glucosidase and pancreatic lipase. Food Sci.
Technol., 46(1): 164-168.
Zafar, H., A. Ali, J.S. Ali, I.U. Haq and M. Zia. 2016. Effect of
ZnO Nanoparticles on Brassica nigra seedlings and stem
explants: Growth dynamics and antioxidative response.
Front Plant Sci., 7: 535.
Zimmet, P., K.G.M.M. Alberti and J. Shaw. 2001. Global and
societal implications of the diabetes epidemic. Nature,
414(6865): 782-787.
Złotek, U., S. Mikulska, M. Nagajek and M. Świeca. 2016. The
effect of different solvents and number of extraction steps
on the polyphenol content and antioxidant capacity of basil
leaves (Ocimum basilicum L.) extracts. Saudi J. Biol. Sci.,
(Received for publication 13 March 2017)