Embed Size (px)
Citation preview

1
BRAND PREFERENCE BEING CHALLENGED
Don E. Schultz, Northwestern University, Evanston, Illinois Martin P. Block, Northwestern University, Evanston, Illinois
Vijay Viswanathan, Northwestern University, Evanston, Illinois
Abstract:
The past decade has witnessed significant shifts in both the macro and micro environments. The main
objective of this study is to examine whether consumers’ preference for manufacturer national brands
today is as strong as it was, say a decade ago. Initial findings from a large-scale survey across multiple
product categories indicate a decreasing preference amongst consumers for manufacturer national
brands. Interestingly, this is accompanied by a non-trivial increasing preference for the No Preference
option. Similar results were found when the authors delved deeper into three specific categories –
cereals, cosmetics and OTC allergy medications. To validate and explain these results the study used two
other data sources, the Customer Loyalty Engagement Index from Brand Keys and the brand value
measures from BAV Consulting. Alternating measures and different methodologies only confirmed the
initial findings. We found in both these data sources that consumers increasingly evaluate different
brands in the category as being more and more similar. In other words, brands are operating in a smaller
competitive space and consumers are finding it increasingly difficult to differentiate brands. In short,
most brands, and particularly those in the three categories which used data from three sources, face a
high risk of ‘commoditization’.
Keywords: Brands, no preference, differentiation, commoditization, brand value, clustering

2
It has long been an article of faith that the development of brand preference was a mainstay in
brand management and strongly contributed to overall brand success. First recognized in the 1940-
1950s in the economics literature as “customer preference” (Modigliani and Brumberg, 1954 and
Friedman, 1957), it evolved and emerged as brand preference in the advertising, marketing and
branding literature in the 1960’s (Lavidge and Steiner, 1961, Stafford, 1966; Dolich, 1969). While many
attempts were made to mathematically demonstrate consumer preference (Arrow, Karlin and Scarf,
1957) it was not until the 1960s that a satisfactory consumer conceptual model was developed. That
was provided by Lavidge and Steiner and was a primary component in their Hierarchy of Effects model.
(Lavidge and Steiner, 1961) It has gained traction in brand management and measurement ever since,
being perceived as a pre-cursor to consumer brand purchase (Aaker, 1999), brand loyalty (Oliver, 1999)
and long-term brand success. (Cobb-Walgren, et al, 1995) Thus, brand preference has reached a status
of being an academic and professional corner-stone in the development of most all brand strategies,
applications and measurements ever since.
Over the years, many methods of determining and measuring consumer brand preference have
been put forth both by both the professional and academic communities. (Zeithaml, 1988; Keller, 1993)
Almost every major brand seems to have developed their own particular method of determining,
measuring, tracking and evaluating the preference for their brand, brands or brand portfolio in the
marketplace. (Keller, 1993; Aaker, 2009; Kapferer, 2012) Thus, brand preference measurement is
seemingly a well-developed and well-accepted brand concept. (David, 1992; Hoeffler and Keller, 2003)
Few brand managers or researchers even question the concept today. As the saying goes, “brand
preference goes with the branding territory”.
There have been few challenges to the concept of consumer brand preference. Indeed, most of
today’s brand research and writing revolves around how to extend, expand or illustrate the basic
concept. (Aaker, 2011; Keller, et al, 2011; Schultz and Block, 2011) Thus, brand preference seems a
sacrosanct concept along with motherhood and apple pie, at least in the American literature. Certainly,
there have been questions about how to best develop and deliver brand preference among customer
groups, especially since brand preference appears to be somewhat volatile. (Aaker, 2009; Keller, et al,
2011; Kapferer, 2012) Brands and their preferences have gone up and down in the marketplace over

3
time, with some losing their “preference” entirely and simply disappearing from the marketplace, i.e.,
Victrola, Woolworths, Rustler Steakhouses, White Rock, and others which once were household names
but, are now seemingly gone forever. The concept of brand preference, however, lives on. (Kapferer,
2012)
However, all that seems to have changed. In 2012 Schultz and Block presented a paper at the
ICORIA conference in Stockholm (Schultz and Block, 2012) which suggested that brand preference, as a
measure of brand strength and value was declining, being replaced by the polar opposite concept of “No
Brand Preference” in the specific manufacturer product categories they had studied. Using responses to
a consumer online questionnaire in the U.S. on two consumer product brands, and using consumer-
reported Net Promoter Scores (NPS) as a measurement approach, they demonstrated that overall
manufacturer brand preference had declined in those two consumer product categories, i.e. ready-to-
eat cereals and salty snacks. The preference for the individual product brands had been replaced by a
consumer-choice response in those categories of No Brand Preference. (Schultz and Block, 2012) While
brand preference in consumer product categories has been challenged by store brands and private
labels over the years, this appears to be the first study that seriously questioned the value of all the
brands in specific product categories. (Schultz and Block, 2012)
Following that study, Schultz and Block added to their database and constructed a U.S. based
consumer product brand preference study. That was based on 10 years of data which came from
1,100,000+ online responses, representing 74 product brand categories (all in categories sold in
grocery/mass merchandise outlets) representing 1,500+ brands. In that study they found consumer No
Brand Preference was growing in almost every brand and category they measured, i.e., No Brand
Preference was replacing preference for almost all traditional consumer brands. That study was
published in the Journal of Brand Strategy. (Schultz and Block, 2013)
Following the research and reporting of the increase in No Brand Preference from this major
study, it was found that other brand research and tracking organizations were reporting the same
findings. (Gerzema, 2013; Passikoff, 2013) While each of the other research groups, most of which are
professional research organizations, i.e., BAV Research and Brand Keys CBLI, all report declines in overall
brand preference among reporting consumers. (Gerzema, 2013; Passikoff, 2013) Thus, the authors of
the original Schultz and Block studies, added an additional researcher, Viswanathan to the research
team, and gained agreement from BAV and Brand Keys to include their findings in a longitudinal,
triangulation study. This paper reports on that analysis. As will be seen, these findings all support the

4
original Schultz and Block results: there has been a substantial increase in the consumer selection of
“No Brand Preference” in a large number of consumer product categories.
Over the past few months, it has been found that other research organizations have also
discovered the same issues in the area of consumer or customer No Brand Preference. Those have come
from the published reports of their separate and independent studies. For example, in their report on
their new brand measurement approach, called “Meaningful Brands”; Havas Media found that among
the consumers studied, the percent of respondents who reported they did not care “…….if over 73% of
(the studied) brands ceased to exist”. (Meaningful Brand Index, Havas Media, 2013) From personal
correspondence, Integration Marketing and Communication, through their “Integration-IMC” studies
have found that digital media has had a major impact on brands and brand preference, a finding similar
to that of the Schultz and Block (Jamhouri. 2013) Finally, while their focus has been on corporate and
B2B brands, Core Brands, another major brand measurement organization, found “….an unusual
downward trend in (brand) Favorability ……overall market sentiment towards corporations is skeptical.”
(Core Brands, 2013) Thus, it appears that brand favorability and brand preference is declining for all
levels of branding around the world. This is certainly a situation which should create concern among all
brand managers, brand owners and brand researchers everywhere.
Currently, we have received data from Brand Keys and BAV Consulting and plus we have
extended and expanded the data set used in the original Schultz and Block studies. While we use
different measures of brand equity (e.g., brand share, brand loyalty, brand value) and different
methodologies (e.g., summary statistics, cluster analysis), we find remarkably similar results. The chief
finding, as discussed later in this paper is that the “brand space is contracting”, that is, the conceptual
space occupied by brands in the consumer’s mind is becoming smaller so that all brands are essentially
perceived to be much the same…..thus, there is less and less reason to prefer one brand over another.
The purpose of this paper is to report on those findings and to verify that various data sets can
indeed be combined. Based on that, we hope to add other data sets going forward, i.e., finding methods
of combining those other data sets into what is reported here. We believe if that can be successfully
done, other studies such as the Havas data and others (assuming cooperation from the data owners can
be gained) can be included in these results. Thus, we would hope to provide a global view of the status
of brand preference among consumers around the world.

5
We should note here, this research is entirely preliminary. There are major difficulties in
combining the data sets since the information was gathered in different ways, using different
assumptions and among different audiences. This paper does demonstrate, however, that a brand
preference challenge does exist, at least among major U.S. consumer product brands. The next step is to
determine why that has occurred and what is supporting that changing consumer and customer view
about the overall value of the concept of brands and branding.
The rest of the study is laid out as follows. First, we report in detail on our observations and
findings from the BIGinsightTM CIA data used in the original Schultz and Block studies. Specifically, we
explain how our findings are consistent across a large number of product categories. We then delve
deeper into three specific product categories, namely cereals, cosmetics and OTC allergy medications.
We then use two other data source, the first being the Customer Brand Loyalty Index, used by Brand
Keys and then brand value measures, used by BAV Consulting, for further analysis. The results from the
analysis of these other data sources validate and explain our observations from the CIA data.
Data Analysis and Findings
BIGinsightTM CIA Data:
Prosper Business Development (www.goProsper.com), based in Worthington, Ohio, has
developed and provided business development services and market intelligence to a wide variety of U.S.
based retailers, brand manufacturers, financial services and media organizations. Their focus has been
on data gathering in the U.S. since 2001 and in China since 2006. They have conducted monthly,
quarterly and semi-annual on-line consumer questionnaire studies in both markets. The results of these
studies have been made available to various academic institutions through research grants and have
been widely used in various types of academic research. (Bickle, 2012; Schultz and Block, 2010, 2011,
2013)
This study makes use of the BIGinsight™ CIA Monthly Consumer Studies, which consists of a
monthly on-line consumer questionnaire distributed, and responded to, by approximately 8,000 U.S.
respondents in each wave. The data set used in this study is based on the aggregated results of 130
months of those questionnaires (January, 2002 through October, 2012).Those questionnaires generated
a total of 1,101,375 responses, an average of 8,472 respondents per questionnaire wave.

6
For this study, we identified consumer responses to questions in 16 broad consumer product
departments found in retail food stores and mass merchandisers. They included such aisles and
categories as household cleaning products, snack foods, frozen foods, breakfast cereal and the like.
Although not all retail stores use the same categorization system, consumers seem to accept them in
the same way as they shop the retail outlets. Therefore, we have organized our data in the same
fashion.
Those 16 broad supermarket departments comprised a total of 131 product ranges and 73
specific product categories, each of which has further detail in terms of reported data for each of the
individual brands. The file therefore consists of brand usage, brand preference, brand purchased last
and a number of other factors for the 1,526 individual brands studied. (We should note here that the
definition of a “brand” is based on a write-in response from consumers. Thus, to consumers, the product
line identified is a brand whether technically it is or not). Since all captured data came directly from
consumer responses in the questionnaire, we have not tried to interpret or re-categorize what those
respondents reported.
The value of this level of data gathering enables us to drill down into specific brand data on
products and categories if desired. That is, we can further investigate categories such as energy drinks,
antacids, baby food, paper towels, shaving and accessories and other classifications as needed or
wanted and into individual brands as well. Unfortunately, this mass of consumer reported data created
some complications in how to describe and define our discussion of the data set used in the
development of this paper. Given the amount of data available, it is difficult to provide specifics on each
of the individual brands analyzed. Thus, we have simplified the data, as is described in Section IV which
follows.
Developing Brand Measures: A key measure in the analysis which follows is the consumer’s response to
a number of questions on brands and branding, how they are viewed, how they are used, what
influences their brand choice, usage and the like. A critical question related to whether or not the
respondent recommended various brands to friends, relatives, acquaintances and the like is also
included. By knowing respondent product usage, and whether or not those experiences were shared
with others, we were able to create a Net Promoter-type Score (NPS) for each brand and for each
retailer as reported by each respondent. Further, we were able to then aggregate that data up into
product line, product category and the like. In developing the NPS number, we used the format
developed by Reichheld (Reichheld, 2003) and employed by Satmetrix (2012) for commercial purposes
in creating and measuring NPS ratings. (The general calculation is based on a 10 point scale which brand

7
users complete to record their level of satisfaction with the brand or store. Consumer rating scores of 10
and 9 are combined for all respondents to create a total “promoter” score. Those giving
recommendation scores of 1to 6 are then totaled as “detractor” scores. Those are then deducted from
the “promoter” total which provides the “One number you need to know” NPS score as advocated by
Reichheld. (Reichheld, 2003) This NPS methodology, although it has been challenged by some (Owen
and Brooks, 2009), is currently used by thousands of organizations around the world to determine their
level of customer satisfaction and to forecast the future growth trends of brands and the overall
organization. (Reichheld, 2006) Thus, we believe it is sufficiently robust to provide the information
required in this paper.
Using these approaches and calculations, we were able to calculate the NPS score for each of
the individual brands in all of the 73 individual product categories, that is, for all the 1,526 brands
included in this study. We were also able to calculate an NPS number for each of the retailers named in
the questionnaire by respondents (identified as “Store” in the tables and discussion) as to where they
shopped or purchased the brand in question. It should be noted that the questionnaire required
respondents to identify the particular retail store where the individual brand was purchased and to
provide information necessary to calculate an NPS score for each retailer as well.
This individual retailer NPS score was a key ingredient in the overall analysis. It allowed the
indexing of the NPS retailer score against the NPS score for the individual brand. Thus, it was possible to
identify which manufacturer brands are stronger than the store brand, and, of course, the alternative
view. Again, this data and data matrix, when indexed and categorized, is so large and complex that only
aggregated data can be provided in this paper.
Results from Analysis across Categories: In measuring the Net Promoter Scores for the 1,526 brands
represented in the 73 individual product categories, it was found that many of them had lower NPS
scores than the retail stores where the brand was reported as being purchased, i.e., the Store NPS. In
other words, the retail store NPS score, indicating consumer preference, was commonly higher than the
manufacturer brand score. Thus, it seems consumers are first selecting the retail store and then
selecting from the array the retailer has assembled. An example of that finding is illustrated in Table 1
below.
Table 1 Goes About Here
Market Performance of Stores and Products

8
Table 1 provides an aggregated comparison of the reported shares of each individual brand in
the product category for both the Store and the Brand. The calculation was simple: the leading brand, in
this analysis was determined by simply identifying the brand with the highest reported consumer
preference score in each of the 73 product categories. The same was done for the calculation of the
leading Retailer in those same categories, using the same approach, that is, i.e., the greatest preference
for each retailer in each product category was determined. Those scores were then aggregated and
averaged to provide the output shown. (The Share Leading Brand should be read as “the share of brand
preference of the retailer in that category” and, the Products line should be read as “the share of brand
preference for the leading brand in that category”). As can be seen, the Share of Preference score for
the Leading Store is generally substantially higher than that of the score of the Product Brand in this
aggregated total. More evidence of that difference is shown by the AGR (Average Growth Rate) for the
Stores, all of which are positive (+0.54%) while the AGR for Product Brands is decreasing on average by -
1.68% over the ten years.
What is more disturbing for the Product Brands, however, is the growth of the “No Brand
Preference” classification. Again, recall, in the CIA Monthly Consumer Survey data, this is a consumer
reported statement, that is, it is an active choice by the consumer of “No Brand Preference” in that
particular product category and was selected by them. As can be seen, while the share of No Brand
Preference is growing for both Stores and Product Brands, the percentage reporting this occurred in
only about 25% of the sample base for the Stores, while it was just over one-half for the Product Brand.
That simply means that over 50% of all consumer responses over the 10 year period reported they had
“No Brand Preference” in the average Product category. Again, what is most disturbing for both Stores
and Brands is that the AGR for both, when stated as “No Brand Preference”, continued to increase in
total during the ten year survey period.
A final data point is relevant here. The Average Net Promoter Score for the Stores was a +19.48,
a very strong showing in the NPS system, while the aggregated Product Brand NPS score was a negative
-9.07. This means the recommendations consumers gave to their Product Brands, in terms of
“Detractors” values, was greater than that of “Promoters” for almost all the brands in all the categories,
when averaged together for the ten year period. Thus the growth of “No Brand Preference” is broad
scale and pervasive among all these food store stocked brands. This is, and should be, a very disturbing
finding for all brand managers no matter what brand they represent or in what field.

9
In a majority of the 1,526 individual Product Brands, when compared to the scores of the retail
Store Brands, the preference for the individual Product Brand was consistently lower than it was for the
Store Brand. The aggregated data in Table 1 clearly points that out. Thus, it is clear that the responding
consumers in these ongoing studies, place more faith in the Store Brand, and are more willing to
recommend it to others, than they were for the Product Brands which are stocked in those same stores.
This issue of store loyalty vs. brand loyalty has been a recurring theme in both academic and practitioner
research for some time. (Keller, 1998; Kumar, 2008) This finding does clarify considerably the unresolved
question in the literature about whether there has been, or whether there still is, a major shift among
consumers in terms of Product Brand loyalty versus Store Brand loyalty. From this data, it appears
consumers are placing more brand faith in the retailer, that is, letting the retailer make the first level
brand decision for them, and then selecting from the product shelf array available when doing their
actual shopping. Tables 2 and 3 support that view.
Table 2 Goes About Here
Top Leading Brand Categories
In Tables 2 and 3, all category and brand data in the analysis has been aggregated into quintiles
for easier analysis and explanation. In Table 2, the quintile with the Product Brand category showing the
highest share of brand preference (in this case, the share of brand preference was calculated by
summing all consumer Brand Product mentions in each category and then ranking those findings to
identify the brand with the most mentions, thus creating the share of brand preference used in this
analysis). Thus, the brand shown in the chart is the one with the highest number of mentions in the
brand category. Using the 73 product categories, the five deciles created. Those came from the 14
Product categories in the highest and lowest quintiles and 15 Product categories in each of the other
three, i.e., the middle deciles.
In Table 2 (above) this first decile consisted of 14 product categories. The leading brand, in
terms of share of preference in each of the product categories, is shown in the Table. In this case, Clorox
is the leading brand in the Bleach category with a “brand preference share” of 42.01%. (Note: this brand
preference share is based on consumer responses to the CIA-MCS questionnaires, not on actual
marketplace sales) The Clorox share of customer preference declined by -3.36% over the ten year study
period. The Store Brand, where the Clorox product was purchased, had a much lower share of customer
preference, on average 8.61%, but, the Store share of consumer preference by mention, increased by

10
+4.95% during the decade. That, we believe, demonstrates a decline in Product Brand preference for
Clorox, being replaced by a growth in customer Store brand preference. What is most interesting in this
example; however is that the No Brand Preference rating was almost the same as that of the Clorox
Brand, i.e., Clorox = 42.01%, No Brand Preference =40.21%. In other words, there were almost as many
respondents who said they had No Brand Preference in the Bleach category as said the preferred Clorox.
More important, however, is the fact that No Brand Preference grew in customer choice over the
period, while the Clorox brand preference was declining, i.e., Clorox AGR = -3.36%, No Brand Preference
+4.15%.
Similar comparisons can be made with other Product Brands and Store Brands and the No Brand
Preference ratings in Table 2. Only three of the 14 Brands in this quintile increased their share of brand
preference over the ten year period…..Kleenex in Facial Tissues, Gatorade in Sports Drinks and Charmin
in Toilet Tissues. In all three of those instances, No Brand Preference actually declined when compared
to preference for the brand, i.e., -2.71% for the Kleenex category, -1.15% for the Gatorade category and
-4.78% for the Charmin category. Thus, there is evidence that, while on average, all brands are declining
in terms of share of brand preference in the CIA-MCS data, some brands have been able to maintain,
and even increase, their consumer franchise. These anomaly brands are ones that should be further
studied to determine how they were able to accomplish that feat.
Even in the Product Brands where growth occurred, not all the findings are positive. For
example, in the Sports Drink category, 61.20 % of the respondents said they had No Brand Preference in
that category. Thus, while Gatorade is the dominant brand, a majority of the consumers say they simply
don’t have a strong enough brand preference to encourage them to buy Gatorade or any other branded
Sports Drink, opting instead for No Brand Preference. Overall, consumers seem to be increasingly
ambivalent about brands in this and other product categories as well.
Table 3 shows the reverse side of the Product Brand Loyalty coin. This summary calculation
shows those Brands in the quintile which have the lowest share of brand preference for the individual
Brands by category across the entire study.
Table 3 Goes About Here
Lowest Leading Brand Categories
All the Product Brands shown in Table 3 have brand preference shares of less than 7% in the
category. (Recall, in this study that means the brand was the one that received the most mentions in

11
that category and the number is the percentage of all mentions.) Some of these low brand preference
scores in various categories may be the result of the fact that there are multiple brands competing in
that category and thus, no single brand stands out. Alternatively, it may well be that the Brands in these
categories are more specialized, i.e., patent medicines, hair coloring and rinses, and baby products and
thus appeal to a more limited number of customers since they are likely infrequently purchased.
Whatever the reason, however, it is clear that, in spite of the substantial amounts of money that have
and are still being spent promoting the brands in these categories, little brand preference has been
developed. While the Brands are well known and easily recognized by the consumer, such as Gerber,
Stouffers, Oil of Olay, Clairol and the like, they have not created sufficient consumer demand to
overcome the consumer vote of “No Brand Preference” in their particular product category. In fact, in
almost all No Brand Preference ratings, the scores are in the 70% to 80% range. And, for the most part,
the AGR of No Brand Preference is continuing to grow.
What is interesting in this analysis, however, is the much lower Store Brand market share
compared to that found in Table 2. In this quintile, many Store Brand categories fall in the single digits,
and in almost all cases, they have been declining over the survey period. One of the reasons for these
low Store Brand scores may well be that the food store is not the primary retail outlet for these Product
Brands; for example, the consumers may well be using drug retailers or discount outlets as their primary
purchasing locations for these categories and brands. That finding raises an interesting question: while
Product Brand managers commonly value broad retail brand distribution, and see it as a marketplace
advantage, the CIA-MCS data seems to say that the broader the distribution base, the lower the Brand
preference at retail and the higher the No Brand Preference in the food/grocery stores where the brand
is stocked. This is a most interesting finding and one that deserves future research attention.
When these findings are broadly extrapolated, it means that the methods and approaches
historically used to define and measure brand value likely need to be re-thought. Several other
researchers have raised these same issues so there seems to be convergence of this idea.
While there is support for our premise that Product Brand preference is indeed declining, it is
important to determine if that is on an individual brand basis or more widespread across all the 1,526
brands studied. Tables 2 and 3 clearly show the decline of Product Brand Preference in many categories
but, the aggregated data is likely more relevant to support the proposition presented in this paper.
Therefore, we aggregated all the 1,526 brands in the 73 individual product categories identified in the
CIA-Monthly Consumer Study data and used that to construct our findings. We further aggregated all

12
the NPS findings for individual retailers in a separate file. We then merged the two. The result is the
aggregated report shown as Table 4 below.
Table 4 Goes about Here
Leading Share Quintiles Categories
As shown, using quintile analysis, five basic product groups were created. As before, those were
done by using the leading Product Brand share of brand preference for the top brand in each of the 73
product categories. The Product Brand Share of was then used to create an array of Product Brands with
the highest product brand preference share in the top quintile (#5), with the others following in
descending order. We thus created 15 product categories in each of the three middle groups and 14
product categories in the first and last quintiles, for a total of 73.
The quintiles were then arrayed based on the descending mean score of the Product Brand
Preference score within each of the categories. As shown, quintile #5 (the top quintile) had an average
mean Product Brand share of 31.22% while the lowest Product Brand quintile had a mean Product Brand
share of only 5.25%. We further calculated the AGR (Average Growth Rate) for all the brands in the
Product Brand quintile. In each case, over the ten year period, as shown, all declined. We did the same
for the Store Brand during the reporting period. While the mean Store Brand preference score on
average was much lower, in the top two quintiles, the Store Brand did indeed grow over the decade.
What is most interesting about these calculations is that of No Brand Preference. In all five quintiles, No
Brand Preference was above 40% in overall share of preference with decile #1 registering 68% based on
consumer rankings. That was higher in preference share than any Product Brand share of preference.
Most importantly, however, is that in all five quintiles, the No Brand Preference AGR increased over the
ten year measurement period, in one case, that of the highest Product Brand quintile, by nearly +3%.
Clearly, based on this longitudinal analysis, Product Brands seem to be in trouble. Their brand
preference scores, as reported over time, are declining. Store preference, as indicated by the NPS scores
seems to be growing but, most importantly, the overall surge in the customer’s choice of No Brand
Preferences does not augur well for Product Brands
Analysis of Specific Product Categories: To get a clearer sense of what is happening in individual
categories, we chose three categories at random for further analysis. Specifically, we picked one
category from each of the food, personal care and OTC pharmaceutical businesses. Most consumer
packaged goods companies compete in these three areas and, hence, it is important to determine if our

13
cross-category findings hold at the individual category level too. We picked the cereals category from
the foods business, cosmetics category from the personal care business and OTC allergy medicines
(syrups) from the OTC pharmaceutical business. We computed the brand preference share for product
brands in these three categories as explained before. We did, however, simplify the data by only
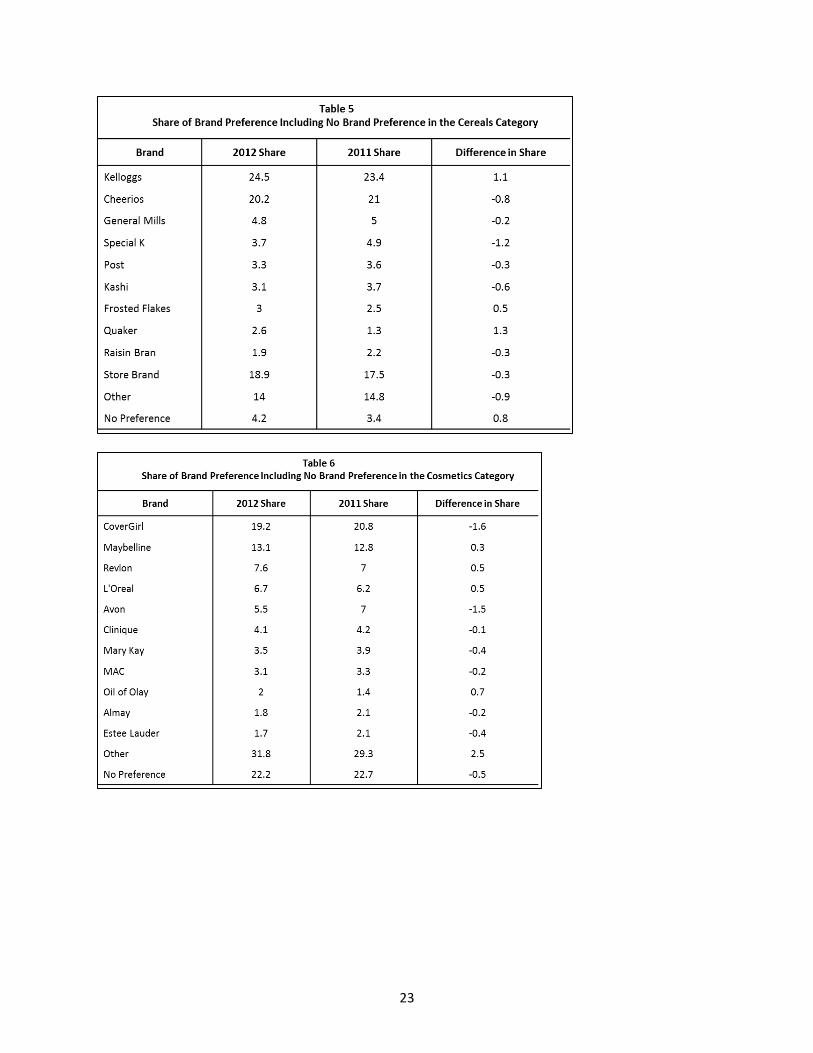
reporting the findings for 2011 and 2012 in the explanation. The results are shown in Tables 5, 6, and 7.
Tables 5, 6 and 7 go about here
Share of Brands and No Preference for Cereals, Cosmetics and OTC Allergy Medications
We can observe from Table 5 that the share of all the brands in the cereals category has seen
little change. However, the share of No Brand Preference has gone up from 3.4% in 2011 to around 4.2%
in 2012, an increase of nearly 25%. The market share for No Brand Preference in the cosmetics category
is even more disturbing. (Table 6). While “Other” makes up 31.8% of category mentions, No Brand
Preference is the most frequently mentioned option in this category with a mention share of 22.2% in
2012. This is indeed surprising in a category where all are well supported global brands such as Revlon,
L’Oreal and Oil of Olay. The OTC allergy medication category reveals similar results. No Brand Preference
has a preference score share of 13.7% in 2012, an increase of nearly 30% over its preference score share
in 2011. And most brands in this category have either witnessed a drop in their preference score shares
or registered only modest gain at best.
We should also note there that the responses to manufacturer brand preference generated a
substantial number of “store brand” and “other brand” preference choices by consumers in addition to
the “no brand preference”. When these are combined, they commonly outdistance consumer
preference for any of the individual brand preferences reported. That can be clearly seen in Tables 5, 6
and 7.
To summarize, it seems that the No Brand Preference option is already dominant in certain
categories and gaining momentum in others. While a key objective of a branding strategy is to
differentiate the brand in a meaningful way from competition, we find that consumers simply are quite
dispassionate about current branding efforts and are increasingly choosing the No Brand Preference
option. The findings of this study will likely meet with much opposition from branding advocates,
particularly those who prefer verification of their views through attitudinal studies such as brand
tracking studies. We therefore took another step to help validate our findings.

14
Brand Keys Data Analysis: In the consumer products field, Brand Keys, the brand consulting
organization, has been conducting their Customer Loyalty Engagement Index for the past sixteen years.
Their annual study covers 39,000 consumers in the U.S. They say: “Brand Keys identified 11 product
categories, mostly CPG (fmcg) where the value of the brand or emotional brand value has decreased. It
is the first time we have seen such consumer reaction.” (Passikoff, 2013) We are grateful to Brand Keys
for providing us the Engagement Index measures for brands in the three categories mentioned above
from 2004 to 2013.
We use the engagement index for each brand in each of the 3 categories for the analysis. The
findings from this data are straightforward yet insightful (Table 8). We find that the average engagement
index for each category has not seen much change from 2004 to 2013. This is perhaps due to the fact
that the index for each brand is relative to an ideal or exemplar for the category and this has not seen
much change. However, we find that in each category there is a significant reduction in the variance of
the engagement index for different brands. For instance, the variance in the engagement index for the
cereals category fell from 28.05 in 2004 to just 3.29 in 2013. Similarly, the variance in the engagement
index for brands in the cosmetics category too has witnessed a sharp fall, from 41.24 in 2004 to just 2.81
in 2013. Finally, the OTC allergy medicines category has also witnessed a significant drop in the variance
of the engagement index from 20.67 in 2004 to 9.60 in 2013. Other summary statistics also reveal
similar results. For instance, the index range for each category, calculated as the difference between the
highest and the lowest indices for that category, has shrunk over time as well. The range of the
engagement index in 2013 compared to that in 2004 has decreased by nearly 68% for cereals, for
cosmetics by 76% and for OTC allergy medications by 25%.
The steep decline in the variance and range of the engagement index across categories strongly
suggests that brands are not as significantly differentiated from each other in 2013 as they were in 2004.
It definitely seems that consumers are beginning to evaluate all brands in a category in a similar fashion.
Categories now have fewer exemplars than before, and brands are now simply synonymous with the
category with few or no differentiating features. These findings provide an interesting backdrop to
results from the BAV Consulting data analysis which is described below.
Table 9 goes about here
Summary Statistics for Customer Loyalty Engagement Index
BAV Consulting Data Analysis: BAV Consulting has been conducting consumer studies of brand impacts
on business metrics such as pricing, loyalty and P/E ratios since the early 1990s. They collect 75 metrics

15
on 40,000 brands in 50 countries each year. Thus, they have one of the largest and most complete
brand databases in the world. Their most recent study findings confirm that brand value is indeed
declining. (Gerzema, 2013) In this study we use two important metrics of brand value as conceptualized
by BAV Consulting, namely ‘Brand Strength’, which is considered a measure of future growth value and
‘Brand Stature’ which is considered a measure of current operating value. While the BAV Pillars
Differentiation and Relevance drive Brand Strength, the Pillars Esteem and Knowledge drive Brand
Stature. We are grateful to BAV Consulting for providing us data on Brand Strength and Brand Stature
measures for brands in the three categories mentioned above for the period 2002 to 2012.
For each of the three categories, we tracked Brand Stature and Brand Strength scores for
different brands over time. We used these measures as bases and plotted the various brands by year on
a positioning map. Figure 1 provides information on how BAV Consulting classifies the four quadrants of
a positioning map with Brand Stature and Brand Strength as the axes. In the interest of brevity, we
include the plots for four of the eleven years that we have data for - 2002, 2006, 2010 and 2012. The
plots for the cereals category are in Figure 2, the cosmetics category in Figure 3 and the OTC allergy
medicines category in Figure 4. The dots in each plot indicate the coordinates i.e., Brand Strength vs.
Brand Stature, for different brands in the category. The plots reveal that the movement of brands in all
the three categories is remarkably similar and provide two interesting insights.
Figures 1, 2, 3 and 4 go about here
First we observe in all three of the categories, the distance between brands on an average was
greater in 2002 than in 2012. Further, overall brands occupied a larger competitive space in 2002 than
they did in 2012. The plots for the intermediate years 2006 and 2010 clearly reveal how consumers have
changed their perception of these brands over time. Second, we observe that most brands in 2012
occupied those quadrants which would be termed ‘unfocused’ and ‘fatigue’ in 2002. This suggests that
most brands are worse off in 2012 for both current operating value as measured by Brand Stature and
future growth value as measured by Brand Strength as compared to 2002. To summarize, it seems that
brands are not only less differentiated from each other in the eyes of the customer, but, are also
generating less value to customers than they have in the past.
Table 9 goes about here
Coefficients obtained from Agglomeration using a Hierarchical Cluster Analysis

16
To conduct a more rigorous examination, we carried out a cluster analysis of these BAV studies
in the three categories. The results from a hierarchical clustering process for cereals, cosmetics and OTC
allergy medicines are shown in Table 9. In this technique, a significant jump in the coefficients obtained
from agglomeration of the brands suggests the presence of a cluster. The highlighted (bold) coefficients
in Table 9 indicate that the number of clusters for cereals has dropped from five in 2002 to two in 2012,
for cosmetics from six clusters in 2002 to just one cluster in 2012, and for OTC allergy medicines from
four clusters in 2002 to two clusters in 2012. The results support our argument that brands are now
huddled much closer to each other than they were in earlier, i.e., they are less and less different and
more and more similar. In fact, the presence of only one cluster in the cosmetics category, which
comprises of both mass market and premium brands in our data, is surprising to say the least. In
cosmetics, where it is assumed brand differentiation is the key goal of the marketer, whatever is being
done seems to be failing.
Other clustering techniques produced similar results. We used a K-means clustering technique
to forcibly split the brands in the cereals category into two clusters from 2002 to 2012. We then
obtained the cluster centers and found that the distance between the clusters shows a decreasing trend
over time (Figure5). We therefore again find support for our notion that brands today are positioned
more closely to each other in the eyes of the customer than they were a decade ago.
Figure 5 goes about here
Decreasing Distance between Clusters in the Cereals Category over Time
Discussion and Implications: The past decade has witnessed significant shifts in the way business is
conducted and how consumers make choices. Easier access to international markets and the rise of Web
2.0 technologies are just a few examples of such changes in the market place. Therefore, the main
objective of this study was to examine whether consumers’ preference for manufacturer national
brands today is as strong as it was, say a decade ago. Interestingly, our initial findings from a large-scale
survey indicated that there is a decreasing preference amongst consumers for manufacturer national
brands which are generally regarded as high equity brands. However, a more interesting finding was
that there is an increasing preference among consumers for the No Preference option. This was found
across a large number of product categories.
In order to validate and explain these results, we used two other data sources namely the
Customer Brand Loyalty Index from Brand Keys and also measures of current and future brand value

17
from BAV Consulting. The use of alternate measures and the employment of different methodologies
did not alter the result. We found in both these data sources that consumers increasingly evaluate
different brands in the category as being more and more similar. In other words, brands are operating in
a much smaller competitive space and thus, consumers are finding it increasingly difficult to
differentiate one brand from another. The result? Commoditization seems to be developing in spite of
the increased spending by some brands in traditional media and the increasing focus by others on new
marketing and branding techniques such as the use of social media. In short, most brands, and
particularly those in the three categories which used data from three sources, find that the risk of being
appraised by consumers as commodities is very real, high and growing higher.
The short-term and long-term implications for marketers who face decreasing levels of brand
preference are huge. In the short-term, brands have to spend more on tactical marketing efforts, say
promotions, to incentivize customers to switch from other brands. However, it seems reasonable to
assume that competition will also engage in such activities. Therefore, it appears such short-term
marketing efforts would not only be inefficient, but,, most likely also ineffective. From a long-term
strategic point of view, the clustering of brands and consequent brand switching behavior makes it
difficult for marketers to identify and separate out specific target markets. Without a clear
understanding of customers, it would seem to be increasingly difficult for brand managers and their
agencies to craft effective, much less efficient, long-term brand strategies. As is evident from this study,
it already seems that investments in brand building efforts have failed to effectively influence the
consumer and have paid little dividends to this point. Such failures in turn are bound to affect long-term
performance measures. In an era where accountability for marketing efforts is paramount, the
increasing trend of No Brand Preference in multiple categories would appear to pose serious risks to
marketing’s and branding’s credibility.
While the aim of this study was to provide concrete evidence of consumers increasingly
choosing the No Brand Preference option, more work needs to be done to understand why consumers
evaluate all brands in a category similarly. Presumably, several factors could lead to this outcome. For
instance, future work can look at whether an increasing number of firms, products and line extensions in
the market place have led to a downfall for the category as a whole. Future work can also examine
whether shorted reaction times by competitors and introduction of incremental innovations have led to
similar and perhaps lower evaluations for brands in the category. An important line of future research
should likely focus on the changes, not only in the marketer’s media mix but also on the radical changes

18
in consumer use of various media forms, i.e. the decline in the use of traditional media and the growth
digital and social media forms. Consumers today have easier access to brands and their network of
friends and acquaintances through digital media. Sharing information is much easier today than it was a
decade ago, and it’s possible that consumers, who are now better informed, evaluate all the brands in a
category in similar ways. Or, it may be with the ease of social media; those evaluations have taken on
radically different approaches and models. The results from these types of studies would definitely
further our understanding of how consumers evaluate firms’ marketing efforts and their branding
strategies.
One thing does seem clear from this analysis of brand preferences…..they are declining and they
are radically changing. Thus, the traditional methods of understanding and measuring brands may no
longer be adequate or even relevant. If the brand is one of the major assets of an organization, as many
of the brand valuation groups suggest (see Brand Finance (brandfinance.com), Interbrand
(Interbrand.com), Millward Brown (millwardbrown.com) then, what is being done with brands and
branding is simply not working with customers and consumers. That in and of itself, would seem to
demand greater attention to how brands are built and maintained.

19
References:
Aaker, David A. (1996) Building Strong Brands, (New York, NY: The Free Press)
Aaker, D. A. (2009), Managing Brand Equity, www.SimonandSchuster.com
Arrow, Kenneth J., Karlin, Samuel and Scarf, Herbert, (1958) Studies in the Mathematical Theory of
Inventory and Production, Stanford Press, Stanford, CA
Bickle, M (2012a) http://blogs.forbes.com/people/mariannebickle/
Bickle, M (2012b) the Changing American Consumer, Prosper Publishing, Worthington, OH
Brand Finance (2012) www.brandfinance.com
Cobb-Walgren, C. J., Ruble, C. A., & Donthu, N. (1995) Brand equity, brand preference, and purchase
intent. Journal of Advertising, 24(3), 25-40.
Core Brands, (2013) http://www.corebrand.com/news-views/news/712-pr-news-helping
David, A. (1992), the Handbook of Brand Management, Basic Books
Dolich, I. J. (1969), Congruence relationships between self-images and product brands. Journal of
Marketing Research, 80-84.
Friedman, Milton, (1957) A Theory of Consumption Function, Princeton University Press, Princeton, NJ ir
Gerzema, John (2013) from personal correspondence from John Gerzema, CEO, Y&R BAV Consulting,
March 7, 2013
Havas Media (2013) www.havasmedia.com/meaning-fulbrands
Hoeffler, S., & Keller, K. L. (2003), the Marketing Advantages of Strong Brands, the Journal of Brand
Management, 10(6), 421-445.
Interbrand (2012) http://www.interbrand.com/en/Default.aspx
Kapferer, J. N. (2012). The new strategic brand management: Advanced insights and strategic thinking.
Buy now from Kogan Page.
Keller, K. L. (1993). Conceptualizing, measuring, and managing customer-based brand equity. The
Journal of Marketing, 1-22.
Keller, K.L. (1998), Strategic Brand Management: Building, Measuring, and Managing Brand Equity,
Upper Saddle River, NJ: Prentice-Hall
Keller, K. L., Parameswaran, M. G., & Jacob, I. (2011), Strategic Brand Management: Building, Measuring,
and Managing Brand Equity, Pearson Education India

20
Kumar, V (2008), Managing Customers for Profit. Upper Saddle River, NJ: Wharton School Publishing
Jamhouri, Oscar (2013) from personal correspondence from Oscar Jamhouri, Founder & Chief Executive
Officer of Integration® Group of Companies, May 30, 2013.
Lavidge, R. J., & Steiner, G. A. (1961), A Model for Predictive Measurements of Advertising effectiveness,
The Journal of Marketing, 59-62.
Millward Brown (2012) http://www.millwardbrown.com/Home.aspx
Modigliani, Franco and Brumberg, Richard (1954) Utility Analysis and the Consumption Function: an
Interpretation of Cross-Section Data” Post-Keynesian Economics, ed by Kenneth K. Kurihara (New
Brunswick: Rutgers University Press, pp. 383-436
Oliver, R. L. (1999). Whence consumer loyalty? The Journal of Marketing, 33-44.
Owen, Richard, and Laura Brooks (2009), Answering the Ultimate Questions: How Net Promoter Can
Transform Your Business, San Francisco, CA: John Wiley and Sons, Jossey-Bass
Passikoff, Robert (2013) personal correspondence with Robert Passikoff, CEO, Brand Keys, Managing
Director, 6 March, 2013
Prosper Business Development (2012) http://www.goprosper.com/
Reichheld, Fredrick F. (2003), "The One Number You Need," Harvard Business Review, 81
(December), pp.46-54
Reichheld, Fredrick F. (2006) the Ultimate Question: Driving Good Profits and True Growth. Cambridge,
MA: Harvard Business School Press
Satmetrix (2012) http://www.satmetrix.com/
Schultz, D.E., Block, M.P (2010) “Retail communities: Customer-driven retailing”, Worthington, OH:
Prosper Publishing
Schultz, D. E., & Block, M. P. (2011), Understanding Customer Brand Engagement Behaviors in Today's
Interactive Marketplace, Micro & Macro Marketing, 20(2), 227-244.
Schultz, Don E. and Martin P. Block (2012) Re-Thinking Brand Loyalty in an Age of Interactivity,
presented at the International Conference on Research in Advertising (ICORIA), Stockholm, Sweden
Schultz, Don, E. and Martin P. Block (2013) Killing Brands…Softly, Journal of Brand Strategy,
Forthcoming, Vol. 2 No. 3
Stafford, J. E. (1966). Effects of group influences on consumer brand preferences. Journal of marketing
Research, 68-75

21
Zeithaml, V. A. (1988). Consumer perceptions of price, quality, and value: a means-end model and
synthesis of evidence. The Journal of Marketing, 2-22.

22
23

24

25

26

27

28