Embed Size (px)
Citation preview
Pakistan Journal of Commerce and Social Sciences
2017, Vol. 11 (3), 1027-1049
Pak J Commer Soc Sci
Brand Image and Customers’ Willingness to Pay a
Price Premium for Female’s Stitched Clothing
Saad Munir (Corresponding author)
COMSATS Institute of Information Technology Vehari, Pakitan
Email: [email protected]
Asad Afzal Humayon
COMSATS Institute of Information Technology Vehari, Pakitan
Email: [email protected]
Munir Ahmed
COMSATS Institute of Information Technology Vehari, Pakitan
Email: [email protected]
Sajid Haider
COMSATS Institute of Information Technology Vehari, Pakitan
Email: [email protected]
Noor Jehan
Department of Economics, Abdul Wali Khan University, Mardan, Pakistan
Email: [email protected]
Abstract
The aim of the present study is to better understand customer’s willingness to pay a price
premium in the market for female’s stitched clothing and what sort of brand images can be
used by a brand in order to achieve price premium. This study is based on quantitative
survey of brand images found in branding literature and their impact on customer’s
willingness to pay a price premium for branded female’s stitched clothing. This study
applies regression analysis to find out the strength of the role of brand image dimensions
towards willingness to pay price premium, using data collected from 409 university level
female students. The outcome of the present study demonstrates that perceived uniqueness
is the strongest predictor, perceived social image is the second strongest, perceived
corporate social responsibility is the third strongest predictor, perceived awareness is the
fourth strongest predictor, perceived quality is the fifth strongest predictor, perceived
country of origin is the last strongest predictor of customer’s willingness to pay a price
premium. This study looks into other branding related dimensions to check price premium
rather than actual price premium determinants. The outcomes aid brand managers to be
aware of the significance of incorporating price premium and to build up an improved
perceptive of what brand images dimensions coerce price premium.

Brand Image and Customers’ Willingness to Pay a Price Premium
1028
Keywords: customer’ willingness, price premium, brand image, perceived uniqueness,
perceived social image, perceived corporate social responsibility, perceived awareness,
perceived quality, perceived country of origin.
1. Introduction
The fashion industry of Pakistan is progressing on rapid pace and increasing the entrance
of females clothing brand in the market. This is also due to the increased awareness among
women regarding use of stitched branded clothes. Naturally women’s want to outstand
among others by the use of branded and famous clothes brands. The female clothing brands
of Pakistan attract females not only in the local market but in the international market also.
In a market of females stitched clothing brands price competition is rapidly increasing.
Verhoef et al, (2002) stated the reason that has contributed to make the competition more
intense is that retailers by looking at the trends have created brands and then market these
owned brands. Pakistan is a dynamic country. People here love to wear trendy clothes.
Instead of having low purchasing power they buy trendy local brands cloths for functions,
on occasions, in universities etc. Pakistan is pretty famous for textiles in the whole world.
Pakistan produces export quality textile products. There are well established Pakistani
brands the people usually prefer to buy such as Warda, Khadi, Chen One, Gul Ahmad,
Alkaram Studio, Junaid Jamshed, Sana Safinaz, and Dinner’s, Uniworth etc. Every brand
is trying to offer such offerings to its customers that can increase customer’s willingness
to pay price premium. But the biggest problem which is faced by most of the customers in
a Pakistani environment is price.
Price factor is extremely important and is being developed by the image of certain brands
in well and effective manner and it includes awareness, quality, uniqueness, CSR, social
image and country of origin (Anselmsson et al., 2014). These are the determinants of brand
image; this study will explain their impact on customer’s willingness to pay price premium.
Further it is extremely important to find out that which variable is most important or
worthwhile for the customers when they decide to buy branded cloths, so they could be
able to focus on that particular variable more than others to generate higher profits and
maintaining lower marketing cost. There is an idea that a brand can create a differentiated
position and this advantage poses by one brand over others motivates the consumer’s to
pay more.
This research will highlight the determinants that could help to create differentiation in the
brand. This will help the brand managers of all three selected ones to prioritize their options
to strengthen their brands. In the present study three brands are selected due to their fame
and due to their presence in the top list. As (Khazana, 2016) stated that Gul Ahmad,
Alkaram Studio, and Warda are the top brands that females usually tend to buy. Being more
specific the main aim behind this study to recognize the forces in the wake of customer’s
willingness and customers unwillingness to pay price premium in the market of female
stitched clothing. These determinants generally used to find out customers willingness to
pay price premium for food products (Anselmsson et al., 2007). This model is being used
in present study to see customer’s willingness to pay price premium for female stitched
clothing in context of university level female students of southern Punjab, Pakistan.
It is the point to be noted that in this study real prices of the products are not reflected with
the willingness of the customers’ to pay a price premium. Price premium is relevant also
for the brands that are having low cost for which the customers are more willing if

Munir et al.
1029
compared to other high cost brand. In the theory of branding price premium seems of
having a vital place. There is a little empirical and systematic research that what particular
brand image elements can construct price premium. The same is applied to the markets
other than consumer packaged food. For the managerial point of view, better understanding
of images having strong impact on willingness of the customers’ to pay a price premium
could have positive impact on competition, innovation and variety. This study could have
a significant impact on the district in a way that these brands could set up branches in
Southern Punjab instead of giving rights to local outlets for limited product selling. This
study will fill this information gap of the clothing market of Southern Punjab.
2. Hypothesis Development
Brand Image for Female’s Stitched Clothing and its Impact on Price Premium
2.1 Awareness
Brand awareness refers to whether consumers can evoke or identify a brand, or merely
whether or not consumers discern about a brand (Keller, 2001). Brand is company’s asset
and with the passage of time it has received enormous attention and importance by the
managers. Awareness can be defined as it is reflected in to the customer’s ability to identify
the brand under different circumstances (Keller, 1993). Hoyer and Brown (1990) defined
brand awareness as a rudimentary level of the brand knowledge that involves at least
recognition of the brand name.
Consumers will contain a higher purchase intention with a known brand (Kamins and
Marks, 1991). A well-known brand will have a higher purchase intention than a less well-
known brand (Hsu, 2000). Brand awareness can assist consumers to distinguish a brand
out of a product category and make a decision to purchase (Percy and Rossiter, 1992).
There is an important role of Brand awareness on intention to purchase because consumers
are likely to buy an identifiable and well known product (Keller, 1993). Hoyer and Brown
(1990) stated that a Brand awareness does have an immense sway on choosing of the
products and there may be a past thought foundation in a product class. Brand awareness
as well acts as a serious part in the user aim to purchase, and some brands build up in users
mind to control consumer choice to purchase. A product having an elevated intensity of
brand awareness will be given superior customer preferences because it has superior share
in market and superiority assessment (Grewal et al., 1998).
Awareness can be viewed as brand equity building important pillar (Aaker, 1996). In the
studies of Anselmsson et al., (2007); Yoo and Donthu (2001); Cobb-Wahlgren et al., (1995)
awareness is found to have influence the response of customer’s to be positive towards the
brands. So the researchers’ consequently assumed that the awareness has constructive
impact on customer’s willingness to pay price premium.
H1: Perceived Awareness have a positive impact on customer’s willingness to pay
price premium
2.2 Quality
Brand quality is defined as the acknowledgment of product quality, which has a control on
consumer buying behavior. Brand quality effect on brand purchase intention has been
validated in many presented studies (Chepchirchir et al., 2015) recommended that higher
quality observations prompt to expanded benefits because of premium prices and over the
Brand Image and Customers’ Willingness to Pay a Price Premium
1030
long haul, to viable business development, including both market extension and share gains
of a market.
Garvin (1984) has defined the quality in five different ways such as quality is fitness for
the purpose, quality is something that cannot be defined but recognized, specification
conformance is quality, quality is tied to the inherited product characteristics, and most
importantly quality can be defined as the amount of the customer’s willingness to pay for
it. Perceived quality can be defined as the judgment of the customer’s about the overall
product’s Excellencies and superiorities (Zeithaml, 1988). The product and services of the
highest quality increases the profitability and financial performance of the company
(Chowudhury, 2012).
Furthermore, perceived quality is a relative idea which possesses situational, comparative,
and character attributes. Perceived quality shall be affected by reasons suggestive of prior
expertise, level of education, and risk that is perceived and variables effects the situation
corresponding to purchase reasons, purchase predicament, time pressure, and social
background from buyers (Holbrook and Corfman, 1985). Moreover, perceived quality is a
client subjective judgment on product quality, and she or he will assessment product quality
from their earlier experiences and feelings.
Zeithaml, (1988); Keller, (1993); Aaker, (1996) stated that perceived quality is a subjective
mental thought that exists in clients' wits and contrasts from target quality by having a
higher level of reflection. Perceived quality is a salient concept in the general markets
literature. There is a direct relationship between perceived quality and price premium
(Netemeyer et al., 2004).
H2: Perceived Quality is positively related to customer’s willingness to pay price
premium
2.3 Corporate Social Responsibility
The first definition of the CSR was declared by Bowen in the year of 1953, is well thought-
out to be the CSR founder, he describe Corporate Social Responsibility that “how society
desire companies to act according to those policies that improve the society as a whole”
(Carroll, 1979). Afterwards European Commission (2011) describes Corporate Social
Responsibility as “the responsibility of enterprises for their impacts on society” this
definition is then used by many authors to describe CSR. Broadly speaking corporate social
responsibility is concerned with the relationship between individuals, countries and their
government, and the global corporations. CSR can also be defined as a relationship
between corporate and local society where it is operating or located (Crowther and Aras,
2008). Corporate social responsibility can be described as a situation in which firm goes
beyond its own interest and law requirement to do some further social good (McWilliams
and Siegel, 2001). The premature extraction of corporate social responsibility can be traced
rear to 1917, as Henry Ford announce that the intend of Ford Motor company is that “To
do as much as possible for everybody concerned, to make money and use it, give
employment, and send out the car where the people can use it and incidentally to make
money” (Kumar et al, 2009).
The adaptations of CSR by the firms depend on two main issues. First is the concentration
of the competition in the market and the second is the degree to which the consumers are
willing to pay premium for corporate social responsibility (Bagnoli and Watts, 2003).
Munir et al.
1031
Fombrun and Shanley (1990) recognized that investing in CSR attributes and actions may
be vital fundamentals of product segregation and status edifice.
When the customer’s perceives that the firm is involved in social responsibility and do care
about their stake holders then the willingness to pay price premium for their brand finely
tuned (Anselmsson and Johansson, 2007; Bagnoli and Watts, 2003). Many studies related
to consumer behavior have looked upon how CSR influences customer’s (Nielsen et al.,
1998; Grunert et al., 1996). However listed researches didn’t communally supports acuity
to drive purchase behavior in all customers’ segments. So the researchers’ has assumed
that firms with positive CSR image positively influence customer’s willingness to pay price
premium.
H3: Perceived Corporate Social Responsibility is directly related to customer’s
willingness to pay price premium
2.4 Country of Origin
Country of Origin “COO” refers to a country that locally manufactures a product or brand,
design a product or brand, or assemble a product or brand (Essoussi and Merunka, 2007).
COO of a product can be defined as “the country of manufacture or assembly” (Bilkey and
Nes, 1982), recognized by “made in” or “manufactured in” labels (Nagashima, 1977).
Ahmed et al., (2004) defined country of origin as the country in which firms makes,
assemble, and manufactures its products. COO can also be defined as country where the
product is originally manufactured. Country of Origin also worked as intangible barrier for
imported products because of customer’s negative bias towards them (Al-Sulaiti and
Baker, 1998). A very large number of studies results are that evaluation of products by the
consumers and consumers buying intentions are related to the origin of the product
(Papadopoulos and Heslop, 2002).
Purchase decisions made by the consumers are based on an organized method of
acquisition, assessment and incorporation of product cue. A cue is defined as all
informational spur accessible to the customer earlier than utilization (Ahmed et al., 2004),
and it can be intrinsic or it can be extrinsic. Hong and Wyer (1989) stated that when
customers are offered with the Country of Origin cue equally with other cues, such as the
price and the brand, COO then affects the cognitive process of consumer’s and it can be
observed in two different ways: the halo effect and the summary construct. The country
image acts as a halo when consumers are not familiar with the country where the product
came from, it then effects directly the beliefs of consumer regarding these products. In
distinction, when customers are well-known with a country’s products, it leads to a précis
construct model work in which consumers deduce an image of a country from its product
knowledge. Furthermore, Papadopoulos and Heslop (1993) stated, consumer’s purchase
decision does get influenced by an image of a country. Especially, when there is a negative
image of the country of manufacturing, then a consumer might have a negative image of
the product made in specific country. Therefore, it is correct that the image of the country
of origin does play a vital role when a consumer makes a purchase decision.
Country of origin more or less is often associated with the quality of the product as
consumers may use country of origin as a benchmark to pay for a product rather than
quality because quality cannot be actually determined until the usage of product. Even
though consumers are provided with additional information on the product country of
origin is very significant in determining the consumer’s perception about the product (Lusk
Brand Image and Customers’ Willingness to Pay a Price Premium
1032
et al, 2006). Consumers will respond to a product favorably if it is bonded with the
favorable country of origin. Country of origin is projected to be a determinant of customer’s
WTP price premium in investigative qualitative study (Tikkanen and Va¨a¨riskoski, 2010).
H4: Perceived Country of Origin have positive effects on customer’s willingness to
pay price premium
2.5 Social Image
Important for the pricing policy of the products are image concerns and also intrinsic
motivation (Friedrichsen, 2013). A number of researches carry the assumption that the
individual always exhibits image hunting and status behavior (Anselmsson et al., 2014). In
the literature the specific image such as perception of users related to purchase or use of
certain brands are seen as a component of some importance certainly when equity of brands
is build (Keller, 2001). Brands allow the users to self-explain themselves, exhibits specific
dimensions of their selves (Ball and Tasaki, 1992). Likewise, concerns about status may
advance as a stability happening in circumstance where communications are harmonizing
in the unobservable capability of which position is an evident sign (Rege, 2008). In count,
icon apprehension has conservative considerable concentration in the perspective of pro-
social behavior. As ethical use have developed fashionable, new studies designate icon
apprehension in the wisdom that consumers’ buying manners is exaggerated by a craving
to emerge as a pro-social instead of signaling pure wealth. Complementary evidence on
social image concerns in ethical consumption is provided in (Griskevicius et al., 2010).
There are number of investigational studies that provide evidences on image concerns
continuation in the viewpoint of pro-social behavior. By assume that behaving pro-socially
bestow image positively, image-concerned individuals ought to perform more pro-socially
in public than in private (DellaVigna et al., 2012). Andreoni and Bernheim (2009) have
investigated the comparative significance of social signaling (effects when there is an
audience) versus self-signaling (effects when there is no audience). The results of the study
of Grossman (2010) have indicated that self-signaling does not cooperate a chief role but
social signaling corporate a major role and it is a related inspiration for a huge subsample
of individuals. Frackenpohl and P¨onitzsch (2013) conducted an experiment on the
willingness to pay and support self-image concerns in this experiment. They discover that
collection of private and public good augment the assessment for both the public and the
private goods. One of numerous details argued by the authors is self-image apprehension.
By design, concerns for social image cannot give explanation about their results as
selections are completed in private.
Persson, (2010) stated that different empirical studies suggested that social images
influences the buying behavior of customer’s for different consumer’s markets. Tikkanen
and Va¨a¨riskoski (2010) stated that Social image have been additionally appeared as a
price premium determinant for food brands and it is also drives price premium for other
consumer markets (Sethuraman, 2000).
H5: Perceived Social Imags have a direct impact on customer’s willingness to pay
price premium
2.6 Uniqueness
Uniqueness can be defined as an extent to which customer’s feels that brands is different
from the other competing brands (Netemeyer et al., 2004). In this study, perceived
uniqueness can be defined as the degree to which customers view the product as dissimilar
Munir et al.
1033
from other products in the identical category. Consumers’ need for uniqueness can be
defined as the trait of pursuing differentness relative to others through the attainment,
consumption, and disposition of consumer goods for the purpose of developing and
enhancing one’s self-image and social image (Tian and William, 2001). Each individual is
distinctive (Ghazali et al., 2008) and individuals might desire to distinguish themselves as
dissimilar as compared to others (Kumar et al., 2009).
The concept of consumers’ need for uniqueness derive from Snyder and Fromkin’s (1977)
theory of uniqueness. This theory states that, the need to see one as being dissimilar from
other persons is aroused and competes with the other motives in situations that menace the
self-perception of uniqueness (i.e., those situations in which people see themselves as very
closely similar to others in their social surroundings). Individuals endeavor to regain their
self-esteem and condense pessimistic affect through self-distinguishing behaviors. They
also found it that it is rational to consider that different kind of people show varying degrees
of need for uniqueness in comparable circumstances and this surely can have a significant
impact on their purchase decisions. This lexis of uniqueness is wanted in diverse
appearance and channels where the social consequences for being different are not harsh.
Material lexis of one’s differentness from others is mainly cherished for the reason that
they please the need for uniqueness devoid of possibly strict social consequences (Snyder,
1992). Persons whose need for uniqueness is very high, they have a propensity to agree to
latest products and brands more rapidly that are related to the fashion business where
tendency and styles are constantly changing (Bertrandias and Goldsmith, 2006).
There are recent studies in the marketing literature that make it appear that consumers
purchase intention could be affected by the need for uniqueness. Consumers’ need for
uniqueness has significant positive impact on their purchase intention (Tavikkai and
Jirawattanaukool, 2010). Also, in brand equity theory, uniqueness is the primary, as the
extent of uniqueness in a brand’s links, jointly with the favorability and vigor of these links,
establish its equity (Keller, 1993). In preceding empirical studies, there is an association
among uniqueness, price premiums and loyalty. It has been statistically established
(Netemeyer et al., 2004).
H6: Perceived Uniqueness is positively related to customer’s willingness to pay price
premium
2.7 Price Premium
A brand acquire a price premium while the sum that clients will pay for items from the
brand is superior than the sum they will pay for practically identical items from other
related brands. It can also be stated as that a brand has a price premium, when the
consumers are prepared to pay for the items or services from a brand is higher than the total
they are charming to pay for comparative offerings from different brands (Aaker, 1996).
Various investigators such as Netemeyer et al., (2004); Bondesson (2012) and Adhikari
(2015) treated the price premium as mean of brand strength. In this research determinants’
of price premium are used to find out that consumers of stitched clothing focus high to low
on which determinant to pay price premium.
The importance of loyalty has been well-acknowledged in the literature of having a
relationship with willingness to pay price premium (Casidy and Wymer, 2016). These
brand image determinant may also have positive relationship because these images have a
positive impact on customers increasing loyalty. Theoretically, quite a few writers explain

Brand Image and Customers’ Willingness to Pay a Price Premium
1034
price premiums as the mainly useful indicator of brand equity (Sethuraman, 2000).
Empirical studies of (Ailawadi et al., 2003; Agarwal and Rao 1996) seem to bolster their
contention by appearing, that a price premium is similarly steady after some time, yet
catches varieties in the brand's strength, and is a prevailing indicator of market shares.
According to Doyle (2001) indeed, even contend that a price premium is for the most part
the vital path in which brands can create shareholder esteem, on the grounds that no
immediate speculations is requires to charge a hoisted cost. It should also be noted that
price premium in the present study, as well as in the study of Sethuraman (2000), handle a
willingness to pay, which is not really be an indication of genuine charge. In accumulation,
price premium is a comparative measure, implies that it is suitable for the brands (not
withstanding for the brands of minimal cost, in favor of which clients can will to give
additional for a brand than for an alternate). Price premium appears to contain an
imperative position in theory of branding, yet there is still relatively minimal orderly and
experimental research on which particular brand image components assemble price
premiums. This applies to buyer attire and additionally other markets. Within the literature
of consumer oriented brand equity, a number of authors have taken care of price premium
as main brand strength (Ailawadi et al., 2003). Measuring the price premium, as an
attitudinal develop, is frequently attempted with proclamations, for example, "Our
organization will pay a higher cost for items from this organization than for comparable
items from different organizations" (Netemeyer et al., 2004). A type of inverted price
premium, price affect-ability, can likewise be utilized: "The price of items from this
organization would need to go up a lot before we would consider another organization"
(Han and Sung, 2008).
Figure 1: Conceptual Framework
Conceptual framework of this study is based on brand equity theory general literature. As seen
in Figure 1 the brand image for female’s stitched branded clothing is conceptualized in six
dimensions of the brand image. These all measurements are hypothesized to be decidedly
identified with the customer’s readiness to pay price premium. In the framework of this study
there are six independent variables which are perceived awareness, perceived quality, perceived
H1 Awareness
H2 Quality
H3 CSR
Price Premium
H4 Origin
H5 Social Image
H6 Uniqueness

Munir et al.
1035
corporate social responsibility, and perceived country of origin, perceived social image, and
perceived uniqueness while the single dependent variable is price premium.
Brand equity is being defined in many different ways but most of the authors agree with the
definition of the Farquhar’s (1989) that is the value which is endowed to the product by the
brand itself. There is a precise focus of the concept of the brand equity on the mining of the
tangible economic value from brands; this makes it quite interesting and particularly relevant
for those who wants to know that how brands are competing for the price premium. Chernatony
and Christodoulides (2010) stated that there exists some confusion over micro-elements and
distinctiveness of brand equity but many authors believe that in customers mind financial value
of the brands is rooted. Later on the focus is shifted towards the psychological oriented brand
equity perspective of customer based. Customer based brand equity is defined as the effects that
are different of brand knowledge on the responses of the consumers to the brand marketing
(Keller, 1993). The present study is also focusing that why consumers are ready to pay more or
pay less for the stitched clothing.
Investigate inside the field of customer based brand equity turn out to be more composed, a
contrast between brand image determinants and results, (price premium) has advanced (Persson,
2010). Keller (1993) defined brand image as any information that is linked to the brand in
customer’s mind. In simpler words the beliefs and the kind of association of the customer with
the brand. Price premium might be the main and best measure of brand equity accessible (Aaker,
1996).
3. Methodology
3.1 Data Collection
Questionnaire is utilized in this study for data collection. Utilizing questionnaire to collect data
from a sample of individuals is an overview strategy (Zikmund, 2003). Sekaran (2002) stated
that Questionnaire is composed of written set of the questions against which respondents gives
desired responses in a closely listed alternatives. The questionnaires are distributed to CIIT
Vehari, Bahaudin Zakariya University (BZU) Multan and Vehari Campus, and from other
universities such as Faisalabad Agriculture University Burewala Campus, and Education
University. For the data collection, total number of distributed questionnaires is 650 out of
which 430 are collected back. After checking the questionnaire 409 are used. The questionnaires
that are not included are having missing values and not completely responded.
In this research majority entity is ‘university level female student’ that is analyzed by the
researchers in this study. Because recording the answers of each student on individual level
that’s why the unit of analysis of this research study is an individual. Further it is found out that
which of the six determinants heavily affects university level female students to pay more in
case of stitched clothing. This also reflects that variable that might has low impact of paying
decision on university level female students. Contrasting enable the managers to make efficient
investments on particular variables.
3.2 Measurement
The five point Likert is used in this study for determinant choice fixed alternative questions.
From the interval scale point of view respondents communicates their reacts on how
emphatically they are strongly agree or strongly disagree the built explanation from a point
of view of extremely positive or negative mentality. It then allows measuring the level of
Brand Image and Customers’ Willingness to Pay a Price Premium
1036
attitudes. Zikmund (2003) stated that Respondents by and large look over five options
which are: strongly disagree, disagree, neutral, agree and strongly agree.
Adopted questionnaires were taken into account for the collection of data as it makes one
able to attain the respondents in large amount. Questionnaire is composed of 4 queries in
the section of demographic profile and 24 items based on two to five items per construct.
These items are adopted from Anselmsson et al., (2014), further they adopted it from
others. Awareness was measured by Yoo and Donthu’s (2001) with three items from scale
of brand equity. Using three items social image was measured in light of (Sweeney and
Soutar, 2001). Perceived quality was measured by Netemeyer et al., (2004) with three
items. The three scale-items are constructed by joining the scales in (Verdu Jover et al.,
2004 and Sanzo et al., 2003). Uniqueness items are adopted from the study of (Netemeyer
et al., 2004). Items of Social Image are adopted from the study of (Bech-Larsen et al.,
2001). Two estimations tried in Netemeyer et al., (2004) are utilized to evaluate the price
premium. Necessary, reliable, and valid information will be collected from the respondents
through the designed questionnaire. Fixed alternative method of the questions is used in
the study to collect the data. This method is used for the reasons that make the respondent
easy to respond to the questions and it makes data analysis easy as well for the researchers.
3.3 Results
Descriptive Statistics is used to summarize the data is an easily understandable form.
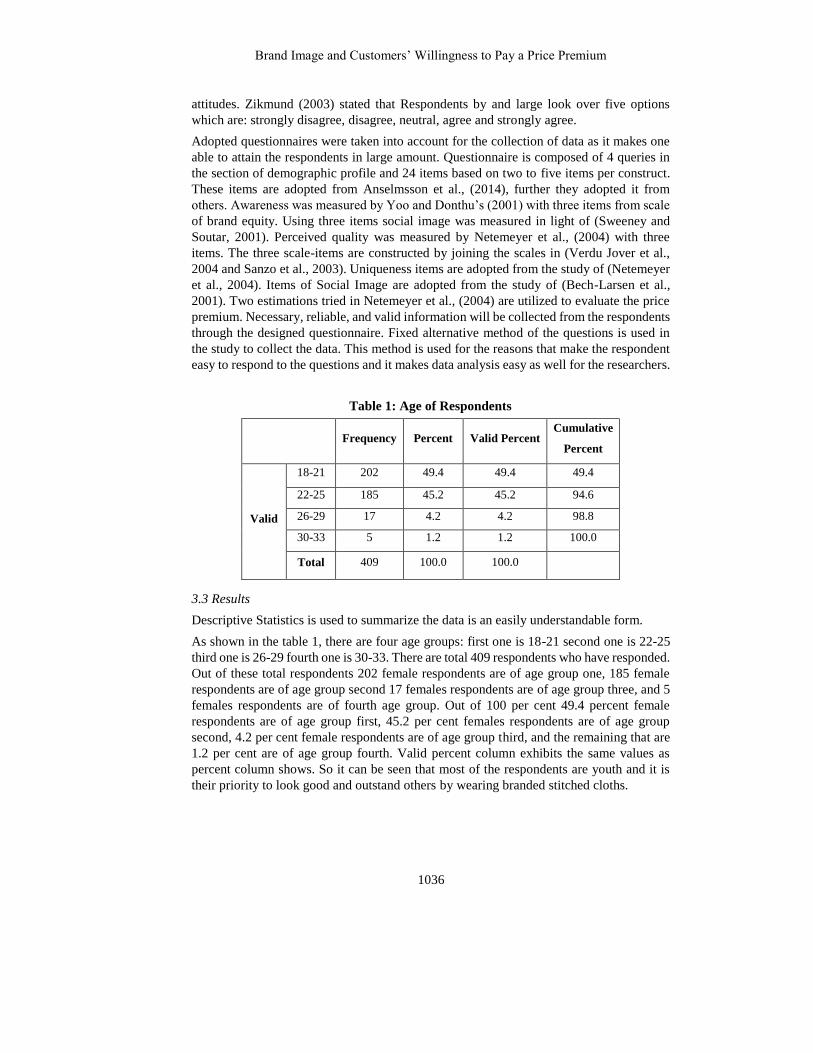
As shown in the table 1, there are four age groups: first one is 18-21 second one is 22-25
third one is 26-29 fourth one is 30-33. There are total 409 respondents who have responded.
Out of these total respondents 202 female respondents are of age group one, 185 female
respondents are of age group second 17 females respondents are of age group three, and 5
females respondents are of fourth age group. Out of 100 per cent 49.4 percent female
respondents are of age group first, 45.2 per cent females respondents are of age group
second, 4.2 per cent female respondents are of age group third, and the remaining that are
1.2 per cent are of age group fourth. Valid percent column exhibits the same values as
percent column shows. So it can be seen that most of the respondents are youth and it is
their priority to look good and outstand others by wearing branded stitched cloths.
Table 1: Age of Respondents
Frequency Percent Valid Percent Cumulative
Percent
Valid
18-21 202 49.4 49.4 49.4
22-25 185 45.2 45.2 94.6
26-29 17 4.2 4.2 98.8
30-33 5 1.2 1.2 100.0
Total 409 100.0 100.0
Munir et al.
1037
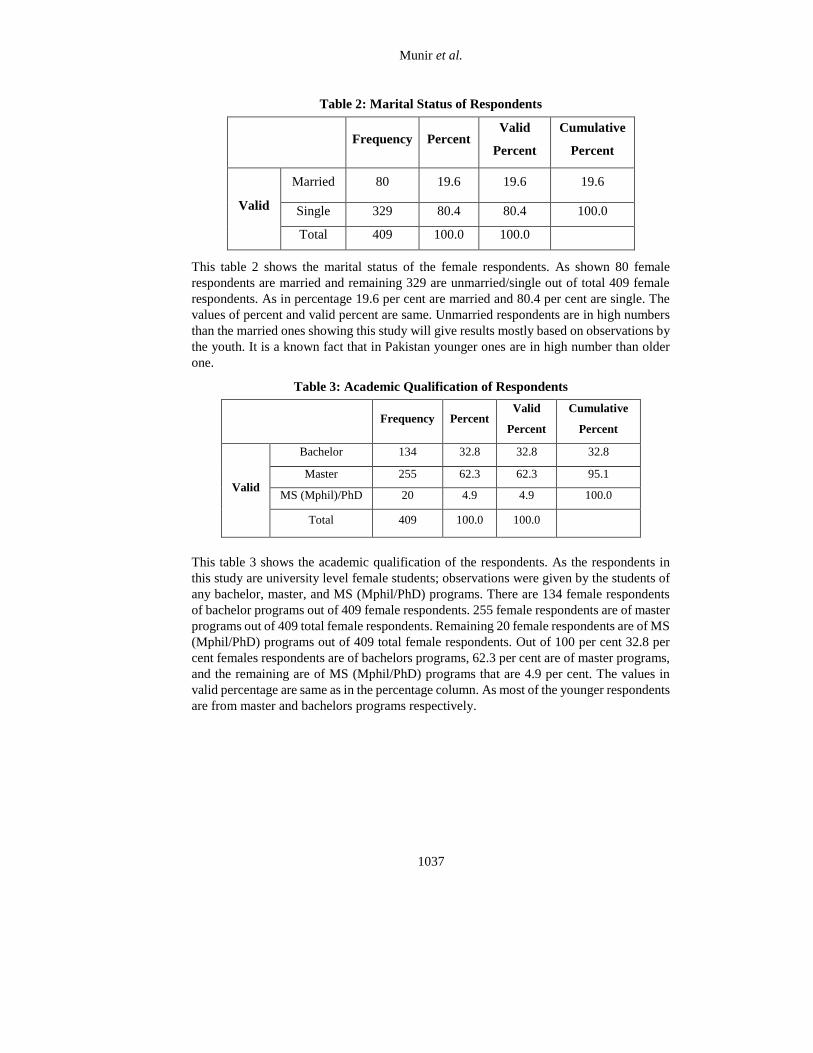
Table 2: Marital Status of Respondents
Frequency Percent Valid
Percent
Cumulative
Percent
Valid
Married 80 19.6 19.6 19.6
Single 329 80.4 80.4 100.0
Total 409 100.0 100.0
This table 2 shows the marital status of the female respondents. As shown 80 female
respondents are married and remaining 329 are unmarried/single out of total 409 female
respondents. As in percentage 19.6 per cent are married and 80.4 per cent are single. The
values of percent and valid percent are same. Unmarried respondents are in high numbers
than the married ones showing this study will give results mostly based on observations by
the youth. It is a known fact that in Pakistan younger ones are in high number than older
one.
Table 3: Academic Qualification of Respondents
Frequency Percent Valid
Percent
Cumulative
Percent
Valid
Bachelor 134 32.8 32.8 32.8
Master 255 62.3 62.3 95.1
MS (Mphil)/PhD 20 4.9 4.9 100.0
Total 409 100.0 100.0
This table 3 shows the academic qualification of the respondents. As the respondents in
this study are university level female students; observations were given by the students of
any bachelor, master, and MS (Mphil/PhD) programs. There are 134 female respondents
of bachelor programs out of 409 female respondents. 255 female respondents are of master
programs out of 409 total female respondents. Remaining 20 female respondents are of MS
(Mphil/PhD) programs out of 409 total female respondents. Out of 100 per cent 32.8 per
cent females respondents are of bachelors programs, 62.3 per cent are of master programs,
and the remaining are of MS (Mphil/PhD) programs that are 4.9 per cent. The values in
valid percentage are same as in the percentage column. As most of the younger respondents
are from master and bachelors programs respectively.
Brand Image and Customers’ Willingness to Pay a Price Premium
1038
Table 4: Institution of Respondents
Frequency Percent Valid
Percent
Cumulative
Percent
Valid
CIIT Vehari 175 42.8 42.8 42.8
BZU 154 37.7 37.7 80.4
Other 80 19.6 19.6 100.0
Total 409 100.0 100.0
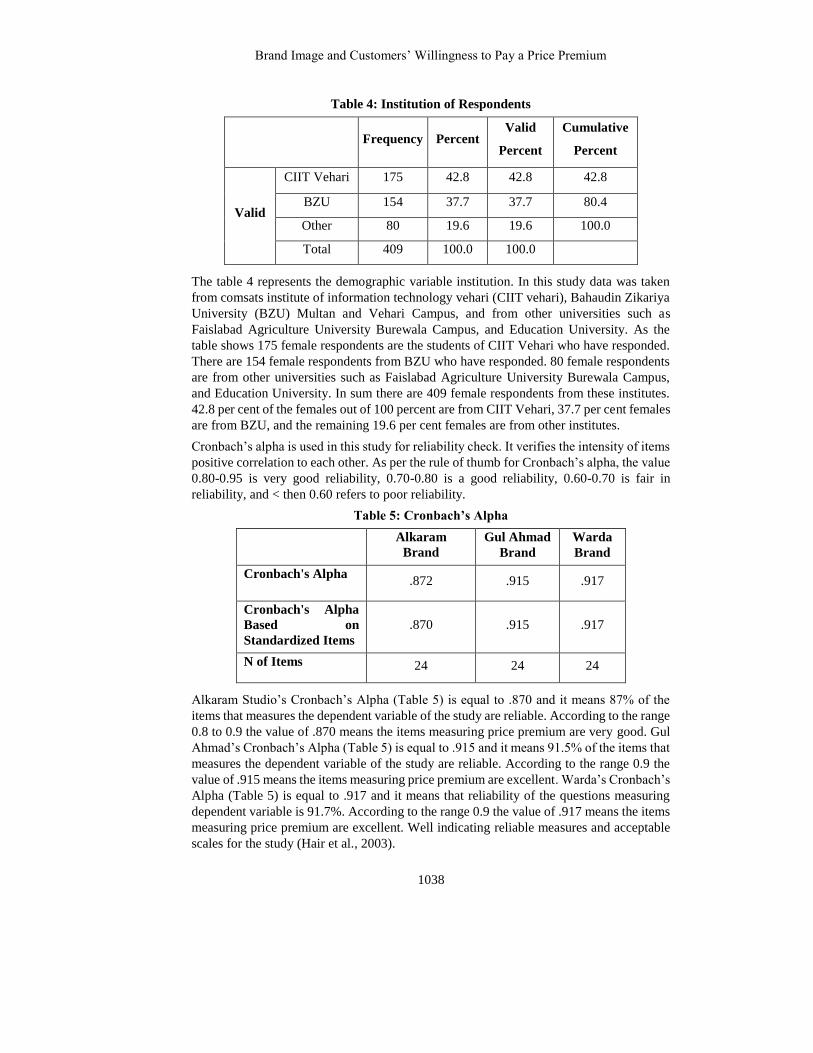
The table 4 represents the demographic variable institution. In this study data was taken
from comsats institute of information technology vehari (CIIT vehari), Bahaudin Zikariya
University (BZU) Multan and Vehari Campus, and from other universities such as
Faislabad Agriculture University Burewala Campus, and Education University. As the
table shows 175 female respondents are the students of CIIT Vehari who have responded.
There are 154 female respondents from BZU who have responded. 80 female respondents
are from other universities such as Faislabad Agriculture University Burewala Campus,
and Education University. In sum there are 409 female respondents from these institutes.
42.8 per cent of the females out of 100 percent are from CIIT Vehari, 37.7 per cent females
are from BZU, and the remaining 19.6 per cent females are from other institutes.
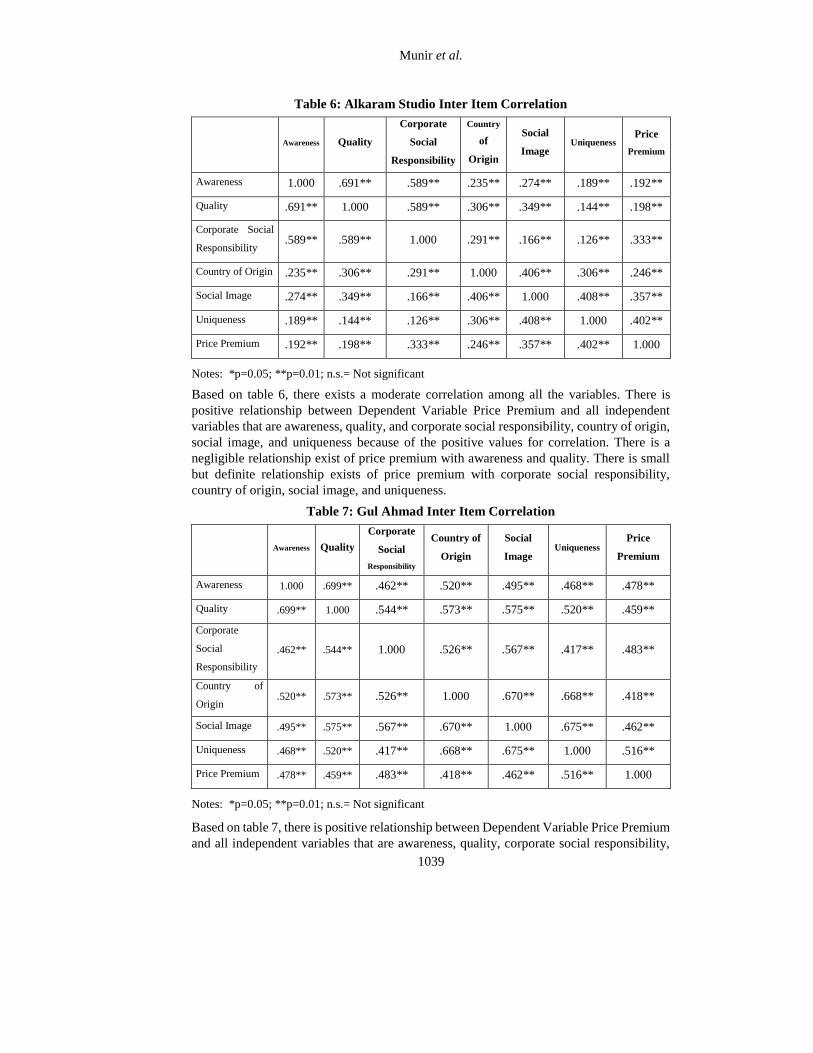
Cronbach’s alpha is used in this study for reliability check. It verifies the intensity of items
positive correlation to each other. As per the rule of thumb for Cronbach’s alpha, the value
0.80-0.95 is very good reliability, 0.70-0.80 is a good reliability, 0.60-0.70 is fair in
reliability, and < then 0.60 refers to poor reliability.
Table 5: Cronbach’s Alpha
Alkaram
Brand
Gul Ahmad
Brand
Warda
Brand
Cronbach's Alpha .872 .915 .917
Cronbach's Alpha
Based on
Standardized Items
.870 .915 .917
N of Items 24 24 24
Alkaram Studio’s Cronbach’s Alpha (Table 5) is equal to .870 and it means 87% of the
items that measures the dependent variable of the study are reliable. According to the range
0.8 to 0.9 the value of .870 means the items measuring price premium are very good. Gul
Ahmad’s Cronbach’s Alpha (Table 5) is equal to .915 and it means 91.5% of the items that
measures the dependent variable of the study are reliable. According to the range 0.9 the
value of .915 means the items measuring price premium are excellent. Warda’s Cronbach’s
Alpha (Table 5) is equal to .917 and it means that reliability of the questions measuring
dependent variable is 91.7%. According to the range 0.9 the value of .917 means the items
measuring price premium are excellent. Well indicating reliable measures and acceptable
scales for the study (Hair et al., 2003).
Munir et al.
1039
Table 6: Alkaram Studio Inter Item Correlation
Awareness Quality
Corporate
Social
Responsibility
Country
of
Origin
Social
Image Uniqueness
Price
Premium
Awareness 1.000 .691** .589** .235** .274** .189** .192**
Quality .691** 1.000 .589** .306** .349** .144** .198**
Corporate Social
Responsibility .589** .589** 1.000 .291** .166** .126** .333**
Country of Origin .235** .306** .291** 1.000 .406** .306** .246**
Social Image .274** .349** .166** .406** 1.000 .408** .357**
Uniqueness .189** .144** .126** .306** .408** 1.000 .402**
Price Premium .192** .198** .333** .246** .357** .402** 1.000
Notes: *p=0.05; **p=0.01; n.s.= Not significant
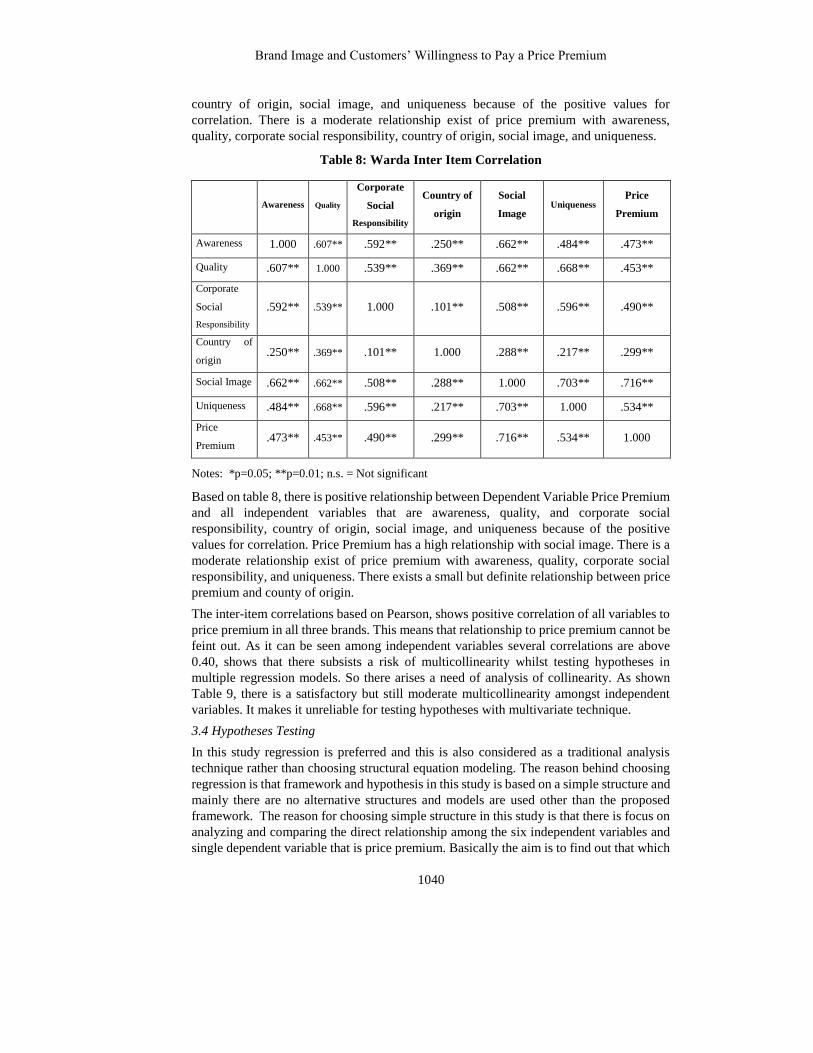
Based on table 6, there exists a moderate correlation among all the variables. There is
positive relationship between Dependent Variable Price Premium and all independent
variables that are awareness, quality, and corporate social responsibility, country of origin,
social image, and uniqueness because of the positive values for correlation. There is a
negligible relationship exist of price premium with awareness and quality. There is small
but definite relationship exists of price premium with corporate social responsibility,
country of origin, social image, and uniqueness.
Table 7: Gul Ahmad Inter Item Correlation
Awareness Quality
Corporate
Social
Responsibility
Country of
Origin
Social
Image Uniqueness
Price
Premium
Awareness 1.000 .699** .462** .520** .495** .468** .478**
Quality .699** 1.000 .544** .573** .575** .520** .459**
Corporate
Social
Responsibility
.462** .544** 1.000 .526** .567** .417** .483**
Country of
Origin .520** .573** .526** 1.000 .670** .668** .418**
Social Image .495** .575** .567** .670** 1.000 .675** .462**
Uniqueness .468** .520** .417** .668** .675** 1.000 .516**
Price Premium .478** .459** .483** .418** .462** .516** 1.000
Notes: *p=0.05; **p=0.01; n.s.= Not significant
Based on table 7, there is positive relationship between Dependent Variable Price Premium
and all independent variables that are awareness, quality, corporate social responsibility,
Brand Image and Customers’ Willingness to Pay a Price Premium
1040
country of origin, social image, and uniqueness because of the positive values for
correlation. There is a moderate relationship exist of price premium with awareness,
quality, corporate social responsibility, country of origin, social image, and uniqueness.
Table 8: Warda Inter Item Correlation
Notes: *p=0.05; **p=0.01; n.s. = Not significant
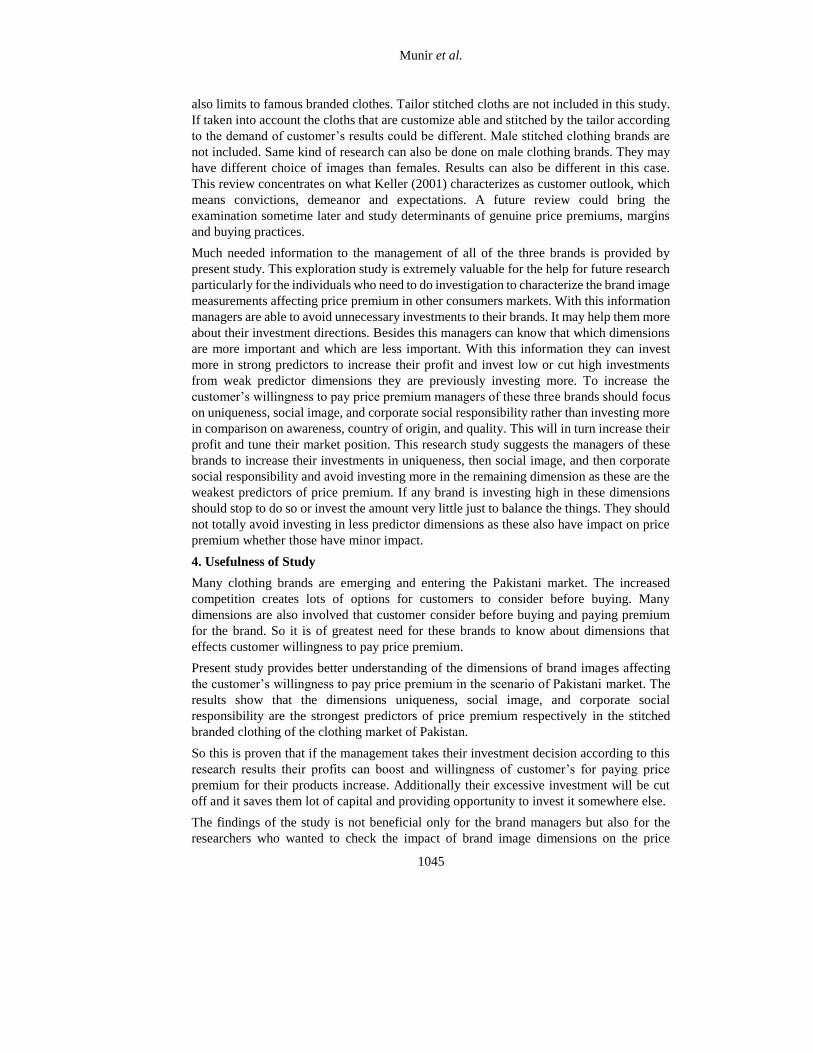
Based on table 8, there is positive relationship between Dependent Variable Price Premium
and all independent variables that are awareness, quality, and corporate social
responsibility, country of origin, social image, and uniqueness because of the positive
values for correlation. Price Premium has a high relationship with social image. There is a
moderate relationship exist of price premium with awareness, quality, corporate social
responsibility, and uniqueness. There exists a small but definite relationship between price
premium and county of origin.
The inter-item correlations based on Pearson, shows positive correlation of all variables to
price premium in all three brands. This means that relationship to price premium cannot be
feint out. As it can be seen among independent variables several correlations are above
0.40, shows that there subsists a risk of multicollinearity whilst testing hypotheses in
multiple regression models. So there arises a need of analysis of collinearity. As shown
Table 9, there is a satisfactory but still moderate multicollinearity amongst independent
variables. It makes it unreliable for testing hypotheses with multivariate technique.
3.4 Hypotheses Testing
In this study regression is preferred and this is also considered as a traditional analysis
technique rather than choosing structural equation modeling. The reason behind choosing
regression is that framework and hypothesis in this study is based on a simple structure and
mainly there are no alternative structures and models are used other than the proposed
framework. The reason for choosing simple structure in this study is that there is focus on
analyzing and comparing the direct relationship among the six independent variables and
single dependent variable that is price premium. Basically the aim is to find out that which
Awareness Quality
Corporate
Social
Responsibility
Country of
origin
Social
Image Uniqueness
Price
Premium
Awareness 1.000 .607** .592** .250** .662** .484** .473**
Quality .607** 1.000 .539** .369** .662** .668** .453**
Corporate
Social
Responsibility
.592** .539** 1.000 .101** .508** .596** .490**
Country of
origin .250** .369** .101** 1.000 .288** .217** .299**
Social Image .662** .662** .508** .288** 1.000 .703** .716**
Uniqueness .484** .668** .596** .217** .703** 1.000 .534**
Price
Premium .473** .453** .490** .299** .716** .534** 1.000

Munir et al.
1041
independent variable in comparison high to low appeal the female customer to pay price
premium and for which brand among the three. Simple Regression analysis is used because
of the presence of moderate levels of multicollinearity among the independent variables.
Results can be reviewed in table 10. All the relationships of independent variables
(Perceived awareness, Quality, Corporate Social Responsibility, Country of Origin, Social
Image, and Uniqueness) to the dependent variable (Price Premium) are significant with
.000 values. Hence all the hypotheses from H1 to H6 are supported and all alternative
hypotheses are accepted. F sig. is showing that the model is fit. With same technique all
the hypotheses are supported also in the study of (Anselmsson et al., 2014)
Table 10 is showing perceived uniqueness the strongest predictor of the customer’s
willingness to pay price premium for female stitched clothing in all three brands. Perceived
social image is the second strongest predictor of the willingness of the customer to pay
price premium in two brands Warda and Alkaram studio but not in brand Gul Ahmad.
Perceived Corporate Social Responsibility (CSR) is the third strongest predictor of the
willingness of customer to pay price premium in all the three brands. Perceived awareness
is the fourth strongest predictor of the customer’s willingness to pay a price premium in
the brands except brand Alkaram studio. Perceived quality is the fifth strongest predictor
of willingness of customer to pay price premium in all three brands Warda, Alkaram studio,
and Gul Ahmad. Perceived Country of Origin (COO) is the weakest predictor of
willingness of customer to pay price premium in all the brands except Alkaram studio.
Depending on all the three brands Perceived uniqueness could predict the variation in the
price premium in between 15.9 per cent to 28.4 per cent. Depending on all the three brands
Perceived Social Image could predict the variation in the price premium in between 12.5
per cent to 51.1 per cent. Depending on all the three brands Perceived Corporate Social
Responsibility (CSR) could predict the variation in the price premium in between 10.8 per
cent to 23.8 per cent. Depending on all the three brands Perceived Awareness could predict
the variation in the price premium in between 3.5 per cent to 22.7 per cent. Depending on
all the three brands Perceived quality could predict the variation in the price premium in
between 3.7 per cent to 20.9 per cent. Depending on all the three brands Perceived Country
of Origin (COO) could predict the variation in the price premium in between 5.8 per cent
to 17.3 per cent.
In the table 9 results are presented from a step wise multiple regression analysis between
independent variables that are six in count and a single dependent variable that is price
premium. The table 9 shows explained variation and strongest predictability for the prize
premium that is found in brand Warda. It shows the weakest predictability and explained
variation for the prize premium in brand Alkaram Studio. The proposed determinants are
explaining the significant proportion of variation in customer’s willingness to pay price
premium with the exception of price premium model in the brand of Alkaram Studio. Value
of the Adj. R2 for the model of price premium is ranges from .27 to .553. As it is clearly
seen in table 9 the collinearity diagnostic of VIF ranges from 1.02 to 2.5. It shows
acceptable but still designate moderate multicollinearity. If step wise multiple regression
analysis is used for hypotheses testing instead of single regression analysis the outcome of
hypotheses H1 to H6 would had affected due to the moderate multicollinearity. Awareness
has actually non-significant relationship with price premium in brand Warda. Country of
Origin has non-significant relationship with price premium in brand Gul Ahmad.
Uniqueness has non-significant relationship with price premium in brand Warda. The table

Brand Image and Customers’ Willingness to Pay a Price Premium
1042
9 shows that Social Image, Quality, and Corporate Social Responsibility (CSR) are the
only dimensions that significantly determine the price premium in all three brands and
tables. As in the case of single regression analysis all the alternative Hypotheses are
accepted in all three brands.
Table 9: Summary Statistics in Multiple Regression Analysis
Price Premium
Stepwise
Gul Ahmad Alkaram Studio Warda
St. B. VIF St. B. VIF St. B. VIF
Awareness .21** 1.4 .12* 1.03 n.s 2.1
Quality .26** 1.3 .14* 1.02 .16** 2.1
CSR .25** 1.3 .32** 1.5 .22** 1.5
COO n.s 1.8 .13* 1.10 .14** 1.1
Social Image .20** 1.8 .21** 1.2 .66** 1.9
Uniqueness .30** 1.3 .29** 1.2 n.s 2.5
Adj. R2 0.381 0.27 0.553
Df 408 408 408
F. 84.63 39.61 127.22
Sig. .000 .000 .000
Notes: *p=0.05; **p=0.01; n.s.= Not significant

Munir et al.
1043
Table 10: Summary Statistics in Single Regression Analysis
Price Premium
Dimension Brand R2 Adj. R2 F sig. Rank P
Awareness
Gul Ahmad .229 .227 .000 3 0.01
Alkaram
Studio .037 .035 .000 6 0.01
Warda .224 .222 .000 4 0.01
Quality
Gul Ahmad .211 .209 .000 5 0.01
Alkaram
Studio .039 .037 .000 5 0.01
Warda .205 .203 .000 5 0.01
CSR
Gul Ahmad .233 .231 .000 2 0.01
Alkaram
Studio .111 .108 .000 3 0.01
Warda .240 .238 .000 3 0.01
Country of
Origin
Gul Ahmad .175 .173 .000 6 0.01
Alkaram
Studio .061 .058 .000 4 0.01
Warda .089 .087 .000 6 0.01
Social Image
Gul Ahmad .214 .212 .000 4 0.01
Alkaram
Studio .128 .125 .000 2 0.01
Warda .512 .511 .000 1 0.01
Uniqueness
Gul Ahmad .266 .264 .000 1 0.01
Alkaram
Studio .161 .159 .000 1 0.01
Warda .286 .284 .000 2 0.01

Brand Image and Customers’ Willingness to Pay a Price Premium
1044
The main starting point of this study is to find out most important and least important
determinant related to price premium from the perspective of the target respondent. So it
has been found in this study as the results shows that uniqueness, social image, and
corporate social responsibility, awareness, quality, and country of origin are the most
strongest to least strongest predictors of the customer’s willingness to pay price premium
respectively. All these brand image dimensions have significant effect on the price
premium whether strongly predicting or weakly predicting the price premium. These all
determinants are also having significant impact on customer’s willingness to pay price
premium in the study of (Anselmsson et al., 2014).Three brand image dimensions are
standing out in comparison to the remaining particularly as strong price premium
determinants: Uniqueness, Corporate Social Responsibility, and Social Image. This finding
of the research study is certainly highlighting the idea of the brand-equity theory (Hoeffler
and Keller 2002) that is both aspects such as rational and emotional are very important.
Brand Image determinant uniqueness is the strongest predictor of customer’s willingness
to pay price premium for female stitched clothing of all three brands. There is a strongest
link between the price premium and perceived uniqueness and it is quite interesting.
Because if this matter is look upon in the perspective of traditional strategies, the
differentiation in the products is often introduced to avoid the competition of price among
competing brands (Porter, 1985). So it can be said that customers are more willing to pay
for the brands that have unique features or functions. Uniqueness is tangible aspect if
related to the brand equity theory as it allows the consumers to look different among others.
Social Image as a brand image dimension is the second strongest predictor of customer’s
willingness to pay price premium for female stitched clothing of all brands except Gul
Ahmad brand. Social Image is expected of having stronger impact on increasing customer’s
willingness to pay price premium as this dimension is related to products like cloths that is
basically a public product and it can moderate the success of brands (Semeijn et al., 2004).
Corporate Social Responsibility as brand image dimension is the third strongest predictor
of the customer’s willingness to pay price premium. CSR had its breakthrough at the end
of 1990s. The companies started to involve in societal activities that has an impact on
customer purchase decision. It also derives the sense of ownership regarding the products
the brands have to offer. Grunert et al., (1996) stated that Customers’ feels like they are
promoting and supporting the companies that are doing good and respecting the societal
needs (Crowther and Aras, 2008).
3.5 Study Limitation, Future Research and Implications
For this research study researchers collected the data of three data sets as for three different
brands of similar nature. It was hard to discover the respondents who are more genuine to
eagerly fill the entire survey. As individuals have distinctive dispositions and identities
some individual data like marital status and age may have some adjustment. There are
chances that respondents purposefully check the desired answer instead of real situation.
In simpler terms it can be said that reliability in accompanying with validity may affects
due to these desired checks rather than real situation.
This study is limited to brands that are available in most of the southern Punjab cities. In
this study other famous brands are not included that are not present in Vehari, Khanewal,
Mailsi etc. So there are chances of the relevance of other image elements to the brands not
studied in this study. In future these brands could also be taken into account. This study
Munir et al.
1045
also limits to famous branded clothes. Tailor stitched cloths are not included in this study.
If taken into account the cloths that are customize able and stitched by the tailor according
to the demand of customer’s results could be different. Male stitched clothing brands are
not included. Same kind of research can also be done on male clothing brands. They may
have different choice of images than females. Results can also be different in this case.
This review concentrates on what Keller (2001) characterizes as customer outlook, which
means convictions, demeanor and expectations. A future review could bring the
examination sometime later and study determinants of genuine price premiums, margins
and buying practices.
Much needed information to the management of all of the three brands is provided by
present study. This exploration study is extremely valuable for the help for future research
particularly for the individuals who need to do investigation to characterize the brand image
measurements affecting price premium in other consumers markets. With this information
managers are able to avoid unnecessary investments to their brands. It may help them more
about their investment directions. Besides this managers can know that which dimensions
are more important and which are less important. With this information they can invest
more in strong predictors to increase their profit and invest low or cut high investments
from weak predictor dimensions they are previously investing more. To increase the
customer’s willingness to pay price premium managers of these three brands should focus
on uniqueness, social image, and corporate social responsibility rather than investing more
in comparison on awareness, country of origin, and quality. This will in turn increase their
profit and tune their market position. This research study suggests the managers of these
brands to increase their investments in uniqueness, then social image, and then corporate
social responsibility and avoid investing more in the remaining dimension as these are the
weakest predictors of price premium. If any brand is investing high in these dimensions
should stop to do so or invest the amount very little just to balance the things. They should
not totally avoid investing in less predictor dimensions as these also have impact on price
premium whether those have minor impact.
4. Usefulness of Study
Many clothing brands are emerging and entering the Pakistani market. The increased
competition creates lots of options for customers to consider before buying. Many
dimensions are also involved that customer consider before buying and paying premium
for the brand. So it is of greatest need for these brands to know about dimensions that
effects customer willingness to pay price premium.
Present study provides better understanding of the dimensions of brand images affecting
the customer’s willingness to pay price premium in the scenario of Pakistani market. The
results show that the dimensions uniqueness, social image, and corporate social
responsibility are the strongest predictors of price premium respectively in the stitched
branded clothing of the clothing market of Pakistan.
So this is proven that if the management takes their investment decision according to this
research results their profits can boost and willingness of customer’s for paying price
premium for their products increase. Additionally their excessive investment will be cut
off and it saves them lot of capital and providing opportunity to invest it somewhere else.
The findings of the study is not beneficial only for the brand managers but also for the
researchers who wanted to check the impact of brand image dimensions on the price
Brand Image and Customers’ Willingness to Pay a Price Premium
1046
premium instead of the impact of the actual variables of price premium. This study can
also be taken into account by the top managers of these brands to launch more of their
outlets and more products in the region of southern Punjab, Pakistan.
REFERENCES
Aaker, D. A. (1996). Measuring brand equity across products and markets. California
Management Review, 38 (3), 102-120.
Adhikari, A. (2015). Differentiating subjective and objective attributes of experience products
to estimate willingness to pay price premium. Journal of Travel Research, 54(5), 634-644.
Agarwal, M.K. and Rao, V.R. (1996). An empirical comparison of consumer-based measures
of brand equity. Marketing Letters, 7 (3), 237-247.
Ahmed, Z. U., Johnson, J. P., Yang, X., Fatt, C. K., Teng, H. S., and Boon, L. C. (2004). Does
Country of Origin Matter for Low Involvement Products. International Market Review, 21(1),
102–120.
Ailawadi, K. L., Lehmann, D. R., and Neslin, S. A. (2003). Revenue premium as an outcome
measure of brand equity. Journal of Marketing, 67 (4), 1-17.
Al-Sulaiti, K. I. and Baker, M. J. (1998). Country of origin effects: a literature review.
Marketing Intelligence and Planning, 16 (3), 150-199.
Andreoni, J. and B. D. Bernheim (2009). Social Image and the 50-50 Norm: A Theoretical and
Experimental Analysis of Audience Effects. Econometrica, 77 (5), 1607–1636.
Anselmsson, J. and Johansson, U. (2007). Corporate social responsibility and the positioning of
grocery brands: an exploratory study of retailer and manufacturer brands at point of purchase.
International Journal of Retail and Distribution Management, 35 (10), 835-856.
Anselmsson, J., Johansson, U., and Persson, N. (2007). Understanding price premium for
grocery products: a conceptual model of customer-based brand equity. Journal of Product and
Brand Management, 16 (6), 401-414.
Anselmsson, J., Vestman Bondesson, N., & Johansson, U. (2014). Brand image and customers'
willingness to pay a price premium for food brands. Journal of Product & Brand
Management, 23(2), 90-102.
Bagnoli, M. and Watts, S. (2003). Selling to socially responsible consumers: Competition and
the Private provision of public goods. Journal of Economics and Management Strategy, 12(3),
419-445.
Ball, A. D. and Tasaki, L. H. (1992). The role and measurement of attachment in consumer
behavior. Journal of Consumer Psychology, 1(2), 155-172.
Bech-Larsen, T., Grunert, K. G., and Poulsen, J. B. (2001). The acceptance of functional foods
in Denmark, Finland and the United States, MAPP working paper 73, Aarhus School of
Business, Aarhus.
Bertrandias, L. and Goldsmith, R. E. (2006). Some psychological motivations for fashion
opinion leadership and fashion opinion seeking. Journal of Fashion Marketing and
Management, 10 (1), 25-40.
Bilkey, W. J., & Nes, E. (1982). Country-of-origin effects on product valuations. Journal of
international business studies, 13(1), 89-100.
Bondesson, N. (2012). Brand image antecedents of loyalty and price premium in business
markets. Business and Management Research, 1(1), 32-47.
Munir et al.
1047
Carroll, A. B. (1979). A three-dimensional conceptual model of corporate performance.
Academy Of Management Review, 4(4), 497-505.
Casidy, R., & Wymer, W. (2016). A risk worth taking: Perceived risk as moderator of
satisfaction, loyalty, and willingness-to-pay premium price. Journal of Retailing and Consumer
Services, 32, 189-197.
Chepchirchir, J. and Leting, M. (2015). Effects of Brand Quality, Brand Prestige on Brand
Purchase Intention of Mobile Phone Brands: Empirical Assessment from Kenya. International
Journal of Management Science and Business Administration, 1(11), 7-14
Chowudhury, R. A. (2012). Developing the measurement of consumer based brand quity in
service industry: An empirical study on mobile phone industry. European Journal of Business
and Management, 4(13), 62-67.
Christodoulides, G. and de Chernatony, L. (2010). Consumer-based brand equity
conceptualisation and measurement: a literature review. International Journal of Market
Research, 52(1), 1-38.
Cobb-Wahlgren, C.J., Ruble, C.A., and Donthu, N. (1995). Brand equity, brand preference and
purchase intent. Journal of Advertising, 24 (3), 25-41.
Crowther, D., & Aras, G. (2010). Handbook of Corporate Governance and Social
Responsibility. Farnham, Surrey, GBR: Ashgate Publishing Group.
DellaVigna, S., List, J. A., and Malmendier, U. (2012). Testing for Altruism and Social
Pressure in Charitable Giving. Quarterly Journal of Economics, 127(1), 1–56.
Doyle, P. (2001). Shareholder-value-based brand strategies. Journal of Brand Management, 9
(1), 20-30.
Essoussi, L. H. and D. Merunka (2007). Consumers' product evaluations in emerging markets:
Does country of design, country of manufacture, or brand image matter? International
Marketing Review, 24(4), 409-426.
European Commission. (2011). A renewed EU strategy 2011-14 for Corporate Social
Responsibility. Brussels: European Commission.
Farquhar, P. H. (1989). Managing brand equity. Marketing Research, 1 (3), 24-33.
Fombrun, C. and Shanley, M. (1990). What’s in a name? Reputation building and corporate
strategy. Academy of Management Journal, 33(2), 233-258.
Frackenpohl, G. and P¨onitzsch, G. (2013). Bundling Public with Private Goods. Bonn Econ
Discussion Papers, No. 05/2013, University of Bonn.
Friedrichsen, J. (2013). Image Concerns and the Provision of Quality, WZB Discussion Paper
SP II 2013–211, Berlin: WZB.
Garvin, D. A. (1983). Quality on the line. Harvard Business Review, 61, 65-73.
Ghazali, M., Othman, M. S., Yahya, A. Z., and Ibrahim, M. S. (2008). Products and country of
origin effects: The Malaysian consumers’ Perception. American Review of Business Research
Papers, 4(2), 91–102.
Grewal, D., Krishnan, R., Baker, J., and Borin, N. (1998). The effect of store name, brand name,
and price discounts on consumer’s evaluations and purchase intentions. Journal of Retailing,
74(3), 331-352.
Griskevicius, V., Tybur, J. M., and Van den Bergh, B. (2010). Going Green to Be Seen: Status,
Reputation, and Conspicuous Conservation. Journal of Personality and Social Psychology, 98
(3), 392–404.
Grossman, Z. (2010). Self-Signaling Versus Social-Signaling in Giving. Mimeo, University of
California Santa Barbara.

Brand Image and Customers’ Willingness to Pay a Price Premium
1048
Grunert, K. G., Baadsgaard, A., Larsen, H. H., and Madsen, T. K. (1996). Market Orientation
in Food and Agriculture, Kluwer, Norwell.
Hair, J. F. Jr., Babin, B,. Money, A. H., and Samouel, P. (2003). Essential of business research
methods. John Wiley and Sons, New Jersey, NJ.
Han, S. L. and Sung, H. S. (2008). Industrial brand value and relationship performance in
business markets – A general structural equation model. Industrial Marketing Management,
37(7), 807-818.
Hoeffler, S. and Keller, K. L. (2002). Building brand equity through corporate societal
marketing. Journal of Public Policy and Marketing, 21(1), 78-89.
Holbrook, M. B. and Corfman, K. P. (1985). Quality and value in the consumption experience:
Phaedrus rides again, Lexington Books 31-57.
Hong, S. and Wyer, R. S. Jr. (1989). Effects of country of origin and product attribute
information on product evaluation: An information processing perspective. Consumer
Research, 16(2), 175-85.
Hoyer, W. D. and Brown, S. P. (1990). Effects of Brand Awareness on Choice for a Common,
Repeat-Purchase Product. Journal of Consumer Research, 17(2), 141-148.
Hsu, Y. Y. (2000). The impact of brand awareness, reference price, product knowledge and
product characteristics on brand evaluation and consumers’ purchase intention, Unpublished
Master Thesis, National Cheng Kung University, Taiwan.
Jover, A. J. V., Montes, F. J. L., & Fuentes, M. D. M. F. (2004). Measuring perceptions of
quality in food products: the case of red wine. Food Quality and Preference, 15(5), 453-469.
Kamins, M. A. and Marks, L. J. (1991). The perception of kosher as a third party certification
claim in advertising for familiar and unfamiliar Brands. Journal of the Academy of Marketing
Science, 19(3), 177-185.
Keller, K. L. (1993). Conceptualizing, measuring, and managing customer-based brand equity.
Journal of Marketing, 57 (1), 1-23.
Keller, K. L. (2001). Building customer-based brand equity. Marketing Management, 10 (2),
14-19.
Khazana. (2016). Top Ten Pakistani Female Clothing Brands in Pakistan. [Online] Available
at: http://ranking.khazana.pk/top-ten-pakistani-female-clothing-brands-in-pakistan-236
(December 10th, 2016).
Kumar, A., Lee, H. J., and Kim, Y. K. (2009). Indian consumers' purchase intention toward a
United States versus local brand. Journal of Business Research, 62(5), 521-527.
Lusk, J. L., Brown, J., Mark, T., Proseku, I., Thompson, R., & Welsh, J. (2006). Consumer
behavior, public policy, and country-of-origin labeling. Review of Agricultural
Economics, 28(2), 284-292.
McWilliams, A. and Siegel, D. (2001). Corporate social responsibility: A theory of the firm
perspective. Academy of Management Review, 26(1), 117-127.
Nagashima, A. (1977). A comparative “Made in” product image survey among Japanese
businessmen. Marketing, 41, 95-100.
Netemeyer, R.G., Krishnan, B., Pullig, C., Wang, G., Yagci, M., Dean, D., Ricks, J. and Wirth,
F. (2004). Developing and validating measures of facets of customer-based brand equity.
Journal of Business Research, 57(2), 209-224.

Munir et al.
1049
Nielsen, N. A., Bech-Larsen, T. and Grunert, K. G. (1998). Consumer purchase motives and
product perceptions: a laddering study on vegetable oil in three countries. Food Quality and
Preference, 9(6), 455-466.
Papadopoulos, N. and Heslop, L. A. (2002). Country Equity and Country Branding: Problems
and Prospects. Journal of Brand Management, 9 (4-5), 294-315.
Percy, L. and Rossiter, J. R. (1992). A model of brand awareness and brand attitude advertising
strategies. Psychology and Marketing, 9(4), 263-274.
Persson, N. (2010). An exploratory investigation of the elements of B2B brand image and its
relationship to price premium. Industrial Marketing Management, 39(8), 1269-1277.
Porter, M. E. (1985). Competitive Advantage. The Free Press, New York, NY.
Rege, M. (2008). Why Do People Care about Social Status? Journal of Economic Behavior and
Organization, 66 (2), 233–242.
Sanzo, M.J., del Rı´o, A.B., Iglesias, V. and Va´zquez, R. (2003). Attitude and satisfaction in a
traditional food product. British Food Journal, 105 (10-11), 771-790.
Sekeran, U. (2002). Research methods for business: A Skill buildings approach (4th ed). John
Wiley and Sons, Wilmington.
Semeijn, J., Van Riel, A. C. R. and Ambrosini, B. (2004). Consumer evaluations of store brands:
effects of store image and product attributes. Journal of Retailing and Consumer Services, 11
(4), 247-258.
Sethuraman, R. (2000). What makes consumers pay more for national brands than for private
labels-image or quality? Marketing Science Institute Paper Series, Cox School of Business,
Southern Methodist University.
Snyder, C. R. (1992). Product Scarcity by Need for Uniqueness Interaction: A Consumer Catch-
22 Carousel. Basic and Applied Social Psychology, 13(1), 9–24.
Snyder, C. R. and Howard, L. F. (1977). Abnormality as a Positive Characteristic: The
Development and Validation of a Scale Measuring Need for Uniqueness. Journal of Abnormal
Psychology, 86(5), 518–527.
Sweeney, J.C. and Soutar, G.N. (2001). Consumer perceived value: the development of a
multiple item scale. Journal of Retailing, 77 (2), 203-220.
Tavikkai, K. and Jirawattanaukool, W. (2010). An Exploratory Study on Young Thai Women
Consumer Behavior toward Purchasing Luxury Fashion Brands. Master Thesis. Mälardalen
University. [Online] Available at:
http://mdh.diva-portal.org/smash/record.jsf?pid=diva2%3A326249&dswid=-5325
Tian, K. and William, O. B. (2001). Consumers’ Need for Uniqueness: Scale Development and
Validation. Journal of Consumer Research, 28(1), 50-66.
Tikkanen, I. and Va¨a¨riskoski, M. (2010). Attributes and benefits of branded bread: case
Artesaani. British Food Journal, 112(9), 1033-1043
Verhoef, P. C., Nijssen, E. J. and Sloot, L.M. (2002). Strategic reactions of national brand
manufacturers towards private labels-an empirical study in The Netherlands. European Journal
of Marketing, 36 (11-12), 1309-1326.
Yoo, B. and Donthu, N. (2001). Developing and validating multidimensional consumer-based
brand equity scale. Journal of Business Research, 52 (1), 1-14.
Zeithaml, V. A. (1988). Consumer perceptions of price, quality, and value: a means-end model
and synthesis of evidence. Journal of Marketing, 52(3), 2-22.
Zikmund, W.G. (2003). Business Research Methods (7th Ed.). South-Western Publishing.