Embed Size (px)
Citation preview

1IAB Proprietary Research
Brand Disruption 2022 The IAB Annual Report on the Evolving Consumer EcosystemNovember 8, 2021
This report was produced by IAB. The final report, findings, and recommendations were not influenced by sponsors.
Sponsored by:

2IAB Proprietary Research
What Is the Direct Brand Economy?
Powered by nimble supply chains and 1st party, data-enriched customer relationships, Direct Brands will continue to steal share and pose significant threats to the growth and vitality of incumbent brands.

3IAB Proprietary Research
The Indirect Brand Economy (1879 – 2010) required tightly woven supply chains and physical stores
retailer
publisher
advertising agency
brand
consumer
finance
sourcing
manufacturing
logistics
distribution
integration
4IAB Proprietary Research
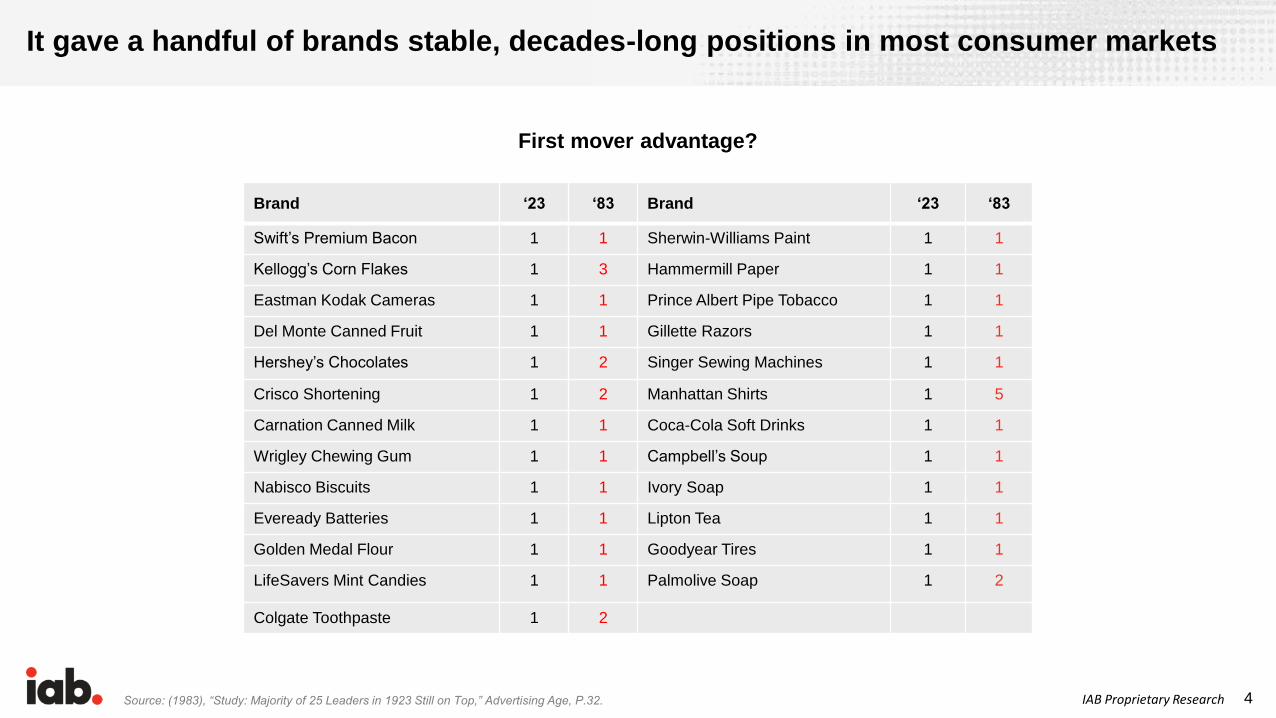
It gave a handful of brands stable, decades-long positions in most consumer markets
Brand ‘23 ‘83 Brand ‘23 ‘83
Swift’s Premium Bacon 1 1 Sherwin-Williams Paint 1 1
Kellogg’s Corn Flakes 1 3 Hammermill Paper 1 1
Eastman Kodak Cameras 1 1 Prince Albert Pipe Tobacco 1 1
Del Monte Canned Fruit 1 1 Gillette Razors 1 1
Hershey’s Chocolates 1 2 Singer Sewing Machines 1 1
Crisco Shortening 1 2 Manhattan Shirts 1 5
Carnation Canned Milk 1 1 Coca-Cola Soft Drinks 1 1
Wrigley Chewing Gum 1 1 Campbell’s Soup 1 1
Nabisco Biscuits 1 1 Ivory Soap 1 1
Eveready Batteries 1 1 Lipton Tea 1 1
Golden Medal Flour 1 1 Goodyear Tires 1 1
LifeSavers Mint Candies 1 1 Palmolive Soap 1 2
Colgate Toothpaste 1 2
First mover advantage?
Source: (1983), “Study: Majority of 25 Leaders in 1923 Still on Top,” Advertising Age, P.32.
5IAB Proprietary Research
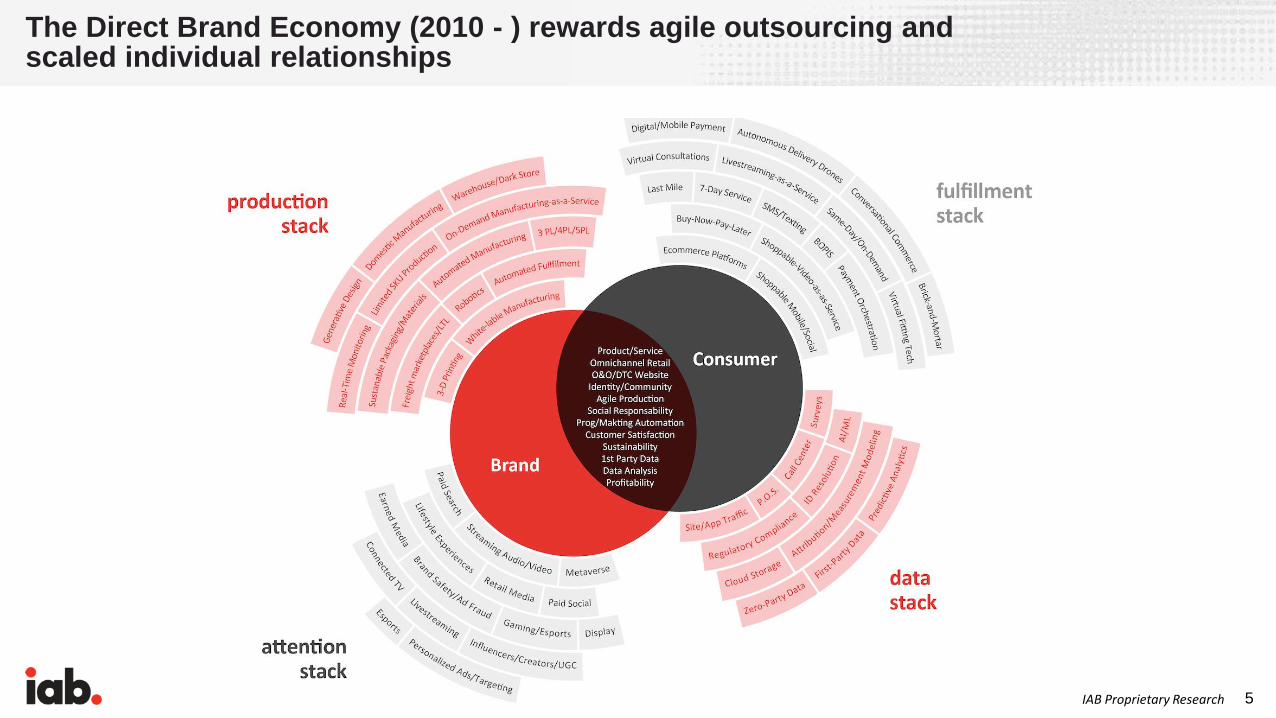
The Direct Brand Economy (2010 - ) rewards agile outsourcing and scaled individual relationships

6IAB Proprietary Research
It is birthing new brands with new attributes, and cultivating new consumer behaviors

IAB Proprietary Research
Digital media democratize the competitiveness of smaller brands…
7
200
# of advertisers
supplying 88% of
U.S. network
television revenue
million# of individual
advertisers on
10
Source: Brian Wieser, Group M; Facebook Earnings Call 10/29/20
IAB Proprietary Research
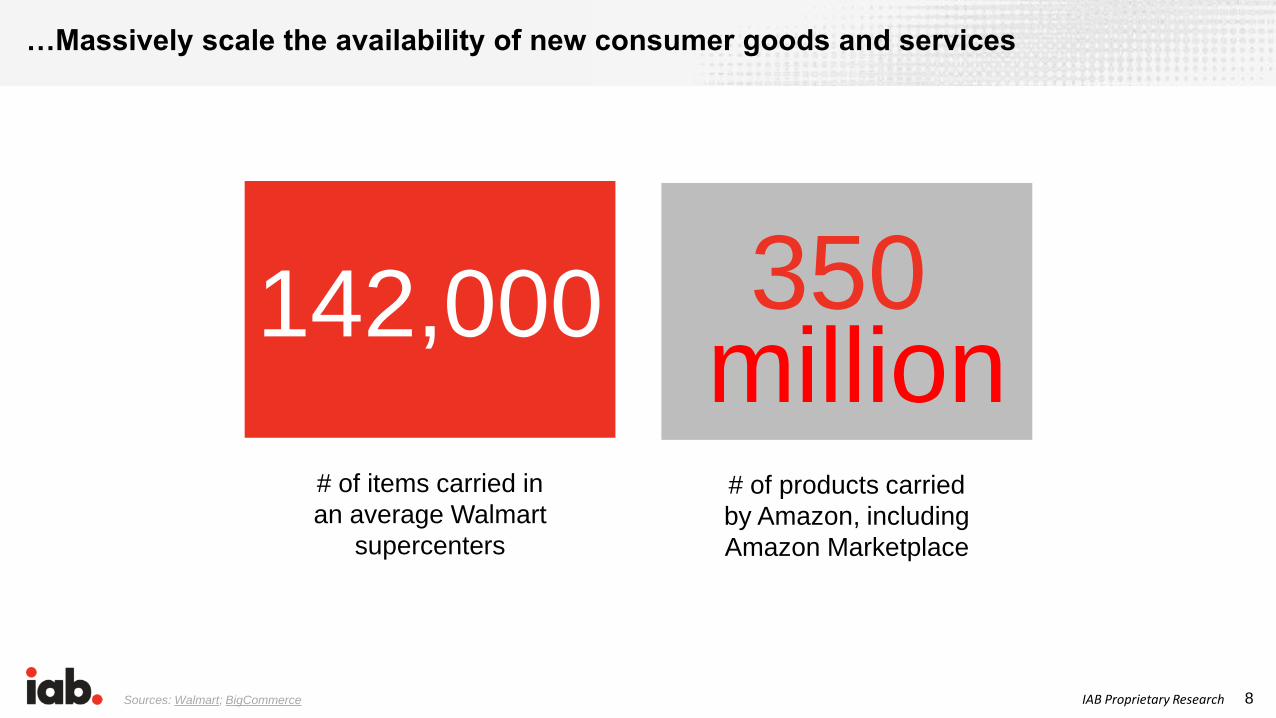
…Massively scale the availability of new consumer goods and services
8
142,000
# of items carried in
an average Walmart
supercenters
# of products carried
by Amazon, including
Amazon Marketplace
350million million
Sources: Walmart; BigCommerce

IAB Proprietary Research
…Increase the reach, segmentation, variability, and complexity of their marketing…
9
8
# of U.S. cable TV
networks with prime-
time ratings above 1
million households
# of YouTube
channels with 1
million+ subscribers
22,000
Sources: Tubics, 11/13/20; The Wrap, 12/30/19
10IAB Proprietary Research
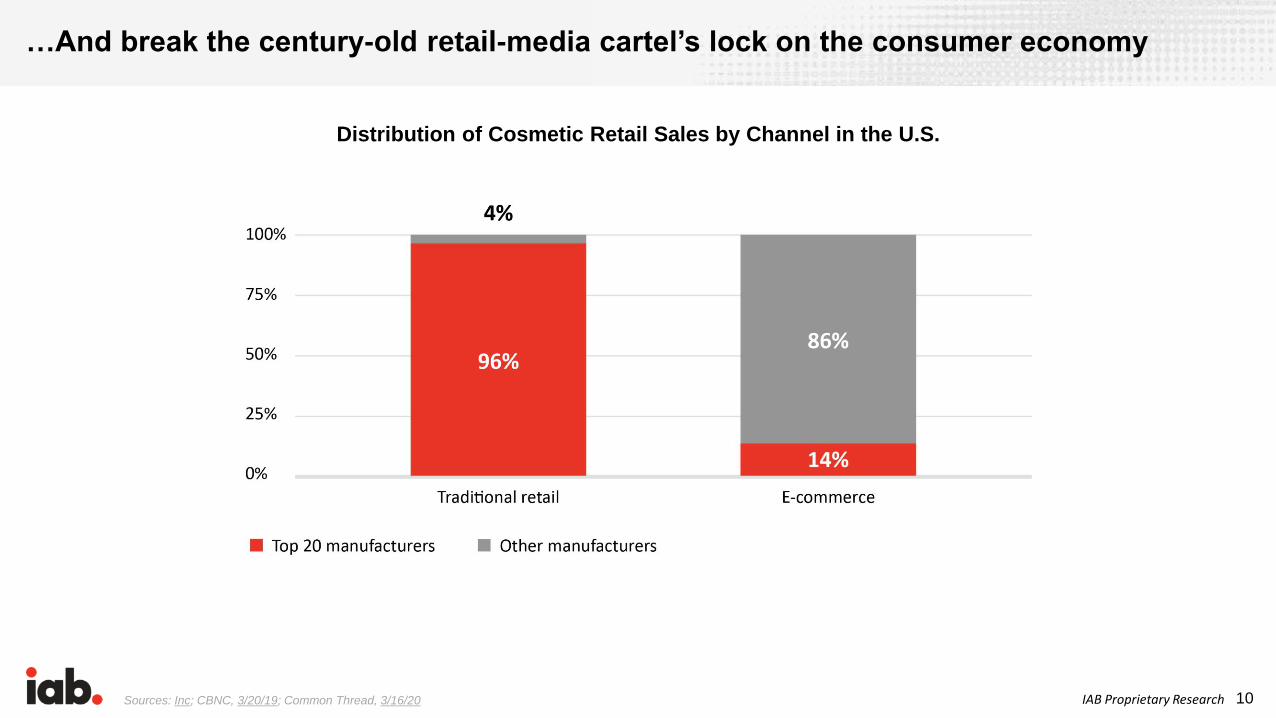
…And break the century-old retail-media cartel’s lock on the consumer economy
Sources: Inc; CBNC, 3/20/19; Common Thread, 3/16/20
Distribution of Cosmetic Retail Sales by Channel in the U.S.

11IAB Proprietary Research
919
129
37
Total E-commmerce Sales DTC E-commerce sales Direct social network sales
Sizing the brand disruption market
Source: eMarketer, 10/11/21; 5/1/21; 2/1/21
U.S. 2021 [Billions]
12IAB Proprietary Research
COVID & Commerce COVID accelerated the transition from a brick-and-mortar consumer economy to a “storeless” economy by 200-300%, permanently altering the brand value chain.

13IAB Proprietary Research
2020 crossed the e-commerce chasm: U.S. sales grew 32% - 2x faster than ever before…
Sources: U.S. Department of Commerce, 8/19/21; Treasure Data, 8/17/2021
$169,921$200,386
$232,196$261,558
$297,989$338,237
$383,466
$443,221
$506,115
$578,501
$762,675
$0
$100,000
$200,000
$300,000
$400,000
$500,000
$600,000
$700,000
$800,000
$900,000
2010 2011 2012 2013 2014 2015 2016 2017 2018 2019 2020
+32%
Yearly U.S. E-commerce Sales
Millions

14IAB Proprietary Research
…While the other markets are stagnant
U.S. Growth: E-commerce vs. Brick-and-Mortar vs. Total Retail vs. GDP, 2010-2020*
*Total Retail sales & Brick-and-Mortar sales include items that cannot be purchased online, i.e. , gas, cars, etc.
Sources: U.S. Department of Commerce, 8/19/21; Retail Dive, 1/19/21; The World Bank
Brands can retain top
line revenue growth—
even as brick and mortar
declines—by leveraging
e-commerce and its
multiple marketing
channels. Despite a
decline in physical
stores, brands that invest
in e-commerce can
match or exceed the
pace of GDP growth.
Insight
15IAB Proprietary Research
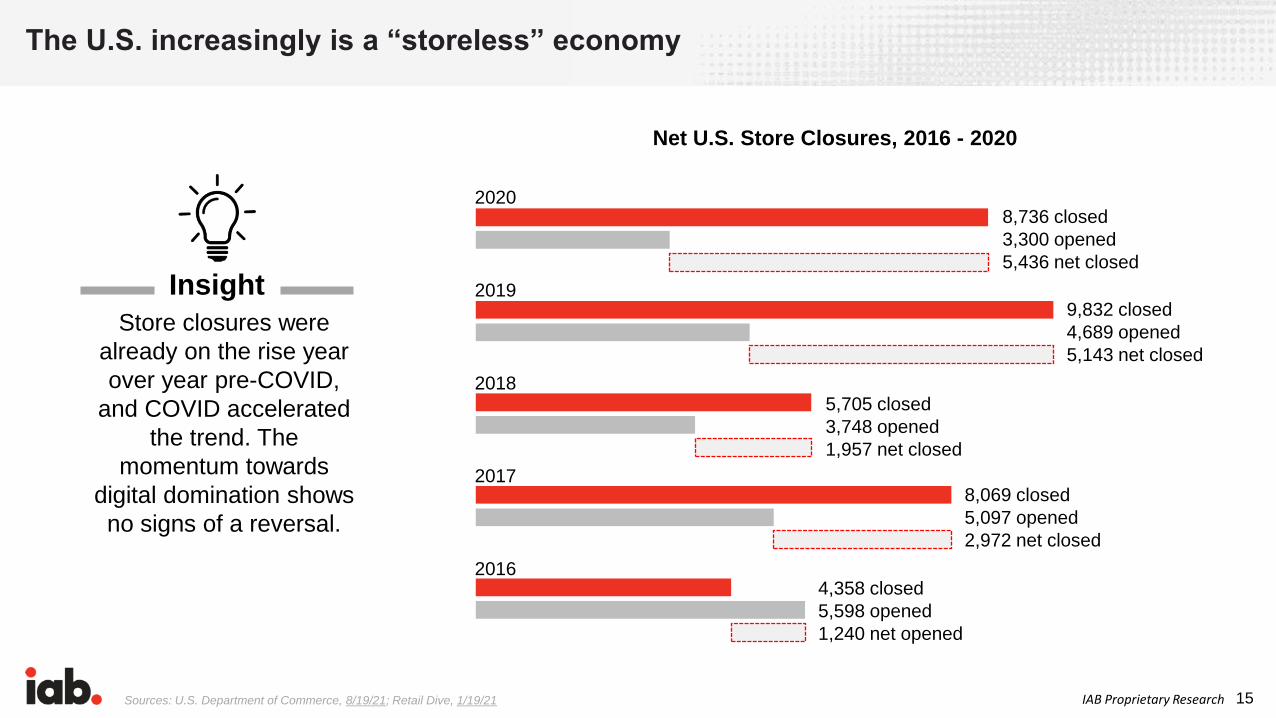
The U.S. increasingly is a “storeless” economy
Sources: U.S. Department of Commerce, 8/19/21; Retail Dive, 1/19/21
Net U.S. Store Closures, 2016 - 2020
Store closures were
already on the rise year
over year pre-COVID,
and COVID accelerated
the trend. The
momentum towards
digital domination shows
no signs of a reversal.
Insight9,832 closed
4,689 opened
5,143 net closed
5,705 closed
3,748 opened
1,957 net closed
8,069 closed
5,097 opened
2,972 net closed
4,358 closed
5,598 opened
1,240 net opened
8,736 closed
3,300 opened
5,436 net closed
2020
2019
2018
2017
2016
16IAB Proprietary Research
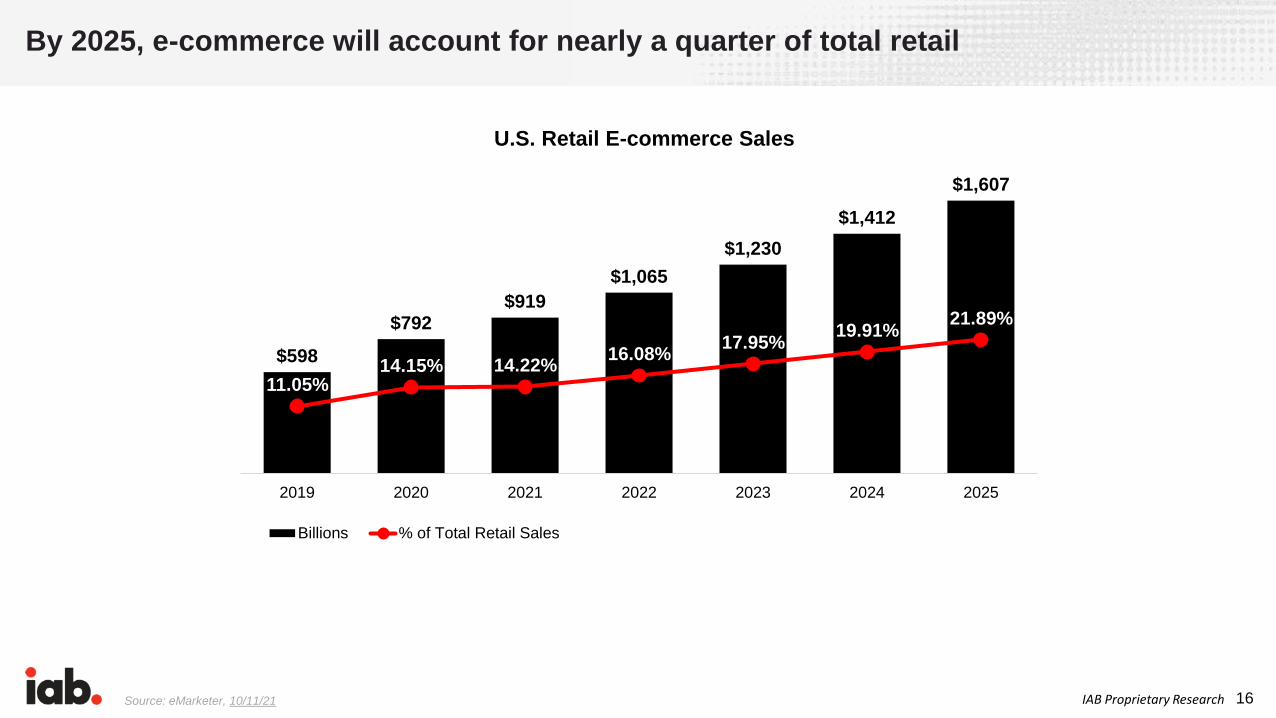
By 2025, e-commerce will account for nearly a quarter of total retail
$598
$792$919
$1,065
$1,230
$1,412
$1,607
11.05%14.15% 14.22%
16.08%17.95%
19.91%21.89%
0%
5%
10%
15%
20%
25%
30%
35%
40%
45%
50%
$0
$200
$400
$600
$800
$1,000
$1,200
$1,400
$1,600
$1,800
2019 2020 2021 2022 2023 2024 2025
Billions % of Total Retail Sales
U.S. Retail E-commerce Sales
Source: eMarketer, 10/11/21
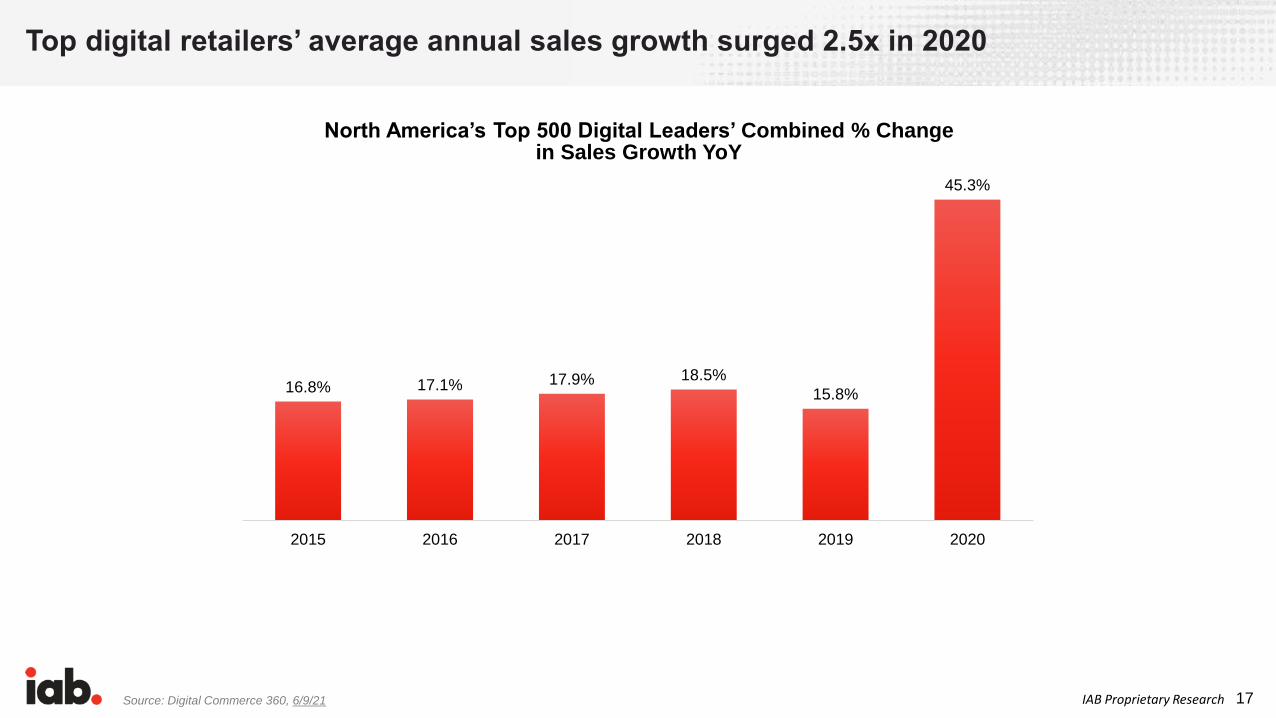
17IAB Proprietary ResearchSource: Digital Commerce 360, 6/9/21
North America’s Top 500 Digital Leaders’ Combined % Change in Sales Growth YoY
Top digital retailers’ average annual sales growth surged 2.5x in 2020
16.8% 17.1% 17.9% 18.5%
15.8%
45.3%
2015 2016 2017 2018 2019 2020

18IAB Proprietary Research
• E-commerce is up 57-58% in Q1 and Q2 of 2021 vs. 2019
• Nearly 2 in 5 consumers plan to shop only via e-commerce for the 2021 holidays
Consumers aren’t coming back like before: Online retail spending exceeds pre-pandemic levels
Sources: U.S. Department of Commerce, 8/19/21; Treasure Data, 8/17/2021; BCG, 6/24/21
Channel Spending Today vs. Before COVID-19
Along both utilitarian and
emotional dimensions—
everything from easing
curbside pickup to
concierge services to
enhanced AR/VR
visualizations—retailers
and brands will need to
reimagine the in-store
experience
Insight
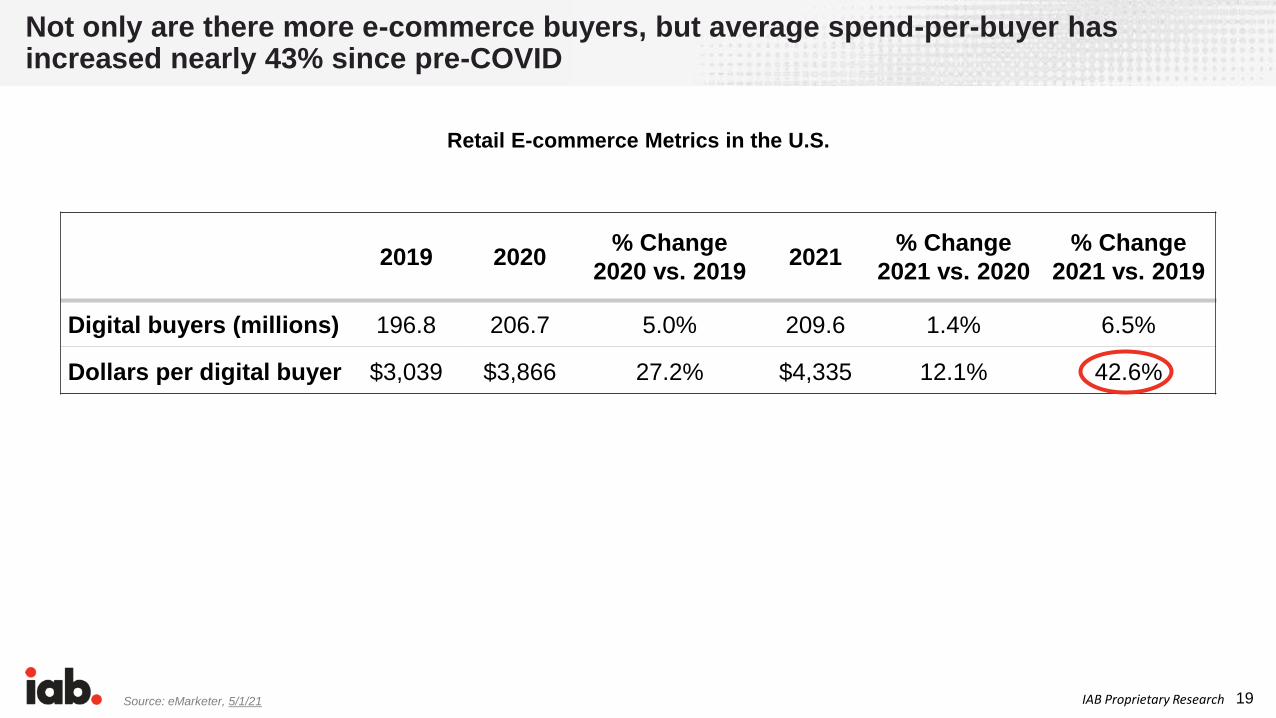
19IAB Proprietary ResearchSource: eMarketer, 5/1/21
2019 2020% Change
2020 vs. 20192021
% Change
2021 vs. 2020
% Change
2021 vs. 2019
Digital buyers (millions) 196.8 206.7 5.0% 209.6 1.4% 6.5%
Dollars per digital buyer $3,039 $3,866 27.2% $4,335 12.1% 42.6%
Retail E-commerce Metrics in the U.S.
Not only are there more e-commerce buyers, but average spend-per-buyer has increased nearly 43% since pre-COVID
20IAB Proprietary Research
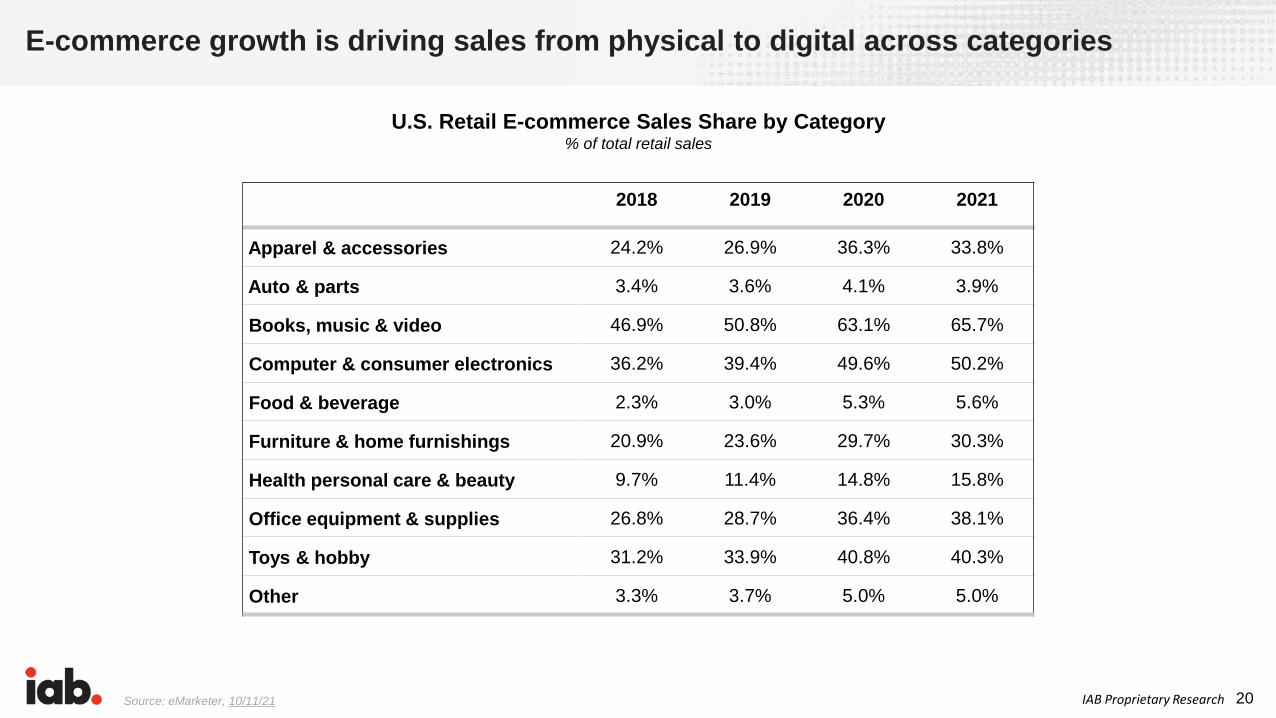
E-commerce growth is driving sales from physical to digital across categories
Source: eMarketer, 10/11/21
U.S. Retail E-commerce Sales Share by Category% of total retail sales
2018 2019 2020 2021
Apparel & accessories 24.2% 26.9% 36.3% 33.8%
Auto & parts 3.4% 3.6% 4.1% 3.9%
Books, music & video 46.9% 50.8% 63.1% 65.7%
Computer & consumer electronics 36.2% 39.4% 49.6% 50.2%
Food & beverage 2.3% 3.0% 5.3% 5.6%
Furniture & home furnishings 20.9% 23.6% 29.7% 30.3%
Health personal care & beauty 9.7% 11.4% 14.8% 15.8%
Office equipment & supplies 26.8% 28.7% 36.4% 38.1%
Toys & hobby 31.2% 33.9% 40.8% 40.3%
Other 3.3% 3.7% 5.0% 5.0%

IAB Proprietary Research 21Sources: Financial Times, 8/11/20; McKinsey, 8/7/20
COVID is turning most consumer categories into majority-online by purchase %
Consumers' use of online channel before and expected use after COVID-191,2
% of respondents purchasing online3
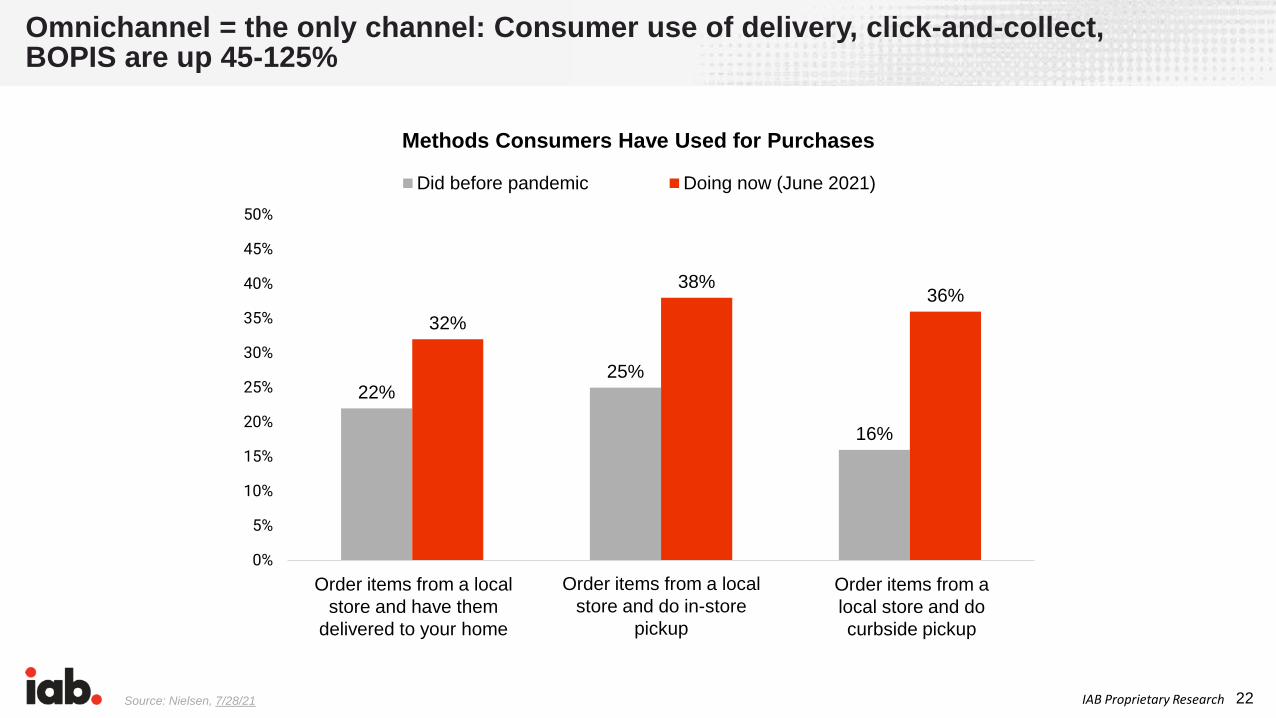
22IAB Proprietary Research
Methods Consumers Have Used for Purchases
Source: Nielsen, 7/28/21
Omnichannel = the only channel: Consumer use of delivery, click-and-collect, BOPIS are up 45-125%
22%25%
16%
32%
38%36%
0%
5%
10%
15%
20%
25%
30%
35%
40%
45%
50%
Did before pandemic Doing now (June 2021)
Order items from a local
store and have them
delivered to your home
Order items from a local
store and do in-store
pickup
Order items from a
local store and do
curbside pickup
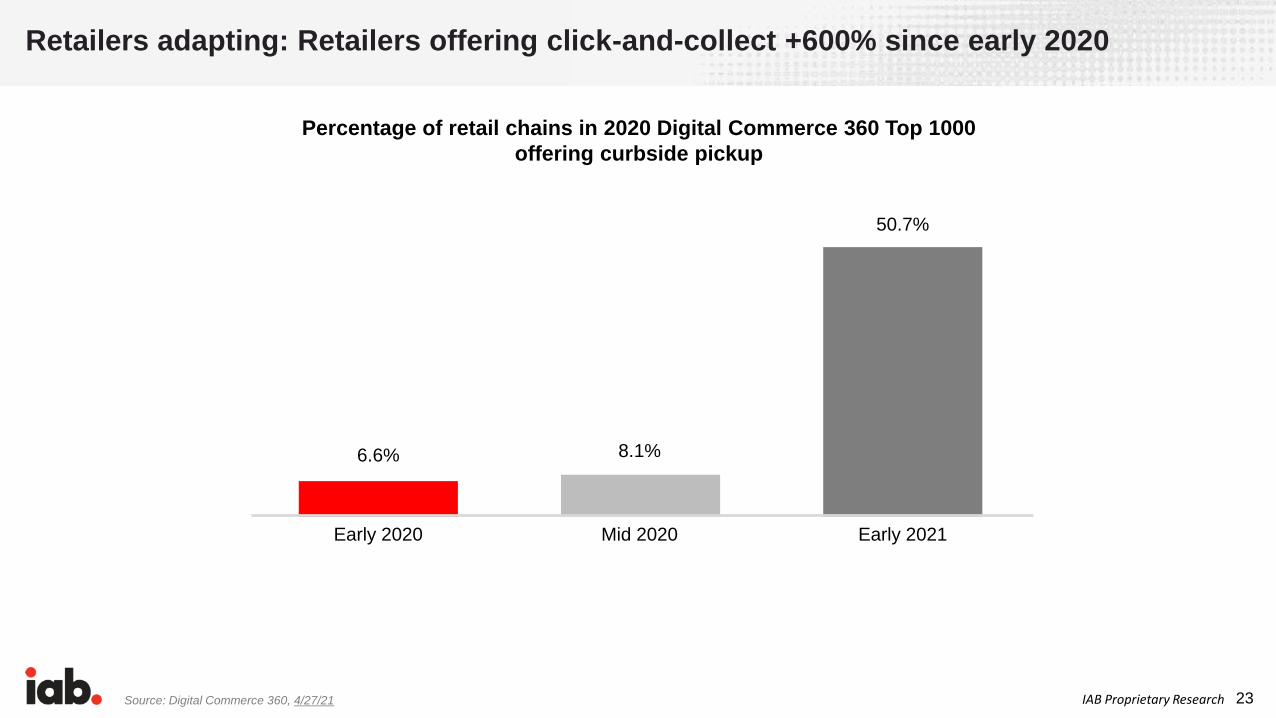
23IAB Proprietary ResearchSource: Digital Commerce 360, 4/27/21
Retailers adapting: Retailers offering click-and-collect +600% since early 2020
Percentage of retail chains in 2020 Digital Commerce 360 Top 1000
offering curbside pickup
Early 2020 Mid 2020 Early 2021
6.6% 8.1%
50.7%
24IAB Proprietary Research
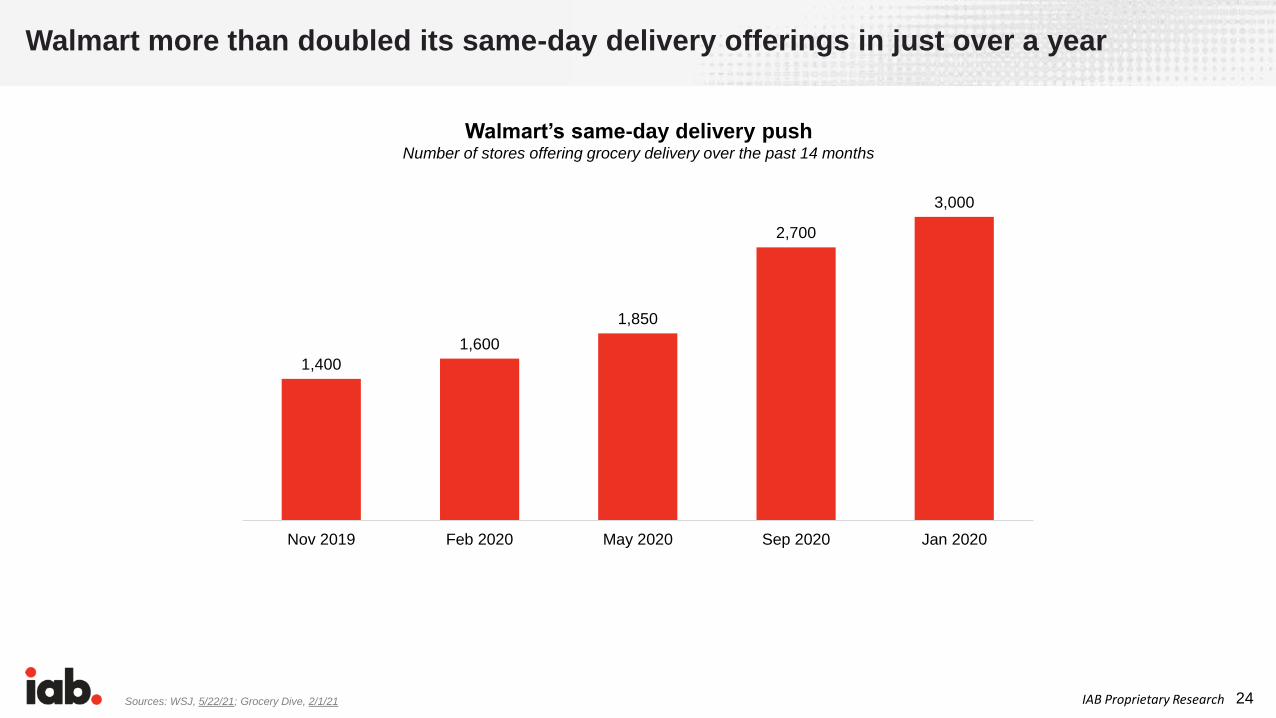
1,400
1,600
1,850
2,700
3,000
Nov 2019 Feb 2020 May 2020 Sep 2020 Jan 2020
Walmart more than doubled its same-day delivery offerings in just over a year
Sources: WSJ, 5/22/21; Grocery Dive, 2/1/21
Walmart’s same-day delivery push Number of stores offering grocery delivery over the past 14 months
25IAB Proprietary ResearchSources: Modern Retail, 8/3/21; Adweek, 7/9/21; Bloomberg, 5/24/21; Supply Chain Dive, 4/16/21
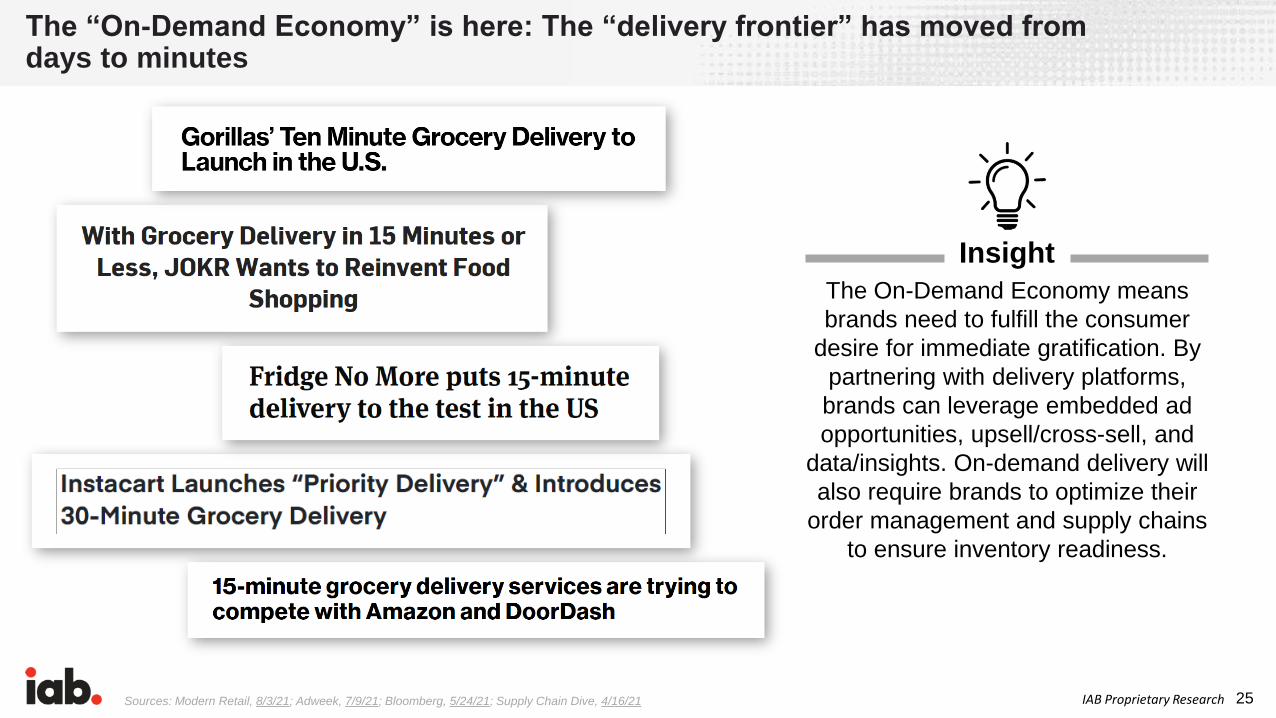
The “On-Demand Economy” is here: The “delivery frontier” has moved from days to minutes
The On-Demand Economy means
brands need to fulfill the consumer
desire for immediate gratification. By
partnering with delivery platforms,
brands can leverage embedded ad
opportunities, upsell/cross-sell, and
data/insights. On-demand delivery will
also require brands to optimize their
order management and supply chains
to ensure inventory readiness.
Insight
26IAB Proprietary ResearchSource: CB Insights, 5/10/21
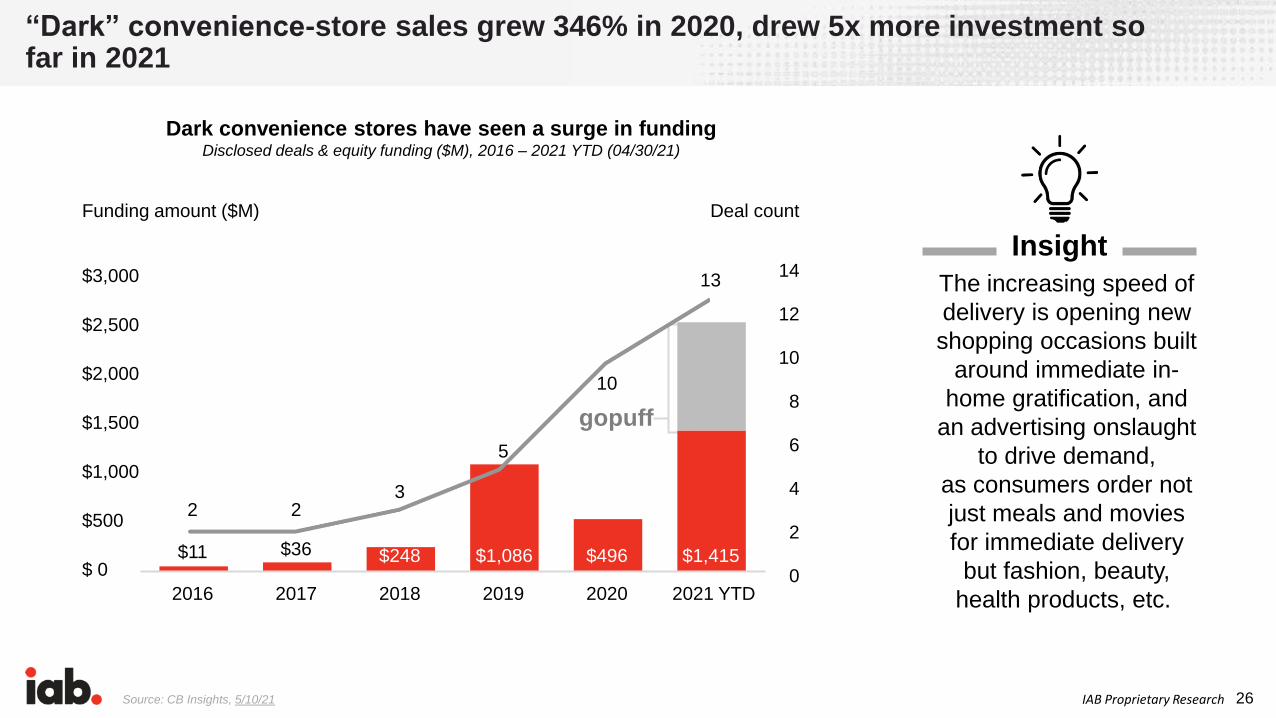
“Dark” convenience-store sales grew 346% in 2020, drew 5x more investment so far in 2021
The increasing speed of
delivery is opening new
shopping occasions built
around immediate in-
home gratification, and
an advertising onslaught
to drive demand,
as consumers order not
just meals and movies
for immediate delivery
but fashion, beauty,
health products, etc.
Insight
Dark convenience stores have seen a surge in fundingDisclosed deals & equity funding ($M), 2016 – 2021 YTD (04/30/21)
Funding amount ($M)
$3,000
$2,500
$2,000
$1,500
$1,000
$500
$ 0
Deal count
14
12
10
8
6
4
2
0
$11
2
2016
$36
2
2017
$248
3
2018
$1,086
5
2019
$496
10
2020
$1,415
13
$1,150
2021 YTD
gopuff

27IAB Proprietary Research
Stores are becoming digitally-powered ecosystems to serve each stage of the omnichannel shopping process
Virtual try-on
BOPIS
Click-and-collect
Curbside pickup
Smart packagingVirtual measurement
Selling/cross-sellingAutomated checkout
Shopper profile

28IAB Proprietary ResearchSources: WSJ, 8/24/21; Retail Dive, 8/19/21; Amazon, 6/5/21; HBR.org, 6/4/21; CB Insights, 4/21/21
Stores are being customized to match regional online shopping habits, bypass checkout, and streamline shoppertainment, social spaces, and BOPIS
29IAB Proprietary ResearchSource: ThredUp, 6/23/21
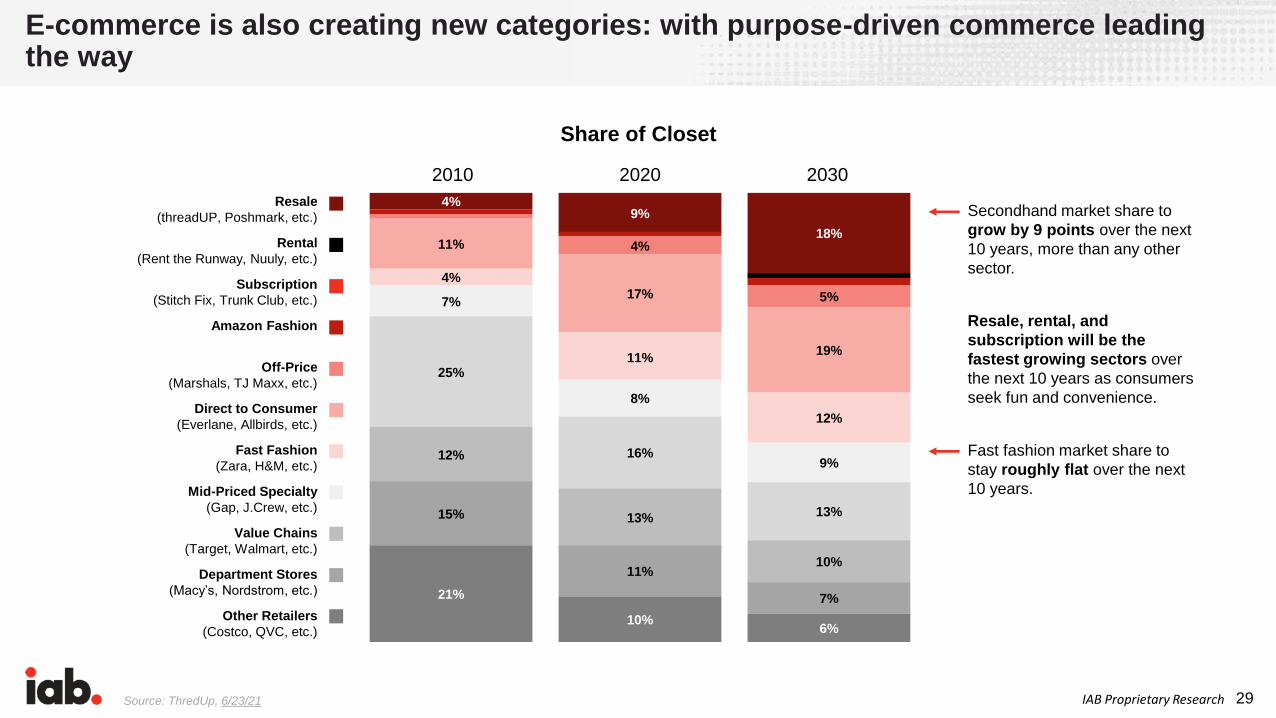
Share of Closet
E-commerce is also creating new categories: with purpose-driven commerce leading the way
Secondhand market share to
grow by 9 points over the next
10 years, more than any other
sector.
Resale, rental, and
subscription will be the
fastest growing sectors over
the next 10 years as consumers
seek fun and convenience.
Fast fashion market share to
stay roughly flat over the next
10 years.
Resale
(threadUP, Poshmark, etc.)
Rental
(Rent the Runway, Nuuly, etc.)
Subscription
(Stitch Fix, Trunk Club, etc.)
Amazon Fashion
Off-Price
(Marshals, TJ Maxx, etc.)
Direct to Consumer
(Everlane, Allbirds, etc.)
Fast Fashion
(Zara, H&M, etc.)
Mid-Priced Specialty
(Gap, J.Crew, etc.)
Value Chains
(Target, Walmart, etc.)
Department Stores
(Macy’s, Nordstrom, etc.)
Other Retailers
(Costco, QVC, etc.)
2010
4%
11%
4%
7%
25%
12%
15%
21%
2020
9%
4%
17%
11%
8%
16%
13%
11%
10%
2030
18%
5%
19%
12%
9%
13%
10%
7%
6%
30IAB Proprietary ResearchSource: McKinsey, 8/11/21
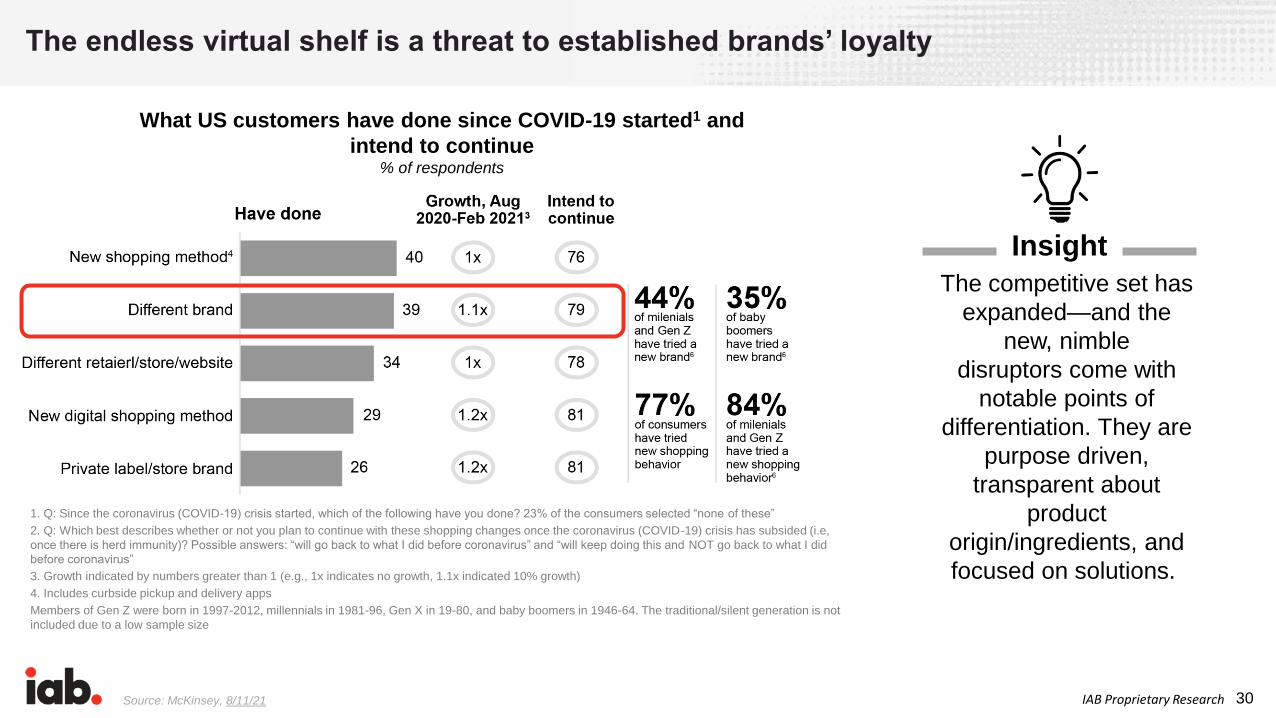
The endless virtual shelf is a threat to established brands’ loyalty
The competitive set has
expanded—and the
new, nimble
disruptors come with
notable points of
differentiation. They are
purpose driven,
transparent about
product
origin/ingredients, and
focused on solutions.
Insight
What US customers have done since COVID-19 started1 and
intend to continue% of respondents
1. Q: Since the coronavirus (COVID-19) crisis started, which of the following have you done? 23% of the consumers selected “none of these”
2. Q: Which best describes whether or not you plan to continue with these shopping changes once the coronavirus (COVID-19) crisis has subsided (i.e,
once there is herd immunity)? Possible answers: “will go back to what I did before coronavirus” and “will keep doing this and NOT go back to what I did
before coronavirus”
3. Growth indicated by numbers greater than 1 (e.g., 1x indicates no growth, 1.1x indicated 10% growth)
4. Includes curbside pickup and delivery apps
Members of Gen Z were born in 1997-2012, millennials in 1981-96, Gen X in 19-80, and baby boomers in 1946-64. The traditional/silent generation is not
included due to a low sample size

31IAB Proprietary Research
+0.6
+0.5
18.3
15.4
Sources: BCG & IRI, 3/11/21; Sources: Treasure Data, 8/17/21; Instacart, 4/6/21
The endless e-comm shelf allows small CPG brands to grow 2x faster than large incumbents – and to take share
47.8
17.9
11.6
8.1
14.5
46.0
18.0
12.0
8.2
15.7
44.9
17.9
12.6
8.8
16.0
$801billion
$845billion
$933billion
2016 2019 2020
+0.1
+1.2
+0.1
+0.4
-1.8
-0.2
+0.2
-1.2
Total CPG market
Private label manufacturers
Extra-small manufacturers
Small manufacturers
Midsize manufacturers
Large manufacturers
1.8
4.5
2.1
3.0
1.9
0.5
10.4
11.9
9.5
7.5
Revenue
CARG
2016-2019 (%)
Revenue
growth
2020 (%)
CPG sales revenue (%)
Sources: IRI data for multioutlet and convenience (MULO+C); BCG analysis.
Note: Large companies were defined as companies that had sales of more than $6 billion in 2020.

32IAB Proprietary Research
When consumers go digital, disruptor brands benefit most
Sources: Digital Commerce 360, 9/2/21; CB Insights, 5/11/21; Retail Dive, 5/5/21; CNBC, 3/17/21; Tech Crunch, 3/4/21; Gap, 3/4/21; Macy’s via BusinessWire, 2/23/21
• Overall, the apparel
category declined 12%
in 2020
• Disruptor brands
ThredUp, Allbirds, and
Stitch Fix saw revenue
increases YoY: 14%,
13%, and 11%,
respectively
Market Disruption
First-Wave Disruptors
Contending Disruptors
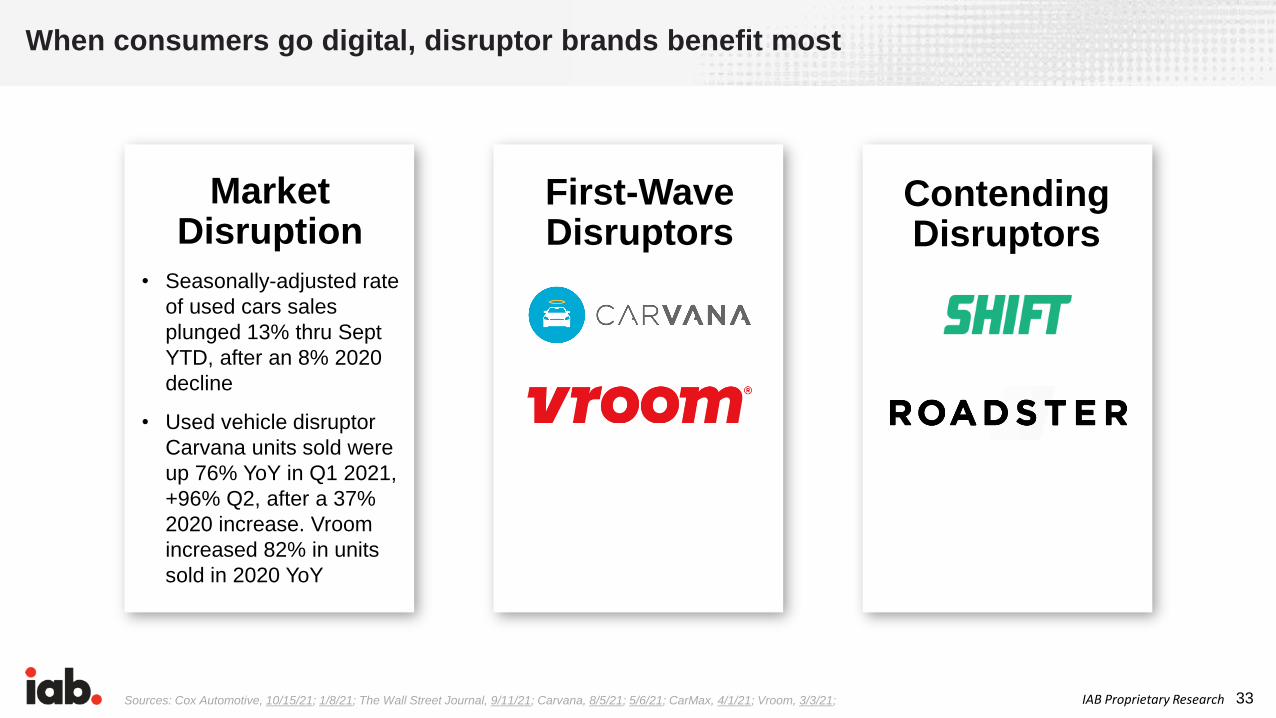
33IAB Proprietary Research
Market Disruption
First-Wave Disruptors
Contending Disruptors
When consumers go digital, disruptor brands benefit most
Sources: Cox Automotive, 10/15/21; 1/8/21; The Wall Street Journal, 9/11/21; Carvana, 8/5/21; 5/6/21; CarMax, 4/1/21; Vroom, 3/3/21;
• Seasonally-adjusted rate
of used cars sales
plunged 13% thru Sept
YTD, after an 8% 2020
decline
• Used vehicle disruptor
Carvana units sold were
up 76% YoY in Q1 2021,
+96% Q2, after a 37%
2020 increase. Vroom
increased 82% in units
sold in 2020 YoY
34IAB Proprietary Research
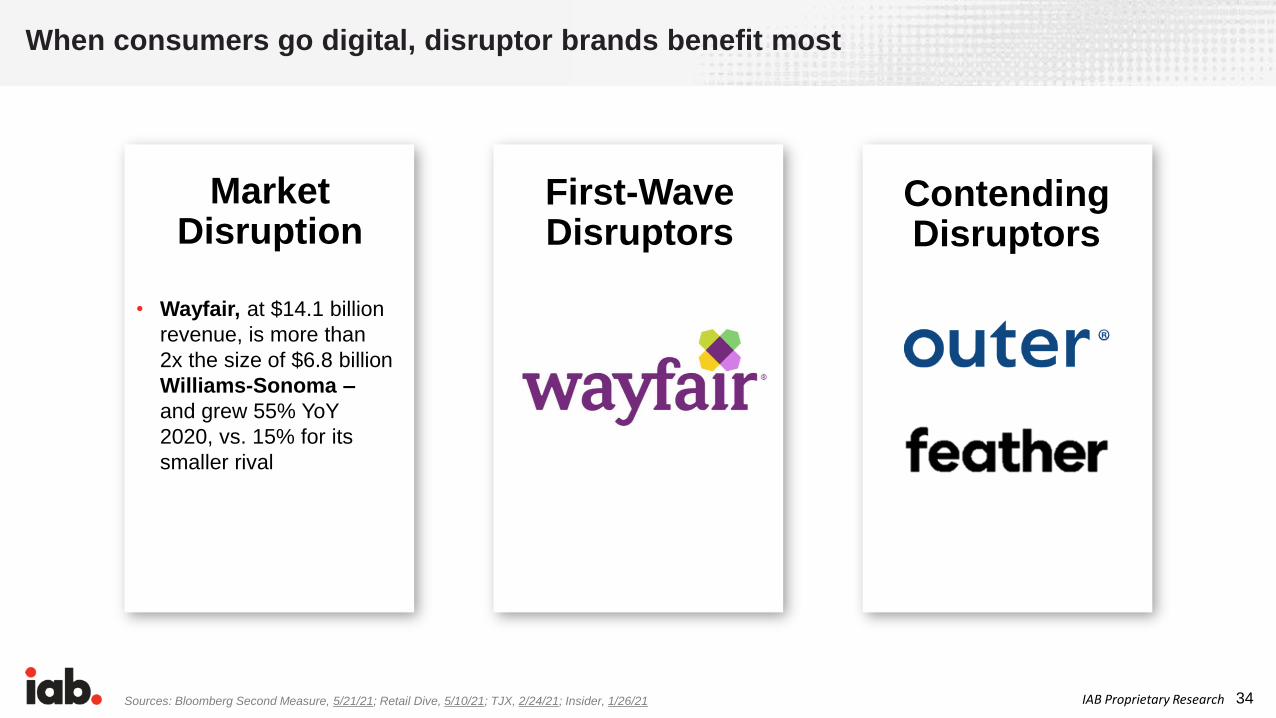
Market Disruption
First-Wave Disruptors
Contending Disruptors
Sources: Bloomberg Second Measure, 5/21/21; Retail Dive, 5/10/21; TJX, 2/24/21; Insider, 1/26/21
• Wayfair, at $14.1 billion
revenue, is more than
2x the size of $6.8 billion
Williams-Sonoma –
and grew 55% YoY
2020, vs. 15% for its
smaller rival
When consumers go digital, disruptor brands benefit most

35IAB Proprietary Research
Market Disruption
First-Wave Disruptors
Contending Disruptors
When consumers go digital, disruptor brands benefit most
Sources: Fortune, 6/2/21; Petfood Industry 3/26/21
• Pet food sales grew
10% in 2020
• Chewy’s net sales
grew 47% to $7.15
billion – landing it on
the Fortune 500 list of
largest U.S. companies
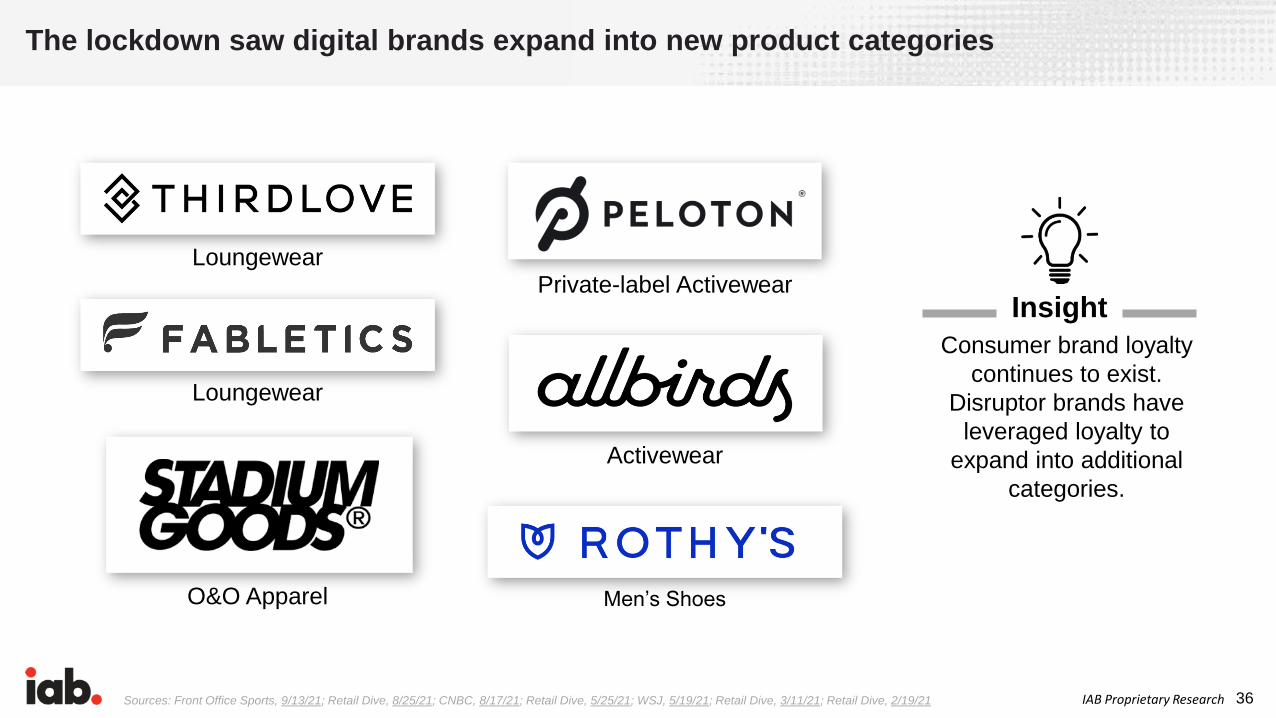
36IAB Proprietary ResearchSources: Front Office Sports, 9/13/21; Retail Dive, 8/25/21; CNBC, 8/17/21; Retail Dive, 5/25/21; WSJ, 5/19/21; Retail Dive, 3/11/21; Retail Dive, 2/19/21
Loungewear
Loungewear
O&O Apparel
Private-label Activewear
Activewear
Men’s Shoes
The lockdown saw digital brands expand into new product categories
Consumer brand loyalty
continues to exist.
Disruptor brands have
leveraged loyalty to
expand into additional
categories.
Insight

37IAB Proprietary Research
With their Gen Z appeal, Direct Brands are now colonizing major chain retailers
Source: Retail Dive, 8/9/21; 7/19/21; 6/23/21; 5/4/21; 4/13/21; 3/15/21
Big Box retailers are
giving prominent instore
placement to smaller
brands—
thereby decreasing shelf
space for traditional,
dominant players.
Insight

38IAB Proprietary ResearchSources: Footwear News, 7/21/21; Forbes, 4/12/21; Retail Dive, 3/11/21; Quartz, 3/10/21
Big brands are now disrupting themselves
DTC sales increased nearly 80% YoY, making up 52% of Q2 revenues
DTC sales represented ~40% of sales in 2020;
goal is 60% in 2021
Aims for DTC to be 50% of sales by 2025—up 66% vs.
pre-pandemic Brands are seeing the
benefit of D2C, as they
increase both top line
revenue and margin.
Insight

39IAB Proprietary Research
Overhauled its wholesale partnerships and exited 2-3K N.A. stores; Q4 2020 DTC sales increased 11% to $655M
Sources: Knix, 5/19/21; Yahoo! Finance, 4/5/21; Retail Dive, 10/30/20
Changed from wholesale to DTC by pulling out of 700 third-party retail
stores; now reports a five-year avg. annual growth rate of 150%
…As many established brands dramatically cut wholesale ties

40IAB Proprietary Research
2021’s biggest brand crisis: Supply chain bottlenecks
Sources: Bloomberg, 9/8/21; Supply Chain Dive, 7/13/21; WSJ, 7/5/21; Supply Chain Dive, 6/23/21; Modern Retail, 5/4/21
While all brands are being impacted
by supply chain challenges, larger
brands likely have the cash reserves
to weather these challenges.
Heightened consumer expectations for
speed, personalization, and mission
mean brands will have to be
transparent regarding origin,
supply, and availability.
Insight

41IAB Proprietary Research
More than half of companies are investing in digital supply chain resiliency
Source: MHI & Deloitte, 4/14/21
Change in Supply Chain Investments
Inventory and Network Optimization Tools
Cloud Computing and Storage
Robotics and Automation
Sensors and Automation Identification
Predictive and Prescriptive Analysis
Industrial Internet-of-Things (IoT)
Artificial Intelligent Technologies
Autonomous Vehicles and Drones
Wearable and Mobile Technology
3D Printing
Block Chain and Distributed Ledger Technologies
25%0% 75%50% 100%
Substantially increasing investment Increasing investment No change Decreasing investment Substantially decreasing investment

42IAB Proprietary Research
$4,733 $5,406 $5,377 $10,284 $5,328 $3,632 $2,188 $4,344 $3,313 $2,376 $8,675 $8,565 $9,637$0
$2,000
$4,000
$6,000
$8,000
$10,000
$12,000
Q2'18 Q3'18 Q4'18 Q1'19 Q2'19 Q3'19 Q4'19 Q1'20 Q2'20 Q3'20 Q4'20 Q1'21 Q2'21
E-commerce sales
Source: CB Insights, 7/21/21
Since Q4 ‘20, supply chain tech deals/funding are up 2-3X as emerging tech is a key element to innovation
Supply chain deals and funding pick up in Quarterly global supply chain & logistics tech deals and funding ($M), Q2’18 – Q2’21
159
144148
142
183
164
148
177
158
113
142147
152
0
50
100
150
200
Deal count
# Of DealsTotal Funding

43IAB Proprietary Research
Big brands made significantly more production, fulfillment, and data adjustments
Source: IAB Brand Disruption Survey 2021, DTCs founded 2004+ n=198, Big Brands n=133; Survey Q: Have you done any of the following as a result of the market disruptions
since the COVID outbreak (Q1 2020)?
Changed production/manufacturing operation or processes
Changed fulfillment/supply chain operations or processes
Changed/added target customer(s)
Increased investment, resources or initiatives towards data
Changed the product/service offering
Changed, cancelled or enlisted a new 3P logistics partner 22%
26%
25%
31%
30%
31%
27%
35%
47%
38%
44%
48%
DTCs
Actions Taken as a Result of the Market Disruptions Since the COVID OutbreakSorted by combination of DTCs and Big Brands responses (total)
Big Brands

44IAB Proprietary ResearchSources: Suma Brands via PR Newswire, 8/4/21; Multichannel Merchant, 7/19/21; Tech Crunch, 7/13/21; Foundry via Business Wire, 7/12/21; Retail Dive, 6/30/21;
Tech Crunch, 2/10/21; Branded Group via PR Newswire, 2/9/21; PYMNTS, 1/28/21
For disruptors, expect logistics, production, & marketing consolidation

45IAB Proprietary Research
The Data Dilemma 95% of brands are changing their data strategies over privacy concerns. To thrive in the post-cookie/ID ecosystem, brands need to pursue a four-pronged strategy that includes 1P data, alternative IDs, contextual signals, and anonymous cohorts.
46IAB Proprietary ResearchSources: Food Business News, 2/24/20; Medium, 1/16/20
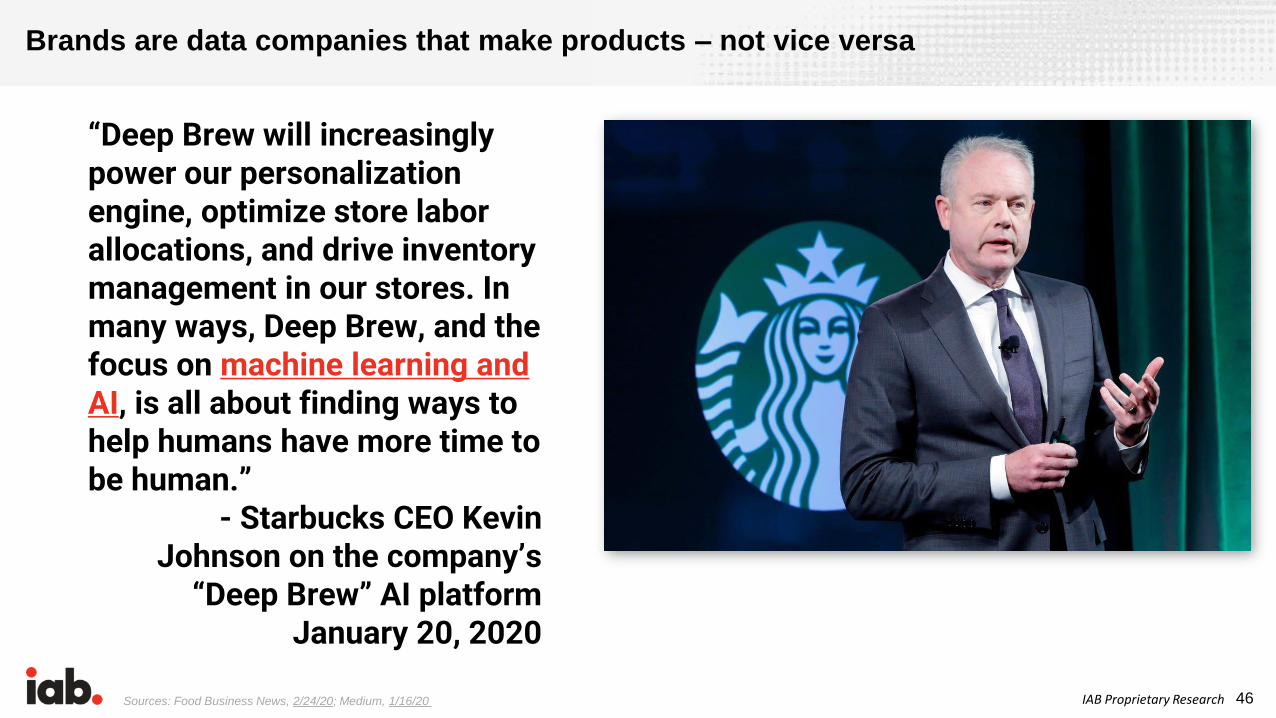
Brands are data companies that make products – not vice versa
“Deep Brew will increasingly power our personalization engine, optimize store labor allocations, and drive inventory management in our stores. In many ways, Deep Brew, and the focus on machine learning and AI, is all about finding ways to help humans have more time to be human.”
- Starbucks CEO Kevin Johnson on the company’s
“Deep Brew” AI platformJanuary 20, 2020

47IAB Proprietary ResearchSources: The New York Times, 10/29/21; CNBC, 2/1/21
The data battle line has been drawn
“If a business is built on misleading
users, on data exploitation, on
choices that are no choices at all, it
does not deserve our praise. It
deserves reform.”
“[The gatekeeping of the mobile app
ecosystem is] stifling innovation,
stopping people from building new
things, and holding back the entire
internet economy.”
48IAB Proprietary Research
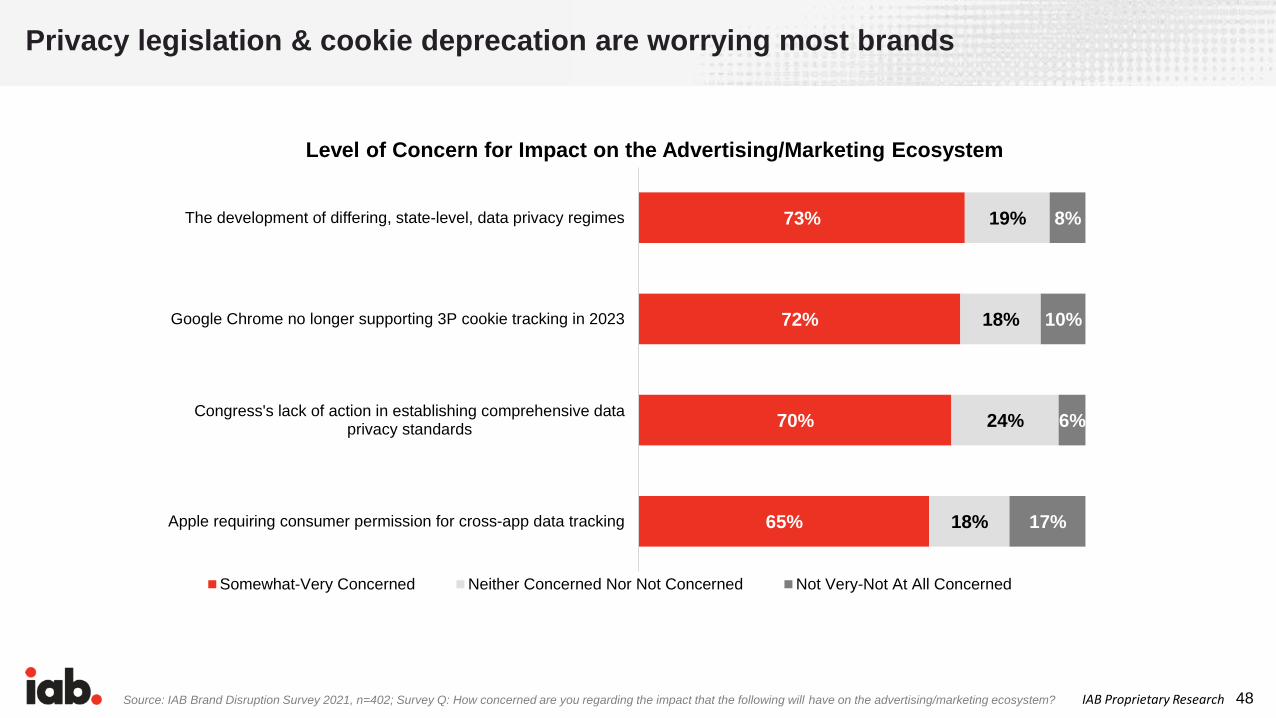
Privacy legislation & cookie deprecation are worrying most brands
Source: IAB Brand Disruption Survey 2021, n=402; Survey Q: How concerned are you regarding the impact that the following will have on the advertising/marketing ecosystem?
Level of Concern for Impact on the Advertising/Marketing Ecosystem
73%
72%
70%
65%
19%
18%
24%
18%
8%
10%
6%
17%
The development of differing, state-level, data privacy regimes
Google Chrome no longer supporting 3P cookie tracking in 2023
Congress's lack of action in establishing comprehensive dataprivacy standards
Apple requiring consumer permission for cross-app data tracking
Somewhat-Very Concerned Neither Concerned Nor Not Concerned Not Very-Not At All Concerned
49IAB Proprietary Research
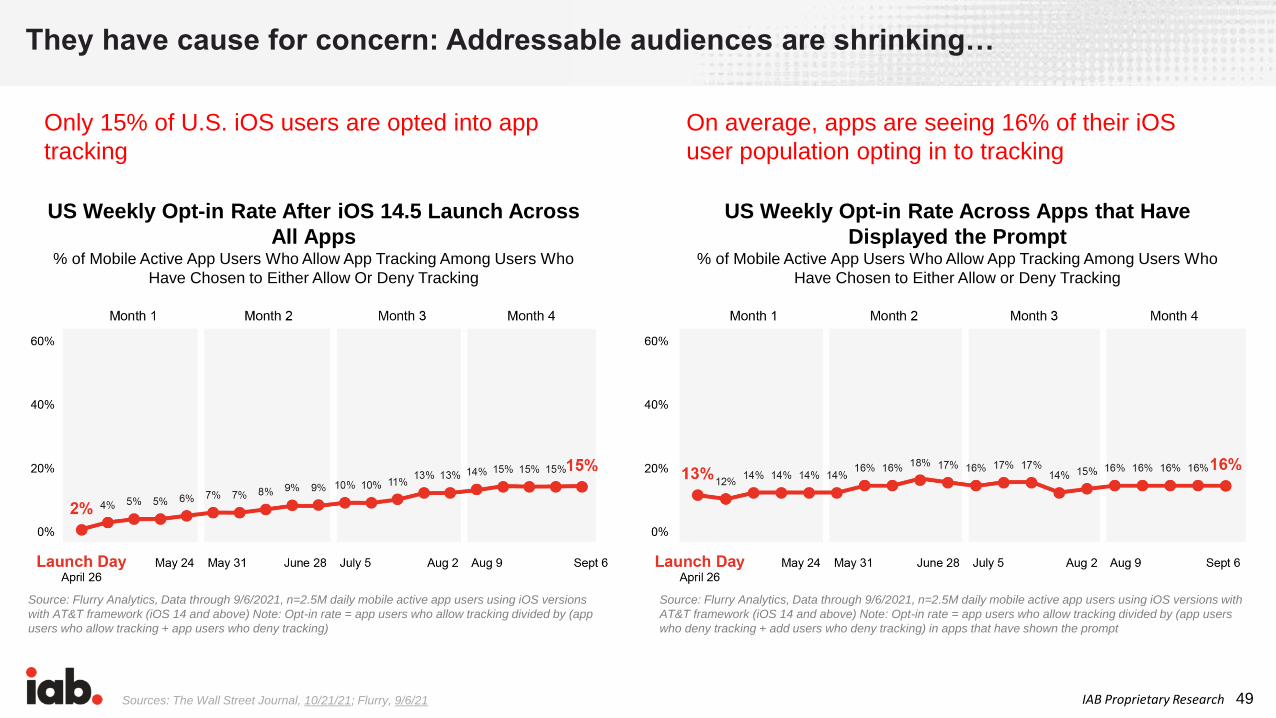
They have cause for concern: Addressable audiences are shrinking…
Only 15% of U.S. iOS users are opted into app
tracking
On average, apps are seeing 16% of their iOS
user population opting in to tracking
Sources: The Wall Street Journal, 10/21/21; Flurry, 9/6/21
US Weekly Opt-in Rate After iOS 14.5 Launch Across
All Apps% of Mobile Active App Users Who Allow App Tracking Among Users Who
Have Chosen to Either Allow Or Deny Tracking
Source: Flurry Analytics, Data through 9/6/2021, n=2.5M daily mobile active app users using iOS versions
with AT&T framework (iOS 14 and above) Note: Opt-in rate = app users who allow tracking divided by (app
users who allow tracking + app users who deny tracking)
US Weekly Opt-in Rate Across Apps that Have
Displayed the Prompt% of Mobile Active App Users Who Allow App Tracking Among Users Who
Have Chosen to Either Allow or Deny Tracking
Source: Flurry Analytics, Data through 9/6/2021, n=2.5M daily mobile active app users using iOS versions with
AT&T framework (iOS 14 and above) Note: Opt-in rate = app users who allow tracking divided by (app users
who deny tracking + add users who deny tracking) in apps that have shown the prompt
50IAB Proprietary Research
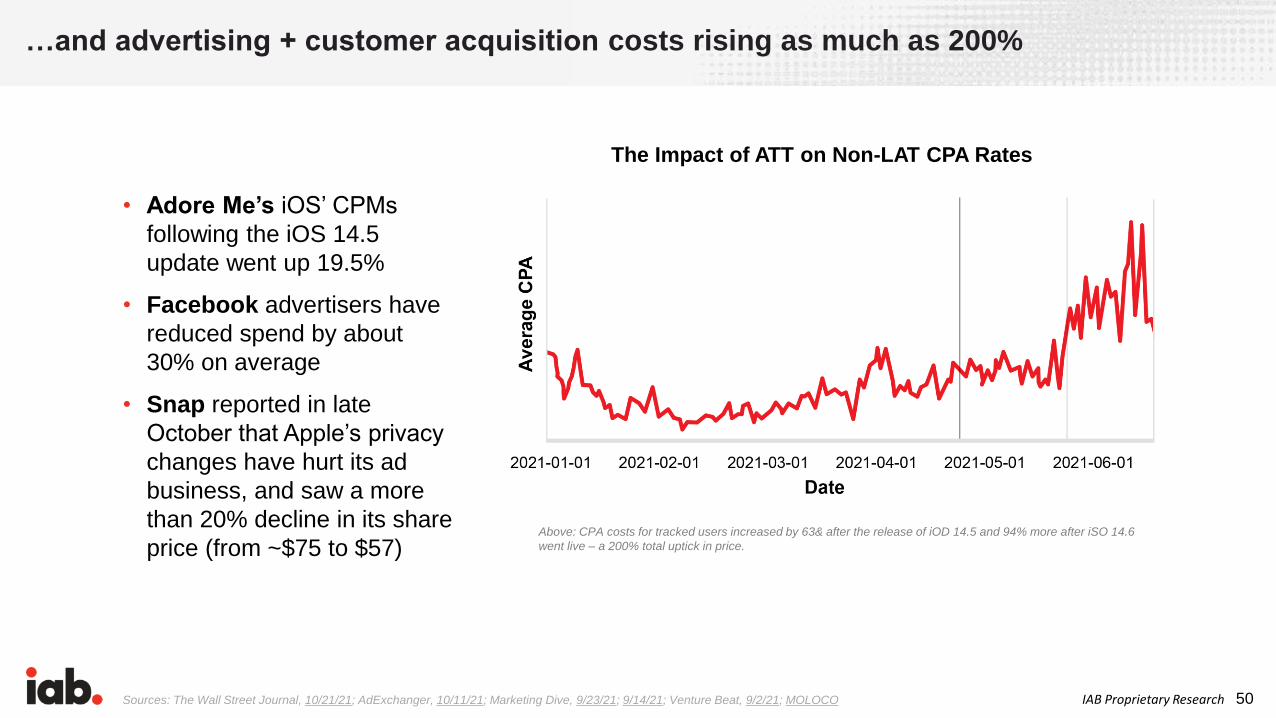
• Adore Me’s iOS’ CPMs
following the iOS 14.5
update went up 19.5%
• Facebook advertisers have
reduced spend by about
30% on average
• Snap reported in late
October that Apple’s privacy
changes have hurt its ad
business, and saw a more
than 20% decline in its share
price (from ~$75 to $57)
Sources: The Wall Street Journal, 10/21/21; AdExchanger, 10/11/21; Marketing Dive, 9/23/21; 9/14/21; Venture Beat, 9/2/21; MOLOCO
…and advertising + customer acquisition costs rising as much as 200%
Above: CPA costs for tracked users increased by 63& after the release of iOD 14.5 and 94% more after iSO 14.6
went live – a 200% total uptick in price.
The Impact of ATT on Non-LAT CPA Rates
51IAB Proprietary Research
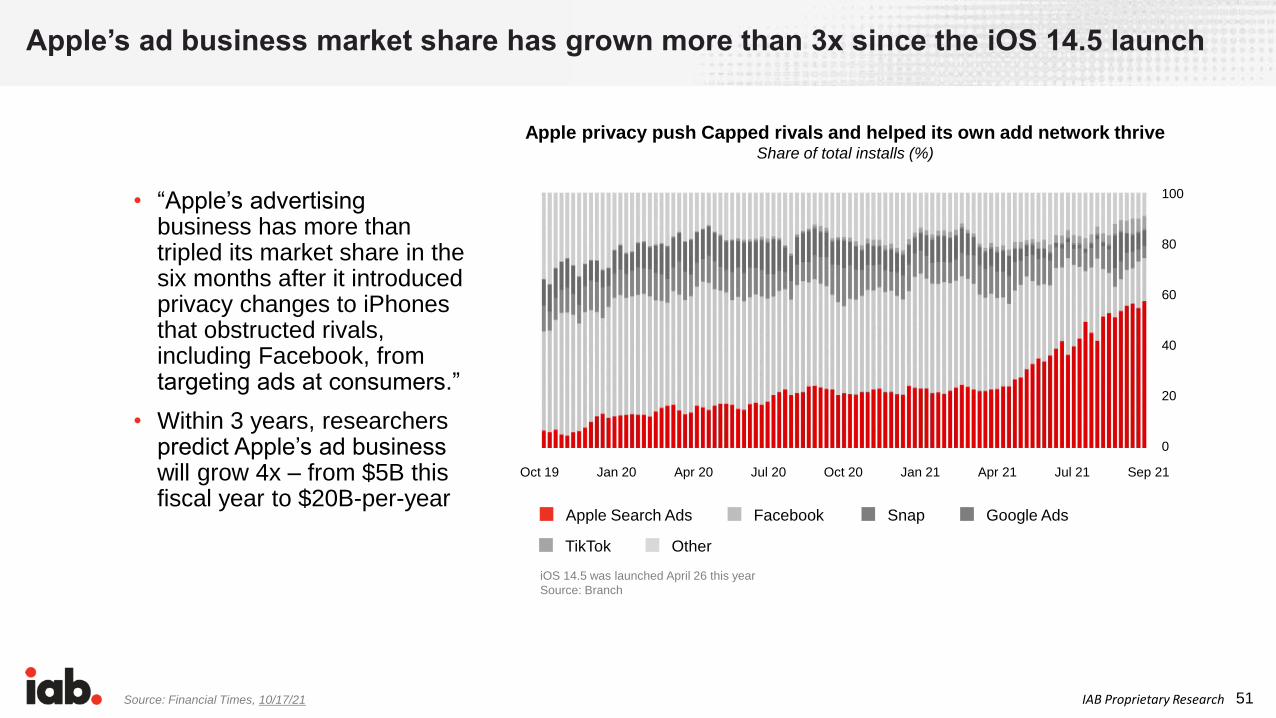
Apple’s ad business market share has grown more than 3x since the iOS 14.5 launch
Source: Financial Times, 10/17/21
• “Apple’s advertising business has more than tripled its market share in the six months after it introduced privacy changes to iPhones that obstructed rivals, including Facebook, from targeting ads at consumers.”
• Within 3 years, researchers predict Apple’s ad business will grow 4x – from $5B this fiscal year to $20B-per-year
iOS 14.5 was launched April 26 this year
Source: Branch
Apple privacy push Capped rivals and helped its own add network thriveShare of total installs (%)
Apple Search Ads
Oct 19 Jan 20 Apr 20 Jul 20 Oct 20 Jan 21 Apr 21 Jul 21 Sep 21
100
80
60
40
20
0
Facebook Snap Google Ads
TikTok Other
52IAB Proprietary Research
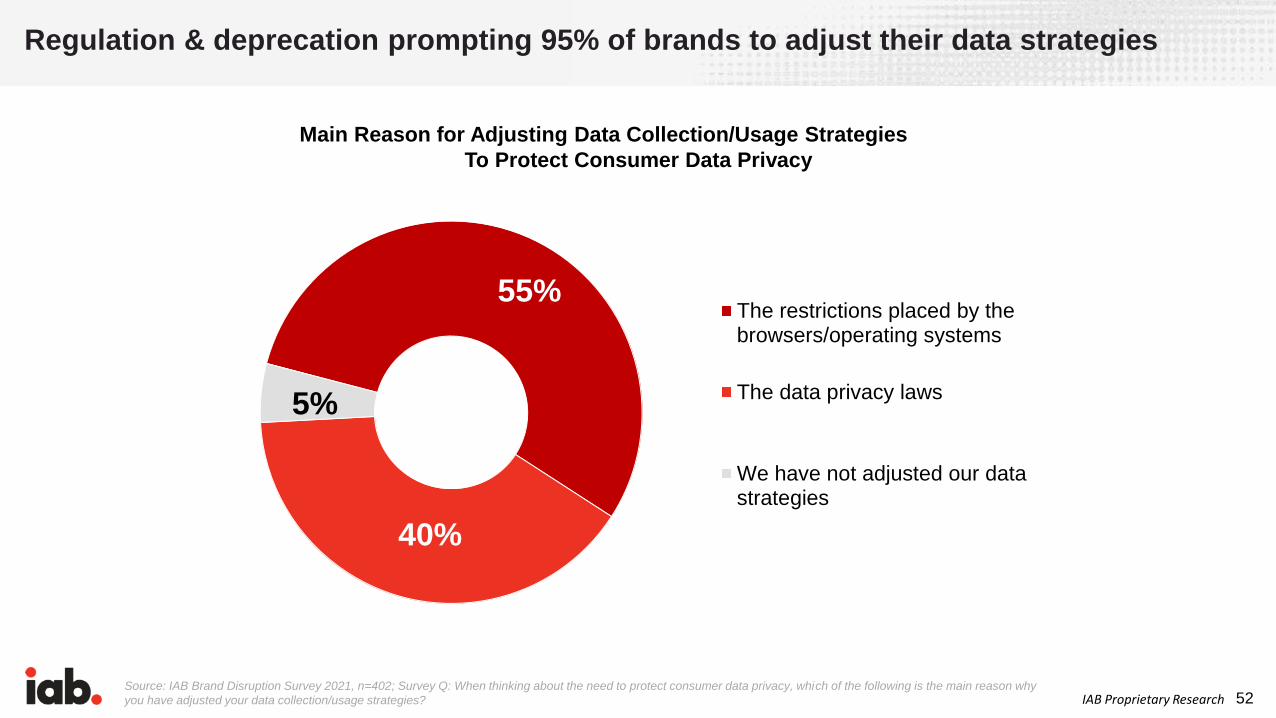
Regulation & deprecation prompting 95% of brands to adjust their data strategies
Source: IAB Brand Disruption Survey 2021, n=402; Survey Q: When thinking about the need to protect consumer data privacy, which of the following is the main reason why
you have adjusted your data collection/usage strategies?
55%
40%
5%
The restrictions placed by thebrowsers/operating systems
The data privacy laws
We have not adjusted our datastrategies
Main Reason for Adjusting Data Collection/Usage Strategies
To Protect Consumer Data Privacy
53IAB Proprietary Research
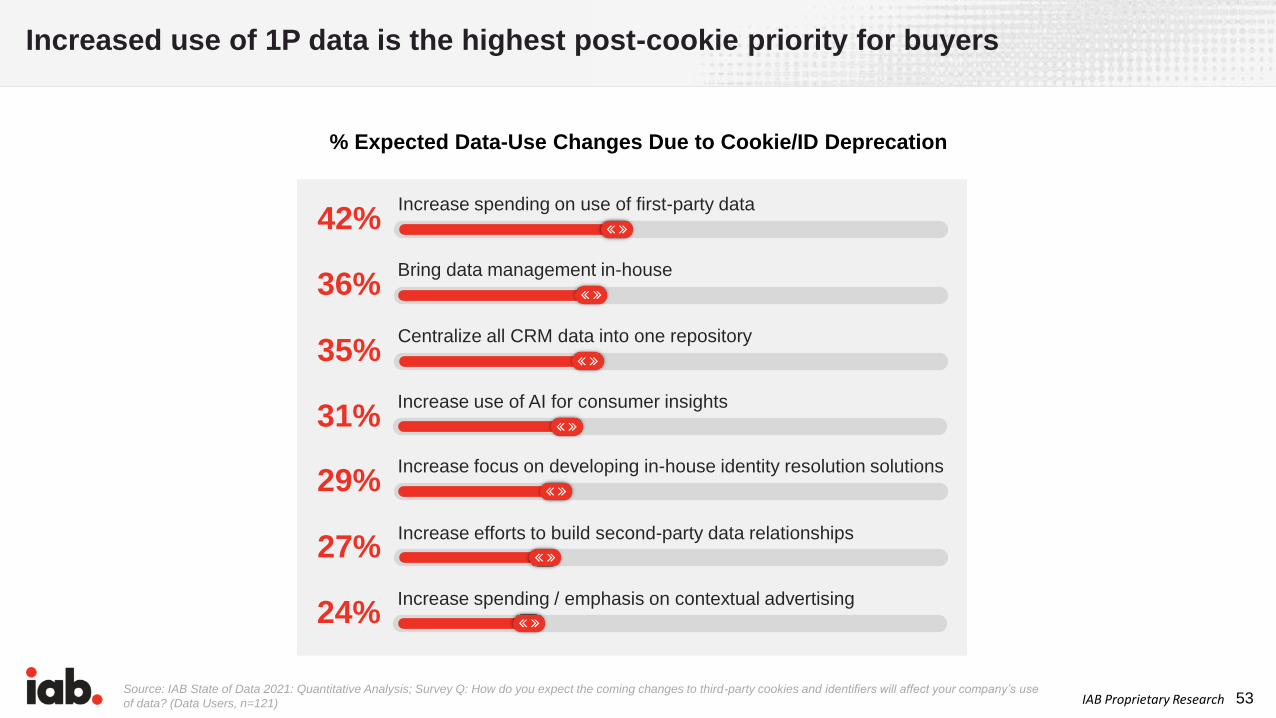
% Expected Data-Use Changes Due to Cookie/ID Deprecation
42%Increase spending on use of first-party data
36%Bring data management in-house
35%Centralize all CRM data into one repository
31%Increase use of AI for consumer insights
29%Increase focus on developing in-house identity resolution solutions
27%Increase efforts to build second-party data relationships
24%Increase spending / emphasis on contextual advertising
Source: IAB State of Data 2021: Quantitative Analysis; Survey Q: How do you expect the coming changes to third-party cookies and identifiers will affect your company’s use
of data? (Data Users, n=121)
Increased use of 1P data is the highest post-cookie priority for buyers
54IAB Proprietary Research
“In tests, Anheuser-Busch has produced sales increase of 50-80%, 35% higher ad recall, and 18% increase in people's likelihood of buying its brands versus benchmarks”
--Luiz Felipe Barros, VP Data Center of Excellence and Global Media, Anheuser-Busch InBev
AB InBev collected 1P data on 2.5B consumers, and is seeing sales increases up to 80% in tests leveraging this data
Source: Business Insider, 5/20/21
55IAB Proprietary Research
• Walmart’s new DSP merges The Trade Desk's inventory (across display, streaming, mobile, audio, and CTV) with Walmart’s 1P in-store and online shopper data for a closed-loop, measurement system for brands
Closing loops: Walmart & The Trade Desk mold a new DSP
Sources: AdWeek, 8/25/21; Marketing Dive, 8/25/21

56IAB Proprietary Research
Amazon DSP data + Whole Foods shopping data = online/offline ad attribution
Source: Digiday, 5/14/21
• Amazon is providing
advertisers with attribution
data showing when ads
bought through its DSP led to
purchases made in-person at
Whole Foods

57IAB Proprietary ResearchSource: IAB State of Data 2021: Quantitative Analysis; Survey Q: What types of 1P data points does your company collect / plan to collect or obtain / use through 3rd party
partnerships to support media efforts, including advertising and marketing? (Data Users, n=121)
But fewer than half of buyers are collecting “insightful” 1P data about media, shopping & behaviors
45% 44%41%
36%
Transactional Campaign Exposure Consumers Preferences Behavioral
Types of 1P Data Collected Directly
58IAB Proprietary Research
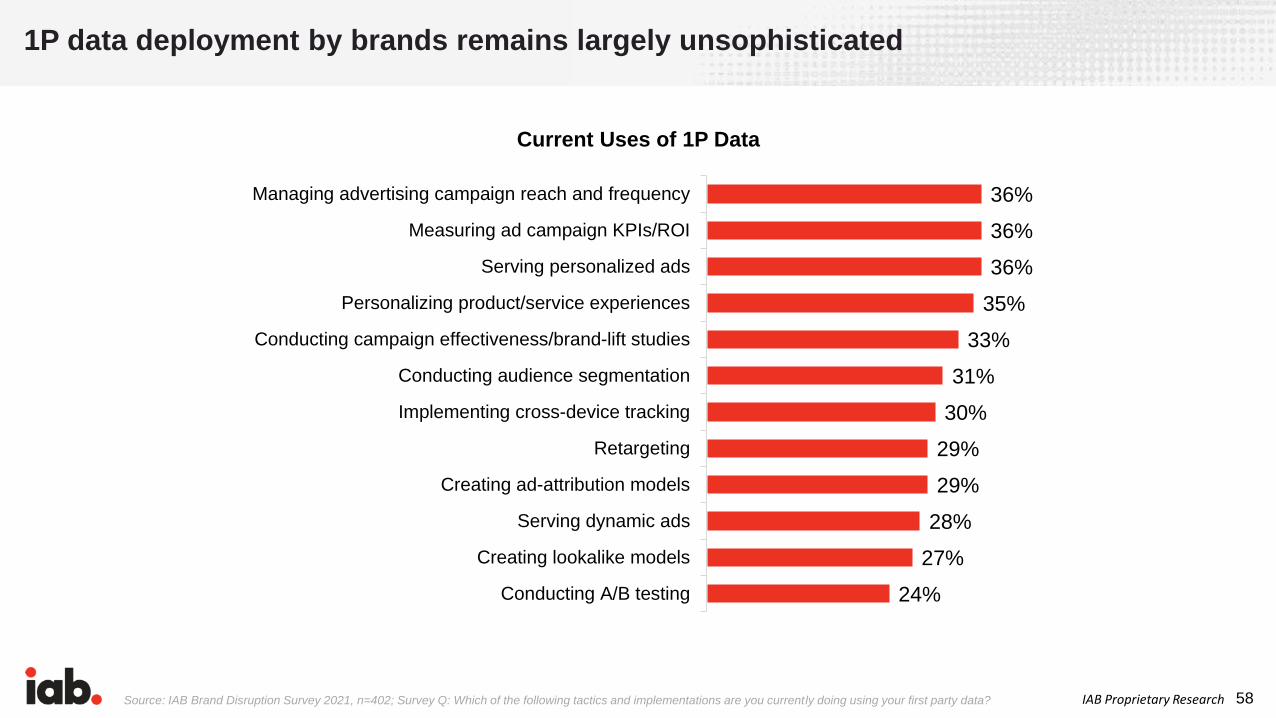
1P data deployment by brands remains largely unsophisticated
Source: IAB Brand Disruption Survey 2021, n=402; Survey Q: Which of the following tactics and implementations are you currently doing using your first party data?
24%
27%
28%
29%
29%
30%
31%
33%
35%
36%
36%
36%
Conducting A/B testing
Creating lookalike models
Serving dynamic ads
Creating ad-attribution models
Retargeting
Implementing cross-device tracking
Conducting audience segmentation
Conducting campaign effectiveness/brand-lift studies
Personalizing product/service experiences
Serving personalized ads
Measuring ad campaign KPIs/ROI
Managing advertising campaign reach and frequency
Current Uses of 1P Data
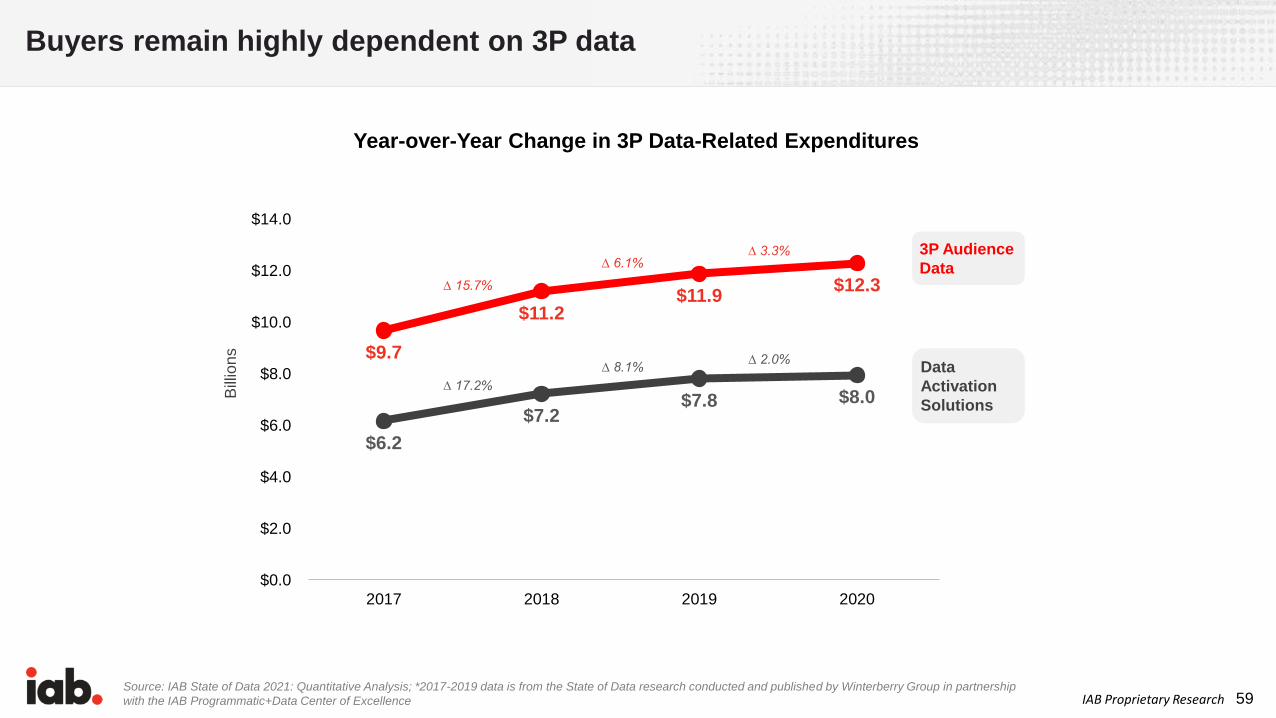
59IAB Proprietary Research
Buyers remain highly dependent on 3P data
Source: IAB State of Data 2021: Quantitative Analysis; *2017-2019 data is from the State of Data research conducted and published by Winterberry Group in partnership
with the IAB Programmatic+Data Center of Excellence
$9.7
$11.2$11.9
$12.3
$6.2
$7.2$7.8 $8.0
$0.0
$2.0
$4.0
$6.0
$8.0
$10.0
$12.0
$14.0
2017 2018 2019 2020
∆ 15.7%
∆ 17.2%
∆ 6.1%
∆ 8.1%
∆ 3.3%
∆ 2.0%
3P Audience
Data
Data
Activation
Solutions
Year-over-Year Change in 3P Data-Related Expenditures
Bill
ion
s

60IAB Proprietary Research
Sources: eMarketer, 10/14/21; IAB Brand Disruption Survey 2021, Brands investing in Digital Video n=334; Survey Q: Please select and rank your top 5 reasons for
leveraging OTT/CTV on your media plan with 1 = the most important. (Rank 1st Summary); IAB Video Ad Spend 2020 & Outlook for 2021, Base: Increased TV Everywhere,
Pure Play Streaming or vMVPDs Spend in 2021; Survey Q: You indicated that you increased your spending in TV Everywhere Apps, Pure Play Streaming Services, or
vMVPDs. How much did the potential deprecation of cookies and mobile ad ids affect that decision?
Had a great effect22%
Had some effect62%
Had little effect14%
Had no effect
2%
Impact of Deprecation of Cookies and Mobile Ad Ids on Increased CTV Spend
Among those increasing TV Everywhere, Pure Play Streaming or vMVPDs Spend in 2021
84% of ad buyers increasing CTV spending say consumer privacy issues contributed to the increase
The ability to deliver
addressability in a privacy-
compliant way is setting up
CTV to be a top beneficiary of
the cookie and privacy wars as
brands cited addressability as
the #1 reason for leveraging
OTT/CTV; CTV ad spend is
expected to surpass $14B this
year, an increase of over 2x
since 2019
Insight
61IAB Proprietary Research
Media Consumption Transformed
Together with the endless e-commerce “shelf,” the limitless digital media “EPG” – and consumers’ firm preference for interactive media - is a primary driver of disruptor brand discovery, consideration, and choice.

62IAB Proprietary Research
Digital time spent by consumers jumped an hour in 2020 – digital media now consume 42% more time than analog
Source: eMarketer, 5/27/21
6:49
7:50 7:59 8:09 8:20
5:33 5:315:13
4:57 4:45
2019 2020 2021 2022 2023
U.S. Average Time Spent per Day with Media (Hr:Mins)
Digital Traditional
Note: ages 18+
Traditional includes TV, newspapers, magazines and radio
63IAB Proprietary Research
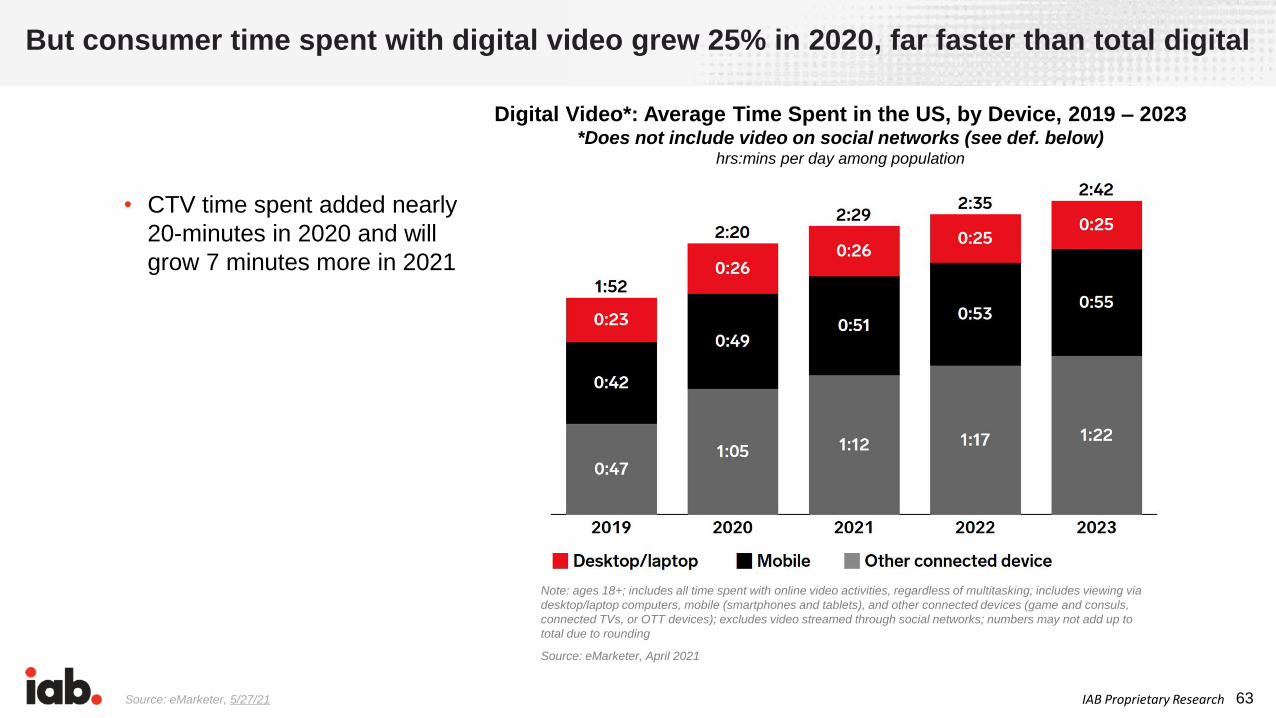
But consumer time spent with digital video grew 25% in 2020, far faster than total digital
• CTV time spent added nearly
20-minutes in 2020 and will
grow 7 minutes more in 2021
Source: eMarketer, 5/27/21
Digital Video*: Average Time Spent in the US, by Device, 2019 – 2023*Does not include video on social networks (see def. below)
hrs:mins per day among population
Note: ages 18+; includes all time spent with online video activities, regardless of multitasking; includes viewing via
desktop/laptop computers, mobile (smartphones and tablets), and other connected devices (game and consuls,
connected TVs, or OTT devices); excludes video streamed through social networks; numbers may not add up to
total due to rounding
Source: eMarketer, April 2021
64IAB Proprietary Research
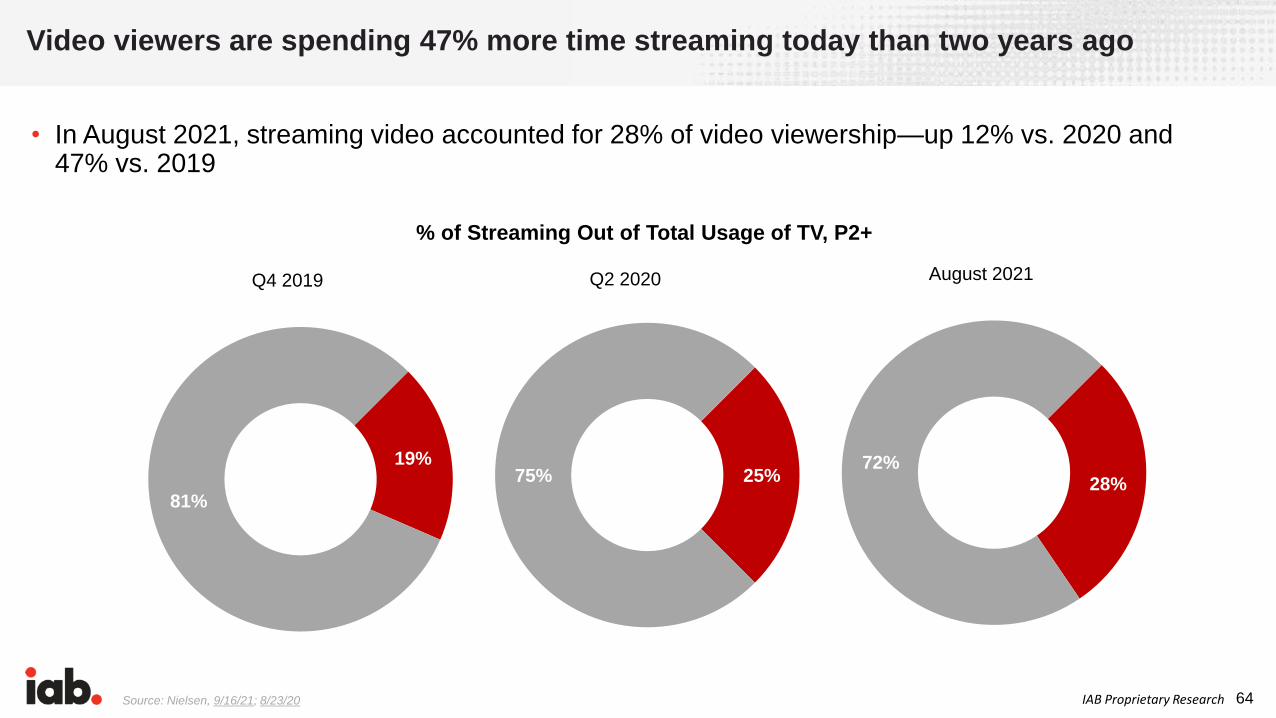
• In August 2021, streaming video accounted for 28% of video viewership—up 12% vs. 2020 and 47% vs. 2019
Video viewers are spending 47% more time streaming today than two years ago
Source: Nielsen, 9/16/21; 8/23/20
19%
81%
Q4 2019
25%75%
Q2 2020
28%72%
August 2021
% of Streaming Out of Total Usage of TV, P2+
65IAB Proprietary Research
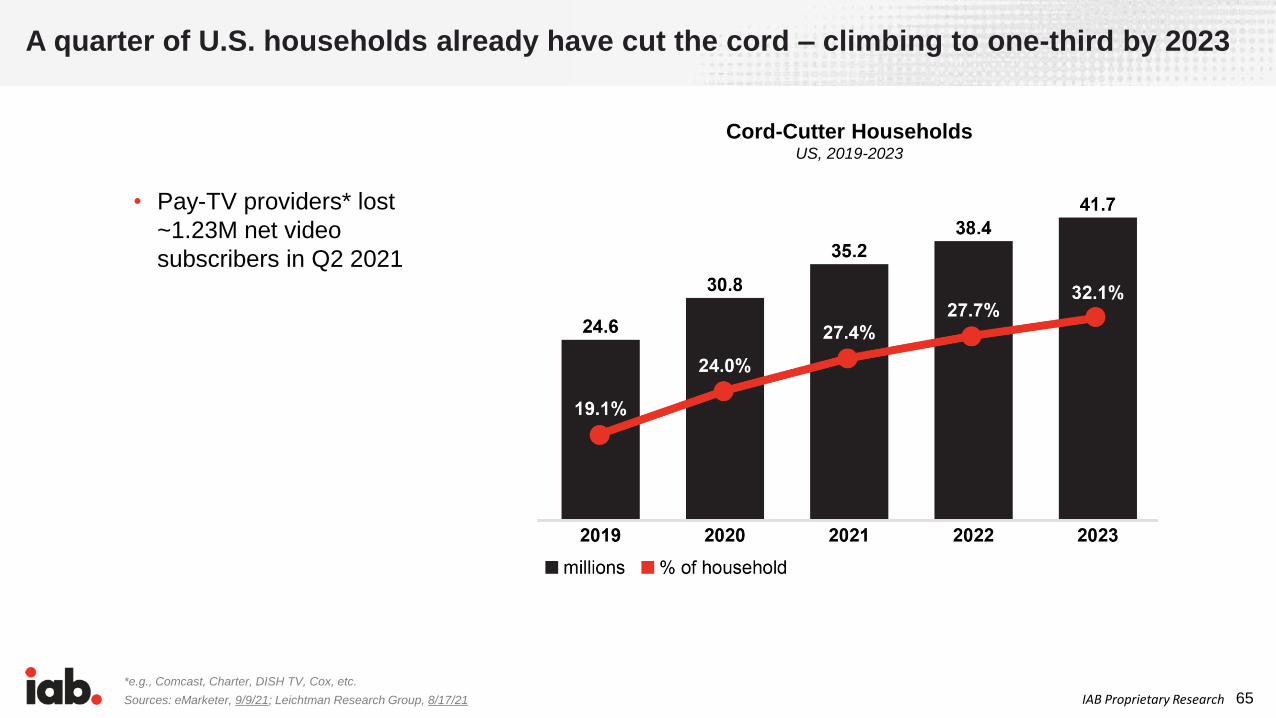
A quarter of U.S. households already have cut the cord – climbing to one-third by 2023
Sources: eMarketer, 9/9/21; Leichtman Research Group, 8/17/21
• Pay-TV providers* lost
~1.23M net video
subscribers in Q2 2021
*e.g., Comcast, Charter, DISH TV, Cox, etc.
Cord-Cutter HouseholdsUS, 2019-2023

66IAB Proprietary Research
Nearly half of U.S. broadband HHs have 4+ subscription streaming services—2x more than 2020
Source: Next TV, 6/14/21
Number of Subscription Streaming Services in U.S. Broadband Homes
82% of U.S.
broadband households
have at least 1
subscription, up from
76% in Q1 2020
Q1/2016 Q1/2017 Q1/2018 Q1/2019
22%
Q1/2020
46%
Q1/2021
100%
80%
60%
40%
20%
0%
0 Services 1 Service 2 Services 3 Services 4 or more Services
67IAB Proprietary ResearchSource: comScore, 9/14/21
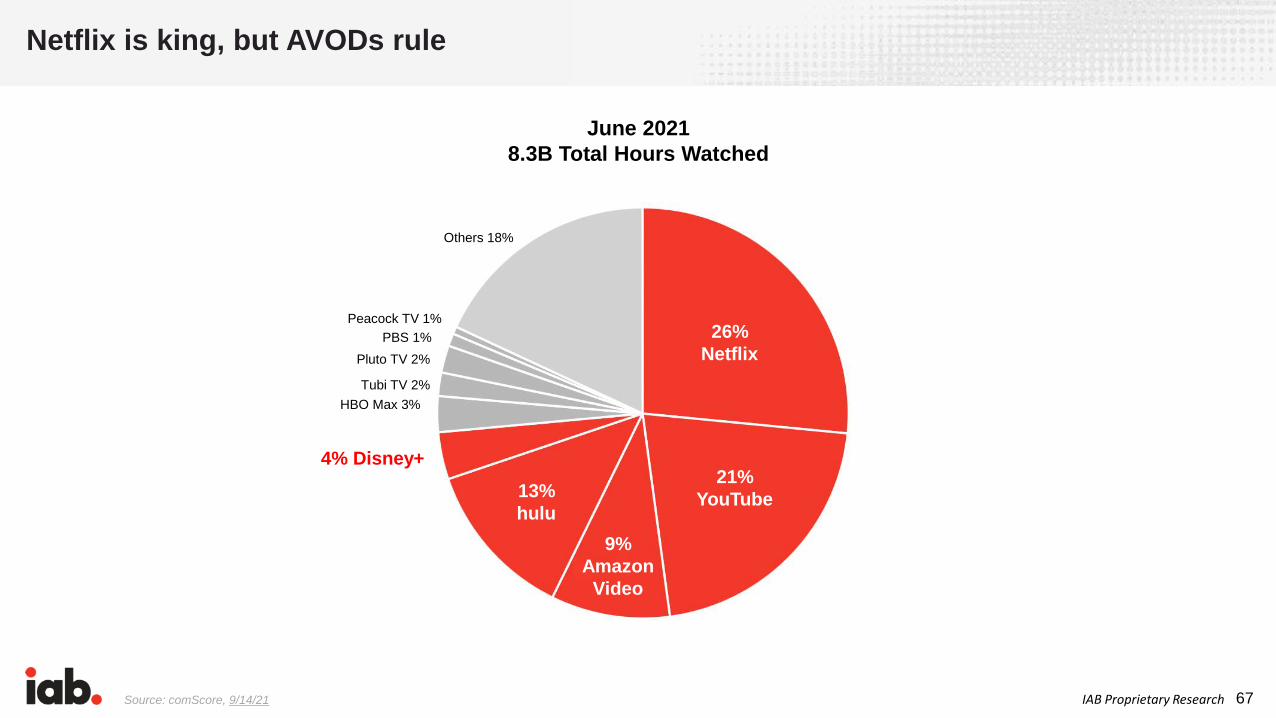
Netflix is king, but AVODs rule
June 2021
8.3B Total Hours Watched
26%
Netflix
21%
YouTube
9%
Amazon
Video
13%
hulu
4% Disney+
HBO Max 3%
Tubi TV 2%
Pluto TV 2%
PBS 1%
Peacock TV 1%
Others 18%
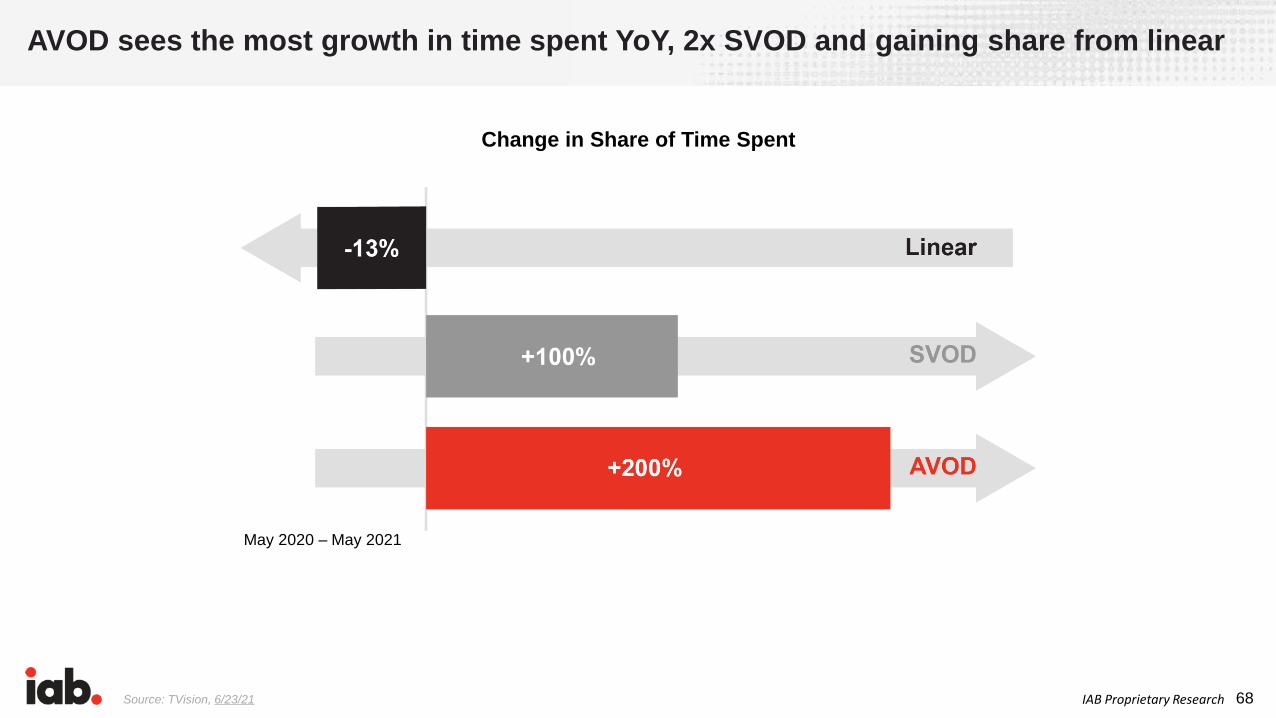
68IAB Proprietary ResearchSource: TVision, 6/23/21
AVOD sees the most growth in time spent YoY, 2x SVOD and gaining share from linear
Change in Share of Time Spent
May 2020 – May 2021

69IAB Proprietary ResearchSource: TiVo, 8/12/21
FAST TV services are among N.A. users’ most popular AVOD services
Most Popular AVOD Services other Than YouTubePercentage of respondents that indicated they use the service type in question; Respondents could choose
more than one option
TiVo plus (free TV channels on TiVo devices)
Plex (free streaming TV and movies, not personal media)
Vevo
Cheddar
Free items on Vudu (with ads)
Twitch
Crunchyroll
Bloomberg TV
Dailymotion
IMBd TV
Crackle
Pluto TV
Tubi TV
Peacock (free version with ads)
Roku Channel
Facebook Watch 18%
17%
16%
16%
14%
13%
12%
10%
9%
9%
8%
8%
6%
5%
5%
4%

70IAB Proprietary Research
In 2020, digital audio surpassed radio in avg. daily time spent, and is gaining more share in 2021
Sources: InsideRadio, 6/11/21; MAGNA & Spotify, 6/3/21
• More than half (51%) of U.S.
consumers said they’ve
listened to digital music more
during the pandemic and
nearly a quarter (24%) have
increased podcast listening
Radio vs. Digital Audio**: Average Time Spent in the US, 2019 – 2023hrs:mins per day among population
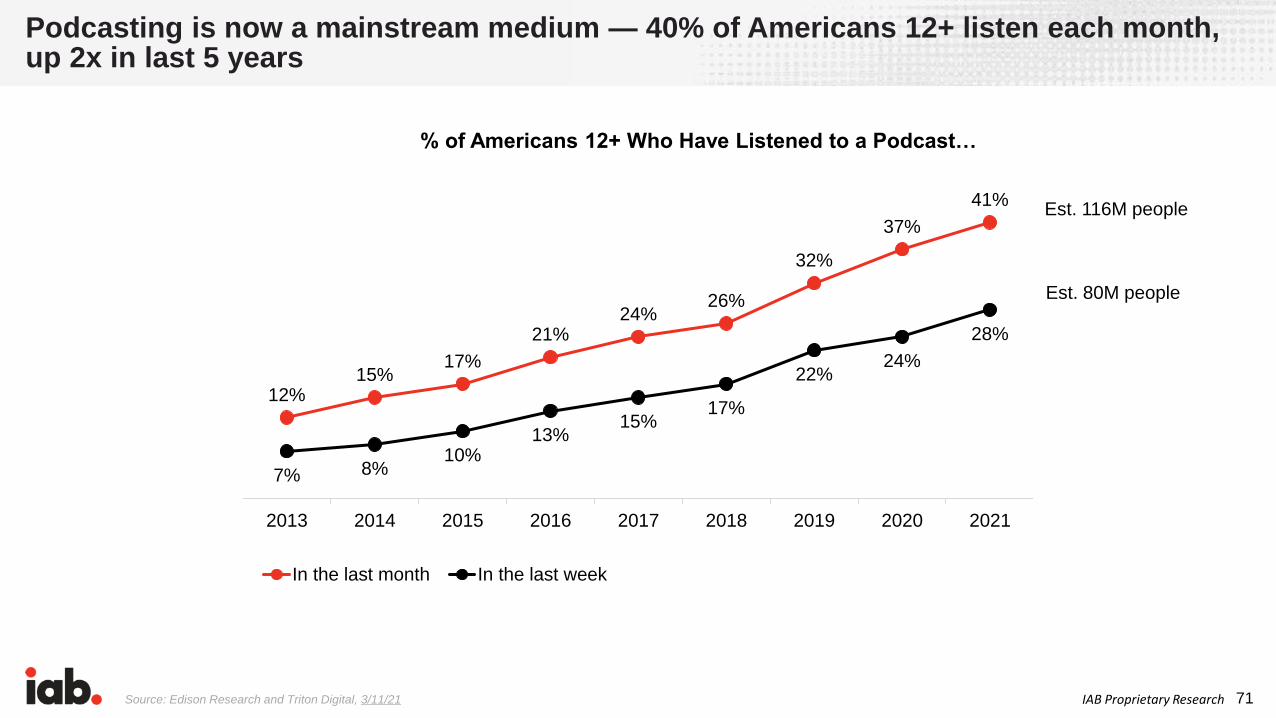
71IAB Proprietary ResearchSource: Edison Research and Triton Digital, 3/11/21
Podcasting is now a mainstream medium — 40% of Americans 12+ listen each month, up 2x in last 5 years
12%15%
17%
21%24%
26%
32%
37%
41%
7% 8%10%
13%15%
17%
22%24%
28%
2013 2014 2015 2016 2017 2018 2019 2020 2021
% of Americans 12+ Who Have Listened to a Podcast…
In the last month In the last week
Est. 80M people
Est. 116M people

72IAB Proprietary Research
More than half of all Americans play digital games – although growth is slowing
Source: Insider Intelligence, 7/21/21
US Digital Gamers, 2019 – 2023millions, % change, and % of population
Note: Internet users of any age to play games through the Internet or games that update via the Internet at least once per month via any device;
includes desktop/mobile app and browser gaming, online Consul gaming, and gaming on social networks
Source: eMarketer, Feb 2021

73IAB Proprietary Research
Social Media, Influencers, & Creators
Content, commerce, and community are now merged. Direct sales of goods on social platforms grew nearly 40% last year and will reach $80 billion in 2025.

74IAB Proprietary Research
• TikTok was #1 downloaded
app in the U.S. in Q2 2021,
following 70% growth in avg.
monthly time spent in 2020
Social media has already achieved near parity in audience size with TV, and will likely surpass it in the next few years
Sources: App Annie, Q2 2021; 2021; eMarketer, 4/1/21; 4/1/21
Social Network UsersUS, 2019-2023
75IAB Proprietary Research
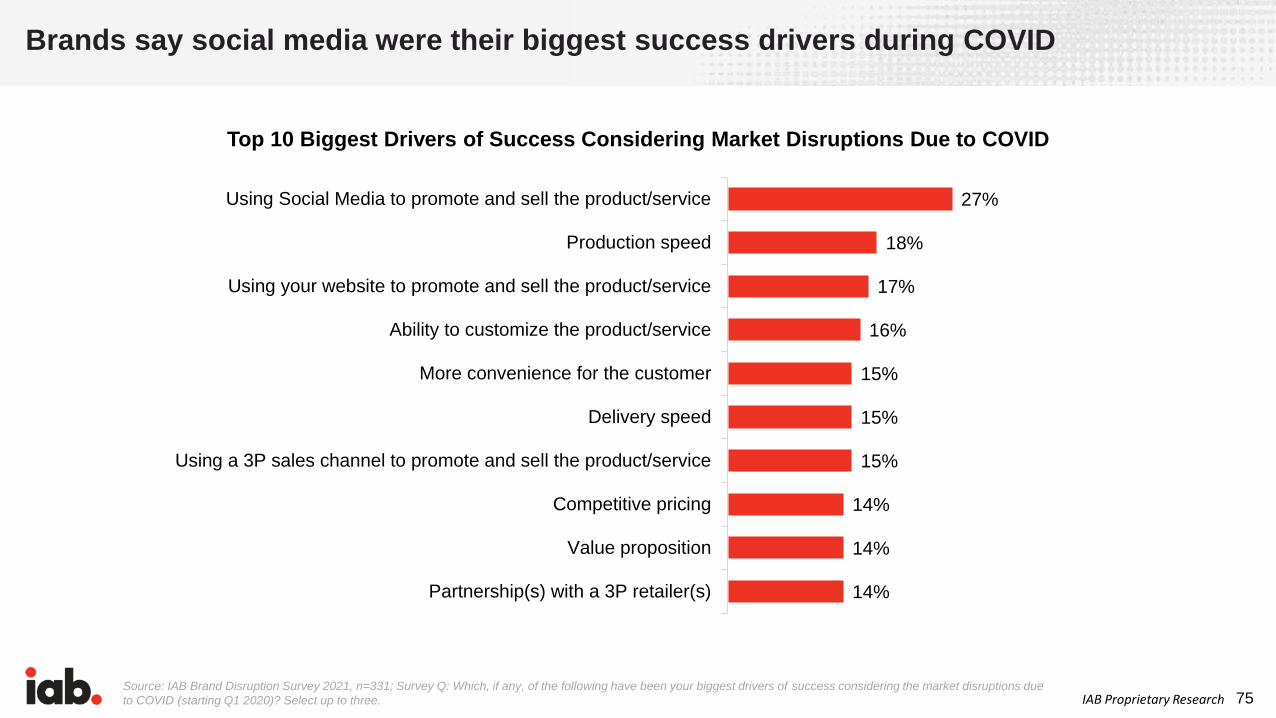
Brands say social media were their biggest success drivers during COVID
Source: IAB Brand Disruption Survey 2021, n=331; Survey Q: Which, if any, of the following have been your biggest drivers of success considering the market disruptions due
to COVID (starting Q1 2020)? Select up to three.
Top 10 Biggest Drivers of Success Considering Market Disruptions Due to COVID
14%
14%
14%
15%
15%
15%
16%
17%
18%
27%
Partnership(s) with a 3P retailer(s)
Value proposition
Competitive pricing
Using a 3P sales channel to promote and sell the product/service
Delivery speed
More convenience for the customer
Ability to customize the product/service
Using your website to promote and sell the product/service
Production speed
Using Social Media to promote and sell the product/service

76IAB Proprietary Research
¼ to ½ of consumers have bought products discovered in social media
Source: Retail Dive, 6/23/21
Percent of shoppers who discovered brands and purchased products
through social media
41%
51%
35%
51%
21% 22%
Interest
17%
29%
15%
25%
Tick-tock
14%
28%
Snapchat
Learn about/discover brands Purchased products
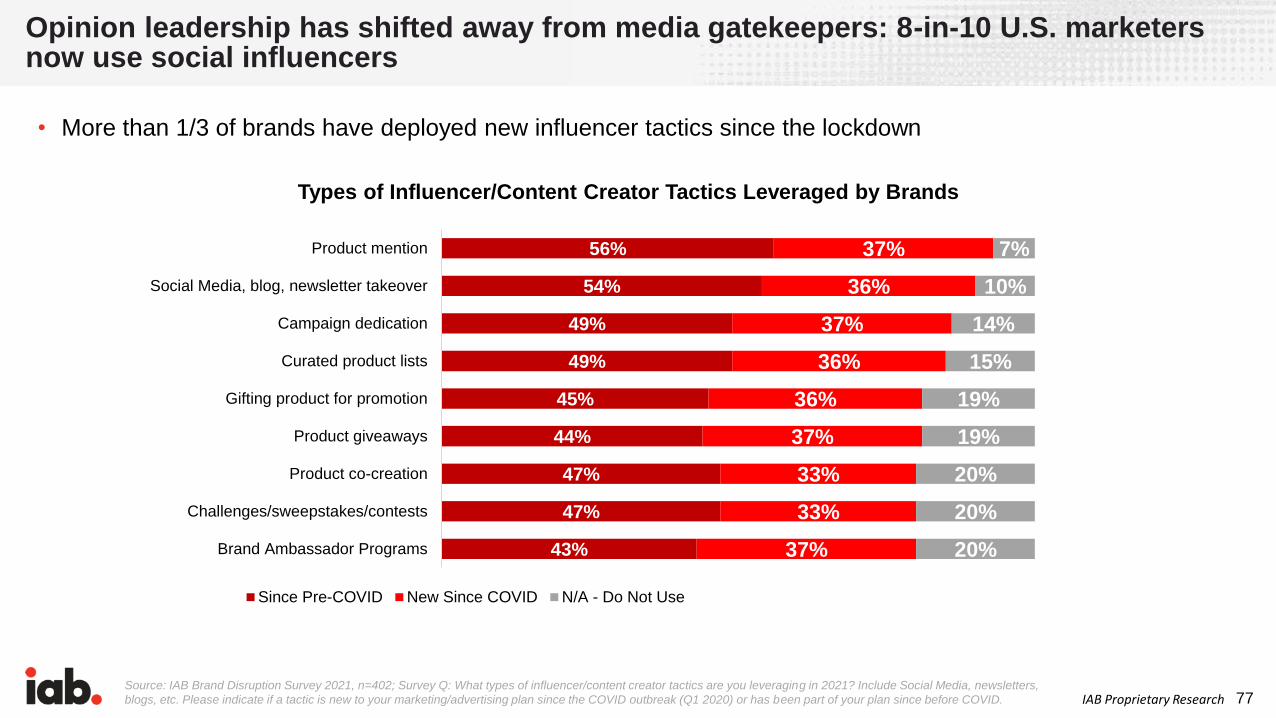
77IAB Proprietary ResearchSource: IAB Brand Disruption Survey 2021, n=402; Survey Q: What types of influencer/content creator tactics are you leveraging in 2021? Include Social Media, newsletters,
blogs, etc. Please indicate if a tactic is new to your marketing/advertising plan since the COVID outbreak (Q1 2020) or has been part of your plan since before COVID.
Opinion leadership has shifted away from media gatekeepers: 8-in-10 U.S. marketers now use social influencers
43%
47%
47%
44%
45%
49%
49%
54%
56%
37%
33%
33%
37%
36%
36%
37%
36%
37%
20%
20%
20%
19%
19%
15%
14%
10%
7%
Brand Ambassador Programs
Challenges/sweepstakes/contests
Product co-creation
Product giveaways
Gifting product for promotion
Curated product lists
Campaign dedication
Social Media, blog, newsletter takeover
Product mention
Since Pre-COVID New Since COVID N/A - Do Not Use
• More than 1/3 of brands have deployed new influencer tactics since the lockdown
Types of Influencer/Content Creator Tactics Leveraged by Brands

78IAB Proprietary Research
Small is beautiful: “Nano” & “micro” influencer use shows the most COVID-era growth
Sources: AdAge, 9/21/21; IAB Brand Disruption Survey 2021, n=402; Survey Q: What types of influencer/content creator partnerships do you leverage? Please indicate if
an influencer type is new to your marketing/advertising plan since the COVID outbreak (Q1 2020) or has been part of your plan since before COVID.
37%
48%
48%
44%
40%
36%
38%
40%
23%
16%
14%
16%
Mega/CelebInfluencers (1M+
followers)
Macro Influencers(109K-1M followers)
Micro Influencers(10K-100K followers)
Nano Influencers(1K-10K followers)
Since Pre-COVID New Since COVID N/A - Do Not Use
Types of Influencer/Content Creator Partnerships Leveraged by Brands
• Influencers with smaller followings are being leveraged more than mega/celeb partnerships
79IAB Proprietary Research
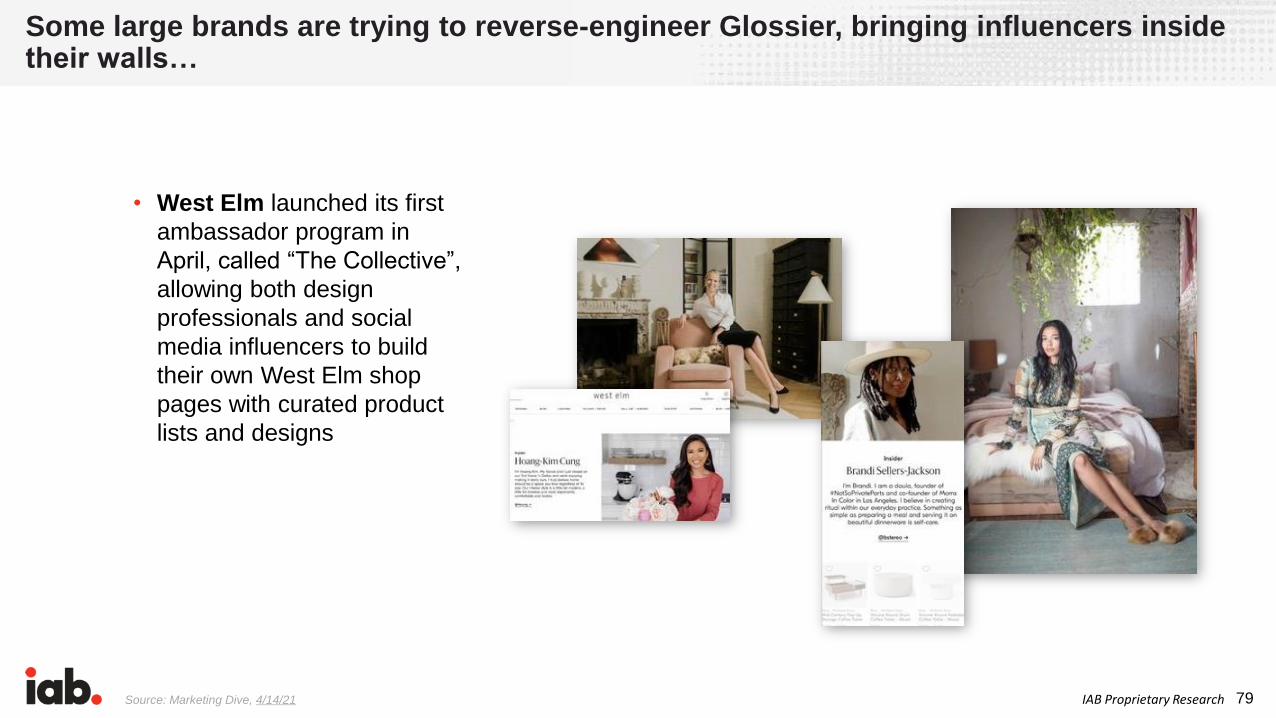
Some large brands are trying to reverse-engineer Glossier, bringing influencers inside their walls…
Source: Marketing Dive, 4/14/21
• West Elm launched its first
ambassador program in
April, called “The Collective”,
allowing both design
professionals and social
media influencers to build
their own West Elm shop
pages with curated product
lists and designs
80IAB Proprietary ResearchSource: Retail Dive, 7/27/21
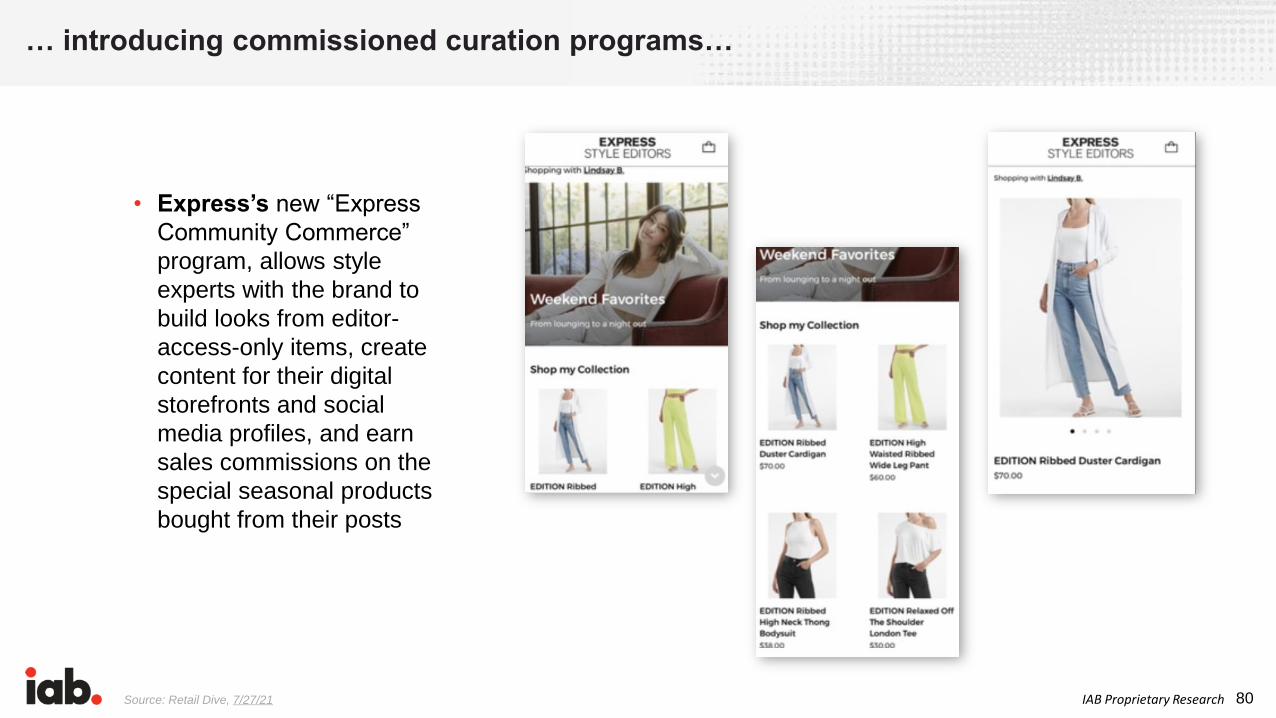
… introducing commissioned curation programs…
• Express’s new “Express
Community Commerce”
program, allows style
experts with the brand to
build looks from editor-
access-only items, create
content for their digital
storefronts and social
media profiles, and earn
sales commissions on the
special seasonal products
bought from their posts
81IAB Proprietary Research
… and even providing “revenge of the nerds” fashion platforms
Source: Marketing Dive, 8/19/21
• American Eagle and Twitch
are partnering to create a
weekly custom segment, a
five-part documentary series,
and community watch parties
spotlighting select Twitch
streamers, who will each also
help to produce new, limited-
edition collections for
American Eagle and curate
outfits from the retailer’s
existing apparel
82IAB Proprietary ResearchSource: Digiday, 11/11/20
Sales associates becoming digital ambassadors, enabled by TikTok & specialist platforms
A Wendy’s employee generated 70K followers to his “Baconator” tutorials on
TikTok
Sephora’s “Sephora Squad” are employee influencers
active on TikTok
Dunkin’s “Crew Ambassadors” program has four Dunkin’ baristas
and in-store workers with large TikTok followings

83IAB Proprietary Research
As brands double down on influencers/creators, so do the platforms
Sources: Social Media Today, 8/23/21; Retail Dive, 7/27/21; Marketing Dive, 7/15/21; Insider, 6/8/21; Snap Inc. via Businesswire, 5/20/21; SocialMediaToday, 5/18/21;
Marketing Dive, 5/13/21; Adweek, 5/5/21; Yahoo!, 4/13/21
84IAB Proprietary Research
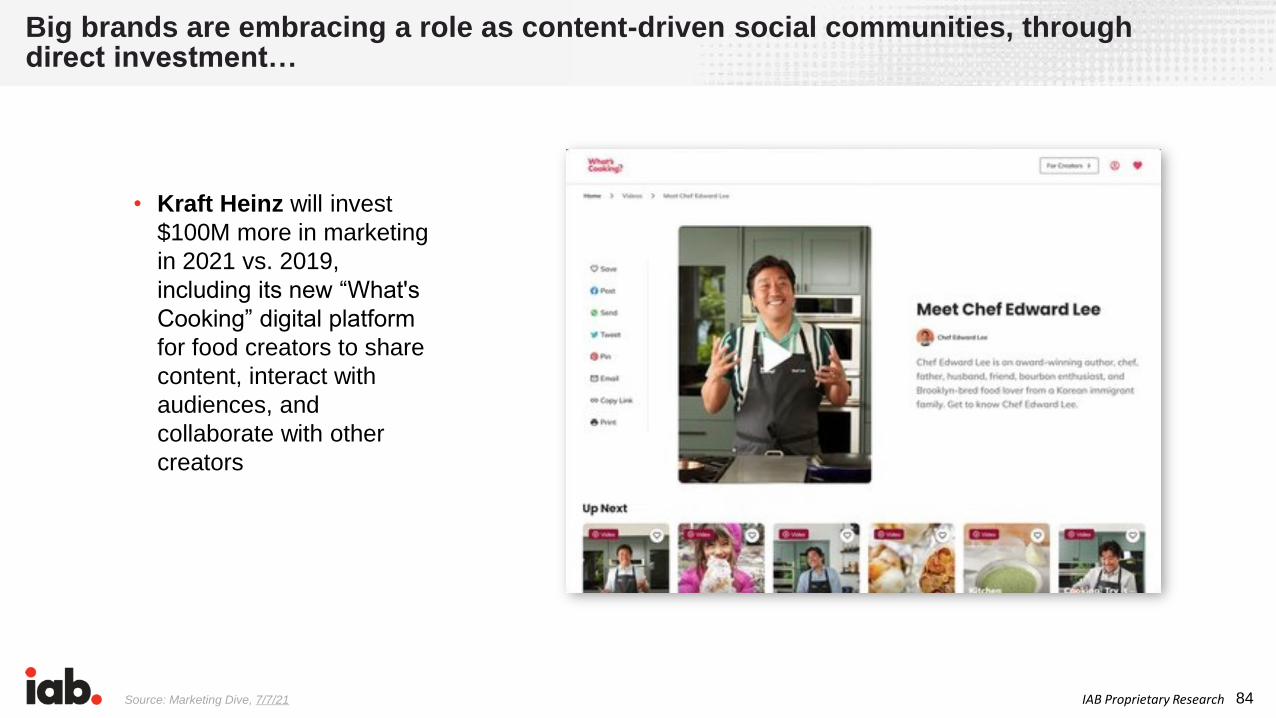
Big brands are embracing a role as content-driven social communities, through direct investment…
Source: Marketing Dive, 7/7/21
• Kraft Heinz will invest
$100M more in marketing
in 2021 vs. 2019,
including its new “What's
Cooking” digital platform
for food creators to share
content, interact with
audiences, and
collaborate with other
creators
85IAB Proprietary Research
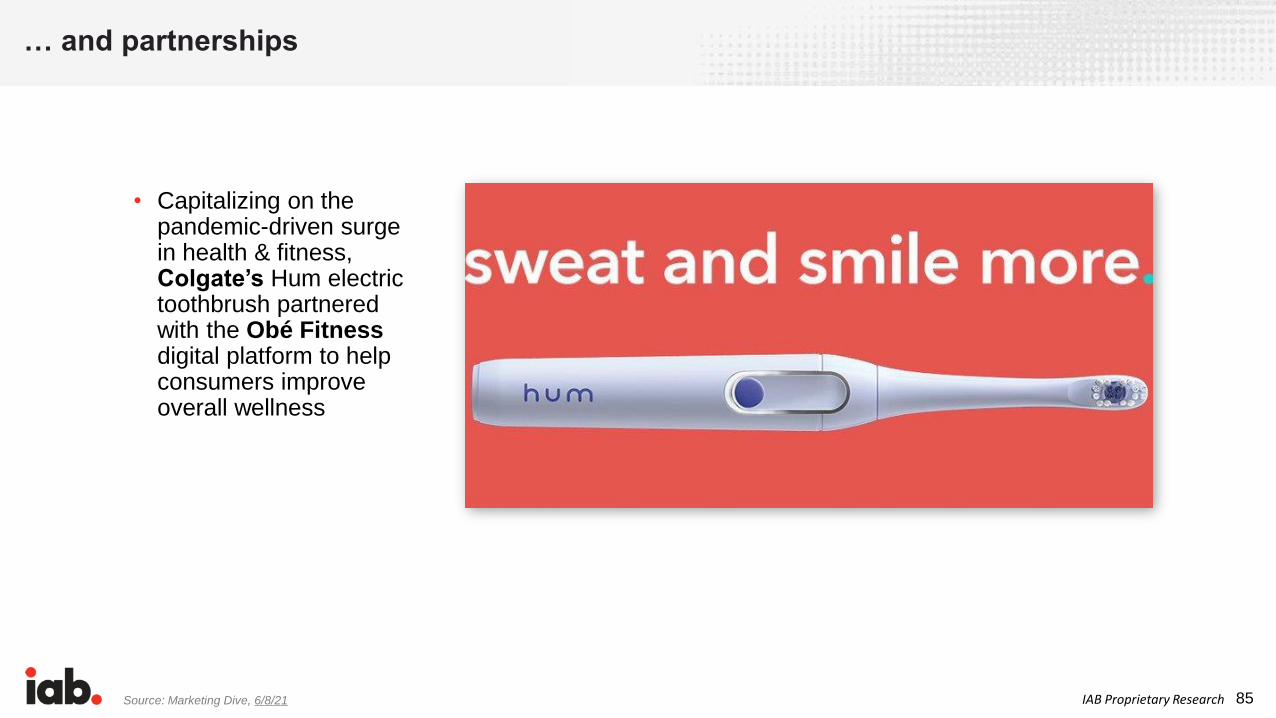
… and partnerships
Source: Marketing Dive, 6/8/21
• Capitalizing on the pandemic-driven surge in health & fitness, Colgate’s Hum electric toothbrush partnered with the Obé Fitness digital platform to help consumers improve overall wellness
86IAB Proprietary ResearchSources: Marketing Dive, 8/19/21; Quartz, 7/17/21
Brand communities extend well beyond product marketing, even into recruitment
+
• With 150M monthly active
users, the otherwise ad-free
Discord app provide
opportunities for brands to
engage directly with
customers and manage
communities: Chipotle’s job
fair received 24K applications
in a week

87IAB Proprietary Research
$35.6
$43.3
$58.8
2019 2020 2021
Social Net Advertising Revenue Forecast 2019-2021, in Billions
Source: MAGNA, September 2021
Social ad revenue is expected to reach nearly $60B in 2021, an increase of 36% vs. 2020

88IAB Proprietary ResearchSources: eMarketer, 8/17/21; Retail Dive, 7/19/21
Direct sales on social networks will double to $80B by 2025
Commerce is inherently
social. Adding
livestreaming, social
influencers, virtual
fitting/try-ons, and
streamlined checkout will
enhance the user
experience
and accelerate
conversion.
Insight
US Retail Social Commerce Sales, 2019 - 2025 billions and percent change
Note: includes products or services ordered via social networks (such as Facebook, Instagram,
Pinterest, Wechat, Line, VK, and others) regardless of the method of payment or fulfillment;
excludes travel and event tickets, tips, subscriptions, payments, such as bill pay, taxes or money
transfers, food services and drinking place sales, gambling and other vice goods sales
Source: eMarketer, May 2021

89IAB Proprietary Research
Facebook is making commerce a priority across its stable of apps
Sources: Retail Dive, 8/13/21; Retail Dive, 7/29/21; Fashion United, 6/23/21; The Verge, 6/20/21; Modern Retail, 2/10/21

90IAB Proprietary Research
• Shop Module is powered by
store-fronts that
brands/retailers use to
display products at the top of
their Twitter profiles—
shoppers can browse
products, and make
purchases within the app
Source: Retail Dive, 7/29/21
With “Shop Module,” Twitter this year made its first significant entry into e-commerce

91IAB Proprietary Research
Now with 1 billion users, TikTok has become a discovery engine for Amazon…
Source: Modern Retail, 5/25/21; 1/14/21
• TikTok hashtags such as
#AmazonFinds (13.3B views),
#AmazonMustHaves (4.7B
views) and #FoundItOnAmazon
(2B views) drive millions of
views to Amazon items—
Amazon’s affiliate
recommenders make between
1%-10% on each sale
92IAB Proprietary Research
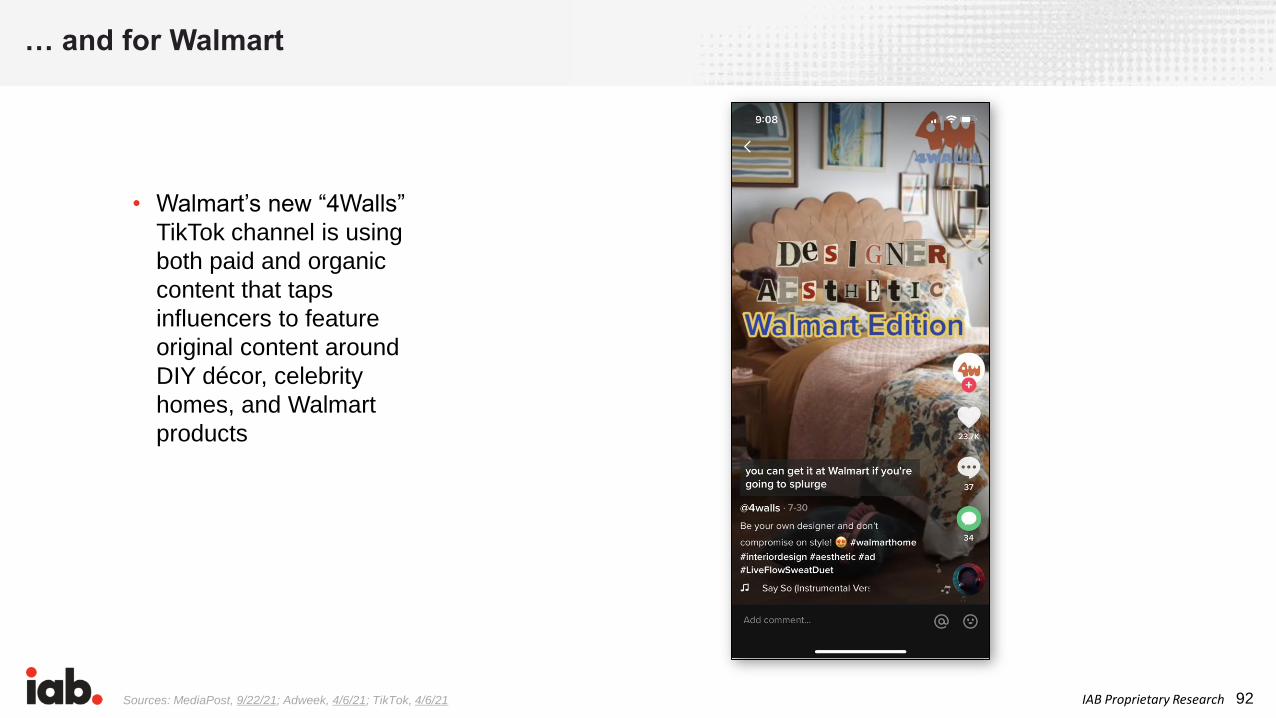
• Walmart’s new “4Walls”
TikTok channel is using
both paid and organic
content that taps
influencers to feature
original content around
DIY décor, celebrity
homes, and Walmart
products
… and for Walmart
Sources: MediaPost, 9/22/21; Adweek, 4/6/21; TikTok, 4/6/21

93IAB Proprietary ResearchSources: Shopify, 6/15/21; Tech Crunch, 2/9/21
• Shopify partnered with
Facebook, Instagram and
Google to expand its payment
option (“Shop Pay”) to all
Shopify merchants selling
across those platforms; Shop
Pay will be available to more
than one million merchants
across the platforms—even if
they don’t use Shopify’s
online store
Shopify is now directly integrated into leading digital platforms, enabling purchases for 1M merchants
94IAB Proprietary Research
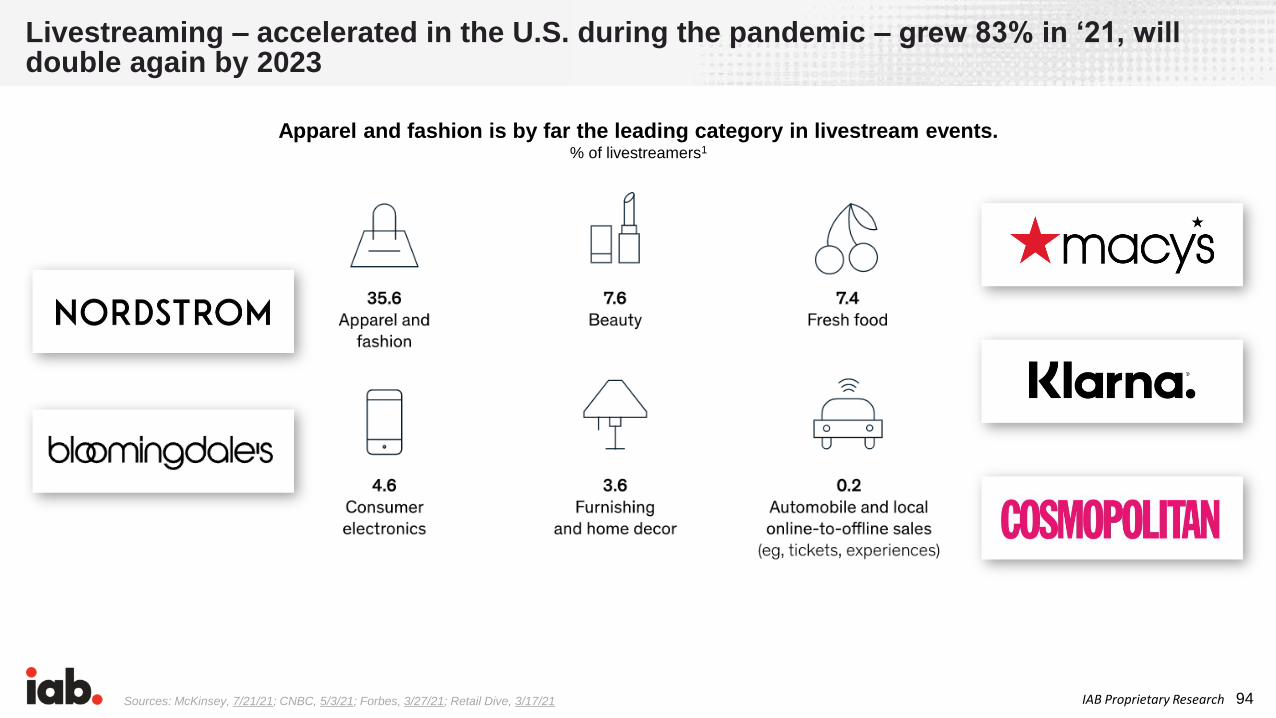
Livestreaming – accelerated in the U.S. during the pandemic – grew 83% in ‘21, will double again by 2023
Sources: McKinsey, 7/21/21; CNBC, 5/3/21; Forbes, 3/27/21; Retail Dive, 3/17/21
Apparel and fashion is by far the leading category in livestream events.% of livestreamers1
95IAB Proprietary ResearchSources: Retail Dive, 7/15/21; 6/25/21; Marketing Dive, 6/28/21
• Livestream startups like ShopShops, Whatnot, Talkshoplive, Ntwrk, Verishop,
Supergreat, and Popshop have raised millions in funding this year as brands look to launch
and scale their video-selling channels
Livestreaming-as-a-Service platforms are VC darlings

96IAB Proprietary Research
Gaming has doubled its volume of social chatter, especially among women & youth
Sources: eMarketer, 10/14/21; Adweek, 8/3/21
• The mobile gaming, digital video gaming, and eSports ad market surpassed $6B in 2020 (a 25% increase YoY) and is forecast to reach $7.5B by the end of this year
76M
140M157M
2019 2020 2021
Tweets about gaming in the US
H1 H1 H1

97IAB Proprietary ResearchSources: Insider Intelligence, 7/21/21; MediaPost, 6/6/21; 4/16/21; Adweek, 4/19/21
Being inherently social, big brands see huge ad opportunities in gaming as the U.S. user base nears 200M
98IAB Proprietary Research
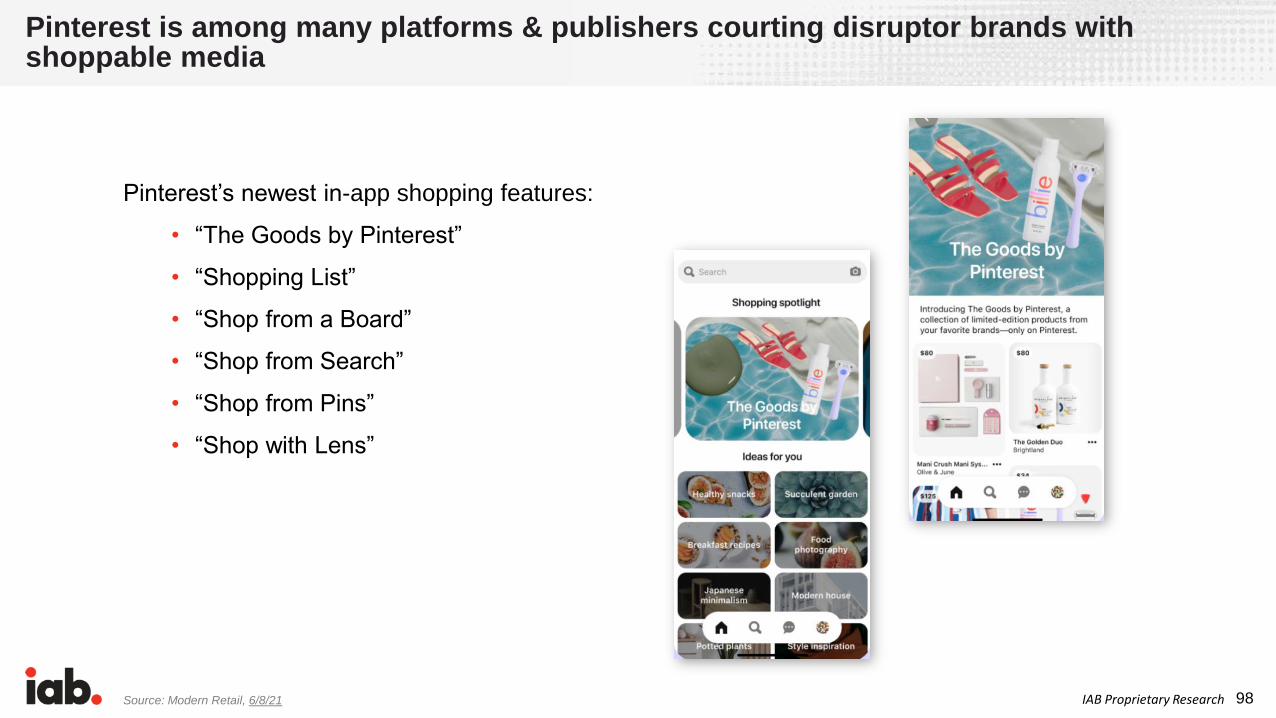
Pinterest’s newest in-app shopping features:
• “The Goods by Pinterest”
• “Shopping List”
• “Shop from a Board”
• “Shop from Search”
• “Shop from Pins”
• “Shop with Lens”
Source: Modern Retail, 6/8/21
Pinterest is among many platforms & publishers courting disruptor brands with shoppable media

99IAB Proprietary Research
• “It’s really difficult to advertise
on TV or too expensive. We
thought this would be a great
way to help change that.”
- Faye Trapani, director of self-
service platform sales, Hulu.
Source: Modern Retail, 6/8/21
Hulu introduced Hulu Ad Manager, with small advertisers able to place self-service ads for only $500
100IAB Proprietary Research
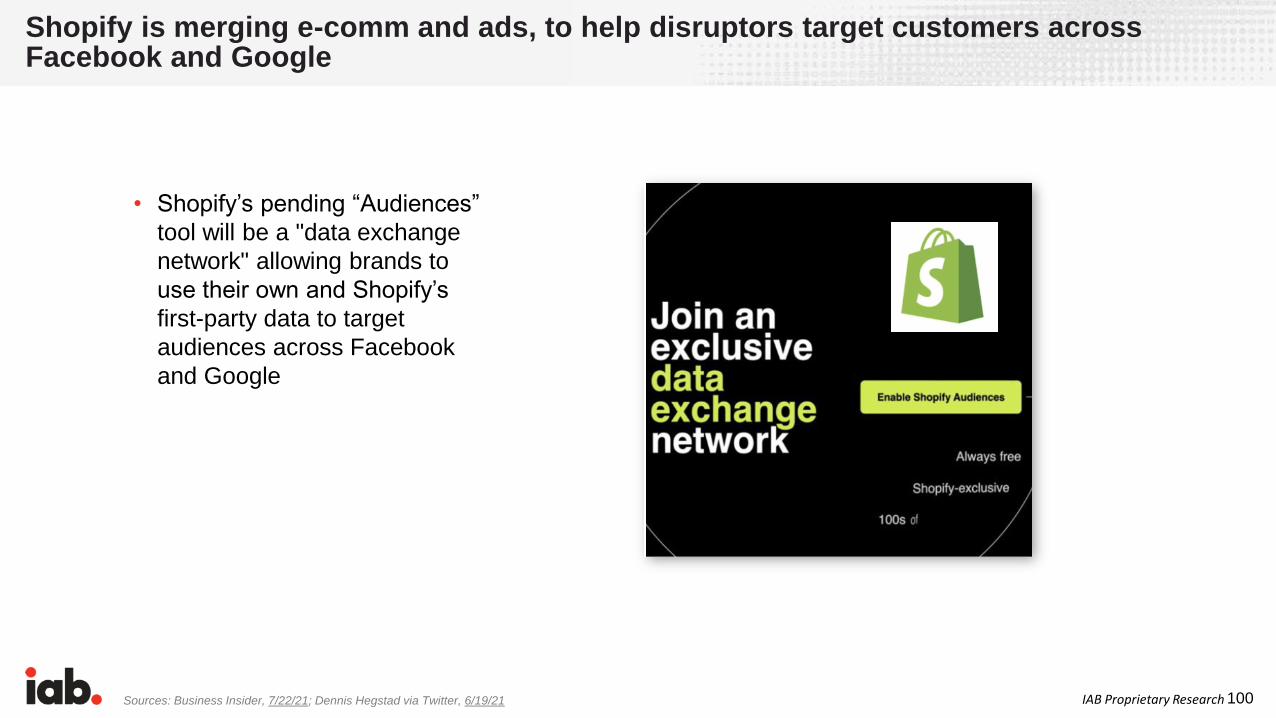
Shopify is merging e-comm and ads, to help disruptors target customers across Facebook and Google
Sources: Business Insider, 7/22/21; Dennis Hegstad via Twitter, 6/19/21
• Shopify’s pending “Audiences”
tool will be a "data exchange
network" allowing brands to
use their own and Shopify’s
first-party data to target
audiences across Facebook
and Google

101IAB Proprietary Research
• In a move to make it easier for
smaller brands to invest in CTV,
Roku is launching an app that
provides Shopify merchants a
seamless way to create and
activate CTV ad campaigns
across the Roku network
Roku is providing streaming-TV-ads-as-a-service for Shopify merchants
Source: Ad Age, 9/21/21

102IAB Proprietary Research
The Advertising Impact: Follow the Money Advertising spend will
increasingly migrate toward media that enable some combination of social activity, entertainment, and commercial transactions.
103IAB Proprietary Research
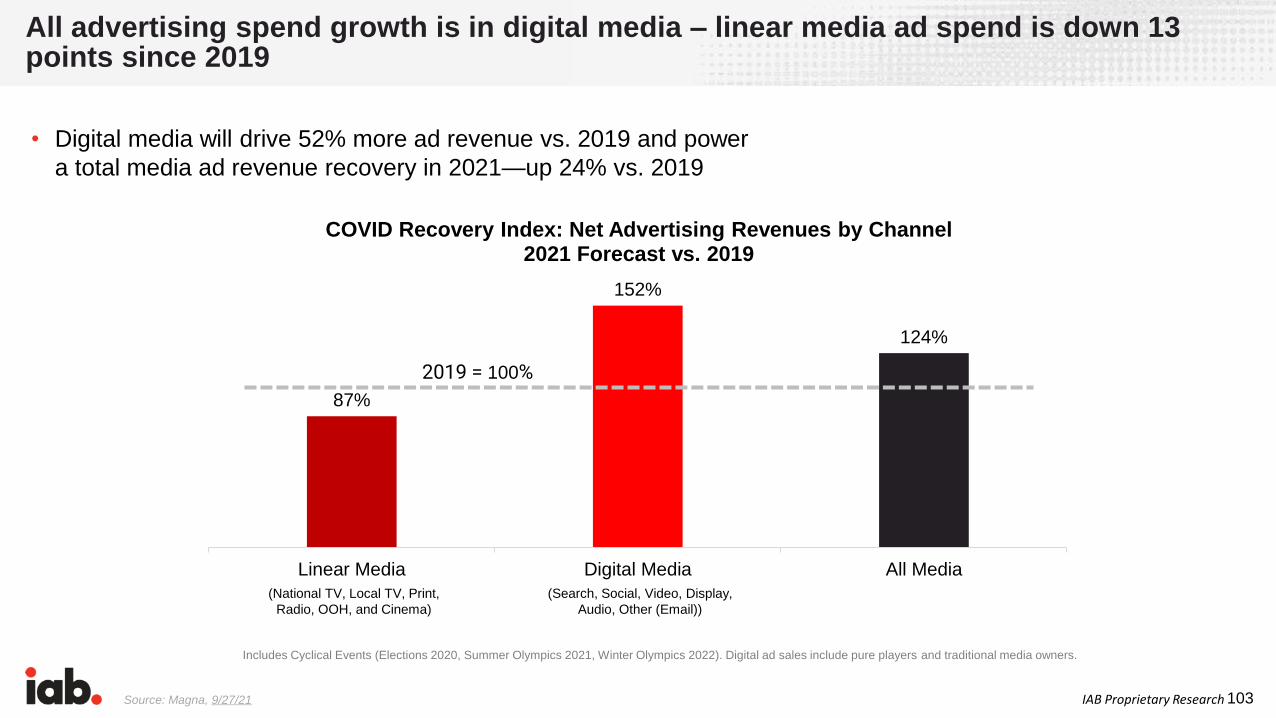
• Digital media will drive 52% more ad revenue vs. 2019 and power
a total media ad revenue recovery in 2021—up 24% vs. 2019
All advertising spend growth is in digital media – linear media ad spend is down 13 points since 2019
Source: Magna, 9/27/21
Includes Cyclical Events (Elections 2020, Summer Olympics 2021, Winter Olympics 2022). Digital ad sales include pure players and traditional media owners.
87%
152%
124%
Linear Media Digital Media All Media
COVID Recovery Index: Net Advertising Revenues by Channel2021 Forecast vs. 2019
2019 = 100%
(Search, Social, Video, Display,
Audio, Other (Email))
(National TV, Local TV, Print,
Radio, OOH, and Cinema)

104IAB Proprietary Research
Digital media channels now comprise 72% of brands’ advertising budgets
18%
10%
5%5%7%
7%
8%
12%
13%
15%
Total 2021 Budget
Brands’ Budget Share by Channel
Digital Video (incl. OTT/CTV)
Social Media
Display
Paid Search (SEM)
Digital Audio (excl. Podcasts)
Podcasts
Digital Out-of-Home (DOOH)
TV (Linear, Addressable, Data-Driven)
All other Traditional Media (Radio, Print,OOH, Direct Mail)
Source: IAB Brand Disruption Survey 2021, n=floating base; Survey Q: Identify the percent share of your 2021 (full year) ad media budget by CHANNEL.

105IAB Proprietary ResearchSource: Magna, 9/27/21
152%
169% 165%151% 149%
98%83%
Digital Media Video Social Search Audio Display Other (e.g.Email)
COVID Recovery Index: Net Advertising Revenues by Digital Channel2021 Forecast vs. 2019
2019 = 100%
Within digital, the greatest ad growth is in video, social, search, and audio
Includes Cyclical Events (Elections 2020, Summer Olympics 2021, Winter Olympics 2022). Digital ad sales include pure players and traditional media owners.

106IAB Proprietary Research
Sources: IAB Q1 2021 Impact Study, n=142; Survey Q: What percentage of your media budget was allocated to retail media networks for the past three years (e.g., Walmart,
Target, Best Buy, CVS, Home Depot, etc.)?; IAB Q1 2021 Impact Study, Retail Media Network buyers: 2019, n=32; 2020, n=37; 2021, n=40; Survey Q: What percentage of your
media budget was allocated to retail media networks for the past three years (e.g., Walmart, Target, Best Buy, CVS, Home Depot, etc.)?
Advertiser use of retail media networks is growing slowly, but investments rising
23%
26%
28%
77%
74%
72%
2019
2020
2021
Yes No
16%
21%
25%
2019 2020 2021
% of Buyers Allocating Budget to Retail
Media Networks
Average % of Budgets Being Allocated to
Retail Media Networks
107IAB Proprietary Research
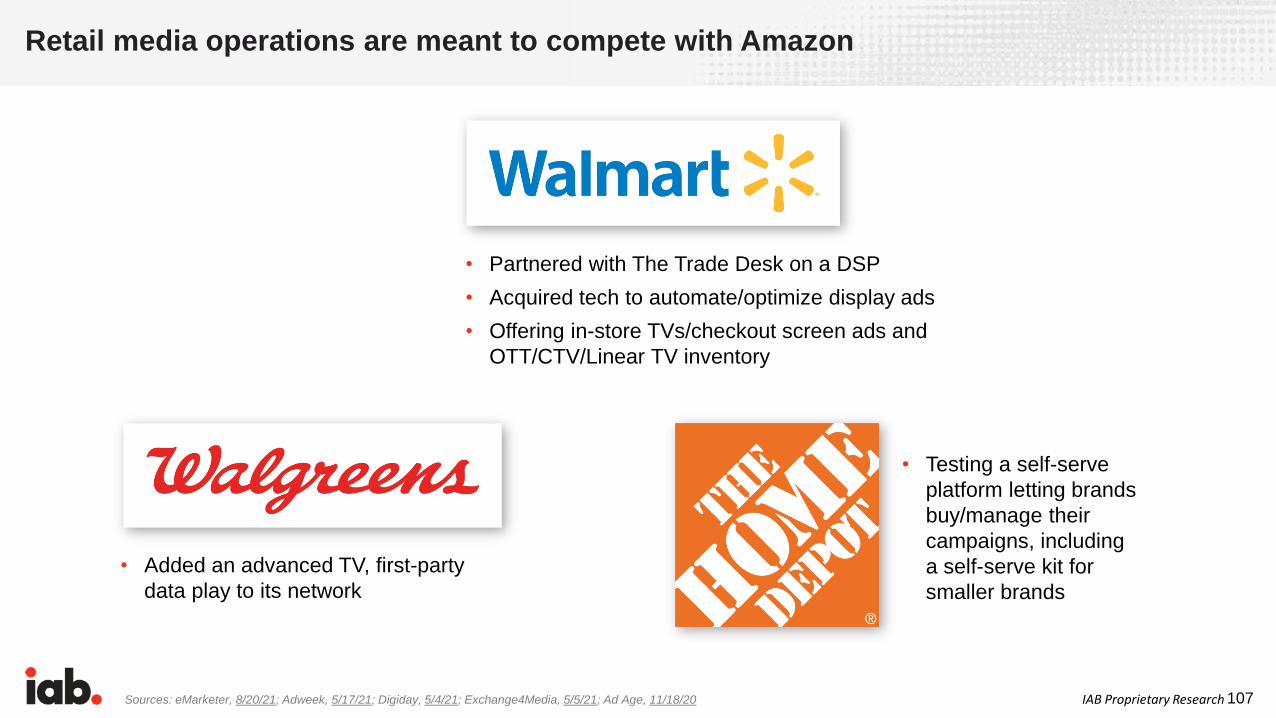
Retail media operations are meant to compete with Amazon
Sources: eMarketer, 8/20/21; Adweek, 5/17/21; Digiday, 5/4/21; Exchange4Media, 5/5/21; Ad Age, 11/18/20
• Partnered with The Trade Desk on a DSP
• Acquired tech to automate/optimize display ads
• Offering in-store TVs/checkout screen ads and
OTT/CTV/Linear TV inventory
• Added an advanced TV, first-party
data play to its network
• Testing a self-serve
platform letting brands
buy/manage their
campaigns, including
a self-serve kit for
smaller brands
108IAB Proprietary Research
Good reporting capabilities
Able to leverage customer
data/knowledge
Access to highly engaged audiences
at POS
Good synergy between online and
offline presence
Retailer partnership requires
media buy
ROAS is strong
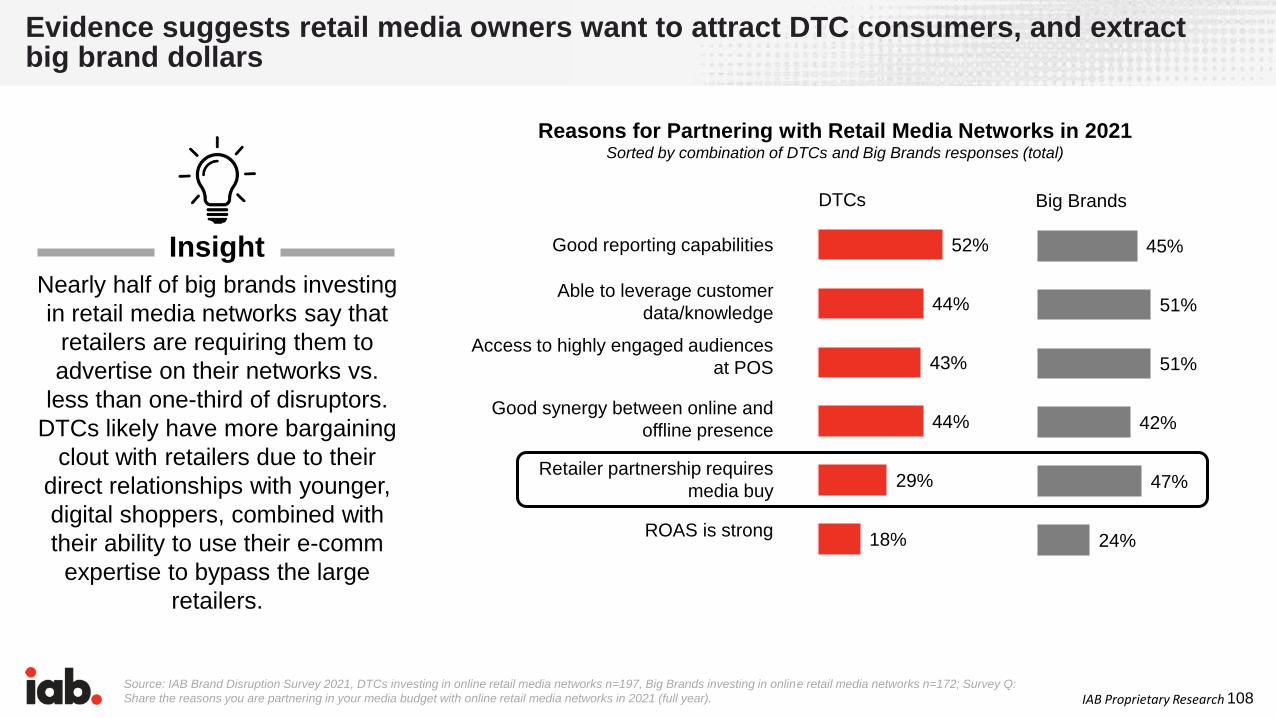
Evidence suggests retail media owners want to attract DTC consumers, and extract big brand dollars
Reasons for Partnering with Retail Media Networks in 2021Sorted by combination of DTCs and Big Brands responses (total)
18%
29%
44%
43%
44%
52%
24%
47%
42%
51%
51%
45%
DTCs Big Brands
Source: IAB Brand Disruption Survey 2021, DTCs investing in online retail media networks n=197, Big Brands investing in online retail media networks n=172; Survey Q:
Share the reasons you are partnering in your media budget with online retail media networks in 2021 (full year).
Nearly half of big brands investing
in retail media networks say that
retailers are requiring them to
advertise on their networks vs.
less than one-third of disruptors.
DTCs likely have more bargaining
clout with retailers due to their
direct relationships with younger,
digital shoppers, combined with
their ability to use their e-comm
expertise to bypass the large
retailers.
Insight
109IAB Proprietary Research
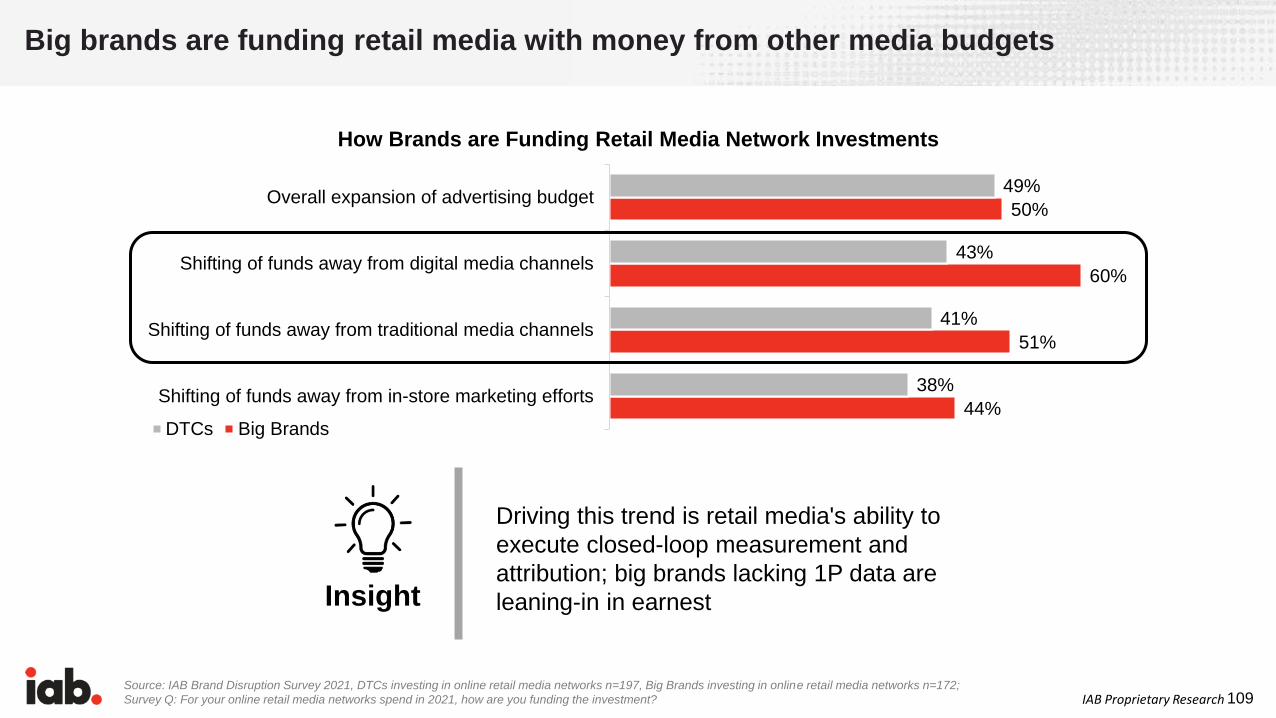
Big brands are funding retail media with money from other media budgets
Source: IAB Brand Disruption Survey 2021, DTCs investing in online retail media networks n=197, Big Brands investing in online retail media networks n=172;
Survey Q: For your online retail media networks spend in 2021, how are you funding the investment?
How Brands are Funding Retail Media Network Investments
44%
51%
60%
50%
38%
41%
43%
49%
Shifting of funds away from in-store marketing efforts
Shifting of funds away from traditional media channels
Shifting of funds away from digital media channels
Overall expansion of advertising budget
DTCs Big Brands
Driving this trend is retail media's ability to
execute closed-loop measurement and
attribution; big brands lacking 1P data are
leaning-in in earnestInsight

110IAB Proprietary Research
Sources: IAB Fall 2021 Impact Study, n=298; IAB March 2021 Impact Study, n=142; Fall 2021 Impact Study Q: Do you expect to have an increase/decrease in investment
during 2022 (vs. projected spend in 2021) for any of the following?; March 2021 Impact Survey Q: Do you expect to have an increase/decrease in investment during 2021 (vs.
actual spend in 2020) for any of the following?
• By next year half of buyers will be investing in shoppable ads (up from 45% in 2021 – see left)
Buyers are investing 23% more on shoppable ads this year, with plans for further increase in 2022 (+17%)
With shopping and content consumption
increasingly happening in one place—on digital—
the opportunity for publishers is to build on the trust
they've established with their readers to recommend
and facilitate commerce directly on their pages.Insight
111IAB Proprietary Research
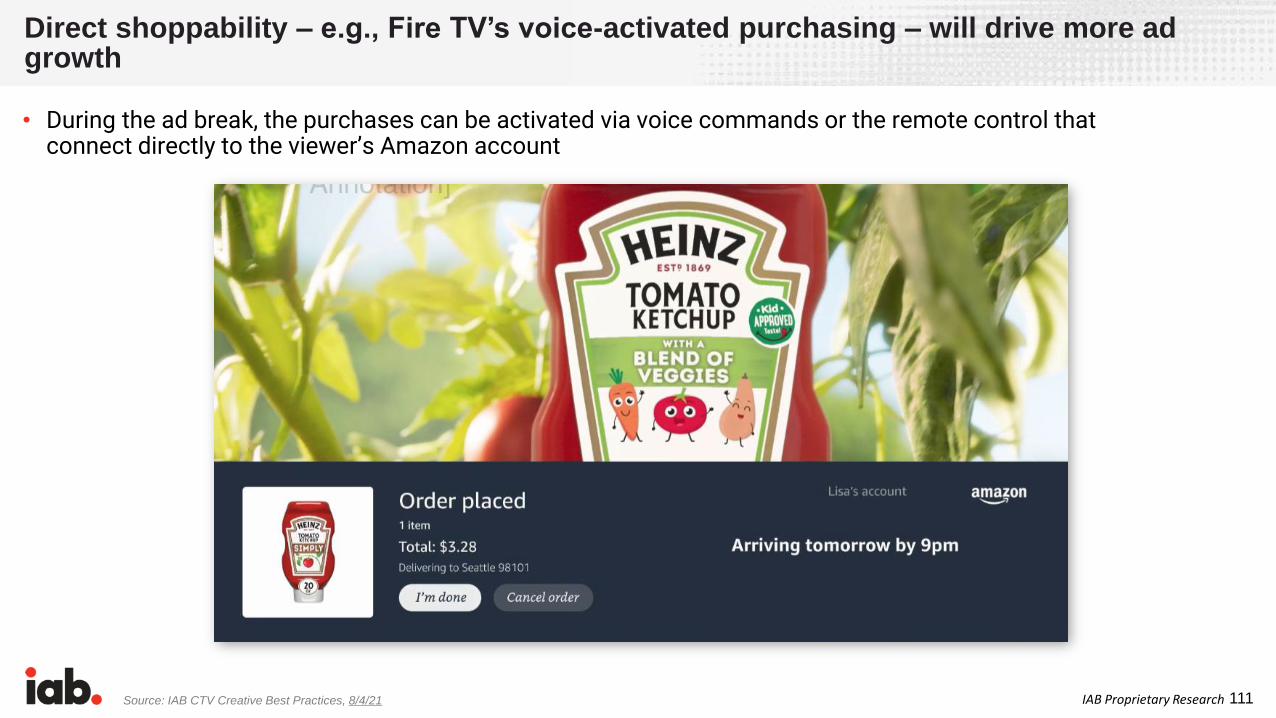
Direct shoppability – e.g., Fire TV’s voice-activated purchasing – will drive more ad growth
Source: IAB CTV Creative Best Practices, 8/4/21
• During the ad break, the purchases can be activated via voice commands or the remote control that connect directly to the viewer’s Amazon account
112IAB Proprietary Research
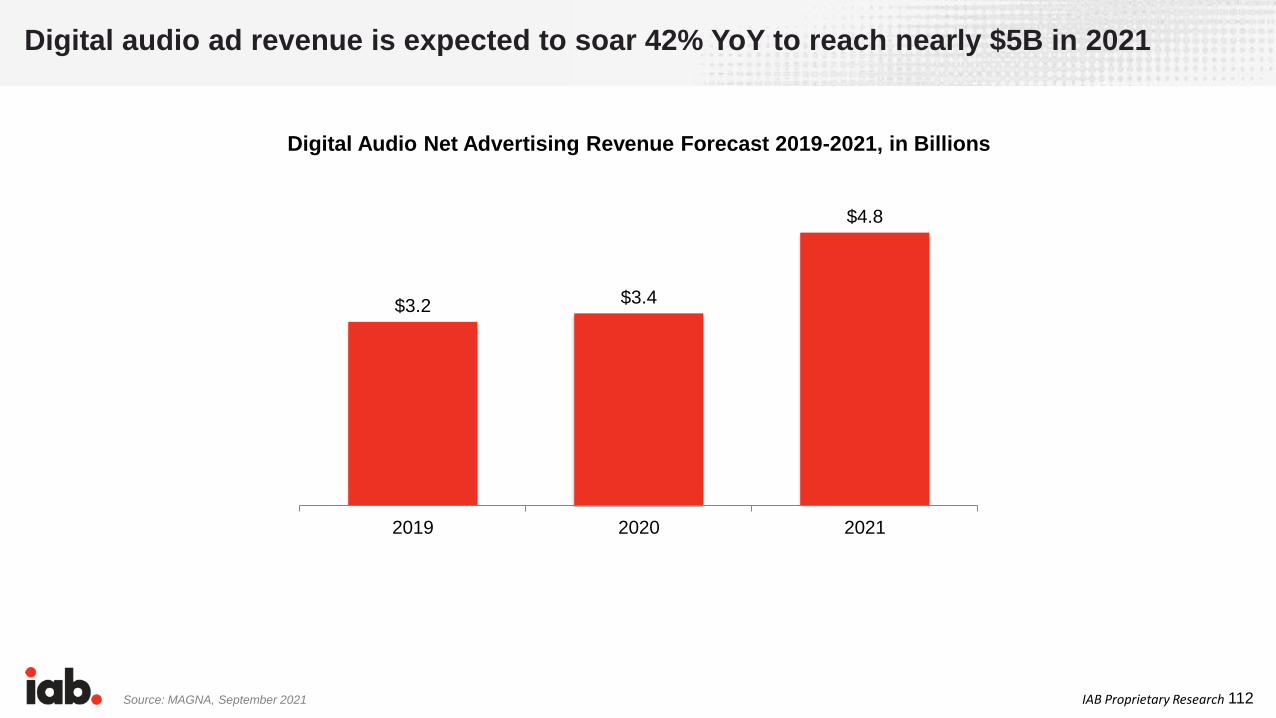
$3.2 $3.4
$4.8
2019 2020 2021
Digital Audio Net Advertising Revenue Forecast 2019-2021, in Billions
Source: MAGNA, September 2021
Digital audio ad revenue is expected to soar 42% YoY to reach nearly $5B in 2021

113IAB Proprietary ResearchSource: IAB FY 2020 Podcast Ad Revenue Study, 5/12/21
Podcast ad revenues are expected to exceed $1B this year, and $2B by 2023
$479.1
$708.1$842.3
$1,347.9
$1,755.4
$2,188.7
2018 2019 2020 2021 2022 2023
Total Market Podcast Revenues (2018 – 2023, $ millions)
48%
19%
60%
30%
25%
114IAB Proprietary Research
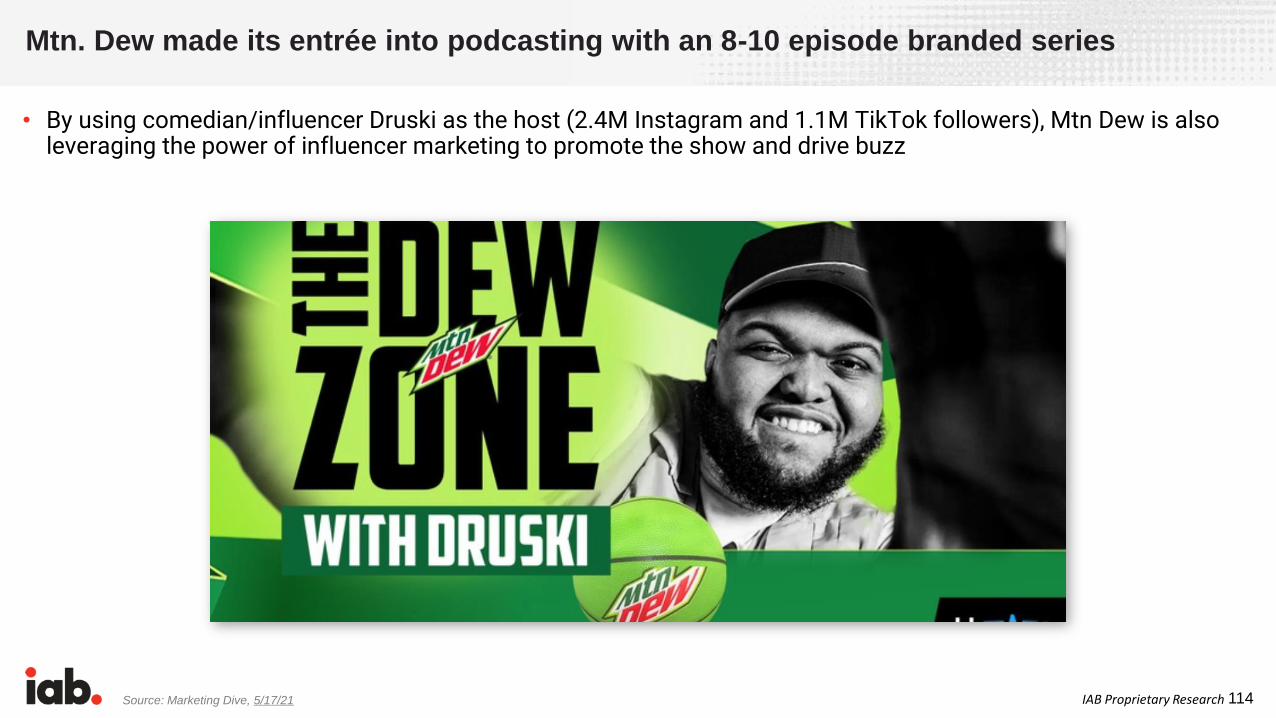
Mtn. Dew made its entrée into podcasting with an 8-10 episode branded series
Source: Marketing Dive, 5/17/21
• By using comedian/influencer Druski as the host (2.4M Instagram and 1.1M TikTok followers), Mtn Dew is also leveraging the power of influencer marketing to promote the show and drive buzz
115IAB Proprietary Research
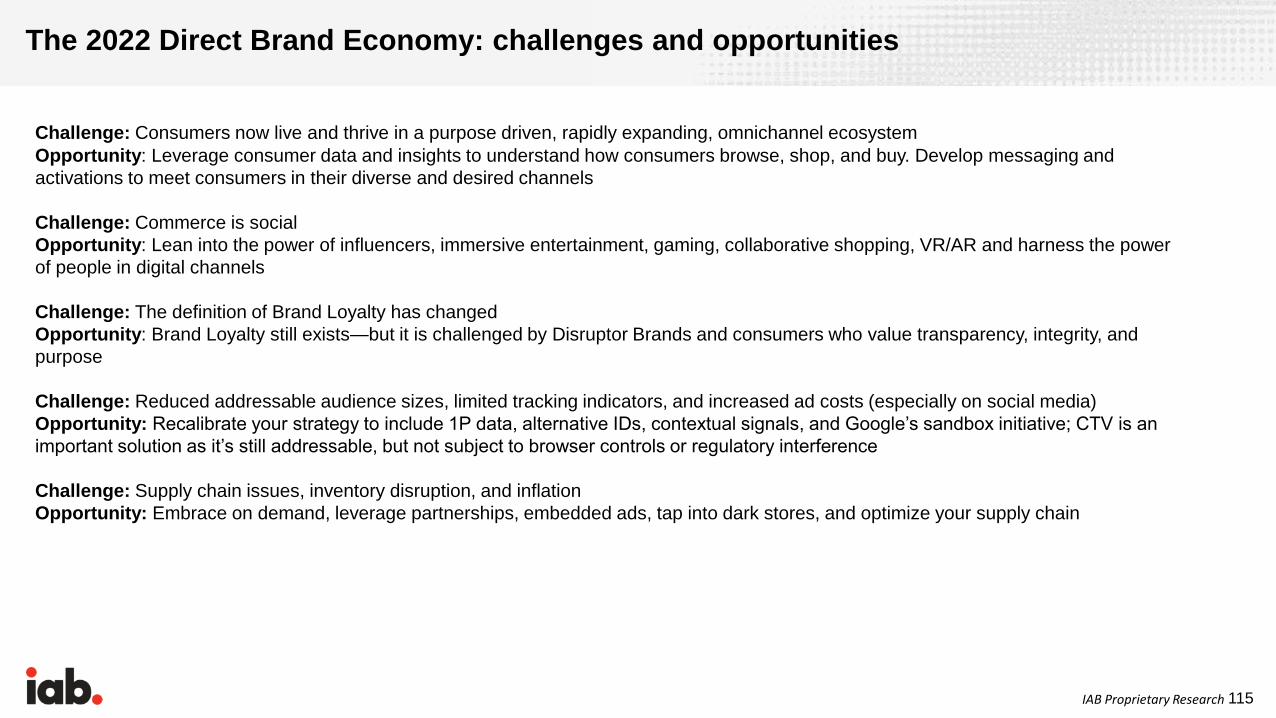
The 2022 Direct Brand Economy: challenges and opportunities
Challenge: Consumers now live and thrive in a purpose driven, rapidly expanding, omnichannel ecosystem
Opportunity: Leverage consumer data and insights to understand how consumers browse, shop, and buy. Develop messaging and
activations to meet consumers in their diverse and desired channels
Challenge: Commerce is social
Opportunity: Lean into the power of influencers, immersive entertainment, gaming, collaborative shopping, VR/AR and harness the power
of people in digital channels
Challenge: The definition of Brand Loyalty has changed
Opportunity: Brand Loyalty still exists—but it is challenged by Disruptor Brands and consumers who value transparency, integrity, and
purpose
Challenge: Reduced addressable audience sizes, limited tracking indicators, and increased ad costs (especially on social media)
Opportunity: Recalibrate your strategy to include 1P data, alternative IDs, contextual signals, and Google’s sandbox initiative; CTV is an
important solution as it’s still addressable, but not subject to browser controls or regulatory interference
Challenge: Supply chain issues, inventory disruption, and inflation
Opportunity: Embrace on demand, leverage partnerships, embedded ads, tap into dark stores, and optimize your supply chain
116IAB Proprietary Research
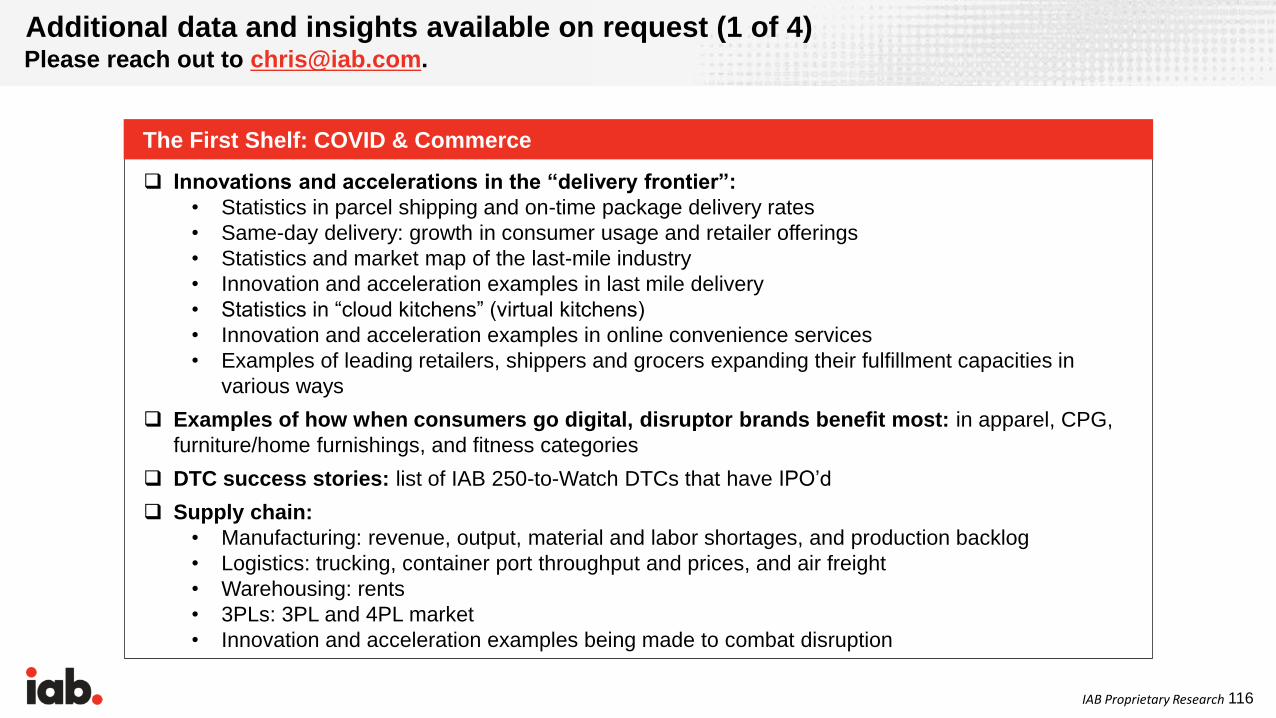
Additional data and insights available on request (1 of 4)Please reach out to [email protected].
❑ Innovations and accelerations in the “delivery frontier”:
• Statistics in parcel shipping and on-time package delivery rates
• Same-day delivery: growth in consumer usage and retailer offerings
• Statistics and market map of the last-mile industry
• Innovation and acceleration examples in last mile delivery
• Statistics in “cloud kitchens” (virtual kitchens)
• Innovation and acceleration examples in online convenience services
• Examples of leading retailers, shippers and grocers expanding their fulfillment capacities in
various ways
❑ Examples of how when consumers go digital, disruptor brands benefit most: in apparel, CPG,
furniture/home furnishings, and fitness categories
❑ DTC success stories: list of IAB 250-to-Watch DTCs that have IPO’d
❑ Supply chain:
• Manufacturing: revenue, output, material and labor shortages, and production backlog
• Logistics: trucking, container port throughput and prices, and air freight
• Warehousing: rents
• 3PLs: 3PL and 4PL market
• Innovation and acceleration examples being made to combat disruption
The First Shelf: COVID & Commerce

117IAB Proprietary Research
❑ E-commerce Infrastructure: statistics and examples of innovations and accelerations from shopping
to payments to returns, and customer service throughout
• Statistics include:
− Mobile commerce (m-commerce) market size
− Conversational commerce (c-commerce) market
− Publisher revenue driven by affiliate commerce
− Virtual shopping assistance market
− Virtual fitting room market
− Digital payments market
− Buy-Now-Pay-Later (BNPL) market
• Innovation and acceleration examples
❑ Brick-and-mortar Reimagined: statistics and examples of innovations and accelerations on how
stores are becoming digitally-powered ecosystems to serve each stage of the omnichannel shopping
process
• Statistics in in-store retail tech deals/funding and key drivers of growth
• Innovation and acceleration examples
The First Shelf: COVID & Commerce (continued)
Additional data and insights available on request (2 of 4)Please reach out to [email protected].
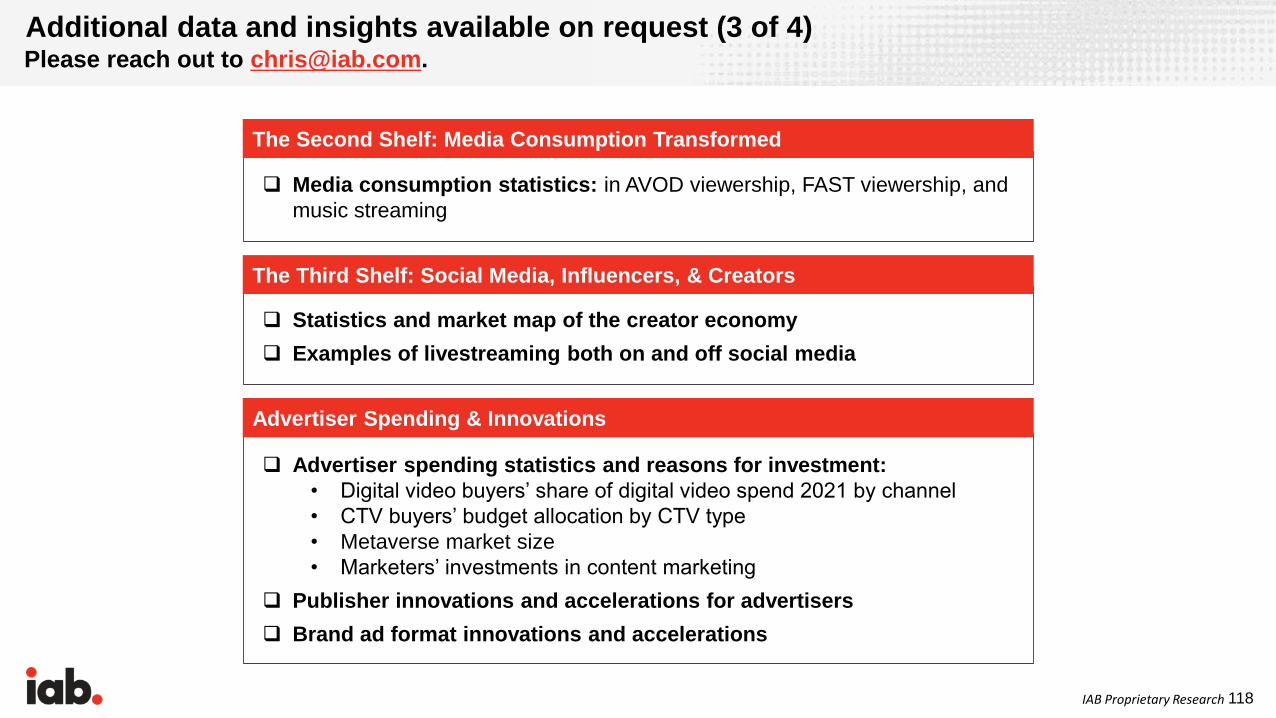
118IAB Proprietary Research
❑ Media consumption statistics: in AVOD viewership, FAST viewership, and
music streaming
❑ Advertiser spending statistics and reasons for investment:
• Digital video buyers’ share of digital video spend 2021 by channel
• CTV buyers’ budget allocation by CTV type
• Metaverse market size
• Marketers’ investments in content marketing
❑ Publisher innovations and accelerations for advertisers
❑ Brand ad format innovations and accelerations
The Second Shelf: Media Consumption Transformed
❑ Statistics and market map of the creator economy
❑ Examples of livestreaming both on and off social media
The Third Shelf: Social Media, Influencers, & Creators
Advertiser Spending & Innovations
Additional data and insights available on request (3 of 4)Please reach out to [email protected].

119IAB Proprietary Research
❑ Statistics on data volume, users, collection, and usage:
• Volume of Internet users, IoT connected devices, data
created/replicated, and mobile users
• Types of basic first-party data buyers are collecting
❑ Statistics on and strategies/solutions for the deprecation of third-party
cookies/IDs:
• Statistics on the threat of the third-party cookies/IDs to
publisher/platform revenue
• Latest industry identity and measurement solutions being adopted: new
ID frameworks, non-ID based solutions, and contextual solutions
• Examples of innovative brand and agency uses of first-party data
❑ Examples of new sell-side tools for cross-channel attribution,
online/offline measurement, and accessing/using first-party data for
marketing/advertising purposes
❑ Examples of innovative uses of artificial intelligence/machine learning
(AI/ML)
The Data Dilemma
Additional data and insights available on request (4 of 4)Please reach out to [email protected].

120IAB Proprietary Research
About IAB
The Interactive Advertising Bureau (IAB) empowers the media and marketing industries to
thrive in the digital economy. Its membership is comprised of more than 650 leading media
companies, brands, and the technology firms responsible for selling, delivering, and optimizing
digital ad marketing campaigns. The trade group fields critical research on interactive
advertising, while also educating brands, agencies, and the wider business community on the
importance of digital marketing. In affiliation with the IAB Tech Lab, IAB develops technical
standards and solutions. IAB is committed to professional development and elevating the
knowledge, skills, expertise, and diversity of the workforce across the industry. Through the
work of its public policy office in Washington, D.C., the trade association advocates for its
members and promotes the value of the interactive advertising industry to legislators and
policymakers. Founded in 1996, IAB is headquartered in New York City.
For more information, please visit iab.com

121IAB Proprietary Research
PubMatic (Nasdaq: PUBM) delivers superior
revenue to publishers by being an SSP of choice
for agencies and advertisers. PubMatic’s cloud
infrastructure platform for digital advertising
empowers app developers and publishers to
increase monetization while enabling media buyers
to drive return on investment by reaching and
engaging their target audiences in brand-safe,
premium environments across ad formats and
devices. Since 2006, PubMatic has been
expanding its owned and operated global
infrastructure and continues to cultivate
programmatic innovation. With a globally
distributed workforce and no corporate
headquarters, PubMatic operates 15 offices and
eight data centers across North America, Europe,
and Asia Pacific.
About our sponsors
YouTube believes that everyone deserves to have
a voice, and that the world is a better place when
we listen, share and build community through our
stories. YouTube Ads helps businesses grow by
reaching their customers and finding new ones.

122IAB Proprietary Research
Thank You!
Chris Bruderle, Senior Director, Research and Analytics: [email protected]
Libby Morgan, Senior Vice President, Chief Strategy Officer: [email protected]
Meredith Guiness (Green), Manager, Research and Analytics: [email protected]
Randall Rothenberg, Executive Chair: [email protected]

123IAB Proprietary Research
Key takeaways, 2018 - 2020
1. Permanent changes in industry supply chains are shifting
the center of growth in the U.S. consumer economy.
2. Economic benefits are accruing for brands that create
value by tapping into low-barrier-to-entry, capital-flexible,
leased or rented supply chains. These include thousands
of small brands in all major consumer-facing categories
that sell their own goods entirely or primarily through their
owned-and-operated digital channels.
3. The singular retail fulfillment experience has permanently
changed to a variable experience, which in turn transforms
all value-creation and –extraction activities before, during,
and after the sale.
4. All retail sales growth is shifting from brick-and-mortar
stores to digital, data-enriched channels.
5. First-party data relationships are important not for their
marketing value independent of other functions, but
because they fuel all significant functions of the enterprise,
including product development, customer value analysis,
and pricing.
6. An arms race for first-party data is influencing strategy,
investment, and marketing strategies among major
incumbent brands across all categories.
1. There is a playbook emerging that takes brands from
customer acquisition cost (CAC) to lifetime value (LTV).
2. Disruptor brands are acquiring individual customers at
scale, overwhelmingly through mobile channels.
3. Storytelling lowers acquisition costs.
4. Community turns customer acquisition cost (CAC) to
lifetime value (LTV).
5. For disruptors, branding must perform…and vice versa.
6. Direct brands are becoming media promiscuous,
moving beyond social media marketing—spending on
channels such as over-the-top (OTT) and addressable
television.
7. Omnichannel shopping is the new normal, from online to
brick-and-mortar to pop-up shops.
8. Fast is the new fashion in every category, with new
product launches happening in just 4 to 7 months.
9. Two-day delivery is the cost-of-entry standard for
customer service—and 2 hours is next.
10.Delivery of one product should empower the discovery
of others.
2018 2019
124IAB Proprietary Research
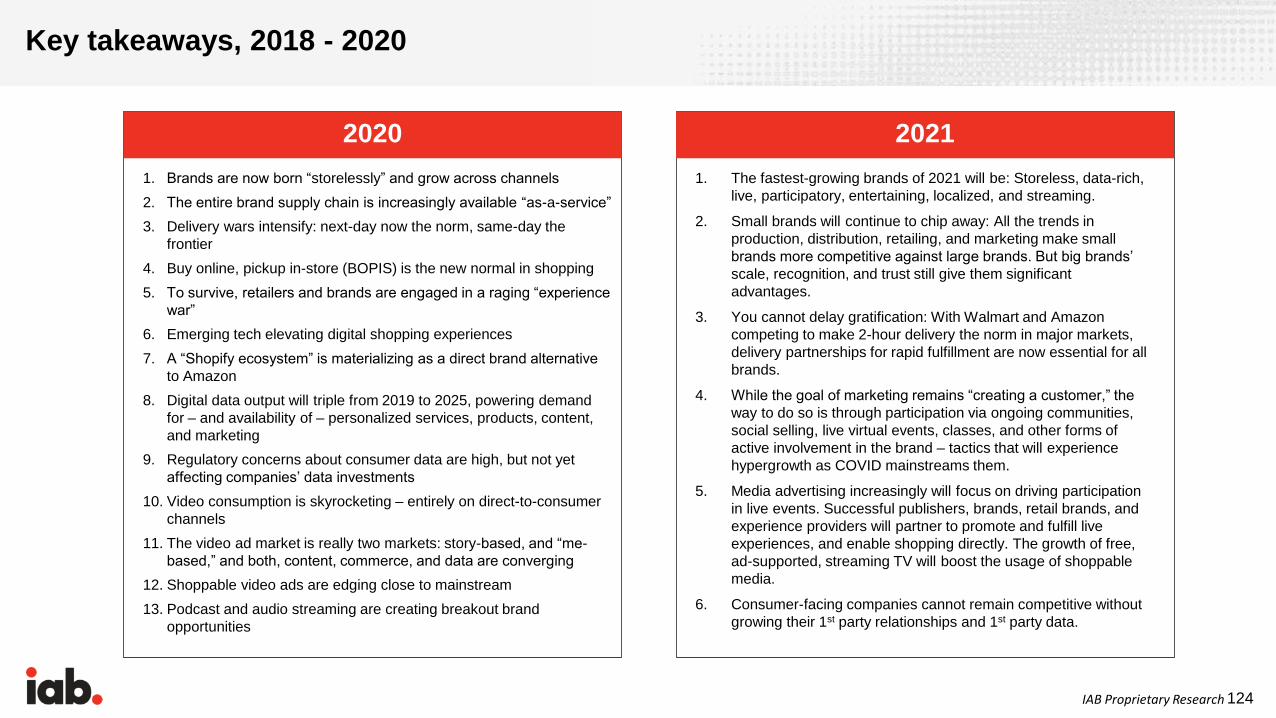
Key takeaways, 2018 - 2020
1. Brands are now born “storelessly” and grow across channels
2. The entire brand supply chain is increasingly available “as-a-service”
3. Delivery wars intensify: next-day now the norm, same-day the
frontier
4. Buy online, pickup in-store (BOPIS) is the new normal in shopping
5. To survive, retailers and brands are engaged in a raging “experience
war”
6. Emerging tech elevating digital shopping experiences
7. A “Shopify ecosystem” is materializing as a direct brand alternative
to Amazon
8. Digital data output will triple from 2019 to 2025, powering demand
for – and availability of – personalized services, products, content,
and marketing
9. Regulatory concerns about consumer data are high, but not yet
affecting companies’ data investments
10. Video consumption is skyrocketing – entirely on direct-to-consumer
channels
11. The video ad market is really two markets: story-based, and “me-
based,” and both, content, commerce, and data are converging
12. Shoppable video ads are edging close to mainstream
13. Podcast and audio streaming are creating breakout brand
opportunities
2020
1. The fastest-growing brands of 2021 will be: Storeless, data-rich,
live, participatory, entertaining, localized, and streaming.
2. Small brands will continue to chip away: All the trends in
production, distribution, retailing, and marketing make small
brands more competitive against large brands. But big brands’
scale, recognition, and trust still give them significant
advantages.
3. You cannot delay gratification: With Walmart and Amazon
competing to make 2-hour delivery the norm in major markets,
delivery partnerships for rapid fulfillment are now essential for all
brands.
4. While the goal of marketing remains “creating a customer,” the
way to do so is through participation via ongoing communities,
social selling, live virtual events, classes, and other forms of
active involvement in the brand – tactics that will experience
hypergrowth as COVID mainstreams them.
5. Media advertising increasingly will focus on driving participation
in live events. Successful publishers, brands, retail brands, and
experience providers will partner to promote and fulfill live
experiences, and enable shopping directly. The growth of free,
ad-supported, streaming TV will boost the usage of shoppable
media.
6. Consumer-facing companies cannot remain competitive without
growing their 1st party relationships and 1st party data.
2021