Embed Size (px)
Citation preview

Bramble Fruits: An Economic Assessment of the Feasibility of Providing Multiple-Peril Crop Insurance
for Raspberries and Blackberries
Prepared by the Economic Research Service,U.S. Department of Agriculture
for the Risk Management Agency
October 21, 1996
Contributors:
Glenn Zepp (202) 219-0771Joy Harwood (202) 219-0770
Charles Hammond (Summer intern)Agapi Somwaru (202) 219-0395

Table of Contents
Introduction . . . . . . . . . . . . . . . . . . . . . . . 6
The Bramble Plant . . . . . . . . . . . . . . . . . . . . . 9
Types of Brambles . . . . . . . . . . . . . . . . . . . . . 9Red Raspberries . . . . . . . . . . . . . . . . . . . 9Black Raspberries . . . . . . . . . . . . . . . . . . 11Purple and Yellow Raspberries . . . . . . . . . . . . 11Blackberries . . . . . . . . . . . . . . . . . . . . . 11
The Bramble Fruit Industry . . . . . . . . . . . . . . . . 12Location . . . . . . . . . . . . . . . . . . . . . . . 12Farms with Brambles . . . . . . . . . . . . . . . . . 12
The Bramble Fruit Market . . . . . . . . . . . . . . . . . 13Supply . . . . . . . . . . . . . . . . . . . . . . . . 13Demand . . . . . . . . . . . . . . . . . . . . . . . . 19Prices . . . . . . . . . . . . . . . . . . . . . . . . 19
Environmental Requirements and Production Practices . . . . 24Climate . . . . . . . . . . . . . . . . . . . . . . . 24Soil . . . . . . . . . . . . . . . . . . . . . . . . . 25Irrigation and Water Supplies . . . . . . . . . . . . 25Planting . . . . . . . . . . . . . . . . . . . . . . . 26Row Spacing . . . . . . . . . . . . . . . . . . . . . 26Training and Pruning Systems . . . . . . . . . . . . . 26Fertilization . . . . . . . . . . . . . . . . . . . . 27Weed Control . . . . . . . . . . . . . . . . . . . . . 28
Harvesting . . . . . . . . . . . . . . . . . . . . . . . . 28
Handling . . . . . . . . . . . . . . . . . . . . . . . . . 28
Processing . . . . . . . . . . . . . . . . . . . . . . . . 29
Marketing . . . . . . . . . . . . . . . . . . . . . . . . . 29
Costs of Production . . . . . . . . . . . . . . . . . . . . 29
Producer Organizations . . . . . . . . . . . . . . . . . . 31The Oregon Raspberry and Blackberry Commission . . . . 31The Washington Red Raspberry Commission . . . . . . . 32
Production Perils . . . . . . . . . . . . . . . . . . . . . 32Winter Injury . . . . . . . . . . . . . . . . . . . . 32Excessive Rain . . . . . . . . . . . . . . . . . . . . 33Excessive Heat . . . . . . . . . . . . . . . . . . . . 33Hail . . . . . . . . . . . . . . . . . . . . . . . . . 34Wind . . . . . . . . . . . . . . . . . . . . . . . . . 34
Sunburn . . . . . . . . . . . . . . . . . . . . . . . 34Insects . . . . . . . . . . . . . . . . . . . . . . . 34Diseases . . . . . . . . . . . . . . . . . . . . . . . 36Birds and Mammal Rodents . . . . . . . . . . . . . . . 38
State Analyses . . . . . . . . . . . . . . . . . . . . . . 39California . . . . . . . . . . . . . . . . . . . . . . 39Oregon . . . . . . . . . . . . . . . . . . . . . . . . 41Texas . . . . . . . . . . . . . . . . . . . . . . . . 42Washington . . . . . . . . . . . . . . . . . . . . . . 44Midwestern and Northeastern Raspberries . . . . . . . 46Southern States (Blackberries) . . . . . . . . . . . . 47
Ad Hoc Disaster Assistance for Brambles . . . . . . . . . . 47
Insurance Implementation Issues . . . . . . . . . . . . . . 48Demand for Insurance . . . . . . . . . . . . . . . . . 48Adverse Selection . . . . . . . . . . . . . . . . . . 51Reference Prices . . . . . . . . . . . . . . . . . . . 52Estimating “Appraised Production” . . . . . . . . . . 52Moral Hazard . . . . . . . . . . . . . . . . . . . . . 53Estimating Actual Production History (APH) . . . . . . 53
References . . . . . . . . . . . . . . . . . . . . . . . . 55
iv
Executive Summary
Bramble fruits refer to blackberries, raspberries, and hybrids (orgenetic combinations) of the two crops that are grown for theirsweet, juicy berries. Sometimes referred to simply as brambles orbramble berries because of their thorny canes (stalks), bramblefruits belong to the genus Rubis and family Rosaceae, the rosefamily. Although the term “bramble” denotes thorniness, someblackberry cultivars (varieties) have been developed that are free ofthorns.
In the U.S., large-scale commercial bramble production is locatedalmost exclusively in states along the Pacific Coast. According tothe 1992 Census of Agriculture, California, Oregon, and Washingtonreported 76 percent of the harvested U.S. raspberry acreage. California and Oregon accounted for 69 percent of the harvested U.S.blackberry acreage in 1992, and were also major producers ofboysenberries. Oregon is the main producer of loganberries. Theremaining bramble fruit production is scattered in small plantingsthroughout the United States.
Raspberry and blackberry plants have perennial roots and biennialshoots. The roots continue to grow for the life of the planting, butnew above-ground shoots (canes) develop each year from crown buds orbuds on the roots. Canes produce vegetative growth the first summerand form flower buds in the fall. These buds bloom the followingspring and bear fruit during the summer. After bearing, the canesdie, completing their life cycle.
Some red raspberry varieties are distinguished by their ability toinitiate flower buds on primocanes during their first summer andproduce fruit that fall. Cultivars with this growth habit are knownvariously as “everbearing,” “fall-fruiting,” or “primocane-bearing”raspberries, and are being widely used as a means of extending thefresh fruit marketing season.
Except in the western commercial production areas, brambles tend tobe grown in small plantings. The U.S. Census of Agriculture reported4,639 farms with 15,899 harvested acres of raspberries and 2,619farms with 6,994 harvested acres of blackberries in 1992. For thosestates other than California, Oregon, and Washington, there were3,522 farms with raspberries and 2,082 with blackberries, and, onaverage, they harvested just over one acre each. Many of these farmshad less than one acre.
More than 95 percent of the bramble fruit grown in Washington andOregon is sold for processing. Although the usage breakdown betweenfresh market and processing is not reported, California brambles aregrown mainly for the fresh market. Berries may be diverted toprocessing when fresh-market prices are low or if the berries are of

v
low quality. Central California is an important fresh-marketstrawberry area and shippers use the fresh-market infrastructuredeveloped for strawberries to handle and sell raspberries. Althoughstatistics are not available for other states, the fresh market,especially direct-to-consumer sales, reportedly accounts for the bulkof marketings.
Climate, chiefly temperature, is the most important factor affectingthe geographic distribution of commercial bramble production. Summerand winter temperatures can be either too hot or too cold forsuccessful berry production. Raspberries and blackberries need tohave an extended period during the winter with temperatures below 45o
F before they can resume growth in the spring. Failure to satisfythis requirement results in reduced flower bud growth in the springand diminished yields.
However, extreme low temperatures may kill raspberry and blackberrycanes, basal buds, and even the entire plant. Winter injuryreportedly is the most serious production peril for both raspberriesand blackberries. In general, red raspberries are more hardy thanare the black and purple cultivars.
An additional, frequently-cited cause of yield loss among raspberriesis root rot, which occurs when the soil is excessively wet. Excessive rains and excessive heat in combination at harvest-timewere cited as conditions that contribute to diseases and qualitydegradation, especially among raspberries. Brambles are also subjectto a number of other perils, such as hail, wind, and various insectand disease pests.
Because of their large commercial acreage, the greatest potential forbramble crop insurance exists in California, Oregon, and Washington. Some growers in Washington have indicated an interest in insurance. The Farm Service Agencies in Clark and Whatcom counties report thatthey have received requests for raspberry insurance and that growershave asked about the availability of such insurance. In addition,the extension farm advisor for brambles in Monterey and Santa Cruzcounties in California indicated that several growers had expressedfrustration that they did not have crop insurance available duringflooding in the spring of 1995.
Even so, disaster assistance payments in these states have been smallrelative to their acreage, suggesting that growers incur relativelyminor yield losses. Disaster payments for Oregon raspberries, forexample, accounted for about 6.5 percent of the U.S. total over the1988-94 period, while the state had 34 percent of U.S. harvestedacreage. Large payments have been received by midwestern andnortheastern growers in states that account for a small portion ofthe U.S. total acreage.
1 The value for blackberries includes boysenberries andloganberries produced in California.
6
Bramble Fruits: An Economic Assessment of the Feasibility of Providing Multiple-Peril Crop Insurance
for Raspberries and Blackberries
Introduction
Bramble fruits refer to blackberries, raspberries, and hybrids (orgenetic combinations) of the two crops that are grown for theirsweet, juicy berries. Sometimes referred to simply as brambles orbramble berries because of their thorny canes (stalks), bramblefruits belong to the genus Rubis and family Rosaceae, the rosefamily. Although the term “bramble” denotes thorniness, someblackberry cultivars (varieties) have been developed that are free ofthorns.
Raspberries and blackberries are composite fruits consisting ofnumerous tiny individual “drupelets” (one-seeded fruits) attached toa central core or receptacle. The main difference betweenblackberries and raspberries is in the way the ripened berryseparates from its stem. Raspberries loosen from the receptacle,leaving a hard, dry, inedible core attached to the plant. Thisresults in a thimble-shaped fruit with a hollow center. On the otherhand, blackberries loosen at the base of the receptacle, and thereceptacle becomes an integral part of the fruit. The blackberryreceptacle is soft, juicy, and edible.
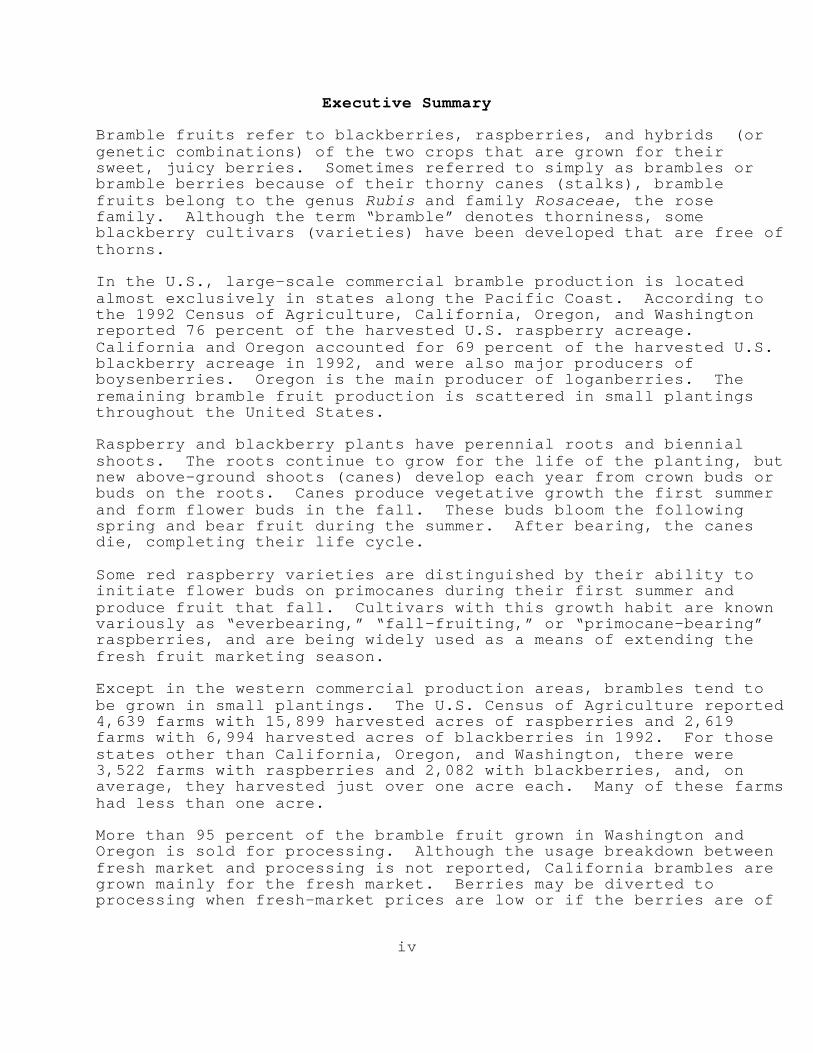
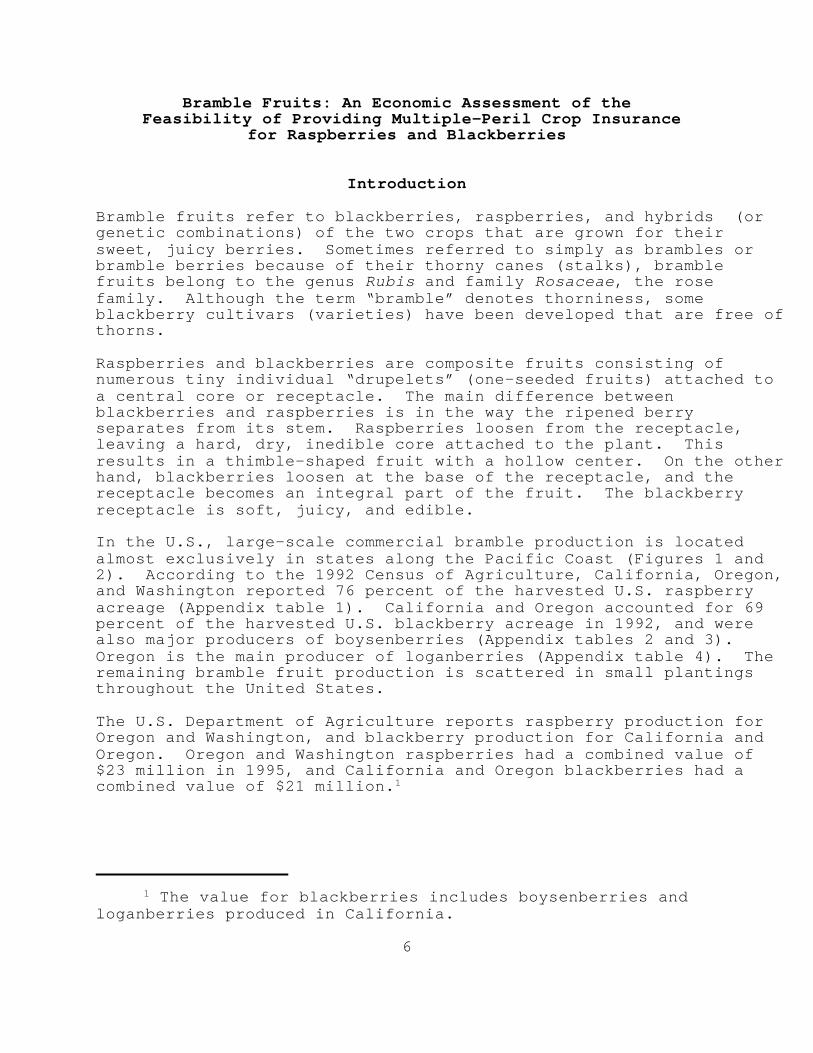
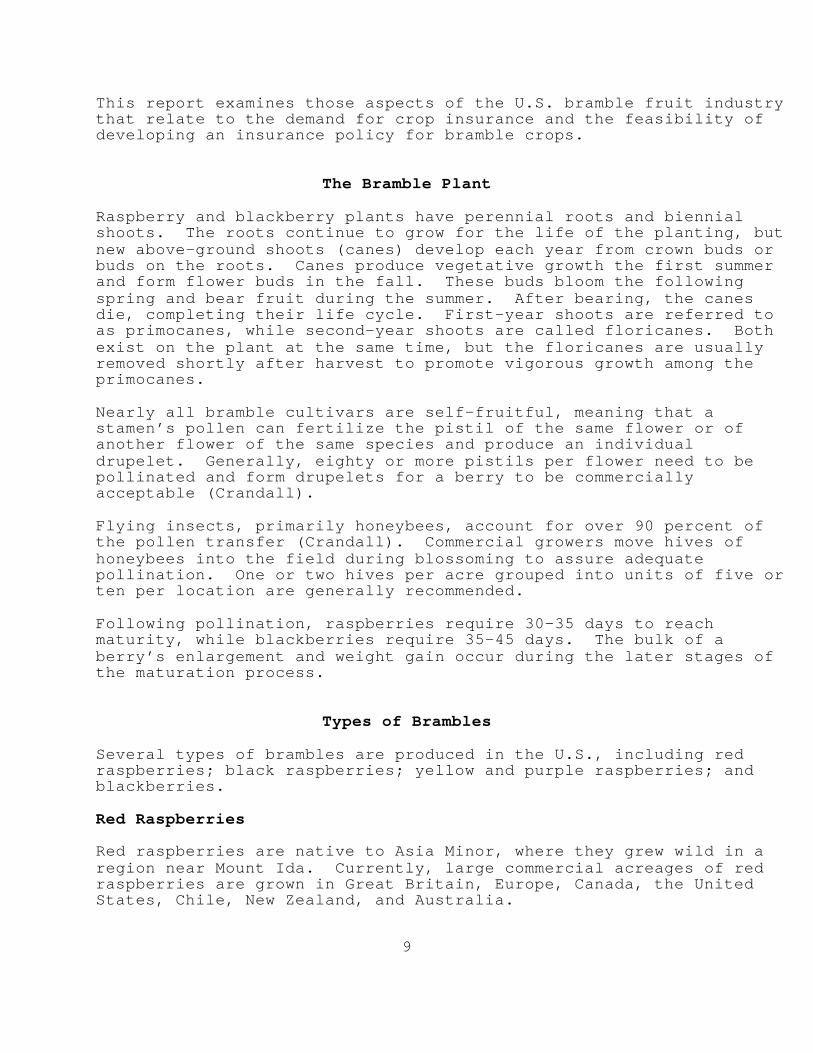
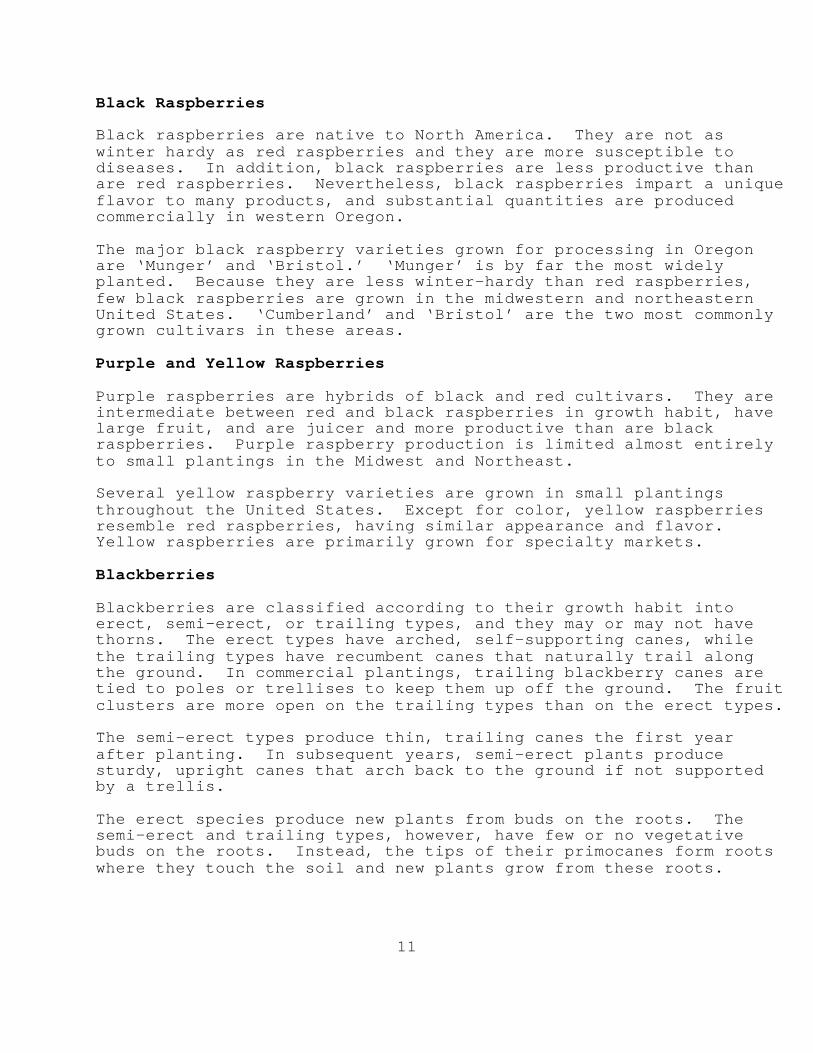
In the U.S., large-scale commercial bramble production is locatedalmost exclusively in states along the Pacific Coast (Figures 1 and2). According to the 1992 Census of Agriculture, California, Oregon,and Washington reported 76 percent of the harvested U.S. raspberryacreage (Appendix table 1). California and Oregon accounted for 69percent of the harvested U.S. blackberry acreage in 1992, and werealso major producers of boysenberries (Appendix tables 2 and 3). Oregon is the main producer of loganberries (Appendix table 4). Theremaining bramble fruit production is scattered in small plantingsthroughout the United States.
The U.S. Department of Agriculture reports raspberry production forOregon and Washington, and blackberry production for California andOregon. Oregon and Washington raspberries had a combined value of$23 million in 1995, and California and Oregon blackberries had acombined value of $21 million.1

7
Sa n t a C ru z
M o n t e rey
Ve n tu ra
C AL IFO RN IA
W a shin gto n
Mu ltn om ah
C la ckam a s
MarionPolk
Linn
OREGON
W ha tc om
S kag it
C ow litz
C la rk
W ASH INGTON
Figure 1. Major raspberry counties in California,Oregon, and Washington

8
Santa Cruz
CALIFORNIA
WashingtonClackam as
Mari on
OREGON
Figure 2. Major blackberry counties in California and Oregon
9
This report examines those aspects of the U.S. bramble fruit industrythat relate to the demand for crop insurance and the feasibility ofdeveloping an insurance policy for bramble crops.
The Bramble Plant
Raspberry and blackberry plants have perennial roots and biennialshoots. The roots continue to grow for the life of the planting, butnew above-ground shoots (canes) develop each year from crown buds orbuds on the roots. Canes produce vegetative growth the first summerand form flower buds in the fall. These buds bloom the followingspring and bear fruit during the summer. After bearing, the canesdie, completing their life cycle. First-year shoots are referred toas primocanes, while second-year shoots are called floricanes. Bothexist on the plant at the same time, but the floricanes are usuallyremoved shortly after harvest to promote vigorous growth among theprimocanes.
Nearly all bramble cultivars are self-fruitful, meaning that astamen’s pollen can fertilize the pistil of the same flower or ofanother flower of the same species and produce an individualdrupelet. Generally, eighty or more pistils per flower need to bepollinated and form drupelets for a berry to be commerciallyacceptable (Crandall).
Flying insects, primarily honeybees, account for over 90 percent ofthe pollen transfer (Crandall). Commercial growers move hives ofhoneybees into the field during blossoming to assure adequatepollination. One or two hives per acre grouped into units of five orten per location are generally recommended.
Following pollination, raspberries require 30-35 days to reachmaturity, while blackberries require 35-45 days. The bulk of aberry’s enlargement and weight gain occur during the later stages ofthe maturation process.
Types of Brambles
Several types of brambles are produced in the U.S., including redraspberries; black raspberries; yellow and purple raspberries; andblackberries.
Red Raspberries
Red raspberries are native to Asia Minor, where they grew wild in aregion near Mount Ida. Currently, large commercial acreages of redraspberries are grown in Great Britain, Europe, Canada, the UnitedStates, Chile, New Zealand, and Australia.

2 Although referred to as "fall-bearing," the primocanes on suchvarieties begin yielding berries in late summer and continue bearinginto the fall, until cold weather forces the plant into dormancy.
3 Many raspberry and blackberry varieties are grown in theUnited States. Some are long-time standards and others are promisingnew cultivars that are being grown on a trial basis. Appendix Aprovides a brief description of some of the varieties currentlyproduced.
10
Some red raspberry varieties are distinguished by their ability toinitiate flower buds on primocanes during their first summer andproduce fruit that fall. Cultivars with this growth habit are knownvariously as “everbearing,” “fall-fruiting,” or “primocane-bearing”raspberries, and are being widely used as a means of extending thefresh fruit marketing season.2 In addition to extending theraspberry season, these primocane-bearing berries can be grownsuccessfully in regions where low winter temperatures would severelydamage or kill raspberry canes. In these areas, cold damage isavoided by cutting off the canes at ground level in the fall. Theprimocanes that grow from root buds the following spring bear fruitduring the fall. Although this practice sacrifices the summer crop,it produces an abundant fall harvest which continues until frost.
Red raspberries are the most widely-grown bramble fruit in the UnitedStates. Although the bulk of U.S. commercial production is locatedin Oregon and Washington, small acreages are reported in every stateexcept Hawaii (Census of Agriculture, 1992).
The principal cultivars produced in the Pacific Northwest are‘Willamette’ and ‘Meeker.’3 They are well-suited for commercialproduction because they can be machine-harvested. In addition, theyproduce high yields of large, firm berries that are especially well-adapted to the processing market. New varieties being adopted in thePacific Northwest are ‘Chilliwack’ and ‘Tulameen,’ which are suitablefor both the processing and fresh markets.
‘Heritage’ and ‘Willamette’ are the principal varieties grown inCalifornia, where they are used primarily for the fresh fruit market. ‘Latham’ is the long-time standard cultivar for the midwestern andnortheastern United States, primarily because of its winter hardinessand relatively wide adaption. ‘Boyne,’ a new, hardy cultivar, isreplacing ‘Latham’ in some colder areas.
11
Black Raspberries
Black raspberries are native to North America. They are not aswinter hardy as red raspberries and they are more susceptible todiseases. In addition, black raspberries are less productive thanare red raspberries. Nevertheless, black raspberries impart a uniqueflavor to many products, and substantial quantities are producedcommercially in western Oregon.
The major black raspberry varieties grown for processing in Oregonare ‘Munger’ and ‘Bristol.’ ‘Munger’ is by far the most widelyplanted. Because they are less winter-hardy than red raspberries,few black raspberries are grown in the midwestern and northeasternUnited States. ‘Cumberland’ and ‘Bristol’ are the two most commonlygrown cultivars in these areas.
Purple and Yellow Raspberries
Purple raspberries are hybrids of black and red cultivars. They areintermediate between red and black raspberries in growth habit, havelarge fruit, and are juicer and more productive than are blackraspberries. Purple raspberry production is limited almost entirelyto small plantings in the Midwest and Northeast.
Several yellow raspberry varieties are grown in small plantingsthroughout the United States. Except for color, yellow raspberriesresemble red raspberries, having similar appearance and flavor. Yellow raspberries are primarily grown for specialty markets.
Blackberries
Blackberries are classified according to their growth habit intoerect, semi-erect, or trailing types, and they may or may not havethorns. The erect types have arched, self-supporting canes, whilethe trailing types have recumbent canes that naturally trail alongthe ground. In commercial plantings, trailing blackberry canes aretied to poles or trellises to keep them up off the ground. The fruitclusters are more open on the trailing types than on the erect types.
The semi-erect types produce thin, trailing canes the first yearafter planting. In subsequent years, semi-erect plants producesturdy, upright canes that arch back to the ground if not supportedby a trellis.
The erect species produce new plants from buds on the roots. Thesemi-erect and trailing types, however, have few or no vegetativebuds on the roots. Instead, the tips of their primocanes form rootswhere they touch the soil and new plants grow from these roots.
12
The major commercial blackberry varieties in the Pacific Northwestare ‘Marion’ and ‘Thornless Evergreen.’ Limited quantities of‘Logan,’ ‘Boysen,’ and ‘Olallie’ are also grown in this area. ‘Boysen’ and Olallie’ are the principal varieties grown forprocessing in the San Joaquin Valley of California, while ‘Shawnee’is the most widely grown cultivar in the southern part of the UnitedStates. Blackberry production in the Midwest and Northeast consistsof many small acreages located close to population centers where theberries can be sold in local fresh markets. Numerous varieties aregrown in these areas, but none are of commercial significance becauseof their small associated acreage.
The Bramble Fruit Industry
Location
Brambles are grown throughout the United States. The Census ofAgriculture reported 49 states with farms harvesting raspberries in1992 (only Hawaii had no raspberries) and 40 states with farmsharvesting blackberries. Two-thirds of the harvested raspberryacreage was located in Oregon and Washington and an additional 9percent was located in coastal California in 1992 (Appendix table 1). Michigan, New York, and Ohio each accounted for 2 percent or more ofU.S. harvested acreage.
The Pacific Coast states also accounted for nearly 70 percent of theblackberry acreage, with 64 percent in Oregon and 6 percent inCalifornia (Appendix table 2). Texas reported an additional 5percent.
Loganberries and boysenberries are mainly produced in California,Oregon, and Washington. These three states had 345 of the 347 farmswith boysenberries in 1992 and all of the farms with loganberries(Appendix tables 3 and 4). Loganberries and boysenberries are typesof blackberry and share the same cultural requirements and productionperils. They have different taste characteristics than otherblackberries, however, and are, therefore, not close substitutes forone another in most uses. Loganberry and boysenberry statistics areusually reported separately from other blackberries.
Farms with Brambles
Except in the western commercial production areas, brambles tend tobe grown in small plantings. The U.S. Census of Agriculture reported4,639 farms with 15,899 harvested acres of raspberries and 2,619farms with 6,994 harvested acres of blackberries in 1992. For thosestates other than California, Oregon, and Washington, there were3,522 farms with raspberries and 2,082 with blackberries, and, on
13
average, they harvested just over one acre each. Many of these farmshad less than one acre.
Sales data suggest that the majority of farms producing brambles aresmall-scale operations often operated by part-time farmers. Seventy-three percent of the raspberry and 77 percent of the blackberry farmshad total farm sales of $25,000 or less in 1987 (Appendix tables 5and 6). Even among the commercial states, half or more of the farmsproducing brambles had sales of less than $25,000. A similarsituation appears for boysenberries and loganberries (Appendix tables7 and 8). Many small operators may be persons with off-farm earningsor retirees who grow brambles for supplemental income.
The Bramble Fruit Market
Supply
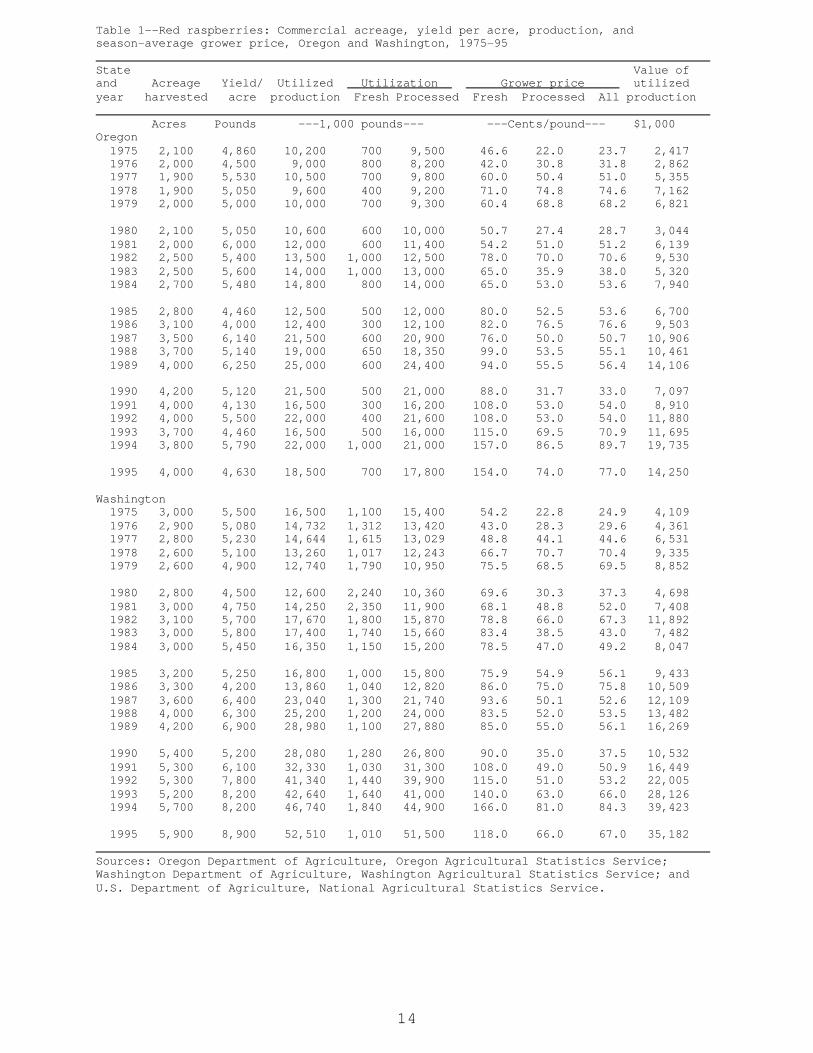
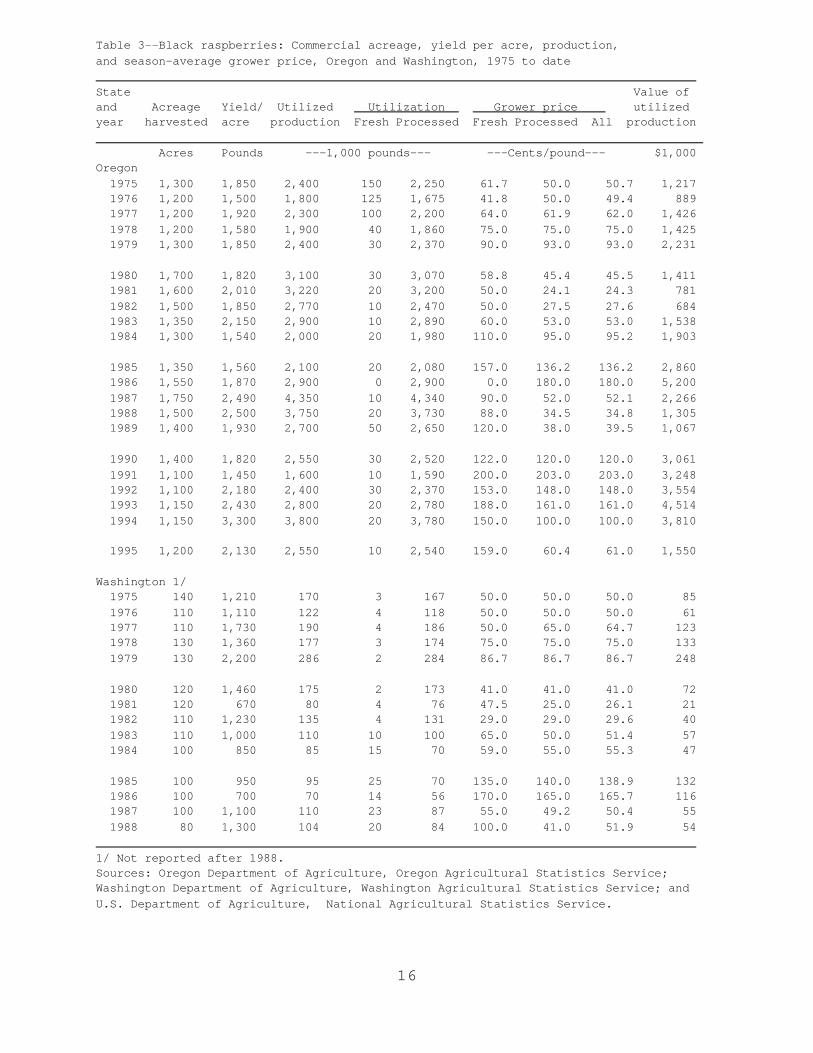
USDA reported 71 million pounds of red raspberry production inWashington and Oregon in 1995, 98 percent of which was used forprocessing (Table 1). USDA also reported 15 million pounds ofraspberries produced in California (Table 2). The bulk ofCalifornia’s output is grown for the fresh market. Other statesproduce an undetermined amount of raspberries, primarily for thefresh market. Oregon is the principal supplier of black raspberries,producing 2.6 million pounds in 1995 (Table 3).
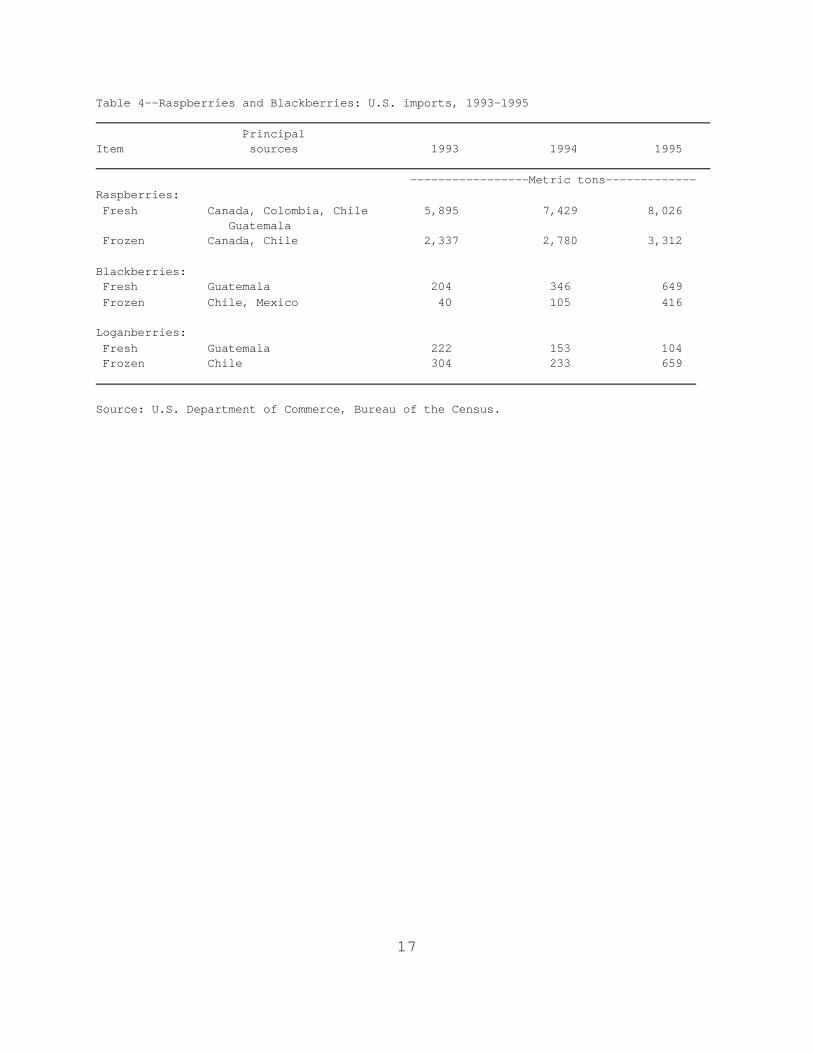
In addition to domestic production, the U.S. imports both fresh andfrozen raspberries. Fresh berries from Canada account for thelargest volume. Chile, Colombia, Mexico, and Guatemala ship asubstantial amount of fresh raspberries into the United States duringthe winter and spring (Table 4). U.S. frozen raspberry importsarrive mostly from Canada and Chile.
Red raspberry production in Oregon and Washington has risen sharplyin recent years. Combined production rose from 29 million pounds in1985 to 71 million pounds in 1995. The increased output may reflectproducers’ response to high prices during the past 5 years. The highprices occurring since 1990 are in part due to civil unrest in theformer Yugoslavia, which disrupted the world supply of frozenraspberries. Yugoslavia is a major world producer of redraspberries.
Oregon is the principal supplier of blackberries, producing 37.5 million pounds in 1995 (Table 5). Most of these are used for
14
Table 1--Red raspberries: Commercial acreage, yield per acre, production, andseason-average grower price, Oregon and Washington, 1975-95 State Value ofand Acreage Yield/ Utilized Utilization Grower price utilizedyear harvested acre production Fresh Processed Fresh Processed All production Acres Pounds ---1,000 pounds--- ---Cents/pound--- $1,000Oregon 1975 2,100 4,860 10,200 700 9,500 46.6 22.0 23.7 2,417 1976 2,000 4,500 9,000 800 8,200 42.0 30.8 31.8 2,862 1977 1,900 5,530 10,500 700 9,800 60.0 50.4 51.0 5,355 1978 1,900 5,050 9,600 400 9,200 71.0 74.8 74.6 7,162 1979 2,000 5,000 10,000 700 9,300 60.4 68.8 68.2 6,821
1980 2,100 5,050 10,600 600 10,000 50.7 27.4 28.7 3,044 1981 2,000 6,000 12,000 600 11,400 54.2 51.0 51.2 6,139 1982 2,500 5,400 13,500 1,000 12,500 78.0 70.0 70.6 9,530 1983 2,500 5,600 14,000 1,000 13,000 65.0 35.9 38.0 5,320 1984 2,700 5,480 14,800 800 14,000 65.0 53.0 53.6 7,940
1985 2,800 4,460 12,500 500 12,000 80.0 52.5 53.6 6,700 1986 3,100 4,000 12,400 300 12,100 82.0 76.5 76.6 9,503 1987 3,500 6,140 21,500 600 20,900 76.0 50.0 50.7 10,906 1988 3,700 5,140 19,000 650 18,350 99.0 53.5 55.1 10,461 1989 4,000 6,250 25,000 600 24,400 94.0 55.5 56.4 14,106
1990 4,200 5,120 21,500 500 21,000 88.0 31.7 33.0 7,097 1991 4,000 4,130 16,500 300 16,200 108.0 53.0 54.0 8,910 1992 4,000 5,500 22,000 400 21,600 108.0 53.0 54.0 11,880 1993 3,700 4,460 16,500 500 16,000 115.0 69.5 70.9 11,695 1994 3,800 5,790 22,000 1,000 21,000 157.0 86.5 89.7 19,735
1995 4,000 4,630 18,500 700 17,800 154.0 74.0 77.0 14,250
Washington 1975 3,000 5,500 16,500 1,100 15,400 54.2 22.8 24.9 4,109 1976 2,900 5,080 14,732 1,312 13,420 43.0 28.3 29.6 4,361 1977 2,800 5,230 14,644 1,615 13,029 48.8 44.1 44.6 6,531 1978 2,600 5,100 13,260 1,017 12,243 66.7 70.7 70.4 9,335 1979 2,600 4,900 12,740 1,790 10,950 75.5 68.5 69.5 8,852
1980 2,800 4,500 12,600 2,240 10,360 69.6 30.3 37.3 4,698 1981 3,000 4,750 14,250 2,350 11,900 68.1 48.8 52.0 7,408 1982 3,100 5,700 17,670 1,800 15,870 78.8 66.0 67.3 11,892 1983 3,000 5,800 17,400 1,740 15,660 83.4 38.5 43.0 7,482 1984 3,000 5,450 16,350 1,150 15,200 78.5 47.0 49.2 8,047
1985 3,200 5,250 16,800 1,000 15,800 75.9 54.9 56.1 9,433 1986 3,300 4,200 13,860 1,040 12,820 86.0 75.0 75.8 10,509 1987 3,600 6,400 23,040 1,300 21,740 93.6 50.1 52.6 12,109 1988 4,000 6,300 25,200 1,200 24,000 83.5 52.0 53.5 13,482 1989 4,200 6,900 28,980 1,100 27,880 85.0 55.0 56.1 16,269
1990 5,400 5,200 28,080 1,280 26,800 90.0 35.0 37.5 10,532 1991 5,300 6,100 32,330 1,030 31,300 108.0 49.0 50.9 16,449 1992 5,300 7,800 41,340 1,440 39,900 115.0 51.0 53.2 22,005 1993 5,200 8,200 42,640 1,640 41,000 140.0 63.0 66.0 28,126 1994 5,700 8,200 46,740 1,840 44,900 166.0 81.0 84.3 39,423
1995 5,900 8,900 52,510 1,010 51,500 118.0 66.0 67.0 35,182 Sources: Oregon Department of Agriculture, Oregon Agricultural Statistics Service;Washington Department of Agriculture, Washington Agricultural Statistics Service; andU.S. Department of Agriculture, National Agricultural Statistics Service.

15
Table 2--All raspberries: Commercial acreage, yield per acre, production, season-average grower price, and value, California, 1990 to 1995
State Value ofand Acreage Yield/ Utilized Utilization Grower price utilizedyear harvested acre production Fresh Processed Fresh Processed All production
Acres Pounds ---1,000 pounds--- ---Cents/pound--- $1,000
1990 1,700 10,400 17,700 na na na na 1.650 29,228
1991 na na na na na na na na na1992 1,600 16,500 26,400 na na na na 1.830 48,2761993 1,850 14,200 26,300 na na na na 1.480 39,000
1994 1,900 11,100 21,000 na na na na 1.430 30,0001995 1,900 8,050 15,300 na na na na 1.520 23,325
na = not available.
Source: U.S. Department of Agriculture, National Agricultural Statistics Service.
16
Table 3--Black raspberries: Commercial acreage, yield per acre, production, and season-average grower price, Oregon and Washington, 1975 to date State Value ofand Acreage Yield/ Utilized Utilization Grower price utilizedyear harvested acre production Fresh Processed Fresh Processed All production Acres Pounds ---1,000 pounds--- ---Cents/pound--- $1,000Oregon 1975 1,300 1,850 2,400 150 2,250 61.7 50.0 50.7 1,217 1976 1,200 1,500 1,800 125 1,675 41.8 50.0 49.4 889 1977 1,200 1,920 2,300 100 2,200 64.0 61.9 62.0 1,426 1978 1,200 1,580 1,900 40 1,860 75.0 75.0 75.0 1,425 1979 1,300 1,850 2,400 30 2,370 90.0 93.0 93.0 2,231
1980 1,700 1,820 3,100 30 3,070 58.8 45.4 45.5 1,411 1981 1,600 2,010 3,220 20 3,200 50.0 24.1 24.3 781 1982 1,500 1,850 2,770 10 2,470 50.0 27.5 27.6 684 1983 1,350 2,150 2,900 10 2,890 60.0 53.0 53.0 1,538 1984 1,300 1,540 2,000 20 1,980 110.0 95.0 95.2 1,903
1985 1,350 1,560 2,100 20 2,080 157.0 136.2 136.2 2,860 1986 1,550 1,870 2,900 0 2,900 0.0 180.0 180.0 5,200 1987 1,750 2,490 4,350 10 4,340 90.0 52.0 52.1 2,266 1988 1,500 2,500 3,750 20 3,730 88.0 34.5 34.8 1,305 1989 1,400 1,930 2,700 50 2,650 120.0 38.0 39.5 1,067
1990 1,400 1,820 2,550 30 2,520 122.0 120.0 120.0 3,061 1991 1,100 1,450 1,600 10 1,590 200.0 203.0 203.0 3,248 1992 1,100 2,180 2,400 30 2,370 153.0 148.0 148.0 3,554 1993 1,150 2,430 2,800 20 2,780 188.0 161.0 161.0 4,514 1994 1,150 3,300 3,800 20 3,780 150.0 100.0 100.0 3,810
1995 1,200 2,130 2,550 10 2,540 159.0 60.4 61.0 1,550
Washington 1/ 1975 140 1,210 170 3 167 50.0 50.0 50.0 85 1976 110 1,110 122 4 118 50.0 50.0 50.0 61 1977 110 1,730 190 4 186 50.0 65.0 64.7 123 1978 130 1,360 177 3 174 75.0 75.0 75.0 133 1979 130 2,200 286 2 284 86.7 86.7 86.7 248
1980 120 1,460 175 2 173 41.0 41.0 41.0 72 1981 120 670 80 4 76 47.5 25.0 26.1 21 1982 110 1,230 135 4 131 29.0 29.0 29.6 40 1983 110 1,000 110 10 100 65.0 50.0 51.4 57 1984 100 850 85 15 70 59.0 55.0 55.3 47
1985 100 950 95 25 70 135.0 140.0 138.9 132 1986 100 700 70 14 56 170.0 165.0 165.7 116 1987 100 1,100 110 23 87 55.0 49.2 50.4 55 1988 80 1,300 104 20 84 100.0 41.0 51.9 54 1/ Not reported after 1988.Sources: Oregon Department of Agriculture, Oregon Agricultural Statistics Service; Washington Department of Agriculture, Washington Agricultural Statistics Service; andU.S. Department of Agriculture, National Agricultural Statistics Service.
17
Table 4--Raspberries and Blackberries: U.S. imports, 1993-1995 PrincipalItem sources 1993 1994 1995 -----------------Metric tons-------------Raspberries: Fresh Canada, Colombia, Chile 5,895 7,429 8,026 Guatemala Frozen Canada, Chile 2,337 2,780 3,312
Blackberries: Fresh Guatemala 204 346 649 Frozen Chile, Mexico 40 105 416
Loganberries: Fresh Guatemala 222 153 104 Frozen Chile 304 233 659
Source: U.S. Department of Commerce, Bureau of the Census.

18
Table 5--Blackberries: Commercial acreage, yield per acre, production, andseason-average grower price, Oregon and Washington, 1975 to date State Value ofand Acreage Yield/ Utilized Utilization Grower price utilizedyear harvested acre production Fresh Processed Fresh Processed All production Acres Pounds ---1,000 pounds--- ---Cents/pound--- $1,000Oregon 1975 3,000 6,830 20,500 300 20,200 21.0 14.4 14.5 2,973 1976 2,600 8,190 21,300 400 20,900 28.1 29.0 29.0 6,177 1977 2,600 7,000 18,200 400 17,800 56.5 45.3 45.5 8,281 1978 3,000 6,700 20,100 400 19,700 55.5 50.7 50.8 10,211 1979 2,500 5,600 14,000 550 13,450 66.2 58.0 58.3 8,165
1980 3,400 8,470 28,800 400 28,400 41.2 20.1 20.4 5,873 1981 3,000 6,580 18,000 450 17,550 30.5 17.2 17.5 3,150 1982 3,000 6,830 18,600 900 17,700 44.2 23.2 24.2 4,504 1983 3,000 7,000 20,250 200 20,050 49.5 29.1 29.3 5,943 1984 3,100 6,190 19,200 400 18,800 49.8 49.8 49.8 9,558
1985 3,400 7,060 24,000 200 23,800 60.5 57.8 57.8 13,873 1986 3,600 6,390 23,000 200 22,800 67.0 60.9 60.9 14,018 1987 4,900 7,670 37,600 610 36,990 60.7 27.7 28.3 10,629 1988 4,400 7,720 33,950 1,100 32,850 58.1 30.0 30.9 10,498 1989 4,200 5,520 23,200 700 22,500 57.7 37.1 37.7 8,748
1990 4,150 7,730 32,100 900 31,200 92.6 37.4 39.0 12,512 1991 3,050 5,510 16,800 700 16,100 146.0 83.2 85.8 14,413 1992 4,700 9,110 42,800 1,100 41,700 88.7 43.9 45.1 19,284 1993 4,700 6,470 30,400 1,200 29,200 86.5 29.1 31.4 9,539 1994 5,040 7,480 37,700 1,200 36,500 95.0 35.8 37.7 14,207
1995 4,900 7,650 37,500 850 36,650 110.0 54.3 55.6 20,836
Washington 1/ 1975 210 7,330 1,540 17 1,523 25.7 13.4 13.5 208 1976 210 6,600 1,386 20 1,366 35.6 28.4 28.5 395 1977 210 5,900 1,239 42 1,197 53.3 40.0 40.5 502 1978 200 5,300 1,060 45 1,015 48.9 52.5 49.1 520 1979 200 2,540 508 21 487 50.0 55.4 55.2 280
1980 240 3,500 840 37 803 55.0 14.0 15.8 133 1981 220 3,750 825 250 575 55.0 8.3 22.5 186 1982 160 3,800 608 308 300 44.1 11.0 27.8 169 1983 160 4,250 680 190 490 54.8 20.4 30.0 204 1984 160 5,000 800 200 600 58.0 40.0 44.5 356
1985 150 4,700 705 315 390 62.0 46.0 53.2 375 1986 150 3,800 570 170 400 75.0 41.0 51.1 292 1987 150 5,400 810 260 550 62.0 29.8 40.1 325 1988 150 5,500 825 325 500 74.5 32.0 48.7 402 1989 130 5,500 715 300 415 75.0 25.0 46.0 329 1/ Not reported after 1989.Sources: Oregon Department of Agriculture, Oregon Agricultural and Fisheries Statistics; Washington Department of Agriculture, Washington Agricultural Statistics Service; andU.S. Department of Agriculture, National Agricultural Statistics Service.
19
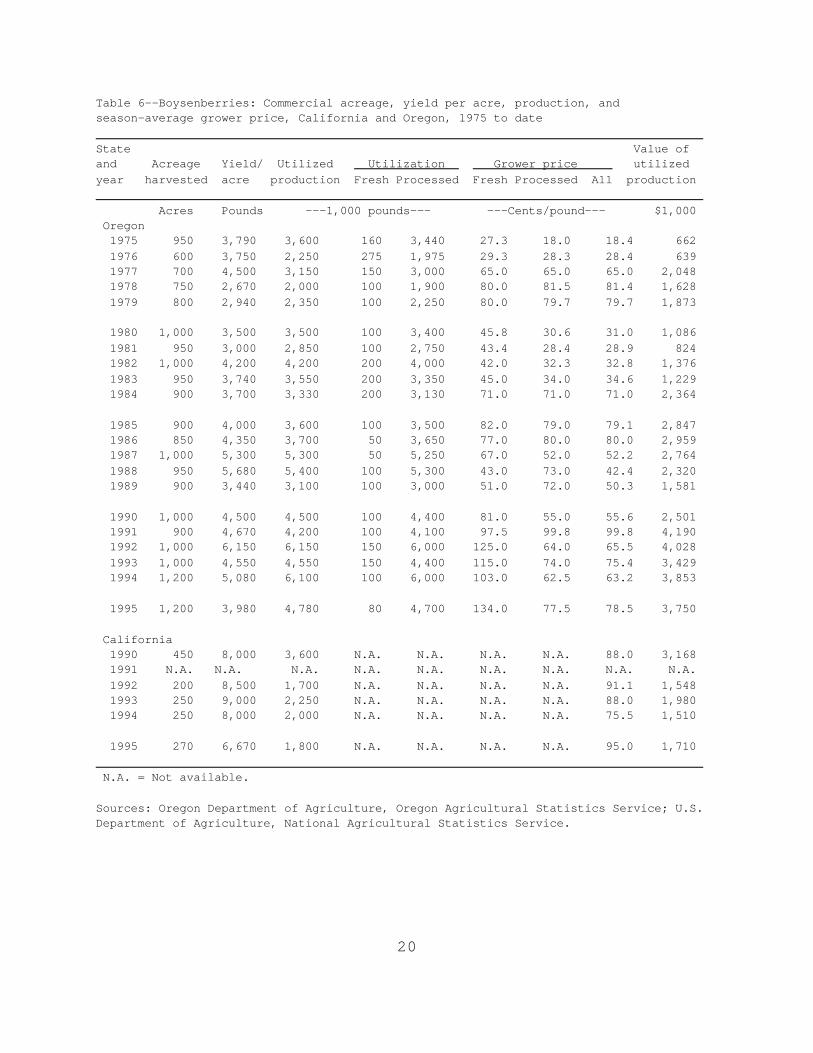
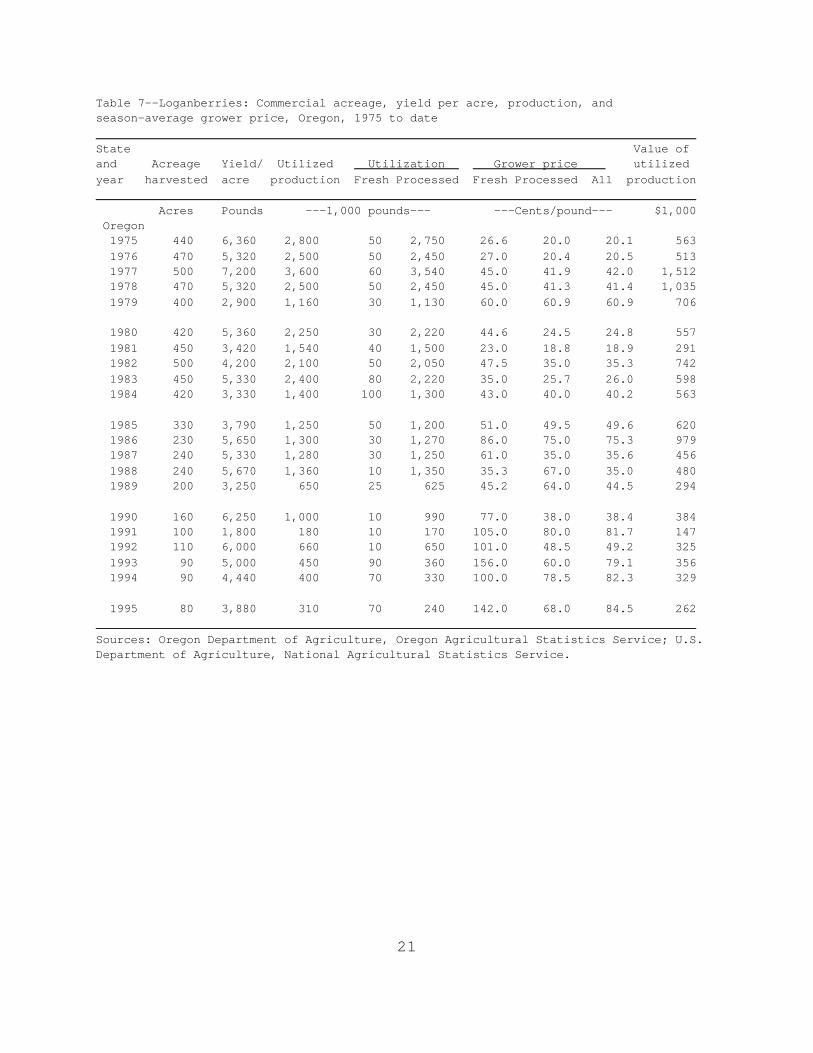
processing. Other states, especially in the middle and southernlatitudes of the U.S., produce an unknown volume of blackberries,most of which are sold in local fresh markets. In addition todomestic output, the U.S. imports a small amount of blackberries,mainly fresh product from Guatemala. Chile and Mexico are theprincipal sources of frozen blackberry imports. Oregon is also theprincipal supplier of boysenberries and loganberries (Tables 6 and7).
Demand
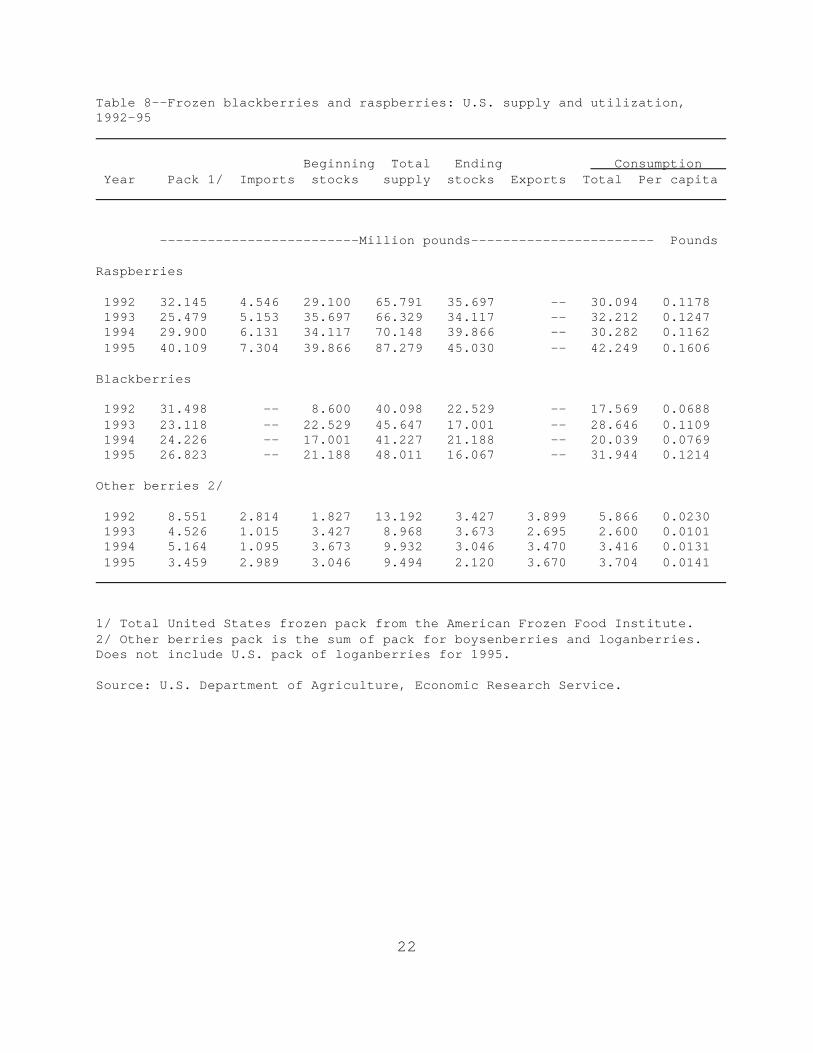
Information on raspberry and blackberry consumption in the UnitedStates is sketchy because production is only reported for threestates--California, Oregon, and Washington. The most complete datarelate to frozen raspberries and blackberries, for which the EconomicResearch Service (ERS) estimates total and per-capita consumption. These estimates indicate that per capita combined use of frozenraspberries and blackberries rose from about 0.17 pounds per personin 1975 to about 0.28 pounds in 1995 (Table 8). Although these data suggest rising consumption, they may overstateany upward trend. There is a great deal of year-to-year variation inuse, and consumption during some intervening years fell below the1975 level, while in other years, use exceeded that which occurred in1995.
Prices
Fresh-market berries almost always sell for a premium over those soldfor processing. Data for Washington and Oregon suggest that fresh-market raspberry prices average about double the prices forprocessing berries. One reason is that harvesting and marketingcosts are higher for fresh-market berries, which must be hand pickedand marketed in retail-sized containers. In contrast, processingberries are usually machine harvested and handled in reusablecontainers. Harvesting and marketing expenses for fresh-marketberries may be as much as ten times the cost for berries used forprocessing.
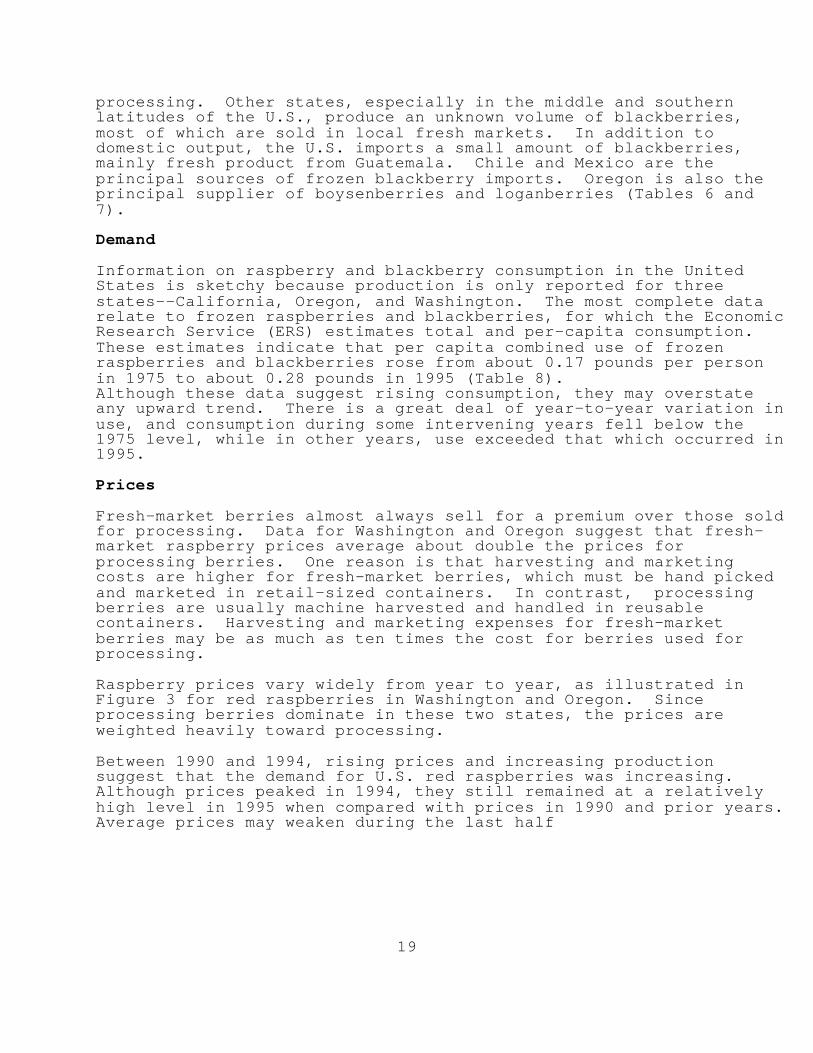
Raspberry prices vary widely from year to year, as illustrated inFigure 3 for red raspberries in Washington and Oregon. Sinceprocessing berries dominate in these two states, the prices areweighted heavily toward processing.
Between 1990 and 1994, rising prices and increasing productionsuggest that the demand for U.S. red raspberries was increasing.Although prices peaked in 1994, they still remained at a relativelyhigh level in 1995 when compared with prices in 1990 and prior years. Average prices may weaken during the last half
20
Table 6--Boysenberries: Commercial acreage, yield per acre, production, and season-average grower price, California and Oregon, 1975 to date State Value ofand Acreage Yield/ Utilized Utilization Grower price utilizedyear harvested acre production Fresh Processed Fresh Processed All production Acres Pounds ---1,000 pounds--- ---Cents/pound--- $1,000 Oregon 1975 950 3,790 3,600 160 3,440 27.3 18.0 18.4 662 1976 600 3,750 2,250 275 1,975 29.3 28.3 28.4 639 1977 700 4,500 3,150 150 3,000 65.0 65.0 65.0 2,048 1978 750 2,670 2,000 100 1,900 80.0 81.5 81.4 1,628 1979 800 2,940 2,350 100 2,250 80.0 79.7 79.7 1,873
1980 1,000 3,500 3,500 100 3,400 45.8 30.6 31.0 1,086 1981 950 3,000 2,850 100 2,750 43.4 28.4 28.9 824 1982 1,000 4,200 4,200 200 4,000 42.0 32.3 32.8 1,376 1983 950 3,740 3,550 200 3,350 45.0 34.0 34.6 1,229 1984 900 3,700 3,330 200 3,130 71.0 71.0 71.0 2,364
1985 900 4,000 3,600 100 3,500 82.0 79.0 79.1 2,847 1986 850 4,350 3,700 50 3,650 77.0 80.0 80.0 2,959 1987 1,000 5,300 5,300 50 5,250 67.0 52.0 52.2 2,764 1988 950 5,680 5,400 100 5,300 43.0 73.0 42.4 2,320 1989 900 3,440 3,100 100 3,000 51.0 72.0 50.3 1,581
1990 1,000 4,500 4,500 100 4,400 81.0 55.0 55.6 2,501 1991 900 4,670 4,200 100 4,100 97.5 99.8 99.8 4,190 1992 1,000 6,150 6,150 150 6,000 125.0 64.0 65.5 4,028 1993 1,000 4,550 4,550 150 4,400 115.0 74.0 75.4 3,429 1994 1,200 5,080 6,100 100 6,000 103.0 62.5 63.2 3,853
1995 1,200 3,980 4,780 80 4,700 134.0 77.5 78.5 3,750
California 1990 450 8,000 3,600 N.A. N.A. N.A. N.A. 88.0 3,168 1991 N.A. N.A. N.A. N.A. N.A. N.A. N.A. N.A. N.A. 1992 200 8,500 1,700 N.A. N.A. N.A. N.A. 91.1 1,548 1993 250 9,000 2,250 N.A. N.A. N.A. N.A. 88.0 1,980 1994 250 8,000 2,000 N.A. N.A. N.A. N.A. 75.5 1,510
1995 270 6,670 1,800 N.A. N.A. N.A. N.A. 95.0 1,710 N.A. = Not available.
Sources: Oregon Department of Agriculture, Oregon Agricultural Statistics Service; U.S.Department of Agriculture, National Agricultural Statistics Service.
21
Table 7--Loganberries: Commercial acreage, yield per acre, production, and season-average grower price, Oregon, 1975 to date State Value ofand Acreage Yield/ Utilized Utilization Grower price utilizedyear harvested acre production Fresh Processed Fresh Processed All production Acres Pounds ---1,000 pounds--- ---Cents/pound--- $1,000 Oregon 1975 440 6,360 2,800 50 2,750 26.6 20.0 20.1 563 1976 470 5,320 2,500 50 2,450 27.0 20.4 20.5 513 1977 500 7,200 3,600 60 3,540 45.0 41.9 42.0 1,512 1978 470 5,320 2,500 50 2,450 45.0 41.3 41.4 1,035 1979 400 2,900 1,160 30 1,130 60.0 60.9 60.9 706
1980 420 5,360 2,250 30 2,220 44.6 24.5 24.8 557 1981 450 3,420 1,540 40 1,500 23.0 18.8 18.9 291 1982 500 4,200 2,100 50 2,050 47.5 35.0 35.3 742 1983 450 5,330 2,400 80 2,220 35.0 25.7 26.0 598 1984 420 3,330 1,400 100 1,300 43.0 40.0 40.2 563
1985 330 3,790 1,250 50 1,200 51.0 49.5 49.6 620 1986 230 5,650 1,300 30 1,270 86.0 75.0 75.3 979 1987 240 5,330 1,280 30 1,250 61.0 35.0 35.6 456 1988 240 5,670 1,360 10 1,350 35.3 67.0 35.0 480 1989 200 3,250 650 25 625 45.2 64.0 44.5 294
1990 160 6,250 1,000 10 990 77.0 38.0 38.4 384 1991 100 1,800 180 10 170 105.0 80.0 81.7 147 1992 110 6,000 660 10 650 101.0 48.5 49.2 325 1993 90 5,000 450 90 360 156.0 60.0 79.1 356 1994 90 4,440 400 70 330 100.0 78.5 82.3 329
1995 80 3,880 310 70 240 142.0 68.0 84.5 262 Sources: Oregon Department of Agriculture, Oregon Agricultural Statistics Service; U.S.Department of Agriculture, National Agricultural Statistics Service.
22
Table 8--Frozen blackberries and raspberries: U.S. supply and utilization, 1992-95
Beginning Total Ending Consumption Year Pack 1/ Imports stocks supply stocks Exports Total Per capita
-------------------------Million pounds----------------------- Pounds
Raspberries
1992 32.145 4.546 29.100 65.791 35.697 -- 30.094 0.1178 1993 25.479 5.153 35.697 66.329 34.117 -- 32.212 0.1247 1994 29.900 6.131 34.117 70.148 39.866 -- 30.282 0.1162 1995 40.109 7.304 39.866 87.279 45.030 -- 42.249 0.1606
Blackberries
1992 31.498 -- 8.600 40.098 22.529 -- 17.569 0.0688 1993 23.118 -- 22.529 45.647 17.001 -- 28.646 0.1109 1994 24.226 -- 17.001 41.227 21.188 -- 20.039 0.0769 1995 26.823 -- 21.188 48.011 16.067 -- 31.944 0.1214
Other berries 2/
1992 8.551 2.814 1.827 13.192 3.427 3.899 5.866 0.0230 1993 4.526 1.015 3.427 8.968 3.673 2.695 2.600 0.0101 1994 5.164 1.095 3.673 9.932 3.046 3.470 3.416 0.0131 1995 3.459 2.989 3.046 9.494 2.120 3.670 3.704 0.0141
1/ Total United States frozen pack from the American Frozen Food Institute. 2/ Other berries pack is the sum of pack for boysenberries and loganberries. Does not include U.S. pack of loganberries for 1995.
Source: U.S. Department of Agriculture, Economic Research Service.

23
20
40
60
80
20
40
60
80
100
Mill
ion
poun
ds
Cen
ts p
er p
ound
1975 1980 1985 1990 1995
Production
Price
Figure 3. Red raspberry price and productionWashington and Oregon, 1975-95
Price is weighted average for Washington and Oregon

24
of the 1990's as production rises due to increases in plantedacreage.
Environmental Requirements and Production Practices
Climate
Climate, chiefly temperature, is the most important factor affectingthe geographic distribution of commercial raspberry and blackberryproduction. Summer and winter temperatures can be either too hot ortoo cold for successful berry production in many areas of the UnitedStates.
Raspberries and blackberries both need to have an extended periodduring the winter with temperatures below 45o F before they canresume normal growth in the spring. The length of this period isknown as the “chilling requirement,” and varies with the cultivar andspecies. The ‘Latham’ red raspberry, for example, has a longchilling requirement, at about 1,400 hours. In contrast, the newly-developed cultivar ‘Anita’ requires only 250 chilling hours. Failureto satisfy the chilling requirement results in reduced flower budgrowth in the spring and diminished yields.
However, extreme low temperatures may kill raspberry and blackberrycanes, basal buds, and even the entire plant. In general, redraspberries are more hardy (tolerant of low winter temperatures) thanare the black and purple cultivars. Erect blackberries are morehardy than the trailing types, and thorny cultivars are more hardythan the thornless types. Practical low temperature limits for redraspberries are about -20o F; for purple raspberries, -10o F; forblack raspberries, -5o F; and for blackberries, 0o F. Injury mayoccur at higher temperatures if the canes are exposed to desiccatingwinds or if the plants have been weakened by disease or other causes.
Another type of cold damage occurs due to freezing temperatures atblossom time. Temperatures that are a few degrees below freezing ator near the time of full bloom damage the blossoms and prevent fruitset. This type of injury is common in some areas among raspberriesand early-flowering blackberries.
Excessively warm summer temperatures also limit production. Redraspberries are especially susceptible to losses due to hot, drysummers. A combination of heat, bright sun, and low humidity canreduce fruit size and cause sunburn damage on exposed fruit. Blackberries are better adapted to extreme heat than raspberries,although they are not completely immune to injury.

25
Soil
Brambles produce the highest yields on fertile, deep, well-drainedsandy loam or loam soils. They can also be produced satisfactorilyon sandy soils, but require frequent irrigation and special effortsto build up and maintain organic matter. Poor bramble sites includethose having heavy, poorly-drained clay soils, those located overhigh water tables, or those that are subject to flooding. Raspberryroots, in particular, lose their ability to resist the invasion ofroot rot diseases in saturated soils and may suffocate from the lackof oxygen during prolonged submersion. Blackberries are moretolerant of poor soil aeration than are raspberries, but they, too,produce the highest yields on well-drained soils.
Raspberries and blackberries should not be planted in fields thathave been used for strawberries, peppers, tomatoes, potatoes, oreggplant during the past four or five years, as these plants may hostVerticillium wilt and the soil may still harbor the disease. Raspberries, in particular, are very susceptible to Verticilliumwilt. Soils with a history of Phytophthora root rot or crown gallalso should be avoided as planting sites.
Sites on rolling or flat land are better for bramble production thanvalley bottoms. Cold air, being heavier than warm air, settles tolow areas where localized low spring temperatures are likely to killthe blossoms. Southern slopes may make poor bramble sites becausethey warm up first in the spring, which promotes early fruit buddevelopment. Developed buds and blossoms are more vulnerable tofrost damage than those that are less developed.
Irrigation and Water Supplies
Although summer rainfalls frequently provide adequate moisture forgood growth and high yields in temperate regions, occasional extendeddry spells can reduce yields substantially. Raspberries andblackberries obtain nearly all of their moisture from the top twofeet of the soil profile because this is the region of greatest rootdevelopment. A moisture deficiency in this root zone from earlyspring until harvest retards lateral root development and diminishesfruit size.
Primocanes also develop most rapidly between early spring andharvest, and moisture deficiency over this period limits the numberof new canes that develop. Primocanes that develop under droughtstress have smaller diameters and are less productive than those thatdevelop when moisture is adequate.
Irrigation enables growers to supplement rainfall as needed andreduces the chances of yield loss due to drought. Approximately two-thirds of the U.S. raspberry acreage and three-quarters of theblackberry acreage were irrigated in 1992 (Appendix tables 1 and 2).
The bulk of the irrigated bramble acreage is equipped with overheadsprinklers (Crandall). In addition to providing supplemental water
26
during dry spells, overhead sprinklers can be used to keep blossomswet and stave off freeze damage at low temperatures. Wetting theblossoms keeps the temperature above the critical 29o F to 30o Frange where freeze damage is likely to occur.
Planting
Brambles may be planted either in the early spring or late fall. Spring planting (in March or April) is recommended in colder climatesto avoid winterkill among the young plants. A light mulch in therows of fall-planted brambles will reduce plant losses due toheaving, which is caused by the freezing and thawing of the soil overthe winter. In milder climates, brambles can be successfully plantedin late October or early November, when the plants have entereddormancy but before the soil freezes.
Because the principal control for bramble diseases and viruses is toavoid introducing infected plants into new plantings, new plantsshould be certified disease-free. Most major nurseries reportedlyfollow propagation methods that insure producers receive disease- andvirus-free plants (Crandall).
Row Spacing
Rows are typically spaced 6-12 feet apart, depending on the size ofthe equipment used by the grower. Typically, rows are 2-3 feet widerthan the outside width of the widest machinery. Blackberries areusually spaced wider than raspberries because they tend to be morevigorous and require more space.
A north-to-south row direction helps prevent sunburned fruit on thesouth sides of rows during hot summer days and promotes uniform fruitproduction on both sides of the rows. As a practical matter,however, rows are usually laid out to accommodate field shape.
Training and Pruning Systems
The canes of vigorous brambles grow too long to stand upright withoutsupport. The growth of black and purple raspberries and erectblackberries is controlled by “tip pruning” (cutting the tops back)during the summer. Tip pruning the canes to 20-24 inches promotesthe development of strong, productive lateral branches and avoids theneed for supplemental support to keep the canes from falling to theground.
Red raspberries and semi-erect and trailing blackberries, however,require some type of trellis to support their canes and fruit. Twobasic types are in common use: the narrow, upright I-trellis and thewider, cross arm or T-trellis.
Upright trellises consist of 1 or 2 wires strung on posts spaced downthe row. Floricanes are tied to the wires, either individually or inbunches. Temporary training wires may be used to pull primocanesinto the row during the growing season to protect them from
27
mechanical damage. Present-day machine harvesters require that canesbe supported by an upright trellis system for mechanical harvesting. Upright trellises also can be used to support trailing and semi-erectblackberries as well as red raspberries that are to be hand picked.
With the T-trellis, wires are strung along the ends of the crossarms, forming a corral around the canes. The canes can be tied tothe wires or held up by “weaving” the canes on the wires. The T-trellis accommodates a larger number of canes in the row than theupright trellis and avoids the need to tie up the primocanes. Fertilization
Nitrogen is the major fertilizer requirement of brambles. Forcommercial plantings of red raspberries and blackberries, rates ofapplication range from 30 to 100 pounds of nitrogen per acre. Blackand purple raspberries require lesser amounts. Commercial growerstypically use trained observation, combined with soil and foliartesting, to determine fertilizer needs.
Deficiencies of boron, iron, magnesium, manganese, and zinc mayreduce plant vigor and yields. Such deficiencies can often bediagnosed by leaf symptoms and confirmed by foliar analysis. Foliarsprays can be used to quickly correct such deficiencies and preventfurther symptoms on new growth.
Fall cover crops, such as oats, barley, winter rye, and annualryegrass, may be planted to use up excess nitrogen and soil moisturein the fall. This slows cane growth and promotes early maturation. Mature canes are more winter hardy than growing canes and, therefore,less likely to suffer winter injury.

28
Weed Control
Weeds are controlled in bramble plantings with the use of soilcultivation, chemical pesticides, and maintenance of a permanentcover crop. The most typical approach consists of using eithermechanical cultivation or a permanent sod cover between the rows andchemical herbicides within the rows.
Harvesting
All berries destined for the fresh market are hand picked. Theberries are picked directly into retail-size containers (pint orhalf-pint boxes) in which they are to be marketed. Pickers needcareful training and supervision to assure high-quality berries. Since the berries are picked directly into the retail containers, thepicker not only harvests the berries, but also grades them.
Berries for the processing market may be either hand picked ormechanically harvested. With mechanical harvesting, harvesters movethrough the field astraddle the rows, and rotary shakers knock theberries from the canes onto conveyor belts. The belts carry thefruit past workers who sort out trash (leaves and stems) and cullunwanted fruit.
Mechanical harvesting costs less than hand picking, but results inhigher field losses. Machine harvesting reportedly results in yieldsthat are 15-20 percent below those associated with hand picking. Inaddition, there is more physical damage to the fruit and greateropportunity for contamination by rot organisms when machineharvesting is used.
Handling
Harvested bramble fruit are very fragile and require careful andprompt handling. Flats containing the retail containers are palletedin the field to speed up the process and reduce the amount ofhandling. The flats are cooled promptly and kept cool until theyreach market in order to preserve quality.
Berries for processing may be handled in flats or in poly-lined 55-gallon drums. The care with which fruit for processing is handleddepends somewhat on its intended use. Berries to be used for juicemay be handled in 55-gallon drums. Those intended for IQF(individually quick frozen) use or for freezing into block packagesare handled in 7-10 pound plastic flats. As with fresh-marketberries, berries for processing are refrigerated as soon as possibleto prevent fruit rot and to maintain the fruit until processing.
Processing
29
Much of the fruit for the processing market is frozen in bulkcontainers for institutional use or is reprocessed into jams,jellies, preserves, pie filling, and yogurt. Some fruit is combinedwith sugar and used to fill retail packages. The best quality, wholefruit is preferred for IQF processing. Over-ripe and lower-qualityfruit is usually destined for juice or wine. A small quantity ofblackberries is canned for the retail market.
Marketing
More than 95 percent of the bramble fruit grown in Washington andOregon is sold for processing. Although the usage breakdown betweenfresh market and processing is not reported, California brambles aregrown mainly for the fresh market (Bettiga). Berries may be divertedto processing when fresh-market prices are low or if the berries areof low quality. Central California is an important fresh-marketstrawberry area and shippers use the fresh-market infrastructuredeveloped for strawberries to handle and sell raspberries. Althoughstatistics are not available for other states, the fresh market,especially direct-to-consumer sales, reportedly accounts for the bulkof marketings (Baker; Shane; Pritts).
Handling bramble fruit for the fresh market is a very specializedbusiness requiring careful attention to all aspects of harvesting,handling, packaging, and shipping. The shelf life of bramble berries(the length of time the fruit remains in marketable condition afterharvest) is shorter than for most fresh fruits and vegetables. Evenwith the least perishable berries, the length of time from harvest tomarket ranges from only a few days to a week or ten days at maximum,depending on how carefully they are harvested and handled.
Because blackberries and raspberries are so perishable, direct marketoutlets likely account for a larger share of fresh-market sales thanfor most fruits and vegetables. Pick-your-own operations, roadsidestands, and farmers' markets all move berries from producer toconsumer in a timely manner and with a minimum of handling.
Costs of Production
Cost of production budgets were located for raspberries inCalifornia, Oregon, and Michigan and for blackberries in Oregon(Table 9). Detailed budgets are contained in Appendix B.

30
Table 9--Bramble fruits: Costs of production
Raspberries Blackberries Santa Cruz County, CA Oregon/Washington Michigan Oregon (1988) Item (1987 fresh market) (processing) (pick-your-own) Every-year Alternate-year Willamette1: Heritage2 1993 1988 production production3
------------------------------------------Pounds-----------------------------------------
Yield (pounds) 6,000 6,000 6,000 4,200 7,000 12,000
-------------------------------------Dollars per acre------------------------------------
Cash expenses: Cultural 2,256 2,323 1,456 676 1,087 1,231 Harvest 7,023 7,023 576 447 980 1,680 Total 9,279 9,346 2,032 1,123 2,067 2,911
Ownership and overhead costs 2,481 616 1,785 228 607 1,147
Total costs 11,760 9,962 3,817 1,351 2,674 4,058
1 Summer bearing variety. 2 Primocane bearing variety. 3 Expenses are the total for the two-year production cycle.
Sources: Elkins and Tyler; Turner and others; Burt and others; Kelsey and others.
31
The raspberry budgets for Santa Cruz County represent costs forcommercial fresh-market production. Harvest expenses are relativelyhigh because costs include hand picking and the cost for containersand flats. The notable difference in ownership and overhead for the‘Willamette’ and the ‘Heritage’ varieties is due to a lower netestablishment cost for ‘Heritage.’ Since ‘Heritage’ is a primocanebearing variety, it produces a crop during its establishment year,offsetting a portion of the establishment costs.
The Oregon budget, which also is representative for Washington,depicts costs for a commercial operation with at least 20 acres ofberries intended for processing. Harvesting costs are considerablylower than in California because of the lower expenses associatedwith machine harvesting (including lower labor and packing materialcosts).
The Michigan raspberry budget represents expenses for a 10-acreplanting. The berries are intended for a pick-your-own market and,therefore, the labor expense for harvesting is relatively small.
Two production systems are used for blackberries in Oregon: 1) every-year production and 2) alternate-year production. With every-yearproduction, berries are harvested annually. With the alternate-yearsystem, berries are harvested every second year. With this system,all the canes (floricanes and primocanes) are removed at the end ofthe harvest year and only primocanes grow during the following year. The every-year system produces more total production over a two-yearperiod. However, the cost per pound of berries is lower with thealternate-year system because yields are higher in the bearing yearand production costs average lower.
Producer Organizations
The Oregon Raspberry and Blackberry Commission
The Oregon Raspberry and Blackberry Commission is a state marketingorder that supports research, promotion, and education for the Oregonbramble industry. Commission activities are supported through growerassessments of 1 percent of the value of all bramble berries sold offthe farm. Since the Commission assesses growers on the basis ofsales rather than the quantity of berries sold, it does not collectproduction data for individual farmers (Schroder).
32
The Washington Red Raspberry Commission
The Washington Red Raspberry Commission is a quasi-state governmentorganization of commercial producers whose purpose is to supportresearch and promotion for the raspberry industry. All Washingtongrowers selling over 6,000 pound of raspberries annually are assessed½ cent a pound on all berries sold. These assessments are used tosupport the Commission’s activities (Seeger).
Processors report each producer’s deliveries of berries to theCommission. These data could provide production histories forgrowers of processed berries. About half of the growers also submitproduction reports to the Commission, which include information onacreage harvested. The processor-reported production statistics, incombination with the grower-reported harvested acreage data, couldprovide a basis for estimating actual production histories forindividual growers.
Production Perils
Winter injury reportedly is the most serious production peril forboth raspberries and blackberries. An additional, frequently-citedcause of yield loss among raspberries is root rot, which occurs whenthe soil is excessively wet. Excessive rains and excessive heat incombination at harvest-time were cited as conditions that contributeto diseases and quality degradation, especially among raspberries. Brambles are also subject to a number of other perils, such as hail,wind, and various insect and disease pests.
Winter Injury
Plants are said to suffer winter injury when low temperatures killfruit buds and damage or kill the canes and roots. The severity ofdamage depends on a number of factors, including the cultivar, thecondition of the plant when the low temperatures occur, and theaccompanying weather conditions. Canes are most hardy and canwithstand cold temperatures most readily when they are fully dormant. They tend to be most vulnerable to winter damage when they areactively growing, such as after breaking dormancy in the earlyspring.
Although raspberries are more tolerant of severe winter weather thanare blackberries, both species can incur winter injury due to extremecold. In general, blackberries tend to be grown in areas with milderwinter temperatures.
Raspberries and blackberries in the Pacific Northwest sufferedconsiderable winter damage to the 1996 crop because of lowtemperatures during January and March. The region had periods ofunseasonably warm temperatures that caused the canes to breakdormancy early. These warm temperatures were followed by hardfreezes and accompanying winds (an “arctic express”) that killed alarge number of fruit buds and retarded growth of lateral shoots.
33
Some raspberry fields in Whatcom County, Washington, reportedly hadyield losses of 50 percent or more due to winter injury in that year(McConnell).
Excessive Rain
Excessive rain causes yield losses in several different ways. Fruitrot is the most common problem associated with wet, rainy weather atharvest-time (see the discussion of gray mold fruit rot in the"diseases" section). Root rot and plant drowning due to extendedflooding also can cause yield losses. Consequently, growers maydiscard all of the fruit ripening during extended rainy periods.
Because of the highly contagious nature of gray mold rot, even fruitthat appears healthy may harbor the gray mold spores and is likely todevelop the disease after being harvested. In some cases, growerscontinue to harvest during wet weather, but drop the fruit to theground rather than collect it. Then, after the weather clears, andthe conditions for gray mold no longer exist, growers again collectthe fruit. One contact estimated that untimely rainy periods atharvest can reduce yields by as much as 50 percent (McConnell).
Root rot (see the discussion of Phytophthora root rot in the"diseases" section) associated with wet soils is particularly seriousamong raspberries. Root rot was reported as a source of reducedyields in the Pacific Northwest during the 1996 season (McConnell;Brun; Strik).
Brambles may be killed by extended flooding, which essentially killsthe plants' roots due to a lack of oxygen. Raspberries are lesstolerant of flooding than blackberries.
Excessive Heat
Raspberries do not thrive under hot, dry conditions. The combinationof heat, bright sun, and low humidity reduces fruit size andproduction and causes sunburn damage on exposed fruit. Hightemperatures cause the berries to dehydrate on the canes as theyripen. This situation reduces both the quality and the quantity ofberries harvested. In addition, excessive heat at, or near, harvest-time speeds up theripening process, reducing the length of the harvest period. Duringsuch times, growers may not be able to harvest the berries as fast asthey ripen, causing the fruit to become over-ripe and soft. Excessive heat at harvest-time is less of a problem with fall-bearingraspberries than with summer-bearing types. Fall-bearing raspberriesmature over a longer time period, and temperature extremes usuallyoccur prior to the harvest period.
Hail
Hail is not considered a serious production peril in the PacificCoast states. Hail occurs less frequently on the West Coast than in
34
the central and eastern United States. In Texas, however, hailstorms occur frequently, and at times cause serious damage tobrambles (Baker).
Wind
Cold, dry winter winds desiccate bramble canes and exacerbate damagecaused by extremely low temperatures. Cold, windy weather was citedas a cause of winter injury in the Pacific Northwest in 1996.
Strong winds during the fall and winter can also cause cane breakagein exposed fields, reducing the yield potential of the plants in thefollowing year. Yield losses from cane breakage are, however, likelyto be relatively small.
Sunburn
Hot, dry sunny conditions when the fruit is ripening can sunburnberries exposed to the direct sun. The individual drupelets onsunburned berries shrivel and dry up, making the berry unsuitable forcommercial use. Blackberries can withstand summer heat better thanraspberries, but they, too, can suffer yield and quality losses.
Insects
Insect populations tend to increase in bramble plantings over time,and are controlled with pesticide spray applications when they reachan economic-threshold level. The economic-threshold is the point atwhich the value of yield losses exceeds the cost of control. Themajor insect pests in bramble production are the raspberry crownborer, raspberry fruit worms, sap beetles, and Japanese beetles.
Raspberry Crown Borers--These insects attack all members of the Rubisfamily. The adult is a clear-winged, black and yellow moth whichlays its eggs on the lower leaves of the bramble plant in latesummer. When the larvae hatch, they fall to the ground, where theyfeed on the bark of the canes and eventually tunnel into the plant. Once in the crown and canes, they continue to feed for up to twoyears before they pupate and become adults.
The crown borer causes infected primocanes to wilt and die duringmidsummer. Because the insects infect individual canes, damagedevelops gradually over time. Further, because the borer feedsinside the crown and canes, its damage is easy to overlook, or thedamage may be mistaken for a disease infection. Control consists ofapplying an insecticidal drench to the base of the plant afterharvest or in the spring, killing young larvae as they feed prior totunneling into the crown.
Raspberry Fruit Worms--Raspberry fruit worms are most often found onraspberries, although they sometimes also attack blackberries. Thelarvae tunnel into the receptacle of the fruit, causing the berriesto drop from the plant. Alternatively, the larvae may remain in oron the fruit at harvest-time. In some plantings, more than half of
35
the berries may be infested with larvae. Berries arriving at thefresh market or processing plant with a noticeable presence of wormsare likely to be rejected. Raspberry fruit worms are controlled byapplying insecticidal sprays during the pre-bloom period or at thegreen fruit stage. Sap Beetles--Sap beetles, also known as picnic beetles, bore intoraspberries at picking time, eating portions of the fruit and layingeggs. Such damage leaves the fruit undesirable for humanconsumption. Sap beetle damage can be so extensive in some plantingsthat the fruit is unmarketable. Sap beetles generally can becontrolled by removing damaged and discarded fruit from the field,since these are the attractants which cause a build-up in beetlepopulations.
Japanese Beetles--Adult Japanese beetles feed on the foliage,blossoms, and ripe fruit of both raspberries and blackberries. Theyespecially like ripe berries which are exposed to sunlight. Infestation can be so serious that the fruit is unmarketable. Thefeeding of Japanese beetles can be controlled with insecticideapplications.
Weekly inspections of the berries are needed from the beginning ofharvest onward to monitor the potential for damage. This is becausebeetles can fly substantial distances from over-wintering sites (suchas pastures) to re-infest a planting.

36
Diseases
Diseases generally cause more serious damage to bramble plants thando insects, and are also more difficult to control. While insectpopulations may be allowed to reach economically important levelsbefore they are controlled, successful disease control depends onprevention. The most damaging bramble diseases are root rot, crownand root gall, Verticillium wilt, anthracnose, orange rust, gray moldfruit rot, rosette, and numerous viral diseases.
Phytophthora Root Rot--This root rot is a soil-borne fungal diseasethat attacks most red and purple raspberries cultivars, some blackraspberry cultivars, and blackberries. It is most commonlyassociated with heavy, wet soils, but is not limited to theseconditions. Infections spread from infected plants to adjacentplants and can kill entire sections of a planting.
The initial symptoms are wilting and die-back of the terminalportions of new primocanes during the early summer. Infectedfruiting canes are frequently stunted, producing weak lateral shootswith leaves that yellow prematurely or scorch along the margins andbetween the veins. The symptoms increase in severity over one or twoseasons and eventually the plant dies.
The keys to control are planting on sites with good soil drainage andavoiding soil contamination. The fungi are often introduced by themovement of contaminated soil from runoff water, farm equipment, orsymptomless nursery stock. Since the fungus can be carried on eitherthe soil or on the plants, growers should plant only certified stockfrom reliable nurseries which have no history of root rot. Carefulmachinery sanitation can also help prevent the introduction ofinfected soil into a field. New bramble plantings should be made onsites where brambles have not been previously grown in order tominimize the risk of infecting new plants.
Crown and Root Gall--Crown and root gall is a soil-borne bacterialdisease that infects bramble plants, causing tumor-like masses on theroots, crowns, and canes. Galls are most often found on the rootsand crowns of raspberries and on the canes of blackberries. Infections result in poor stands, weak growth, and lowered yields.
The best control is to prevent the introduction of infections intothe field by planting gall-free stock. No effective methods existfor eradication once the plants and soil become infected. Verticillium Wilt--Verticillium wilt is a fungal disease thatseverely damages black raspberries and, to a lesser extent, purpleand red raspberries. Blackberries are also susceptible to thedisease, but seldom suffer severe losses. Infected primocanes turnpale green or yellow during the summer and then appear to recover inthe fall. The following spring, however, infected canes turn yellow,wilt, and die. After two or three seasons, the entire plant dies.
37
There is no cure for Verticillium wilt once infection occurs. Disease-free plants should be selected from a reliable nursery andplanted in disease-free soil. Raspberries should not be planted insoils that have grown Verticillium-susceptible crops in the previousfour to five years, including tomatoes, potatoes, peppers, andeggplants.
Anthracnose--Anthracnose is one of the most widespread fungaldiseases affecting brambles in the United States. It is mostdestructive on black and purple raspberries, but also infects redraspberries and blackberries. Losses occur from defoliation, generalstunting and decline in cane vigor, reductions in fruit yield andquality, and death of the canes. Infections are spread from oldcanes to new canes by spores carried by insects, splashing rainwater, or wind.
Anthracnose thrives under cool, moist conditions and is difficult tocontrol. Control begins with the planting of disease-free stock. Growers should follow strict sanitation practices to remove sourcesof the inoculum. In addition, production practices that promote goodair movement within the planting can help prevent infections.
Orange Rust--Orange rust is a fungal disease that attacks mostblackberries and both black and purple raspberries. Most redraspberries are resistant to the disease. The undersides of infectedleaves develop blister-like pustules which turn powdery and brightorange. This bright orange, rusty appearance is what gives thedisease its name. Infected plants normally do not die from thedisease, but are weakened and produce little or no fruit.
The main control is to use resistant varieties. Destroying infectedplants as soon as they show symptoms of infection in the spring helpsreduce the spread of the disease to healthy plants.
Gray Mold Fruit Rot--This fruit rot is caused by the fungus Botrytiscinerea, and is the most widespread, costly disease that attacksbrambles. Red raspberries are more susceptible than blackraspberries and blackberries, but gray mold can reduce the shelf lifeof all bramble fruit. Infected fruit deteriorates rapidly, becomingwatery and soft.
Prolonged rainy periods just prior to or during harvest can bepotentially disastrous, creating ideal conditions for gray moldinfections to develop. The spores that cause infection are nearlyalways present and infect ripe fruit and blossoms when moisture andtemperature conditions are right.
Infected fruit is not suitable for shipment to fresh-marketdestinations as its shelf life is very limited. A good fungicidalspray program can help in controlling gray mold and other fruit rotdiseases.
Rosette--Rosette, or double blossom, is a fungal disease ofblackberries in the central and southern parts of the United States.

38
It is commonly found on erect blackberries and causes reduced yields,poor fruit quality, and death of the canes. The bloom is delayed ininfected plants and the flowers are wrinkled, twisted, pinkish, andresemble double blossoms. Infected flowers either fail to set fruitor produce small, abnormal fruit.
Planting resistant cultivars helps control rosette in regions whereit is a problem. Removing infected canes and applying fungicides atweekly intervals during blossoming also provides a measure ofcontrol.
Viral Diseases--Numerous viral diseases infect brambles. Black andpurple raspberries are more seriously damaged than are either redraspberries or blackberries. Viral infections in raspberriesreportedly can reduce fruit yields by 70 percent or more (Funt andothers). Individual cultivars vary widely in susceptibility. Once established, it is impossible to eliminate most viruses frominfected plants. The only control methods involve isolating healthyplants from sources of infection or eliminating the vector thattransmits the virus from one plant to another. As a result, it isvery important to use virus-free planting stock when establishing anew field.
Since black raspberries are very susceptible to damage, while manyred raspberry cultivars can thrive with few or no symptoms, it isrecommended that new black raspberry plantings be separated from redraspberries by at least 600 feet. This distance reduces the chancesof insects, especially aphids, transmitting an infection from virus-tolerant red raspberries to virus-susceptible black raspberries.
Birds and Mammal Rodents
Fruit losses due to the feeding of birds and mammals on bramble fruitgenerally represents a minor nuisance. Some birds eat ripe berries,but the amount of fruit lost usually represents only a minusculepercentage of the total yield.
Deer were reported as a bramble pest in east Texas, where they forageon blackberry canes. Some growers in Texas build deer-proof fencesaround their plantings to protect blackberry plants (Baker).
State Analyses
California
The Census of Agriculture reported 266 California farms with 1,428harvested acres of raspberries in 1992. In addition, 134 farmsreported 410 harvested acres of blackberries and 116 farms reported269 harvested acres of boysenberries. The farm value of brambleproduction in California was about $25 million in 1995 (USDA, NASS).
The bulk of California’s raspberries and blackberries are located incoastal valleys, where the ocean climate moderates summer
39
temperatures (Appendix table 9). The largest acreage is in SantaCruz County. Commercial brambles are also produced in San LuisObispo, Santa Clara, and Monterey counties. Summer temperatures inthe interior valleys are too hot for raspberries.
In addition to commercial production, a number of farms locatedthroughout the state have small bramble plantings. The output fromthese plantings is intended for local direct market outlets, such asfarmers’ markets and roadside stands. Some brambles are also grownon U-pick operations. California’s boysenberry production is locatedin the San Joaquin Valley, notably in Fresno, Merced, San Joaquin,and Stanislaus counties.
California’s commercial raspberry and blackberry production isdestined for the fresh market. Virtually all commercial output islocated in areas that also produce fresh-market strawberries, withshippers using their strawberry facilities for handling and sellingbramble berries. A number of California’s raspberry growers alsoproduce strawberries.
Although California’s bramble fruits are grown for the fresh market,at times net returns from the fresh market fall below those forprocessing. At such times, producers may sell their bramble fruitsfor processing (Bettiga).
The expected life of bramble plantings in California is 4 to 6 years,somewhat less that the 15 years reported in Washington and Oregon. This short life span is because fungal diseases and viruses reduceplant vigor sooner in California than in Oregon and Washington. Somegrowers in California are experimenting with an 18-month plantingcycle, in which the plants are harvested for only one season and thenreplaced (Bettiga).
The most serious production peril for California producers isexcessive rain during the winter and spring, which causes plantlosses from root rot (Bettiga). Currently, growers are keenly awareof the potential for losses from excessive rain because of extensiveflooding in the central coast area of California during the spring of1995. Some growers lost up to 75 percent of their plants in thefirst year following this flooding. These losses were caused byplant drownings and root rot infections. Root rot infections tend tobe more serious among raspberries than among blackberries.
Gray mold, the most serious raspberry disease in the U.S., is usuallynot a problem in California because the climate tends to berelatively dry during harvest-time. Most of the rain occurs duringlate fall, winter, and early spring, when raspberries are in theirdormant phase.
Sunburn is a second source of yield loss among bramble fruits inCalifornia. In extreme cases, losses can be as high as 50-70 percentof the normal raspberry yield (Bettiga).
40
In contrast, hail is a minimal peril. California has few hail stormsand yield losses due to hail are judged to be relatively light(Bettiga).
There is likely to be some interest in bramble insurance amongCalifornia growers, especially following their experience with lossesdue to flooding in 1995. The University of California farm advisorfor bramble fruits in Monterey County indicated that several growershad expressed frustration in not having crop insurance during the1995 floods (Bettiga).
However, there appears to be limited potential for a crop insurancepolicy in California because of the relatively small value of thecrop--$25 million in 1995. In fact, the insurable value is likely tobe substantially less than this amount. The reason is that most ofCalifornia’s bramble fruits are sold for the fresh market, and thereported value of fresh-market berries embodies the costs associatedwith hand harvesting and with marketing, including the costs of boxesand cartons. Harvesting and marketing expenses accounted for 60 to70 percent of the total cost of producing raspberries in Californiain 1987 (Table 9).
41
Oregon
Oregon is the number-one producing state for both blackberries andblack raspberries. It ranks number two in red raspberry production,behind Washington. Oregon’s bramble production is concentrated infive or six counties in the northern Willamette Valley (Appendixtables 10-15).
The Census of Agriculture reported 492 farms with 5,353 acres ofraspberries (all types) in Oregon in 1992. Oregon produced 18.5million pounds of red raspberries in 1995 and 2.6 million pounds ofblack raspberries. In addition, Oregon produced 37.5 million poundsof blackberries, 4.8 million pounds of boysenberries, and 0.3 millionpounds of loganberries. The farm value of production for these fivecrops totaled $40.6 million in 1995.
Growers typically produce both raspberries and blackberries, and attimes, other crops such as strawberries, vegetables, wheat, and grassseed (Strik; Brewster). Smaller producers tend to specialize inbrambles, while farms with larger bramble acreages tend to be morediversified. Commercial plantings usually range from 5 to 150 acresin size, although 20-25 acres is typical.
A number of smaller bramble producers (those with 5-10 acres) arepart-time farmers, having income from off-farm employment in additionto the sale of berries (Brewster). These small growers commonly runlow-cash-outlay operations, relying on family labor for cultivationand harvesting. Small operations may hire a custom harvester for themain pickings and hand pick the later- maturing berries using familylabor.
The most serious production perils among raspberries in Oregon areroot rot and winter injury (Strik). Root rot tends to affectraspberries, and is usually not a problem with blackberries. Incontrast, winter injury is more damaging among blackberries thanamong raspberries.
The Willamette Valley occasionally has an unusually wet spring whichkeeps the soils saturated for long periods. During such periods,root rot may develop in raspberry plantings, diminishing vigor andreducing yields. Some growers apply fungicides to the soil in anattempt to control root rot, reportedly with varying degrees ofsuccess.
Blackberries are grown under two different production systems inOregon: 1) bearing every year, and 2) bearing in alternate years. Under the alternate-year system, the plants yield more berries percrop, but produce only one crop every two years. Consequently, thealternate-year system results in only about 85 percent as manyberries over a two-year period as the every-year method. Total costsunder the alternate-year system, however, are only about 75 percentas much as with the every-year system.

42
The alternate-year system provides growers with a measure offlexibility in dealing with winter damage. If their blackberriessuffer severe injury, growers can remove the floricanes in the springand skip that year’s harvest. New primocanes grow during the summerand the producer harvests a larger crop the following season. As aresult, an insurance policy would need to acknowledge that yieldprospects for the season following winter damage are enhanced ifgrowers skip a year’s harvest.
As in California, Oregon bramble producers will likely have moderateinterest in purchasing insurance. The most significant productionperils are root rot among raspberries and winter damage amongblackberries. With raspberries, however, yield losses usuallyrepresent a small portion of the potential yield and, in most cases,would not likely reach the 25-percent loss threshold required totrigger payments. With blackberries, growers can switch to analternate-year harvesting system when their plants are damaged bycold temperatures and recoup part of their losses by harvesting alarger yield the following season.
The small amount of disaster assistance paid to Oregon brambleproducers relative to their acreage suggests that growers incurrelatively minor yield losses. Disaster payments for Oregonraspberries accounted for about 6.5 percent of the U.S. total overthe 1988-94 period ($318,000), while the state had 34 percent of U.S.harvested acreage. For blackberries, disaster payments totaled$401,000 over the six-year period, nearly 17 percent of the U.S.total, while Oregon accounted for 65 percent of U.S. harvestedblackberry acreage.
Even so, the potential for bramble insurance exists in Oregon. Forsome of the larger, commercial-size operations, a severe yield lossrepresents a substantial financial setback to the farming operation. Crop insurance could serve as an important risk management techniqueon such farms.
Texas
Blackberries are the major bramble crop in Texas. The 1992 Censusreported that 350 Texas farms harvested 478,000 pounds ofblackberries from 320 acres. The extension horticulturist inOverton, Texas, estimates that blackberry acreage was much higherthan this in 1996, with perhaps as many as 800 acres in 20 easternTexas counties and another 200-300 acres in central Texas (Baker). The blackberry acreage in east Texas has risen sharply in recentyears as several new, disease-resistant varieties have becomeavailable.
The farm value of Texas blackberries is estimated at about $1-2million annually. This estimate is based on the assumptions of 1,000acres of berries yielding 1,500 pounds an acre, and selling for anaverage of $1.00 a pound.
43
The Census also reports 26 Texas farms harvesting 17 acres ofraspberries in 1992. Texas Extension Service personnel indicate thatacreage has increased somewhat in recent years with the introductionof a new, heat-tolerant variety named ‘Dorman Red.’
About one-half of the east Texas blackberry acreage is irrigated. Irrigation provides protection against drought, but little or noprotection against freeze damage. Plants are not protected fromfreeze damage because growers use a drip emitter system that does notwet the plants.
Blackberries in Texas are grown almost exclusively for the freshmarket, and a high proportion of the crop is sold through directmarketing outlets. East Texas is near several major populationcenters (including Dallas-Fort Worth, Austin, Houston, and SanAntonio) that serve as a source of demand for roadside stands,farmers’ markets, and U-pick operations. A small percentage of Texasblackberries are also sold for processing into specialty jellies andjams.
Blackberries are commonly retailed in covered ½ pint containers. Prices range from $14-$22 per flat, containing 12 half-pints. U-pickoperations typically charge $4-$6 per gallon, or about 70 cents apint.
Most blackberry plantings in Texas cover 1 to 5 acres. With theadoption of the newer disease-resistant varieties, however, a fewlarger plantings (30-50 acres) have been established (Baker). Typically, farms with blackberries also grow other horticulturalcrops, including peaches, blueberries, raspberries, and a number ofvegetables. This diversification allows growers to offer a mix ofproduce to their direct-market customers. Diversification alsoprovides a measure of risk protection against crop failure.
The most serious perils in Texas include freezing temperatures duringthe spring bloom period, hail damage, and drought (Baker). Usually,winter temperatures in east Texas do not fall low enough to damagethe blackberry canes. However, late spring freezes frequently occurwhile blackberries are in bloom, killing the blossom buds.
Hail frequently occurs in Texas and can cause varying degrees ofdamage. Severe hail shreds the blackberry leaves, bruises theimmature berries, and can destroy the mature fruit.
Drought damage can also affect yields. Extreme dryness during thespring and early summer reduces the size of the berries, loweringcurrent-year yields. In addition, dry conditions during the summerand fall can diminish the subsequent season’s yield potential byreducing the number and vigor of the primocanes (the new canes)produced by the plants.
Some of the larger bramble growers in Texas would likely purchasebramble insurance beyond the catastrophic (CAT) level, as yieldlosses can cause substantial financial setbacks. Nevertheless, there
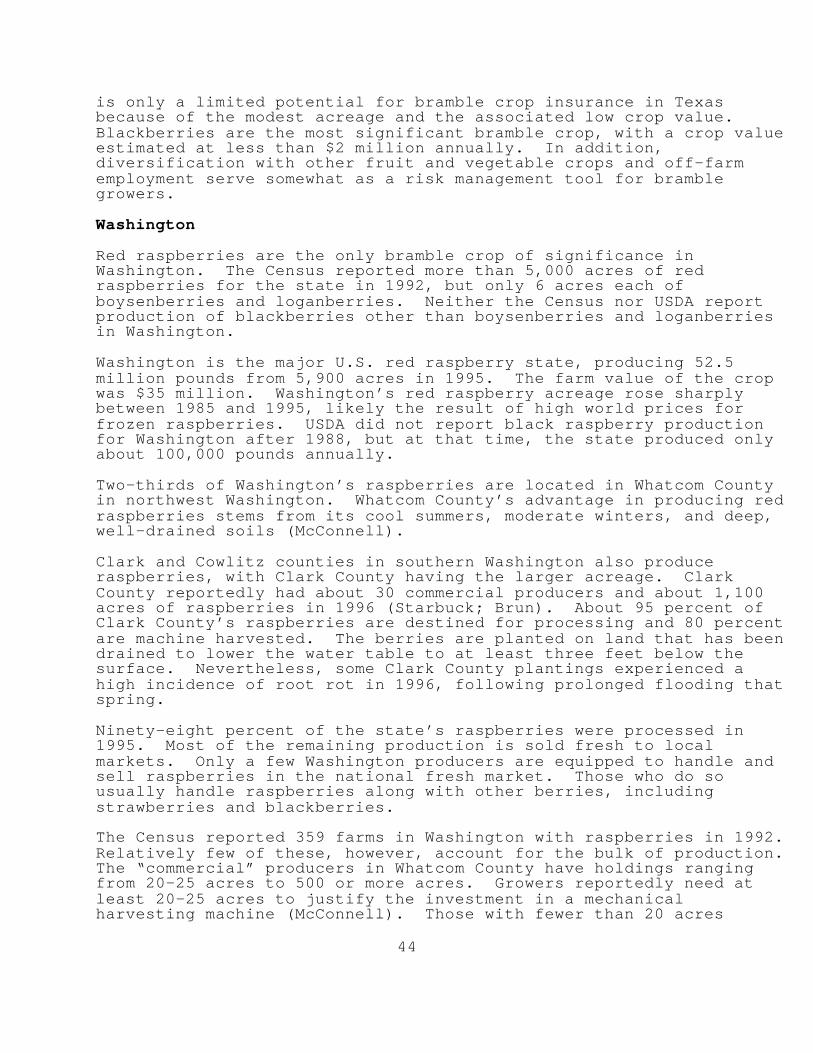
44
is only a limited potential for bramble crop insurance in Texasbecause of the modest acreage and the associated low crop value. Blackberries are the most significant bramble crop, with a crop valueestimated at less than $2 million annually. In addition,diversification with other fruit and vegetable crops and off-farmemployment serve somewhat as a risk management tool for bramblegrowers.
Washington
Red raspberries are the only bramble crop of significance inWashington. The Census reported more than 5,000 acres of redraspberries for the state in 1992, but only 6 acres each ofboysenberries and loganberries. Neither the Census nor USDA reportproduction of blackberries other than boysenberries and loganberriesin Washington.
Washington is the major U.S. red raspberry state, producing 52.5million pounds from 5,900 acres in 1995. The farm value of the cropwas $35 million. Washington’s red raspberry acreage rose sharplybetween 1985 and 1995, likely the result of high world prices forfrozen raspberries. USDA did not report black raspberry productionfor Washington after 1988, but at that time, the state produced onlyabout 100,000 pounds annually.
Two-thirds of Washington’s raspberries are located in Whatcom Countyin northwest Washington. Whatcom County’s advantage in producing redraspberries stems from its cool summers, moderate winters, and deep,well-drained soils (McConnell).
Clark and Cowlitz counties in southern Washington also produceraspberries, with Clark County having the larger acreage. ClarkCounty reportedly had about 30 commercial producers and about 1,100acres of raspberries in 1996 (Starbuck; Brun). About 95 percent ofClark County’s raspberries are destined for processing and 80 percentare machine harvested. The berries are planted on land that has beendrained to lower the water table to at least three feet below thesurface. Nevertheless, some Clark County plantings experienced ahigh incidence of root rot in 1996, following prolonged flooding thatspring.
Ninety-eight percent of the state’s raspberries were processed in1995. Most of the remaining production is sold fresh to localmarkets. Only a few Washington producers are equipped to handle andsell raspberries in the national fresh market. Those who do sousually handle raspberries along with other berries, including strawberries and blackberries.
The Census reported 359 farms in Washington with raspberries in 1992. Relatively few of these, however, account for the bulk of production. The “commercial” producers in Whatcom County have holdings rangingfrom 20-25 acres to 500 or more acres. Growers reportedly need atleast 20-25 acres to justify the investment in a mechanicalharvesting machine (McConnell). Those with fewer than 20 acres

45
likely hand pick their berries or have them custom harvested. Somesmall producers sell in the local fresh market.
‘Meeker’ is the dominant variety grown in Whatcom County, havingreplaced ‘Willamette’ as the most widely-grown cultivar. A smallamount of acreage is planted with the ‘Tulameen’ and ‘Chilliwack’varieties.
The most damaging production peril in Whatcom County is winter damage(Carkner; McConnell). Winter damage occurs when cold, dry windsdesiccate the dormant canes, killing buds and, at times, entirecanes. Winter damage is limited to the subsequent season as theraspberry roots remain unharmed by the cold weather and produce anormal growth of primocanes the following summer. Winter damagereportedly can reduce yields 50 percent or more below normal in hard-hit fields, and was a significant cause of loss in the winter of1995/96.
Excessive rain is cited as the second-most-likely cause of yield lossin Washington. Too much rain at harvest-time can result inuncontrolled outbreaks of gray mold fruit rot. During gray moldoutbreaks, growers usually continue the harvest process, but shakethe fruit to the ground rather than collect the berries. Whensubsequent dry weather reduces the incidence of gray mold infection,growers again collect the ripe fruit. Because gray mold outbreaks donot usually last for the entire harvest period, the entire crop isnot likely to be lost. If the infection begins early in the season,up to 50 percent of the crop may be lost. This would, however,represent an extreme situation (McConnell).
A second source of loss associated with excessive rain occurs whenplants die due to root rot infections. Root rot problems are mostprevalent on poorly drained soils. Raspberry production has beenunusually profitable in the past several years, and some growershave, as a consequence, planted berries on poorly drained soils whereroot rot problems are more likely to occur.
Disaster assistance data indicate that Washington has experienced arelatively low incidence of sizeable yield losses. Between 1988 and1994, disaster payments for raspberries totaled $374,000 inWashington, about 8 percent of the U.S. total. In comparison, thestate accounted for 33 percent of U.S. harvested acreage.
Washington has potential for bramble crop insurance, particularly forraspberries, because of the large acreage and high value ofproduction. In addition, a number of growers in Washington aresufficiently specialized in bramble production that yield lossesrepresent a severe financial setback to their farming operations. Such growers would likely purchase bramble insurance beyond thecatastrophic level to protect themselves against large financiallosses.
Midwestern and Northeastern Raspberries
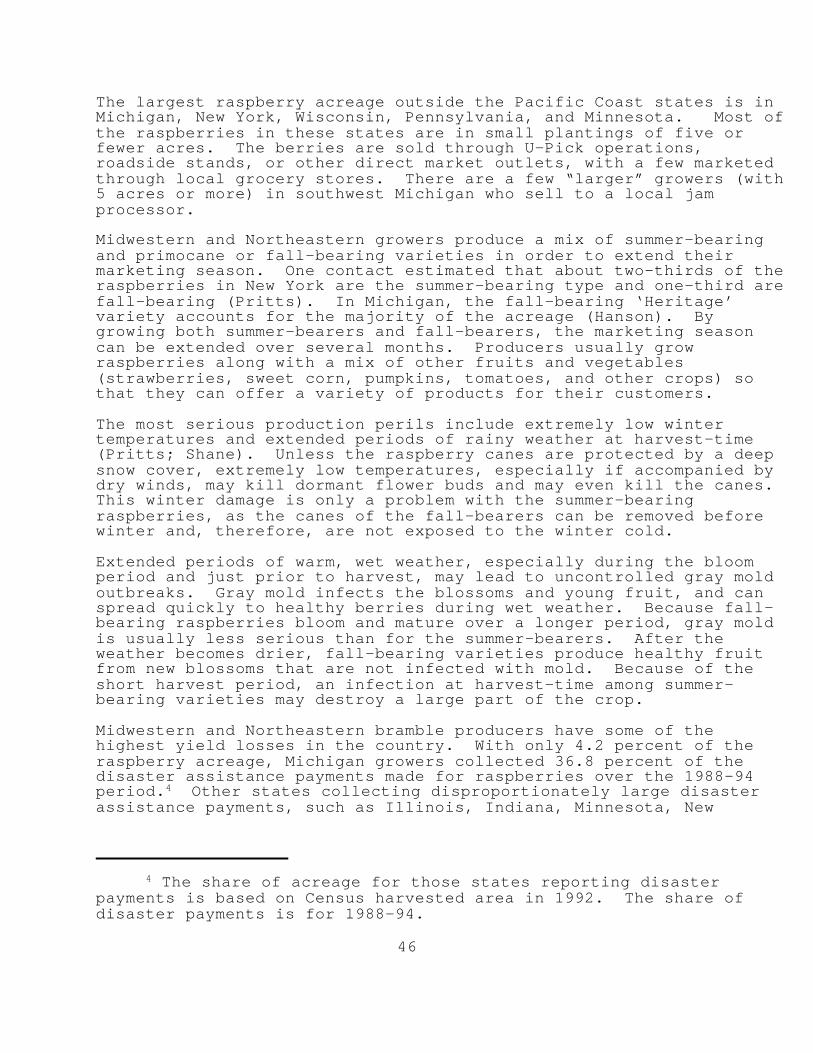
4 The share of acreage for those states reporting disasterpayments is based on Census harvested area in 1992. The share ofdisaster payments is for 1988-94.
46
The largest raspberry acreage outside the Pacific Coast states is inMichigan, New York, Wisconsin, Pennsylvania, and Minnesota. Most ofthe raspberries in these states are in small plantings of five orfewer acres. The berries are sold through U-Pick operations,roadside stands, or other direct market outlets, with a few marketedthrough local grocery stores. There are a few “larger” growers (with5 acres or more) in southwest Michigan who sell to a local jamprocessor.
Midwestern and Northeastern growers produce a mix of summer-bearingand primocane or fall-bearing varieties in order to extend theirmarketing season. One contact estimated that about two-thirds of theraspberries in New York are the summer-bearing type and one-third arefall-bearing (Pritts). In Michigan, the fall-bearing ‘Heritage’variety accounts for the majority of the acreage (Hanson). Bygrowing both summer-bearers and fall-bearers, the marketing seasoncan be extended over several months. Producers usually growraspberries along with a mix of other fruits and vegetables(strawberries, sweet corn, pumpkins, tomatoes, and other crops) sothat they can offer a variety of products for their customers.
The most serious production perils include extremely low wintertemperatures and extended periods of rainy weather at harvest-time(Pritts; Shane). Unless the raspberry canes are protected by a deepsnow cover, extremely low temperatures, especially if accompanied bydry winds, may kill dormant flower buds and may even kill the canes. This winter damage is only a problem with the summer-bearingraspberries, as the canes of the fall-bearers can be removed beforewinter and, therefore, are not exposed to the winter cold.
Extended periods of warm, wet weather, especially during the bloomperiod and just prior to harvest, may lead to uncontrolled gray moldoutbreaks. Gray mold infects the blossoms and young fruit, and canspread quickly to healthy berries during wet weather. Because fall-bearing raspberries bloom and mature over a longer period, gray moldis usually less serious than for the summer-bearers. After theweather becomes drier, fall-bearing varieties produce healthy fruitfrom new blossoms that are not infected with mold. Because of theshort harvest period, an infection at harvest-time among summer-bearing varieties may destroy a large part of the crop.
Midwestern and Northeastern bramble producers have some of thehighest yield losses in the country. With only 4.2 percent of theraspberry acreage, Michigan growers collected 36.8 percent of thedisaster assistance payments made for raspberries over the 1988-94period.4 Other states collecting disproportionately large disasterassistance payments, such as Illinois, Indiana, Minnesota, New
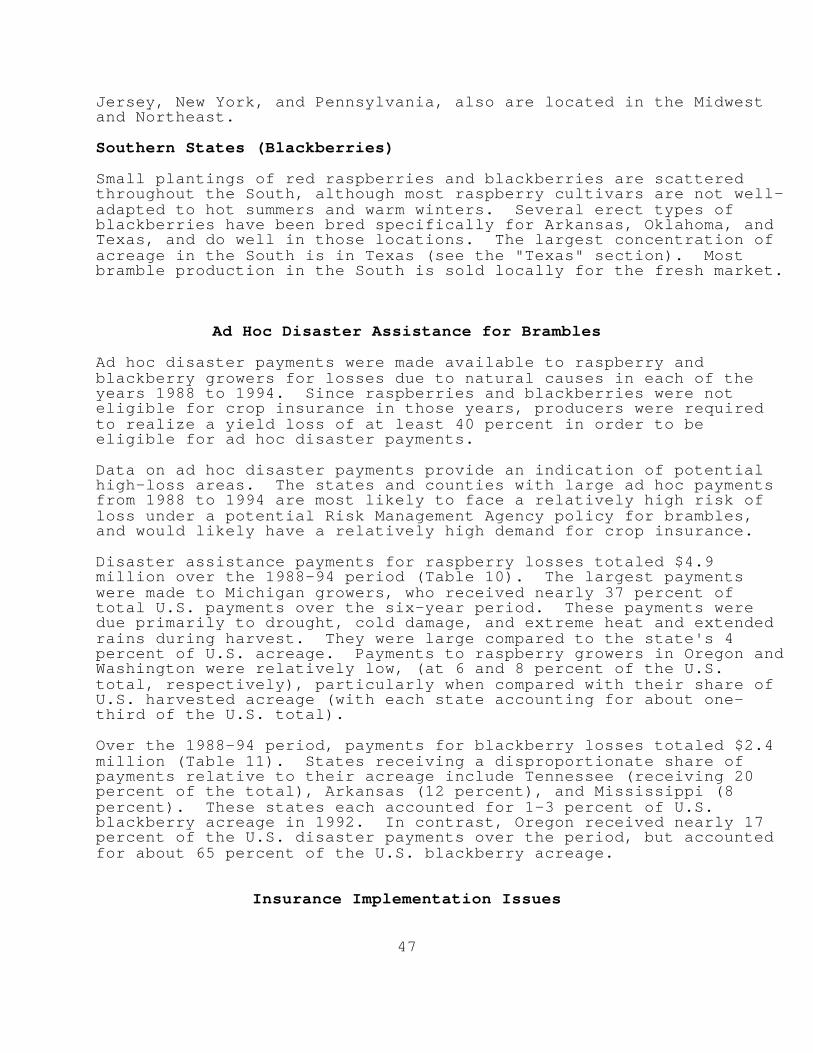
47
Jersey, New York, and Pennsylvania, also are located in the Midwestand Northeast.
Southern States (Blackberries)
Small plantings of red raspberries and blackberries are scatteredthroughout the South, although most raspberry cultivars are not well-adapted to hot summers and warm winters. Several erect types ofblackberries have been bred specifically for Arkansas, Oklahoma, andTexas, and do well in those locations. The largest concentration ofacreage in the South is in Texas (see the "Texas" section). Mostbramble production in the South is sold locally for the fresh market.
Ad Hoc Disaster Assistance for Brambles
Ad hoc disaster payments were made available to raspberry andblackberry growers for losses due to natural causes in each of theyears 1988 to 1994. Since raspberries and blackberries were noteligible for crop insurance in those years, producers were requiredto realize a yield loss of at least 40 percent in order to beeligible for ad hoc disaster payments.
Data on ad hoc disaster payments provide an indication of potentialhigh-loss areas. The states and counties with large ad hoc paymentsfrom 1988 to 1994 are most likely to face a relatively high risk ofloss under a potential Risk Management Agency policy for brambles,and would likely have a relatively high demand for crop insurance.
Disaster assistance payments for raspberry losses totaled $4.9million over the 1988-94 period (Table 10). The largest paymentswere made to Michigan growers, who received nearly 37 percent oftotal U.S. payments over the six-year period. These payments weredue primarily to drought, cold damage, and extreme heat and extendedrains during harvest. They were large compared to the state's 4percent of U.S. acreage. Payments to raspberry growers in Oregon andWashington were relatively low, (at 6 and 8 percent of the U.S.total, respectively), particularly when compared with their share ofU.S. harvested acreage (with each state accounting for about one-third of the U.S. total).
Over the 1988-94 period, payments for blackberry losses totaled $2.4million (Table 11). States receiving a disproportionate share ofpayments relative to their acreage include Tennessee (receiving 20percent of the total), Arkansas (12 percent), and Mississippi (8percent). These states each accounted for 1-3 percent of U.S.blackberry acreage in 1992. In contrast, Oregon received nearly 17percent of the U.S. disaster payments over the period, but accountedfor about 65 percent of the U.S. blackberry acreage.
Insurance Implementation Issues

48
Demand for Insurance
The greatest interest among growers in bramble crop insurance islikely to arise in the north central and northeastern United States,where growers frequently incur large yield losses. This is indicatedby ad hoc disaster assistance data for states such as Michigan,Minnesota, New York, and New Jersey, which receiveddisproportionately large shares of total U.S. payments over the 1988-94 period. Growers in these states have relatively large yieldlosses due to weather-related perils, and crop insurance could be animportant risk management tool for them.
The potential for crop insurance in these states is limited, however,because of the small amount of acreage and low value of production. Michigan, the largest bramble producer outside the Pacific Coaststates, reported only 667 acres of raspberries and 63 acres ofblackberries in 1992 and less then 1 million pounds of bramble fruitoutput. Other Midwestern and Northeastern states reportedsubstantially less acreage in 1992.
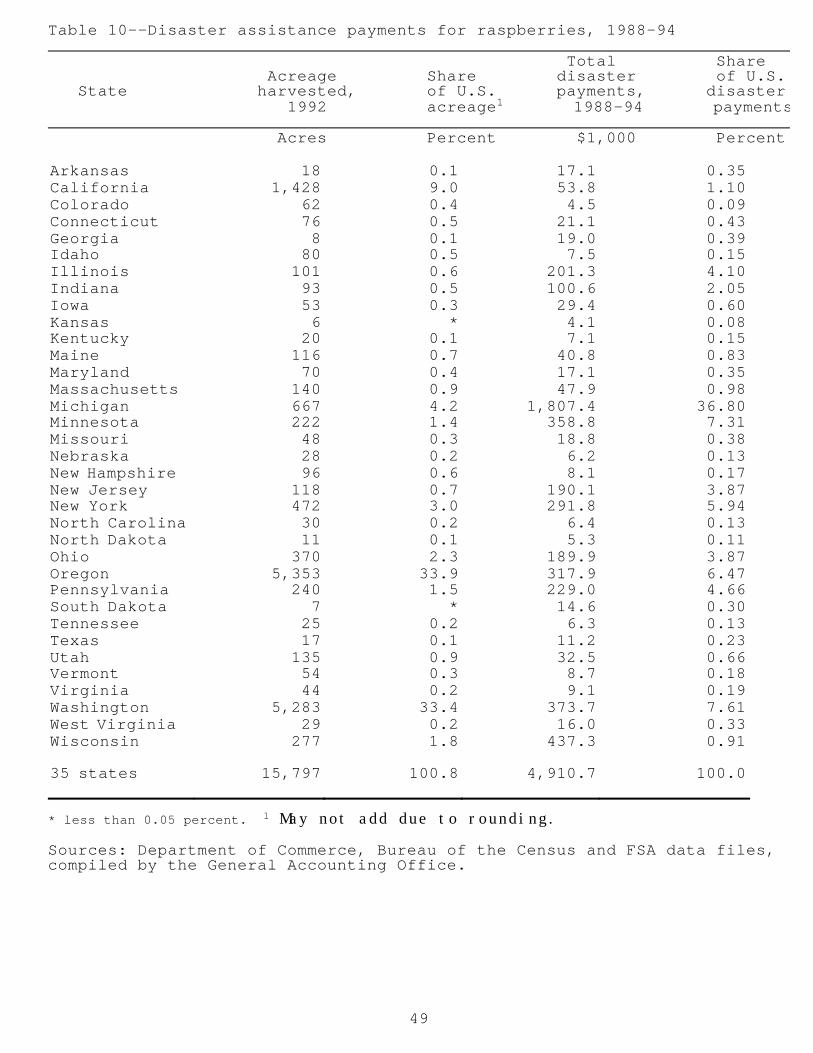
49
Table 10--Disaster assistance payments for raspberries, 1988-94 Total Share Acreage Share disaster of U.S. State harvested, of U.S. payments, disaster 1992 acreage1 1988-94 payments Acres Percent $1,000 Percent
Arkansas 18 0.1 17.1 0.35California 1,428 9.0 53.8 1.10Colorado 62 0.4 4.5 0.09Connecticut 76 0.5 21.1 0.43Georgia 8 0.1 19.0 0.39Idaho 80 0.5 7.5 0.15Illinois 101 0.6 201.3 4.10Indiana 93 0.5 100.6 2.05Iowa 53 0.3 29.4 0.60Kansas 6 * 4.1 0.08Kentucky 20 0.1 7.1 0.15Maine 116 0.7 40.8 0.83Maryland 70 0.4 17.1 0.35Massachusetts 140 0.9 47.9 0.98Michigan 667 4.2 1,807.4 36.80Minnesota 222 1.4 358.8 7.31Missouri 48 0.3 18.8 0.38Nebraska 28 0.2 6.2 0.13New Hampshire 96 0.6 8.1 0.17New Jersey 118 0.7 190.1 3.87New York 472 3.0 291.8 5.94North Carolina 30 0.2 6.4 0.13North Dakota 11 0.1 5.3 0.11Ohio 370 2.3 189.9 3.87Oregon 5,353 33.9 317.9 6.47Pennsylvania 240 1.5 229.0 4.66South Dakota 7 * 14.6 0.30Tennessee 25 0.2 6.3 0.13Texas 17 0.1 11.2 0.23Utah 135 0.9 32.5 0.66Vermont 54 0.3 8.7 0.18Virginia 44 0.2 9.1 0.19Washington 5,283 33.4 373.7 7.61West Virginia 29 0.2 16.0 0.33Wisconsin 277 1.8 437.3 0.91
35 states 15,797 100.8 4,910.7 100.0
* less than 0.05 percent. 1 May not add due to rounding.
Sources: Department of Commerce, Bureau of the Census and FSA data files,compiled by the General Accounting Office.
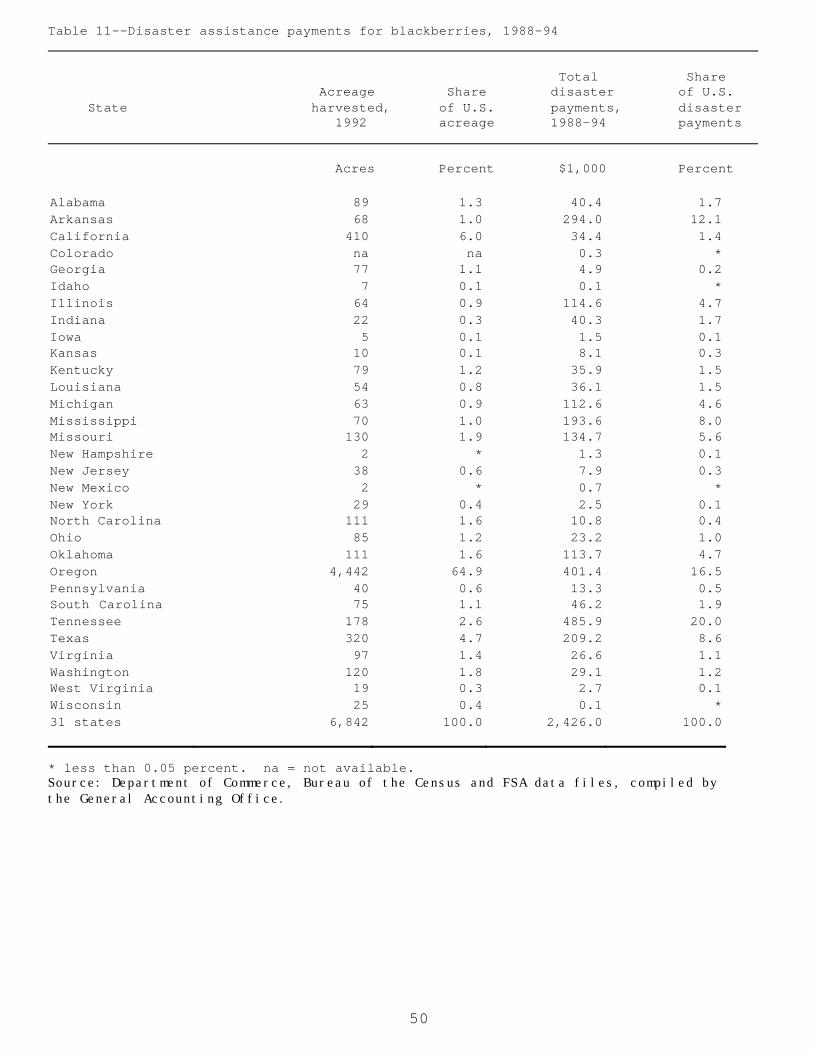
50
Table 11--Disaster assistance payments for blackberries, 1988-94
Total Share Acreage Share disaster of U.S. State harvested, of U.S. payments, disaster 1992 acreage 1988-94 payments Acres Percent $1,000 Percent
Alabama 89 1.3 40.4 1.7Arkansas 68 1.0 294.0 12.1California 410 6.0 34.4 1.4Colorado na na 0.3 *Georgia 77 1.1 4.9 0.2Idaho 7 0.1 0.1 *Illinois 64 0.9 114.6 4.7Indiana 22 0.3 40.3 1.7Iowa 5 0.1 1.5 0.1Kansas 10 0.1 8.1 0.3Kentucky 79 1.2 35.9 1.5Louisiana 54 0.8 36.1 1.5Michigan 63 0.9 112.6 4.6Mississippi 70 1.0 193.6 8.0Missouri 130 1.9 134.7 5.6New Hampshire 2 * 1.3 0.1New Jersey 38 0.6 7.9 0.3New Mexico 2 * 0.7 *New York 29 0.4 2.5 0.1North Carolina 111 1.6 10.8 0.4Ohio 85 1.2 23.2 1.0Oklahoma 111 1.6 113.7 4.7Oregon 4,442 64.9 401.4 16.5Pennsylvania 40 0.6 13.3 0.5South Carolina 75 1.1 46.2 1.9Tennessee 178 2.6 485.9 20.0Texas 320 4.7 209.2 8.6Virginia 97 1.4 26.6 1.1Washington 120 1.8 29.1 1.2West Virginia 19 0.3 2.7 0.1Wisconsin 25 0.4 0.1 *31 states 6,842 100.0 2,426.0 100.0
* less than 0.05 percent. na = not available. Source: Department of Commerce, Bureau of the Census and FSA data files, compiled by the General Accounting Office.
51
Because of their large commercial acreage, the greatest potential forbramble crop insurance exists in California, Oregon, and Washington. For some of the larger, commercial-size operations, a severe yieldloss represents a substantial financial setback to the farmingoperation. Crop insurance could serve as an important riskmanagement technique on such farms.
Some growers in Washington have indicated an interest in brambleinsurance. The Farm Service Agencies in Clark and Whatcom counties,for example, report that they have received requests for raspberryinsurance and that growers have asked about the availability of suchinsurance (Jaquish; Starbuck). Production perils were of particularconcern in 1996, when substantial crop losses occurred due to winterdamage. In addition, some growers in Clark County, Washington, lostraspberry plants due to flooding in 1996.
The Marion County, Oregon, Farm Service Agency Executive Directorindicated that he had not received any requests for crop insurancefor brambles (Brewster). However, he thought that if insurance wereavailable some producers, especially the largest ones, would purchaseit because “brambles are a high-risk crop.”
The extension farm advisor for brambles in Monterey and Santa Cruzcounties in California indicated that several growers had expressedfrustration that they did not have crop insurance available duringflooding in the spring of 1995. Unusual flooding along the centralCalifornia coast caused severe damage to a wide range of crops in1995.
Adverse Selection
A major source of loss among raspberries planted on poorly-drainedsoils is the debilitation and death of plants due to flooding androot rot infections. Consequently, the soil type and its elevationrelative to potential flood waters play an important role indetermining the chances of yield losses. Several contacts indicatedthat “new” growers sometimes plant raspberries on heavy, poorly-drained soils, and that the probability of losses due to flooding androot rot are higher among these plantings than among plantings onbetter sites. Growers planting raspberries on heavy, poorly-drainedsoils, and whose premium rates are not adjusted accordingly, arelikely to expect higher returns from crop insurance than growers withmore desirable planting sites. Therefore, such growers may be morelikely to purchase insurance.
Adverse selection may also exist in situations where drought damageto brambles during the summer weakens the plants and diminishes thenumber of primocanes. Growers may be more likely to purchase cropinsurance for the following year when their plants have been weakenedby summer drought. They may reason that their chances of a cropfailure rise due to the weakened plants. This situation would occurmost frequently in drought-prone areas where brambles are notirrigated. Summer drought damage was cited as a production perilamong blackberries in Texas.
52
Reference Prices
The state agricultural statistics services in Washington and Oregonreport state average prices received by farmers for fresh-market andprocessing raspberries. The Oregon Agricultural Statistics Servicealso reports average fresh-market and processing prices forblackberries (including prices for loganberries and boysenberries). The price reported in California is an all-raspberry price andrepresents returns for fresh-market and processing berries. Sincethe bulk of California’s sales are for the fresh market, the all-raspberry price more closely represents a fresh-market price than aprocessing-berry price.
Fresh-market berry prices tend to run higher than the prices forprocessing berries because they embody returns for services andsupplies (including packing, grading, selling, and containers) notembedded in the returns for processing berries. In addition,harvesting expenses for fresh market berries exceed those forprocessing berries because of the need for hand picking. Handpicking expenses run substantially higher than machine harvestingcosts.
The average prices reported by the agricultural statistics servicesrepresent a reasonable basis for setting price elections. Becauseberry prices embody returns for a substantial amount of harvestingand marketing expenses, the in-field value of production is, however,substantially less than indicated by reported market prices.
Estimating “Appraised Production”
Appraised production refers to output that is not destroyed by aninsurable peril. As with a number of crops, estimating appraisedproduction for brambles will require a great amount of subjectivejudgment on the part of the insurance adjuster, particularlyregarding whether production went unharvested because of damage by aninsurable peril or because of market conditions.
One example is the case where gray mold fruit rot infects theberries. Occasionally, growers discard all of the fruit maturingduring a gray mold outbreak, regardless of whether or not theindividual berries are infected. This is more likely to happenduring periods of low market prices, when the cost of separatinginfected berries from healthy berries exceeds the returns for theharvested fruit. Whether or not the production losses are due togray mold or to low market returns is a subjective judgment which theinsurance adjusters would have to make.
A second example where insurance adjusters would be faced with makinga subjective judgment is when growers remove the canes in the springfollowing winter damage. In such situations, the grower incurs acomplete yield loss in the current season, but may expect a largerthan normal crop in the subsequent season.
Moral Hazard
53
Moral hazard occurs when a grower intentionally (either throughneglect or overt actions) contributes to causing a yield loss. Generally, moral hazard incentives exist when net market returns fromthe additional yield fall below the returns from collecting cropinsurance. This situation is most likely to occur during periods oflow market prices and when the crop yield is somewhat marginal.
Moral hazard is not likely to be a widespread problem in offeringbramble insurance because, in the major producing areas, mostproduction is concentrated in a relatively small area. In westernWashington and Oregon, the low market returns usually associated withmoral hazard would be most likely to occur during seasons whengrowers had relatively high average yields. Conversely, during yearswith low yields, market prices are likely to exceed the priceelection, diminishing the chances that a moral hazard incentiveexists.
Estimating Actual Production History (APH)
The production and acreage data reported to the Washington RedRaspberry Commission by processors and producers provide a means forestimating APH for growers. In Washington, the Raspberry Commissionrequires processors to report the pounds of berries delivered by eachproducer. These data could provide growers’ production histories forprocessed berries. About half of the growers reportedly also submitreports to the Commission which include information on harvestedacres. The processor-reported production statistics, in combinationwith the grower-reported harvested acreage data, could provide abasis for estimating the APH for growers.
California and Oregon do not have the production data available on anindividual-producer basis that is available in Washington. Commercial growers in these states, however, are likely to haveadequate records on acreage, as well as documentation on the outputdelivered to processors or handlers. These data could be used toestablish yield histories.
54
References
American Frozen Food Institute. Frozen Food Pack Statistics. McLean, Virginia. Various issues.
Baker, M.L. Extension Horticulturist. Texas A&M Research andExtension Center. Overton, Texas. Personal communication. August1996.
Bettiga, Larry. Extension Farm Advisor. Monterey County,California. Personal communication. August 1996.
Brewster, Thomas. County Executive Director. U.S. Department ofAgriculture. Farm Service Agency. Marion County, Oregon. Personalcommunication. August 1996.
Brun, Charles. Extension Fruit Specialist. Clark County.Washington. Personal communication. August 1996.
Burt, J.G., K.N. Brown and T.L. Cross. Enterprise Cost Study forMarion Blackberries: Establishment Years, Every Year Production, andAlternate Year Production in the Mid-Willamette Valley. SpecialReport 792. Oregon State University Extension Service. October1988.
California Agricultural Statistics Service. County AgriculturalCommissioners' Reports. Various issues.
Carkner, Richard. Extension Farm Management Specialist. WashingtonState University. Personal communication. August 1996.
Crandall, Perry C. Bramble Production: The Management and Marketingof Raspberries and Blackberries. Food Products Press. New York. 1995.
Daubeny, G., and C. Fear. “Primocane Fruiting Raspberries in thePacific Northwest and California.” J. Fruit Var. American Pomological Society. October 1992. Volume 46, No. 4. pp. 197-199.
Elkins, Rachel and Ronald Tyler. Sample Costs to ProduceRaspberries- Willamette Variety Santa Cruz County 1987. Universityof California Cooperative Extension Service. Santa Cruz County,California. 1987.
Elkins, Rachel and Ronald Tyler. Sample Costs to ProduceRaspberries- Heritage Variety Santa Cruz County 1987. University ofCalifornia Cooperative Extension Service. Santa Cruz County,California. 1987.
Food and Agriculture Organization of the United Nations. FAOProduction Yearbook. Rome. Various issues.
55
Funt, Richard C., and others. Brambles: Production, Management, andMarketing. Bulletin 783. Ohio Cooperative Extension Service. OhioState University. January 1988.
Goulart, Barbara, and others. Small Fruit Production and PestManagement Guide 1994-95. College of Agricultural Sciences.Pennsylvania State University. 1994.
Hanson, Eric. Status and Potential of Michigan Agriculture-SmallFruit Crops. Michigan State University. Department of Horticulture. Report Number 58. September 1992.
Jaquish, George. County Executive Director. U.S. Department ofAgriculture. Whatcom County, Washington. Personal communication. August 1996.
Kelsey, Myron P. and others. Cost of Producing Red Raspberries inMichigan. Michigan State University Cooperative Extension Service. Extension Bulletin E-2193. October 1989.
McConnell, Craig. County Extension Agent. Whatcom County,Washington. Personal communication. August 1996.
Nonnecke, G.R. and J.J. Luby. “Raspberry Cultivars and Production inthe Midwest.” J. Fruit Var. American Pomological Society. Volume46, Number 4. pp. 207-212. October 1992.
Oregon Department of Agriculture. Oregon Agricultural StatisticsService. Oregon Agricultural Statistics. Various issues.
Oregon State University. Department of Agriculture and ResourceEconomics. Unpublished commodity statistics.
Pritts, Marvin. Extension Small Fruit Specialist. Department ofFruit and Vegetable Science. Cornell University Extension. Personalcommunication. August 1996.
Schroder, Jan. Executive Secretary. Oregon Raspberry and BlackberryCommission. Personal Communication. August 1996.
Seeger, Ann. Manager. Washington Red Raspberry Commission. Personal communication. August 1996.
Shane, Bill. District Extension Fruit Agent. Berrien County, Michigan. Personal communication. August 1996.
Starbuck, Sandra. County Executive Director. U.S. Department ofAgriculture. Clark County, Oregon. Personal communication. August1996.
Strik, Bernadine. Extension Small Fruit Specialist. Oregon StateUniversity. Corvallis, Oregon. Personal communication. August1996.
56
Turner, Brenda and others. Enterprise Budget Red Raspberry,Willamette Valley Region. Oregon State University Extension Service. EM 8539. April 1993.
U.S. Department of Agriculture. Economic Research Service. Fruitand Tree Nut Situation and Outlook Report. FST-274. September 1995and updated tables for 1996.
U.S. Department of Agriculture. Farm Service Agency. Ad HocDisaster Assistance Data Files. Compiled by the General AccountingOffice. 1988-94.
U.S. Department of Agriculture. National Agricultural StatisticsService. Noncitrus Fruits and Nuts Annual Summary. Various.
U.S. Department of Commerce. Bureau of the Census. Census ofAgriculture, 1992.
U.S. Department of Commerce. Bureau of the Census. Census ofAgriculture, 1987. Special tabulations.
Washington Department of Agriculture. Washington AgriculturalStatistics Service. Washington Agricultural Statistics. Variousissues.

57
Appendix table 1-- Raspberries: Number of farms, acresharvested, and acres irrigated, 1987 and 1992
----------------1992----------------- ---------------1987----------------- State/County Acres ---Irrigated--- Acres ---Irrigated--- Farms harvested Farms Acres Farms harvested Farms Acres
California 266 1,428 266 1,428 258 1,330 258 1,330 Monterey 46 501 46 501 58 351 58 351 Santa Cruz 57 580 57 580 75 750 75 750 Ventura 15 139 15 139 8 66 8 66 Other 148 208 148 208 117 163 117 163
Michigan 357 667 170 361 375 861 162 428
New York 318 472 117 173 300 497 96 204
Ohio 224 370 61 116 224 435 70 232 Oregon 492 5,353 322 2,724 496 5,754 271 2,637 Clackamas 154 2,093 52 616 199 2,626 55 692 Linn 26 377 23 358 27 438 23 322 Marion 38 583 27 510 42 333 34 284 Multnomah 40 804 19 91 148 974 13 176 Polk 9 137 9 13 9 89 7 85 Washington 49 1,077 37 821 42 829 32 752 Other 176 282 155 315 29 465 107 326
Washington 359 5,283 252 4,502 400 4,185 232 3,088 Clark 42 626 24 355 47 443 24 200

58
Cowlitz 9 259 6 257 8 na 6 na Skagit 29 412 13 225 36 547 11 211 Whatcom 95 3,535 89 3,419 91 2,168 75 2,047 Other 184 451 120 246 218 na 116 na
Other 2,623 2,326 1,082 1,183 2,244 2,422 925 1,226
U.S. 4,639 15,899 2,270 10,487 4,297 15,484 2,014 9,145
Source: U.S. Department of Commerce, Bureau of the Census.1992.
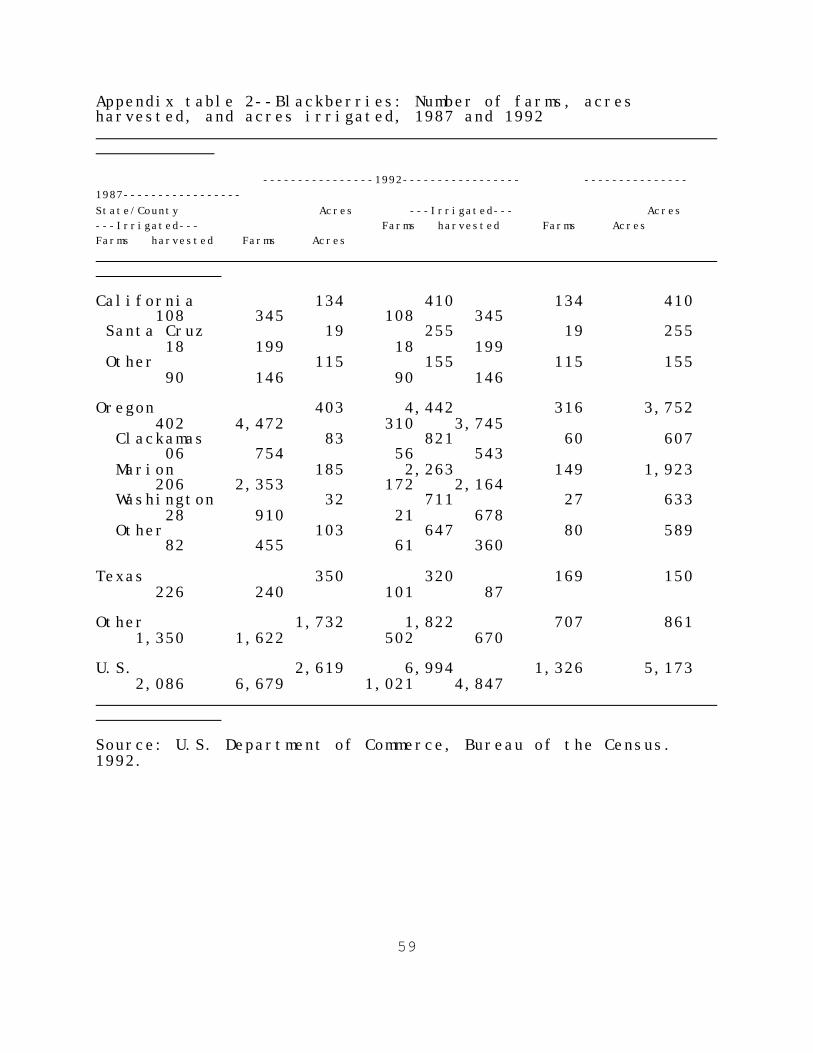
59
Appendix table 2--Blackberries: Number of farms, acresharvested, and acres irrigated, 1987 and 1992
----------------1992----------------- ---------------1987----------------- State/County Acres ---Irrigated--- Acres ---Irrigated--- Farms harvested Farms Acres Farms harvested Farms Acres
California 134 410 134 410 108 345 108 345 Santa Cruz 19 255 19 255 18 199 18 199 Other 115 155 115 155 90 146 90 146
Oregon 403 4,442 316 3,752 402 4,472 310 3,745 Clackamas 83 821 60 607 06 754 56 543 Marion 185 2,263 149 1,923 206 2,353 172 2,164 Washington 32 711 27 633 28 910 21 678 Other 103 647 80 589 82 455 61 360
Texas 350 320 169 150 226 240 101 87
Other 1,732 1,822 707 861 1,350 1,622 502 670
U.S. 2,619 6,994 1,326 5,173 2,086 6,679 1,021 4,847
Source: U.S. Department of Commerce, Bureau of the Census.1992.
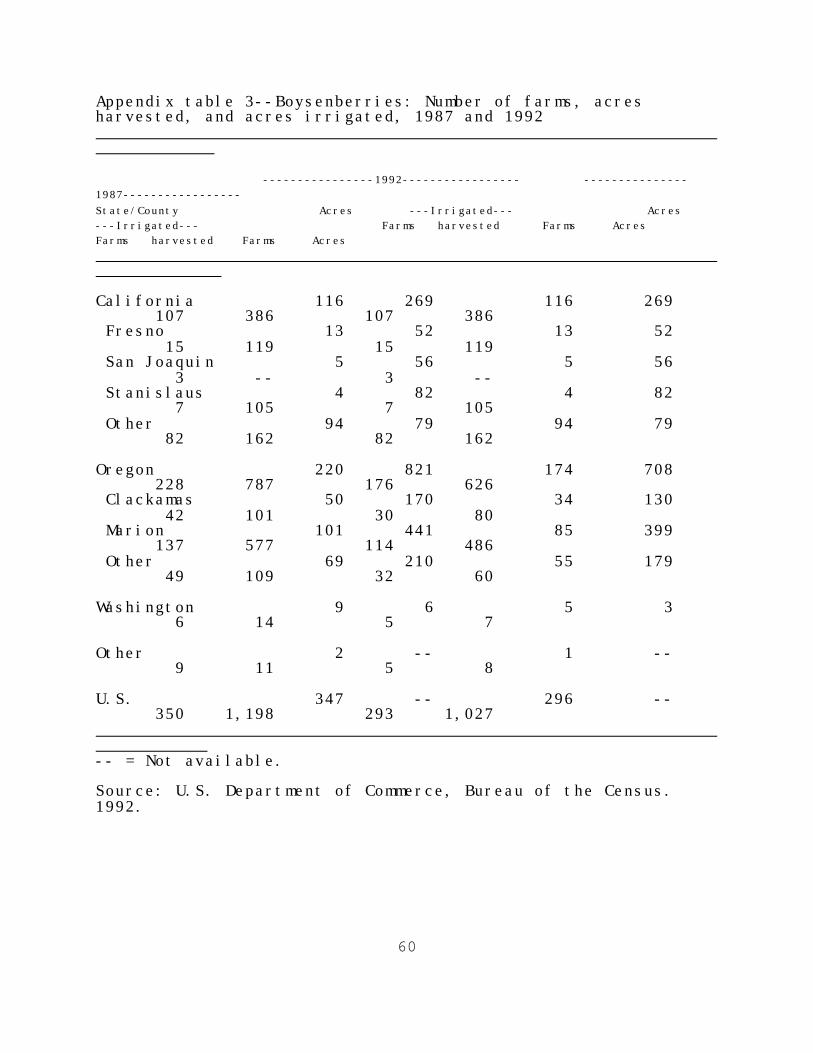
60
Appendix table 3--Boysenberries: Number of farms, acresharvested, and acres irrigated, 1987 and 1992
----------------1992----------------- ---------------1987----------------- State/County Acres ---Irrigated--- Acres ---Irrigated--- Farms harvested Farms Acres Farms harvested Farms Acres
California 116 269 116 269 107 386 107 386 Fresno 13 52 13 52 15 119 15 119 San Joaquin 5 56 5 56 3 -- 3 -- Stanislaus 4 82 4 82 7 105 7 105 Other 94 79 94 79 82 162 82 162
Oregon 220 821 174 708 228 787 176 626 Clackamas 50 170 34 130 42 101 30 80 Marion 101 441 85 399 137 577 114 486 Other 69 210 55 179 49 109 32 60
Washington 9 6 5 3 6 14 5 7
Other 2 -- 1 -- 9 11 5 8
U.S. 347 -- 296 -- 350 1,198 293 1,027 -- = Not available.
Source: U.S. Department of Commerce, Bureau of the Census.1992.
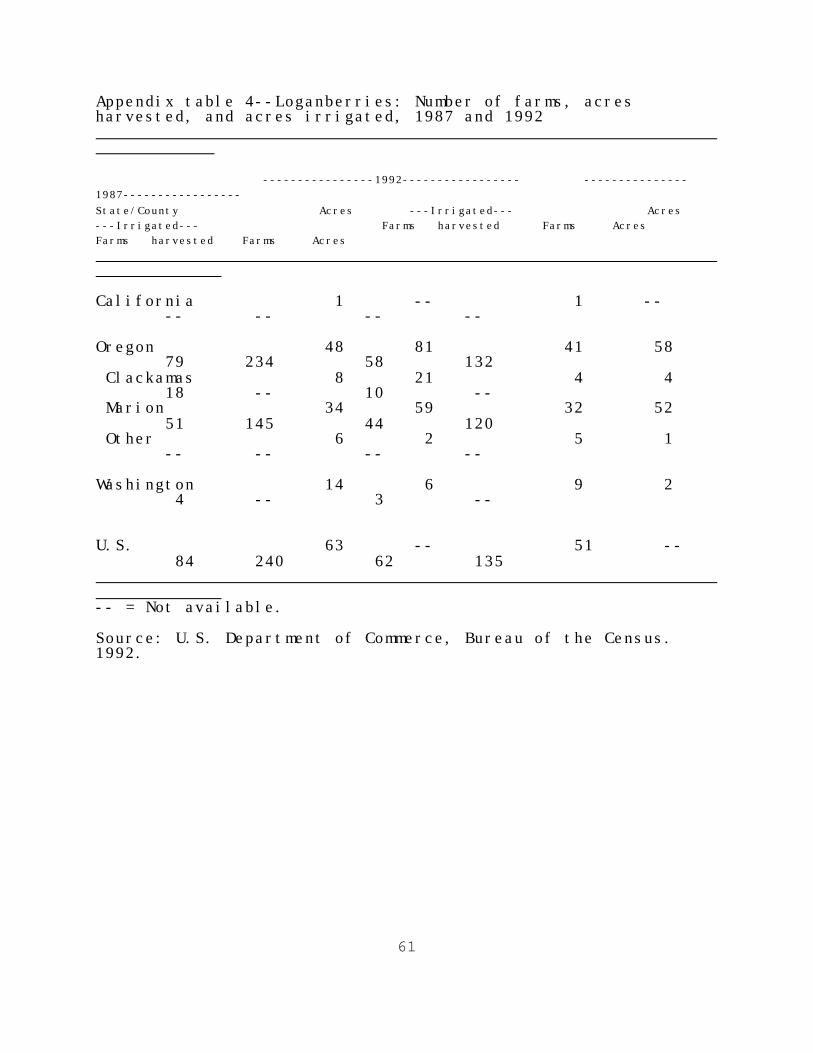
61
Appendix table 4--Loganberries: Number of farms, acresharvested, and acres irrigated, 1987 and 1992
----------------1992----------------- ---------------1987----------------- State/County Acres ---Irrigated--- Acres ---Irrigated--- Farms harvested Farms Acres Farms harvested Farms Acres
California 1 -- 1 -- -- -- -- --
Oregon 48 81 41 58 79 234 58 132 Clackamas 8 21 4 4 18 -- 10 -- Marion 34 59 32 52 51 145 44 120 Other 6 2 5 1 -- -- -- --
Washington 14 6 9 2 4 -- 3 --
U.S. 63 -- 51 -- 84 240 62 135 -- = Not available.
Source: U.S. Department of Commerce, Bureau of the Census.1992.
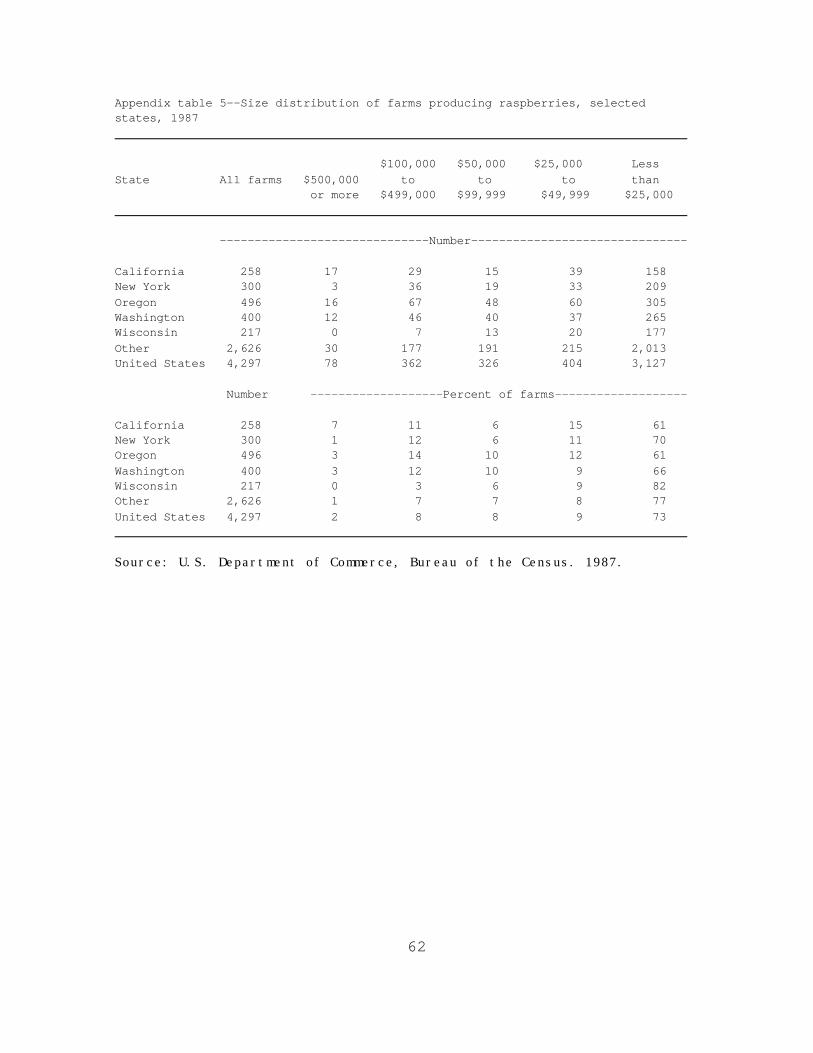
62
Appendix table 5--Size distribution of farms producing raspberries, selected states, 1987
$100,000 $50,000 $25,000 Less State All farms $500,000 to to to than or more $499,000 $99,999 $49,999 $25,000 ------------------------------Number-------------------------------
California 258 17 29 15 39 158New York 300 3 36 19 33 209Oregon 496 16 67 48 60 305Washington 400 12 46 40 37 265Wisconsin 217 0 7 13 20 177Other 2,626 30 177 191 215 2,013United States 4,297 78 362 326 404 3,127
Number -------------------Percent of farms-------------------
California 258 7 11 6 15 61New York 300 1 12 6 11 70Oregon 496 3 14 10 12 61Washington 400 3 12 10 9 66Wisconsin 217 0 3 6 9 82Other 2,626 1 7 7 8 77United States 4,297 2 8 8 9 73
Source: U.S. Department of Commerce, Bureau of the Census. 1987.
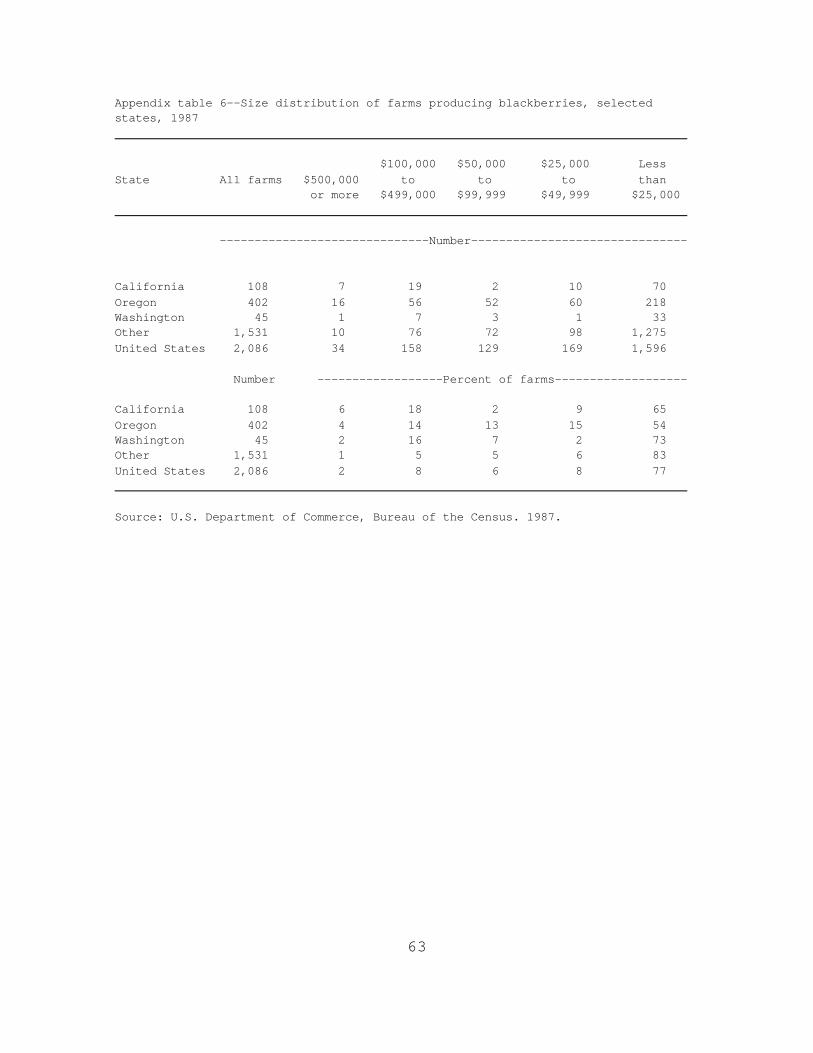
63
Appendix table 6--Size distribution of farms producing blackberries, selected states, 1987
$100,000 $50,000 $25,000 Less State All farms $500,000 to to to than or more $499,000 $99,999 $49,999 $25,000 ------------------------------Number-------------------------------
California 108 7 19 2 10 70Oregon 402 16 56 52 60 218Washington 45 1 7 3 1 33Other 1,531 10 76 72 98 1,275United States 2,086 34 158 129 169 1,596 Number ------------------Percent of farms-------------------
California 108 6 18 2 9 65Oregon 402 4 14 13 15 54Washington 45 2 16 7 2 73Other 1,531 1 5 5 6 83United States 2,086 2 8 6 8 77
Source: U.S. Department of Commerce, Bureau of the Census. 1987.
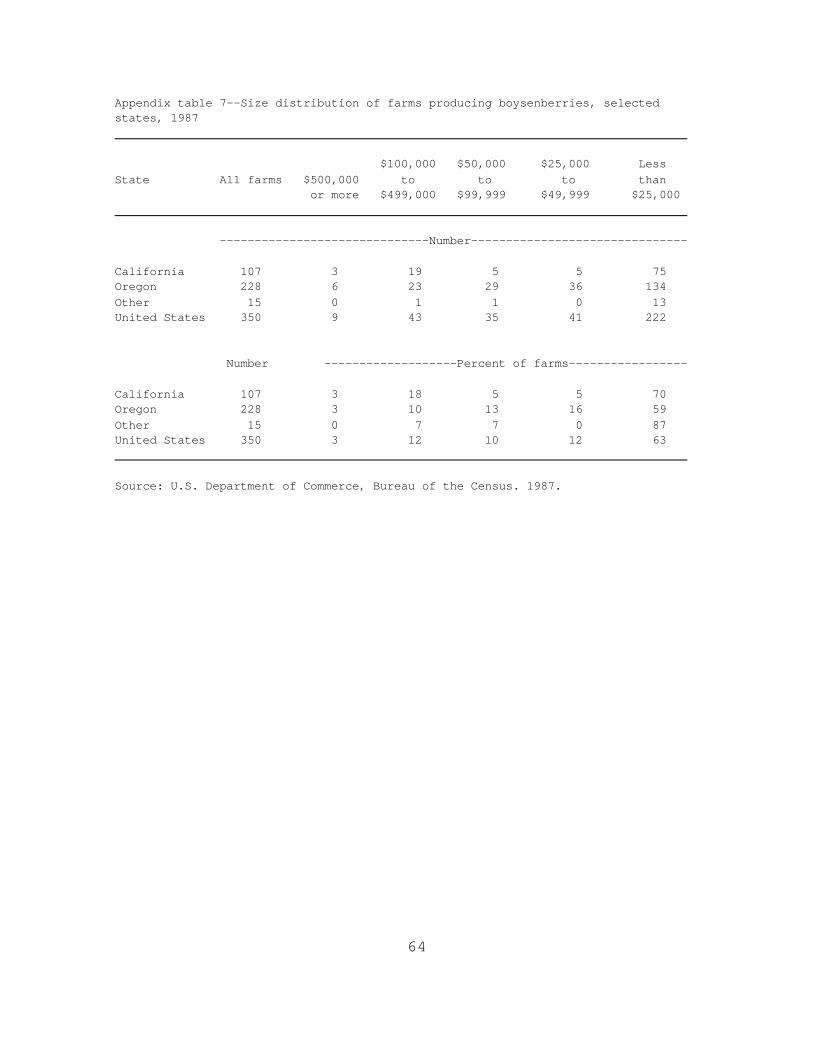
64
Appendix table 7--Size distribution of farms producing boysenberries, selectedstates, 1987
$100,000 $50,000 $25,000 Less State All farms $500,000 to to to than or more $499,000 $99,999 $49,999 $25,000 ------------------------------Number-------------------------------
California 107 3 19 5 5 75Oregon 228 6 23 29 36 134Other 15 0 1 1 0 13United States 350 9 43 35 41 222
Number -------------------Percent of farms-----------------
California 107 3 18 5 5 70Oregon 228 3 10 13 16 59Other 15 0 7 7 0 87United States 350 3 12 10 12 63
Source: U.S. Department of Commerce, Bureau of the Census. 1987.
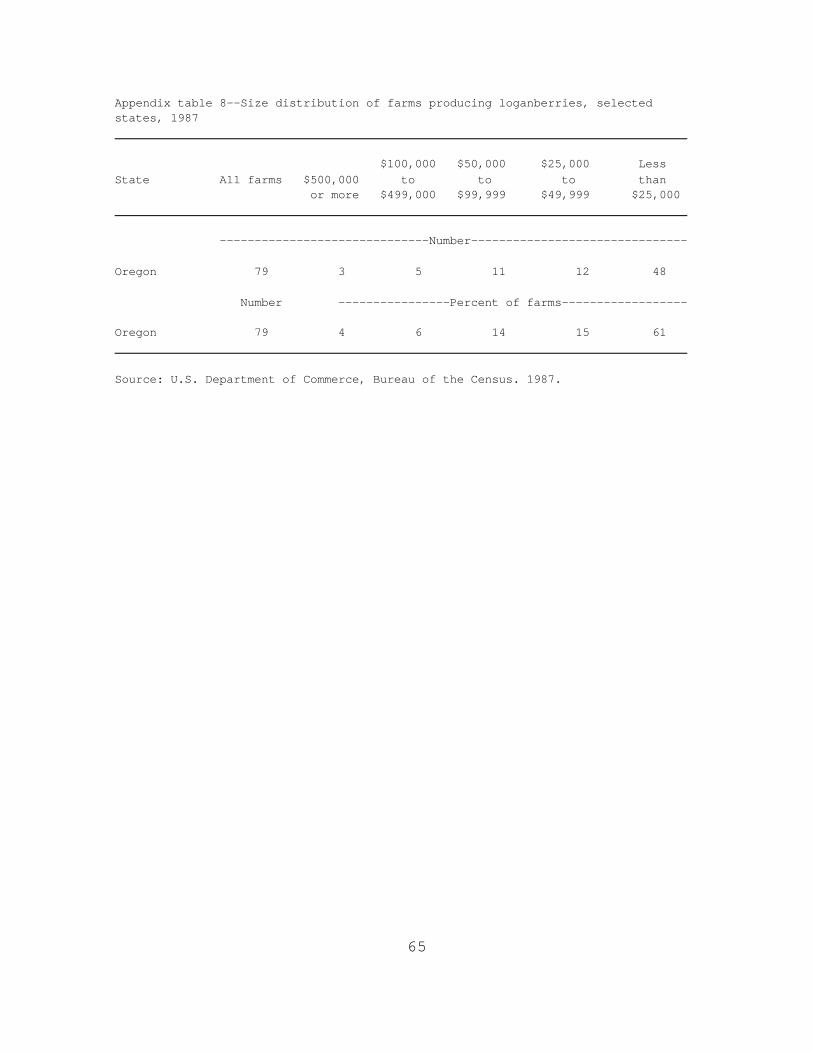
65
Appendix table 8--Size distribution of farms producing loganberries, selected states, 1987
$100,000 $50,000 $25,000 Less State All farms $500,000 to to to than or more $499,000 $99,999 $49,999 $25,000 ------------------------------Number-------------------------------
Oregon 79 3 5 11 12 48
Number ----------------Percent of farms------------------
Oregon 79 4 6 14 15 61
Source: U.S. Department of Commerce, Bureau of the Census. 1987.
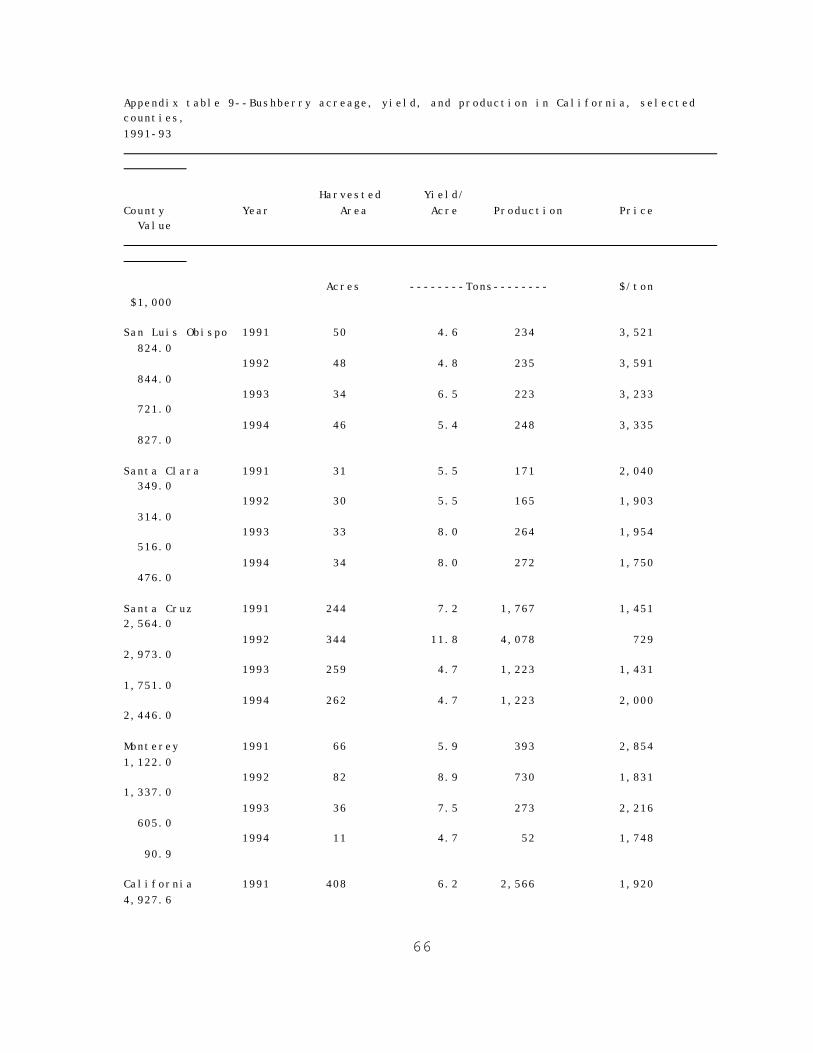
66
Appendix table 9--Bushberry acreage, yield, and production in California, selectedcounties, 1991-93
Harvested Yield/ County Year Area Acre Production Price Value Acres --------Tons-------- $/ton $1,000
San Luis Obispo 1991 50 4.6 234 3,521 824.0 1992 48 4.8 235 3,591 844.0 1993 34 6.5 223 3,233 721.0 1994 46 5.4 248 3,335 827.0
Santa Clara 1991 31 5.5 171 2,040 349.0 1992 30 5.5 165 1,903 314.0 1993 33 8.0 264 1,954 516.0 1994 34 8.0 272 1,750 476.0
Santa Cruz 1991 244 7.2 1,767 1,451 2,564.0 1992 344 11.8 4,078 729 2,973.0 1993 259 4.7 1,223 1,431 1,751.0 1994 262 4.7 1,223 2,000 2,446.0
Monterey 1991 66 5.9 393 2,854 1,122.0 1992 82 8.9 730 1,831 1,337.0 1993 36 7.5 273 2,216 605.0 1994 11 4.7 52 1,748 90.9
California 1991 408 6.2 2,566 1,920 4,927.6
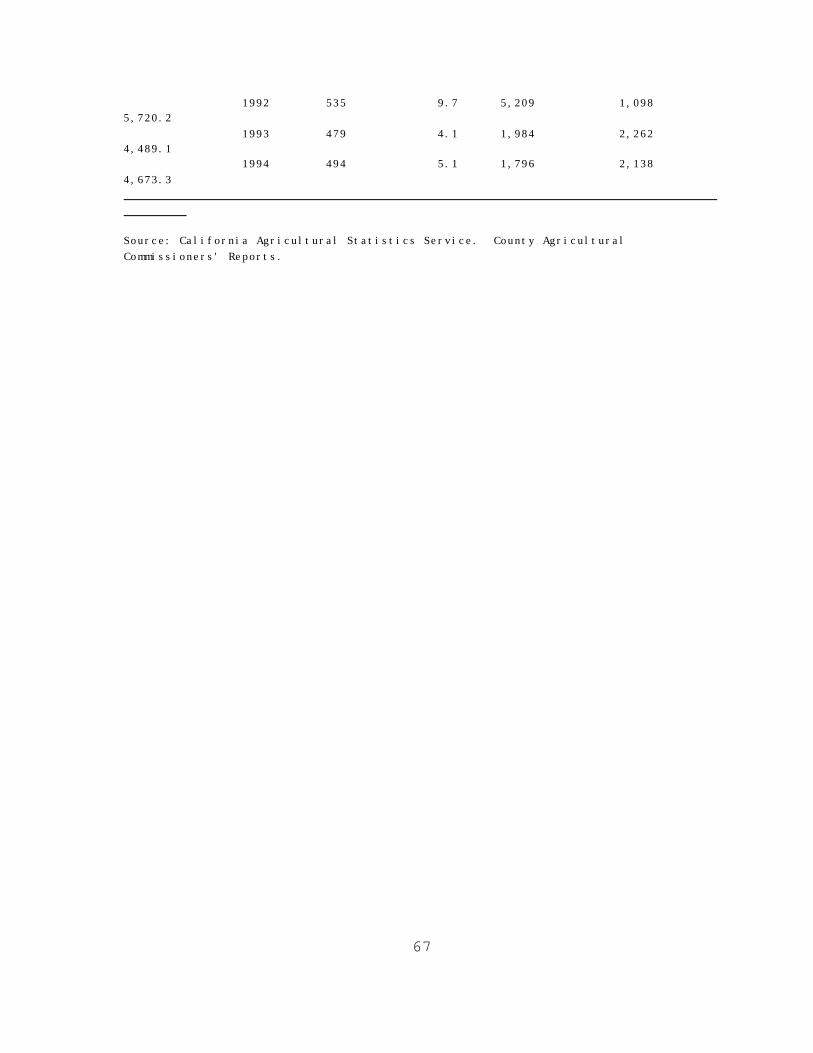
67
1992 535 9.7 5,209 1,098 5,720.2 1993 479 4.1 1,984 2,262 4,489.1 1994 494 5.1 1,796 2,138 4,673.3
Source: California Agricultural Statistics Service. County AgriculturalCommissioners' Reports.
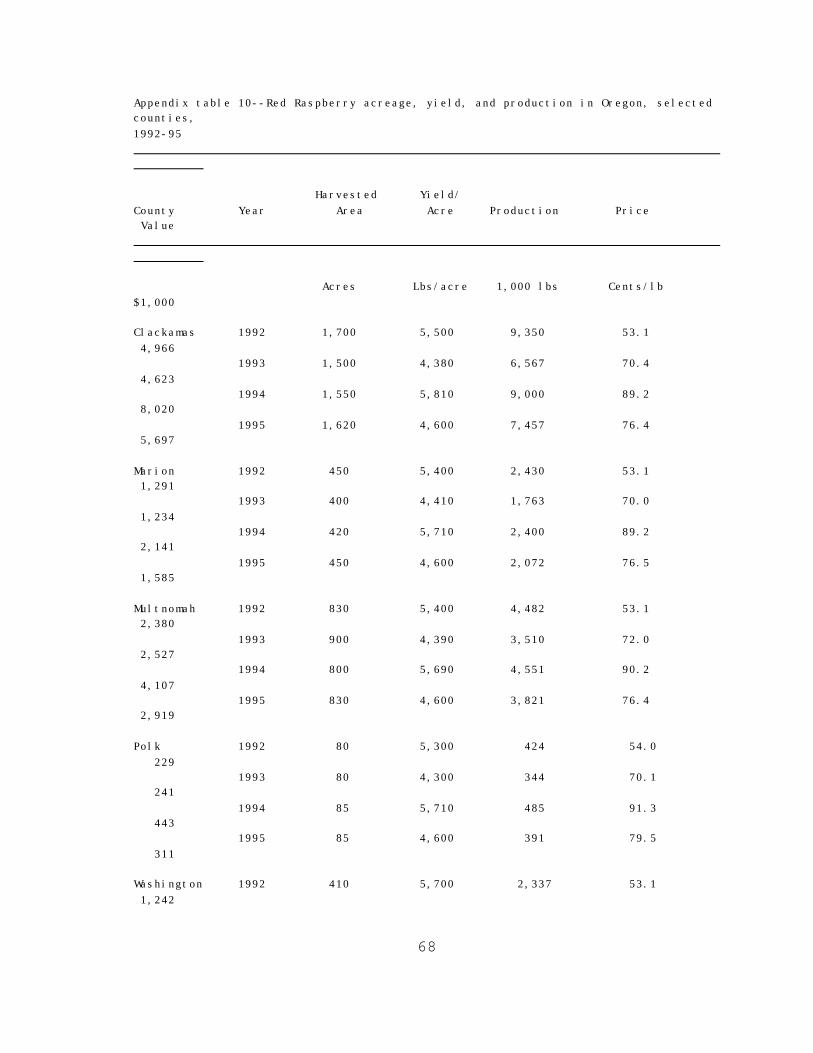
68
Appendix table 10--Red Raspberry acreage, yield, and production in Oregon, selectedcounties, 1992-95
Harvested Yield/ County Year Area Acre Production Price Value
Acres Lbs/acre 1,000 lbs Cents/lb $1,000
Clackamas 1992 1,700 5,500 9,350 53.1 4,966 1993 1,500 4,380 6,567 70.4 4,623 1994 1,550 5,810 9,000 89.2 8,020 1995 1,620 4,600 7,457 76.4 5,697
Marion 1992 450 5,400 2,430 53.1 1,291 1993 400 4,410 1,763 70.0 1,234 1994 420 5,710 2,400 89.2 2,141 1995 450 4,600 2,072 76.5 1,585
Multnomah 1992 830 5,400 4,482 53.1 2,380 1993 900 4,390 3,510 72.0 2,527 1994 800 5,690 4,551 90.2 4,107 1995 830 4,600 3,821 76.4 2,919
Polk 1992 80 5,300 424 54.0 229 1993 80 4,300 344 70.1 241 1994 85 5,710 485 91.3 443 1995 85 4,600 391 79.5 311
Washington 1992 410 5,700 2,337 53.1 1,242
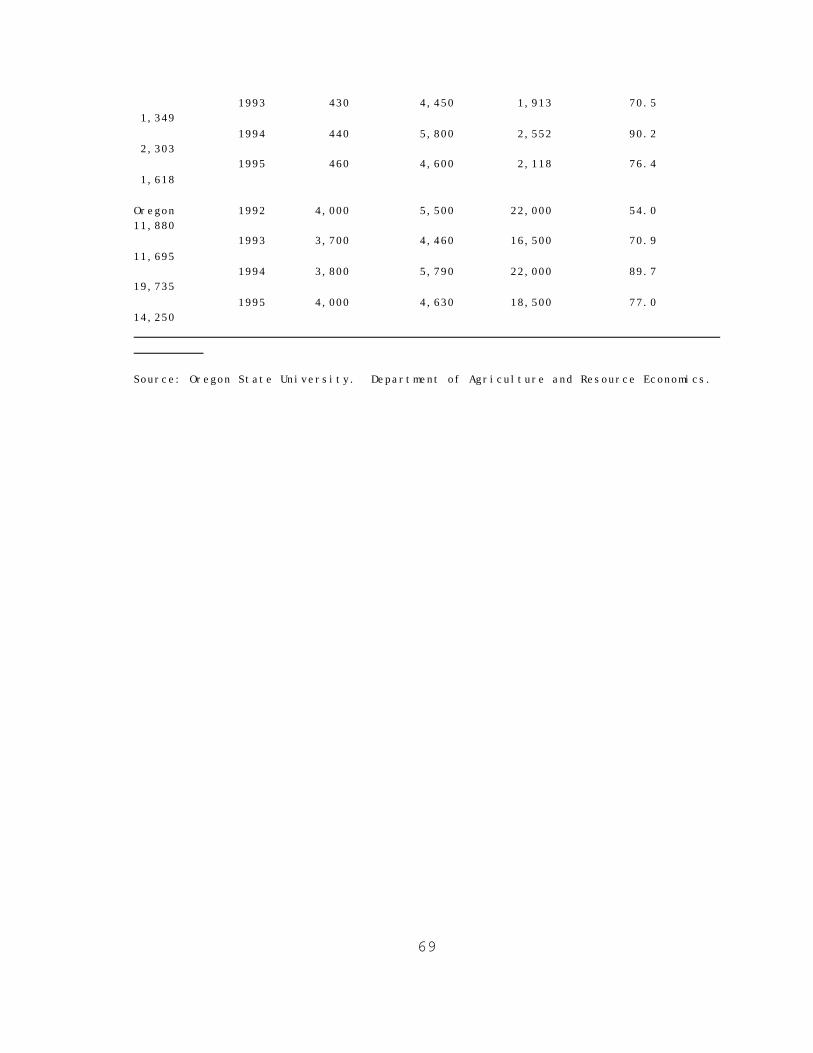
69
1993 430 4,450 1,913 70.5 1,349 1994 440 5,800 2,552 90.2 2,303 1995 460 4,600 2,118 76.4 1,618
Oregon 1992 4,000 5,500 22,000 54.0 11,880 1993 3,700 4,460 16,500 70.9 11,695 1994 3,800 5,790 22,000 89.7 19,735 1995 4,000 4,630 18,500 77.0 14,250
Source: Oregon State University. Department of Agriculture and Resource Economics.
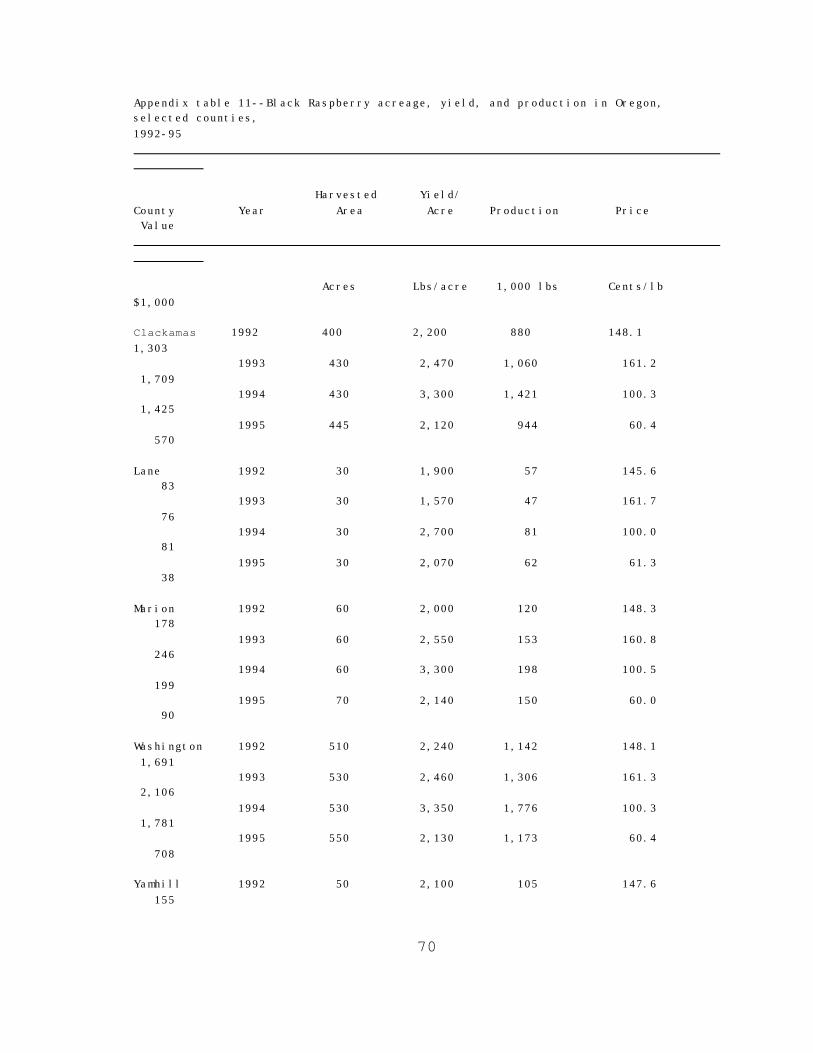
70
Appendix table 11--Black Raspberry acreage, yield, and production in Oregon,selected counties, 1992-95
Harvested Yield/ County Year Area Acre Production Price Value
Acres Lbs/acre 1,000 lbs Cents/lb $1,000
Clackamas 1992 400 2,200 880 148.1 1,303 1993 430 2,470 1,060 161.2 1,709 1994 430 3,300 1,421 100.3 1,425 1995 445 2,120 944 60.4 570
Lane 1992 30 1,900 57 145.6 83 1993 30 1,570 47 161.7 76 1994 30 2,700 81 100.0 81 1995 30 2,070 62 61.3 38
Marion 1992 60 2,000 120 148.3 178 1993 60 2,550 153 160.8 246 1994 60 3,300 198 100.5 199 1995 70 2,140 150 60.0 90
Washington 1992 510 2,240 1,142 148.1 1,691 1993 530 2,460 1,306 161.3 2,106 1994 530 3,350 1,776 100.3 1,781 1995 550 2,130 1,173 60.4 708
Yamhill 1992 50 2,100 105 147.6 155
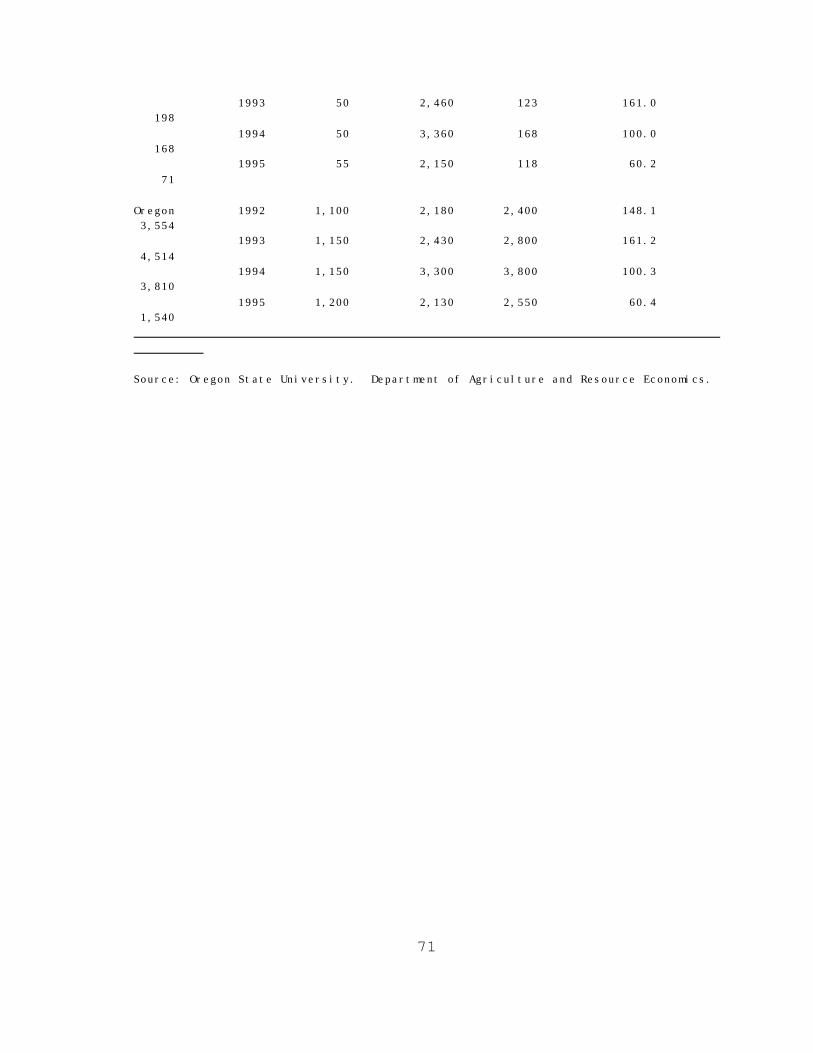
71
1993 50 2,460 123 161.0 198 1994 50 3,360 168 100.0 168 1995 55 2,150 118 60.2 71
Oregon 1992 1,100 2,180 2,400 148.1 3,554 1993 1,150 2,430 2,800 161.2 4,514 1994 1,150 3,300 3,800 100.3 3,810 1995 1,200 2,130 2,550 60.4 1,540
Source: Oregon State University. Department of Agriculture and Resource Economics.
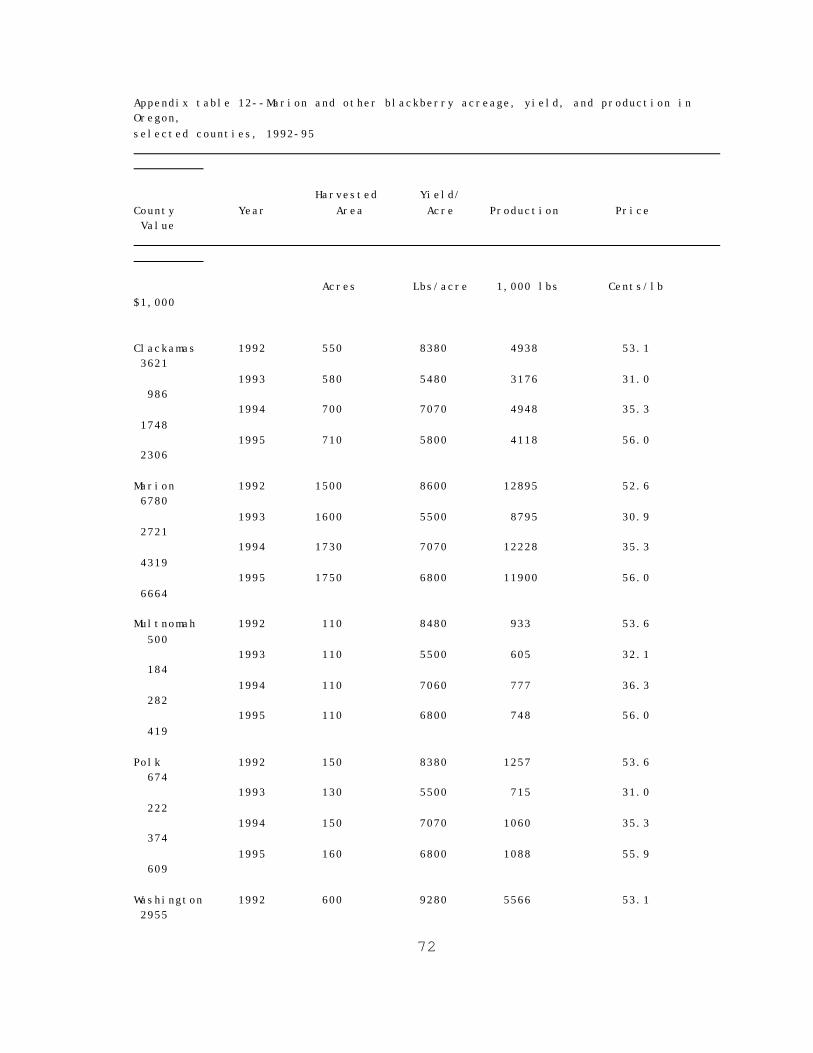
72
Appendix table 12--Marion and other blackberry acreage, yield, and production inOregon,selected counties, 1992-95
Harvested Yield/ County Year Area Acre Production Price Value
Acres Lbs/acre 1,000 lbs Cents/lb $1,000
Clackamas 1992 550 8380 4938 53.1 3621 1993 580 5480 3176 31.0 986 1994 700 7070 4948 35.3 1748 1995 710 5800 4118 56.0 2306
Marion 1992 1500 8600 12895 52.6 6780 1993 1600 5500 8795 30.9 2721 1994 1730 7070 12228 35.3 4319 1995 1750 6800 11900 56.0 6664
Multnomah 1992 110 8480 933 53.6 500 1993 110 5500 605 32.1 184 1994 110 7060 777 36.3 282 1995 110 6800 748 56.0 419
Polk 1992 150 8380 1257 53.6 674 1993 130 5500 715 31.0 222 1994 150 7070 1060 35.3 374 1995 160 6800 1088 55.9 609
Washington 1992 600 9280 5566 53.1 2955
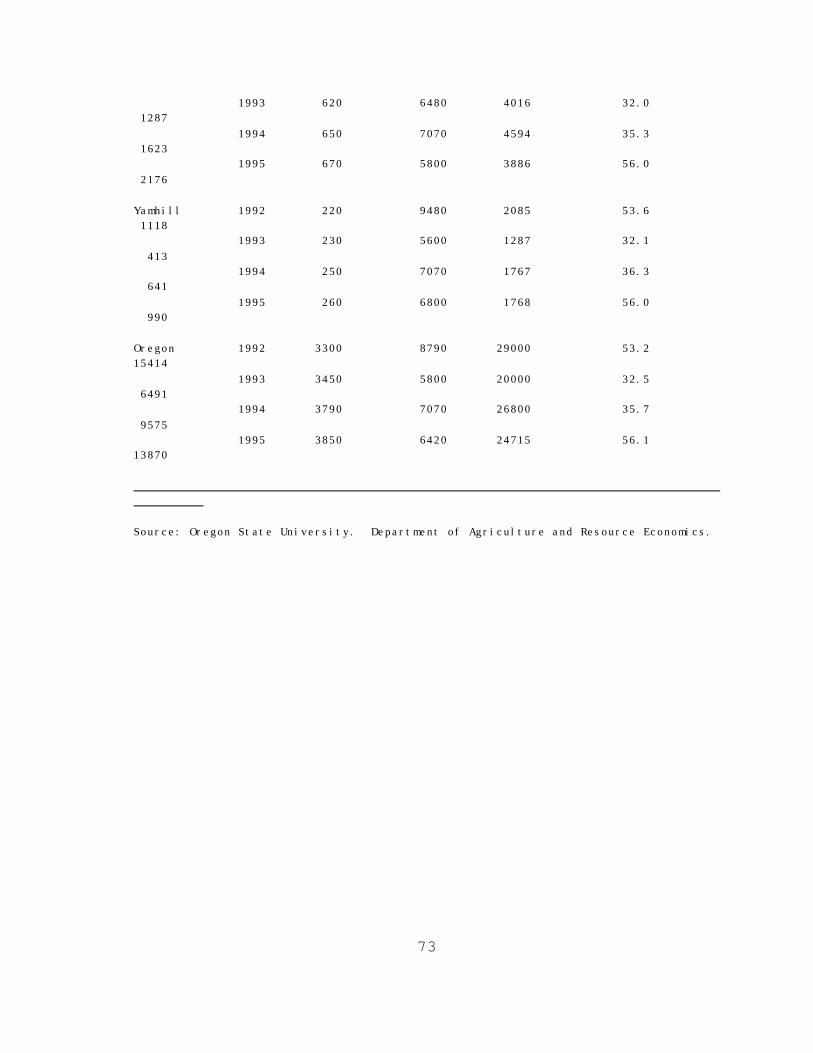
73
1993 620 6480 4016 32.0 1287 1994 650 7070 4594 35.3 1623 1995 670 5800 3886 56.0 2176
Yamhill 1992 220 9480 2085 53.6 1118 1993 230 5600 1287 32.1 413 1994 250 7070 1767 36.3 641 1995 260 6800 1768 56.0 990
Oregon 1992 3300 8790 29000 53.2 15414 1993 3450 5800 20000 32.5 6491 1994 3790 7070 26800 35.7 9575 1995 3850 6420 24715 56.1 13870
Source: Oregon State University. Department of Agriculture and Resource Economics.
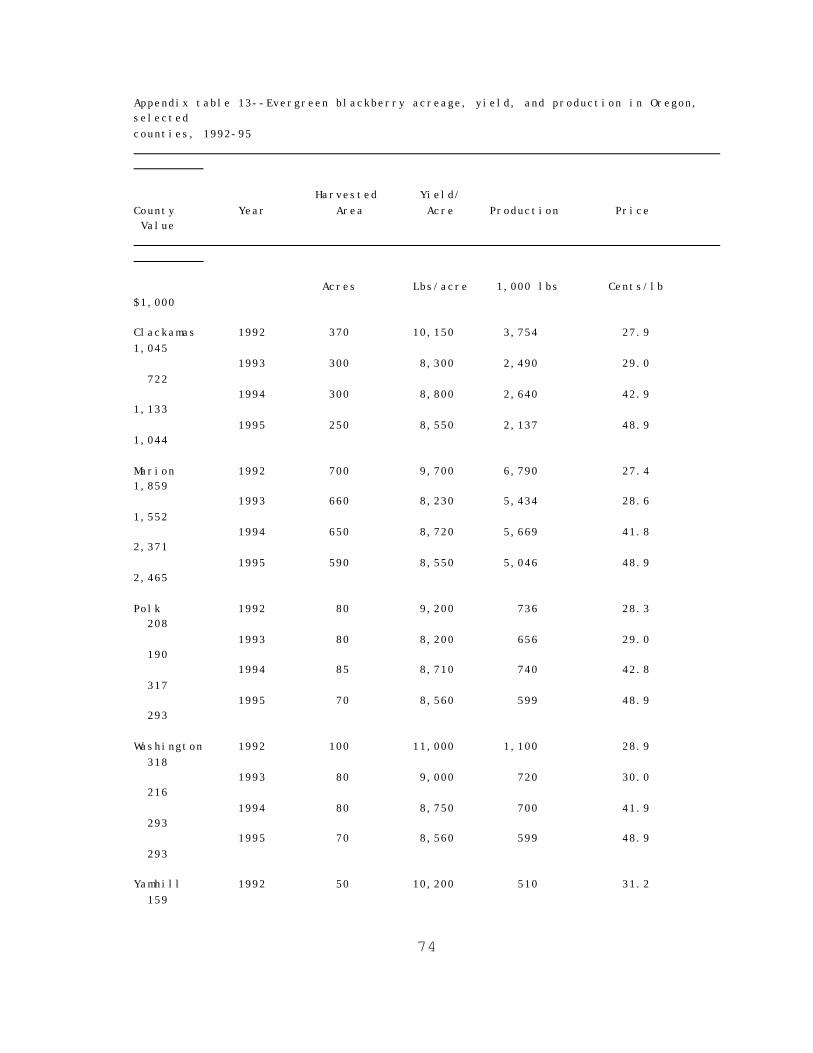
74
Appendix table 13--Evergreen blackberry acreage, yield, and production in Oregon,selected counties, 1992-95
Harvested Yield/ County Year Area Acre Production Price Value
Acres Lbs/acre 1,000 lbs Cents/lb $1,000
Clackamas 1992 370 10,150 3,754 27.9 1,045 1993 300 8,300 2,490 29.0 722 1994 300 8,800 2,640 42.9 1,133 1995 250 8,550 2,137 48.9 1,044
Marion 1992 700 9,700 6,790 27.4 1,859 1993 660 8,230 5,434 28.6 1,552 1994 650 8,720 5,669 41.8 2,371 1995 590 8,550 5,046 48.9 2,465
Polk 1992 80 9,200 736 28.3 208 1993 80 8,200 656 29.0 190 1994 85 8,710 740 42.8 317 1995 70 8,560 599 48.9 293
Washington 1992 100 11,000 1,100 28.9 318 1993 80 9,000 720 30.0 216 1994 80 8,750 700 41.9 293 1995 70 8,560 599 48.9 293
Yamhill 1992 50 10,200 510 31.2 159
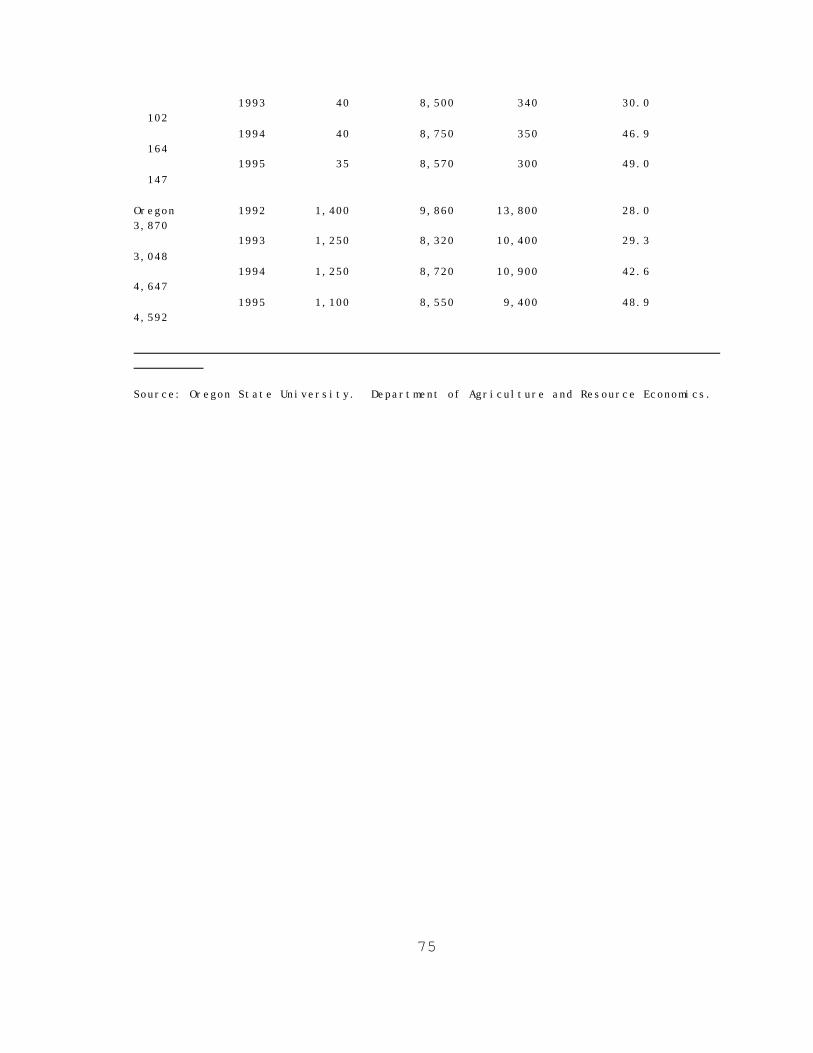
75
1993 40 8,500 340 30.0 102 1994 40 8,750 350 46.9 164 1995 35 8,570 300 49.0 147
Oregon 1992 1,400 9,860 13,800 28.0 3,870 1993 1,250 8,320 10,400 29.3 3,048 1994 1,250 8,720 10,900 42.6 4,647 1995 1,100 8,550 9,400 48.9 4,592
Source: Oregon State University. Department of Agriculture and Resource Economics.

76
Appendix table 14--Boysenberry acreage, yield, and production in Oregon, selectedcounties, 1992-95
Harvested Yield/ County Year Area Acre Production Price Value
Acres Lbs/acre 1,000 lbs Cents/lb $1,000
Clackamas 1992 180 6,200 1,116 65.2 728 1993 180 4,510 811 74.2 602 1994 220 5,040 1,108 63.0 698 1995 220 3,950 870 78.4 682
Marion 1992 520 5,800 3,016 65.3 1970 1993 510 4,420 2,255 74.8 1686 1994 580 5,030 2,919 62.5 1824 1995 580 3,960 2,296 78.3 1797
Multnomah 1992 70 6,100 427 65.1 278 1993 70 4,500 315 80.0 252 1994 70 5,030 352 66.8 235 1995 70 3,960 277 80.5 223
Washington 1992 90 7,570 681 65.1 443 1993 90 4,800 432 75.0 324 1994 120 5,530 664 63.0 418 1995 120 4,060 487 78.2 381
Yamhill 1992 100 7,000 700 65.0 455

77
1993 100 5,000 500 75.2 376 1994 130 5,030 654 63.0 412 1995 130 3,960 515 78.3 403
Oregon 1992 1000 6,150 6,150 65.5 4028 1993 1000 4,550 4,550 75.4 3429 1994 1200 5,080 6,100 63.2 3853 1995 1200 3,980 4,780 78.5 3750
Source: Oregon State University. Department of Agriculture and Resource Economics.
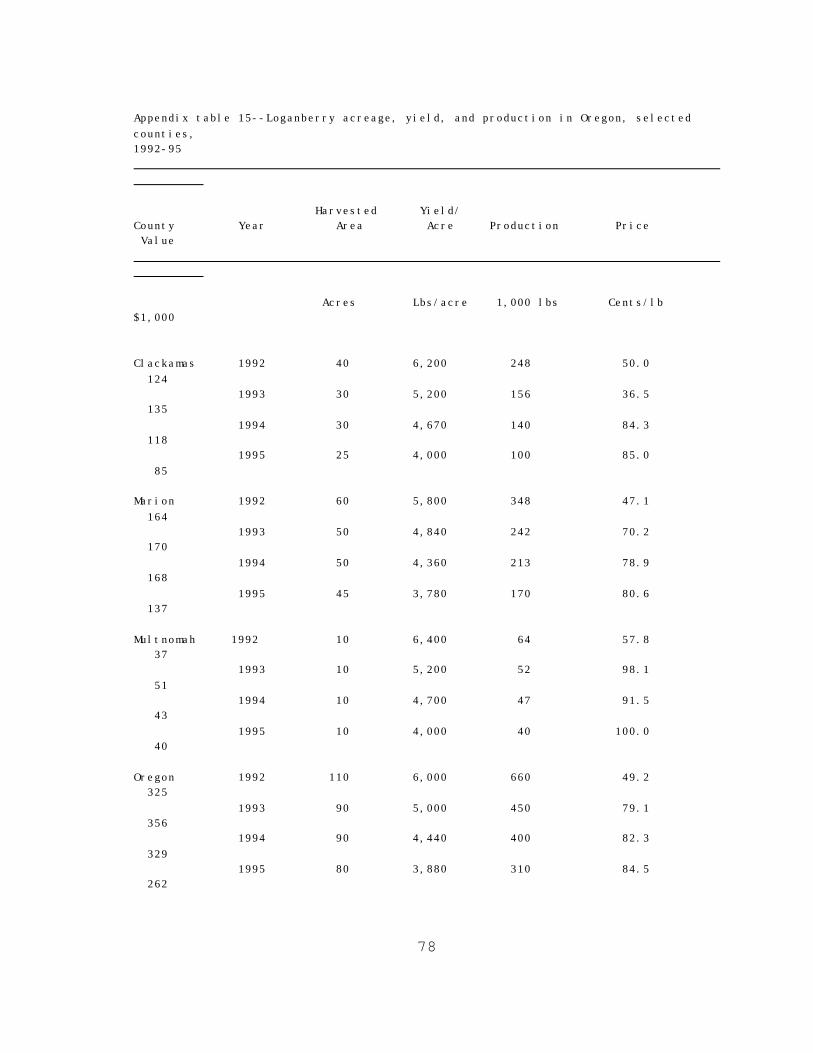
78
Appendix table 15--Loganberry acreage, yield, and production in Oregon, selectedcounties, 1992-95
Harvested Yield/ County Year Area Acre Production Price Value
Acres Lbs/acre 1,000 lbs Cents/lb $1,000
Clackamas 1992 40 6,200 248 50.0 124 1993 30 5,200 156 36.5 135 1994 30 4,670 140 84.3 118 1995 25 4,000 100 85.0 85
Marion 1992 60 5,800 348 47.1 164 1993 50 4,840 242 70.2 170 1994 50 4,360 213 78.9 168 1995 45 3,780 170 80.6 137
Multnomah 1992 10 6,400 64 57.8 37 1993 10 5,200 52 98.1 51 1994 10 4,700 47 91.5 43 1995 10 4,000 40 100.0 40
Oregon 1992 110 6,000 660 49.2 325 1993 90 5,000 450 79.1 356 1994 90 4,440 400 82.3 329 1995 80 3,880 310 84.5 262

79
Source: Oregon State University. Department of Agriculture and Resource Economics.

Appendix A
Selected Raspberry and Blackberry Cultivars Produced in the United States
(Sources: Crandall; Funt and others; Goulart and others.)

81
Red Raspberries
Amity: From Oregon. Primocane bearing, one to two weeks earlier than‘Heritage,’ vigorous, moderate production, some root rot resistance. Fruit: Medium size, very firm, medium dark red, good for processingand fresh market.
Autumn Bliss: From Great Britain. Primocane bearing, erect, two tothree weeks earlier and more productive than ‘Heritage,’ aphidresistant, root rot resistant. Fruit: Large, dark red, medium firm,mild flavor. Grown in Pacific Northwest. Recommended for thenortheastern U.S. on a trial basis.
Boyne: From Manitoba. Summer bearing, early-midseason, hardy,vigorous, sturdy, good yield. Fruit: Medium size, dark red,aromatic, only fair flavor. Canes susceptible to Verticillium wilt. A new hardy cultivar for the Midwest and northern states.
Chilliwack: From British Columbia. High yields, upright canes, manyprimocanes, long strong laterals, hardy, aphid resistant. Fruit:Large, conic, glossy medium red, firm, very good flavor, easy tomachine harvest, good for both fresh and processing markets. Promising new cultivar in Pacific Northwest.
Dorman Red: Grown in the South. Short chilling requirement. Fruit:Does not have the quality that the northern raspberries have, but isa raspberry adapted to the South.
Festival: From Ontario. Hardy, moderate yield, compact. Fruit: Medium size, firm, fair flavor. Newer, promising cultivar for theMidwest and northern United States. Recommended for trial only.
Heritage: From New York. Primocane bearing, vigorous, productive,upright, late season, widely adapted. Fruit: Medium size, attractivemedium red, firm, fair flavor, good for freezing. Limited to warmerclimates by its late ripening. Important primocane fruiting varietyin the Pacific Northwest and California. Also widely grown in theMidwest and Northeast.
Hilton: From New York. Summer bearing, vigorous, productive, mid-season, upright, winter hardy. Fruit: Large, conic, dark red, firmgood flavor. Newer variety in the Midwest and Northeast.
Killarney: From Canada. Summer bearing, hardy, sturdy canes. Fruit:deep red, firm, sweet, good quality. Newer variety being grown inthe Midwest on a trial basis.
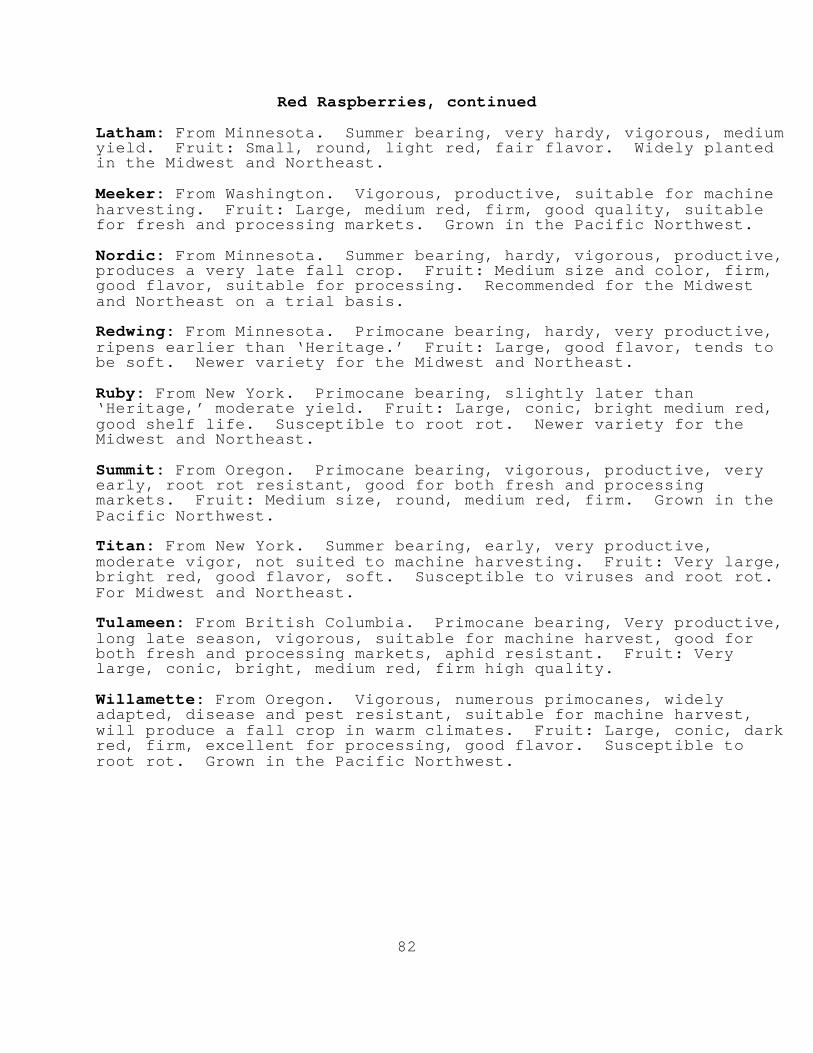
82
Red Raspberries, continued
Latham: From Minnesota. Summer bearing, very hardy, vigorous, mediumyield. Fruit: Small, round, light red, fair flavor. Widely plantedin the Midwest and Northeast.
Meeker: From Washington. Vigorous, productive, suitable for machineharvesting. Fruit: Large, medium red, firm, good quality, suitablefor fresh and processing markets. Grown in the Pacific Northwest.
Nordic: From Minnesota. Summer bearing, hardy, vigorous, productive,produces a very late fall crop. Fruit: Medium size and color, firm,good flavor, suitable for processing. Recommended for the Midwestand Northeast on a trial basis.
Redwing: From Minnesota. Primocane bearing, hardy, very productive,ripens earlier than ‘Heritage.’ Fruit: Large, good flavor, tends tobe soft. Newer variety for the Midwest and Northeast.
Ruby: From New York. Primocane bearing, slightly later than‘Heritage,’ moderate yield. Fruit: Large, conic, bright medium red,good shelf life. Susceptible to root rot. Newer variety for theMidwest and Northeast.
Summit: From Oregon. Primocane bearing, vigorous, productive, veryearly, root rot resistant, good for both fresh and processingmarkets. Fruit: Medium size, round, medium red, firm. Grown in thePacific Northwest.
Titan: From New York. Summer bearing, early, very productive,moderate vigor, not suited to machine harvesting. Fruit: Very large,bright red, good flavor, soft. Susceptible to viruses and root rot. For Midwest and Northeast.
Tulameen: From British Columbia. Primocane bearing, Very productive,long late season, vigorous, suitable for machine harvest, good forboth fresh and processing markets, aphid resistant. Fruit: Verylarge, conic, bright, medium red, firm high quality.
Willamette: From Oregon. Vigorous, numerous primocanes, widelyadapted, disease and pest resistant, suitable for machine harvest,will produce a fall crop in warm climates. Fruit: Large, conic, darkred, firm, excellent for processing, good flavor. Susceptible toroot rot. Grown in the Pacific Northwest.

83
Black Raspberries
Allen: From New York. Vigorous, intermediate hardiness, medium yield,early, concentrated crop. Fruit: Large, firm, good quality. Susceptible to anthracnose. Recommended for the Midwest andNortheast.
Blackhawk: From Iowa. Vigorous, medium yields, hardy, late,resistant to anthracnose. Fruit: Large, firm, good quality. Recommended for the Midwest and Northeast.
Bristol: From New York. Very popular, productive, early. Fruit:Large, firm glossy black, medium size, good quality. Susceptible toanthracnose. Recommended for the Midwest and Northeast.
Cumberland: From Pennsylvania. Older cultivar, late, fair yield,midseason, susceptible to anthracnose, Lacks hardiness. Fruit:Large, firm, good quality. Recommended for the Midwest andNortheast.
Jewel: From New York. Early, productive, vigorous, hardy, resistantto anthracnose. Fruit: Large, firm, glossy, excellent flavor.
Munger: From New York. Principal Oregon cultivar, early, suitablefor machine harvesting. Fruit: Medium size and yield, excellent forprocessing.
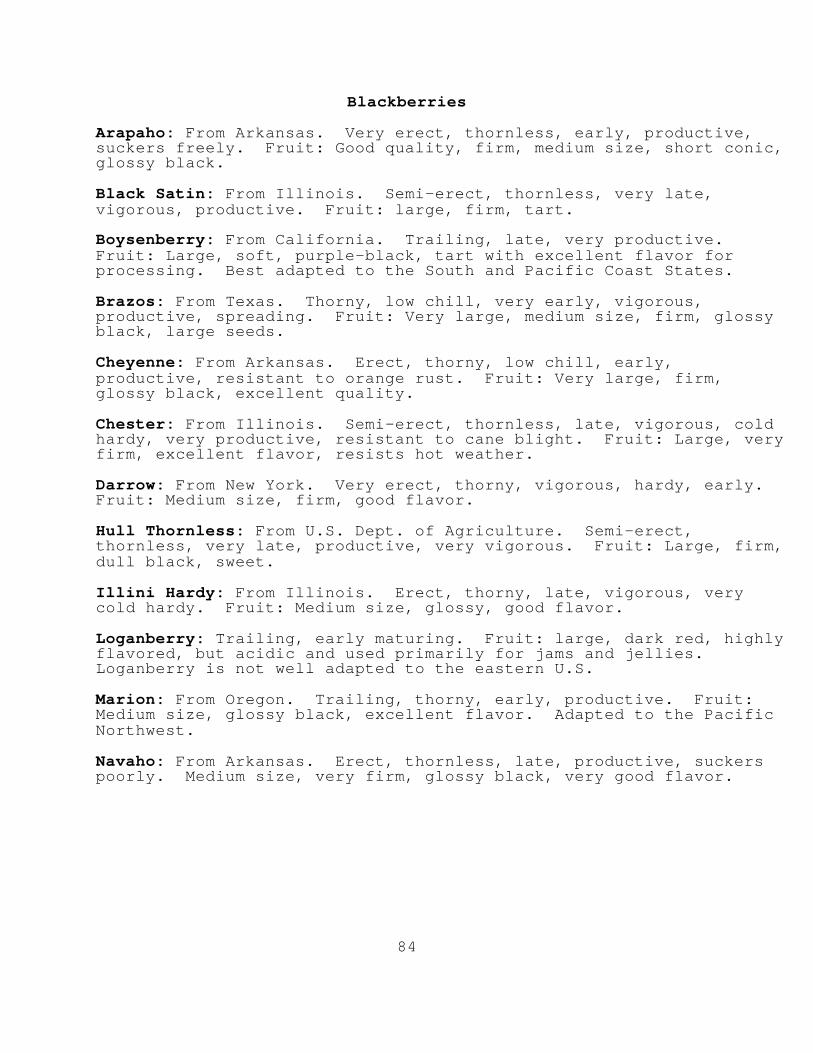
84
Blackberries
Arapaho: From Arkansas. Very erect, thornless, early, productive,suckers freely. Fruit: Good quality, firm, medium size, short conic,glossy black.
Black Satin: From Illinois. Semi-erect, thornless, very late,vigorous, productive. Fruit: large, firm, tart.
Boysenberry: From California. Trailing, late, very productive. Fruit: Large, soft, purple-black, tart with excellent flavor forprocessing. Best adapted to the South and Pacific Coast States.
Brazos: From Texas. Thorny, low chill, very early, vigorous,productive, spreading. Fruit: Very large, medium size, firm, glossyblack, large seeds.
Cheyenne: From Arkansas. Erect, thorny, low chill, early,productive, resistant to orange rust. Fruit: Very large, firm,glossy black, excellent quality.
Chester: From Illinois. Semi-erect, thornless, late, vigorous, coldhardy, very productive, resistant to cane blight. Fruit: Large, veryfirm, excellent flavor, resists hot weather.
Darrow: From New York. Very erect, thorny, vigorous, hardy, early. Fruit: Medium size, firm, good flavor.
Hull Thornless: From U.S. Dept. of Agriculture. Semi-erect,thornless, very late, productive, very vigorous. Fruit: Large, firm,dull black, sweet.
Illini Hardy: From Illinois. Erect, thorny, late, vigorous, verycold hardy. Fruit: Medium size, glossy, good flavor.
Loganberry: Trailing, early maturing. Fruit: large, dark red, highlyflavored, but acidic and used primarily for jams and jellies. Loganberry is not well adapted to the eastern U.S.
Marion: From Oregon. Trailing, thorny, early, productive. Fruit:Medium size, glossy black, excellent flavor. Adapted to the PacificNorthwest.
Navaho: From Arkansas. Erect, thornless, late, productive, suckerspoorly. Medium size, very firm, glossy black, very good flavor.

85
Blackberries, continued
Olallieberry: From Oregon. Trailing, thorny, vigorous, midseason,very productive. Fruit: Large, firm, glossy black, good flavor. Adapted to California and western Oregon.
Rosborough: From Texas. Erect, thorny, early, very productive, lowchill. Fruit: Very large, sweet, glossy black.
Shawnee: From Arkansas. Erect, thorny, very productive, late, Immuneto orange rust. Fruit: Very large, medium firm, good flavor. Adapted to the southern United States.
Silvan: From Australia. Trailing, thornless, late, vigorous, veryproductive, machine harvestable. Fruit: Large, glossy purple-black,good flavor, sweet, suitable for both fresh and processing markets.
Thornless Evergreen: From Oregon. Trailing, thornless, late,vigorous, very productive, machine harvestable. Fruit: Large, glossyblack, fair flavor. The most widely grown blackberry in the PacificNorthwest.
Waldo: From Oregon. Trailing, thornless, mid-early, high yield,machine harvestable. Fruit: Large, firm, glossy black, multipurpose,good shelf life.

Appendix B
Cost of Production Budgets
Santa Cruz County, California Raspberries(Willamette and Heritage)
Willamette Valley Region, Oregon Red Raspberries (Processing)
Michigan Red Raspberries (Pick-Your-Own)
Oregon Marion Blackberries (Every-year and Alternate-Year Production)
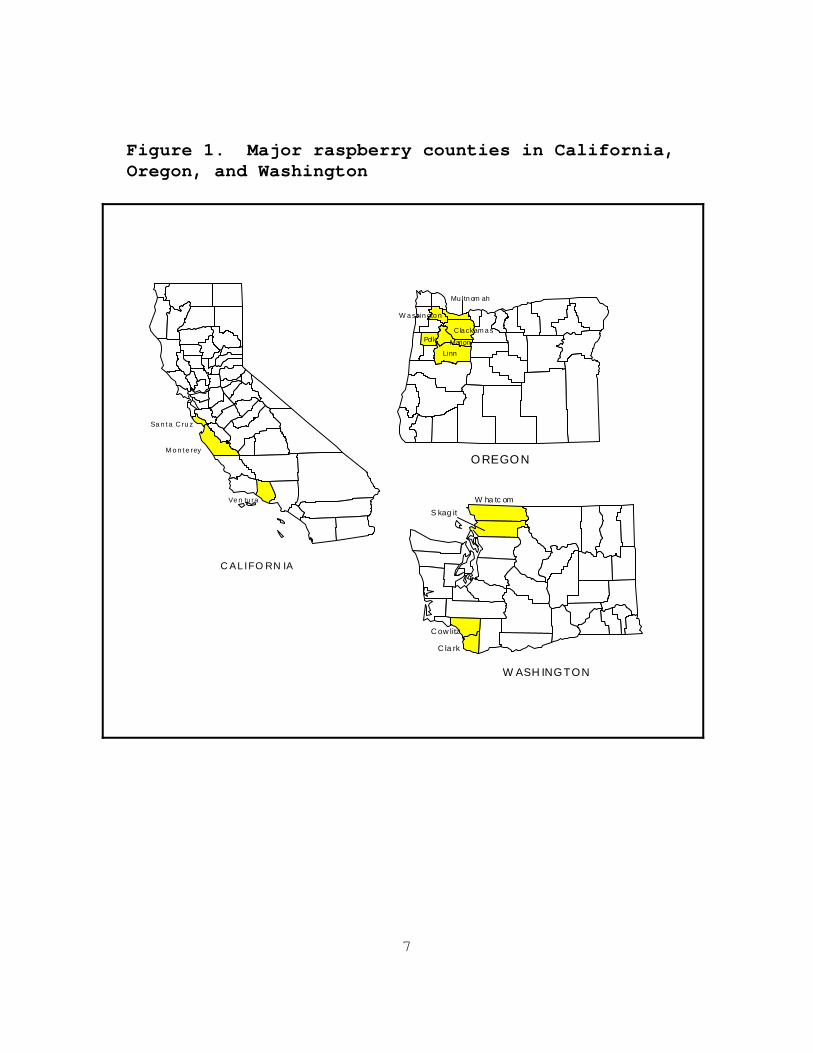
7
Sa n t a C ru z
M o n t e rey
Ve n tu ra
C AL IFO RN IA
W a shin gto n
Mu ltn om ah
C la ckam a s
MarionPolk
Linn
OREGON
W ha tc om
S kag it
C ow litz
C la rk
W ASH INGTON
Figure 1. Major raspberry counties in California,Oregon, and Washington

8
Santa Cruz
CALIFORNIA
WashingtonClackam as
Mari on
OREGON
Figure 2. Major blackberry counties in California and Oregon
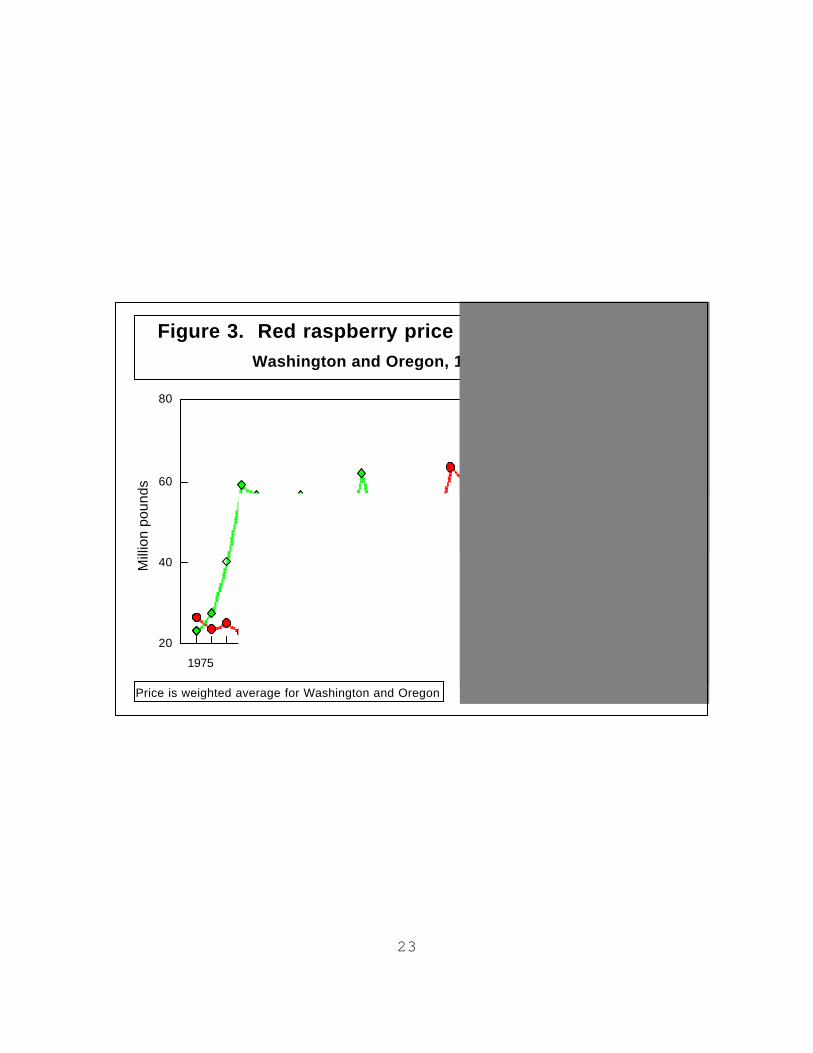
23
20
40
60
80
20
40
60
80
100
Mill
ion
poun
ds
Cen
ts p
er p
ound
1975 1980 1985 1990 1995
Production
Price
Figure 3. Red raspberry price and productionWashington and Oregon, 1975-95
Price is weighted average for Washington and Oregon
Raspberry and Blackberry Contacts
California
Larry Bettiga, Farm AdvisorMonterey County, California
(408) 759-7350
Oregon
Jan Schroeder, Executive SecretaryOregon Raspberry and Blackberry Commission
712 NW 4th StreetCorvallis, Oregon 97330
(541) 758-4043
Washington
Ann Seeger, ManagerWashington Red Raspberry Commission
1323 Lincoln Street #204Bellingham, Washington 98226
(306) 671-1437
Craig McConnellWhatcom County Extension Service
Courthouse Annex1000 North Forest
Bellingham Washington 98226(360) 676-6736