Embed Size (px)
Citation preview
Neurobiology of Aging 33 (2012) 510–517
Brain iron deposits are associated with general cognitiveability and cognitive aging
Lars Penkea,b,c,1,*, Maria C. Valdés Hernandézb,1, Susana Muñoz Maniegab,c, Alan J. Gowa,b,Catherine Murraya, John M. Starra,d, Mark E. Bastinb,c,e, Ian J. Dearya,b,c,1,
Joanna M. Wardlawb,c,1
a Department of Psychology, The University of Edinburgh, Edinburgh, United Kingdomb Centre for Cognitive Aging and Cognitive Epidemiology, The University of Edinburgh, Edinburgh, United Kingdom
c SINAPSE Collaboration, SFC Brain Imaging Research Centre, Department of Clinical Neurosciences, The University of Edinburgh, Western GeneralHospital, Edinburgh, United Kingdom
d Geriatric Medicine Unit, The University of Edinburgh, Edinburgh, United Kingdome Department of Medical and Radiological Sciences (Medical Physics), The University of Edinburgh, Edinburgh, United Kingdom
Received 20 November 2009; received in revised form 26 March 2010; accepted 27 April 2010
Abstract
A novel analysis of magnetic resonance imaging (MRI) scans based on multispectral image fusion was used to quantify iron deposits inbasal ganglia and microbleeds in 143 nondemented subjects of the generally healthy Lothian Birth Cohort, who were tested for generalcognitive ability (intelligence) at mean ages of 11, 70, and 72 years. Possessing more iron deposits at age 72 was significantly associatedwith lower general cognitive ability at age 11, 70, and 72, explaining 4% to 9% of the variance. The relationships with old age generalcognitive ability remained significant after controlling for childhood cognition, suggesting that iron deposits are related to lifetime cognitivedecline. Most iron deposits were in the basal ganglia, with few microbleeds. While iron deposits in the general population have so far beendismissed in the literature, our results show substantial associations with cognitive functioning. The pattern of results suggests that irondeposits are not only a biomarker of general cognitive ability in old age and age-related cognitive decline, but that they are also related tothe lifelong-stable trait of intelligence.© 2012 Elsevier Inc. All rights reserved.
Keywords: Cognitive aging; Intelligence; General cognitive ability; Iron; Hemosiderin; Basal ganglia; Cognition; MRI
www.elsevier.com/locate/neuaging
1. Introduction
Maintaining cognitive functions in old age is importantin an aging society. Whereas some age-related cognitivedecline is normative, there are large individual differencesin its severity (Hedden and Gabrieli, 2004). At all ages,individuals who perform better on 1 type of cognitive ability
* Corresponding author at: Centre for Cognitive Aging and CognitiveEpidemiology, Department of Psychology, The University of Edinburgh, 7George Square, Edinburgh EH8 9JZ, United Kingdom. Tel.: �44 1316508482; fax: �44 131 6511771.
E-mail address: [email protected] (L. Penke).
1 These authors contributed equally to the work.0197-4580/$ – see front matter © 2012 Elsevier Inc. All rights reserved.doi:10.1016/j.neurobiolaging.2010.04.032
test tend also to perform above average in a broad variety ofother types of cognitive ability tests. Underlying this is acommon factor of general cognitive ability (also calledgeneral intelligence or “g”) that explains about 50% of theindividual differences in the performance of diverse cogni-tive tests and is largely equivalent to the intelligence quo-tient (IQ) that broad cognitive batteries provide (Deary etal., 2010; Jensen, 1998; Jung and Haier, 2007). Normative(nonpathological) age-related cognitive decline tends tomostly affect this common factor and, to a lesser extent, theunique variance of some specific cognitive abilities (Salt-house and Czaja, 2000).
The biological factors underlying normal cognitive aging
have been nominated as a priority for public health research
511L. Penke et al. / Neurobiology of Aging 33 (2012) 510–517
(Deary et al., 2009), yet they remain largely unclear. Cere-bral small vessel dysfunction may explain some age-relatedcognitive decline (Waldstein et al., 2001). Most studies ofvascular dysfunction and cognition have focused on whitematter lesions seen on brain imaging, but their effect ap-pears to be modest (Frisoni et al., 2007). There are otherimportant markers of small vessel impairment, such as brainmicrobleeds. These are increased in individuals with cere-bral small vessel disease, but are also found in about 5% ofotherwise healthy older adults (Cordonnier et al., 2007).Microbleeds are small focal microhemorrhages that leaveresidual iron deposits (IDs), mainly as the insoluble oxyhy-droxide of hemosiderin, in lobar white matter, the basalganglia, and internal capsule (Casanova and Araque, 2003;Cordo—nnier et al., 2007; Harder et al., 2008). Microbleedsappear as hypointense round dots on T2*-weighted mag-netic resonance imaging (MRI) scans and are associatedwith hypertension, amyloid angiopathy, future risk of strokeand, when frequent, with cognitive impairment (Cordonnieret al., 2007). Other forms of IDs also appear in the basalganglia where the lenticulostriate arteries enter the brainsubstance. These basal ganglia IDs increase in prevalenceand extent with increasing age, correspond with increasedattenuation on computed tomography (CT) scanning andhence were assumed to be calcium. Basal ganglia IDs aregenerally regarded as asymptomatic physiological conse-quences of aging, and consequently, unless present to asevere degree, have been ignored (Bartzokis et al., 2007;Casanova and Araque, 2003). However, detailed histopa-thology shows that these mineral deposits are closely relatedto small blood vessels and show staining properties predom-inantly of iron, although a small proportion of calcium maybe present (Casanova and Araque, 2003; Slager and Wag-ner, 1956; Yao et al., 2009). Their association with agingdifferences in the normal range has rarely been studied(Bartzokis et al., 2007) and relationships with cognitivedifferences have so far only been tested for a few specificcognitive tasks in 2 rather exploratory samples (Pujol et al.,1992; Sullivan et al., 2009). Reports of relationships be-tween IDs and differences in normal cognitive aging — apotential precursor of and contributor to pathological cog-nitive decline (Hedden and Gabrieli, 2004) — are absentfrom the literature. We tested the potential role of accumu-lated brain IDs as a biomarker of lower normal range gen-eral cognitive ability and age-related cognitive decline in ahealthy elderly cohort on whom childhood general cognitiveability scores were available.
2. Methods
2.1. Subjects
The sample of this study was composed of 147 membersof the Lothian Birth Cohort (1936; Deary et al., 2007). Fourparticipants were excluded from further analyses because
they showed signs of dementia or minor cognitive impair-ment (self-reported medical history and/or Mini MentalState Examination [Folstein et al., 1975] scores below 24).Thus the size of the final sample was 143 (74 women, 69men). Unique advantages of this sample are the availabilityof cognitive test scores over a period of more than 6 decades(see below) and a very narrow age range (71 to 72 years;mean, 71.9; SD, 0.3), which is desirable for studies ofindividual differences in cognitive aging (Hofer and Sliwin-ski, 2001). Their years of full-time education ranged be-tween 9 and 20, with the average and median being 11.0years (SD, 1.4 years). All were Caucasian and lived inde-pendently in the community. Written informed consent wasobtained from all participants under protocols approved bythe National Health Service ethic committees (MREC andLREC).
2.2. Neuroimaging
Brain images were obtained at age 72 from a GE SignaLX 1.5 T MRI clinical scanner using a self-shielding gra-dient set with maximum gradient strength of 33 mT/m, andan 8-channel head array coil in the SFC Brain ImagingResearch Centre, University of Edinburgh (www.sbirc.e-d.ac.uk). The relaxation and echo times (TR and TE) of thesequences scanned for each image modality were 9.8/4 msfor T1-weighted (T1W), 11,320/104.9 ms for T2-weighted(T2W), 940/15 ms for T2*-weighted (T2* W) and 9,002/147.38 ms for fluid-attenuated inversion recovery (FLAIR)images.
2.3. Cognitive testing
The participants underwent cognitive testing at 3 timepoints. General cognitive ability was assessed at all 3 timepoints using 2 different measures: First, the Moray HouseTest number 12 (MHT), a measure of general cognitiveability or IQ, had been administered when participants were11 years old as part of the Scottish Mental Survey of 1947(Scottish Council for Research in Education, 1949). Thesame test was readministered in this sample during a fol-low-up at a mean age of almost 70 years, using the sameinstructions and the same 45-minute time limit. The psy-chometric quality of the MHT has been established byDeary et al. (2004). Second, at a further follow-up at a meanage of 72 years, 6 subtests from the Wechsler Adult Intel-ligence Scale — Wais-IIIUK — were administered: SymbolSearch, Digit Symbol, Matrix Reasoning, Letter-NumberSequencing, Digit Span Backwards, and Block Design(Wechsler, 1998). Only the first unrotated principal compo-nent was extracted from these 6 subtests. It explained 48.9%of the variance, with all 6 subtests showing strong loadingsbetween 0.63 and 0.76, and is interpreted as the generalcognitive ability factor, which is well established in thepsychometric literature (Deary et al., 2010; Jensen, 1998).In addition, the participants completed 2 reading recogni-tion tests as measures of prior or premorbid general cogni-
tive ability at age 72, the National Adult Reading Test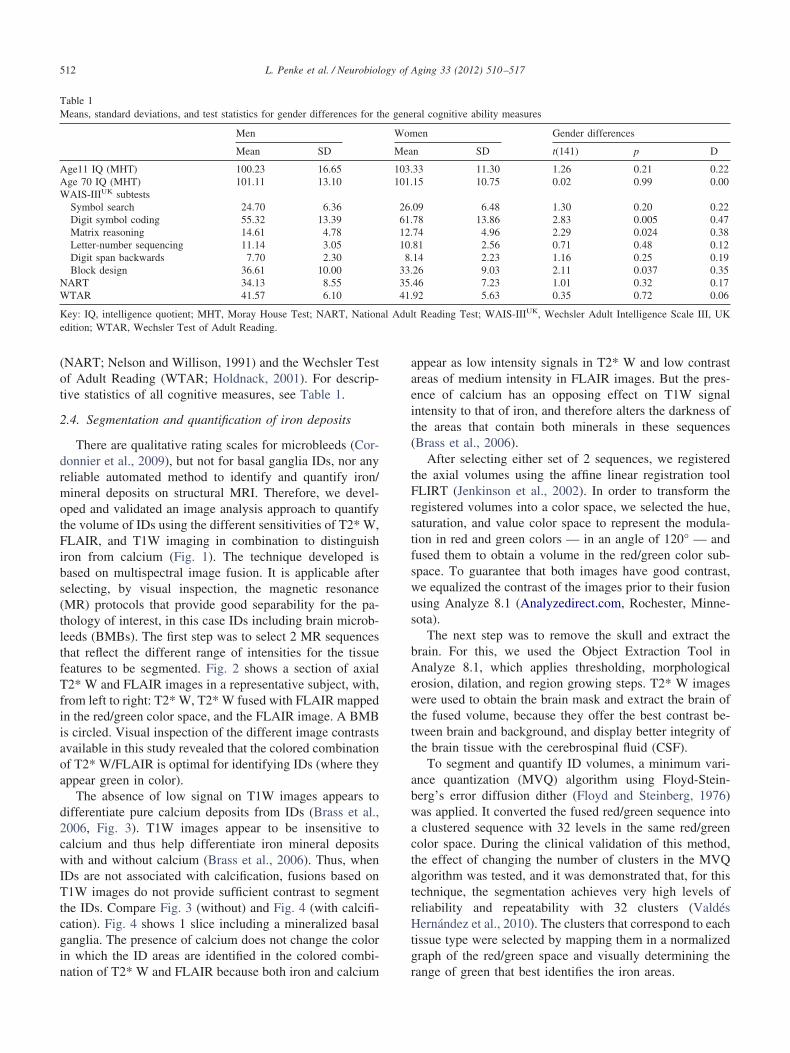
AAW
NW
Ke
512 L. Penke et al. / Neurobiology of Aging 33 (2012) 510–517
(NART; Nelson and Willison, 1991) and the Wechsler Testof Adult Reading (WTAR; Holdnack, 2001). For descrip-tive statistics of all cognitive measures, see Table 1.
2.4. Segmentation and quantification of iron deposits
There are qualitative rating scales for microbleeds (Cor-donnier et al., 2009), but not for basal ganglia IDs, nor anyreliable automated method to identify and quantify iron/mineral deposits on structural MRI. Therefore, we devel-oped and validated an image analysis approach to quantifythe volume of IDs using the different sensitivities of T2* W,FLAIR, and T1W imaging in combination to distinguishiron from calcium (Fig. 1). The technique developed isbased on multispectral image fusion. It is applicable afterselecting, by visual inspection, the magnetic resonance(MR) protocols that provide good separability for the pa-thology of interest, in this case IDs including brain microb-leeds (BMBs). The first step was to select 2 MR sequencesthat reflect the different range of intensities for the tissuefeatures to be segmented. Fig. 2 shows a section of axialT2* W and FLAIR images in a representative subject, with,from left to right: T2* W, T2* W fused with FLAIR mappedin the red/green color space, and the FLAIR image. A BMBis circled. Visual inspection of the different image contrastsavailable in this study revealed that the colored combinationof T2* W/FLAIR is optimal for identifying IDs (where theyappear green in color).
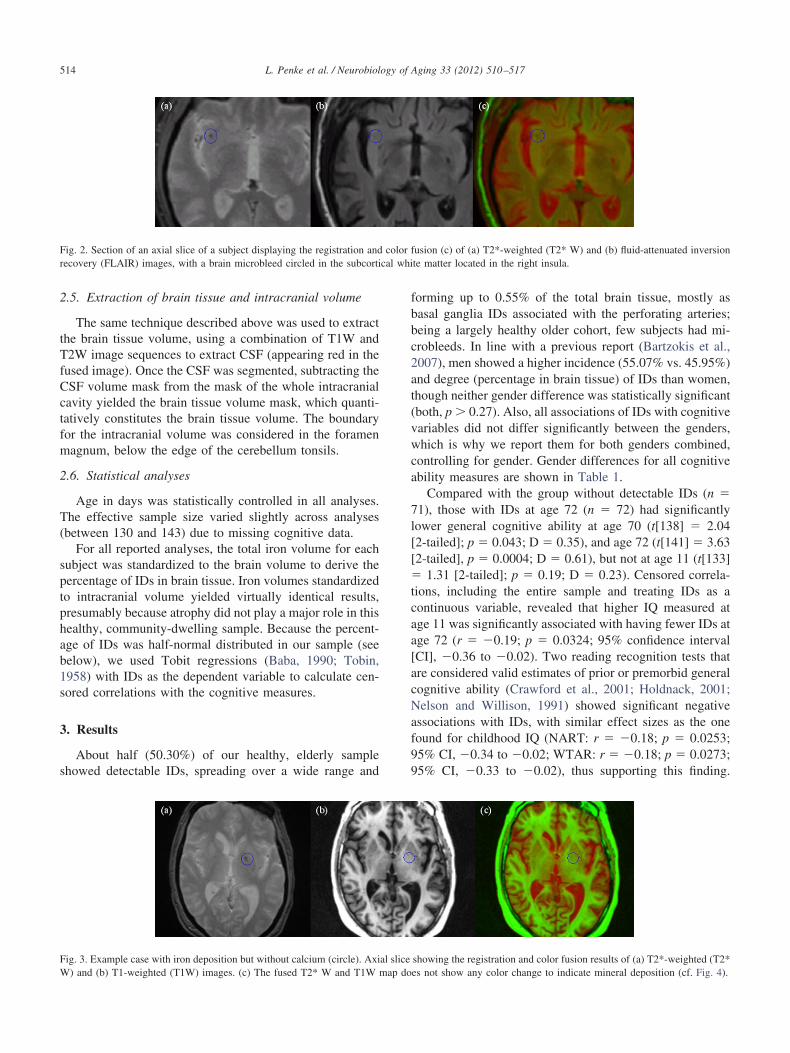
The absence of low signal on T1W images appears todifferentiate pure calcium deposits from IDs (Brass et al.,2006, Fig. 3). T1W images appear to be insensitive tocalcium and thus help differentiate iron mineral depositswith and without calcium (Brass et al., 2006). Thus, whenIDs are not associated with calcification, fusions based onT1W images do not provide sufficient contrast to segmentthe IDs. Compare Fig. 3 (without) and Fig. 4 (with calcifi-cation). Fig. 4 shows 1 slice including a mineralized basalganglia. The presence of calcium does not change the colorin which the ID areas are identified in the colored combi-
Table 1Means, standard deviations, and test statistics for gender differences for t
Men
Mean SD
ge11 IQ (MHT) 100.23 16.65ge 70 IQ (MHT) 101.11 13.10AIS-IIIUK subtestsSymbol search 24.70 6.36Digit symbol coding 55.32 13.39Matrix reasoning 14.61 4.78Letter-number sequencing 11.14 3.05Digit span backwards 7.70 2.30Block design 36.61 10.00
ART 34.13 8.55TAR 41.57 6.10
ey: IQ, intelligence quotient; MHT, Moray House Test; NART, Nationdition; WTAR, Wechsler Test of Adult Reading.
nation of T2* W and FLAIR because both iron and calcium
appear as low intensity signals in T2* W and low contrastareas of medium intensity in FLAIR images. But the pres-ence of calcium has an opposing effect on T1W signalintensity to that of iron, and therefore alters the darkness ofthe areas that contain both minerals in these sequences(Brass et al., 2006).
After selecting either set of 2 sequences, we registeredthe axial volumes using the affine linear registration toolFLIRT (Jenkinson et al., 2002). In order to transform theregistered volumes into a color space, we selected the hue,saturation, and value color space to represent the modula-tion in red and green colors — in an angle of 120° — andfused them to obtain a volume in the red/green color sub-space. To guarantee that both images have good contrast,we equalized the contrast of the images prior to their fusionusing Analyze 8.1 (Analyzedirect.com, Rochester, Minne-sota).
The next step was to remove the skull and extract thebrain. For this, we used the Object Extraction Tool inAnalyze 8.1, which applies thresholding, morphologicalerosion, dilation, and region growing steps. T2* W imageswere used to obtain the brain mask and extract the brain ofthe fused volume, because they offer the best contrast be-tween brain and background, and display better integrity ofthe brain tissue with the cerebrospinal fluid (CSF).
To segment and quantify ID volumes, a minimum vari-ance quantization (MVQ) algorithm using Floyd-Stein-berg’s error diffusion dither (Floyd and Steinberg, 1976)was applied. It converted the fused red/green sequence intoa clustered sequence with 32 levels in the same red/greencolor space. During the clinical validation of this method,the effect of changing the number of clusters in the MVQalgorithm was tested, and it was demonstrated that, for thistechnique, the segmentation achieves very high levels ofreliability and repeatability with 32 clusters (ValdésHernández et al., 2010). The clusters that correspond to eachtissue type were selected by mapping them in a normalizedgraph of the red/green space and visually determining the
ral cognitive ability measures
en Gender differences
n SD t(141) p D
33 11.30 1.26 0.21 0.2215 10.75 0.02 0.99 0.00
09 6.48 1.30 0.20 0.2278 13.86 2.83 0.005 0.4774 4.96 2.29 0.024 0.3881 2.56 0.71 0.48 0.1214 2.23 1.16 0.25 0.1926 9.03 2.11 0.037 0.3546 7.23 1.01 0.32 0.1792 5.63 0.35 0.72 0.06
t Reading Test; WAIS-IIIUK, Wechsler Adult Intelligence Scale III, UK
he gene
Wom
Mea
103.101.
26.61.12.10.8.
33.35.41.
al Adul
range of green that best identifies the iron areas.

513L. Penke et al. / Neurobiology of Aging 33 (2012) 510–517
We named this technique MCMxxxVI (see supplemen-tary Fig. 1). This stands for Multispectral Coloring Modu-lation and Variance Identification, and incorporates thenumber “1936” represented in roman numerals, reflectingour study sample, the Lothian Birth Cohort (1936; Deary etal., 2007). A detailed derivation of this technique, clinicalvalidation results, and its comparison with the commonlyused thresholding technique can be found in Valdés Hernán-dez et al. (2010).
This technique does not discriminate between differ-ent types of iron content. As a result, some vessels may
Fig. 1. Three cases (a, b, c) illustrating different types of iron deposits (ID(T2* W) and fluid-attenuated inversion recovery (FLAIR) to the red and gafter spatial registration. Second column: ID masked in blue on a sectiocorresponding sections in T2* W (above) and T1-weighted (T1W; below) fganglia IDs without calcium. Case (c) shows small basal ganglia IDs withappear hypointense on T1W, while areas with only hemosiderin deposits ain case [a]) or iron are hypointense on T2* W.
appear selected in the automatic segmentation process.
For this reason, a postprocessing manual step to removethe areas not considered to contain IDs and BMBs wasrequired.
In the absence of an established and validated visualmethod for quantifying brain IDs in addition to BMBs, wedeveloped a simple visual rating scale to categorize theputaminal IDs, from none (0) to medium-high (4), based oncomparison with 4 standard cases (Fig. 5). This provided asimple method for describing the population that could beused to relate our population to those in other studies, in theabsence of any previous standardization of brain iron vol-
column: axial slice of a volume obtained from modulating T2*-weightedequency bands of the visible spectrum, respectively, and then their fusione first column image after extracting cerebrospinal fluid. Third column:case. Case (a) shows basal ganglia IDs with calcium. Case (b) shows basaland a microbleed in the left thalamus. Note that areas containing calcium
tected; all areas that contain calcium deposits (note the left choroid plexus
s). Firstreen frn of thor eachcalciumre unde
ume.
�tcaa[acNaf99
cal whi
514 L. Penke et al. / Neurobiology of Aging 33 (2012) 510–517
2.5. Extraction of brain tissue and intracranial volume
The same technique described above was used to extractthe brain tissue volume, using a combination of T1W andT2W image sequences to extract CSF (appearing red in thefused image). Once the CSF was segmented, subtracting theCSF volume mask from the mask of the whole intracranialcavity yielded the brain tissue volume mask, which quanti-tatively constitutes the brain tissue volume. The boundaryfor the intracranial volume was considered in the foramenmagnum, below the edge of the cerebellum tonsils.
2.6. Statistical analyses
Age in days was statistically controlled in all analyses.The effective sample size varied slightly across analyses(between 130 and 143) due to missing cognitive data.
For all reported analyses, the total iron volume for eachsubject was standardized to the brain volume to derive thepercentage of IDs in brain tissue. Iron volumes standardizedto intracranial volume yielded virtually identical results,presumably because atrophy did not play a major role in thishealthy, community-dwelling sample. Because the percent-age of IDs was half-normal distributed in our sample (seebelow), we used Tobit regressions (Baba, 1990; Tobin,1958) with IDs as the dependent variable to calculate cen-sored correlations with the cognitive measures.
3. Results
About half (50.30%) of our healthy, elderly sampleshowed detectable IDs, spreading over a wide range and
Fig. 2. Section of an axial slice of a subject displaying the registration andrecovery (FLAIR) images, with a brain microbleed circled in the subcorti
Fig. 3. Example case with iron deposition but without calcium (circle). Axi
W) and (b) T1-weighted (T1W) images. (c) The fused T2* W and T1W map doforming up to 0.55% of the total brain tissue, mostly asbasal ganglia IDs associated with the perforating arteries;being a largely healthy older cohort, few subjects had mi-crobleeds. In line with a previous report (Bartzokis et al.,2007), men showed a higher incidence (55.07% vs. 45.95%)and degree (percentage in brain tissue) of IDs than women,though neither gender difference was statistically significant(both, p � 0.27). Also, all associations of IDs with cognitivevariables did not differ significantly between the genders,which is why we report them for both genders combined,controlling for gender. Gender differences for all cognitiveability measures are shown in Table 1.
Compared with the group without detectable IDs (n �71), those with IDs at age 72 (n � 72) had significantlylower general cognitive ability at age 70 (t[138] � 2.04[2-tailed]; p � 0.043; D � 0.35), and age 72 (t[141] � 3.63[2-tailed], p � 0.0004; D � 0.61), but not at age 11 (t[133]
1.31 [2-tailed]; p � 0.19; D � 0.23). Censored correla-ions, including the entire sample and treating IDs as aontinuous variable, revealed that higher IQ measured atge 11 was significantly associated with having fewer IDs atge 72 (r � �0.19; p � 0.0324; 95% confidence intervalCI], �0.36 to �0.02). Two reading recognition tests thatre considered valid estimates of prior or premorbid generalognitive ability (Crawford et al., 2001; Holdnack, 2001;elson and Willison, 1991) showed significant negative
ssociations with IDs, with similar effect sizes as the oneound for childhood IQ (NART: r � �0.18; p � 0.0253;5% CI, �0.34 to �0.02; WTAR: r � �0.18; p � 0.0273;5% CI, �0.33 to �0.02), thus supporting this finding.
usion (c) of (a) T2*-weighted (T2* W) and (b) fluid-attenuated inversionte matter located in the right insula.
showing the registration and color fusion results of (a) T2*-weighted (T2*
color f
al slice
es not show any color change to indicate mineral deposition (cf. Fig. 4).
0
s that c
515L. Penke et al. / Neurobiology of Aging 33 (2012) 510–517
Furthermore, more IDs were significantly associated withlower general cognitive ability at ages 70 (r � �0.27; p �.0015; 95% CI, �0.44 to �0.10) and 72 (r � �0.31; p �
0.0001; 95% CI, �0.46 to �0.15). These continuous asso-ciations indicate a dose-response relationship between IDsand general cognitive ability. The effect of the relationshipsbetween IDs and general cognitive ability measured in oldage remained substantial in size and significant after adjust-ing for age 11 IQ in the analyses (Table 2). This key resulteffectively means that more IDs are associated with greaterrelative cognitive decline between age 11 and old age. Theassociations were largely unchanged (data not shown) afterexcluding any potentially undetected cases of early demen-tia by rerunning all analyses excluding participants withscores 1 SD below the mean on the Wechsler MemoryScale-III logical memory test, which is a more sensitivecriterion than the Mini Mental State Examination (MMSE).Further analyses (supplementary results) showed that therelationship with IDs was significant for 5 of the 6 cognitivesubtests that constitute the general cognitive ability factorbefore age 11 IQ was controlled, and for 4 of the 6 tests afterit was controlled. No significant relationships were foundfor more specific cognitive measures of information pro-cessing speed, memory, or verbal fluency, as assessed byadditional cognitive measures described in the Supple-ments.
Fig. 4. Example case with iron deposition with calcium. Central axial sT1-weighted (T1W), (c) T2-weighted (T2W), and (d) the registration andrecovery (FLAIR) images. The low signal on the T1W image (b) indicate
Fig. 5. Examples to illustrate the 4 groups of iron deposits in the basa
(medium-high), denoting increasing putaminal iron deposits.To illustrate the nature of the central findings, Fig. 6depicts the scatter plots of IDs with general cognitive abilityat ages 11, 70, and 72 (panel a), as well as general cognitiveability at ages 70 and 72 after adjusting for general cogni-tive ability at age 11, indicating age-related cognitive de-cline (panel b). The lines are derived from linear regressionanalyses, and they show that, even though many subjectshad low amounts of IDs and thus clustering on the extremeleft side of each scatter plot (i.e., reflecting the censorednature of the ID data), there was a clear linear trend ofdecreasing general cognitive ability and accelerated cogni-tive decline with more IDs in every analysis.
4. Discussion
Our results showed a negative association of IDs withboth general cognitive ability and successful cognitive ag-ing in a healthy elderly cohort, accounting for 4%–9% of thevariance. IDs in individuals with normal cognitive functionshave so far been dismissed in the literature, but our resultsshowed substantial associations with cognitive functioningin early as well as late life, especially compared with otherexisting biomarkers of cognitive aging (Cordonnier et al.,2007; Deary et al., 2009; Frisoni et al., 2007; Hedden andGabrieli, 2004). Because histopathological studies suggestthat increased basal ganglia attenuation on computed to-
a subject displaying from left to right: (a) T2*-weighted (T2* W), (b)results of T2W and T1W, and (e) T2* W and fluid-attenuated inversionalcium is present as well as iron (inset).
ia in T2*-weighted (T2* W) images. From left to right: 1 (none) to 4
lice offusion
l gangl
2aaasnundkae
piltltae
Bfwqsre
pqeemtevsfica
D
t
iS
A
516 L. Penke et al. / Neurobiology of Aging 33 (2012) 510–517
mography scan is mostly due to IDs rather than to calcifi-cation (Brass et al., 2006; Casanova and Araque, 2003;Slager and Wagner, 1956; Yao et al., 2009), these attenua-tions might also be a marker for cognitive decline. Theassociation of IDs late in life with age 11 general cognitiveability indicates that IDs are not simply related to generalcognitive ability in old age, but are at least partly related tothe lifelong-stable trait of general cognitive ability (Deary etal., 2004). This means that either early life general cognitiveability leads to lifestyle differences that influence theamount of iron deposited in the brain between childhoodand old age, and/or that both are indicators of vascularfrailty that is already present early in life and increases inold age. That the relationships with old age general cogni-tive ability remained significant after controlling for child-hood general cognitive ability as measured by the samevalidated test (Deary et al., 2007) (which can be understoodas the individual baseline for eventual cognitive decline),and after excluding subjects who might have early dementianot detected by the Mini Mental State Examination, sug-gests that IDs are a biomarker of age-related cognitivedecline in people without signs of dementia, beyond anyassociation of IDs with lifelong-stable general cognitiveability differences. These associations with cognitive agingmight be due to the link between IDs and microangiopathy,or alternatively perhaps due to a frequent co-occurence ofIDs in astroglia, oxidative stress, and mitrochondrial insuf-ficiency (Schipper, 2004). However, all these mechanisticinterpretations must be regarded as speculative at this stageand further studies are clearly warranted.
Our study is in agreement with the few earlier reports ofassociations of specific cognitive tasks with IDs in the basalganglia (Pujol et al., 1992; Sullivan et al., 2009) and BMBs(Cordonnier et al., 2007). Compared with these studies, thecurrent 1 stands out in that we carefully assessed generalcognitive ability — the variable that has been shown to bemost important for differences in normal cognition and
Table 2Censored (tobit) correlations between brain iron deposits and indicatorsof general cognitive ability and cognitive aging
Percentage of irondeposits in brain tissue
Percentage of iron depositsin brain tissue, with age 11IQ controlleda
Age 11 IQ �0.19 (�0.36 to �0.02) —Age 70 IQ �0.27 (�0.44 to �0.10) �0.18 (�0.36 to 0.00)Age 72 general
cognitive abilityfactor
�0.31 (�0.46 to �0.15) �0.25 (�0.41 to �0.09)
95% confidence intervals shown in parentheses. All coefficients are fullystandardized. Age in days at cognitive testing and gender are controlled inall analyses.Key: IDs, iron deposits; IQ, intelligence quotient.
a By adjusting for IQ at age 11, this means the coefficients in this columneffectively represent the association between IDs and relative cognitivechange between childhood and old age.
cognitive aging in the psychometric literature (Deary et al., D
009, 2010; Jensen, 1998; Salthouse and Czaja, 2000) — inlongitudinal design spanning over 6 decades and based onlarge cohort with narrow age range, which is the prefer-
ble design for differential aging studies (Hofer and Sliwin-ki, 2001). While the availability of childhood general cog-itive ability data in an elderly sample might be rathernique to our study, our results suggest that reading recog-ition tests are a valid substitute in this context. Genderifferences in IDs that have been found in 1 study (Bartzo-is et al., 2007) received only weak support in our samplend do not appear to affect relations with cognitive differ-nces.
We applied a novel, semiautomated procedure that canrovide a detailed picture of brain IDs. Initial validations forts accuracy of brain volume measurement, of white matteresion volume measurement, and of IDs has been under-aken and show it can accurately segment white matteresions (Valdés Hernández et al., 2010). However, moreesting in different patient cohorts with focal lesions as wells more diffuse abnormalities will be required for the fullvaluation of the method.
Other limitations include that we were unable to separateMBs from IDs and that we have not examined other
actors potentially coassociated with cognitive aging (e.g.,hite matter lesions), because a larger sample will be re-uired to adjust for these factors. However, in this healthyample few subjects had many white matter lesions. Theesults found in this generally healthy sample might also notxtend to patients with conditions like stroke or dementia.
The current study suggests that, rather than being unim-ortant physiological features of no pathological conse-uence, IDs (including microbleeds) might in fact be mark-rs of small vessel dysfunction and thus provide furthervidence of the importance of the vascular-brain interface inaintaining normal brain function. Other lifetime associa-
ions remain to be tested, but the association of IDs witharly life general cognitive ability suggests that early lifeascular status is important for lifelong wellbeing. Furthertudies in different populations are required to confirm thesendings and examine the correlations between IDs andognition in patients with small vessel stroke, or dementia,nd at different ages.
isclosure statement
The authors have no actual or potential conflicts of in-erest to report.
Written informed consent was obtained from all partic-pants under protocols approved by the National Healthervice ethic committees (MREC and LREC).
cknowledgements
LP, MCVH, SMM, CM, and AJG are supported by The
isconnected Mind (www.disconnectedmind.ed.ac.uk)
rPrCRw
linear
517L. Penke et al. / Neurobiology of Aging 33 (2012) 510–517
funded by Help the Aged and the UK Medical ResearchCouncil. JMW is supported by the Scottish FundingCouncil (SFC) through the SINAPSE Collaboration(Scottish Imaging Network. A Platform for ScientificExcellence, www.sinapse.ac.uk). We thank the study sec-etary P. Davies, and J. Corley, R. Henderson, and A.attie for data collection and data entry; the nurses,adiographers, and other staff at the Wellcome Trustlinical Research Facility, and the SFC Brain Imagingesearch Centre (www.sbirc.ed.ac.uk) where the data
Fig. 6. Scatter plots of the percentage of iron deposits on general cognitivquotient (IQ) at age 11 and 70 as well as the general cognitive ability factoability after controlling for childhood (age 11) IQ. Lines are derived from
ere collected; and the staff at Lothian Health Board and
at the SCRE Centre, University of Glasgow. The SFCBrain Imaging Research Centre is supported by the SI-NAPSE Collaboration. The work was partly undertakenwithin The University of Edinburgh Centre for CognitiveAging and Cognitive Epidemiology, part of the crosscouncil Lifelong Health and Wellbeing Initiative. Fund-ing from the BBSRC, EPSRC, ESRC, and MRC is grate-fully acknowledged.AppendixSupplementary data
Supplementary data associated with this article can befound, in the online version, at doi:10.1016/j.neurobiolaging.
. Panel (a) shows the relationship of iron deposits (IDs) with intelligencee 72. Panel (b) shows the same relationships for old age general cognitiveregressions.
e abilityr at ag
2010.04.032.

tpBcSagaEr
BGSCIGLLSSVV
9aK
517.e1 L. Penke et al. / Neurobiology of Aging 33 (2012) 510–517
Supplementary material
Supplementary results
The relationships of iron deposits (IDs) with the 6 indi-vidual subtests of the Wechsler Adult Intelligence Scale III,UK edition (WAIS-IIIUK; Wechsler, 1998) that constitutehe general cognitive ability factor are shown in the upperart of supplementary Table S1. Except for Digit Spanackwards, all subtests showed a significant negative asso-iation with IDs. For 4 of the 6 tests (Symbol Search, Digitymbol, Matrix Reasoning, and Block Design), the associ-tion survived controlling for Moray House Test intelli-ence quotient (IQ) at age 11 (i.e., prior general cognitivebility) (Deary et al., 2007; Scottish Council for Research inducation, 1949), indicating unique effects of IDs on age-
elated cognitive decline.In addition to the WAIS-IIIUK, a series of other cognitive
tests were administered at the same testing session at age 72(for details, see reference 11). These included 3 so-calledelementary cognitive tasks (simple reaction time, 4-choicereaction time, and inspection time), which were submittedto a principal components analysis to derive a general speedof information processing factor (explained variance of thefirst unrotated component: 55.39%) as well as 6 subtests ofthe Wechsler Memory Scale IIIUK (Logical Memory initialrecall, Logical Memory delayed recall, Spatial Span for-ward, Spatial Span backward, Verbal Paired Associates I(first recall), and Verbal Paired Associates II) (Wechsler,
Table S1Censored (tobit) correlations of brain iron deposits with the individual tesinformation processing speed, memory, and estimated early-life cognitive
Percentage o
WAIS-IIIUK subtests that define the general cognitiveability factor
Symbol search �.23 (�.39Digit symbol �.23 (�.38Matrix reasoning �.28 (�.45Letter-number sequencing �.20 (�.38Digit span backwards �.12 (�.28
lock design �.30 (�.47eneral information processing speed factor .04 (�.11imple reaction time (mean) .09 (�.05hoice reaction time (mean) .00 (�.18
nspection time .00 (�.18eneral memory factor (WMS) �.07 (�.24ogical memory (initial recall) .05 (�.12ogical memory (delayed recall) �.01 (�.18patial span (forward) �.04 (�.21patial span (backward) �.06 (�.24erbal Paired Associates I (first recall) �.01 (�.19erbal Paired Associates II .03 (�.13
5% confidence intervals are shown in parentheses. All coefficients are funalyses.ey: IDs to iron deposits; IQ, intelligence quotient; WAIS, Wechsler Ad
edition; WMS, Wechsler Memory Scale.a By adjusting for cognitive ability at age 11, this means the coefficien
cognitive change between childhood and old age.
1998), from which a general memory factor was extracted
(explained variance of the first unrotated component:36.82%). As the middle part of Supplementary Table S1shows, none of these tests and factors was significantlyrelated to IDs, neither before nor after controlling for child-hood IQ. Thus, IDs seem to affect general cognitive ability,but not information processing speed or memory.
References
Baba, V.V., 1990. Methodological issues in modeling absence: A compar-ison of least squares and tobit analyses. J. Appl. Psychol. 75, 428–432.
Bartzokis, G., Tishler, T.A., Lu, P.H., Villablanca, P., Altshuler, L.L.,Carter, M., Huang, D., Edwards, N., Mintz, J., 2007. Brain ferritin ironmay influence age- and gender-related risks of neurodegeneration.Neurobiol. Aging 28, 414–423.
Brass, S.D., Chen, N.K., Mulkern, R.V., Bakshi, R., 2006. Magneticresonance imaging of iron deposition in neurological disorders. Top.Magn. Reson. Imaging 17, 31–40.
Casanova, M.F., Araque, J.M., 2003. Mineralization of the basal ganglia:implications for neuropsychiatry, pathology and neuroimaging. Psychi-atry Res. 121, 59–87.
Cordonnier, C., Al-Shahi Salman, R., Wardlaw, J.M., 2007. Spontaneousbrain microbleeds: systematic review, subgroup analyses and standardsfor study design and reporting. Brain 130, 1988–2003.
Cordonnier, C., Potter, G.M., Jackson, C.A., Doubal, F., Keir, S., Sudlow,C.L., Wardlaw, J.M., Al-Shahi Salman, R., 2009. Improving inter-rateragreement about brain microbleeds: development of the Brain ObserverMicrobleed Scale BOMBS. Stroke 40, 94–99.
Crawford, J.R., Deary, I.J., Starr, J., Whalley, L.J., 2001. The NART as anindex of prior intellectual functioning: a retrospective validity study
constitute the general cognitive ability factor as well as measures of
eposits in brain tissue Percentage of iron deposits in brain tissue,with age 11 IQ controlleda
) �.18 (�.34 to �.03)) �.19 (�.34 to �.04)) �.25 (�.42 to �.09)) �.14 (�.32 to .04)
�.06 (�.22 to .10)) �.26 (�.44 to �.08)
�.01 (�.17 to .16).07 (�.09 to .22)
�.04 (�.22 to .14).02 (�.16 to .20).04 (�.15 to .22).13 (�.05 to .31).05 (�.12 to .23)
�.06 (�.23 to .12)�.03 (�.22 to .15)
.00 (�.18 to .18)
.06 (�.10 to .22)
dardized. Age in days at cognitive testing and gender are controlled in all
elligence Scale; WAIS-IIIUK, Wechsler Adult Intelligence Scale III, UK
is column effectively represent the association between IDs and relative
ts thatability
f iron d
to �.08to �.08to �.12to �.02to .05)to �.13to .20)to .24)to .18)to .17)to .11)to .23)to .16)to .13)to .12)to .17)to .19)
lly stan
ult Int
ts in th
covering a 66-year interval. Psychol. Med. 31, 451–458.
517.e2L. Penke et al. / Neurobiology of Aging 33 (2012) 510–517
Deary, I.J., Corley, J., Gow, A.J., Harris, S.E., Houlihan, L.M., Marioni,R.E., Penke, L., Rafnsson, S.B., Starr, J.M., 2009. Age-associatedcognitive decline. Br. Med. Bull. 92, 135–152.
Deary, I.J., Gow, A.J., Taylor, M.D., Corley, J., Brett, C., Wilson, V.,Campbell, H., Whalley, L.J., Visscher, P.M., Porteous, D.J., Starr, J.M.,2007. The Lothian Birth Cohort 1936: a study to examine influences oncognitive ageing from age eleven to age seventy and beyond. BMCGeriatr. 7, 28.
Deary, I.J., Penke, L., Johnson, W., 2010. The neuroscience of humanintelligence differences. Nat. Rev. Neurosci. 11, 201–211.
Deary, I.J., Whiteman, M.C., Starr, J.M., Whalley, L.J., Fox, H.C., 2004.The impact of childhood intelligence on later life: Following up theScottish mental surveys of 1932 and 1947. J. Pers. Soc. Psychol. 86,130–147.
Folstein, M.F., Folstein, S.E., McHugh, P.R., 1975. Mini-mental state. Apractical method for grading the cognitive state of patients for theclinician. J. Psychiatr. Res. 12, 189–198.
Floyd, R.W., Steinberg, L., 1976. An adaptive algorithm for spatial greyscale. Proceedings of the Society of Information Display 17, 75–77.
Frisoni, G.B., Galluzzi, S., Pantoni, L., Filippi, M., 2007. The effect ofwhite matter lesions on cognition in the elderly: small but detectable.Nat. Clin. Pract. Neurol. 3, 620–627.
Harder, S.L., Hopp, K.M., Ward, H., Neglio, H., Gitlin, J., Kido, D., 2008.Mineralization of the deep gray matter with age: A retrospective reviewwith susceptibility-weighted MR imaging. AJNR Am. J. Neuroradiol.29, 176–183.
Hedden, T., Gabrieli, J.D.E., 2004. Insights into the ageing mind: A viewfrom cognitive neuroscience. Nat. Rev. Neurosci. 5, 87–112.
Hofer, S.M., Sliwinski, M.J., 2001. Understanding ageing: An evaluationof research designs for assessing the interdependence of ageing-relatedchanges. Gerontology 47, 341–352.
Holdnack, J.A., 2001. Wechsler Test of Adult Reading Manual. Psycho-logical Corporation, San Antonio.
Jenkinson, M., Bannister, P.R., Brady, J.M., Smith, S.M., 2002. Improvedoptimisation for the robust and accurate linear registration and motioncorrection of brain images. Neuroimage 17, 825–841.
Jensen, A.R., 1998. The g Factor: The Science of Mental Ability. Praeger,Westport.
Jung, R.E., Haier, R.J., 2007. The Parieto-Frontal Integration Theory (P-FIT) of intelligence: converging neuroimaging evidence. Behav. BrainSci. 30, 135–154.
Nelson, H.E., Willison, J.R., 1991. National Adult Reading Test Manual.
NFER-Nelson, Windsor.Pujol, J., Junque, C., Vendrell, P., Grau, J.M., Martí-Vilalta, J.L., Olivé, C.,Gili, J., 1992. Biological significance of iron-related magnetic reso-nance imaging changes in the brain. Arch. Neurol. 49, 711–717.
Salthouse, T.A., Czaja, S.J., 2000. Structural constraints on process expla-nations in cognitive aging. Psychol. Aging 15, 44–55.
Schipper, H.M., 2004. Brain iron deposition and the free radical-mitochon-drial theory of ageing. Ageing Res. Rev. 3, 265–301.
Scottish Council for Research in Education, 1949. The Trend of ScottishCognitive Ability: A Comparison of the 1947 and 1932 Surveys of theCognitive Ability of Eleven-Year-Old Pupils. University PublishingGroup, London.
Slager, U.T., Wagner, J.A., 1956. The incidence, composition and patho-logical significance of intracerebral vascular deposits in the basal gan-glia. J. Neuropathol. Exp. Neurol. 15, 417–431.
Sullivan, E.V., Adalsteinsson, E., Rohlfing, T., Pfefferbaum, A., 2009.Relevance of iron deposition in deep gray matter brain structures tocognitive and motor performance in healthy elderly men and women:Exploratory findings. Brain Imaging Behav. 3, 167–175.
Tobin, J., 1958. Estimation of relationships for limited dependent variables.Econometrica 26, 24–36.
Valdés Hernández, M.C., Ferguson, K.J., Bastin, M.E., Wardlaw, J.M.,2010. New multispectral MRI data fusion technique for white matterlesion segmentation: method and comparison with thresholding inFLAIR images. Eur. Radiol., doi:10.1007/s00330-010-1718-6.
Waldstein, S.R., Snow, J., Muldoon, M.F., Katzel, L.I., 2001. MedicalNeuropsychology, second ed. Kluwer, New York.
Wechsler, D., 1998. WAIS-IIIUK Administration and Scoring Manual.Psychological Corporation, London.
Yao, B., Li, T.Q., Gelderen, P., Shmueli, K., de Zwart, J.A., Duyn, J.H.,2009. Susceptibility contrast in high field MRI of human brain as afunction of tissue iron content. Neuroimage 44, 1259–1266.
Supplementary referencesDeary, I.J., Gow, A.J., Taylor, M.D., Corley, J., Brett, C., Wilson, V.,
Campbell, H., Whalley, L.J., Visscher, P.M., Porteous, D.J., Starr, J.M.,2007. The Lothian Birth Cohort 1936: a study to examine influences oncognitive ageing from age eleven to age seventy and beyond. BMCGeriatr. 7, 28.
Scottish Council for Research in Education, 1949. The Trend of ScottishCognitive Ability: A Comparison of the 1947 and 1932 Surveys of theCognitive Ability of Eleven-Year-Old Pupils. University PublishingGroup, London.
Wechsler, D., 1998. WAIS-IIIUK Administration and Scoring Manual.
Psychological Corporation, London.

![Curriculum Vitae Lars Balzer [31.05.2019] ...lars-balzer.info/CV_lars-balzer.pdf · Curriculum Vitae Prof. Dr. Lars Balzer [31.05.2019] 3/32 Professional Experience / Beruflicher](https://img.pdfslide.us/doc/110x75/5d59923488c9933b318bbfcc/curriculum-vitae-lars-balzer-31052019-lars-curriculum-vitae-prof-dr.jpg)