Embed Size (px)
Citation preview
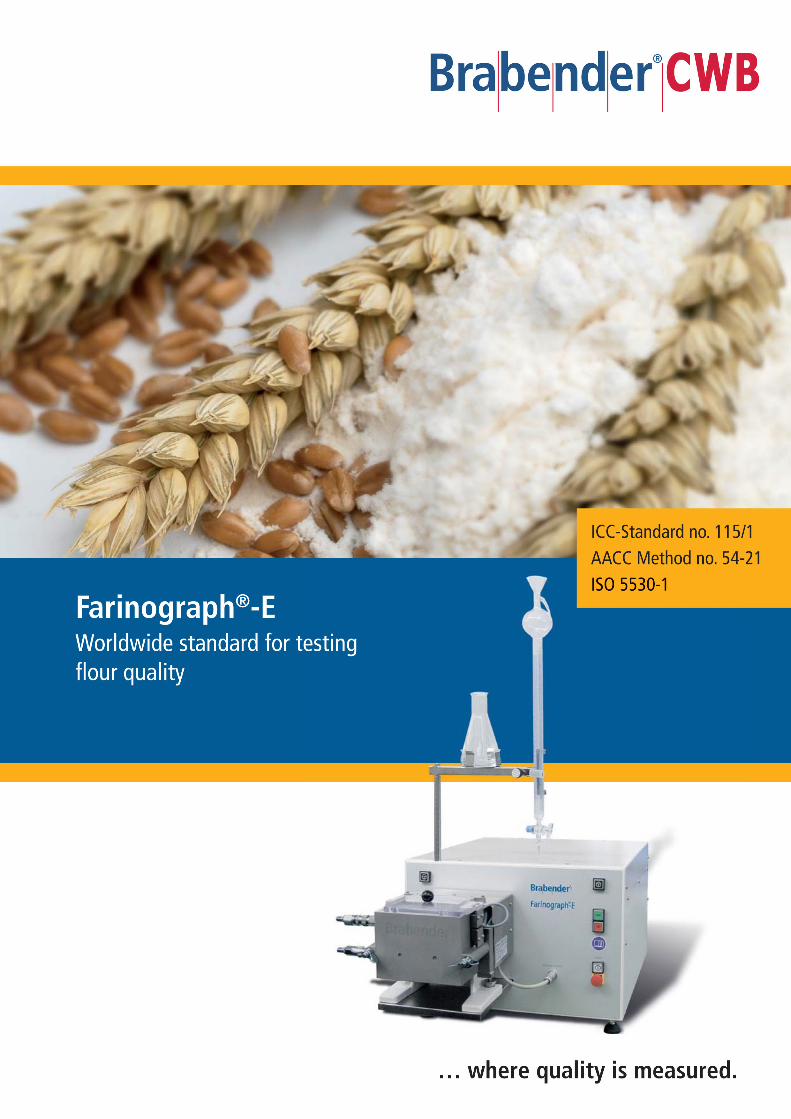
Brabender®CWB
ICC-Standard no. 115/1
AACC Method no. 54-21
ISO 5530-1
Brabender !IJ Farinograph-E
... where quality is measured.

State-of-the-art measuring system
Farinograph®-E
Benefi t from our long experi-ence in the fi eld of fl our testing and use the advantages of the Brabender® Farinograph®.Easy handling, reliability and the objectivity and reproducibility of the results have made it the instrument most frequently used all over the world for determi-ning the water absorption and mixing characteristics of wheat and rye fl our.
ApplicationThe instrument consists of a drive unit with continuous speed control and an attached measuring mixer for mixing the dough to be tested.
Reliable and reproducible determi-nation of the fl our quality and its processing characteristics is a basic demand in the milling and baking industries for ensuring optimum and uniform fl our qualities for the manifold baking and noodle products.
Advantages• Extended software applications
• Variable speed (0 - 200 min-1)
Aqua-Inject allows:• Recording of two temperatures (dosing water and dough)
• Calculates mixing energy
Additional software• Programming of speed profi les
• Creating of individual test profi les
• Free defi nition of own evaluation methods
• Integrated videos show test procedures
• Auto save mode
• Reference curve could be integrated
Principle
Fill your fl our / water suspension into the heated measuring mixer where it is subjected to a defi ned mechanical stress by the rotating mixer blades which are driven by a motor, carried in a pendulum bearing.
The resistance of the dough against the blades, which depends on the viscosity of the dough, causes an opposite defl ection of the motor housing. This defl ection is measured as torque and recorded and plotted on-line as a function of time in a clear color diagram.
The Farinogram
Farinogram
Schematic diagram
Manifold applications
• Measure the water absorption of fl ours
• Determine the rheological properties of the dough
• Check production and fl our blends in the mill
• Test rye fl our, biscuit batters, egg foam, etc.
• Special applications, e.g. for chocolate, chewing gum, fi sh, cheese, meat etc.
Get reliable and reproducible data about the quality characteristics of your fl our from the Farinogram
which shows
• Water absorption• Development time• Stability• Degree of softening• Farinograph® quality number
Individual test proceduresApart from the standard evaluation, the software allows to adapt the test procedure to your individual requirements:
• Reduced test time and/or increased mixing intensity by variable speed (0 - 200 min-1)
• Variable mixing intensity and energy input to the dough for research and development applications
• Additional software for programming complex speed profi les, e.g. premixing at a low speed and measurement at an increased speed or defi nition of rest times for long dough systems
• Evaluation of diagrams which differ from the typical Farinogram profi le

Further special mixers on request
Mixing tools for the Farinograph®-E
Sigma mixer S 300 • For standard Farinograph® test
(300 g of flour) according to ICC, AACC, ISO
• For mixing the dough for Extensograph® tests
• Removable blades
Sigma mixer S 50 • For standard Farinograph®
test (50 g of flour) according to ICC, AACC, ISO
• Removable blades
Sigma mixer S 10 • For standard Farinograph® test
with small sample weights (1 0 g)
Hardness and Structure Tester • For testing the hardness of grain
(wheat, barley, malt, etc.)
• Special software
Working without glass burette The Aqua-lnject is an add on instrument for use with a Brabender® Farinograph®-E (USB) and can be used for the 300 g and 50 g mixers.
The Aqua-lnject provides for
• Automatie dosing of water
• High reproducibility
• For breeders and research work Advantages • Exact tempering of the
dosing water
Planetary mixer P 600 • For rye dough and sponge batter
• With dough hook, K-hook, whisk
• Electronically controlled, constant water temperature
• High accuracy (better than 0.1 %)
• Registration of water quantity and temperature
• Recording of the mixer bowl temperature and/or dough temperature is optional possible (via PT1 00 feeler)
• Elemination of the glass burette
Easy servicing and cleaning
• Connection of a balance, for registering the weight of the flour quantity into the software
• Connection of a thermostat, for controlling a temperature profile which was programmed into the software
The added water quantity and temperature are registered and stored by means of the software
Aqua-lnject
Mains connection
Dimensions (W x H x D)
Weight
1 x 230 V 50/ 60 Hz + N + PE 0.6 A
1 x 11 5 V 50 I 60 Hz + PE 1 .2 A
280 x 430 x 540 mm
quality is measured.

Farinograph®-E
" ..... .. Farinograph ·- '"' -· .......... ,.,
" "_ 01.7 • ~ ... ' "'-~~.-~ ... • ................. ....... ~11 -· ·~(101rft,.....~ll " ,~,l;t " " / 12-IY!fllolal f~IHIIIIIZ-Ihl "'
Ex!ensograph ............ "' " ·- "" - I Ex!ensograph2 ,..,_".,.....
'"' " ......... "' -UMS Evaluation
Individual test procedures
IJt1 ,,.'lVIII'....,
: ...... ; ..... -t .. .. -f .... . ; ..... .;..H ...... ; ..... .;. ..... t .... .. "" : .: ::: : ! :::::~ .. +·+ .. + +····· ~ ;7f··-r·· .. r:: .. c:r:::r::::;:: :::r::::
0 ~ ' 1- I 1D U U II tS :U
Cl • 0 • 0
: 0
• •
Wholemeal .__ _____________ __. flour
·rr Rye
L...!:=====:3======:L...J flour
gl!l" ... 'lo - Obtqr-...
.,., .. ., ' ' ... ... ... .,.
... ... .. ., '"" • • .. , ", "'
,., .,., "' "' ""
,,., ,., "'
C.W. Brabender® Instruments, lnc.
Farinograph® UMS Extension This special Farinograph® software makes your quality assurance even more easier and safer.
The reference data is put into the software, then a visual evaluation and display of the specific test is
Data correlation Use the powerful Farinograph® correlation program to compare diagrams and results of up to 1 0 tests with each other. Test conditions and results are contrasted in tables and evaluated statistically.
Data correlation
carried out. This is done by transferring the specific Farinogram by means of the software .
Additional data like e.g. Extensogram or Amylogram values can be inserted manually.
Quick assess trends or irregularities by drawing and printing all diagrams of the correlation tagether in a single plot.
Farinograph®-E
Speed
Safety device
Mains connection
Dimensions (W x H x D)
Weight
0-200 min 1
1 x 230 V; 50/60 Hz + N + PE; 3.2 A 115 V; 50/60 Hz + PE; 6.5 A
510 x 370 x 820 mm
approx. 75 kg net
50 E Wesley St. , South Hackensack , NJ 07606 Phone: 201.343.8425 • Fax: 201.343.0608 cwbi@cwbrabende r. com • www.cwbrabender.com
Brabender® agencies all over the world. © 2013 Brabender® GmbH & Co. KG
All Irademarks are registered . Subject to change of design and technical modification without notice.
M
0 N