Embed Size (px)
Citation preview

1
Investor PresentationMay 2018

2
This presentation contains forward-looking statements, other than historical
facts, which reflect the view of the Fund's management with respect to future
events. Such forward-looking statements reflect the current views of the Fund's
management and are made on the basis of information currently available.
Although management believes that its expectations are reasonable, it can give
no assurance that such expectations will prove to be correct. The forward-looking
statements contained herein are subject to these factors and other risks,
uncertainties and assumptions relating to the operations, results of operations
and financial position of the Fund. For more information concerning forward-
looking statements and related risk factors and uncertainties, please refer to the
Boyd Group’s interim and annual regulatory filings.
Forward-Looking Statements
3
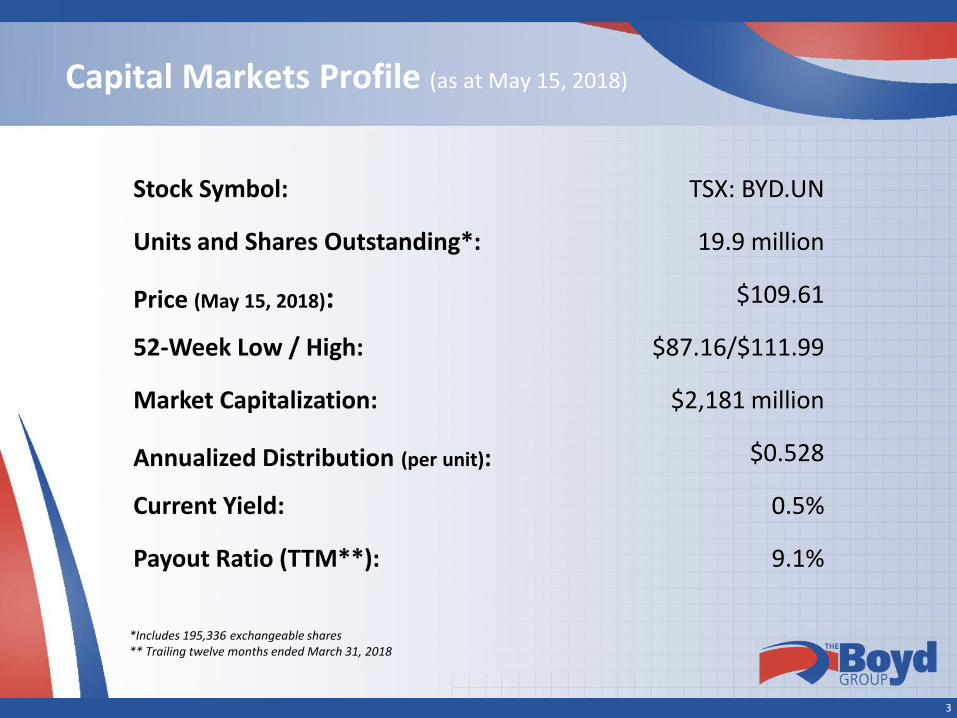
Capital Markets Profile (as at May 15, 2018)
Stock Symbol: TSX: BYD.UN
Units and Shares Outstanding*: 19.9 million
Price (May 15, 2018): $109.61
52-Week Low / High: $87.16/$111.99
Market Capitalization: $2,181 million
Annualized Distribution (per unit): $0.528
Current Yield: 0.5%
Payout Ratio (TTM**): 9.1%
*Includes 195,336 exchangeable shares** Trailing twelve months ended March 31, 2018

4
Company Overview
• Leader and one of the largest operators of collision repair shops in North America by number of locations (non-franchised)
• Consolidator in a highly fragmented US$38.0 billion market
• One of the largest retail auto glass operators in the U.S.
• Only public company in the auto collision repair industry in North America
• Recession resilient industry
By Country By Payor< 10% Customer Pay/Other
> 90% Insurance
< 15%*
Canada
U.S.
Revenue Contribution:
*pro forma for the acquisition of Assured Automotive

5
Collision Operations
• 512 company operated collision locations
across 22 U.S. states and five Canadian
provinces
• Operate full-service repair centers offering
collision repair, glass repair and replacement
services
• Strong relationships with insurance carriers
• Advanced management system technology
• Process improvement initiatives

6
North American Collision Repair Footprint
U.S. • Florida (60)
• Illinois (54)
• Michigan (47)
• North Carolina (30)
• Ohio (26)
• Washington (26)
• Indiana (25)
• Georgia (23)
• Arizona (20)
• Colorado (19)
• Louisiana (10)
• Maryland (10)
• Oregon (9)
• Tennessee (9)
• Oklahoma (5)
• Pennsylvania (5)
• Utah (5)
• Nevada (4)
• Texas (3)
• Idaho (1)
• Kansas (1)
• Kentucky (1)
Canada• Ontario (74)
• Alberta (16)
• Manitoba (14)
• British Columbia (13)
• Saskatchewan (2)
119locations
393locations
6

7
Glass Operations
• Retail glass operations across 31 U.S.
states Asset light business model
• Third-Party Administrator business that
offers glass, emergency roadside and
first notice of loss services with
approximately: 5,500 affiliated glass provider locations
4,600 affiliated emergency road-side service
providers
• Canadian Glass Operations are
integrated in the collision business

8
North American Glass Footprint
U.S.
• Alabama• Arizona• Colorado• Connecticut• District of Columbia• Florida• Georgia• Idaho• Illinois• Indiana• Kentucky• Louisiana• Massachusetts• Maryland• Michigan• Missouri• Nevada• New Hampshire• New York• North Carolina• Ohio• Oklahoma• Oregon • Pennsylvania• Tennessee• Texas• Utah• Virginia• Washington• West Virginia• Wisconsin
8

9
Market Overview & Business Strategy
9

10
Large, Fragmented Market
• Revenue for North American collision repair industry is estimated to be
approximately US$38.0 billion annually (U.S. $35.7B, CDA $2.3B)
• 32,400 shops in the U.S.
• Composition of the collision repair market in the U.S.:
U.S. Collision Repair Market
Source: The Romans Group, “Advancing Our Insights Into the 2016 Collision Repair Marketplace”
Large MSO24.6%
Small MSO and
Franchises8.2%
Single Shops67.2%
Dealer-owned Shops19.5%
Independent Repair Shops80.5%

11
Evolving Collision Repair Market
• Long-term decline of independent and dealership repair facilities
Total number of independent and dealership collision repair locations has declined by 24.7% from late 2007 to 2016, and almost 60% over the past 36 years
• Large multi-shop collision repair operator (“MSO”) market share opportunity
Large MSOs represented 7.7% of total locations in 2016 and 24.6% of estimated 2016 revenue (up from 9.1% in 2006) in the U.S.
80 MSOs had revenues of $20 million or greater in 2016
The top 10 MSOs together represent 70.5% of revenue of large MSOs
MSOs benefit from standardized processes, integration of technology platforms and expense reduction through large-scale supply chain management
Source: The Romans Group, “Advancing Our Insights Into the 2016 Collision Repair Marketplace”

12
Strong Relationships with Insurance Companies through DRPs
• Direct Repair Programs (“DRPs”) are established between
insurance companies and collision repair shops to better
manage auto repair claims and the level of customer satisfaction
• Auto insurers utilize DRPs for a growing percentage of collision
repair claims volume
• Growing preference among insurers for DRP arrangements with
multi-location collision repair operators
• Boyd is well positioned to take advantage of these DRP trends
with all major insurers and most regional insurers
• Boyd’s relationship with insurance customers Top 5 largest customers contribute 44% of revenue
Largest customer contributes 14% of revenue
12

13
Insurer Market Dynamics
Top 10 Insurer Market Share Insurer DRP Usage
Source: The Romans Group
Top 10 Insurers71.7%
Other Insurers28.3%
DRP59.5%
Other40.5%

14
Impact of Collision Avoidance Systems
• CCC estimates technology will reduce accident frequency by ~30% in next 25-30 years
• Collision avoidance technology may lessen the extent of damage in some accidents, leading to less required repairs, but also a higher percentage of repairable vehicles (less total losses)
• Offsetting factors to accident frequency decline include:
Increases in repair costs due to the additional repair or replacement requirements of collision avoidance technology; and
Increases in vehicle miles driven resulting from increases in ride-share and related increased utilization of registered vehicles
• Large operators could also mitigate market decline by continued market share gains in consolidating industry
*Source: CCC Information Services Inc. Crash Course 2018: Updated projection expands the ADAS technology to include systems like lane departure warning, adaptive headlights, and blind spot monitoring, uses HLDI’s predictions in regard to the ramp-up in percent of registered vehicle fleet equipped with each system, and includes projections of the number of vehicles in operation in the U.S. Projections based on current projected annual rate of change - impact may increase with changes in market adoption and system improvements
All Rights Reserved Copyright 2018 CCC Information Services Inc.
0%
0%
0%
0%
-1%
-1%
-3%
-11%
-19%
-25%
-29%
-30%
-31%
-35% -30% -25% -20% -15% -10% -5% 0%
CY 2010
CY 2011
CY 2012
CY 2013
CY 2014
CY 2015
CY 2020
CY 2025
CY 2030
CY 2035
CY 2040
CY 2045
CY 2050
Impact of Crash Avoidance on VehicleClaim Counts *
15
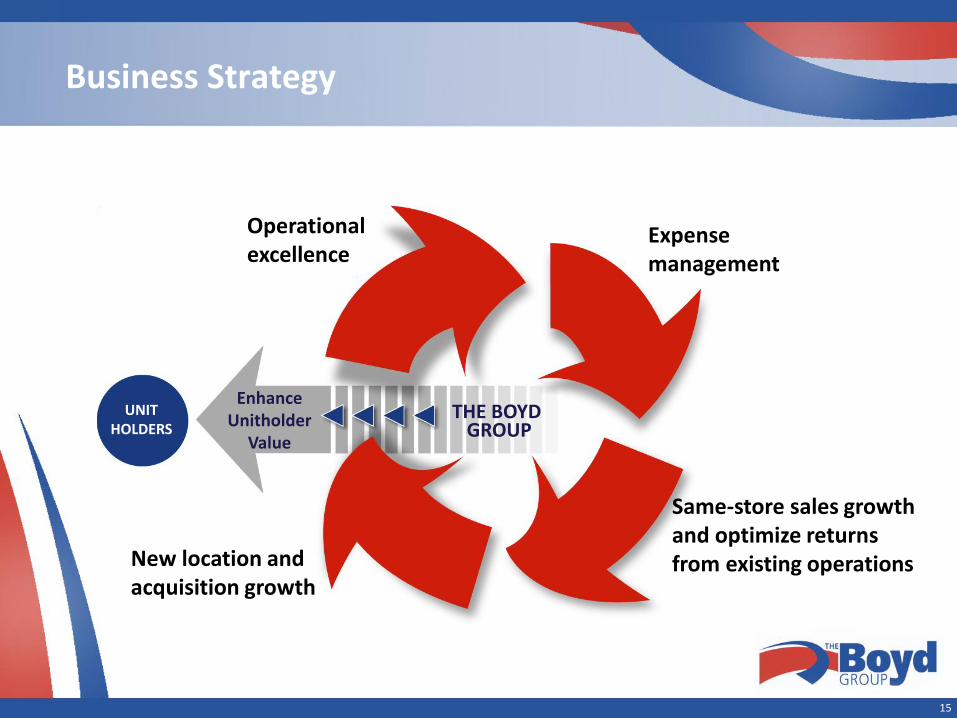
Business Strategy
Operational excellence
New location and acquisition growth
Expense management
Same-store sales growth and optimize returns from existing operations
EnhanceUnitholder
Value
THE BOYD GROUP
UNITHOLDERS
15

16
Operational Excellence – WOW Operating Way
• Best-in-Class Service Provider
Average cost of repair
Cycle time
Customer service
Quality
Integrity
• “WOW” Operating Way
Implemented in all of our locations other than those added in the last 12 months

17
Expense ManagementO
pe
rati
ng
Exp
en
ses
as %
of
Sale
s
Well managed operating expenses as a % of sales
17
38.4% 38.8% 38.0% 37.1% 36.8% 36.5%
0.0%
5.0%
10.0%
15.0%
20.0%
25.0%
30.0%
35.0%
40.0%
45.0%
2012 2013 2014 2015 2016 2017

18
SSSG - Optimizing Returns from Existing Operations
Same-store sales increases in 33 of 40 most recent quarters
*Total Company, excluding FX.
**Adjusting for the positive impact of hail in Q4-10, Q4-11 SSSG was 4.7%
***Adjusting for the negative impact of Hurricane Irma and Hurricane Harvey, Q3-17 SSSG was 1.0%
18
Sam
e-S
tore
Sal
es
Gro
wth
*
3-year average SSSG: 4.2%
5-year average SSSG: 5.2%10-year average SSSG: 3.8%

19
Focus on Accretive Growth
• Goal: double the size of the business during the five-year period ending in 2020*
• Implied average annual growth rate of 15%: Same-store sales
Acquisition or development of single locations
Acquisition of multiple-location businesses
• Well-positioned to take advantage of large acquisitions
*Growth from 2015 on a constant currency basis.

20
54
42
64
29
58
105
16
512
0
20
40
60
80
100
120
0
100
200
300
400
500
600
2012 2013 2014 2015 2016 2017 YTD 2018
Annual additions Total locations
Strong Growth in Collision Locations
• May 2013: acquisition of Glass America added 61 retail auto glass locations
• March 2016: acquisition of 4 retail auto glass locations
20

21
FinancialReview
21

Revenue Growth
22
$434.4
$578.3
$844.1
$1,174.1
$1,387.1
$1,569.4
$0
$200
$400
$600
$800
$1,000
$1,200
$1,400
$1,600
2012 2013 2014 2015 2016 2017
(C$ millions)
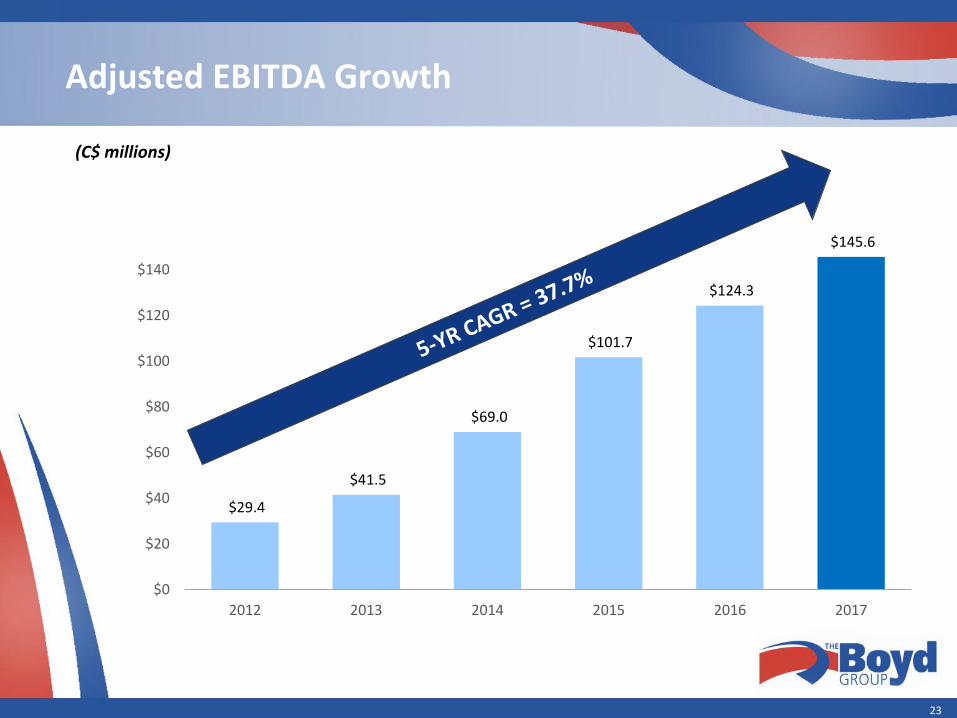
Adjusted EBITDA Growth
23
$29.4
$41.5
$69.0
$101.7
$124.3
$145.6
$0
$20
$40
$60
$80
$100
$120
$140
2012 2013 2014 2015 2016 2017
(C$ millions)

24
Financial Summary
24
* Adjusted EBITDA, adjusted net earnings, and adjusted distributable cash are not recognized measures under International Financial Reporting Standards ("IFRS"). See the Fund’s Q1 2018 MD&A for more information.
(C$ millions, except per unit and percent amounts)
3-months ended
March 31,2018
March 31,2017
Sales $453.3 $378.9
Gross Profit $204.5 $173.1
Adjusted EBITDA* $42.1 $32.8
Adjusted EBITDA Margin* 9.3% 8.7%
Adjusted Net Earnings* $20.9 $13.9
Adjusted Net Earnings* per unit $1.062 $0.771
Adjusted Distributable Cash* $29.9 $15.4
Adjusted Distributable Cash* per average unit and Class A common share $1.504 $0.843
Payout Ratio 8.8% 15.3%
Payout Ratio (TTM) 9.1% 10.6%

25
Strong Balance Sheet
(in C$ millions) March 31, 2018 December 31, 2017
Cash $59.2 $47.8
Long-Term Debt $265.6 $258.0
Obligations Under Finance Leases $8.5 $8.9
Net Debt (total debt, including current portion and bank indebtedness, net of cash)
$214.9 $219.1
Net Debt / Adjusted EBITDA (TTM) pro forma for Assured
1.3x 1.4x
25

26
Financial Flexibility
• Cash of $59.2 million
• Net Debt to EBITDA TTM ratio of 1.3x pro forma for Assured
• 5-year committed facility of US$300 million which can increase to US$450 million with accordion feature, maturing May 2022
• Over $400 million in cash and available credit
• Only public company in the industry Access to all capital markets

27
U.S. Tax Reform Impact
• U.S. effective tax rate decreased by 13% after considering state taxes beginning January 1, 2018
• Proforma 2017 (if tax reform was effective January 1, 2017): would have lowered total tax expense (current and deferred) by approximately $11.0M
• Boyd’s low leverage makes interest deductibility limitation very unlikely to impact Boyd unless its leverage increases significantly in the future
• Tax efficiency of the income trust structure is still maintained, however the benefit is reduced due to lower U.S. tax rate
• The Company is currently rolling out enhancements to benefits for U.S. employees that will be funded by a portion of the tax savings to be realized from U.S. Tax Reform

28
Distributions
Annualized Distribution per Unit (C$)
Annualized distributions have increased by 12.8% since 2012
28
0.4680.48
0.4920.504
0.5160.528
$0.40
$0.45
$0.50
$0.55
Nov 12 -Oct 13
Nov 13 -Oct 14
Nov 14 -Oct 15
Nov 15 -Oct 16
Nov 16 -Oct 17
Nov 17 -present

29
Five-year Return to Unitholders
*Source: Thomson Reuters Eikon. Total return based on reinvestment of dividends.
-100%
0%
100%
200%
300%
400%
500%
600%
700%
800%
31-Dec-12 31-Dec-13 31-Dec-14 31-Dec-15 31-Dec-16 31-Dec-17
Boyd Group S&P/TSX Composite S&P/TSX Income Trust
5-year total return:
553.50%*
S&P/TSX Composite
51.3%
S&P/TSX Income Trust
40.8%

30
2007 - 2017
Delivering long-term value to unitholders
• Best 10-year performance on the TSX in 2015 and 2016
• Second best 10-year performance on the TSX in 2017
Source: Thomson One, includes reinvested distributions
+57.5%
+5,795.6%
2006 - 2016
+58.6%
+9,966.5%
2005 - 2015
S&P/TSX Composite Index
BYD.UN
+15.4%
+4,655%

31
Experienced & Committed Management Team
Brock BulbuckCEO
Pat PathipatiExecutive Vice-President & CFO
Tim O’DayPresident & COO

32
Outlook
• Increase North American presence through:
Drive same-store sales growth through enhanced capacity utilization, development of DRP arrangements and leveraging existing major and regional insurance relationships
Acquire or develop new single locations as well as the acquisition of multi-location collision repair businesses
• Margin enhancement opportunities through operational excellence and leveraging scale over time
• Double size of the business during the five-year period ending in 2020*
*Growth from 2015 on a constant currency basis.

33
Summary
Stability
Unitholder Value
Growth
+
=
Strong balance sheet
Insurer preference for MSOs
Recession resilient
Cash distributions/conservative payout ratio
5-year total unitholder return of 553.5%
US$38.0 billion fragmented industry
High ROIC growth strategy
Market leader/consolidator in North America
Focus on enhancing unitholders’ value
33