Embed Size (px)
Citation preview
8/3/2019 Bovee and Scott 2002
http://slidepdf.com/reader/full/bovee-and-scott-2002 1/12
RIVER RESEARCH AND APPLICATIONS
River Res. Applic. 18: 287–298 (2002)
Published online in Wiley InterScience
(www.interscience.wiley.com). DOI: 10.1002/rra.672
IMPLICATIONS OF FLOOD PULSE RESTORATION FOR POPULUSREGENERATION ON THE UPPER MISSOURI RIVER
KEN D. BOVEE* AND MICHAEL L. SCOTT
US Geological Survey, Midcontinent Ecological Science Center, 4512 McMurry Avenue, Fort Collins, CO 80525-3400, USA
ABSTRACT
We developed a mass balance flow model to reconstruct unregulated daily peak flows in the National Wild and Scenicreach of the Missouri River, Montana. Results indicated that although the observed frequency of large peak flows has notchanged in the post-dam period, their magnitude has been reduced from 40 to 50% as a consequence of flow regulation.Reductions in the magnitude of these flows should reduce the expected frequency of large flood-pulses over a longertime-scale. Results of a two-dimensional hydraulic model indicated that limited cottonwood (Populus deltoides subsp.
Monilifera) recruitment occurs at relatively small peak discharges, but to maximize establishment of cottonwoods in theWild and Scenic reach, a threshold of 1850 m 3 /s would be necessary at the Virgelle gauge. Floods of this magnitudeor greater lead to establishment of cottonwood seedlings above the zone of frequent ice-drive disturbance. Restoringthe frequency, magnitude, duration and timing of these flood pulses would benefit important natural resource valuesincluding riparian cottonwood forests and native fish species in the upper Missouri River basin. However, efforts tonaturalize flow must be made in the context of a water management system that was authorized and constructed for theprimary purposes of flood control, power generation and irrigation. Using the synthesized flow model and flood damagecurves, we examined six scenarios for delivering flows ≥1850 m3 /s to the Wild and Scenic reach. Whereas some scenariosappeared to be politically and economically infeasible, our analysis suggested that there is enough operational flexibilityin the system to restore more natural flood pulses without greatly compromising other values. Published in 2002 by JohnWiley & Sons, Ltd.
KEY WORDS: flood routing; flow mass balance; flood pulse; flow restoration; Populus; riparian forests; Missouri River
INTRODUCTION
Throughout the northern hemisphere, dams have substantially altered riverine ecosystems through fragmen-tation of once-continuous river corridors and modification of natural flow regimes (Dynesis and Nilsson,1994). There are over 75 000 dams in the continental United States capable of storing significant amountsof sediment and water (Graf, 1999). Construction of large dams and reservoirs, primarily between the 1950sand 1980s, has provided valuable goods and services for irrigation, power generation, flood protection, andrecreational opportunities. However, the magnitude of unanticipated costs associated with the alteration of downstream riverine and riparian ecosystems has only begun to be appreciated (Graf, 1999). It is now evident,
for example, that the ecological integrity of riparian ecosystems throughout western North America is threat-ened by widespread water management activities that have altered natural patterns of sediment and streamflow (Johnson et al., 1976; Rood and Mahoney, 1990; Ligon et al., 1995; Stanford et al., 1996; Graf, 1999).
Ecological deterioration or loss of riverine and riparian resources can be the direct result of the modificationof the magnitude, frequency, duration, timing and change-rate of flow (Poff, 1997). However, full restorationof natural, regionally specific stream flow patterns along large, flow-controlled rivers may not be possible, andflow prescriptions for natural resource values must be made in the context of competing economic and socialvalues (Schmidt et al., 1998). Thus, efforts to conserve and restore flow-dependent natural resources alongregulated rivers must include a quantitative understanding of the extent to which natural flows have been
* Correspondence to: Ken D. Bovee, US Geological Survey, Midcontinent Ecological Science Center, 4512 McMurry Ave., Fort Collins,CO 80525-3400, USA. E-mail: Ken [email protected]
This article is a US Government work and is in the public domain in the USA.
Received 13 February 2001
Revised 18 June 2001
Accepted 25 June 2001
8/3/2019 Bovee and Scott 2002
http://slidepdf.com/reader/full/bovee-and-scott-2002 2/12
288 K. D. BOVEE AND M. L. SCOTT
altered. This knowledge is important in understanding how hydrologic events, such as floods, drive specificecological processes, such as establishment and survival of riparian cottonwoods (Populus spp.) (Mahoney
and Rood, 1998).The primary objective of this work was to develop and test a strategy to implement larger flood pulses to
sustain cottonwood forests and other natural resource values under existing economic and water managementconstraints. This was accomplished by synthesizing a daily hydrograph for the post-dam period (1957–1998),that represented annual peak discharges that would have occurred under unregulated flow conditions at varioushydrologic nodes in the system. We then compared benefits and liabilities under conditions of recorded andunregulated annual peak discharges for the post-dam period.
STUDY AREA
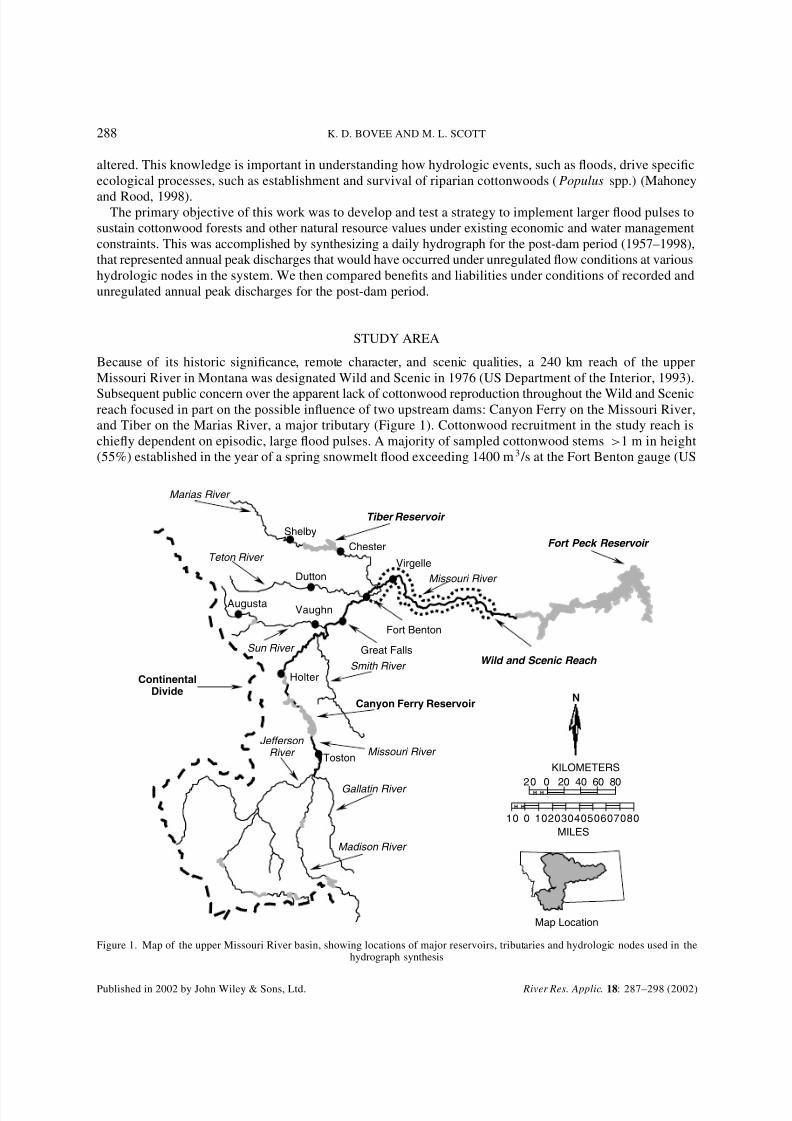
Because of its historic significance, remote character, and scenic qualities, a 240 km reach of the upperMissouri River in Montana was designated Wild and Scenic in 1976 (US Department of the Interior, 1993).
Subsequent public concern over the apparent lack of cottonwood reproduction throughout the Wild and Scenicreach focused in part on the possible influence of two upstream dams: Canyon Ferry on the Missouri River,and Tiber on the Marias River, a major tributary (Figure 1). Cottonwood recruitment in the study reach ischiefly dependent on episodic, large flood pulses. A majority of sampled cottonwood stems >1 m in height(55%) established in the year of a spring snowmelt flood exceeding 1400 m3 /s at the Fort Benton gauge (US
Marias River
Teton River
Missouri River
Missouri River
Madison River
Gallatin River
Jefferson
River
Sun River
Smith River Wild and Scenic Reach
Toston
Canyon Ferry Reservoir
Great Falls
Fort Benton
Vaughn
Holter
Augusta
Shelby
Chester
Dutton
Virgelle
Tiber Reservoir
Fort Peck Reservoir
ContinentalDivide
10 0 1020304050607080
KILOMETERS
MILES
Map Location
H H
H H
20 0 20 40 60 80
N
Figure 1. Map of the upper Missouri River basin, showing locations of major reservoirs, tributaries and hydrologic nodes used in thehydrograph synthesis
Published in 2002 by John Wiley & Sons, Ltd. River Res. Applic. 18: 287–298 (2002)
8/3/2019 Bovee and Scott 2002
http://slidepdf.com/reader/full/bovee-and-scott-2002 3/12
FLOOD PULSE RESTORATION FOR POPULUS REGENERATION 289
Geological Survey (USGS) gauge 06090800), or in the following two years. An additional 17% establishedfollowing an ice-related flood in March 1978. Approximately 30% of the cottonwoods in the study reach
established in non-flood years, typically in locations protected from ice disturbance, such as the downstreamends of channel islands or tributary fans (Scott et al., 1997). Spring floods >1400 m3 /s at Fort Benton have anestimated average recurrence interval of 9.3 years and establish seedlings above the zone of frequent ice-drivedisturbance observed along large, northern Great Plains rivers (Smith, 1980; Auble and Scott, 1998).
Meteorological and physiographic contributions to large flood pulses
Widespread and intense rainstorms along the eastern front of the Rocky Mountains in northern Montana,USA, and southern Alberta, Canada, are characteristic of the climatic history of the upper Missouri Riverbasin. Records indicate a period from 20 May through June when atmospheric conditions are most likelyto contribute to heavy rainfall in central Montana (US Weather Bureau, 1960). Heavy rainstorms have beendirectly involved in historical floods on the upper Missouri in 1894, 1906, 1908, 1916, 1927, 1938, 1948, 1953and 1964. Although antecedent conditions of snowmelt runoff and rain-soaked soils contributed in varying
degrees to these floods, they have been primarily rain-induced (Dightman, 1973).The elements necessary to produce heavy rain in the upper Missouri basin include (1) a source of warm,
moist air, (2) vertical lifting of this air mass by a combination of large and medium-scale atmosphericprocesses, which are (3) sustained over a period of hours or days. In previous flood-producing rainstorms,moisture-laden air from the Gulf of Mexico produced rainfall totals of up to 40 cm over a two to three dayperiod. The sustained vertical lifting of air necessary to produce the intensity of precipitation observed in thesestorms resulted from a combination of three factors. First, orographic lifting occurred as warm, moist upslopewinds encountered the steep slopes of local mountain ranges east of the Continental Divide. Second, air atthe surface and aloft near the storm centres converged horizontally and formed vortexes. Third, frontal liftingresulted when the warm air mass was forced over colder air at the surface (Dightman, 1950; US GeologicalSurvey, 1957; Bonner and Stermitz, 1967).
METHODS
Peak flow synthesis
We obtained daily discharge data for stations upstream from the major flood-control reservoirs (hereaftertermed headwater nodes) and used a time-lagged mass balance model (Dunne and Leopold, 1978) to routedaily flows to downstream nodes (hereafter termed collector nodes; Figure 1). We used USGS gauging stationrecords for all headwater and collector nodes, except for the Sun River above Gibson Reservoir. We alsoused USGS data for the Augusta station on the Sun River (USGS gauge 00608000) to determine traveltime from Gibson Reservoir to Vaughn (USGS gauge 06089000). However, USGS records for the Augustagauge were not available for the subject period of record, 1957–1999. For the Sun River headwater node, weobtained reservoir inflow data from the Bureau of Reclamation’s HYDROMET database (November 2000,
from <www.gp.usbr.gov/hydromet.htm>). Our downstream-most collector node was the USGS gauge atVirgelle (06109500). This gauge is near the upstream boundary of the Wild and Scenic reach, but downstreamfrom the Marias River confluence.
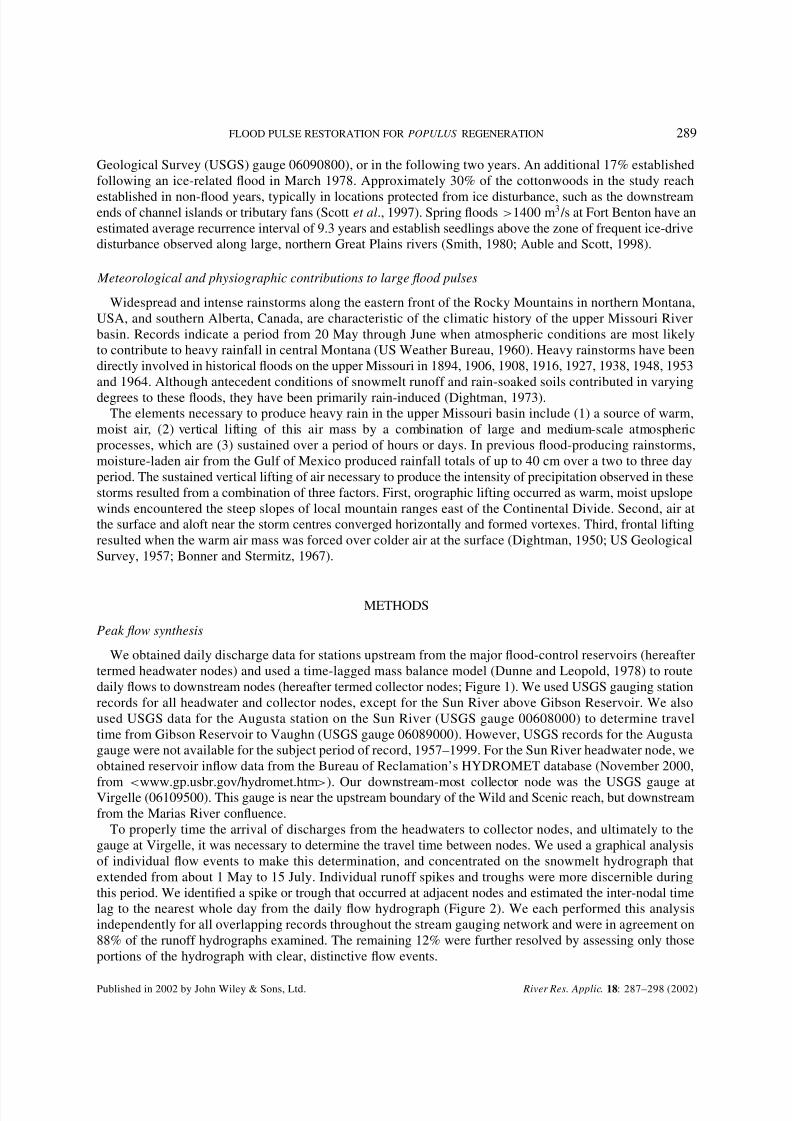
To properly time the arrival of discharges from the headwaters to collector nodes, and ultimately to thegauge at Virgelle, it was necessary to determine the travel time between nodes. We used a graphical analysisof individual flow events to make this determination, and concentrated on the snowmelt hydrograph thatextended from about 1 May to 15 July. Individual runoff spikes and troughs were more discernible duringthis period. We identified a spike or trough that occurred at adjacent nodes and estimated the inter-nodal timelag to the nearest whole day from the daily flow hydrograph (Figure 2). We each performed this analysisindependently for all overlapping records throughout the stream gauging network and were in agreement on88% of the runoff hydrographs examined. The remaining 12% were further resolved by assessing only thoseportions of the hydrograph with clear, distinctive flow events.
Published in 2002 by John Wiley & Sons, Ltd. River Res. Applic. 18: 287–298 (2002)
8/3/2019 Bovee and Scott 2002
http://slidepdf.com/reader/full/bovee-and-scott-2002 4/12
290 K. D. BOVEE AND M. L. SCOTT
Figure 2. Example runoff hydrographs for the Marias River at Shelby and the Missouri River at Fort Benton and Virgelle. The spikeat Virgelle corresponds to that at Shelby, lagged by two days, with little effect from the Fort Benton contribution
Individual spikes and troughs in the hydrograph were usually very discrete, so errors associated with theactual travel time on an hourly or sub-hourly time step were not considered problematic. However, our useof average daily flows instead of instantaneous flows will result in an underestimation of the true annualpeak flow at any node in the system. A discharge-dependent variable lag in some of the longer inter-nodalreaches was observed, even at a daily time step. For these reaches, we used a simple ‘IF-THEN’ rule to applya differential lag, depending on the discharge at the inflow. Inter-nodal reaches, distances, travel times, and‘IF-THEN’ conditions are listed in Table I.
To realistically simulate unregulated discharge at each collector node, it was necessary to estimate unmea-sured flow accretions (gains) and depletions (losses) between nodes. Using the time-lagged mass balance modelto estimate flow at upstream nodes, we compared flow differentials between nodes using the collector nodeimmediately downstream. During the peak runoff period, flow accretions predominated (e.g. from ungauged
tributaries). In contrast, flow depletions, such as bank storage losses, occurred 26% of the time with an averagedepletion equalling 5.2% of total flow.The final flow synthesis involved summing the lagged inflows from the upstream nodes and the inter-nodal
accretion or depletions for each collector node. For example, given an inflow greater than 170 m3 /s at theToston gauge (USGS gauge 06054500), the average daily discharge at the Great Falls gauge (USGS gauge06090300) was calculated as:
QGF,t = QTST,(t −3) +QGIB,(t −1) ±ACC(Holter-GreatFalls)
Table I. Travel times and IF-THEN conditions for hydrologic nodes in the upper Missouri River system
From To River Length (km) Lag (days) Conditions
Shelby Virgelle Marias 220 2 Shelby Q > 85 m3 /sShelby Virgelle Marias 220 3 Shelby Q < 85 m3 /sChester Virgelle Marias 133 1 Chester Q > 85 m3 /sChester Virgelle Marias 133 2 Chester Q < 85 m3 /sFt. Benton Virgelle Missouri 53 0 All Q
Dutton Virgelle Teton 131 1 All Q
Great Falls Ft. Benton Missouri 50 0 All Q
Augusta Vaughn Sun 111 1 All Q
Vaughn Great Falls Sun-Missouri 39 0 All Q
Holter Great Falls Missouri 139 1 Holter Q > 170 m3 /sHolter Great Falls Missouri 139 2 Holter Q < 170 m3 /sToston Holter Missouri 128 2 Toston Q > 170 m3 /sToston Holter Missouri 128 3 Toston Q < 170 m3 /s
Published in 2002 by John Wiley & Sons, Ltd. River Res. Applic. 18: 287–298 (2002)
8/3/2019 Bovee and Scott 2002
http://slidepdf.com/reader/full/bovee-and-scott-2002 5/12
FLOOD PULSE RESTORATION FOR POPULUS REGENERATION 291
where QGF is the average daily flow at the Great Falls gauge for day t , QTST,(t −3) was the average daily
flow at Toston three days earlier, QGIB,(t −1) was the inflow to Gibson Reservoir (Sun River) the previous
day, and ACC(Holter-GreatFalls) was the empirical accretion between Holter and Great Falls for day t . Depletionswere computed as negative accretions. Owing to the presence of Canyon Ferry Reservoir, we were unable to
calculate an empirical accretion for the reach between Toston and Holter. For day t , Great Falls then became
an upstream node to be lagged and summed appropriately with inflows from the Marias and Teton Rivers and
the accretion from Great Falls to Virgelle. Once the synthesized daily flow hydrograph had been constructedfor the 1 May–31 July runoff period, the maximum value for the period was recorded as the unregulated
daily peak discharge.
Determination of thresholds
Flows ≥1400 m3 /s as measured at the Fort Benton gauge were significantly associated with the successful
recruitment of cottonwood stands within the Wild and Scenic reach (Scott et al., 1997). However, because
the Marias River joins the Missouri below Fort Benton, we chose the gauge at Virgelle to represent flowconditions in the Wild and Scenic reach (Figure 1). We correlated flows between these two gauges to identify
the magnitude of stand-producing flows for cottonwood downstream of Virgelle.
Flow restoration
We used the results from a two-dimensional hydraulic simulation model (Ghanem et al., 1994, 1996)
and interpretation of aerial photographs to evaluate the effectiveness of different peak flows in establishing
cottonwoods within the Wild and Scenic reach (USGS, unpublished data). The section of river we examined
extended from the confluence of Arrow Creek downstream for a distance of approximately 9 km. A 1 : 40 000-scale aerial photograph (1996 National Aerial Photogrammetry Program) of the reach was scanned and
orth-rectified into the same map coordinate system used in the hydraulic models. Polygons of cottonwoodcanopy area were digitized from the photographic image, and superimposed with the water surface profile
predicted by the hydraulic models. The effectiveness of a particular discharge for establishing stands of
cottonwoods was measured as the union of its water surface with cottonwood polygons. In essence, we used
existing stands of mature cottonwoods as a measure of the water stage necessary to inundate locations where
there had been long-term cottonwood survival.
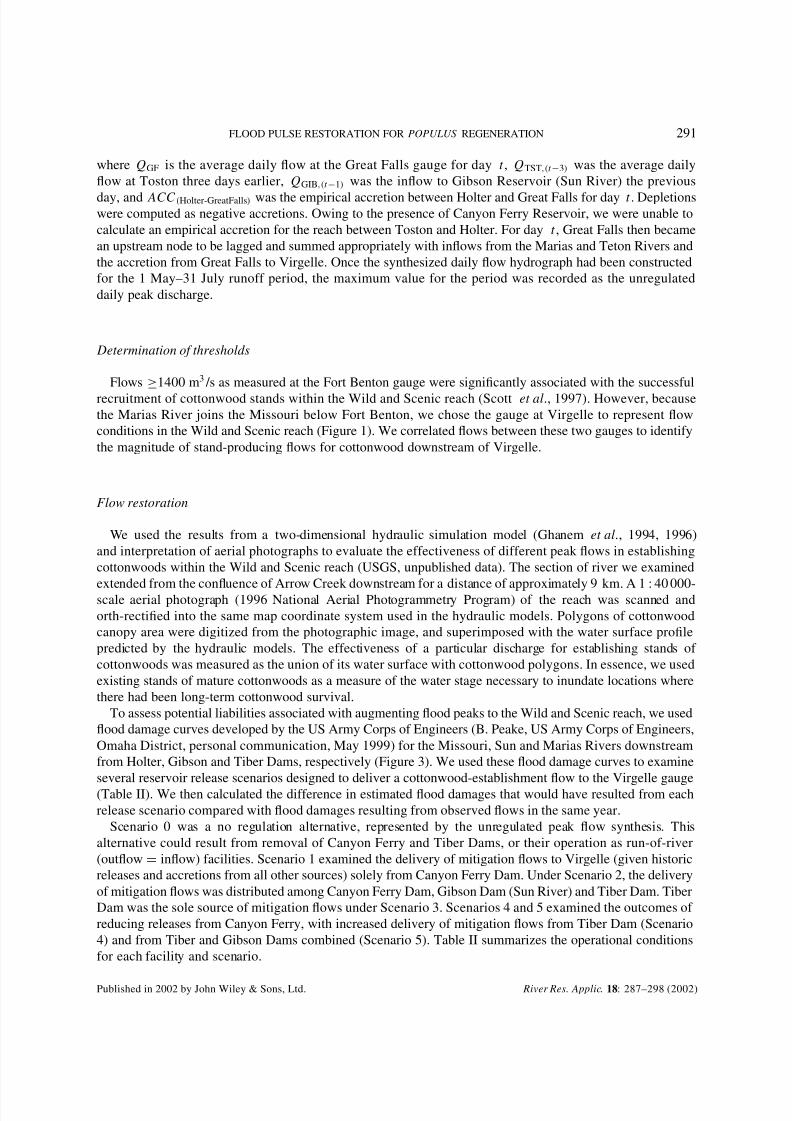
To assess potential liabilities associated with augmenting flood peaks to the Wild and Scenic reach, we usedflood damage curves developed by the US Army Corps of Engineers (B. Peake, US Army Corps of Engineers,
Omaha District, personal communication, May 1999) for the Missouri, Sun and Marias Rivers downstreamfrom Holter, Gibson and Tiber Dams, respectively (Figure 3). We used these flood damage curves to examine
several reservoir release scenarios designed to deliver a cottonwood-establishment flow to the Virgelle gauge
(Table II). We then calculated the difference in estimated flood damages that would have resulted from each
release scenario compared with flood damages resulting from observed flows in the same year.
Scenario 0 was a no regulation alternative, represented by the unregulated peak flow synthesis. This
alternative could result from removal of Canyon Ferry and Tiber Dams, or their operation as run-of-river
(outflow = inflow) facilities. Scenario 1 examined the delivery of mitigation flows to Virgelle (given historicreleases and accretions from all other sources) solely from Canyon Ferry Dam. Under Scenario 2, the delivery
of mitigation flows was distributed among Canyon Ferry Dam, Gibson Dam (Sun River) and Tiber Dam. TiberDam was the sole source of mitigation flows under Scenario 3. Scenarios 4 and 5 examined the outcomes of
reducing releases from Canyon Ferry, with increased delivery of mitigation flows from Tiber Dam (Scenario
4) and from Tiber and Gibson Dams combined (Scenario 5). Table II summarizes the operational conditions
for each facility and scenario.
Published in 2002 by John Wiley & Sons, Ltd. River Res. Applic. 18: 287–298 (2002)
8/3/2019 Bovee and Scott 2002
http://slidepdf.com/reader/full/bovee-and-scott-2002 6/12
292 K. D. BOVEE AND M. L. SCOTT
Figure 3. Flood damage curves for inter-nodal segments of the Missouri, Sun and Marias Rivers (source: US Army Corps of Engineers,Planning Division, Omaha District, March 1999)
Table II. Reservoir release scenarios to achieve minimum threshold discharge of 1850 m3 /sto the Wild and Scenic reach of the upper Missouri River
Scenario Year Canyon Ferry Gibson Tiber
0 All Outflow = inflow Outflow = inflow Outflow = inflow1 1975a Add 62 m3 /s Same as historic Same as historic1 1981 Add 400 m3 /s Same as historic Same as historic1 1995 Add 1096 m3 /s Same as historic Same as historic1 1997 Add 640 m3 /s Same as historic Same as historic2 1975a Same as historic Same as historic Add 62 m3 /s2 1981 Same as historic Same as historic Add 400 m3 /s2 1995 Add 283 m3 /s Add 142 m3 /s Add 578 m3 /s2 1997 Same as historic Add 71 m3 /s Add 569 m3 /s3 1975a Same as historic Same as historic Add 62 m3 /s3 1981 Same as historic Same as historic Add 400 m3 /s3 1995 Same as historic Same as historic Add 1096 m3 /s3 1997 Same as historic Same as historic Add 640 m3 /s4 1975a Same as historic Same as historic Add 62 m3 /s4 1981 Reduce 142 m3 /s Same as historic Add 547 m3 /s4 1995 Reduce 142 m3 /s Same as historic Add 1144 m3 /s4 1997 Reduce 283 m3 /s Same as historic Add 923 m3 /s5 1975a Same as historic Same as historic Add 62 m3 /s5 1981 Reduce 142 m3 /s Add 85 m3 /s Add 462 m3 /s5 1995 Reduce 142 m3 /s Add 142 m3 /s Add 1096 m3 /s
5 1997 Reduce 142 m3
/s Add 142 m3
/s Add 640 m3
/s
a Delivers Q > 2000 m3 /s to Virgelle.
RESULTS
Peak flow synthesis and cottonwood establishment
For the period 1935 to 1999, a discharge of 1400 m3 /s at Fort Benton corresponded to a discharge of 1850 m3 /s at Virgelle. Thus, a discharge of 1850 m3 /s was chosen to represent the minimum dischargethreshold needed to establish cottonwoods at elevations where they are likely to survive future ice-drivedisturbance.
Published in 2002 by John Wiley & Sons, Ltd. River Res. Applic. 18: 287–298 (2002)
8/3/2019 Bovee and Scott 2002
http://slidepdf.com/reader/full/bovee-and-scott-2002 7/12
FLOOD PULSE RESTORATION FOR POPULUS REGENERATION 293
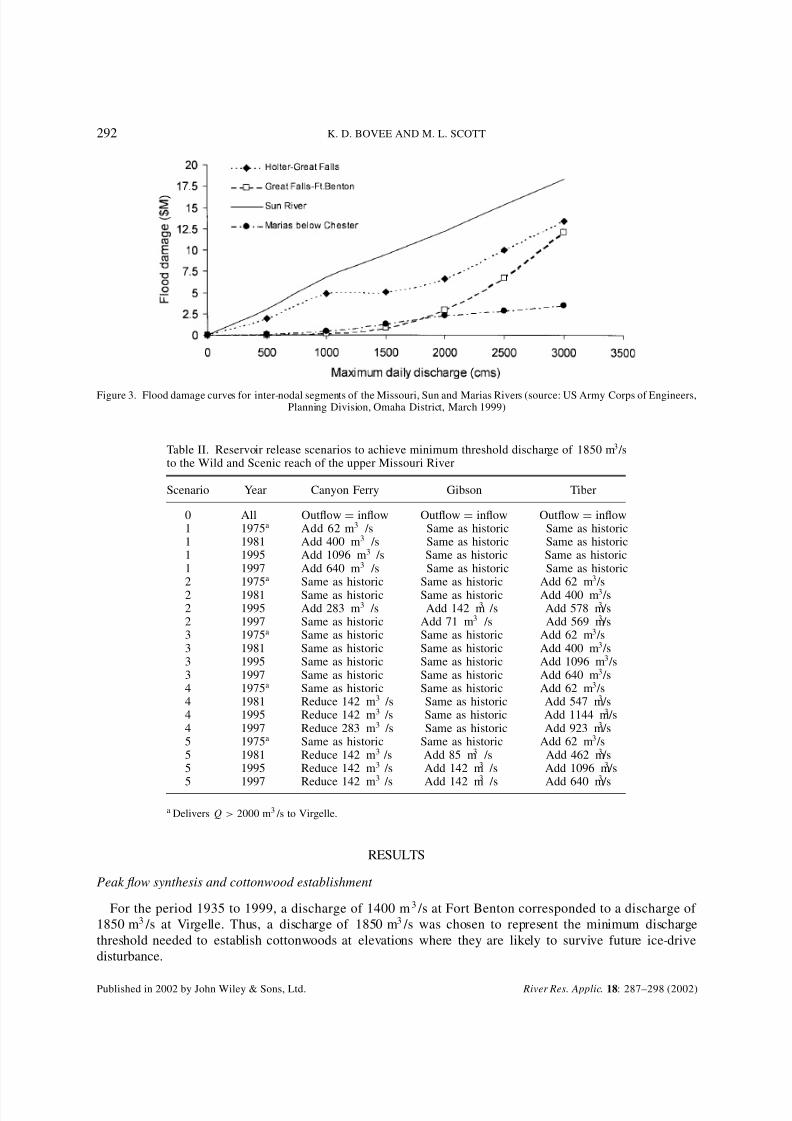
Figure 4. Comparison of synthesized and recorded maximum daily discharges at the Virgelle gauge
A comparison of synthesized and measured maximum daily discharges at the Virgelle gauge indicated thatflow regulation in the post-dam period has reduced the magnitude of peak flows in the Wild and Scenic portionof the upper Missouri River. This reduction was especially pronounced for large flow peaks, and reflectedthe effectiveness of flood control provided by the dams (Figure 4). For example, unregulated maximum dailydischarge at Virgelle in 1964 was estimated to have been 5759 m3 /s. The recorded maximum daily dischargefor this event was 2737 m3 /s, or a reduction of 52%. This flood included the failure of Swift dam on BirchCreek and Lower Two Medicine Dam on Two Medicine River following heavy rains in the upper MariasRiver basin. During this event, Tiber reservoir recorded a peak inflow of 5660 m 3 /s (Bonner and Stermitz,1967). Similarly, the maximum daily discharge in 1975 was reduced by 41%.
Flow effectiveness
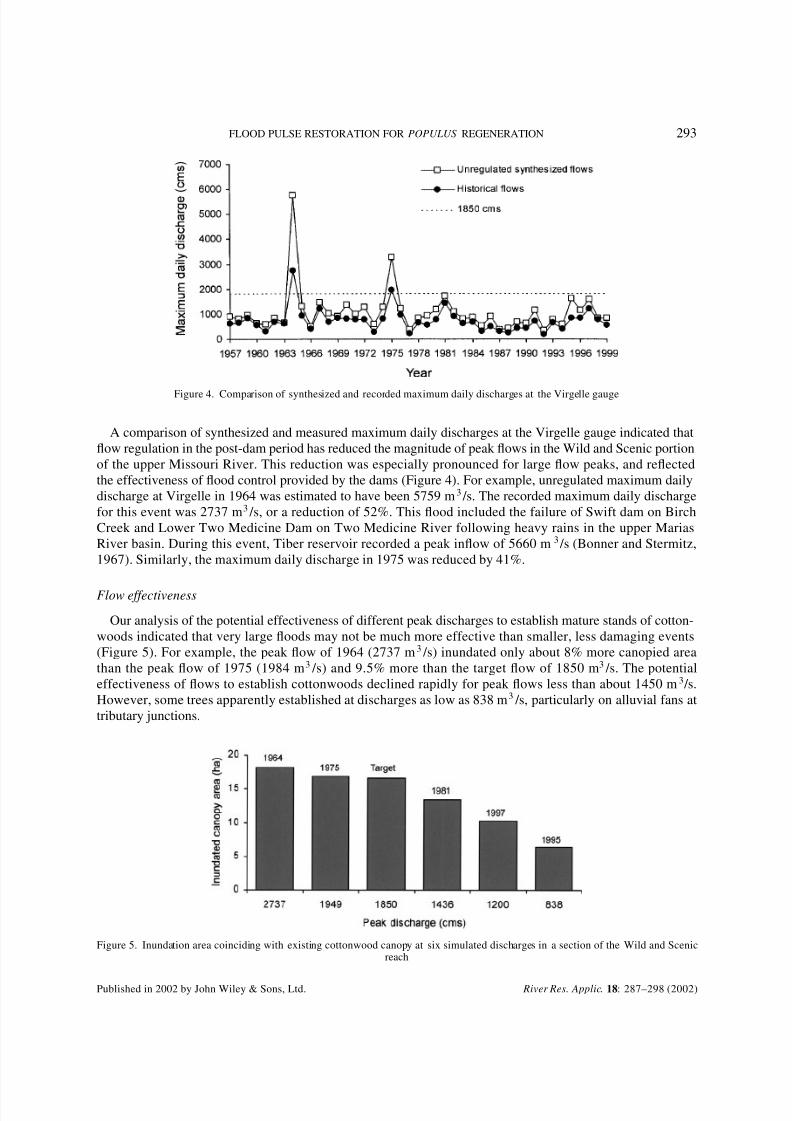
Our analysis of the potential effectiveness of different peak discharges to establish mature stands of cotton-woods indicated that very large floods may not be much more effective than smaller, less damaging events(Figure 5). For example, the peak flow of 1964 (2737 m3 /s) inundated only about 8% more canopied areathan the peak flow of 1975 (1984 m3 /s) and 9.5% more than the target flow of 1850 m3 /s. The potentialeffectiveness of flows to establish cottonwoods declined rapidly for peak flows less than about 1450 m3 /s.However, some trees apparently established at discharges as low as 838 m3 /s, particularly on alluvial fans attributary junctions.
Figure 5. Inundation area coinciding with existing cottonwood canopy at six simulated discharges in a section of the Wild and Scenicreach
Published in 2002 by John Wiley & Sons, Ltd. River Res. Applic. 18: 287–298 (2002)
8/3/2019 Bovee and Scott 2002
http://slidepdf.com/reader/full/bovee-and-scott-2002 8/12
294 K. D. BOVEE AND M. L. SCOTT
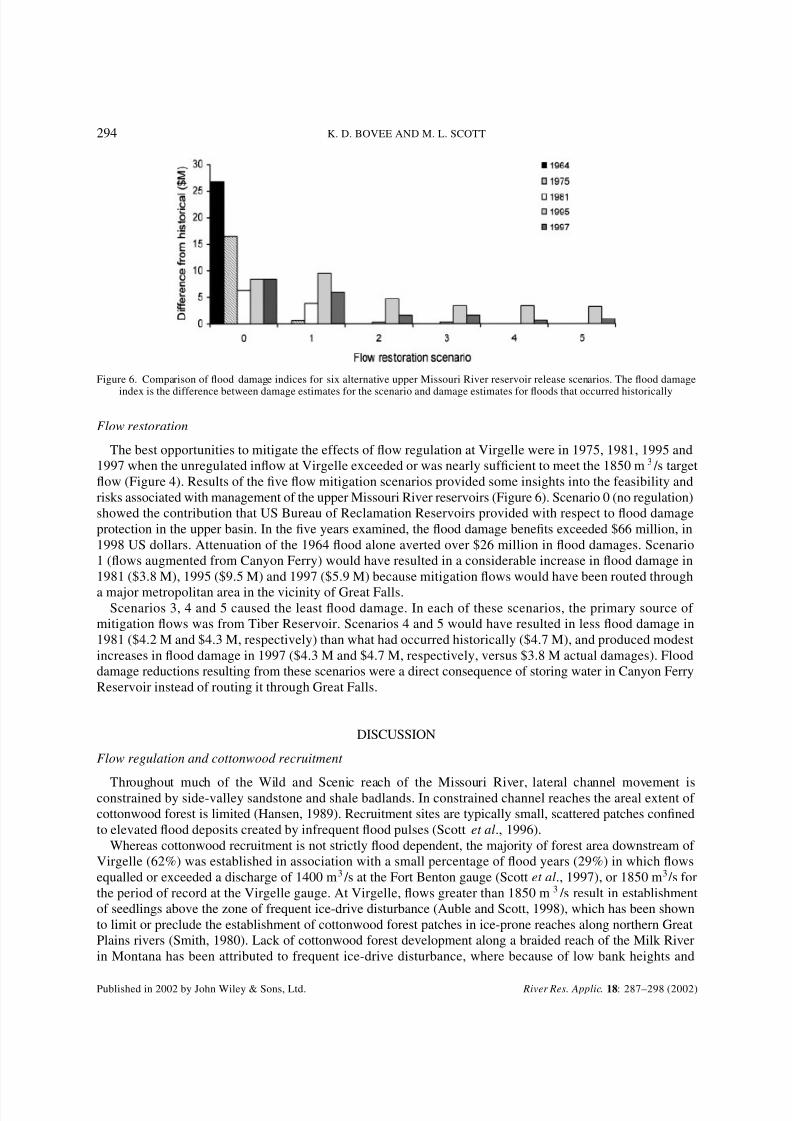
Figure 6. Comparison of flood damage indices for six alternative upper Missouri River reservoir release scenarios. The flood damage
index is the difference between damage estimates for the scenario and damage estimates for floods that occurred historically
Flow restoration
The best opportunities to mitigate the effects of flow regulation at Virgelle were in 1975, 1981, 1995 and1997 when the unregulated inflow at Virgelle exceeded or was nearly sufficient to meet the 1850 m3 /s targetflow (Figure 4). Results of the five flow mitigation scenarios provided some insights into the feasibility andrisks associated with management of the upper Missouri River reservoirs (Figure 6). Scenario 0 (no regulation)showed the contribution that US Bureau of Reclamation Reservoirs provided with respect to flood damageprotection in the upper basin. In the five years examined, the flood damage benefits exceeded $66 million, in1998 US dollars. Attenuation of the 1964 flood alone averted over $26 million in flood damages. Scenario1 (flows augmented from Canyon Ferry) would have resulted in a considerable increase in flood damage in1981 ($3.8 M), 1995 ($9.5 M) and 1997 ($5.9 M) because mitigation flows would have been routed through
a major metropolitan area in the vicinity of Great Falls.Scenarios 3, 4 and 5 caused the least flood damage. In each of these scenarios, the primary source of
mitigation flows was from Tiber Reservoir. Scenarios 4 and 5 would have resulted in less flood damage in1981 ($4.2 M and $4.3 M, respectively) than what had occurred historically ($4.7 M), and produced modestincreases in flood damage in 1997 ($4.3 M and $4.7 M, respectively, versus $3.8 M actual damages). Flooddamage reductions resulting from these scenarios were a direct consequence of storing water in Canyon FerryReservoir instead of routing it through Great Falls.
DISCUSSION
Flow regulation and cottonwood recruitment
Throughout much of the Wild and Scenic reach of the Missouri River, lateral channel movement isconstrained by side-valley sandstone and shale badlands. In constrained channel reaches the areal extent of cottonwood forest is limited (Hansen, 1989). Recruitment sites are typically small, scattered patches confinedto elevated flood deposits created by infrequent flood pulses (Scott et al., 1996).
Whereas cottonwood recruitment is not strictly flood dependent, the majority of forest area downstream of Virgelle (62%) was established in association with a small percentage of flood years (29%) in which flowsequalled or exceeded a discharge of 1400 m3 /s at the Fort Benton gauge (Scott et al., 1997), or 1850 m3 /s forthe period of record at the Virgelle gauge. At Virgelle, flows greater than 1850 m 3 /s result in establishmentof seedlings above the zone of frequent ice-drive disturbance (Auble and Scott, 1998), which has been shownto limit or preclude the establishment of cottonwood forest patches in ice-prone reaches along northern GreatPlains rivers (Smith, 1980). Lack of cottonwood forest development along a braided reach of the Milk Riverin Montana has been attributed to frequent ice-drive disturbance, where because of low bank heights and
Published in 2002 by John Wiley & Sons, Ltd. River Res. Applic. 18: 287–298 (2002)
8/3/2019 Bovee and Scott 2002
http://slidepdf.com/reader/full/bovee-and-scott-2002 9/12
FLOOD PULSE RESTORATION FOR POPULUS REGENERATION 295
a wide, straight channel, cottonwood stems are repeatedly bent, broken, sheared and toppled by ice blocks(Smith and Pearce, 2000).
Reduced peak flows below Tiber Reservoir have reduced cottonwood seedling recruitment along the uncon-strained channel of the Marias River, which is predicted to result in progressive riparian forest decline asmature trees die without replacement (Rood and Mahoney, 1995). Dam-related changes in the natural flowregime on the Marias River have contributed to the establishment and spread of the non-native tree Russianolive ( Elaeagnus angustifolia ) on moist low terraces and under mature cottonwood on higher terraces (Lesicaand Miles, 1999). Because of differences in reproductive strategies, non-native species like Russian olivemay replace native species like cottonwood and willow (Salix spp.) along flow-altered rivers (Shafroth et al.,1995; Stanford et al., 1996).
Restoration of more natural peak flow regime below Tiber Dam may result in short-term removal of riparian vegetation that has established as a consequence of lower peak flows in the post-dam period. Inaddition, cottonwood forest recruitment would likely benefit (Rood and Mahoney, 1995) as would othernatural resources, such as riparian bird diversity (Scott et al., in press) and native fish species, includingthe endangered pallid sturgeon (Scaphirhynclus albus) (Hesse et al., 1993). These resources are dependentupon natural variability in the frequency, magnitude, timing, duration and recession rates of annual floodpulses. Flow restoration remains a possibility in these reaches since there is currently little urban or industrialdevelopment on the bottomlands (Rood and Mahoney, 1995).
Flow restoration
Our analysis indicated that complete restoration of unregulated flows to the upper Missouri River basinwould result in extensive and costly flood damage to existing urban and agricultural infrastructure. However,considerable restoration or enhancement of riverine and riparian ecosystems may be possible along regulatedrivers by restoring more natural flow and temperature regimes (Stanford et al., 1996).
In the 9 km reach we modelled, the amount of canopied area inundated in 1995 (peak discharge = 838 m3 /s)was 35% of the maximum in 1964 (peak discharge = 2737 m3 /s), which would indicate potential cottonwoodrecruitment at relatively small peak discharges. Canopied areas inundated at discharges less than 1850 m3 /s,
however, were primarily associated with alluvial fans at the mouth of Arrow Creek and the mouths of gullies along the constrained channel. These locations appeared to be relatively protected from ice drivesand would therefore represent safe sites having greater probabilities of seedling survival than more exposedsites. Locations along constrained channel reaches were typically not inundated by discharges lower than1850 m3 /s.
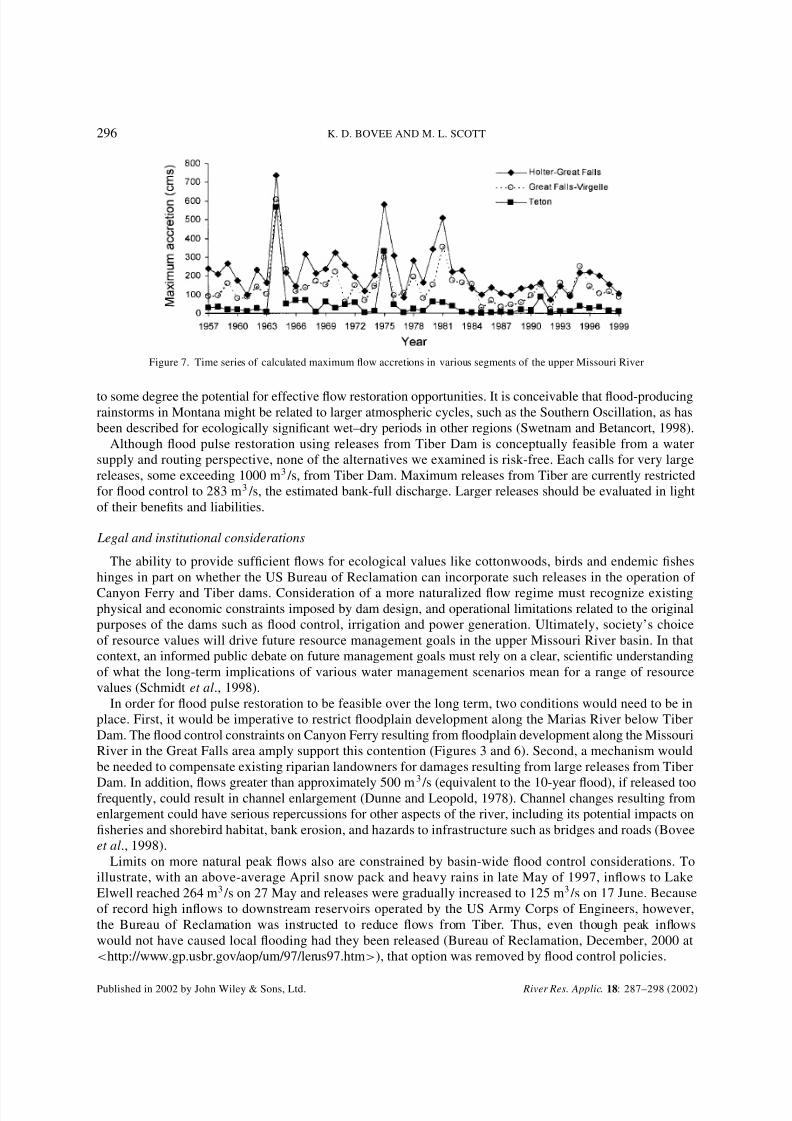
Under certain conditions, restoration of ecologically significant flood pulses to the upper Missouri wouldbe physically and economically feasible (Figure 6). The opportunity to augment flows occurs in years whenaccretions are relatively high in the Great Falls– Fort Benton reach (primarily from Belt and HighwoodCreeks) and in the Teton River drainage (Figure 7). We suggest increasing flows from Tiber Reservoir whenlarge runoff events occur in one or more of the Teton, Belt, Highwood or Smith River drainages. It should benoted, however, that successful mitigation flows will usually depend on a substantial discharge (≥1100 m3 /s)in the Missouri River at Great Falls.
The Teton River may be an important factor in providing the operational flexibility to restore flood pulses inthis basin. The Teton, which has no dams, has historically produced large flood pulses at Virgelle (Figure 7).Because the Teton and Marias Rivers have adjacent watersheds, large runoff events in the Teton are oftenmatched in the Marias. By monitoring real-time discharge at the accretion sources, it should be possible torelease water from Tiber such that it arrives at Virgelle coincident with the runoff spikes from other streams.Also, emergency telemetering equipment could automatically alert dam operators of large inflows at any orall of these nodes.
The evidence that large floods in these basins are rain-induced may be used to advantage in a flowrestoration strategy. Although individual heavy rainstorms are not entirely predictable, conditions favourableto such events are certainly recognizable. A key factor is the northwesterly movement of warm, moist airfrom the Gulf of Mexico into central Montana in late May and early June. Because these meteorologicalconditions are predicated on continental, and perhaps global, weather patterns, it may be possible to anticipate
Published in 2002 by John Wiley & Sons, Ltd. River Res. Applic. 18: 287–298 (2002)
8/3/2019 Bovee and Scott 2002
http://slidepdf.com/reader/full/bovee-and-scott-2002 10/12
296 K. D. BOVEE AND M. L. SCOTT
Figure 7. Time series of calculated maximum flow accretions in various segments of the upper Missouri River
to some degree the potential for effective flow restoration opportunities. It is conceivable that flood-producingrainstorms in Montana might be related to larger atmospheric cycles, such as the Southern Oscillation, as hasbeen described for ecologically significant wet–dry periods in other regions (Swetnam and Betancort, 1998).
Although flood pulse restoration using releases from Tiber Dam is conceptually feasible from a watersupply and routing perspective, none of the alternatives we examined is risk-free. Each calls for very largereleases, some exceeding 1000 m3 /s, from Tiber Dam. Maximum releases from Tiber are currently restrictedfor flood control to 283 m3 /s, the estimated bank-full discharge. Larger releases should be evaluated in lightof their benefits and liabilities.
Legal and institutional considerations
The ability to provide sufficient flows for ecological values like cottonwoods, birds and endemic fisheshinges in part on whether the US Bureau of Reclamation can incorporate such releases in the operation of
Canyon Ferry and Tiber dams. Consideration of a more naturalized flow regime must recognize existingphysical and economic constraints imposed by dam design, and operational limitations related to the originalpurposes of the dams such as flood control, irrigation and power generation. Ultimately, society’s choiceof resource values will drive future resource management goals in the upper Missouri River basin. In thatcontext, an informed public debate on future management goals must rely on a clear, scientific understandingof what the long-term implications of various water management scenarios mean for a range of resourcevalues (Schmidt et al., 1998).
In order for flood pulse restoration to be feasible over the long term, two conditions would need to be inplace. First, it would be imperative to restrict floodplain development along the Marias River below TiberDam. The flood control constraints on Canyon Ferry resulting from floodplain development along the MissouriRiver in the Great Falls area amply support this contention (Figures 3 and 6). Second, a mechanism wouldbe needed to compensate existing riparian landowners for damages resulting from large releases from Tiber
Dam. In addition, flows greater than approximately 500 m3
/s (equivalent to the 10-year flood), if released toofrequently, could result in channel enlargement (Dunne and Leopold, 1978). Channel changes resulting fromenlargement could have serious repercussions for other aspects of the river, including its potential impacts onfisheries and shorebird habitat, bank erosion, and hazards to infrastructure such as bridges and roads (Boveeet al., 1998).
Limits on more natural peak flows also are constrained by basin-wide flood control considerations. Toillustrate, with an above-average April snow pack and heavy rains in late May of 1997, inflows to LakeElwell reached 264 m3 /s on 27 May and releases were gradually increased to 125 m3 /s on 17 June. Becauseof record high inflows to downstream reservoirs operated by the US Army Corps of Engineers, however,the Bureau of Reclamation was instructed to reduce flows from Tiber. Thus, even though peak inflowswould not have caused local flooding had they been released (Bureau of Reclamation, December, 2000 at<http://www.gp.usbr.gov/aop/um/97/lerus97.htm>), that option was removed by flood control policies.
Published in 2002 by John Wiley & Sons, Ltd. River Res. Applic. 18: 287–298 (2002)
8/3/2019 Bovee and Scott 2002
http://slidepdf.com/reader/full/bovee-and-scott-2002 11/12
FLOOD PULSE RESTORATION FOR POPULUS REGENERATION 297
Another risk associated with supplying large pulse flows from Tiber Reservoir is related to changes inreservoir operations that would be necessary to provide the release. In a normal flood control operation,
reservoir storage is drawn down prior to the runoff period to reserve storage for flood detention. This operatingpolicy would need to be changed in order to take advantage of the opportunistic flood pulse strategy wehave described. Although Tiber has the capability to release over 2000 m3 /s, capacity of the outlet gates isapproximately 133 m3 /s. To achieve a pulse flow of more than 133 m3 /s, it would be necessary to releasethe remainder from the gated spillway. One of two conditions would be required in order to make such arelease: (1) water for mitigation flows would need to be stored ahead of time behind the spillway gate, or (2)inflow from the Marias River must greatly exceed the flood storage pool, necessitating a spill. Neither of thesescenarios may be acceptable to the Bureau of Reclamation, and may not be possible under present operatingrules. Maintaining the management flexibility to restore more natural flows will require modification of thecurrent operating policies of at least some of the system reservoirs, or revision of the Corps of EngineersFlood Control Manual. Ultimately, changes in operation to benefit natural resource values may need to bereviewed as part of an Environmental Impact Statement under the National Environmental Policy Act (NEPA).
CONCLUSIONS
Flow regulation in the upper Missouri River basin has reduced the magnitude of infrequent, large flood pulsesby as much as 40 to 50%. Reducing the observed frequency of flood pulses >1850 m3 /s is expected to limitsuccessful cottonwood recruitment. Floods of this magnitude establish cottonwood seedlings above the zoneof frequent ice-drive disturbance throughout constrained channel reaches of the Wild and Scenic MissouriRiver. A target pulse flow of 1850 m3 /s appears to be efficient for cottonwood recruitment. Larger peak flowsdo not inundate substantially greater areas of mature cottonwoods in the Wild and Scenic reach, but can causeserious flood damage along the upper Missouri. Cottonwood recruitment occurs at flows less than 1850 m3 /s,but appears to be confined to locations that are sheltered from ice-drive disturbance.
Our results further suggest that restoration of more natural flood pulses to benefit cottonwoods and other
natural resource values is physically and economically feasible, using opportunistic releases from Tiber Dam.The operational policies of the US Bureau of Reclamation would have to be modified, however, in order totake full advantage of opportunities provided by episodic, high runoff events. Mechanisms for limiting futuredevelopment on floodplains and compensating existing landowners for property loss and flood liabilities alongthe Missouri and Marias Rivers would ultimately need to be part of a comprehensive basin-wide approach toflow restoration.
ACKNOWLEDGMENTS
Funding for this study was provided in part by the Montana Area Office of the US Bureau of Reclamationand the US Geological Survey. Bob Bergantino offered insight into the geology of the upper Missouri Riverbasin. Greg Auble, W. Carter Johnson, Lee Lamb, Patrick Shafroth, and an anonymous reviewer provided
valuable comments on earlier drafts of this document.
REFERENCES
Auble GT, Scott ML. 1998. Fluvial disturbance patches and cottonwood recruitment along the upper Missouri River, Montana. Wetlands
18: 546–556.
Bonner FC, Stermitz F. 1967. Floods of June 1964 in Northwestern Montana. US Geological Survey, Water-Supply Paper 1840-B.
Bovee KD, Lamb BL, Bartholow JM, Stalnaker CB, Taylor J, Henriksen J. 1998. Stream Habitat Analysis using the Instream Flow
Incremental Methodology. US Geological Survey, Information and Technology Report USGS/BRD-1998-0004.
Dightman RA. 1950. Montana Marias basin rainstorm, June 16–17, 1948. Monthly Weather Review 78: 6–12.
Dightman RA. 1973. Meteorological developments contributing to the flood. In Flood of June 1964 in the Oldman and Milk River
Basins, Alberta. Warner LA (ed.). Technical Bulletin No. 73. Inland Waters Directorate, Water Resources Branch: Ottawa; 79– 81.
Dunne T, Leopold LB. 1978. Water in Environmental Planning. W.H Freeman: San Francisco.
Published in 2002 by John Wiley & Sons, Ltd. River Res. Applic. 18: 287–298 (2002)
8/3/2019 Bovee and Scott 2002
http://slidepdf.com/reader/full/bovee-and-scott-2002 12/12
298 K. D. BOVEE AND M. L. SCOTT
Dynesis M, Nilsson C. 1994. Fragmentation and flow regulation of river systems in the northern third of the world. Science 266:
753–762.
Ghanem A, Steffler P, Hicks F, Katopodis C. 1994. Two-dimensional finite element modeling of physical fish habitat. Proceedings of
First Internation Symposium on Habitat Hydraulics, Trondheim, Norway.
Ghanem A, Steffler P, Hicks F, Katopodis C. 1996. Two-dimensional simulation of physical habitat conditions in flowing streams.
Regulated Rivers: Research and Management 12: 185–200.
Graf WL. 1999. Dam nation: A geographic census of American dams and their large-scale hydrologic impacts. Water Resources Research
35: 1305–1311.
Hansen PL. 1989. Inventory, classification, and management of riparian sites along the Upper Missouri National Wild and Scenic River .
Final Report. Montana Riparian Association, Montana Forest and Conservation Experiment Station, School of Forestry, University
of Montana: Missoula, Montana.
Hesse LW, Mestl GE, Robinson JW. 1993. Status of selected fishes in the Missouri River in Nebraska with recommendations for their
recovery. In Restoration Planning for the Rivers of the Mississippi River Ecosystem , Hesse LW, Stalnaker CB, Benson NG, Zuboy JR
(eds). Biology Report 19. US Department of the Interior, National Biological Survey: Washington, DC.
Johnson WC, Burgess RL, Keammerer WR. 1976. Forest overstory vegetation and environment on the Missouri River floodplain in
North Dakota. Ecological Monographs 46: 59–84.
Lesica P, Miles S. 1999. Russian olive invasion into cottonwood forests along a regulated river in north-central Montana. Canadian
Journal of Botany77
: 1077–4083.Ligon FK, Dietrich WE, Trush WJ. 1995. Downstream ecological effects of dams. BioScience 45: 183–192.
Mahoney JM, Rood SB. 1998. Streamflow requirements for cottonwood seedling recruitment—an integrative model. Wetlands 18:
634–645.
Poff NL, Allen JD, Bain MB, Karr JR, Prestegaard KL, Richter BD, Sparks RE, Stromberg JC. 1997. The natural flow regime: a
paradigm for river conservation and restoration. BioScience 47: 769–784.
Rood SB, Mahoney JM. 1990. Collapse of riparian poplar forests downstream from dams in western prairies: Probable causes and
prospects for mitigation. Environmental Management 14: 451–164.
Rood SB, Mahoney JM. 1995. River damming and riparian cottonwoods along the Marias River, Montana. Rivers 5: 195–207.
Schmidt JC, Webb RH, Valdez RA, Marzolf GR, Stevens LE. 1998. Science and values in river restoration in the Grand Canyon.
BioScience 48: 735–747.
Scott ML, Friedman JM, Auble GT. 1996. Fluvial process and the establishment of bottomland trees. Geomorphology 14: 327–339.
Scott ML, Auble GT, Friedman JM. 1997. Flood dependency of cottonwood establishment along the Missouri River, Montana, USA.
Ecological Applications 7: 677–690.
Scott ML, Skagen SK, Merigliano MF. In press. Relating geomorphic change and grazing to avian communities in riparian forests.
Conservation Biology.Shafroth PB, Auble GT, Scott ML. 1995. Germination and establishment of the native plains cottonwood ( Populus deltoides Marshall
subsp. monilifera) and the exotic Russian-olive ( Elaeagnus angustifolia L.) Conservation Biology 9: 1169– 1175.
Smith DG. 1980. River ice processes: thresholds and geomorphologic effects in northern and mountain rivers. In Thresholds in
Geomorphology, Coates DR, Vitek JD (eds). Allen & Unwin: London.
Smith DG, Pearce CM. 2000. River ice and its role in limiting woodland development on a sandy braid-plain, Milk River, Montana.
Wetlands 20: 232–250.
Stanford JA, Ward JV, Liss WJ, Frissell CA, Williams RN, Lichatowich JA, Coutant CC. 1996. A general protocol for restoration of
regulated rivers. Regulated Rivers: Research and Management 12: 391–413.
Swetnam TW, Betancourt JL. 1998. Mesoscale disturbance and ecological response to decadal climatic variability in the American
Southwest. Journal of Climate 11: 3128–3147.
US Department of the Interior. 1993. Upper Missouri National Wild and Scenic River Management Plan Update. Bureau of Land
Management: Lewistown, Montana.
US Geological Survey. 1957. Floods of May–June 1953 in Missouri River Basin in Montana . Geological Survey Water-Supply Paper
1320-B.
US Weather Bureau. 1960. Climates of the States, Montana: Climatography of the United States. No. 60-24. US Department of Commerce: Washington, DC.
Published in 2002 by John Wiley & Sons, Ltd. River Res. Applic. 18: 287–298 (2002)