Embed Size (px)
Citation preview

Boustead Singapore Limited /Boustead Projects LimitedJoint FY2015 Financial Results Presentation
26 M
AY 2
015

Disclaimer
This presentation contains certain statements that are not statements of historical fact such as forward-looking statements. These statements are based on current expectations, projections and assumptions about future events. Although Boustead Singapore Limited and Boustead Projects Limited believe that these expectations, projections and assumptions are reasonable, these statements are subject to the risks (whether known or unknown), uncertainties and assumptions about the companies and their business operations such as the general economic, business and political conditions in Singapore and globally; currency fluctuations between the Singapore dollar and other currencies; governmental, statutory, regulatory or administrative initiatives affecting their businesses; industry trends; future levels and composition of their assets and liabilities; future profitability of their operations; competition; changes in Singapore tax laws or similar laws and regulations; changes in or the failure to comply with government regulations including exchange control regulations if any.
You are advised not to place undue reliance on these statements as the forward-looking events referred to in this presentation may differ materially or not occur due to these risks, uncertainties and assumptions.
Investors should assume that the information in this presentation is accurate only as of the date it is issued. Boustead Singapore Limited and Boustead Projects Limited have no obligations to update or revise any statements, whether as a result of new information, future events or otherwise, except as required by law.

Presentation Agenda
Overview Group Financial Review Division Performance Review Questions & Answers

Overview
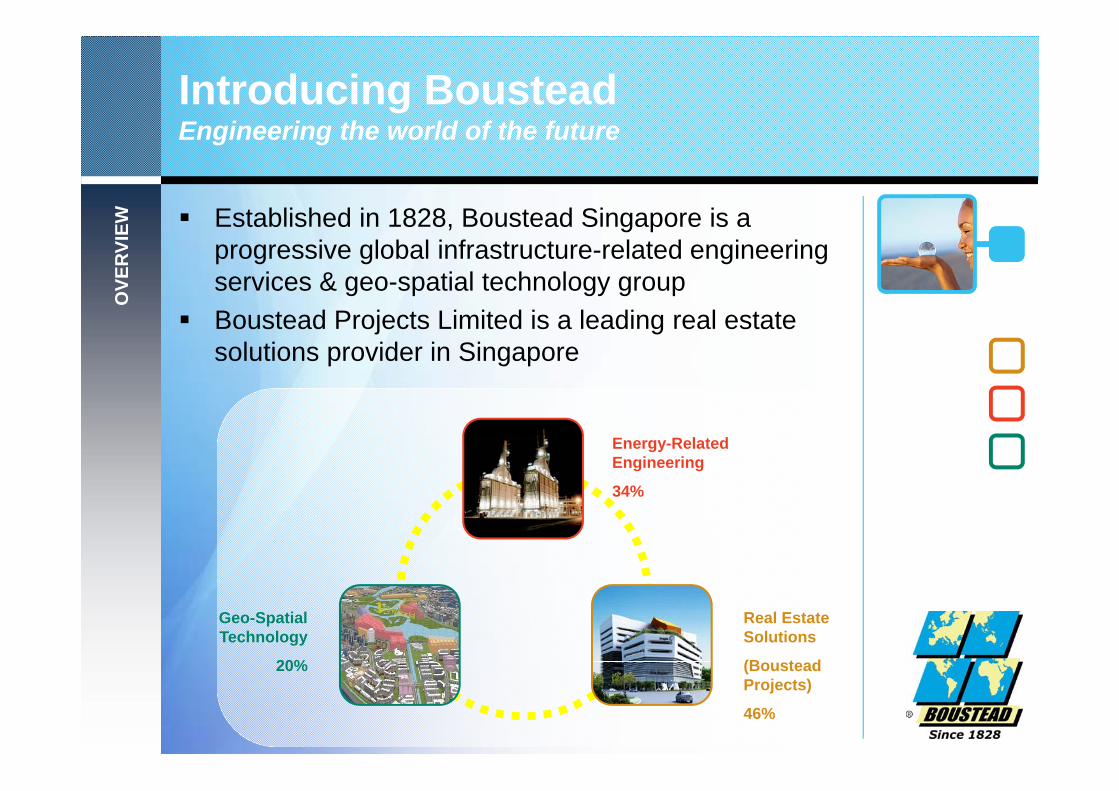
Introducing BousteadEngineering the world of the future
Established in 1828, Boustead Singapore is a progressive global infrastructure-related engineering services & geo-spatial technology group
Boustead Projects Limited is a leading real estate solutions provider in Singapore
OVE
RVI
EW
Energy-Related Engineering
34%
Real Estate Solutions
(Boustead Projects)
46%
Geo-Spatial Technology
20%
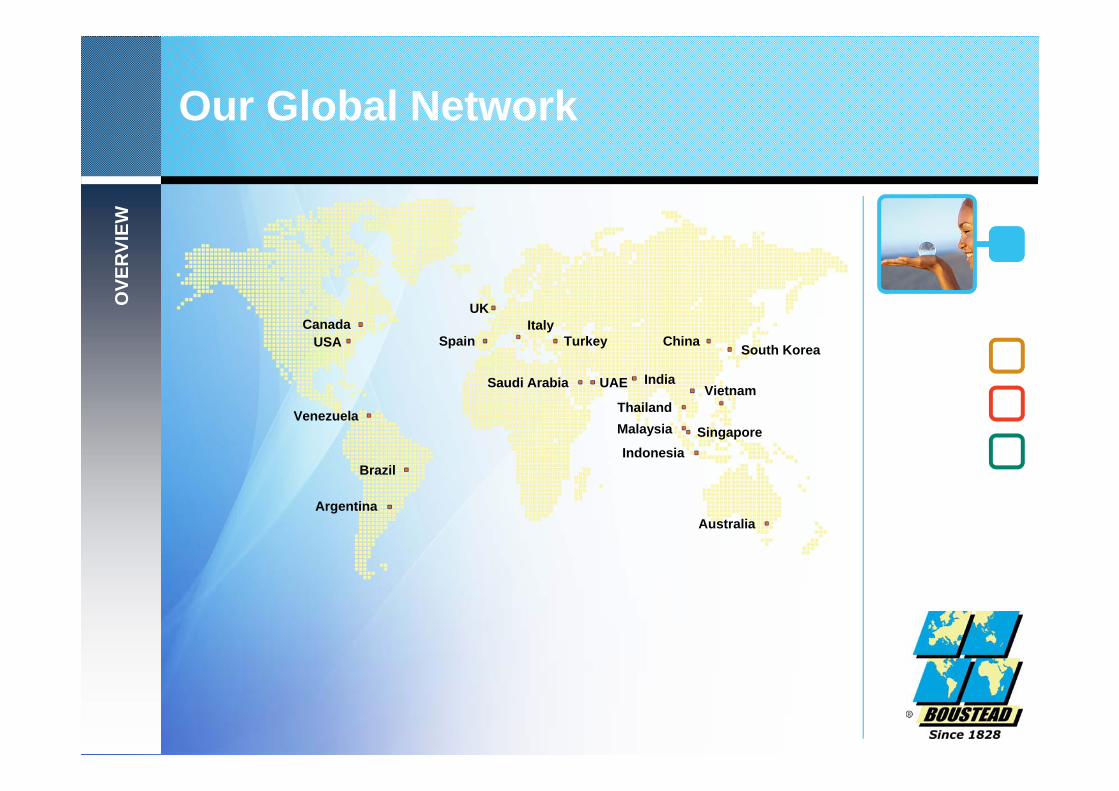
Our Global Network
CanadaUSA
Venezuela
Brazil
ArgentinaAustralia
South Korea
SingaporeMalaysia
Indonesia
VietnamThailand
IndiaUAESaudi Arabia
TurkeyItaly
Spain
UK
China
OVE
RVI
EW
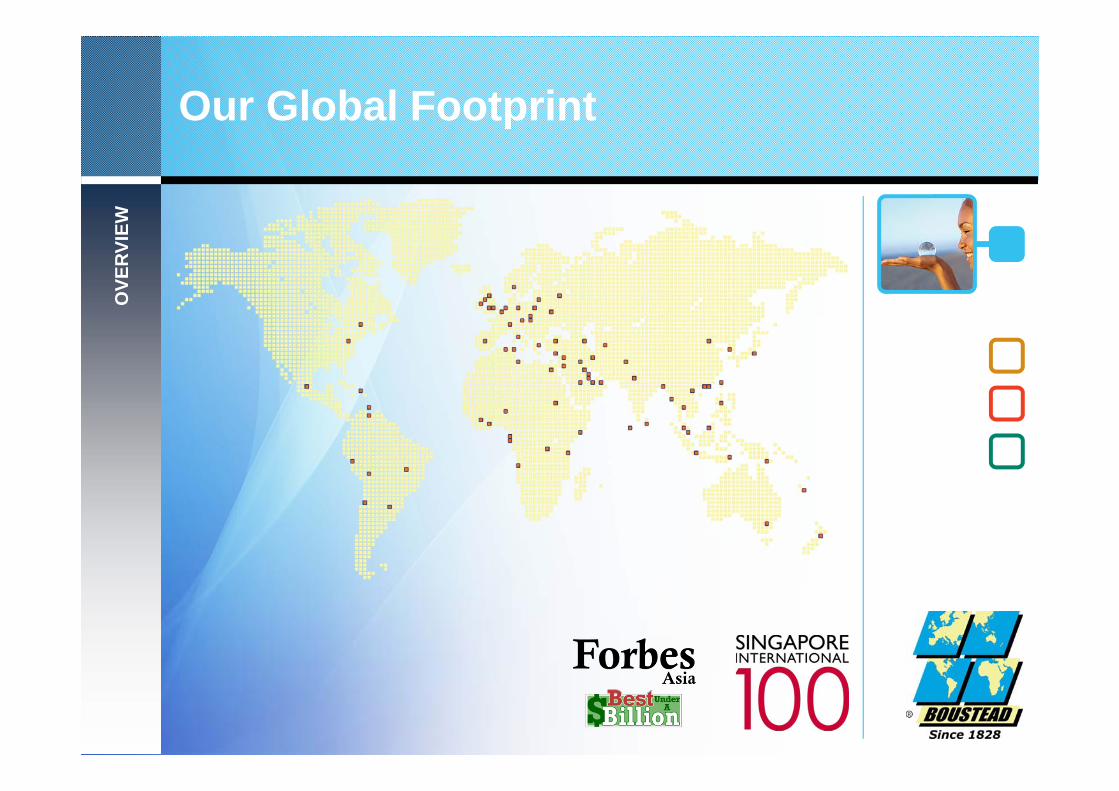
Our Global FootprintO
VER
VIEW
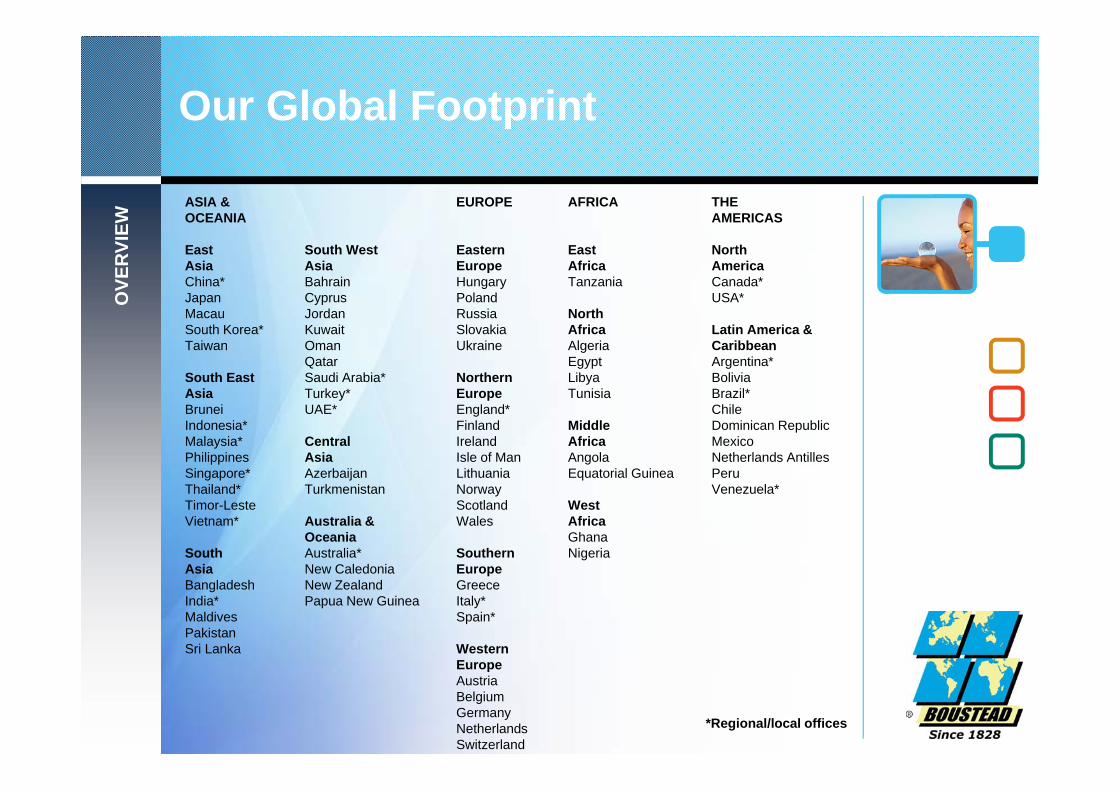
Our Global Footprint
ASIA &OCEANIA
EastAsiaChina*JapanMacauSouth Korea*Taiwan
South EastAsiaBruneiIndonesia*Malaysia*PhilippinesSingapore*Thailand*Timor-LesteVietnam*
SouthAsiaBangladeshIndia*MaldivesPakistanSri Lanka
South WestAsiaBahrainCyprusJordanKuwaitOmanQatarSaudi Arabia*Turkey*UAE*
CentralAsiaAzerbaijanTurkmenistan
Australia &OceaniaAustralia*New CaledoniaNew ZealandPapua New Guinea
EUROPE
EasternEuropeHungaryPolandRussiaSlovakiaUkraine
NorthernEuropeEngland*FinlandIrelandIsle of ManLithuaniaNorwayScotlandWales
SouthernEuropeGreeceItaly*Spain*
WesternEuropeAustriaBelgiumGermanyNetherlandsSwitzerland
AFRICA
EastAfricaTanzania
NorthAfricaAlgeriaEgyptLibyaTunisia
MiddleAfricaAngolaEquatorial Guinea
WestAfricaGhanaNigeria
THEAMERICAS
NorthAmericaCanada*USA*
Latin America &CaribbeanArgentina*BoliviaBrazil*ChileDominican RepublicMexicoNetherlands AntillesPeruVenezuela*
*Regional/local offices
OVE
RVI
EW

Group Financial Review
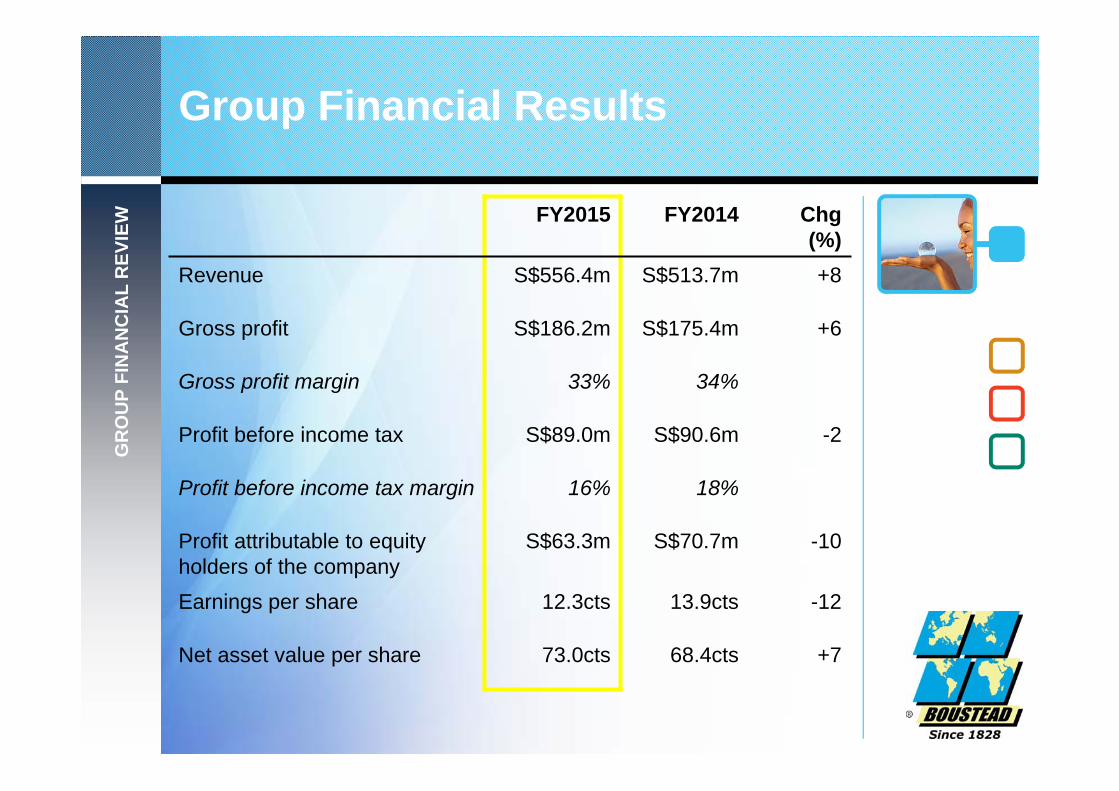
Group Financial Results
FY2015 FY2014 Chg(%)
Revenue S$556.4m S$513.7m +8
Gross profit S$186.2m S$175.4m +6
Gross profit margin 33% 34%
Profit before income tax S$89.0m S$90.6m -2
Profit before income tax margin 16% 18%
Profit attributable to equity holders of the company
S$63.3m S$70.7m -10
Earnings per share 12.3cts 13.9cts -12
Net asset value per share 73.0cts 68.4cts +7
GR
OU
P FI
NA
NC
IAL
REV
IEW
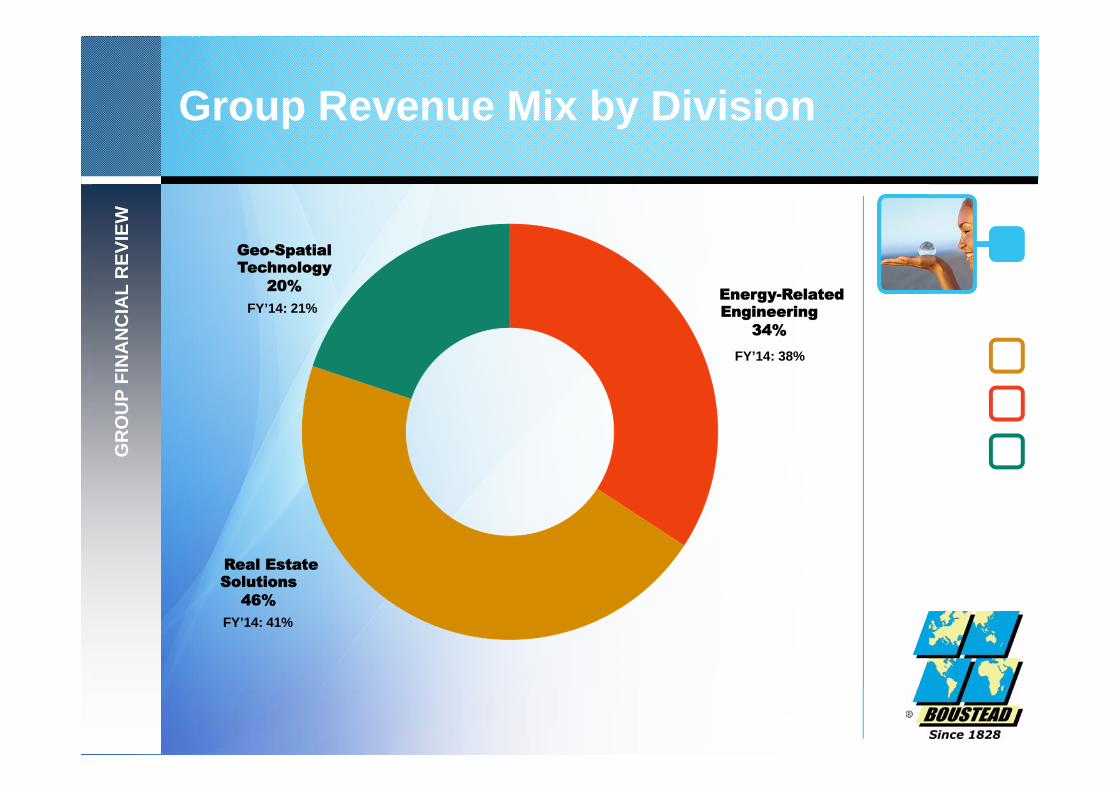
Group Revenue Mix by DivisionG
RO
UP
FIN
AN
CIA
L R
EVIE
W
FY’14: 21%
FY’14: 41%
FY’14: 38%
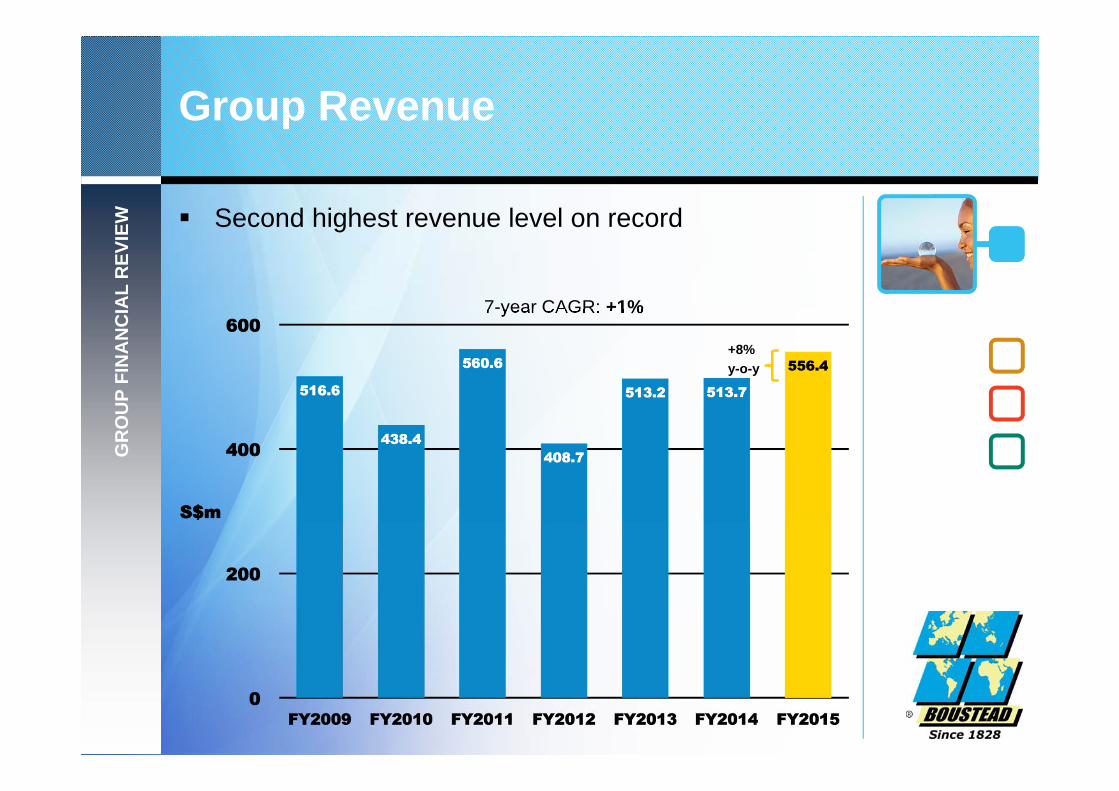
Group RevenueG
RO
UP
FIN
AN
CIA
L R
EVIE
W
7-year CAGR: +1%
Second highest revenue level on record
+8%y-o-y
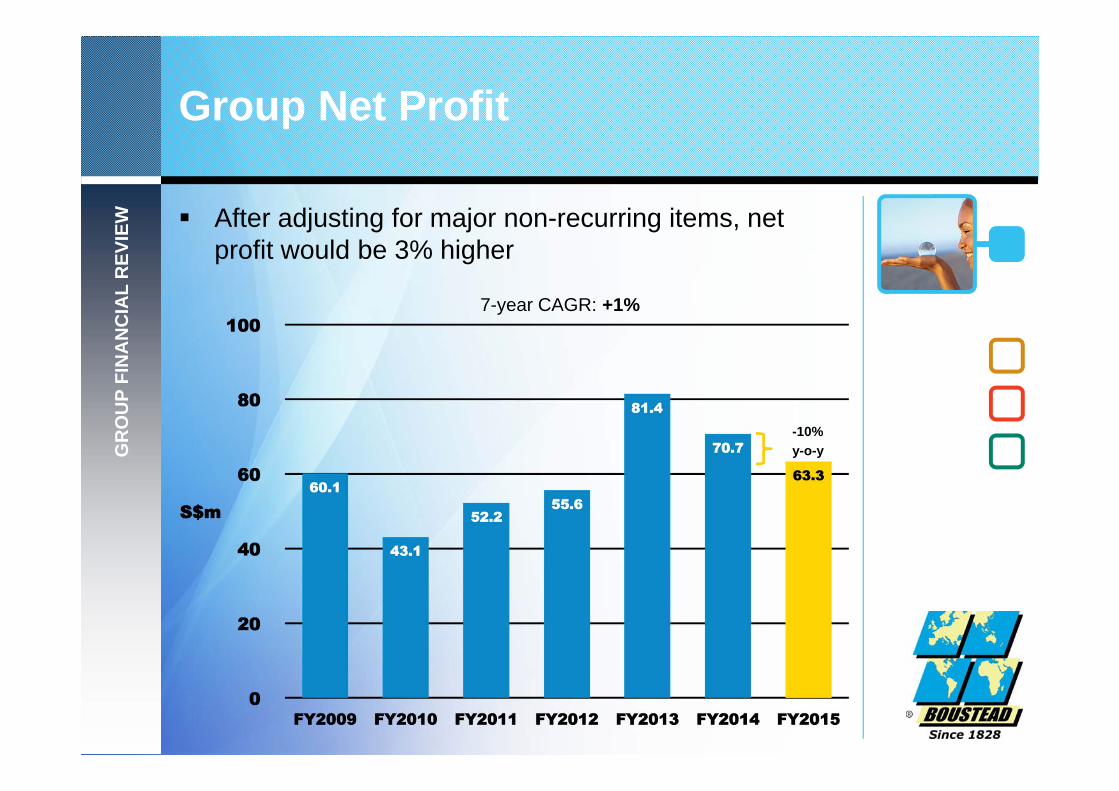
Group Net Profit
After adjusting for major non-recurring items, net profit would be 3% higher
GR
OU
P FI
NA
NC
IAL
REV
IEW
7-year CAGR: +1%
-10%y-o-y
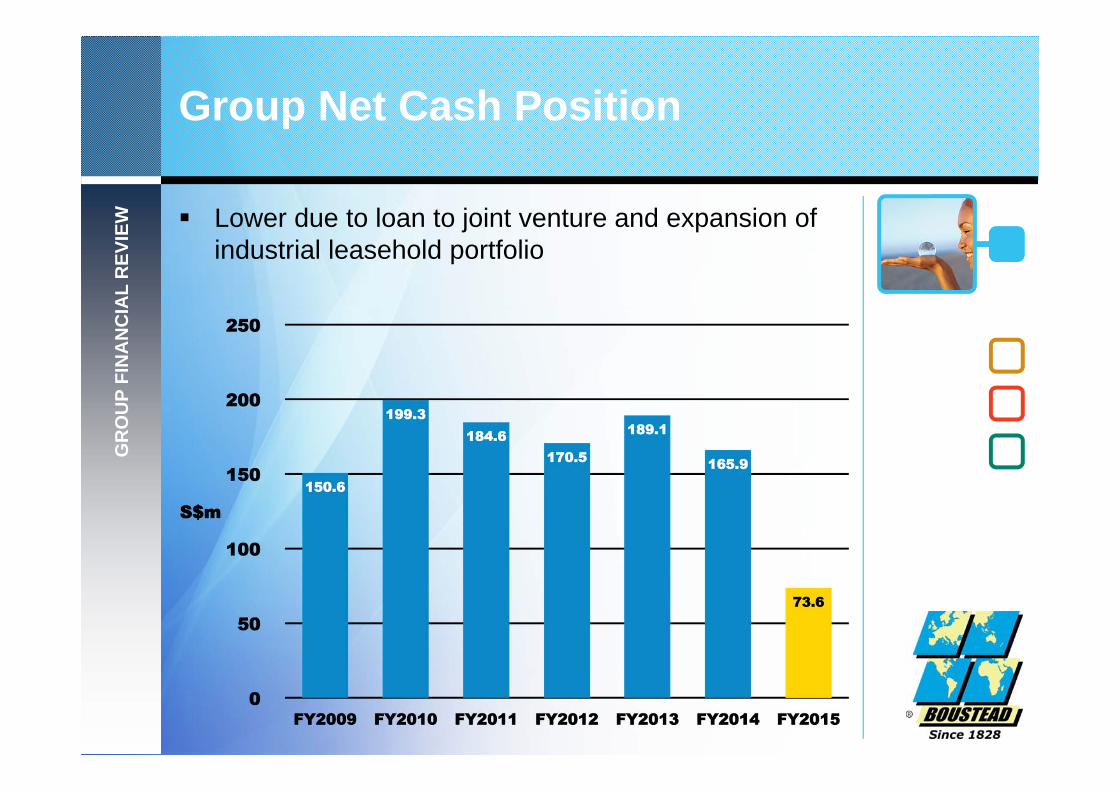
Group Net Cash Position
Lower due to loan to joint venture and expansion of industrial leasehold portfolio
GR
OU
P FI
NA
NC
IAL
REV
IEW
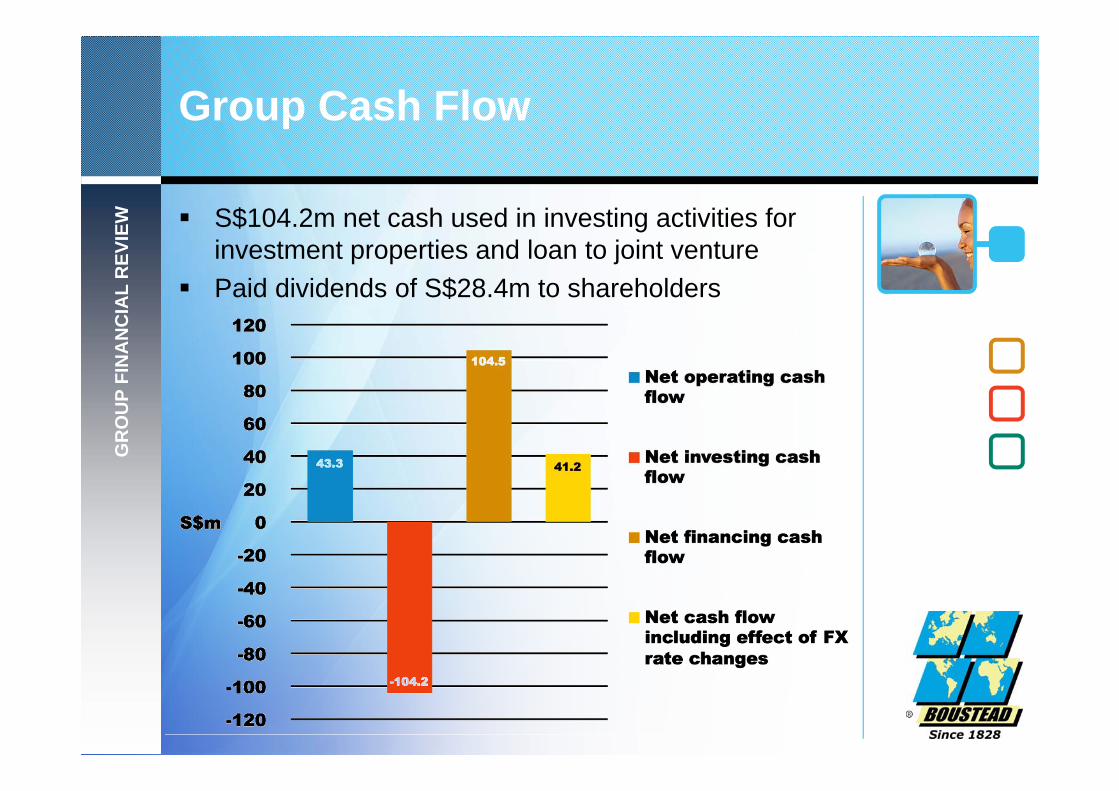
Group Cash Flow
S$104.2m net cash used in investing activities for investment properties and loan to joint venture
Paid dividends of S$28.4m to shareholders
GR
OU
P FI
NA
NC
IAL
REV
IEW
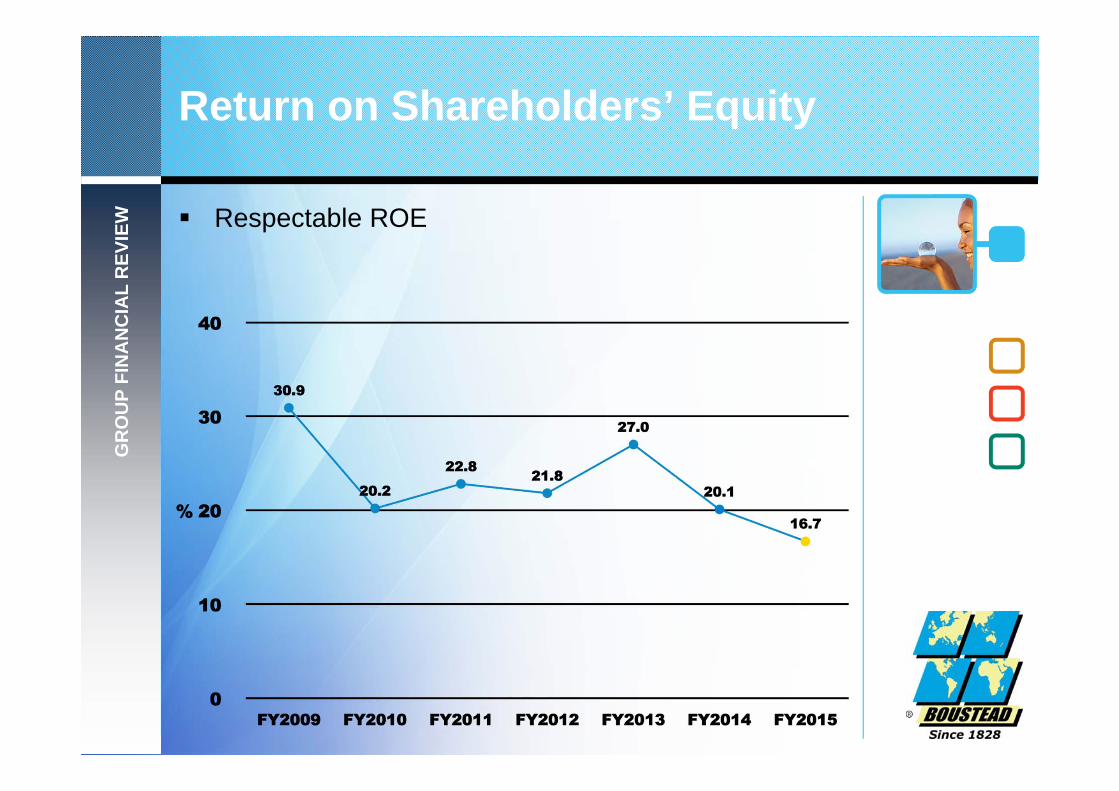
Return on Shareholders’ Equity
Respectable ROE
GR
OU
P FI
NA
NC
IAL
REV
IEW

Earnings per Share
Tracking net profit
GR
OU
P FI
NA
NC
IAL
REV
IEW
7-year CAGR: +1%
-12%y-o-y
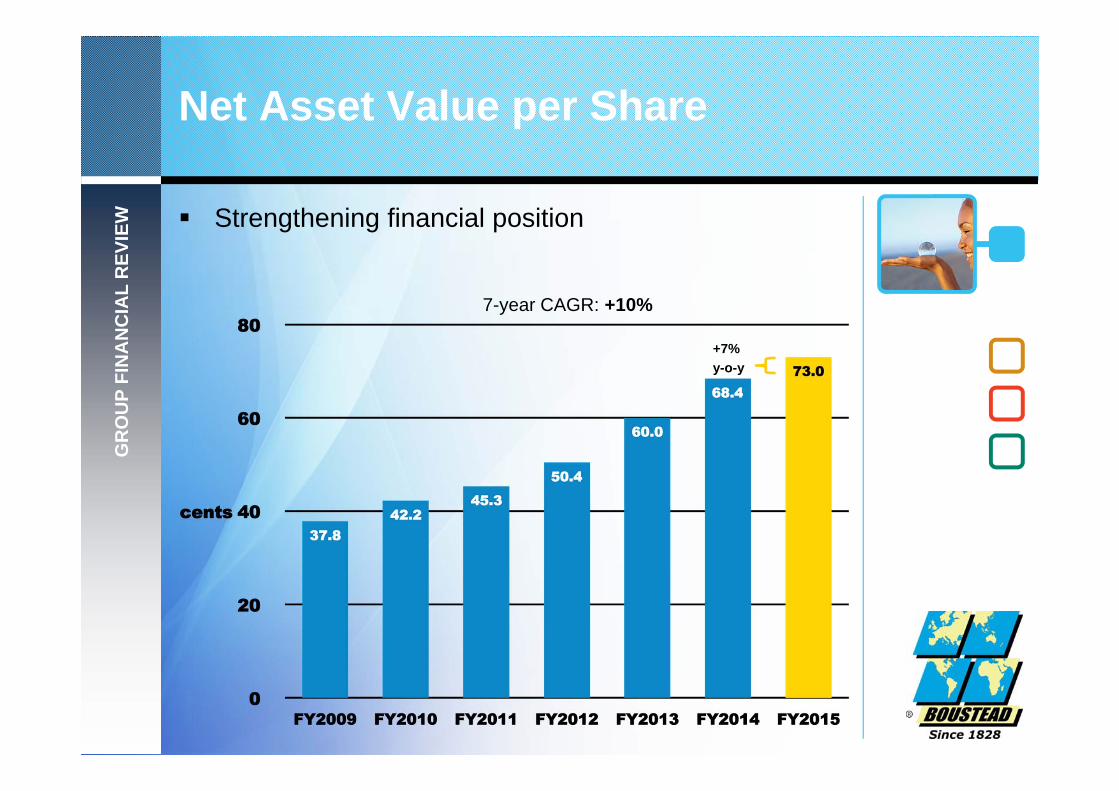
Net Asset Value per Share
Strengthening financial position
GR
OU
P FI
NA
NC
IAL
REV
IEW
7-year CAGR: +10%
+7%y-o-y
Group DividendG
RO
UP
FIN
AN
CIA
L R
EVIE
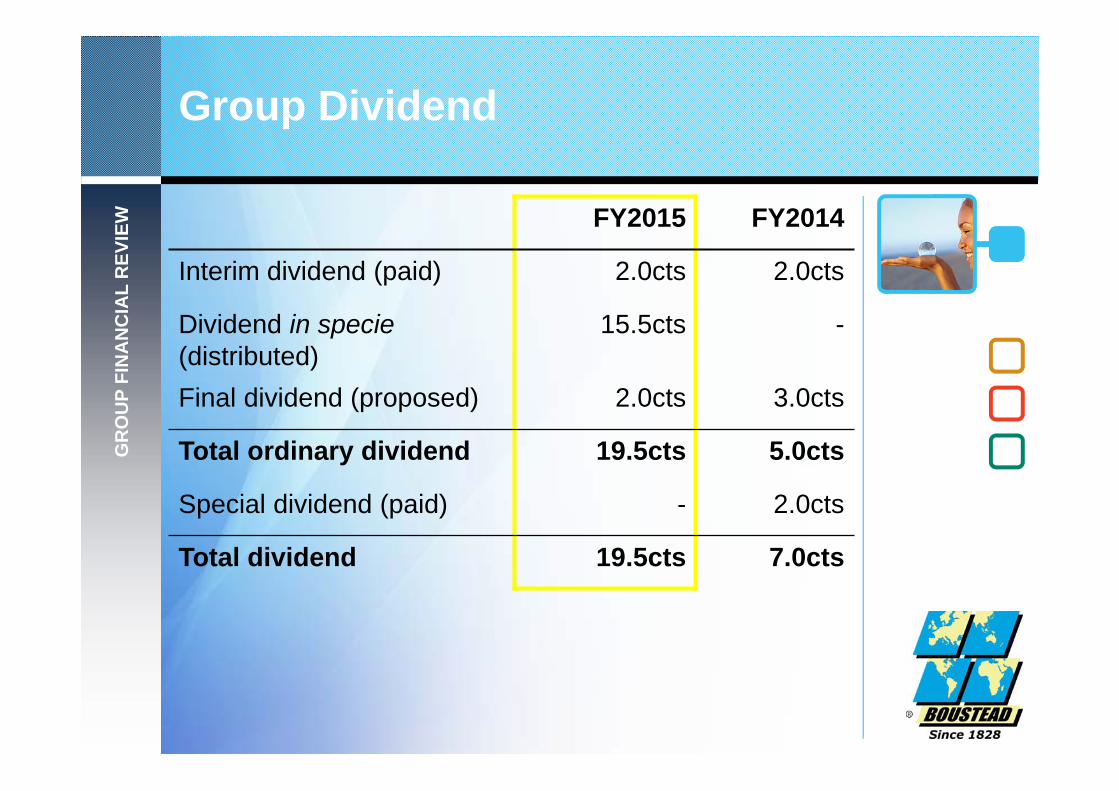
W FY2015 FY2014
Interim dividend (paid) 2.0cts 2.0cts
Dividend in specie (distributed)
15.5cts -
Final dividend (proposed) 2.0cts 3.0cts
Total ordinary dividend 19.5cts 5.0cts
Special dividend (paid) - 2.0cts
Total dividend 19.5cts 7.0cts
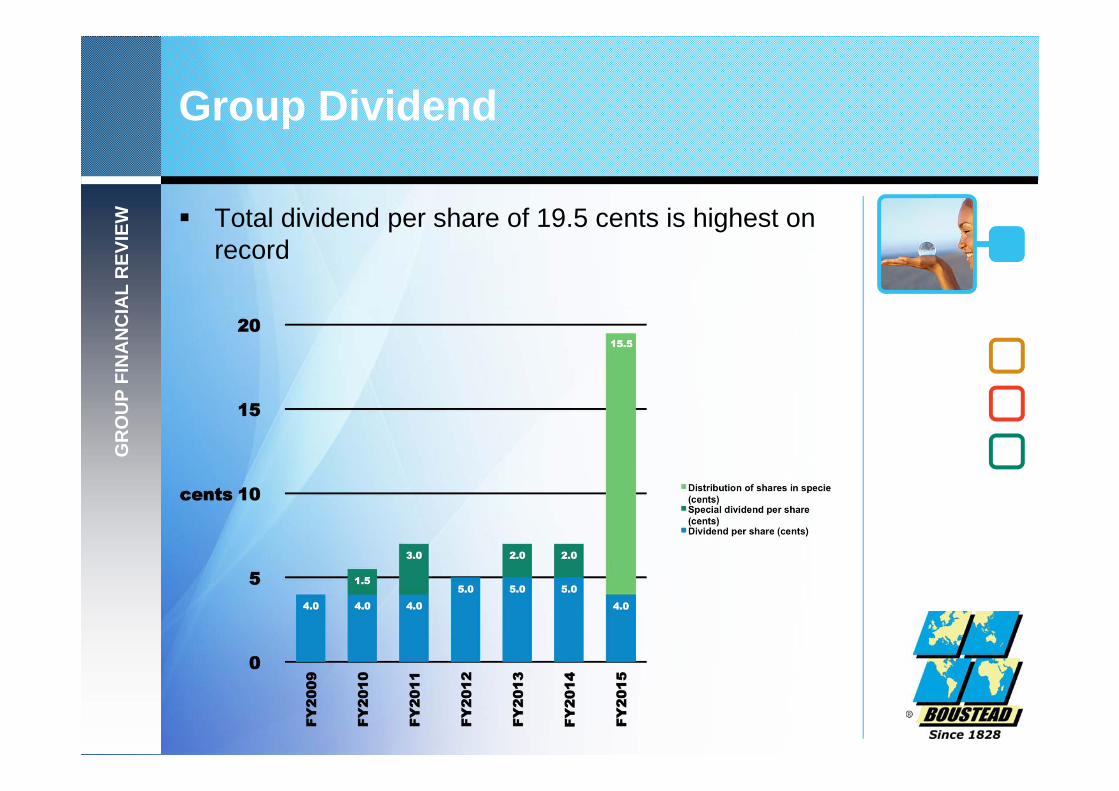
Group Dividend
Total dividend per share of 19.5 cents is highest on record
GR
OU
P FI
NA
NC
IAL
REV
IEW
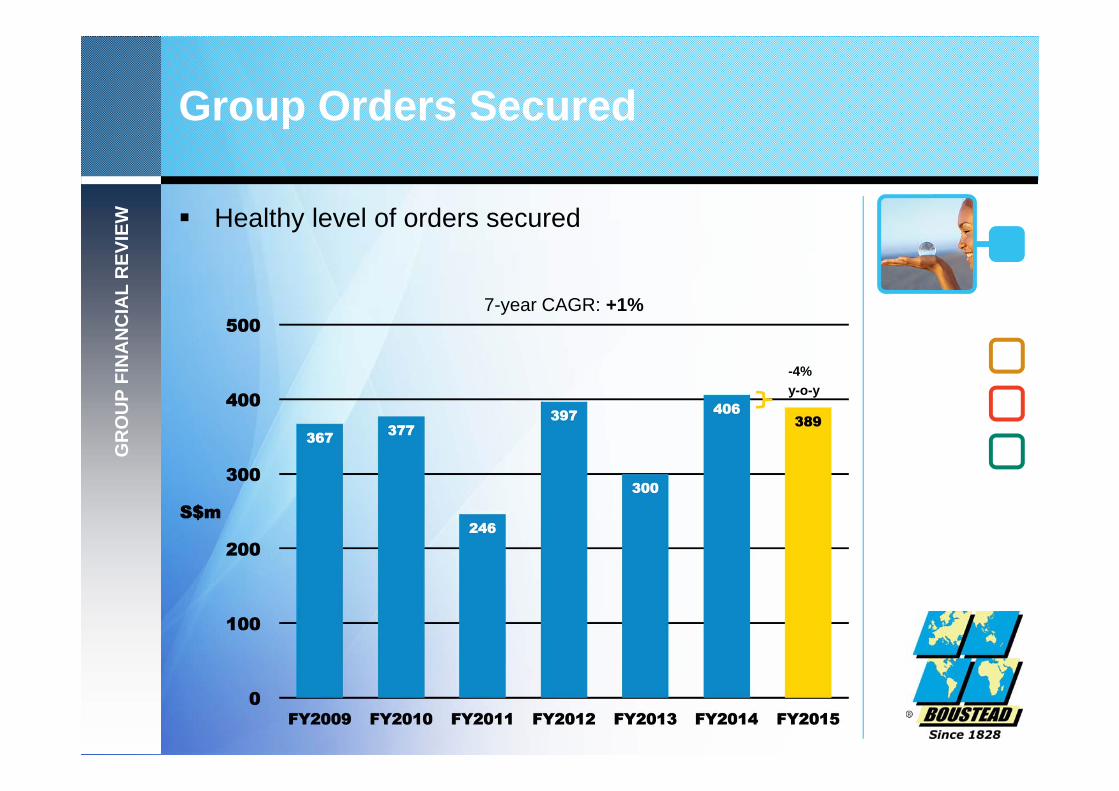
Group Orders Secured
Healthy level of orders secured
GR
OU
P FI
NA
NC
IAL
REV
IEW
7-year CAGR: +1%
-4%y-o-y
BP Group Financial ReviewBoustead Projects Limited (BP)
BP
GR
OU
P F
INA
NC
IAL
REV
IEW
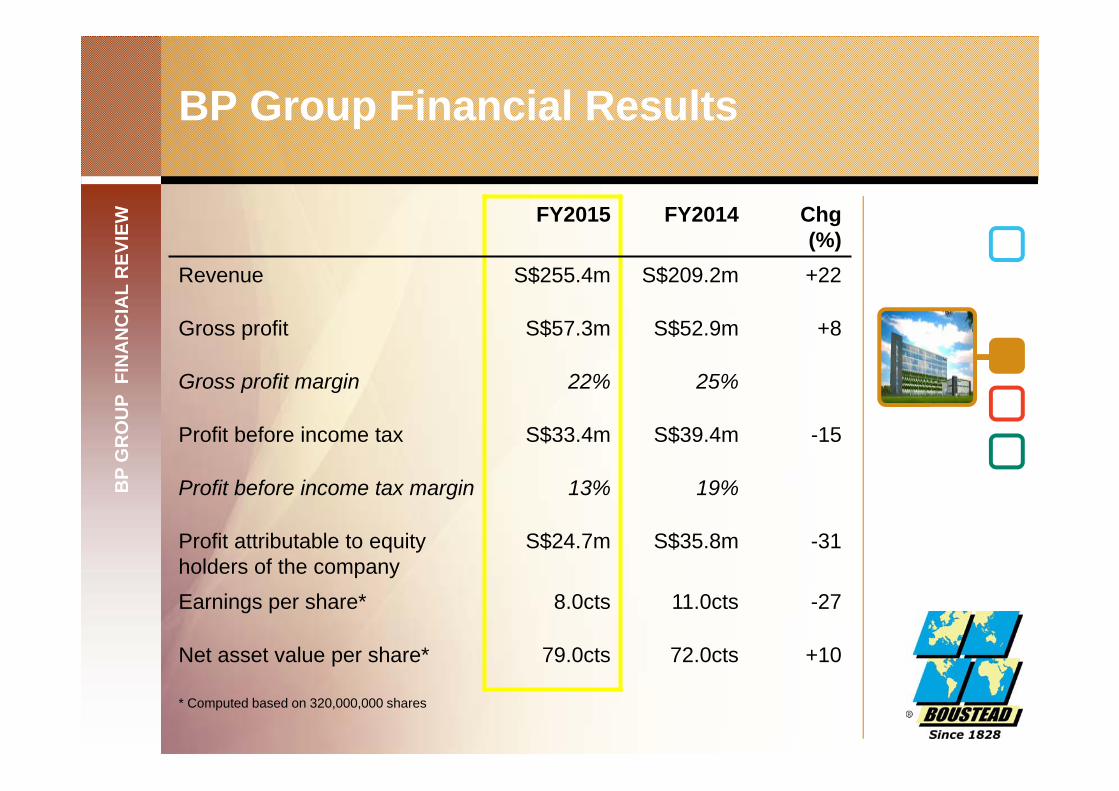
BP Group Financial Results
FY2015 FY2014 Chg(%)
Revenue S$255.4m S$209.2m +22
Gross profit S$57.3m S$52.9m +8
Gross profit margin 22% 25%
Profit before income tax S$33.4m S$39.4m -15
Profit before income tax margin 13% 19%
Profit attributable to equity holders of the company
S$24.7m S$35.8m -31
Earnings per share* 8.0cts 11.0cts -27
Net asset value per share* 79.0cts 72.0cts +10
* Computed based on 320,000,000 shares
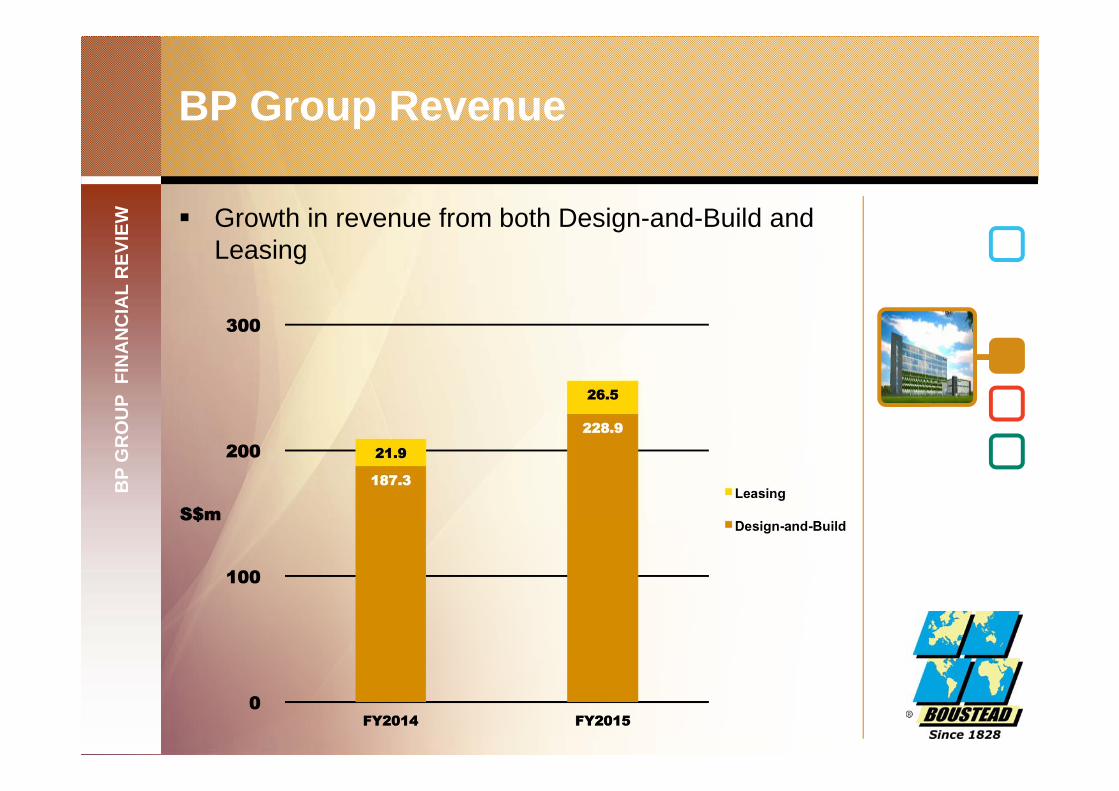
Growth in revenue from both Design-and-Build and Leasing
BP
GR
OU
P F
INA
NC
IAL
REV
IEW
BP Group Revenue
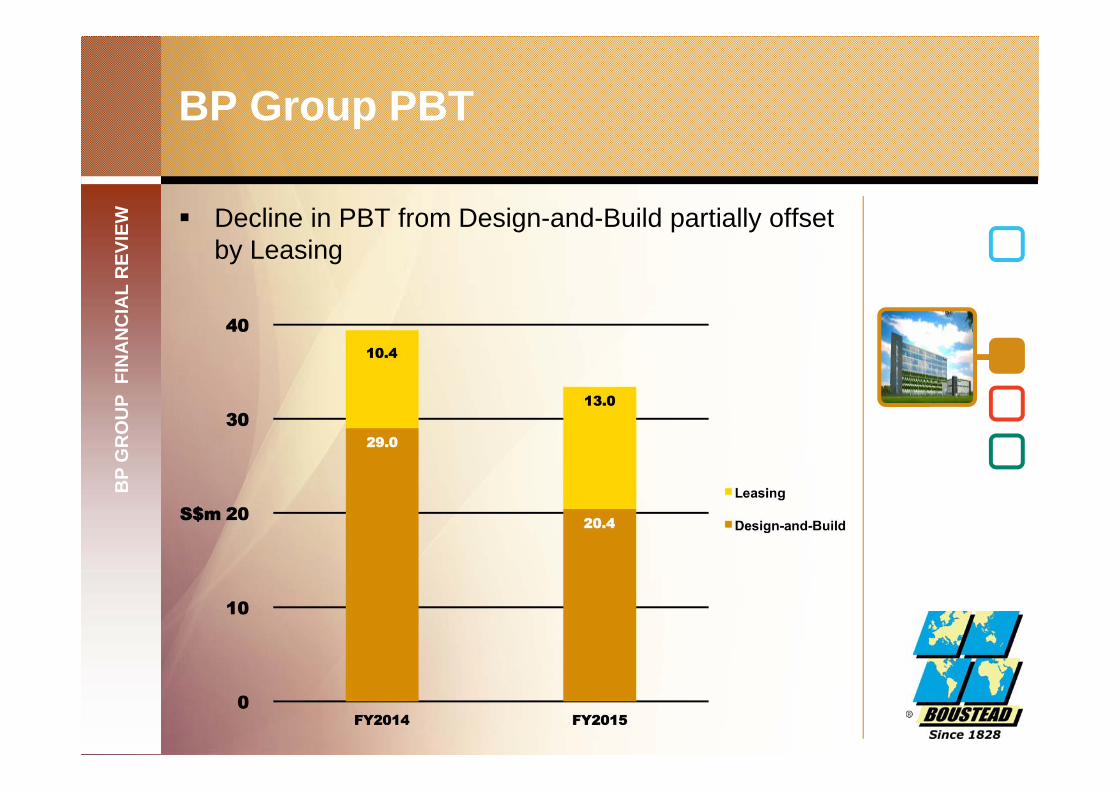
Decline in PBT from Design-and-Build partially offset by Leasing
BP
GR
OU
P F
INA
NC
IAL
REV
IEW
BP Group PBT
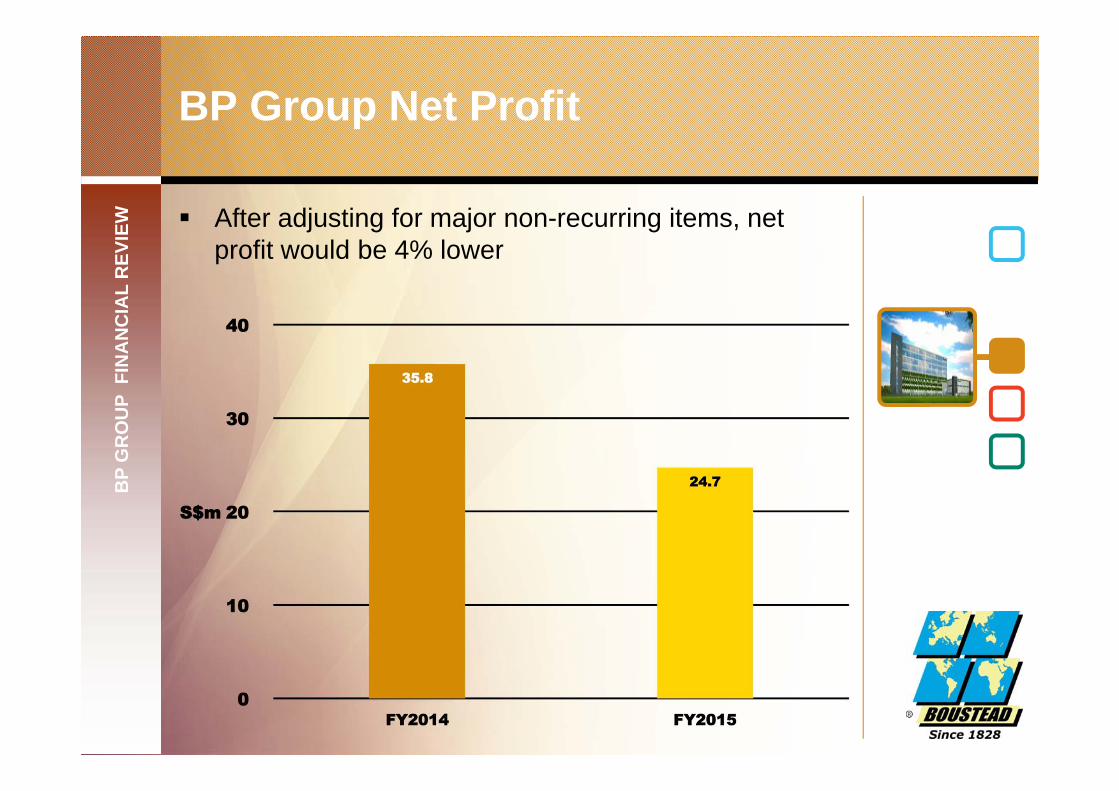
After adjusting for major non-recurring items, net profit would be 4% lower
BP
GR
OU
P F
INA
NC
IAL
REV
IEW
BP Group Net Profit
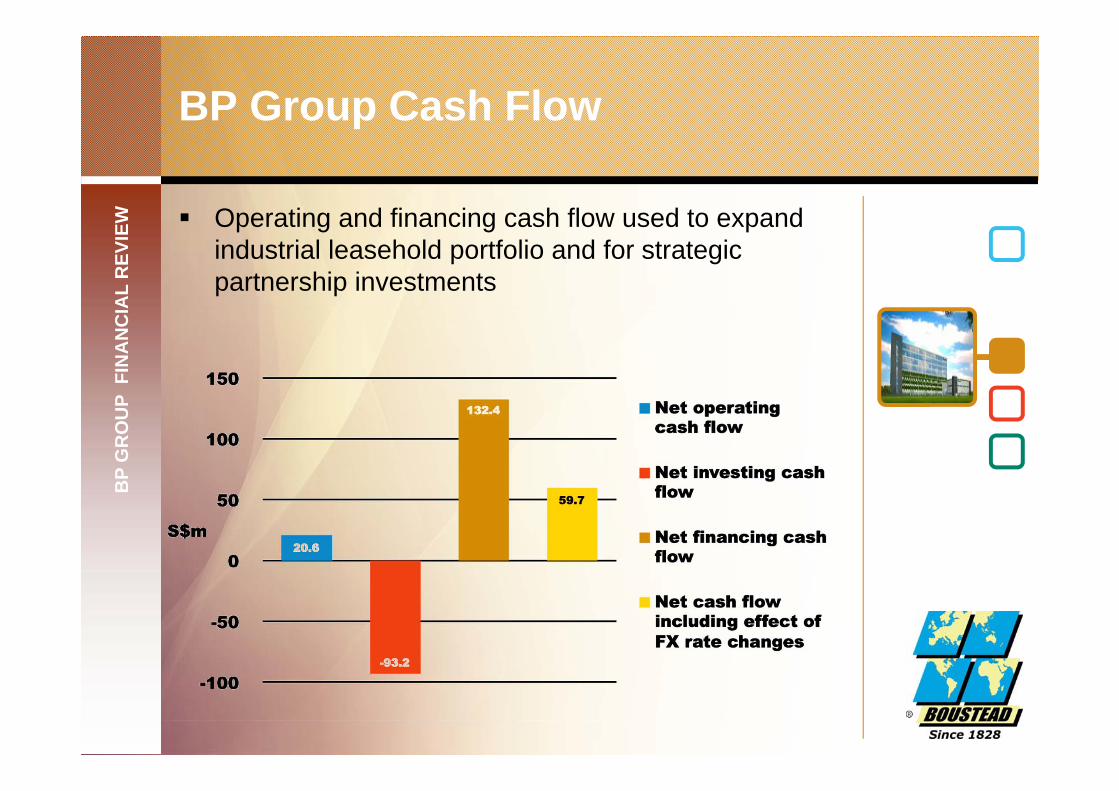
Operating and financing cash flow used to expand industrial leasehold portfolio and for strategic partnership investments
BP
GR
OU
P F
INA
NC
IAL
REV
IEW
BP Group Cash Flow
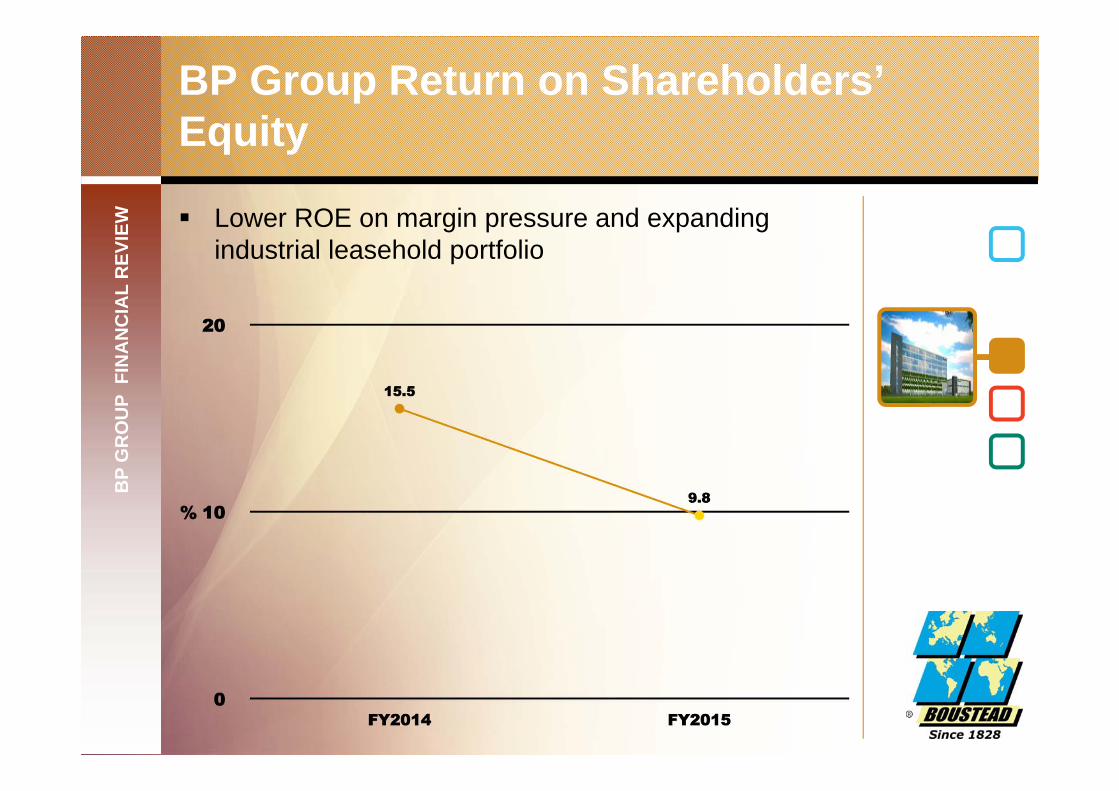
Lower ROE on margin pressure and expanding industrial leasehold portfolio
BP
GR
OU
P F
INA
NC
IAL
REV
IEW
BP Group Return on Shareholders’ Equity

Division Financial ReviewEnergy-Related Engineering
DIV
ISIO
N F
INA
NC
IAL
REV
IEW
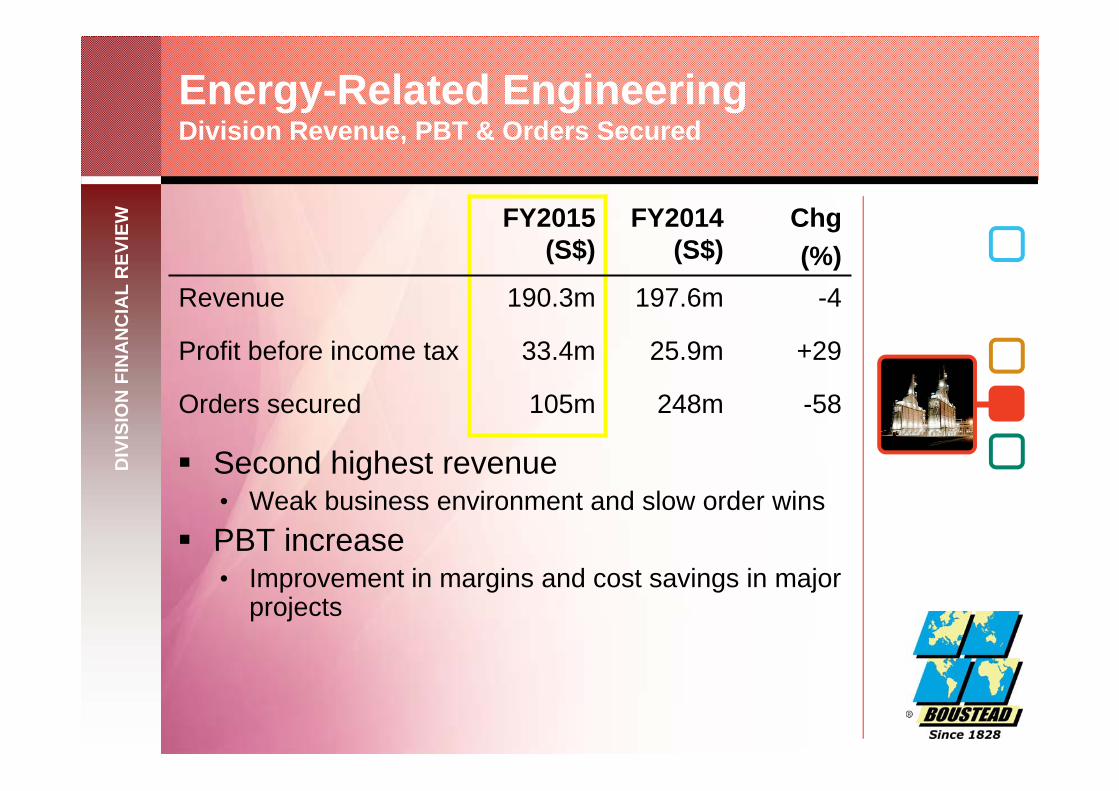
Second highest revenue• Weak business environment and slow order wins
PBT increase• Improvement in margins and cost savings in major
projects
Energy-Related EngineeringDivision Revenue, PBT & Orders Secured
FY2015 (S$)
FY2014 (S$)
Chg(%)
Revenue 190.3m 197.6m -4
Profit before income tax 33.4m 25.9m +29
Orders secured 105m 248m -58
DIV
ISIO
N F
INA
NC
IAL
REV
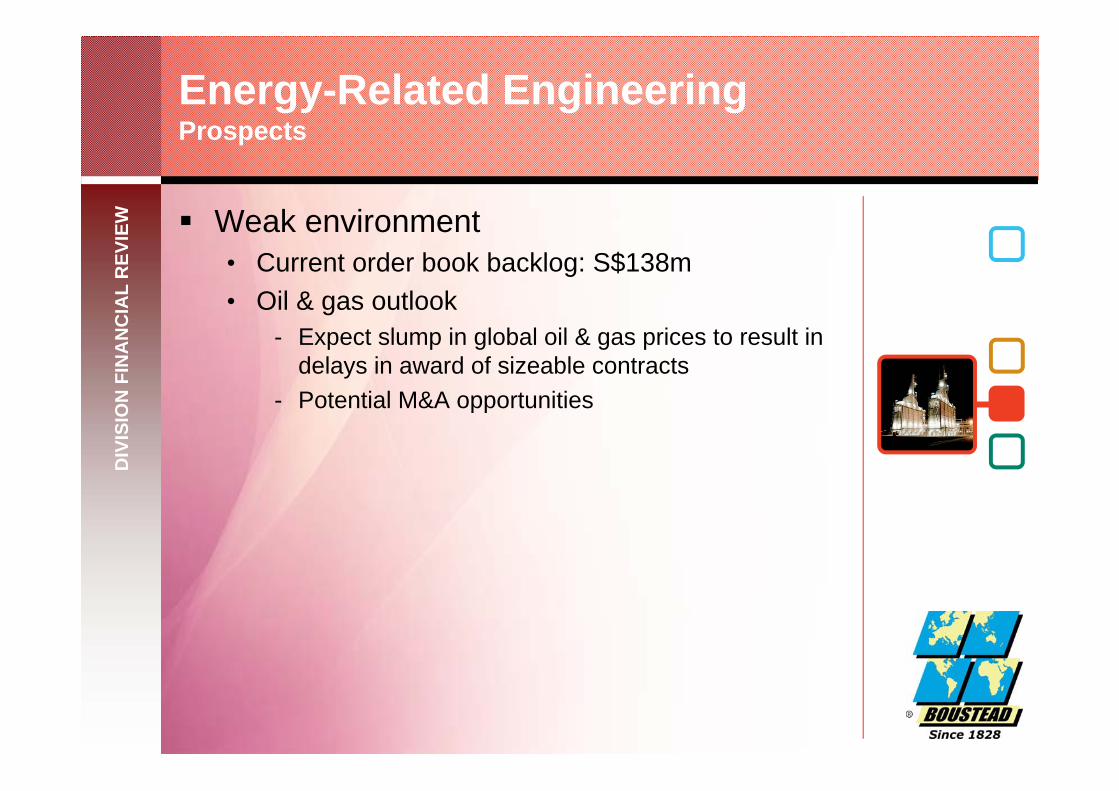
IEW Weak environment
• Current order book backlog: S$138m• Oil & gas outlook
- Expect slump in global oil & gas prices to result in delays in award of sizeable contracts
- Potential M&A opportunities
Energy-Related EngineeringProspects

Division Financial ReviewReal Estate Solutions
DIV
ISIO
N F
INA
NC
IAL
REV
IEW
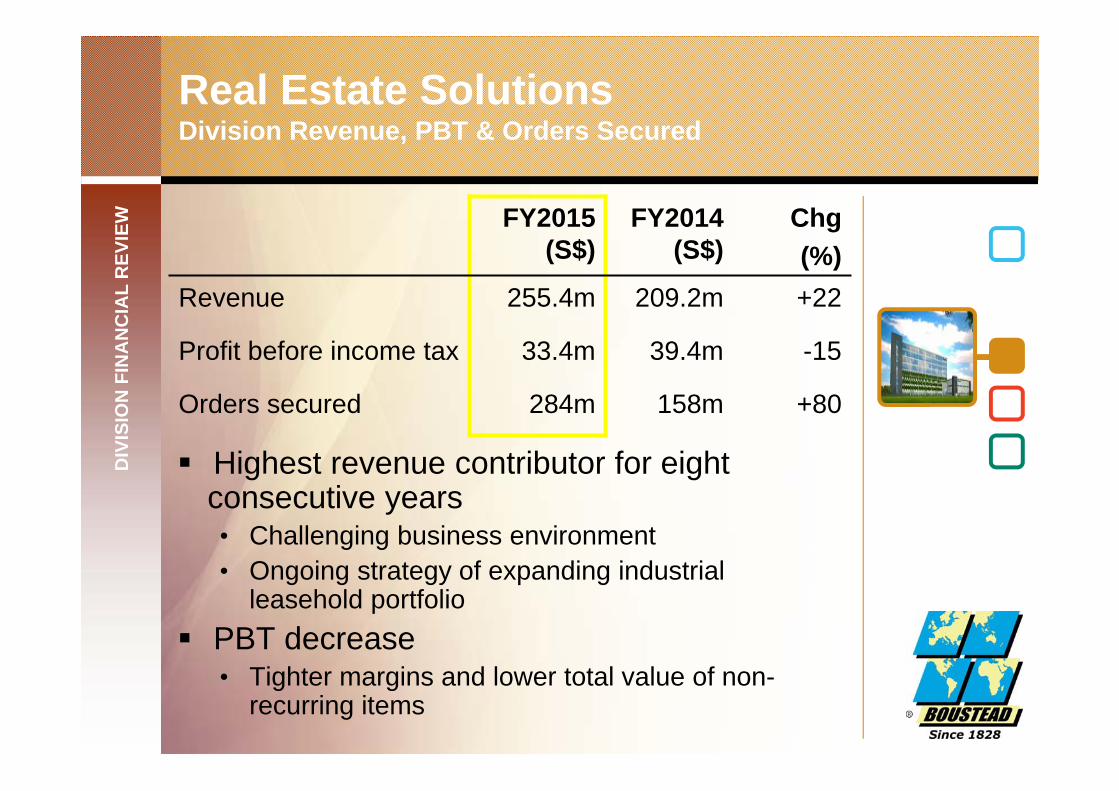
Real Estate SolutionsDivision Revenue, PBT & Orders Secured
FY2015 (S$)
FY2014 (S$)
Chg(%)
Revenue 255.4m 209.2m +22
Profit before income tax 33.4m 39.4m -15
Orders secured 284m 158m +80
Highest revenue contributor for eight consecutive years• Challenging business environment• Ongoing strategy of expanding industrial
leasehold portfolio PBT decrease
• Tighter margins and lower total value of non-recurring items

DIV
ISIO
N F
INA
NC
IAL
REV
IEW
Real Estate SolutionsProspects
Focusing on niche growth industries• Current order book backlog: S$250m• Industrial real estate outlook:
- Challenging operating environment to persist- Design-and-build contracts in niche growth
industries- Boustead Development Partnership to grow
industrial leasehold portfolio for recurring income- Strategic partnerships with reputable joint venture
partners in region

Division Financial ReviewGeo-Spatial Technology
DIV
ISIO
N F
INA
NC
IAL
REV
IEW
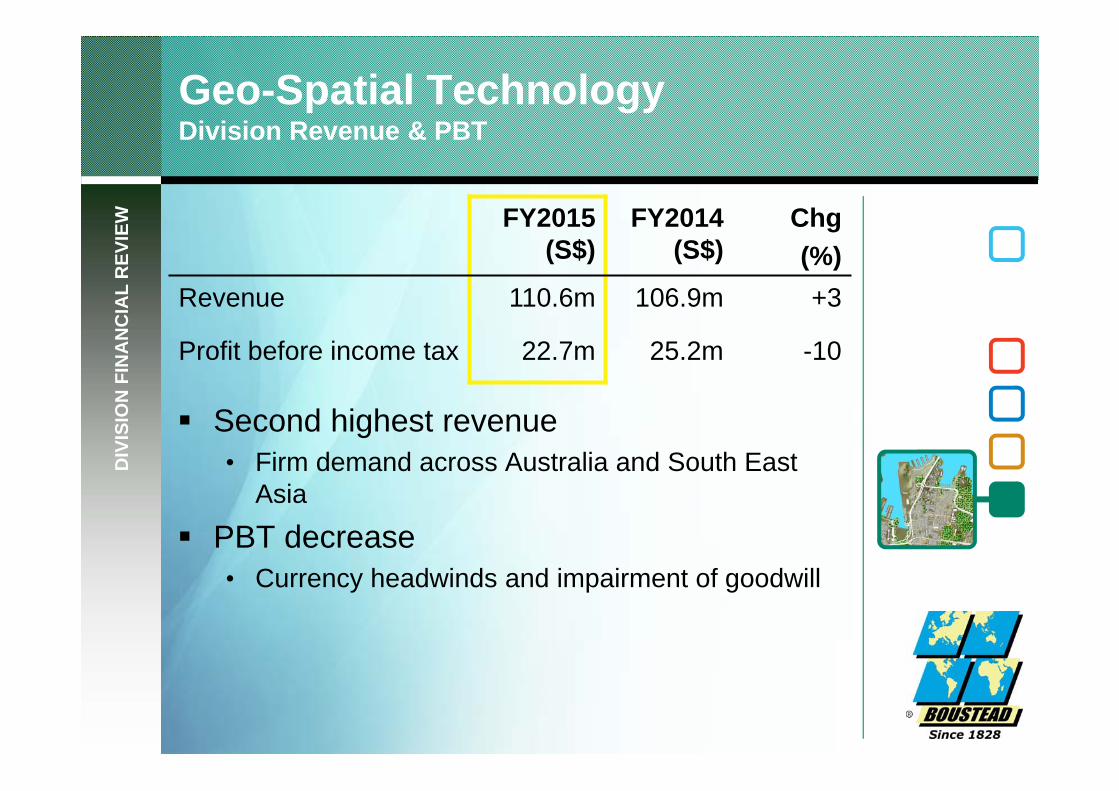
Geo-Spatial TechnologyDivision Revenue & PBT
Second highest revenue• Firm demand across Australia and South East
Asia
PBT decrease• Currency headwinds and impairment of goodwill
FY2015 (S$)
FY2014 (S$)
Chg(%)
Revenue 110.6m 106.9m +3
Profit before income tax 22.7m 25.2m -10
DIV
ISIO
N F
INA
NC
IAL
REV
IEW
Geo-Spatial TechnologyProspects
Steady prospects• Sustained demand from government agencies• Continued expansion of workforce• Currency headwinds may affect margins

Thank You

Questions & Answers