Embed Size (px)
Citation preview

209
BOTOSEIS: A NEW SEISMIC UNIX BASED INTERACTIVEPLATFORM FOR SEISMIC DATA PROCESSING
W. Lima, G. Garabito, I. G. Oliveira and J. C. R. Cruz
email: [email protected]: Seismic Unix, Java Language, Interactive Processing, Data Visualization
ABSTRACT
After eight years of the first distribution of the user’s manual of the Seismic Unix (SU) package, itis yet a challenge to execute some seismic processing SU scripts, especially for inexperienced users.Up to now there are few friendly Graphical User Interfaces (GUI) for the SU package, namely Tksu,iSU and GêBR. In order to obtain a more robust and flexible way to work with the SU package, wepresent a new graphical user interface written in the Java programming language, which can be usedunder any operating system, the so-called BOTOSEIS. It is adequate to be used both as a productionor as interactive development environment, by creating and managing projects, lines and flowcharts ofseismic data processing. It is also possible to add SU based softwares, interactively, without knowl-edge about any programming language. The BOTOSEIS platform is structured by modules, whichcan be a single application or a combination of SU programs to produce a more complex result, e.g.,iVIEW, iVELAN and iNIP-PICKING. The first is a GUI used for data visualization, the second isan important interactive tool for velocity analysis fitted for production environments, and the last is asoftware for data picking in the zero-offset seismic section that is fundamental for traveltime inversionmethods.
INTRODUCTION
The Seismic Unix (SU) package was developed with the initial support of the Society of Exploration Geo-physicists (SEG) and the Gas Research Institute (GRI). Nowadays it is supported by the Center for WavePhenomena (CWP) of the Colorado School of Mines, United States of America (USA). It is a data process-ing environment for Unix-based systems, written mainly in C language, which extends the Unix operatingsystems for seismic processing production and research tasks, and it is completely free and open source(Cohen and Stockwell Jr., 2000). With SU package fundamental techniques of seismic data processing(e.g., spectral analysis, F-K filter, velocity analysis, NMO-DMO stack, deconvolution, migration and oth-ers) are applied by using command lines or script files. Due to this fact, students or professionals withoutexperience in the use of commands and scripts have difficulties in using the SU package. Even so the SUsoftware has been successfully used in the geophysical community, considering its important character-istics referring to facilities for seismic data procesing without using any commercial package, which is astrong advantage for the academic institutions and researchers (Stockwell Jr., 1999).
In order to facilitate the access to the SU applications, the graphical interfaces Tksu, iSU and GêBRwere developed by users of different institutions. The Tksu is developed in the Tcl/Tk language, it is agraphical environment to build interactively flowcharts for seismic processing. The iSU software has asmain features the execution of a single process or a sequence of processes from a special dialog box. TheGêBR software is developed by using GTKmm library at Campinas University (UNICAMP), Brazil. It isadequate to manage projects and seismic lines, and also to create, execute and manage flowcharts.
The SU package is not only the most famous geophysical free software, but it is also an excellenttool for new developments, students and researchers interested in seismic data processing. Therefore, to

210 Annual WIT report 2008
facilitate the use of SU software it is necessary to have an efficient and robust graphical user interface.To reach this goal, at Federal University of Para, Brazil, in recent years have been implemented projects
to develop graphical user interfaces for SU software and some main processes of seismic data processing.As a result of this endeavor, we present the BOTOSEIS platform. It is a software written in the Javaprogramming language with a graphical environment to create and manage projects, lines and processingflowcharts. The name BOTO refers to a legendary fish from the Amazon river frequently used as maincharacter of local folk tales.
Besides the SU package, the BOTOSEIS platform includes three interactive modules (iVIEW, iVELANand iNIP-PICKING) that are special tools based on SU applications. With iVIEW it is possible to obtaindifferent visualization modes of multiple seismic sections, it has, also, dialog boxes for applying gains andfor viewing headers of the seismic traces. The iVELAN is a GUI software based on SU applications forinteractive velocity analysis in common-midpoint seismic domain, the so-called CMP method. The iNIP-PICKING is a software for semi-automatic amplitude picking of a selected point or of a target seismichorizon on a zero-offset (ZO) section, by using local properties of the interpreted reflector.
BOTOSEIS PLATFORM
Since 2003 years, researchers at Federal University of Pará, Brazil, have dedicated an important part oftheir time on the development of an interactive graphical interface, that is able to create and manage SUbased processes, by resulting in the development of the BOTOSEIS platform. In order to make easierits application, the BOTOSEIS preserves some characteristics of well-known commercial seismic dataprocessing packages. The BOTOSEIS user can create, manage and execute projects, lines and flowchartsfrom only one interactive environment. In the flowcharts the processes can be interactively inserted, movedor excluded.
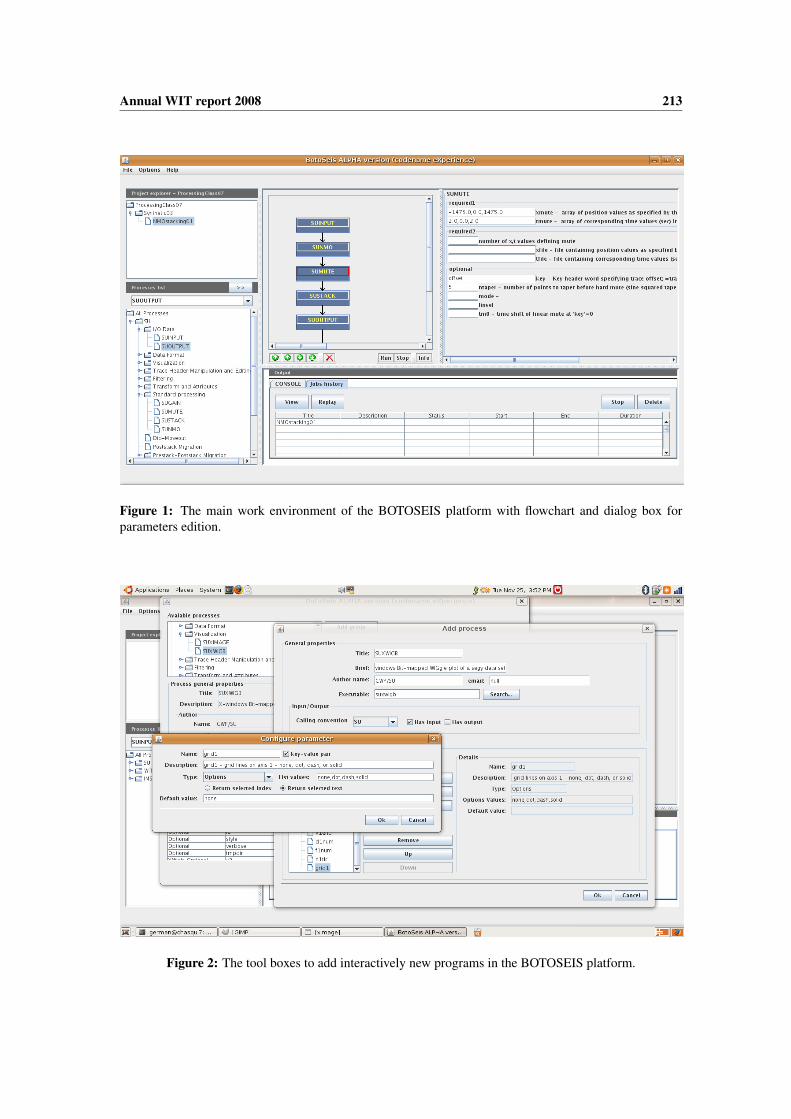
The BOTOSEIS platform offers the following posibilities: a) the main work environment is constitutedby five areas, to be known: 1) visualization of project, lines and flowcharts 2) visualization of programsgrouped in categories; 2) visualization and interactive manipulation of processing flowcharts; 3) dialogwindow to insert parameters of the SU programs in a flowchart; and 4) visualization of errors and log filesto verify the process;
By means of the main interface the user creates and manages projects, lines and flowcharts. Also, itis possible to move, exclude, and add SU process in the flowchart, and to execute and stop a process.The BOTOSEIS allows the inclusion of SU modules or other Unix based packages in the interactive workenvironment.
In Figure 1 it is shown the main work environment of the BOTOSEIS platform. On the upper left weshow the window for management of projects, lines and flowcharts and in the bottom the work place forselecting SU or others programs. In the central part there is a place to build flowcharts with options to run,pause, and kill a process, and also to obtain information of it. On the right we have the window to insertthe parameters of the processes. In Figure 2 we have tool boxes to add interactively new programs in theBOTOSEIS platform, very important for customizing the BOTOSEIS environment.
INTERACTIVE MODULES
The philosophy behind BOTOSEIS development is to make possible the expandability and flexibility ofthe SU package in only one interactive environment, preserving the free software characteristics. It isstructured by modules that can be a single program or a combination of SU based softwares, in order toproduce a more complex result, e.g., the so-called iVIEW (Lima et al., 2006), iVELAN (Lima et al., 2007)and iNIP-PICKING (Oliveira, 2006) that are presented in this section.
iVIEW
The iVIEW is a tool for the visualization of seismic data with the functionalities of the three SU visualiza-tion programs (suximage, suxwigb and suxcontour) in only one graphical interface, written initially in theC++ programming language. Currently the iVIEW is being rewritten in the Java. This interface providesa more robust and flexible data visualization tool, by using the same advantages of the softwares ximage,xwigb, xcontour and others of the SU package.

Annual WIT report 2008 211
The main features of iVIEW module are: a) The visualization modes: image, wiggle, contour, im-age+wiggle and image+contour; b) visualization of multiple sections; c) zoom tool; e) dialog boxes forheader display and gain application.
We can see in Figure 3 the class diagram of the iVIEW, with the input and output data structure forvarious types of visualization of seismic data. In Figure 4 we show an example with the image+wigglevisualization mode using the iVIEW. It is important to point out that this result is fully based on the SUpackage. In Figure 5 we show the trace visualization in wiggle mode, with headers information displayedby a dialog window that is activated by a mouse click at the desired trace.
iVELAN
The iVELAN is an interactive software for velocity analysis using the common-midpoint technique, basedon a combination of SU programs. Its first version was written in C++, but currently it is being rewritten inthe Java language to guarantee better portability. The interactivity necessary to do the velocity analysis wasreached by using a flexible graphical interface based on SU codes, that are organized in classes by meansof a central work environment.
The main features of the iVELAN are: a) Selection and visualization of CMP sections into a giveninterval; b) image visualization of the coherence semblance panel; c) images of stacked traces from nearbyCMP data sections by using constant velocities, the so-called constant velocity stack (CVS); d) visualiza-tion of the hyperbolic curve on the CMP section as the mouse pointer moves in the image of coherence(semblance) or CVS panel; e) the option to apply and remove normal moveout (NMO) correction.
An example of application of the iVELAN software is shown in Figure 6. On the left side we visualizethe CMP data section, the red line is the NMO hyperbola to be fitted on the reflection data for optimalstacking velocity. On the upper left there are buttons to apply and to remove the NMO correction, and toadvance for the next CMP section. The coherence semblance image in the central part of the figure is usedto define interactively the best stack velocity at each ZO reflection traveltime. On the right of the samefigure we have the CVS panel that is built for various constant stack velocity values, and it can also be usedto define the optimal velocity to apply the NMO correction. In Figure 7 on the left we can see the NMOcorrected CMP data section.
iNIP-PICKING
The seismic velocity model is the most important information for performing pre-stack or post-stack depthmigrations. To solve the velocity problem, (Billete and Lambaré, 1998) proposed a tomography methodthat depends only on zero-offset (ZO) traveltimes, and (Duveneck, 2004) presented a new tomographymethod that uses the ZO traveltimes and two parameters that are determined by the Common-Reflection-Surface (CRS) stack method (Garabito et al., 2001) and (Jäger et al., 2001), the radius of curvature of thenormal incidence point (NIP) wave and the emergence angle of the reflection normal ray, the so-calledNIP-CRS parameters. The amplitudes of the ZO traveltimes are extracted from ZO stacked section bypicking the seismic events, and the associated CRS parameters pairs are automatically selected from CRSpanels.
The iNIP-PICKING software is written in the Java language and it has two picking possibilities: point-to-point and horizon based picking. In the former case the user must choose point-to-point seismic eventson the ZO stacked section, and in the last case some automatic criterion must be used to pick the ZOtraveltime from one selected point of a target seismic horizon.
As it was originally proposed by (Duveneck, 2004), in the point-to-point picking the amplitudes of theZO traveltimes are extracted from a ZO stacked section, by using the iNIP-PICKING software, and theassociated CRS parameters pairs are automatically selected from CRS panels.
In the other hand, for the horizon based picking, the iNIP-PICKING software follows the strategy:a) Based on the semblance panels of the CRS stack processing, it is selected reflection events of the ZOstacked section, so-called target seismic horizons; b) one point must be chosen of a target seismic horizon,the so-called reference point;c) At this selected point, the orientation of the target seismic horizon is deter-mined by using the emergence angle of the CRS stack processing; d) it is calculated the mean amplitudeof the predefined nearby points on the left and right positions of the reference point; e) the iNIP-PICKING
212 Annual WIT report 2008
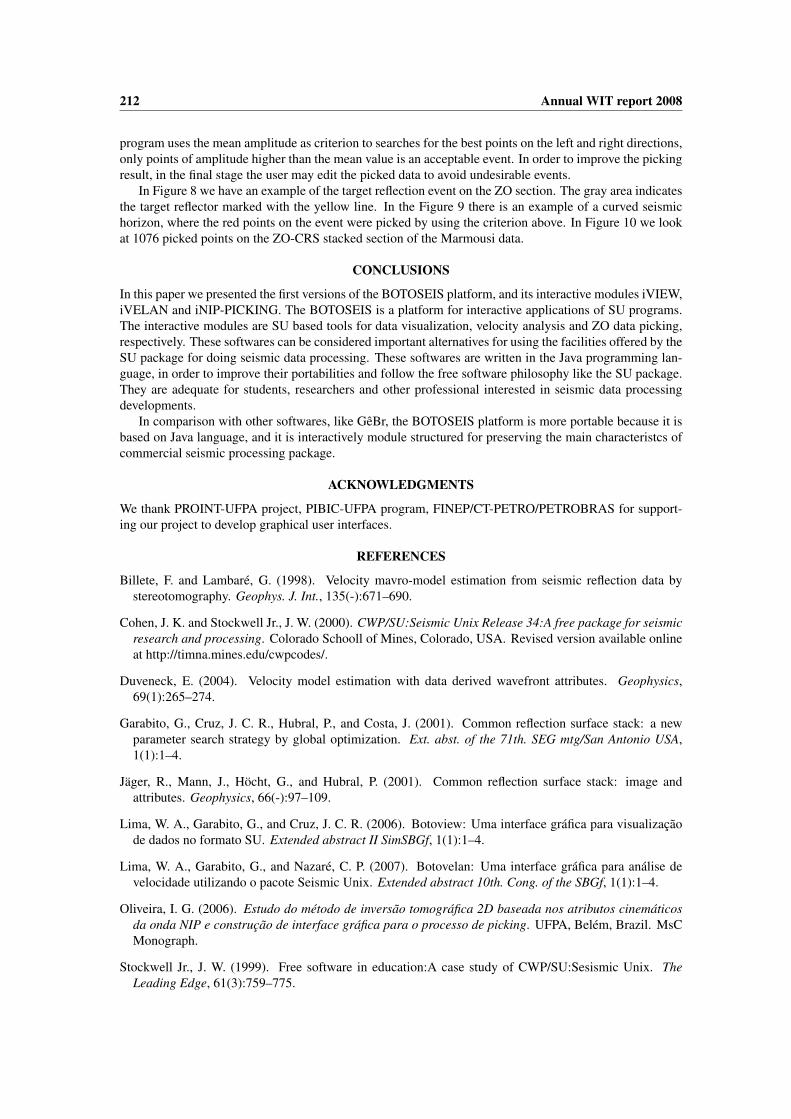
program uses the mean amplitude as criterion to searches for the best points on the left and right directions,only points of amplitude higher than the mean value is an acceptable event. In order to improve the pickingresult, in the final stage the user may edit the picked data to avoid undesirable events.
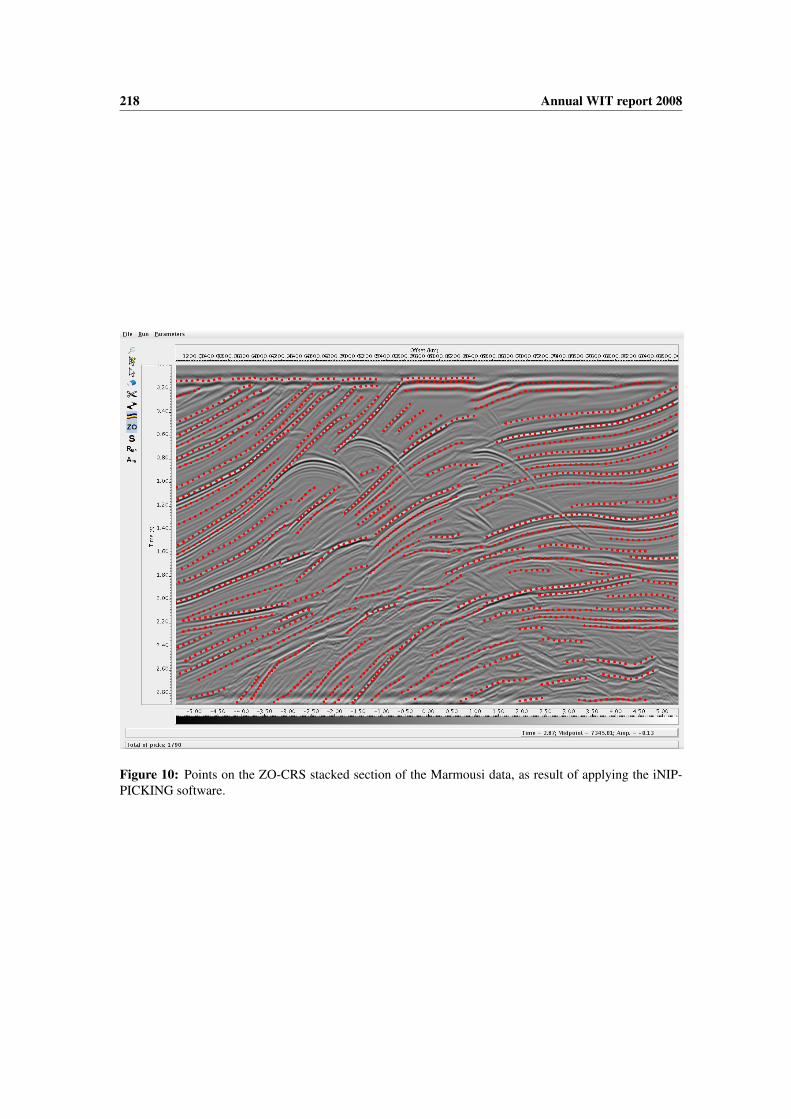
In Figure 8 we have an example of the target reflection event on the ZO section. The gray area indicatesthe target reflector marked with the yellow line. In the Figure 9 there is an example of a curved seismichorizon, where the red points on the event were picked by using the criterion above. In Figure 10 we lookat 1076 picked points on the ZO-CRS stacked section of the Marmousi data.
CONCLUSIONS
In this paper we presented the first versions of the BOTOSEIS platform, and its interactive modules iVIEW,iVELAN and iNIP-PICKING. The BOTOSEIS is a platform for interactive applications of SU programs.The interactive modules are SU based tools for data visualization, velocity analysis and ZO data picking,respectively. These softwares can be considered important alternatives for using the facilities offered by theSU package for doing seismic data processing. These softwares are written in the Java programming lan-guage, in order to improve their portabilities and follow the free software philosophy like the SU package.They are adequate for students, researchers and other professional interested in seismic data processingdevelopments.
In comparison with other softwares, like GêBr, the BOTOSEIS platform is more portable because it isbased on Java language, and it is interactively module structured for preserving the main characteristcs ofcommercial seismic processing package.
ACKNOWLEDGMENTS
We thank PROINT-UFPA project, PIBIC-UFPA program, FINEP/CT-PETRO/PETROBRAS for support-ing our project to develop graphical user interfaces.
REFERENCES
Billete, F. and Lambaré, G. (1998). Velocity mavro-model estimation from seismic reflection data bystereotomography. Geophys. J. Int., 135(-):671–690.
Cohen, J. K. and Stockwell Jr., J. W. (2000). CWP/SU:Seismic Unix Release 34:A free package for seismicresearch and processing. Colorado Schooll of Mines, Colorado, USA. Revised version available onlineat http://timna.mines.edu/cwpcodes/.
Duveneck, E. (2004). Velocity model estimation with data derived wavefront attributes. Geophysics,69(1):265–274.
Garabito, G., Cruz, J. C. R., Hubral, P., and Costa, J. (2001). Common reflection surface stack: a newparameter search strategy by global optimization. Ext. abst. of the 71th. SEG mtg/San Antonio USA,1(1):1–4.
Jäger, R., Mann, J., Höcht, G., and Hubral, P. (2001). Common reflection surface stack: image andattributes. Geophysics, 66(-):97–109.
Lima, W. A., Garabito, G., and Cruz, J. C. R. (2006). Botoview: Uma interface gráfica para visualizaçãode dados no formato SU. Extended abstract II SimSBGf, 1(1):1–4.
Lima, W. A., Garabito, G., and Nazaré, C. P. (2007). Botovelan: Uma interface gráfica para análise develocidade utilizando o pacote Seismic Unix. Extended abstract 10th. Cong. of the SBGf, 1(1):1–4.
Oliveira, I. G. (2006). Estudo do método de inversão tomográfica 2D baseada nos atributos cinemáticosda onda NIP e construção de interface gráfica para o processo de picking. UFPA, Belém, Brazil. MsCMonograph.
Stockwell Jr., J. W. (1999). Free software in education:A case study of CWP/SU:Sesismic Unix. TheLeading Edge, 61(3):759–775.
Annual WIT report 2008 213
Figure 1: The main work environment of the BOTOSEIS platform with flowchart and dialog box forparameters edition.
Figure 2: The tool boxes to add interactively new programs in the BOTOSEIS platform.

214 Annual WIT report 2008
Figure 3: The class diagram of the iVIEW module, with the input and output data structure for varioustypes of presentation of the seismic data.

Annual WIT report 2008 215
Figure 4: Visualization in image+wiggle mode by using the iVIEW software.
Figure 5: Visualization in wiggle mode. The trace headers information are displayed in an appropriatewindow.

216 Annual WIT report 2008
Figure 6: Example of application of the iVELAN software for velocity analysis.
Figure 7: The NMO corrected CMP section applied using the picked velocities displayed in red line.

Annual WIT report 2008 217
Figure 8: Example of the target reflector on the ZO section, with the reference point and the assigned angleto start the iNIP-PICKING software.
Figure 9: Example of picked points on a curved seismic horizon, by using the iNIP-PICKING software.
218 Annual WIT report 2008
Figure 10: Points on the ZO-CRS stacked section of the Marmousi data, as result of applying the iNIP-PICKING software.