Embed Size (px)
Citation preview
Boston University Common Data Set 1
Name of College/University: Boston University
Mailing Address: One Sherborn Street
Boston MA 02215
Street Address (if different)
Main Phone: (617) 353‐2000
www Home Page Address: http://www.bu.edu
Admissions Phone Number: (617) 353‐2300
Admissions Toll‐Free Number: N/A
Admissions Office Mailing Address: 121 Bay State Road
Boston MA 02215
Admissions Fax Number: (617) 353‐9695
Admissions E‐mail Address: [email protected]; International: [email protected]
Separate URL application site: https://app.commonapp.org/
Public
Private (nonprofit) X
A. General Information
A1. General information
A2. Institutional control
( p )
Proprietary
Coeducational college XMen's college
Women's college
Semester XQuarter
Trimester
"4‐1‐4"
Continuous
Differs by program (describe):
Other (describe):
A3. Institution classification
A4. Academic year calendar
Boston University Institutional Research 2010‐2011
Boston University Common Data Set 2
Certificate
Diploma
Associate
Transfer associate
Terminal associate
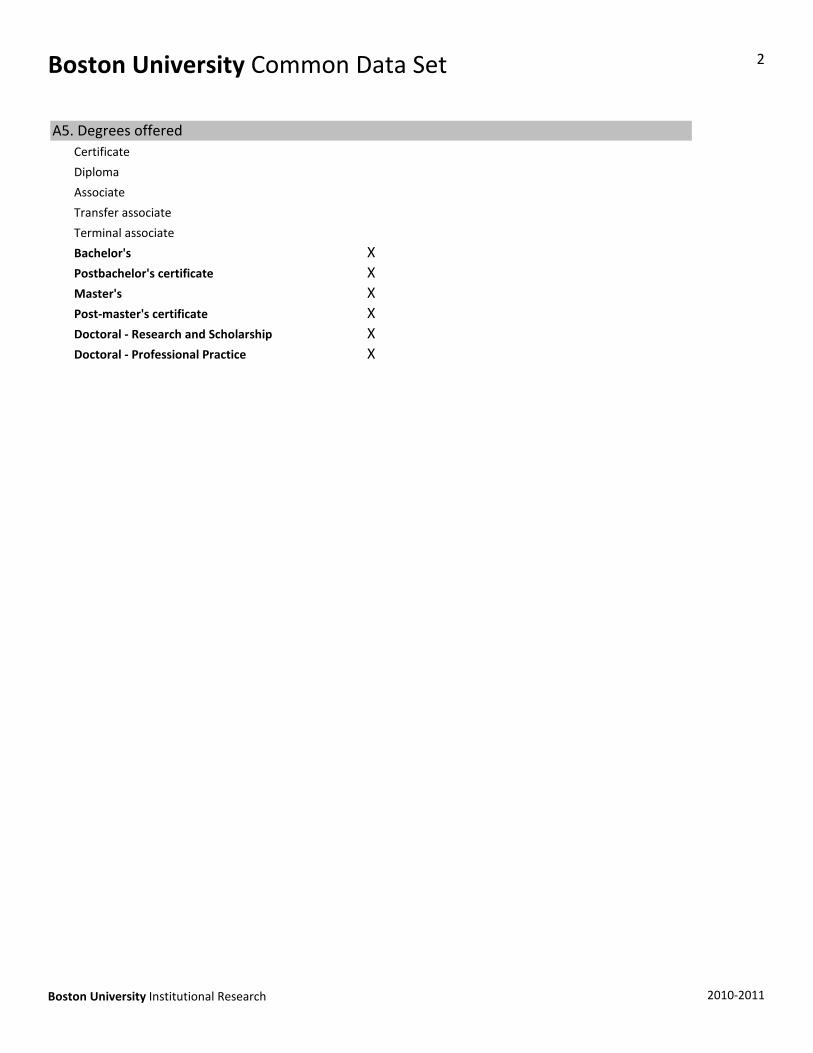
Bachelor's XPostbachelor's certificate XMaster's XPost‐master's certificate XDoctoral ‐ Research and Scholarship XDoctoral ‐ Professional Practice X
A5. Degrees offered
Boston University Institutional Research 2010‐2011
Boston University Common Data Set 3
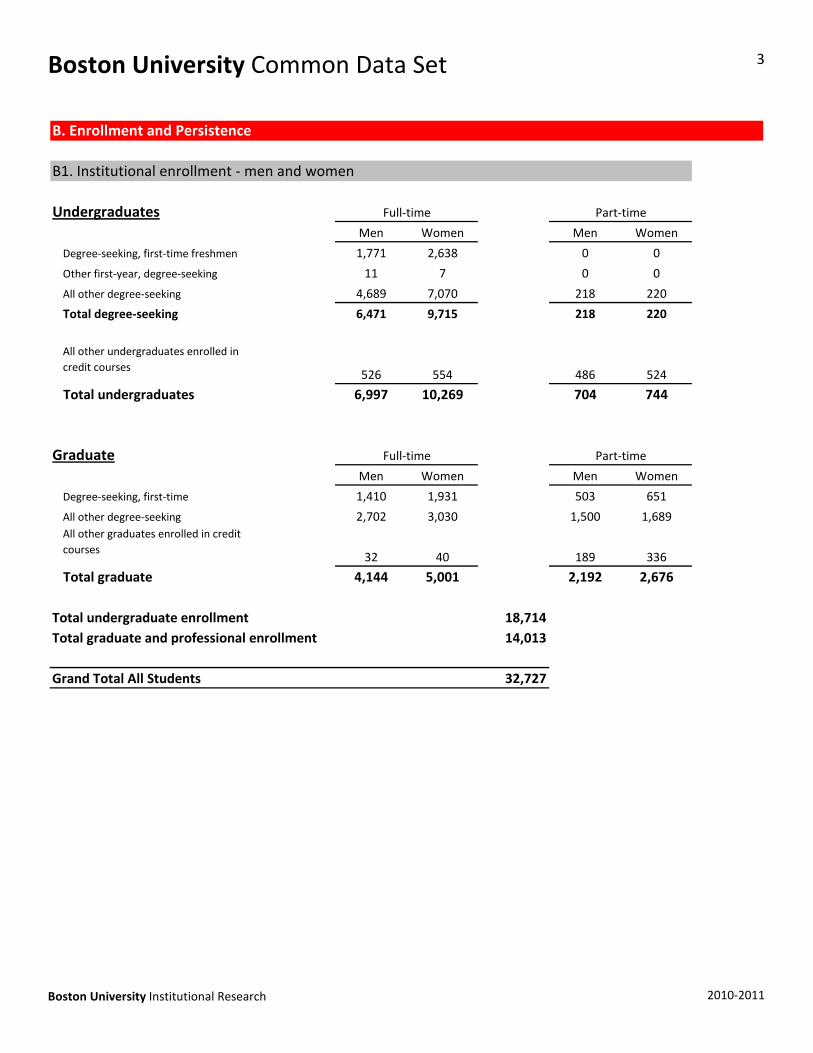
UndergraduatesMen Women Men Women
Degree‐seeking, first‐time freshmen 1,771 2,638 0 0
Other first‐year, degree‐seeking 11 7 0 0
All other degree‐seeking 4,689 7,070 218 220
Total degree‐seeking 6,471 9,715 218 220
526 554 486 524
Total undergraduates 6,997 10,269 704 744
GraduateMen Women Men Women
Degree‐seeking, first‐time 1,410 1,931 503 651
All other degree‐seeking 2,702 3,030 1,500 1,689
32 40 189 336
Total graduate 4,144 5,001 2,192 2,676
All other graduates enrolled in credit courses
B. Enrollment and Persistence
B1. Institutional enrollment ‐ men and women
Full‐time Part‐time
All other undergraduates enrolled in credit courses
Full‐time Part‐time
Total undergraduate enrollment 18,714Total graduate and professional enrollment 14,013
Grand Total All Students 32,727
Boston University Institutional Research 2010‐2011
Boston University Common Data Set 4
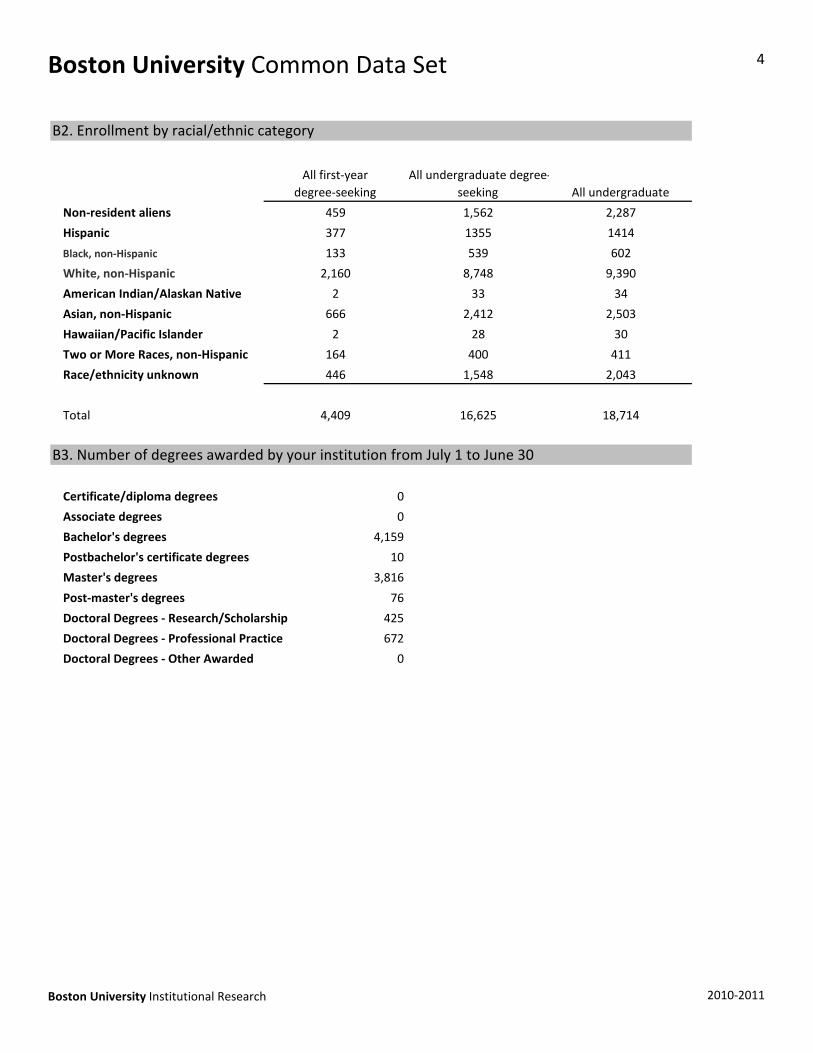
Non‐resident aliens
Hispanic
Black, non‐Hispanic
White, non‐Hispanic
American Indian/Alaskan Native
Asian, non‐Hispanic
Hawaiian/Pacific Islander
Two or More Races, non‐Hispanic
Race/ethnicity unknown
Total
Certificate/diploma degrees 0
Associate degrees 0
Bachelor's degrees 4,159
Postbachelor's certificate degrees 10
Master's degrees 3,816
666 2,412 2,503
2 28 30
4,409 16,625 18,714
B3. Number of degrees awarded by your institution from July 1 to June 30
164 400 411
446 1,548 2,043
2,160 8,748 9,390
2 33 34
377 1355 1414
133 539 602
B2. Enrollment by racial/ethnic category
All first‐year degree‐seeking
All undergraduate degree‐seeking All undergraduate
459 1,562 2,287
Post‐master's degrees 76
Doctoral Degrees ‐ Research/Scholarship 425
Doctoral Degrees ‐ Professional Practice 672
Doctoral Degrees ‐ Other Awarded 0
Boston University Institutional Research 2010‐2011
Boston University Common Data Set 5
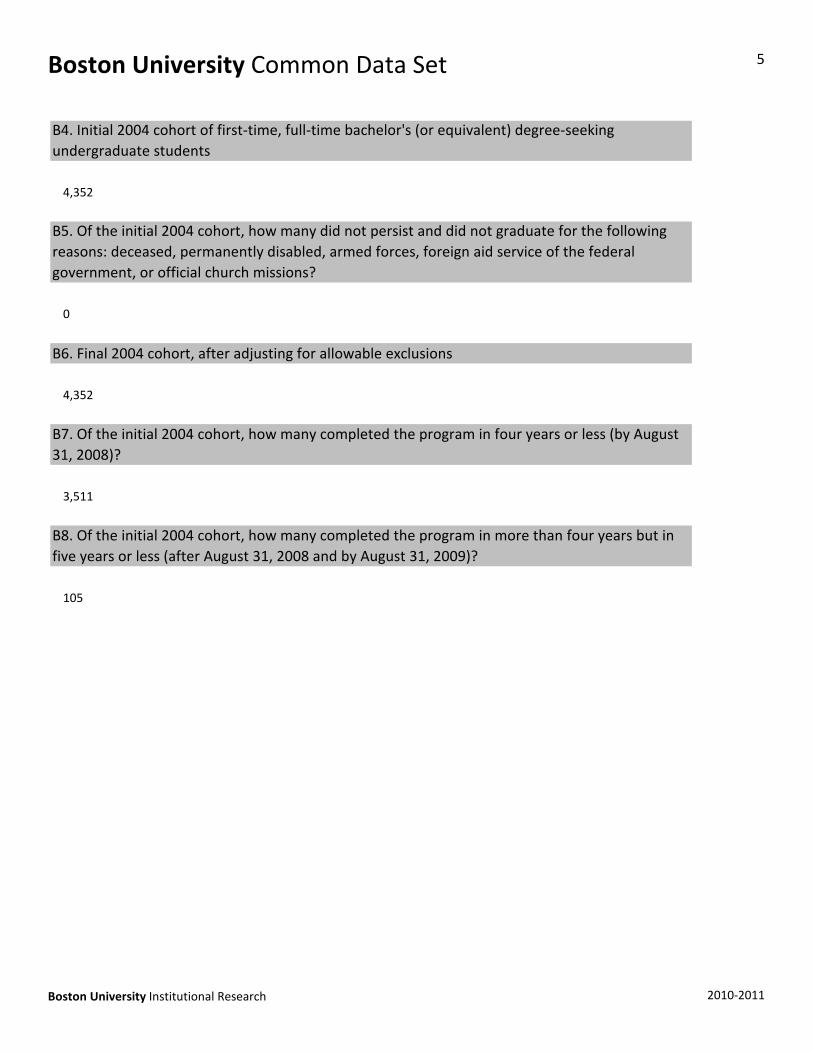
4,352
0
4,352
3,511
B6. Final 2004 cohort, after adjusting for allowable exclusions
B7. Of the initial 2004 cohort, how many completed the program in four years or less (by August 31, 2008)?
B8. Of the initial 2004 cohort, how many completed the program in more than four years but in five years or less (after August 31, 2008 and by August 31, 2009)?
B4. Initial 2004 cohort of first‐time, full‐time bachelor's (or equivalent) degree‐seeking undergraduate students
B5. Of the initial 2004 cohort, how many did not persist and did not graduate for the following reasons: deceased, permanently disabled, armed forces, foreign aid service of the federal government, or official church missions?
105
Boston University Institutional Research 2010‐2011
Boston University Common Data Set 6
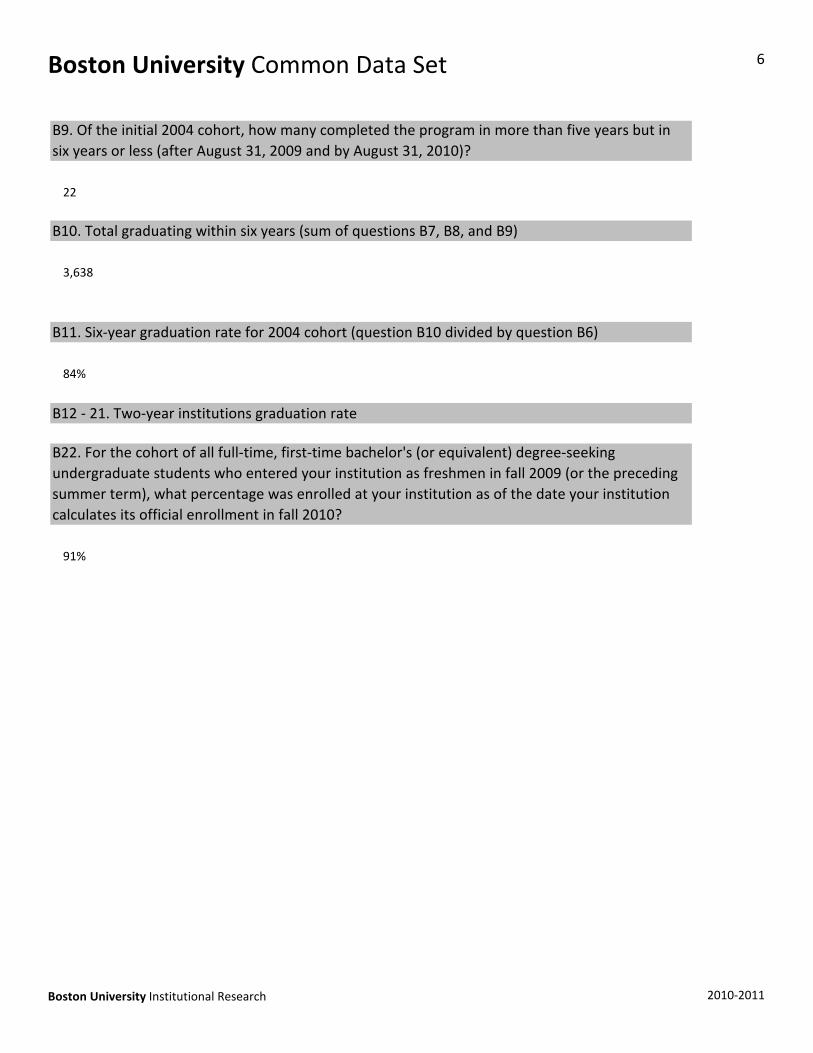
22
3,638
84%
91%
B12 ‐ 21. Two‐year institutions graduation rate
B22. For the cohort of all full‐time, first‐time bachelor's (or equivalent) degree‐seeking undergraduate students who entered your institution as freshmen in fall 2009 (or the preceding summer term), what percentage was enrolled at your institution as of the date your institution calculates its official enrollment in fall 2010?
B9. Of the initial 2004 cohort, how many completed the program in more than five years but in six years or less (after August 31, 2009 and by August 31, 2010)?
B10. Total graduating within six years (sum of questions B7, B8, and B9)
B11. Six‐year graduation rate for 2004 cohort (question B10 divided by question B6)
Boston University Institutional Research 2010‐2011
Boston University Common Data Set 7
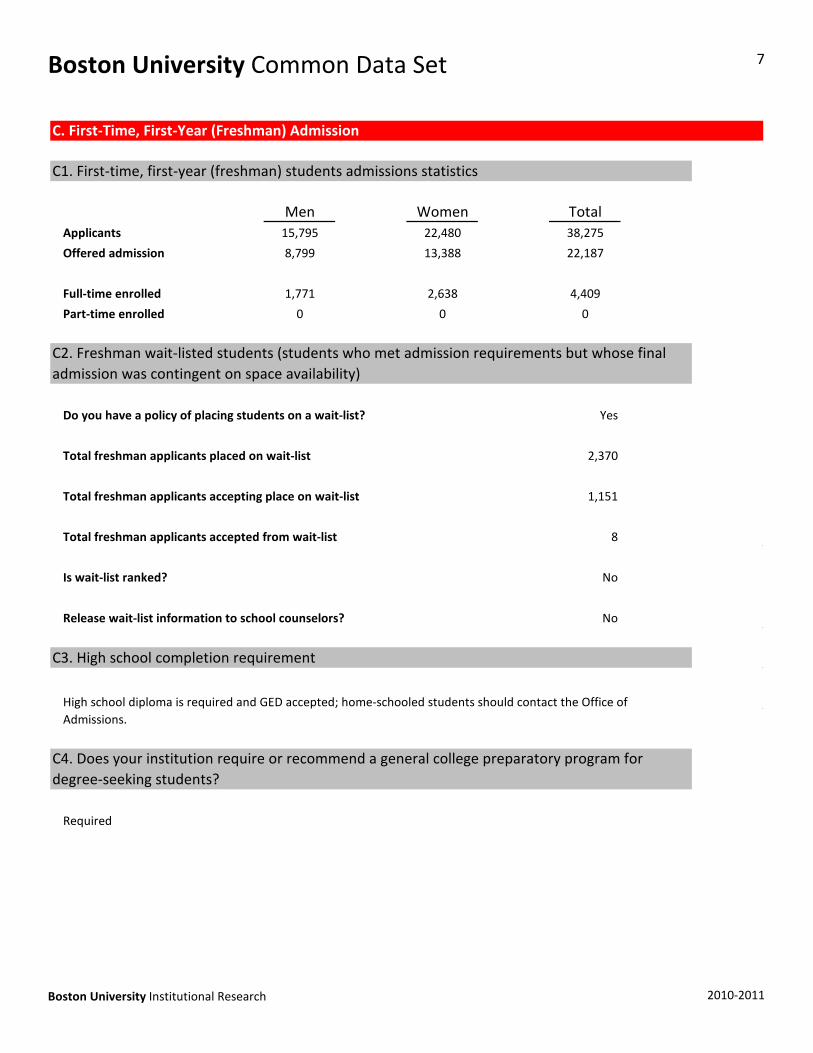
Men Women TotalApplicants 15,795 22,480 38,275
Offered admission 8,799 13,388 22,187
Full‐time enrolled 1,771 2,638 4,409
Part‐time enrolled 0 0 0
Do you have a policy of placing students on a wait‐list? Yes
Total freshman applicants placed on wait‐list 2,370
Total freshman applicants accepting place on wait‐list 1,151
Total freshman applicants accepted from wait‐list 8
Is wait‐list ranked? No
C. First‐Time, First‐Year (Freshman) Admission
C1. First‐time, first‐year (freshman) students admissions statistics
C2. Freshman wait‐listed students (students who met admission requirements but whose final admission was contingent on space availability)
Release wait‐list information to school counselors? No
Required
High school diploma is required and GED accepted; home‐schooled students should contact the Office of Admissions.
C4. Does your institution require or recommend a general college preparatory program for degree‐seeking students?
C3. High school completion requirement
Boston University Institutional Research 2010‐2011
Boston University Common Data Set 8
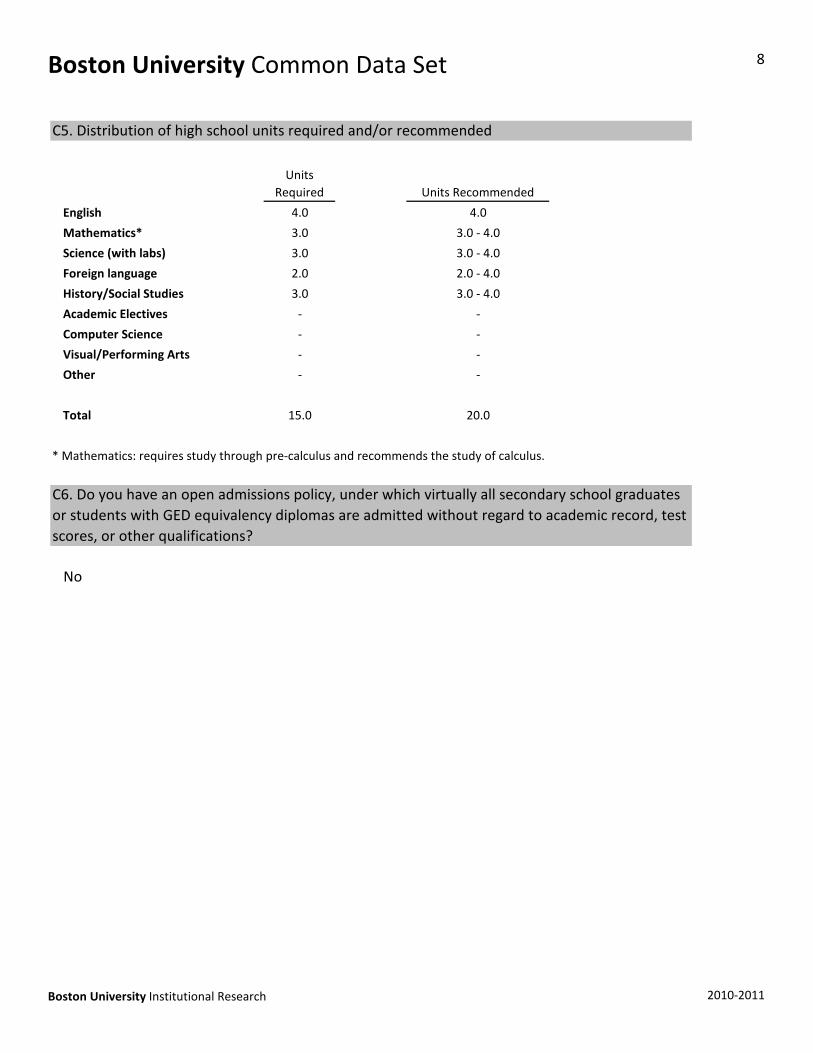
English 4.0
Mathematics* 3.0
Science (with labs) 3.0
Foreign language 2.0
History/Social Studies 3.0
Academic Electives ‐
Computer Science ‐
Visual/Performing Arts ‐
Other ‐
Total 15.0
* Mathematics: requires study through pre‐calculus and recommends the study of calculus.
No
‐
‐
20.0
C6. Do you have an open admissions policy, under which virtually all secondary school graduates or students with GED equivalency diplomas are admitted without regard to academic record, test scores, or other qualifications?
3.0 ‐ 4.0
3.0 ‐ 4.0
2.0 ‐ 4.0
3.0 ‐ 4.0
‐
‐
C5. Distribution of high school units required and/or recommended
Units Required Units Recommended
4.0
Boston University Institutional Research 2010‐2011

Boston University Common Data Set 9
Academic factors
Rigor of secondary school record XClass rank XAcademic GPA XStandardized test scores XApplication essay XRecommendations X
Non‐academic factors
Interview 1 X XExtracurricular activities XTalent/ability 2 X XCharacter/personal qualities XFirst generation XAlumni/ae relation XGeographical residence XState residency XReligious affiliation/commitment X
Very Important Important Considered
Not Considered
C7. Relative importance of each of the following academic non academic factors in your first‐time, first‐year, degree‐seeking (freshman) admissions decisions
Racial/ethnic status XVolunteer work XWork experience XLevel of applicant's interest X
2 Talent/ability is very important for College of Fine Arts applicants, otherwise not considered.
1 Interviews are only required for 7 year accelerated medical and dental program finalists and Boston and Medeiros Scholarship nominees.
Boston University Institutional Research 2010‐2011
Boston University Common Data Set 10
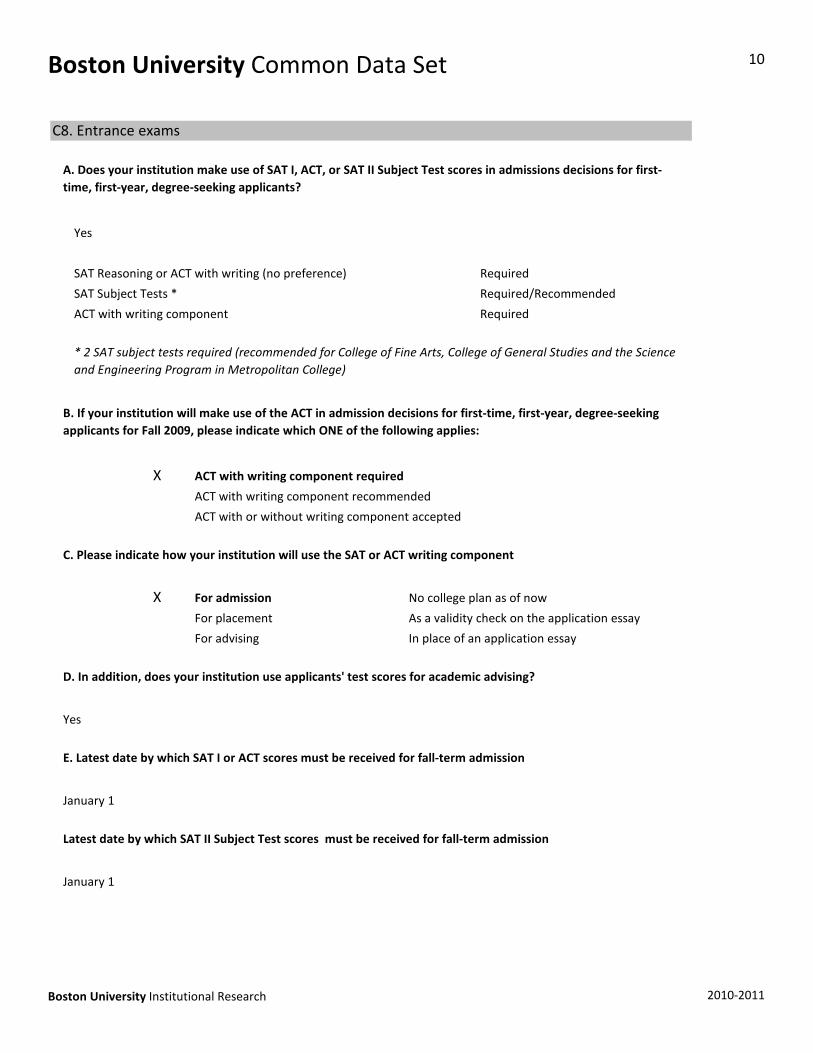
Yes
SAT Reasoning or ACT with writing (no preference) Required
SAT Subject Tests * Required/Recommended
ACT with writing component Required
X ACT with writing component required
ACT with writing component recommended
ACT with or without writing component accepted
A. Does your institution make use of SAT I, ACT, or SAT II Subject Test scores in admissions decisions for first‐time, first‐year, degree‐seeking applicants?
* 2 SAT subject tests required (recommended for College of Fine Arts, College of General Studies and the Science and Engineering Program in Metropolitan College)
B. If your institution will make use of the ACT in admission decisions for first‐time, first‐year, degree‐seeking applicants for Fall 2009, please indicate which ONE of the following applies:
C. Please indicate how your institution will use the SAT or ACT writing component
C8. Entrance exams
X For admission No college plan as of now
For placement As a validity check on the application essay
For advising In place of an application essay
Yes
January 1
January 1
Latest date by which SAT II Subject Test scores must be received for fall‐term admission
D. In addition, does your institution use applicants' test scores for academic advising?
E. Latest date by which SAT I or ACT scores must be received for fall‐term admission
Boston University Institutional Research 2010‐2011
Boston University Common Data Set 11
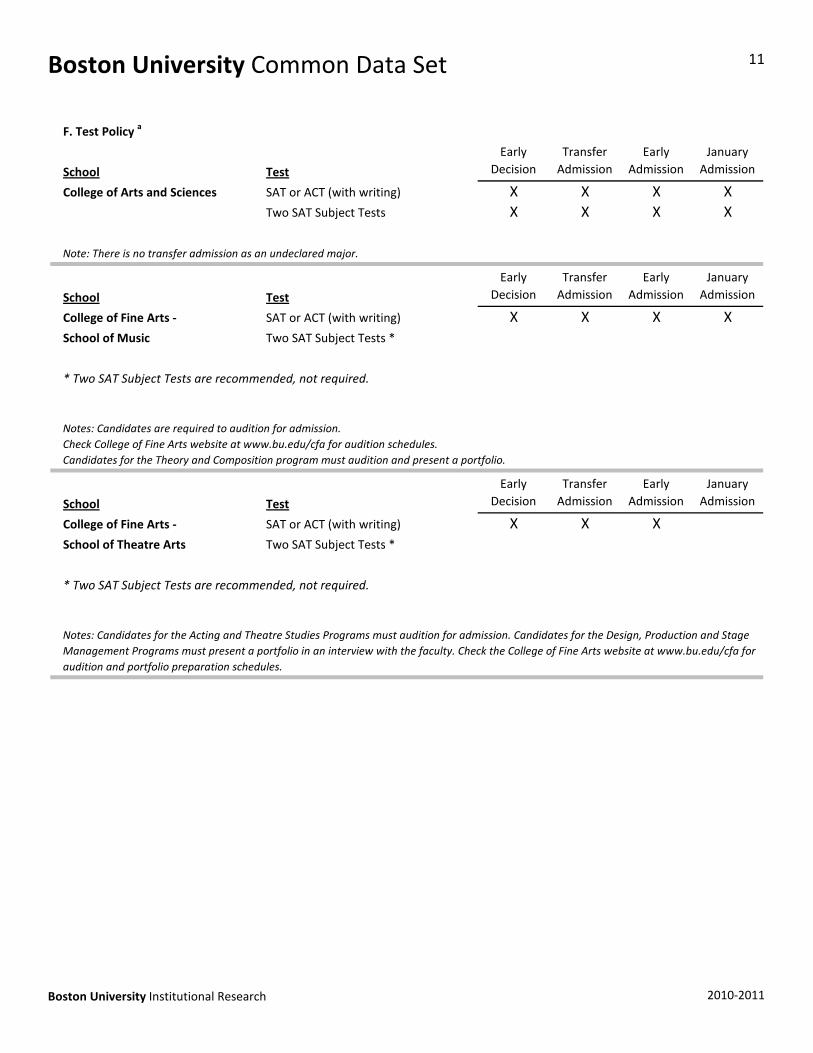
School Test
College of Arts and Sciences SAT or ACT (with writing) X X X XTwo SAT Subject Tests X X X X
Note: There is no transfer admission as an undeclared major.
School Test
College of Fine Arts ‐ SAT or ACT (with writing) X X X XSchool of Music Two SAT Subject Tests *
* Two SAT Subject Tests are recommended, not required.
School Test
College of Fine Arts ‐ SAT or ACT (with writing) X X XSchool of Theatre Arts Two SAT Subject Tests *
* Two SAT Subject Tests are recommended not required
Early Decision
Transfer Admission
Early Admission
January Admission
Notes: Candidates are required to audition for admission.Check College of Fine Arts website at www.bu.edu/cfa for audition schedules.Candidates for the Theory and Composition program must audition and present a portfolio.
Early Decision
Transfer Admission
Early Admission
January Admission
F. Test Policy a
Early Decision
Transfer Admission
Early Admission
January Admission
Two SAT Subject Tests are recommended, not required.
Notes: Candidates for the Acting and Theatre Studies Programs must audition for admission. Candidates for the Design, Production and Stage Management Programs must present a portfolio in an interview with the faculty. Check the College of Fine Arts website at www.bu.edu/cfa for audition and portfolio preparation schedules.
Boston University Institutional Research 2010‐2011
Boston University Common Data Set 12
School Test
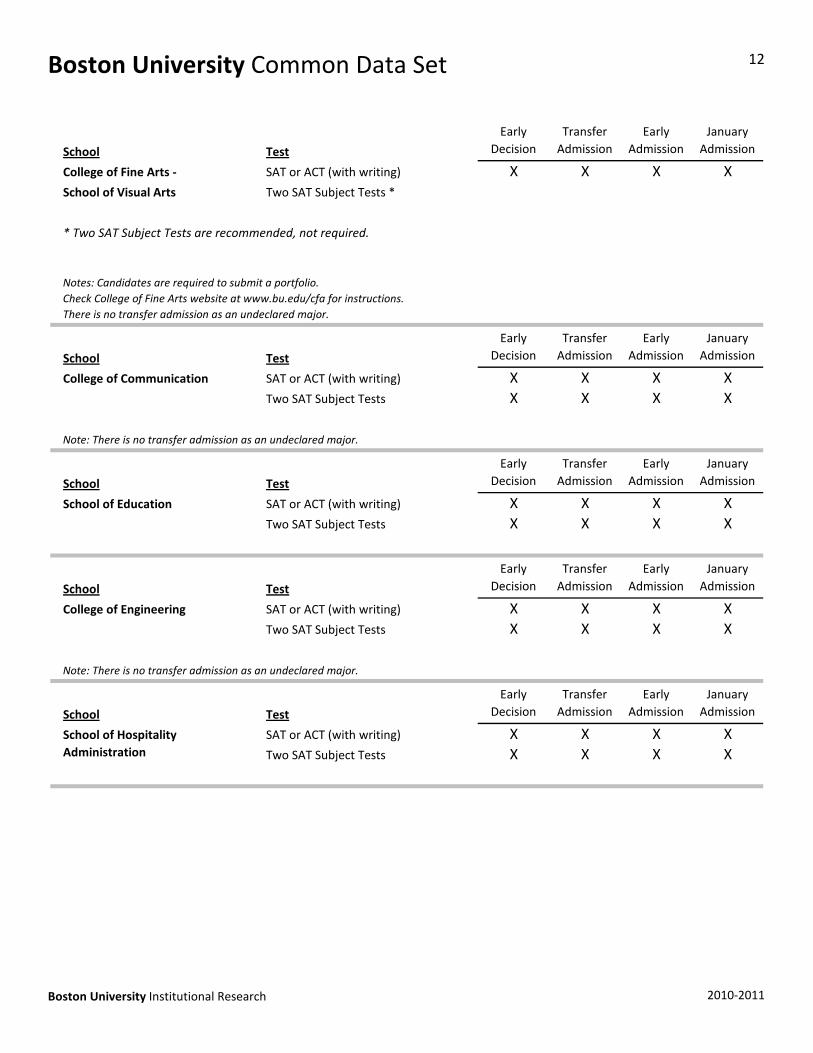
College of Fine Arts ‐ SAT or ACT (with writing) X X X XSchool of Visual Arts Two SAT Subject Tests *
* Two SAT Subject Tests are recommended, not required.
School Test
College of Communication SAT or ACT (with writing) X X X XTwo SAT Subject Tests X X X X
Note: There is no transfer admission as an undeclared major.
School Test
School of Education SAT or ACT (with writing) X X X XTwo SAT Subject Tests X X X X
School Test
Early Decision
Transfer Admission
Early Admission
January Admission
Early Decision
Transfer Admission
Early Admission
January Admission
Early Decision
Transfer Admission
Early Admission
January Admission
Early Decision
Transfer Admission
Early Admission
January Admission
Notes: Candidates are required to submit a portfolio.Check College of Fine Arts website at www.bu.edu/cfa for instructions.There is no transfer admission as an undeclared major.
School Test
College of Engineering SAT or ACT (with writing) X X X XTwo SAT Subject Tests X X X X
Note: There is no transfer admission as an undeclared major.
School Test
SAT or ACT (with writing) X X X XTwo SAT Subject Tests X X X X
School of Hospitality Administration
Decision Admission Admission Admission
Early Decision
Transfer Admission
Early Admission
January Admission
Boston University Institutional Research 2010‐2011
Boston University Common Data Set 13
School Test
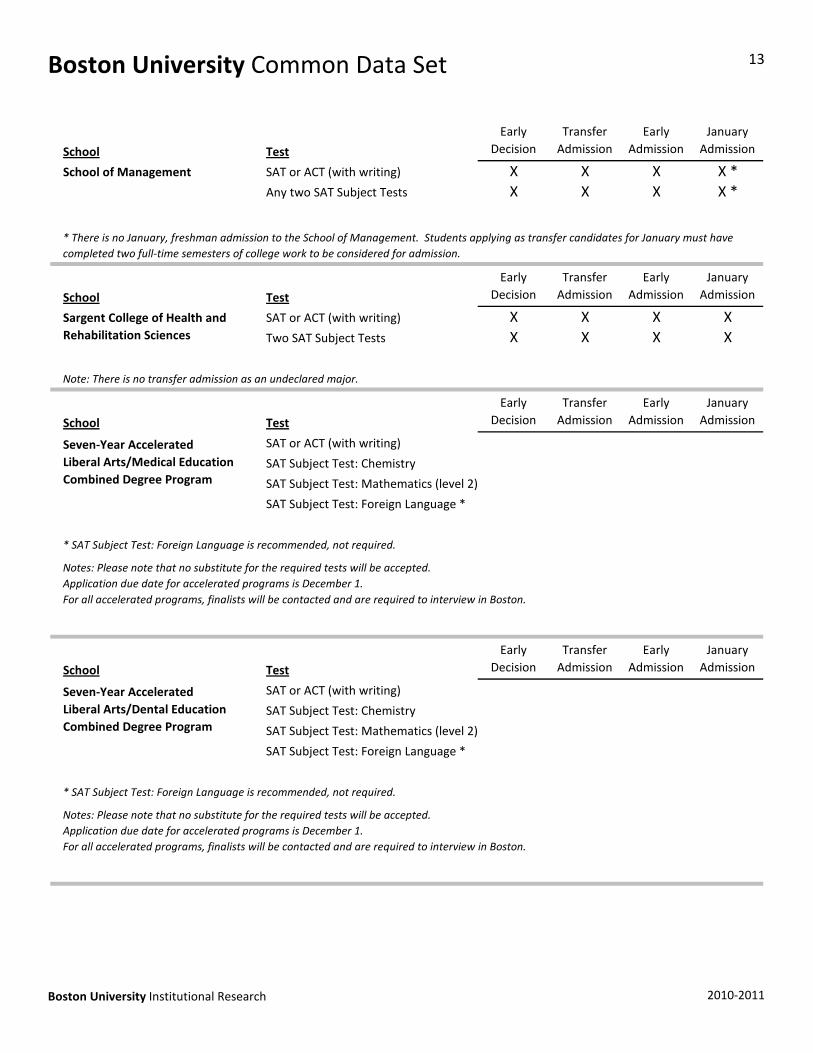
School of Management SAT or ACT (with writing) X X X X *Any two SAT Subject Tests X X X X *
School Test
SAT or ACT (with writing) X X X XTwo SAT Subject Tests X X X X
Note: There is no transfer admission as an undeclared major.
School Test
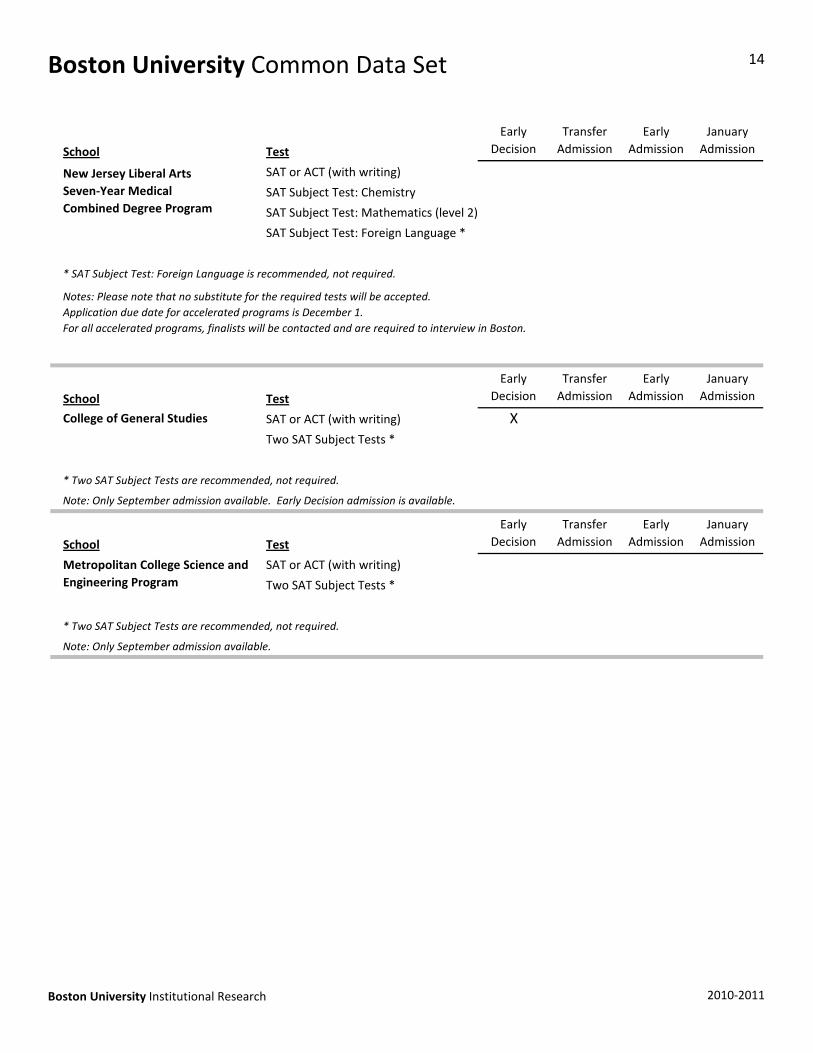
SAT or ACT (with writing)
SAT Subject Test: Chemistry
SAT Subject Test: Mathematics (level 2)
SAT Subject Test: Foreign Language *
* SAT Subject Test: Foreign Language is recommended, not required.
Seven‐Year Accelerated Liberal Arts/Medical Education Combined Degree Program
Notes: Please note that no substitute for the required tests will be accepted. Application due date for accelerated programs is December 1.
Early Decision
Transfer Admission
Early Admission
January Admission
Sargent College of Health and Rehabilitation Sciences
Early Decision
Transfer Admission
Early Admission
January Admission
Early Decision
Transfer Admission
Early Admission
January Admission
* There is no January, freshman admission to the School of Management. Students applying as transfer candidates for January must have completed two full‐time semesters of college work to be considered for admission.
School Test
SAT or ACT (with writing)
SAT Subject Test: Chemistry
SAT Subject Test: Mathematics (level 2)
SAT Subject Test: Foreign Language *
* SAT Subject Test: Foreign Language is recommended, not required.
Seven‐Year Accelerated Liberal Arts/Dental Education Combined Degree Program
Notes: Please note that no substitute for the required tests will be accepted. Application due date for accelerated programs is December 1. For all accelerated programs, finalists will be contacted and are required to interview in Boston.
pp f p gFor all accelerated programs, finalists will be contacted and are required to interview in Boston.
Early Decision
Transfer Admission
Early Admission
January Admission
Boston University Institutional Research 2010‐2011
Boston University Common Data Set 14
School Test
SAT or ACT (with writing)
SAT Subject Test: Chemistry
SAT Subject Test: Mathematics (level 2)
SAT Subject Test: Foreign Language *
* SAT Subject Test: Foreign Language is recommended, not required.
School Test
College of General Studies SAT or ACT (with writing) XTwo SAT Subject Tests *
* Two SAT Subject Tests are recommended, not required.
Note: Only September admission available. Early Decision admission is available.
School Test
SAT or ACT (with writing)
Two SAT Subject Tests *
Early Decision
Transfer Admission
Early Admission
January Admission
Metropolitan College Science and Engineering Program
New Jersey Liberal Arts Seven‐Year Medical Combined Degree Program
Notes: Please note that no substitute for the required tests will be accepted. Application due date for accelerated programs is December 1. For all accelerated programs, finalists will be contacted and are required to interview in Boston.
Early Decision
Transfer Admission
Early Admission
January Admission
Early Decision
Transfer Admission
Early Admission
January Admission
Two SAT Subject Tests
* Two SAT Subject Tests are recommended, not required.
Note: Only September admission available.
g g g
Boston University Institutional Research 2010‐2011
Boston University Common Data Set 15
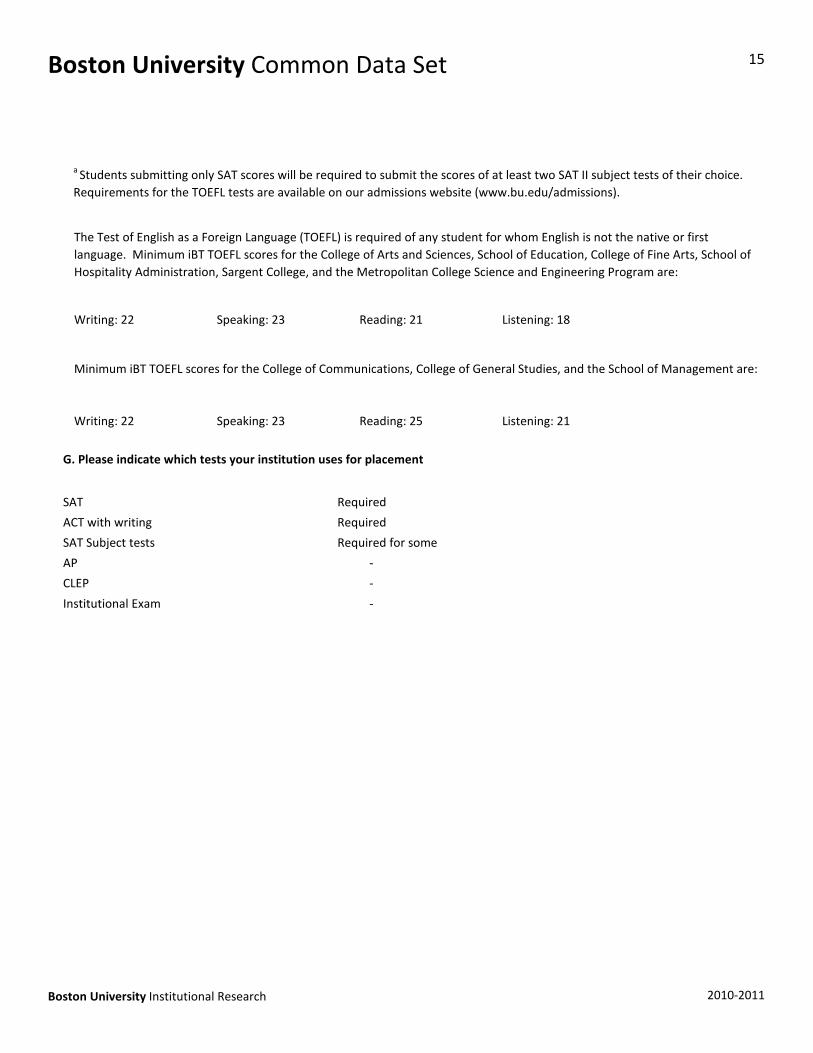
Writing: 22 Speaking: 23 Reading: 21 Listening: 18
Writing: 22 Speaking: 23 Reading: 25 Listening: 21
SAT Required
ACT with writing Required
SAT Subject tests Required for some
AP ‐
CLEP ‐
The Test of English as a Foreign Language (TOEFL) is required of any student for whom English is not the native or first language. Minimum iBT TOEFL scores for the College of Arts and Sciences, School of Education, College of Fine Arts, School of Hospitality Administration, Sargent College, and the Metropolitan College Science and Engineering Program are:
Minimum iBT TOEFL scores for the College of Communications, College of General Studies, and the School of Management are:
G. Please indicate which tests your institution uses for placement
a Students submitting only SAT scores will be required to submit the scores of at least two SAT II subject tests of their choice. Requirements for the TOEFL tests are available on our admissions website (www.bu.edu/admissions).
Institutional Exam ‐
Boston University Institutional Research 2010‐2011
Boston University Common Data Set 16
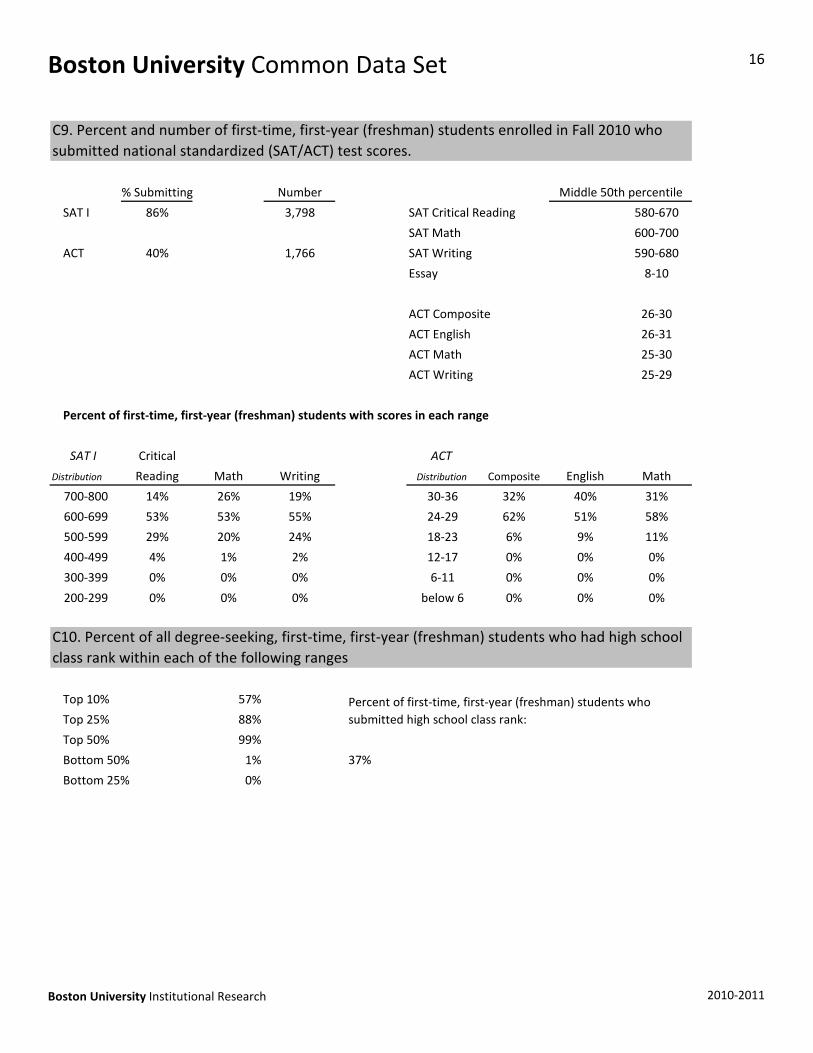
% Submitting Number
SAT I 86% 3,798 SAT Critical Reading 580‐670
SAT Math 600‐700
ACT 40% 1,766 SAT Writing 590‐680
Essay 8‐10
ACT Composite 26‐30
ACT English 26‐31
ACT Math 25‐30
ACT Writing 25‐29
Percent of first‐time, first‐year (freshman) students with scores in each range
SAT I Critical ACT
Distribution Reading Math Writing Distribution Composite English Math
700‐800 14% 26% 19% 30‐36 32% 40% 31%
600‐699 53% 53% 55% 24‐29 62% 51% 58%
500‐599 29% 20% 24% 18‐23 6% 9% 11%
400‐499 4% 1% 2% 12‐17 0% 0% 0%
300‐399 0% 0% 0% 6‐11 0% 0% 0%
C9. Percent and number of first‐time, first‐year (freshman) students enrolled in Fall 2010 who submitted national standardized (SAT/ACT) test scores.
Middle 50th percentile
200‐299 0% 0% 0% below 6 0% 0% 0%
Top 10% 57%
Top 25% 88%
Top 50% 99%
Bottom 50% 1% 37%
Bottom 25% 0%
Percent of first‐time, first‐year (freshman) students who submitted high school class rank:
C10. Percent of all degree‐seeking, first‐time, first‐year (freshman) students who had high school class rank within each of the following ranges
Boston University Institutional Research 2010‐2011

Boston University Common Data Set 17
3.75 and higher 25%
3.50 ‐ 3.74 36%
3.25 ‐ 3.49 19%
3.00 ‐ 3.24 17%
2.50 ‐ 2.99 3%
2.00 ‐ 2.49 0%
1.00 ‐ 1.99 0%
Below 1.00 0%
3.52
Percent of total freshman submitting high school GPA 99.1%
Is there an application fee? Yes
Amount of application fee $75 ‐ all forms (electronic and paper)
C11. Percent of all enrolled, degree‐seeking, first‐time, first‐year (freshman) students who had high school grade‐point averages within each of the following ranges (using 4.0 scale)
C12. Average high school GPA of all degree‐seeking, first‐time, first‐year (freshman) students who submitted GPA
C13. Application fee
Can it be waived for applicants with financial need? Yes *
* Students should speak with high school guidance counselors to request the submission of a fee waiver.
Does your institution have an application closing date? Yes
January 1 for fall admissions
C14. Application closing date
(December 1 for Accelerated Medical and Dental programs, Trustee Scholar, Dr. Martin Luther King, Jr. Scholar, Alexander Graham Bell Scholar, Boston High School, and Cardinal Medeiros Scholar programs)
Boston University Institutional Research 2010‐2011

Boston University Common Data Set 18
Yes, in most programs
Early April
Must reply by May 1.
Deadline for housing deposit: Enrollment deposit due May 1 (no separate housing deposit)
Amount of housing deposit: Enrollment deposit ‐ $650
Refundable if student does not enroll? No
Does your institution allow students to postpone enrollment after admission?
Yes, Deferred admission is allowed with a maximum postponement of one year (freshmen only).
C15. Are first‐time, first‐year students accepted for terms other than the fall?
C16. Notification to applicants of admission decision sent
C17. Reply policy for admitted applicants
C18. Deferred admission
C19. Early admission of high school students
Yes
C20. No longer on the Common Data Set
Does your institution allow high school students to enroll as full‐time, first‐time (freshman) students one year or more before high school graduation?
Boston University Institutional Research 2010‐2011
Boston University Common Data Set 19
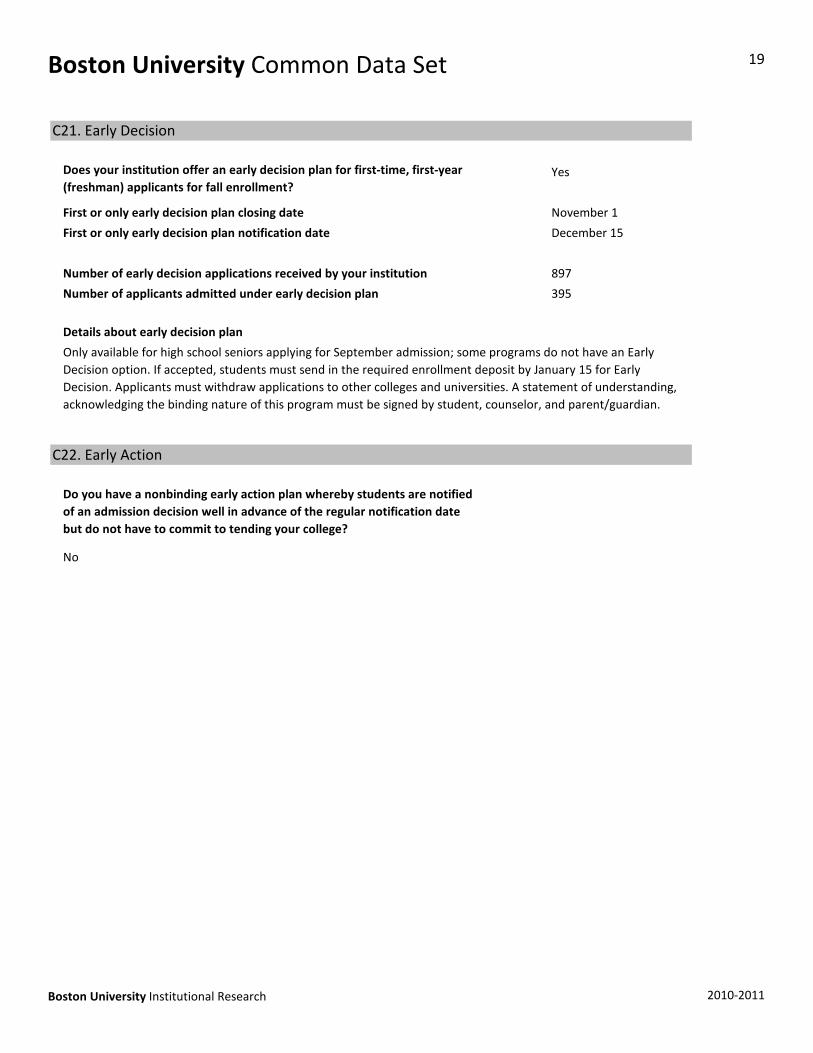
Yes
First or only early decision plan closing date November 1
First or only early decision plan notification date December 15
Number of early decision applications received by your institution 897
Number of applicants admitted under early decision plan 395
Details about early decision plan
No
C21. Early Decision
Does your institution offer an early decision plan for first‐time, first‐year (freshman) applicants for fall enrollment?
Only available for high school seniors applying for September admission; some programs do not have an Early Decision option. If accepted, students must send in the required enrollment deposit by January 15 for Early Decision. Applicants must withdraw applications to other colleges and universities. A statement of understanding, acknowledging the binding nature of this program must be signed by student, counselor, and parent/guardian.
C22. Early Action
Do you have a nonbinding early action plan whereby students are notified of an admission decision well in advance of the regular notification date but do not have to commit to tending your college?
Boston University Institutional Research 2010‐2011
Boston University Common Data Set 20
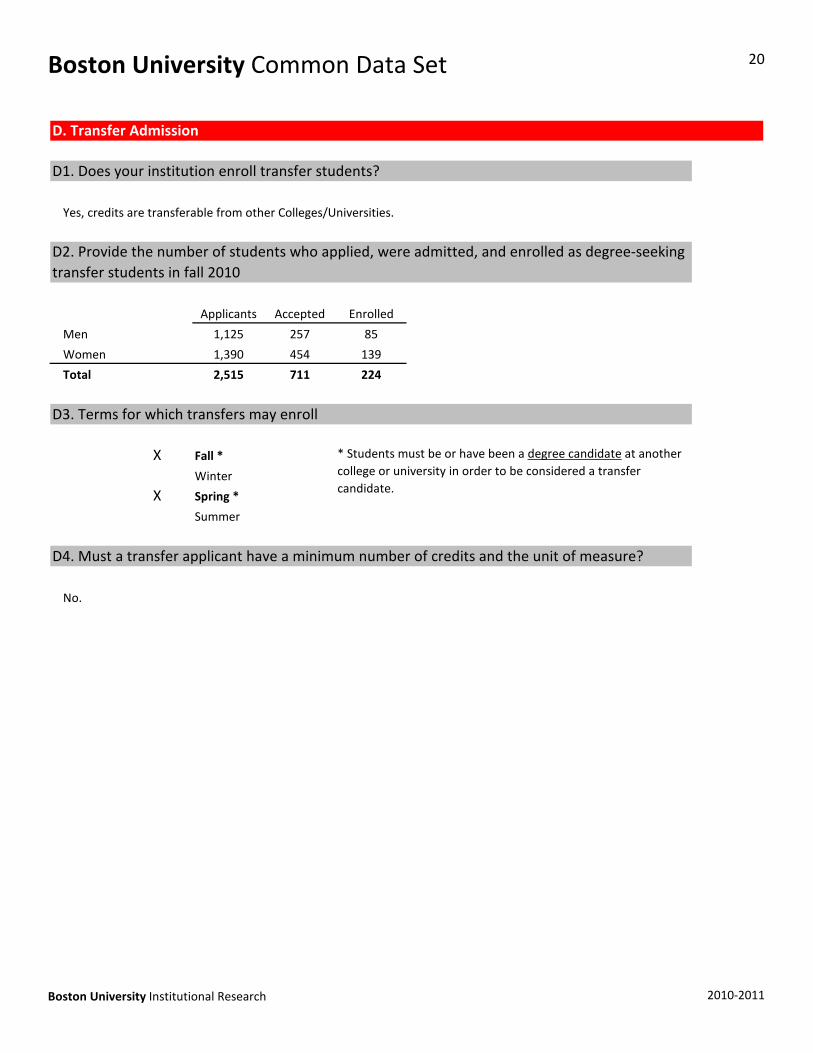
Yes, credits are transferable from other Colleges/Universities.
Applicants Accepted Enrolled
Men 1,125 257 85
Women 1,390 454 139
Total 2,515 711 224
X Fall *
Winter
X Spring *
Summer
D. Transfer Admission
D1. Does your institution enroll transfer students?
D2. Provide the number of students who applied, were admitted, and enrolled as degree‐seeking transfer students in fall 2010
D3. Terms for which transfers may enroll
* Students must be or have been a degree candidate at another college or university in order to be considered a transfer candidate.
D4. Must a transfer applicant have a minimum number of credits and the unit of measure?
No.
Boston University Institutional Research 2010‐2011
Boston University Common Data Set 21
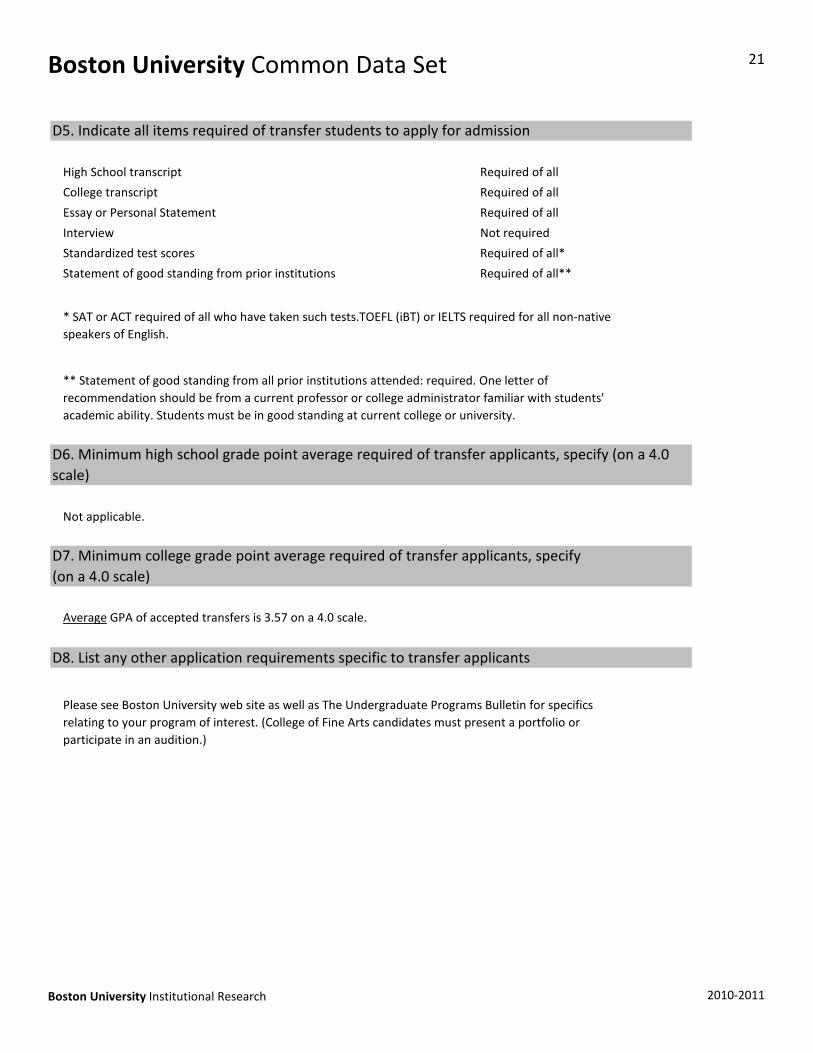
High School transcript Required of all
College transcript Required of all
Essay or Personal Statement Required of all
Interview Not required
Standardized test scores Required of all*
Statement of good standing from prior institutions Required of all**
Not applicable.
D5. Indicate all items required of transfer students to apply for admission
* SAT or ACT required of all who have taken such tests.TOEFL (iBT) or IELTS required for all non‐native speakers of English.
** Statement of good standing from all prior institutions attended: required. One letter of recommendation should be from a current professor or college administrator familiar with students' academic ability. Students must be in good standing at current college or university.
D6. Minimum high school grade point average required of transfer applicants, specify (on a 4.0 scale)
D7. Minimum college grade point average required of transfer applicants, specify (on a 4.0 scale)
Average GPA of accepted transfers is 3.57 on a 4.0 scale.
Please see Boston University web site as well as The Undergraduate Programs Bulletin for specifics relating to your program of interest. (College of Fine Arts candidates must present a portfolio or participate in an audition.)
D8. List any other application requirements specific to transfer applicants
Boston University Institutional Research 2010‐2011
Boston University Common Data Set 22
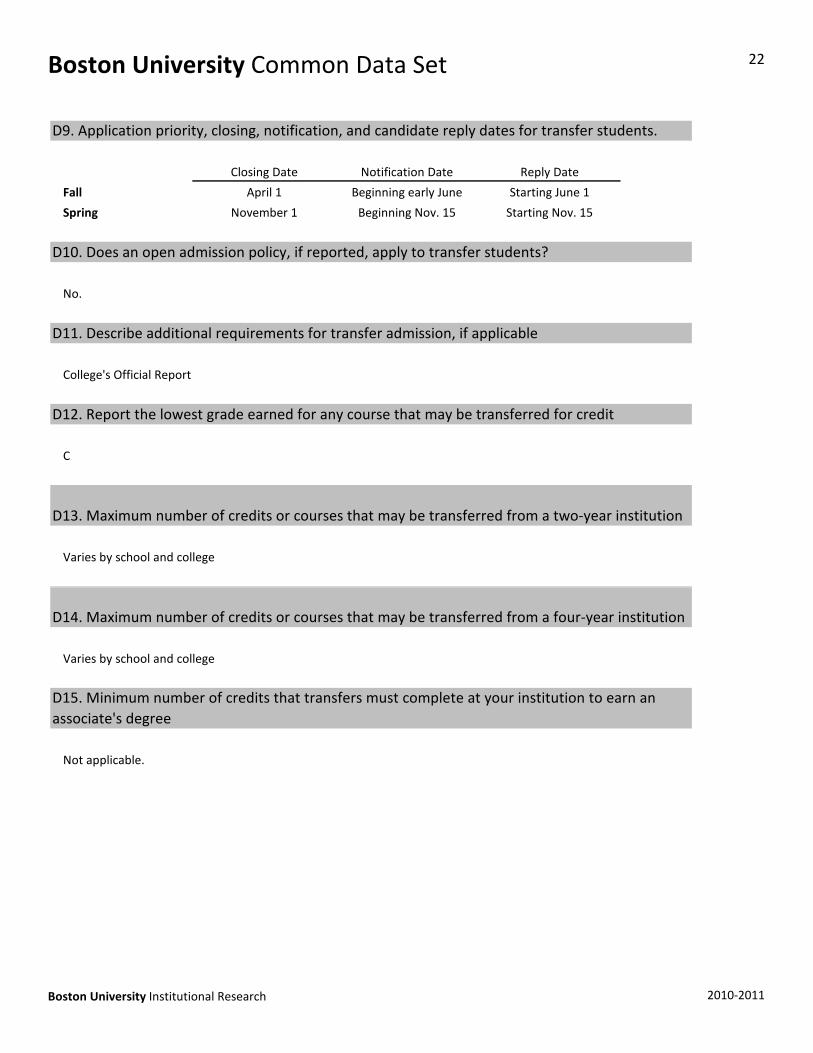
Fall
Spring
No.
College's Official Report
C
Varies by school and college
D13. Maximum number of credits or courses that may be transferred from a two‐year institution
November 1 Beginning Nov. 15 Starting Nov. 15
D10. Does an open admission policy, if reported, apply to transfer students?
D11. Describe additional requirements for transfer admission, if applicable
D12. Report the lowest grade earned for any course that may be transferred for credit
D9. Application priority, closing, notification, and candidate reply dates for transfer students.
Closing Date Notification Date Reply Date
April 1 Beginning early June Starting June 1
Varies by school and college
Not applicable.
D14. Maximum number of credits or courses that may be transferred from a four‐year institution
D15. Minimum number of credits that transfers must complete at your institution to earn an associate's degree
Boston University Institutional Research 2010‐2011
Boston University Common Data Set 23
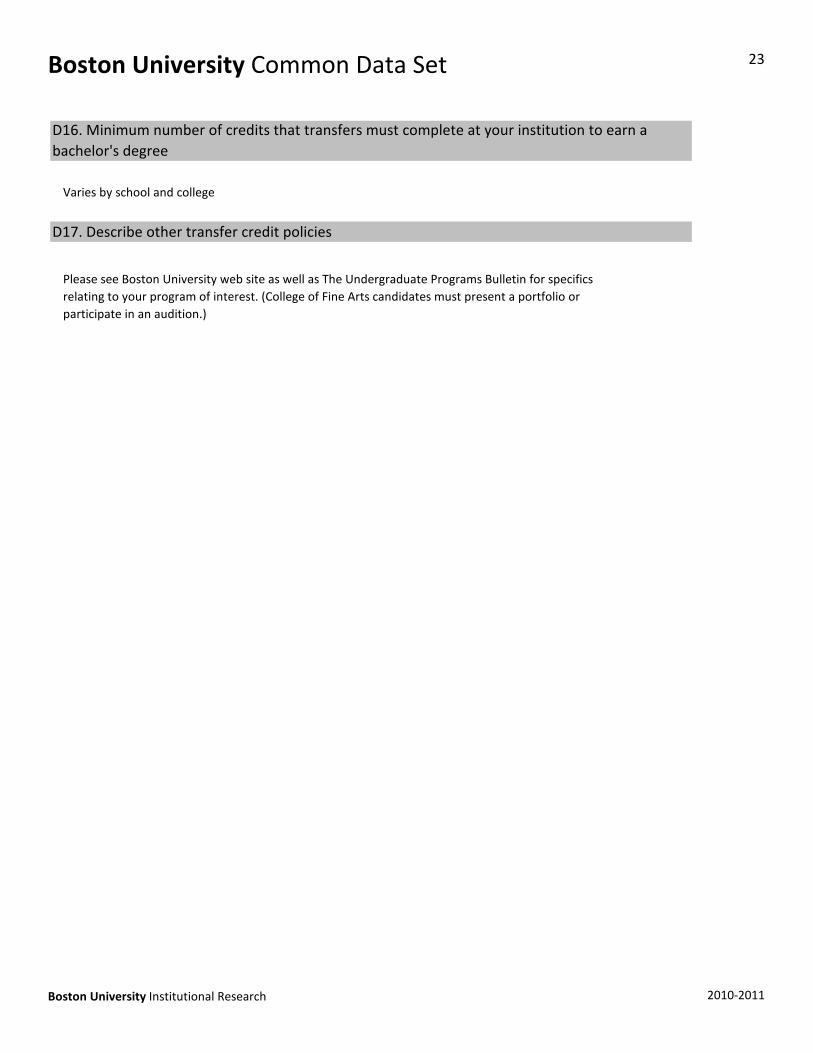
Varies by school and college
D16. Minimum number of credits that transfers must complete at your institution to earn a bachelor's degree
D17. Describe other transfer credit policies
Please see Boston University web site as well as The Undergraduate Programs Bulletin for specifics relating to your program of interest. (College of Fine Arts candidates must present a portfolio or participate in an audition.)
Boston University Institutional Research 2010‐2011
Boston University Common Data Set 24
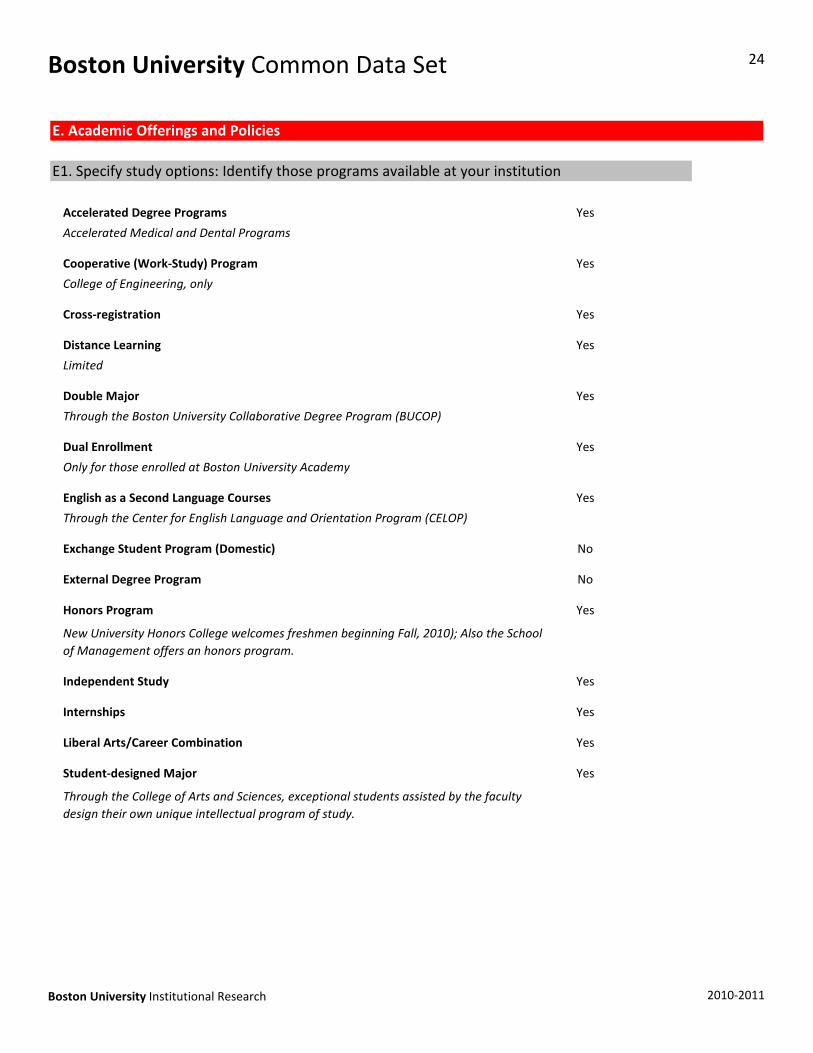
Accelerated Degree Programs Yes
Accelerated Medical and Dental Programs
Cooperative (Work‐Study) Program Yes
College of Engineering, only
Cross‐registration Yes
Distance Learning Yes
Limited
Double Major Yes
Through the Boston University Collaborative Degree Program (BUCOP)
Dual Enrollment Yes
Only for those enrolled at Boston University Academy
English as a Second Language Courses Yes
Through the Center for English Language and Orientation Program (CELOP)
Exchange Student Program (Domestic) No
External Degree Program No
E. Academic Offerings and Policies
E1. Specify study options: Identify those programs available at your institution
Honors Program Yes
Independent Study Yes
Internships Yes
Liberal Arts/Career Combination Yes
Student‐designed Major Yes
New University Honors College welcomes freshmen beginning Fall, 2010); Also the School of Management offers an honors program.
Through the College of Arts and Sciences, exceptional students assisted by the faculty design their own unique intellectual program of study.
Boston University Institutional Research 2010‐2011
Boston University Common Data Set 25
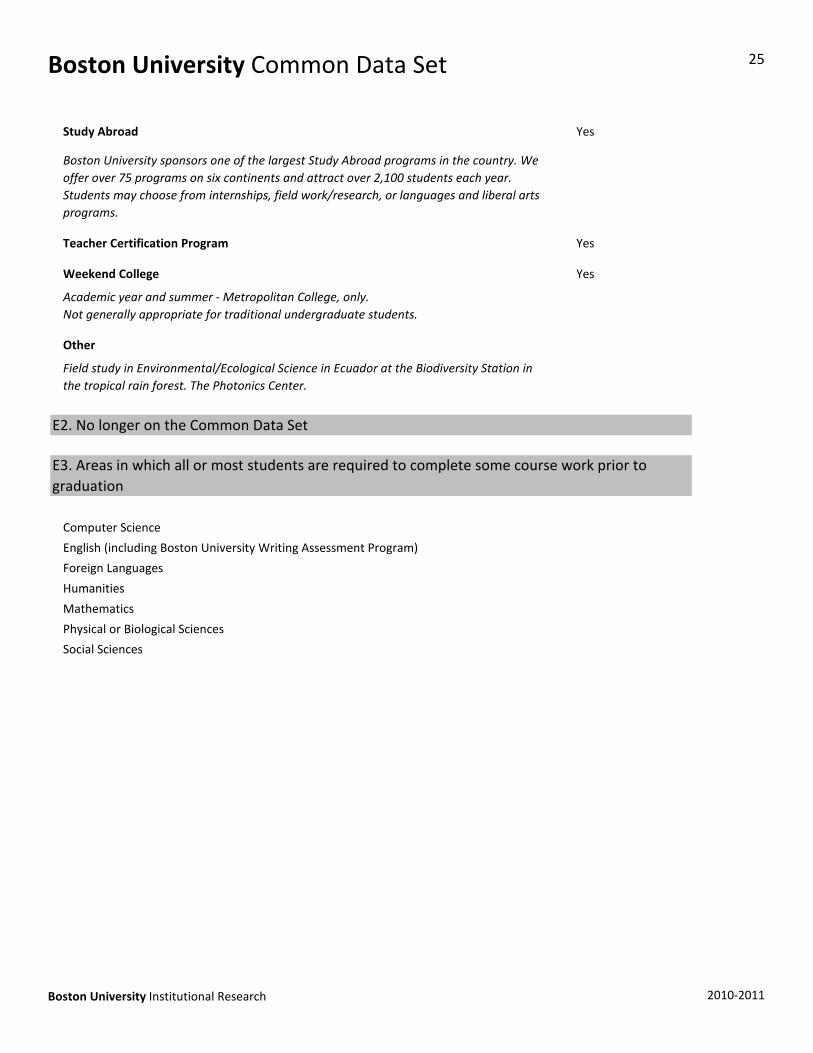
Study Abroad Yes
Teacher Certification Program Yes
Weekend College Yes
Other
Computer Science
English (including Boston University Writing Assessment Program)
Foreign Languages
Humanities
Field study in Environmental/Ecological Science in Ecuador at the Biodiversity Station in the tropical rain forest. The Photonics Center.
E2. No longer on the Common Data Set
E3. Areas in which all or most students are required to complete some course work prior to graduation
Boston University sponsors one of the largest Study Abroad programs in the country. We offer over 75 programs on six continents and attract over 2,100 students each year. Students may choose from internships, field work/research, or languages and liberal arts programs.
Academic year and summer ‐ Metropolitan College, only. Not generally appropriate for traditional undergraduate students.
Humanities
Mathematics
Physical or Biological Sciences
Social Sciences
Boston University Institutional Research 2010‐2011
Boston University Common Data Set 26
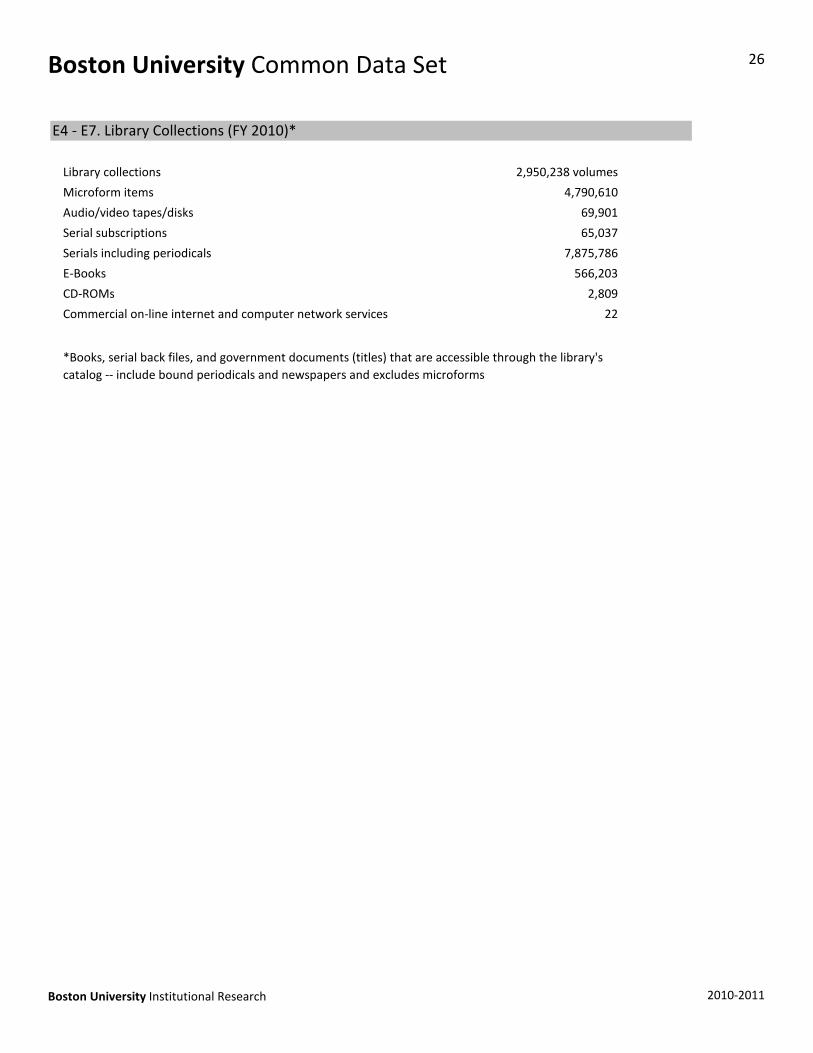
Library collections 2,950,238 volumes
Microform items 4,790,610
Audio/video tapes/disks 69,901
Serial subscriptions 65,037
Serials including periodicals 7,875,786
E‐Books 566,203
CD‐ROMs 2,809
Commercial on‐line internet and computer network services 22
E4 ‐ E7. Library Collections (FY 2010)*
*Books, serial back files, and government documents (titles) that are accessible through the library's catalog ‐‐ include bound periodicals and newspapers and excludes microforms
Boston University Institutional Research 2010‐2011
Boston University Common Data Set 27
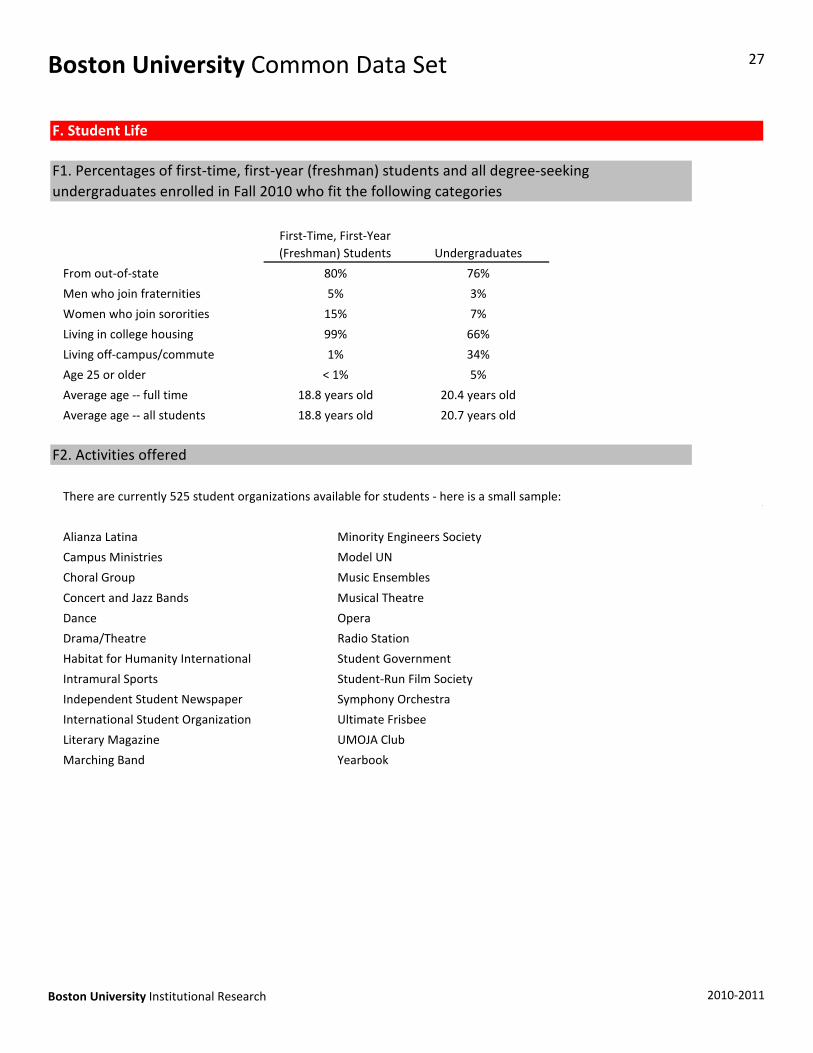
From out‐of‐state
Men who join fraternities
Women who join sororities
Living in college housing
Living off‐campus/commute
Age 25 or older
Average age ‐‐ full time
Average age ‐‐ all students
There are currently 525 student organizations available for students ‐ here is a small sample:
Alianza Latina Minority Engineers Society
Campus Ministries Model UN
Choral Group Music Ensembles
F2. Activities offered
< 1% 5%
18.8 years old 20.4 years old
18.8 years old 20.7 years old
15% 7%
99% 66%
1% 34%
F1. Percentages of first‐time, first‐year (freshman) students and all degree‐seeking undergraduates enrolled in Fall 2010 who fit the following categories
First‐Time, First‐Year (Freshman) Students Undergraduates
80% 76%
5% 3%
F. Student Life
Concert and Jazz Bands Musical Theatre
Dance Opera
Drama/Theatre Radio Station
Habitat for Humanity International Student Government
Intramural Sports Student‐Run Film Society
Independent Student Newspaper Symphony Orchestra
International Student Organization Ultimate Frisbee
Literary Magazine UMOJA Club
Marching Band Yearbook
Boston University Institutional Research 2010‐2011
Boston University Common Data Set 28
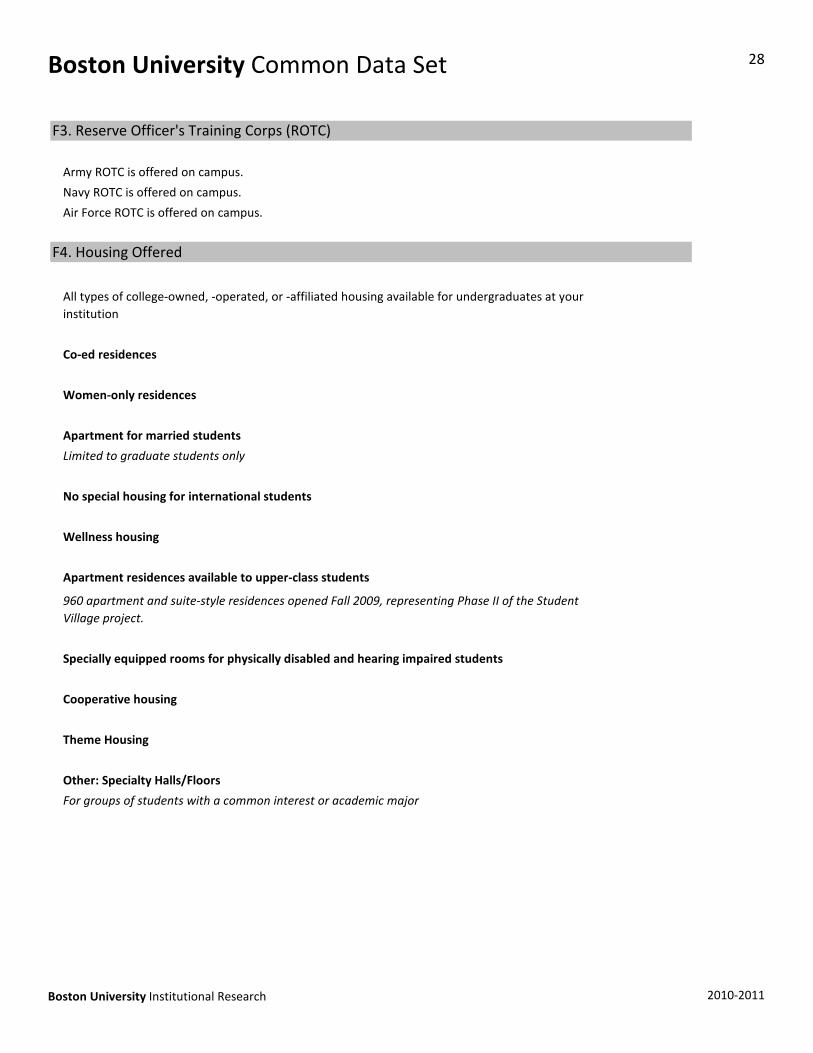
Army ROTC is offered on campus.
Navy ROTC is offered on campus.
Air Force ROTC is offered on campus.
Co‐ed residences
Women‐only residences
Apartment for married students
Limited to graduate students only
No special housing for international students
Wellness housing
Apartment residences available to upper‐class students
F3. Reserve Officer's Training Corps (ROTC)
F4. Housing Offered
All types of college‐owned, ‐operated, or ‐affiliated housing available for undergraduates at your institution
Specially equipped rooms for physically disabled and hearing impaired students
Cooperative housing
Theme Housing
Other: Specialty Halls/Floors
For groups of students with a common interest or academic major
960 apartment and suite‐style residences opened Fall 2009, representing Phase II of the Student Village project.
Boston University Institutional Research 2010‐2011
Boston University Common Data Set 29
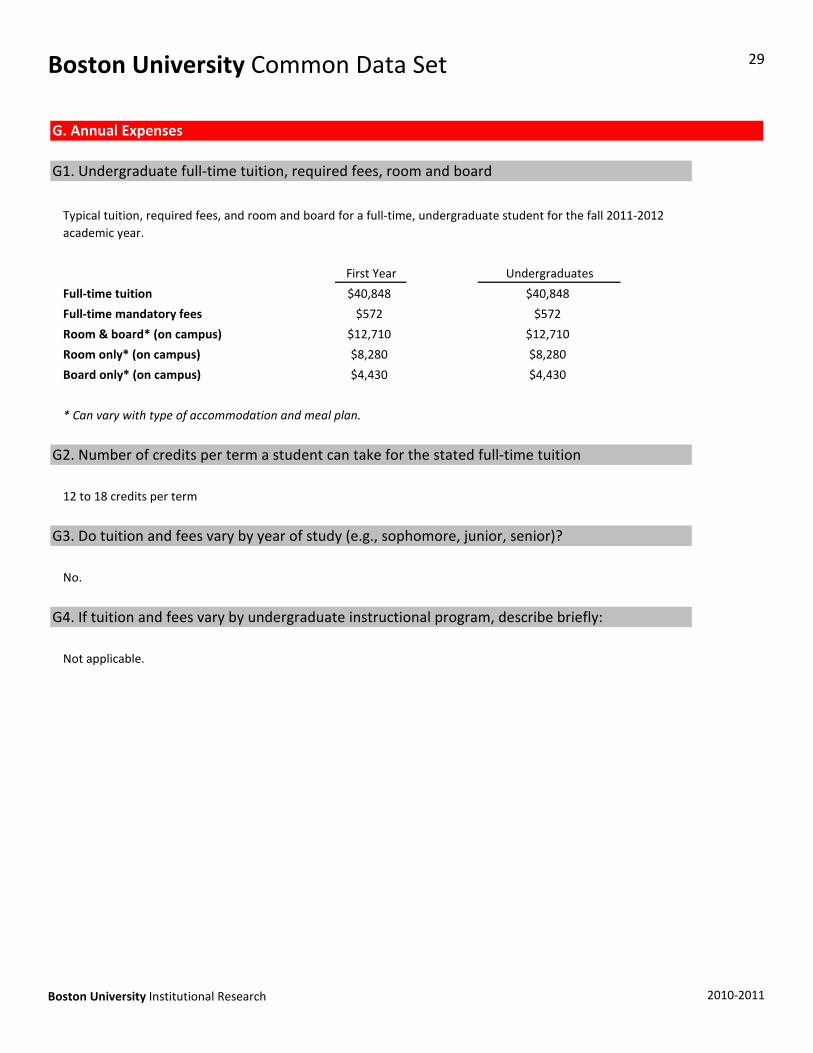
First Year
Full‐time tuition $40,848
Full‐time mandatory fees $572
Room & board* (on campus) $12,710
Room only* (on campus) $8,280
Board only* (on campus) $4,430
* Can vary with type of accommodation and meal plan.
12 to 18 credits per term
No.
$8,280
$4,430
G2. Number of credits per term a student can take for the stated full‐time tuition
G3. Do tuition and fees vary by year of study (e.g., sophomore, junior, senior)?
G1. Undergraduate full‐time tuition, required fees, room and board
Typical tuition, required fees, and room and board for a full‐time, undergraduate student for the fall 2011‐2012 academic year.
Undergraduates
$40,848
$572
$12,710
G. Annual Expenses
Not applicable.
G4. If tuition and fees vary by undergraduate instructional program, describe briefly:
Boston University Institutional Research 2010‐2011
Boston University Common Data Set 30
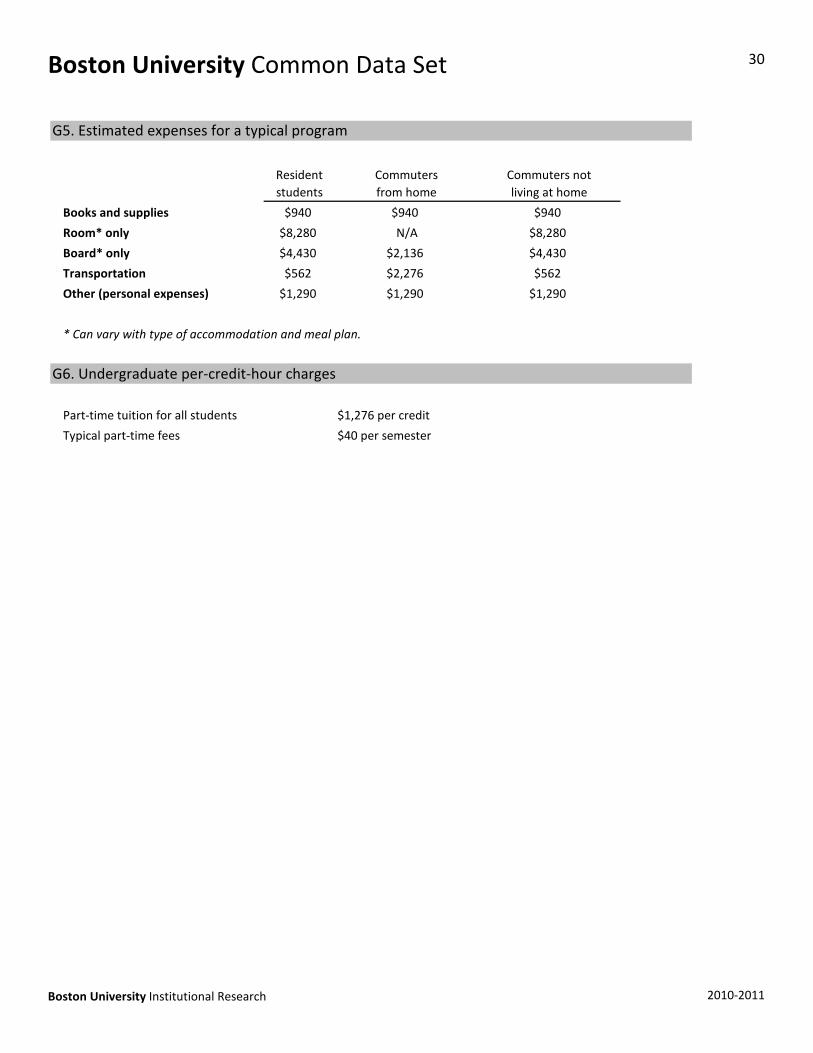
Books and supplies $940
Room* only $8,280
Board* only $4,430
Transportation $562
Other (personal expenses) $1,290
* Can vary with type of accommodation and meal plan.
Part‐time tuition for all students $1,276 per credit
Typical part‐time fees $40 per semester
G6. Undergraduate per‐credit‐hour charges
$2,136 $4,430
$2,276 $562
$1,290 $1,290
Resident students
Commuters from home
Commuters not living at home
$940 $940
N/A $8,280
G5. Estimated expenses for a typical program
Boston University Institutional Research 2010‐2011
Boston University Common Data Set 31
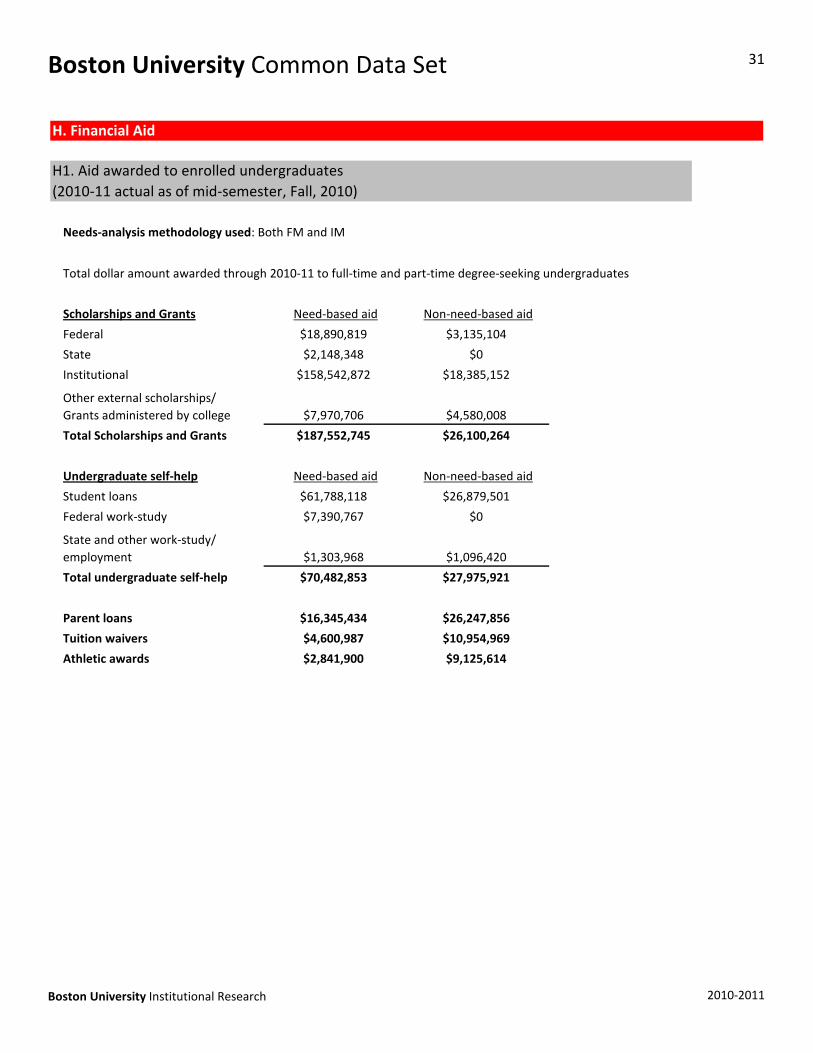
Needs‐analysis methodology used: Both FM and IM
Total dollar amount awarded through 2010‐11 to full‐time and part‐time degree‐seeking undergraduates
Scholarships and Grants
Federal
State
Institutional
Total Scholarships and Grants
Undergraduate self‐help
Student loans
Federal work‐study
Total undergraduate self‐help $70,482,853 $27,975,921
$7,390,767 $0
State and other work‐study/employment $1,303,968 $1,096,420
$187,552,745 $26,100,264
Need‐based aid Non‐need‐based aid
$61,788,118 $26,879,501
$2,148,348 $0
$158,542,872 $18,385,152
Other external scholarships/Grants administered by college $7,970,706 $4,580,008
H. Financial Aid
H1. Aid awarded to enrolled undergraduates (2010‐11 actual as of mid‐semester, Fall, 2010)
Need‐based aid Non‐need‐based aid
$18,890,819 $3,135,104
Parent loans
Tuition waivers
Athletic awards $2,841,900 $9,125,614
$16,345,434 $26,247,856
$4,600,987 $10,954,969
Boston University Institutional Research 2010‐2011
Boston University Common Data Set 32
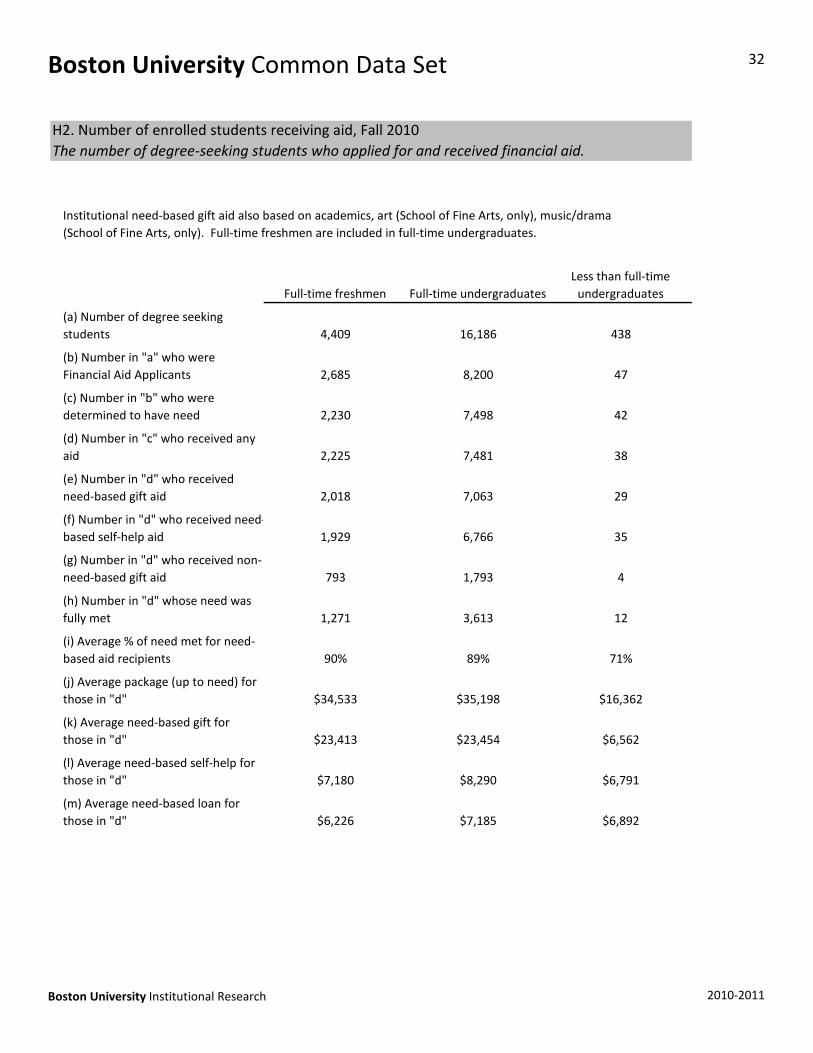
(g) Number in "d" who received non‐need‐based gift aid 793 1,793 4
(f) Number in "d" who received need‐based self‐help aid 1,929 6,766 35
(e) Number in "d" who received need‐based gift aid 2,018 7,063 29
(d) Number in "c" who received any aid 2,225 7,481 38
(c) Number in "b" who were determined to have need 2,230 7,498 42
(b) Number in "a" who were Financial Aid Applicants 2,685 8,200 47
(a) Number of degree seeking students 4,409 16,186 438
H2. Number of enrolled students receiving aid, Fall 2010The number of degree‐seeking students who applied for and received financial aid.
Institutional need‐based gift aid also based on academics, art (School of Fine Arts, only), music/drama (School of Fine Arts, only). Full‐time freshmen are included in full‐time undergraduates.
Full‐time freshmen Full‐time undergraduatesLess than full‐time undergraduates
(m) Average need‐based loan for those in "d" $6,226 $7,185 $6,892
(l) Average need‐based self‐help for those in "d" $7,180 $8,290 $6,791
(k) Average need‐based gift for those in "d" $23,413 $23,454 $6,562
(j) Average package (up to need) for those in "d" $34,533 $35,198 $16,362
(i) Average % of need met for need‐based aid recipients 90% 89% 71%
(h) Number in "d" whose need was fully met 1,271 3,613 12
Boston University Institutional Research 2010‐2011
Boston University Common Data Set 33
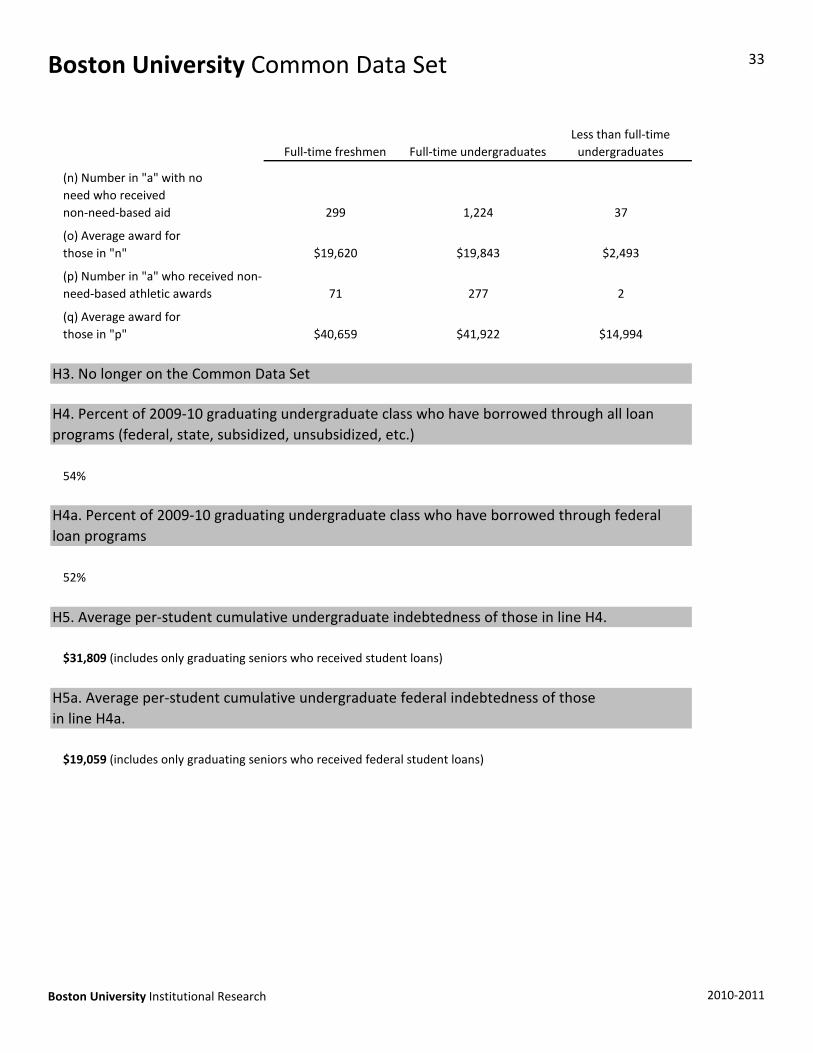
54%
52%
H3. No longer on the Common Data Set
H4. Percent of 2009‐10 graduating undergraduate class who have borrowed through all loan programs (federal, state, subsidized, unsubsidized, etc.)
H4a. Percent of 2009‐10 graduating undergraduate class who have borrowed through federal loan programs
(q) Average award for those in "p" $40,659 $41,922 $14,994
(p) Number in "a" who received non‐need‐based athletic awards 71 277 2
299 1,224 37
(o) Average award for those in "n" $19,620 $19,843 $2,493
Full‐time freshmen Full‐time undergraduatesLess than full‐time undergraduates
(n) Number in "a" with no need who received non‐need‐based aid
$31,809 (includes only graduating seniors who received student loans)
$19,059 (includes only graduating seniors who received federal student loans)
H5. Average per‐student cumulative undergraduate indebtedness of those in line H4.
H5a. Average per‐student cumulative undergraduate federal indebtedness of those in line H4a.
Boston University Institutional Research 2010‐2011
Boston University Common Data Set 34
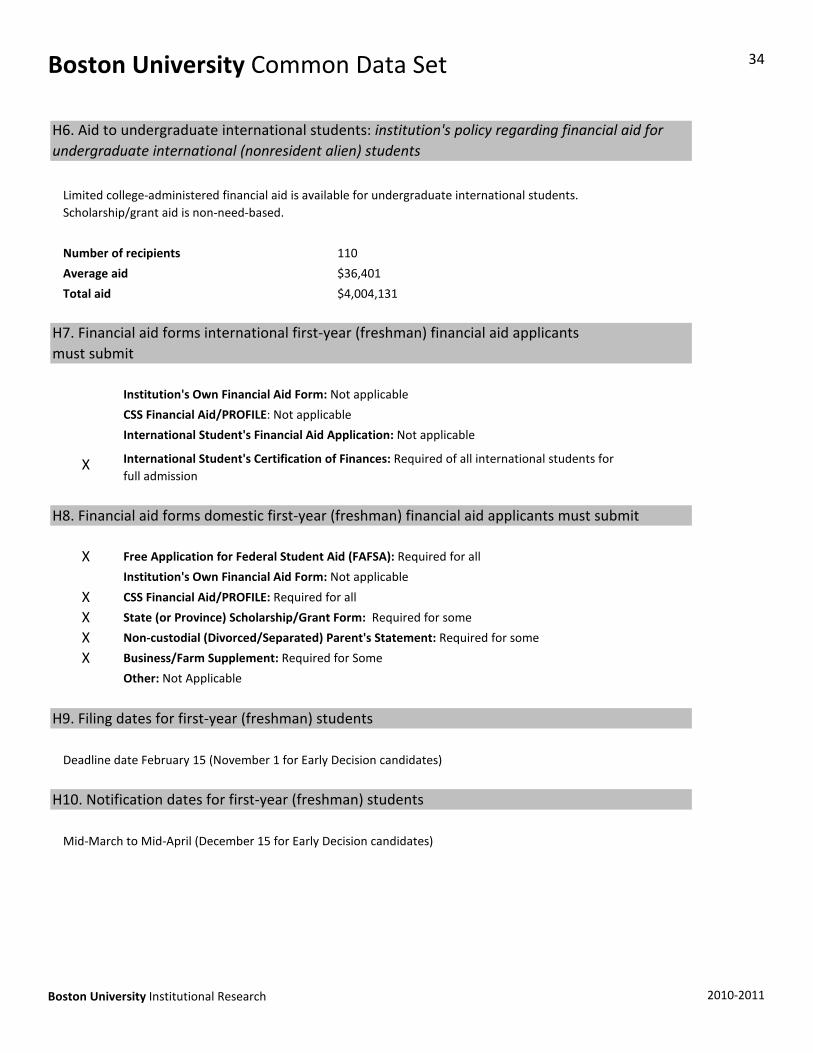
Number of recipients 110
Average aid $36,401
Total aid $4,004,131
Institution's Own Financial Aid Form: Not applicable
CSS Financial Aid/PROFILE: Not applicable
International Student's Financial Aid Application: Not applicable
X Free Application for Federal Student Aid (FAFSA): Required for all
Institution's Own Financial Aid Form: Not applicable
Limited college‐administered financial aid is available for undergraduate international students. Scholarship/grant aid is non‐need‐based.
H7. Financial aid forms international first‐year (freshman) financial aid applicants must submit
X International Student's Certification of Finances: Required of all international students for full admission
H8. Financial aid forms domestic first‐year (freshman) financial aid applicants must submit
H6. Aid to undergraduate international students: institution's policy regarding financial aid for undergraduate international (nonresident alien) students
X CSS Financial Aid/PROFILE: Required for all
X State (or Province) Scholarship/Grant Form: Required for some
X Non‐custodial (Divorced/Separated) Parent's Statement: Required for some
X Business/Farm Supplement: Required for Some
Other: Not Applicable
Deadline date February 15 (November 1 for Early Decision candidates)
Mid‐March to Mid‐April (December 15 for Early Decision candidates)
H10. Notification dates for first‐year (freshman) students
H9. Filing dates for first‐year (freshman) students
Boston University Institutional Research 2010‐2011

Boston University Common Data Set 35
May 1 or within two weeks of notification of financial aid decision
X Federal Direct Subsidized Stafford Loans
X Federal Direct Unsubsidized Stafford Loans
X Federal Direct PLUS Loans
X Federal Perkins Loans
X State Loans
X Federal Pell Grants
X Federal Supplemental Opportunity Grants
X State scholarships/grants
X Private scholarships/grants
X College and University scholarships/grants from institutional funds
X Federal Academic Competitiveness and Smart Grants
H11. Freshmen reply date
H12. Types of aid available: Loans
H13. Types of aid available: Scholarships and grants (need‐based)
Boston University Institutional Research 2010‐2011
Boston University Common Data Set 36
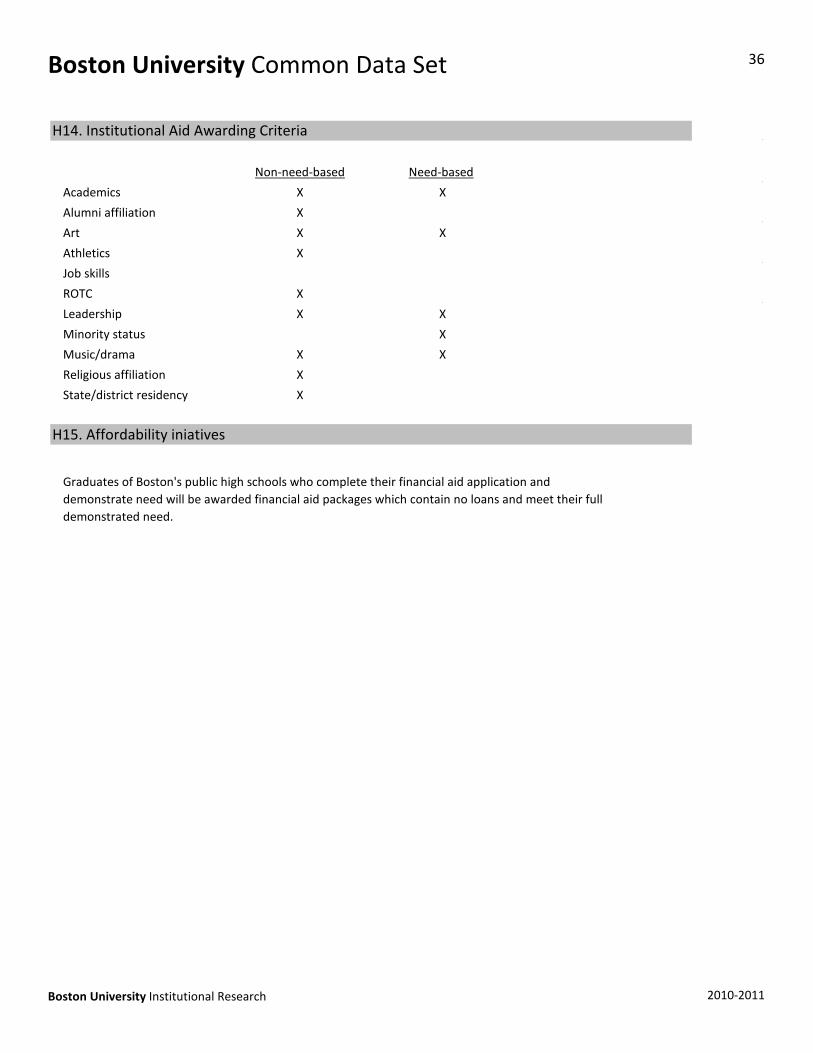
Non‐need‐based Need‐based
Academics X X
Alumni affiliation X
Art X X
Athletics X
Job skills
ROTC X
Leadership X X
Minority status X
Music/drama X X
Religious affiliation X
State/district residency X
Graduates of Boston's public high schools who complete their financial aid application and demonstrate need will be awarded financial aid packages which contain no loans and meet their full demonstrated need.
H14. Institutional Aid Awarding Criteria
H15. Affordability iniatives
Boston University Institutional Research 2010‐2011
Boston University Common Data Set 37
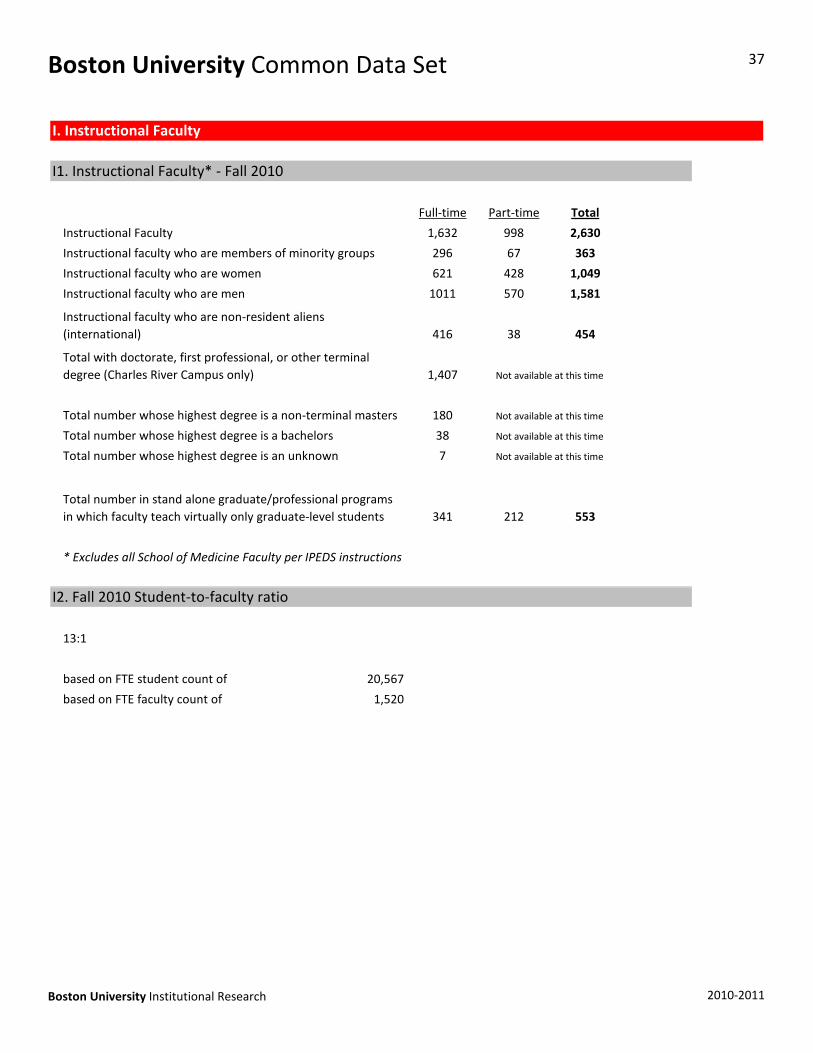
Full‐time Part‐time Total
Instructional Faculty 1,632 998 2,630
Instructional faculty who are members of minority groups 296 67 363
Instructional faculty who are women 621 428 1,049
Instructional faculty who are men 1011 570 1,581
416 38 454
1,407
180
Total number whose highest degree is a bachelors 38
Total number whose highest degree is an unknown 7
341 212 553
* Excludes all School of Medicine Faculty per IPEDS instructions
Total number whose highest degree is a non‐terminal masters Not available at this time
Not available at this time
Not available at this time
Total number in stand alone graduate/professional programs in which faculty teach virtually only graduate‐level students
I. Instructional Faculty
I1. Instructional Faculty* ‐ Fall 2010
Instructional faculty who are non‐resident aliens (international)
Total with doctorate, first professional, or other terminal degree (Charles River Campus only) Not available at this time
13:1
based on FTE student count of 20,567
based on FTE faculty count of 1,520
I2. Fall 2010 Student‐to‐faculty ratio
Boston University Institutional Research 2010‐2011
Boston University Common Data Set 38
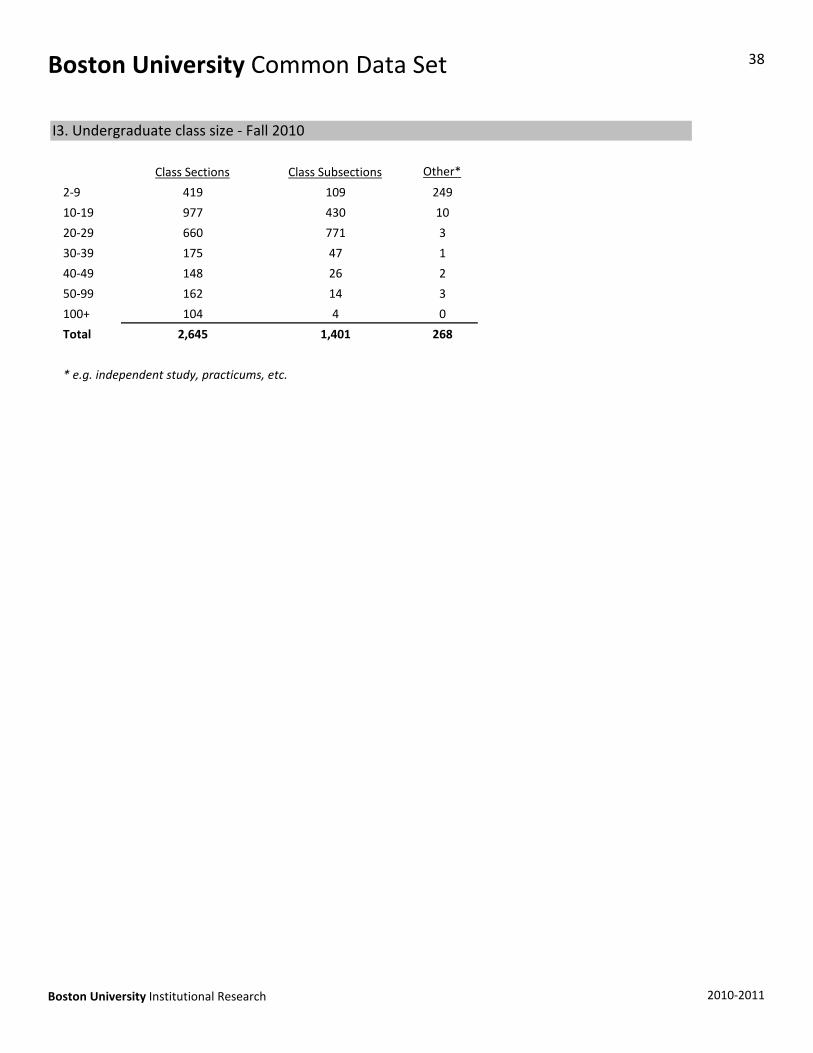
Other*
2‐9 249
10‐19 10
20‐29 3
30‐39 1
40‐49 2
50‐99 3
100+ 0
Total 268
* e.g. independent study, practicums, etc.
162 14
104 4
2,645 1,401
660 771
175 47
148 26
I3. Undergraduate class size ‐ Fall 2010
Class Sections Class Subsections
419 109
977 430
Boston University Institutional Research 2010‐2011
Boston University Common Data Set 39
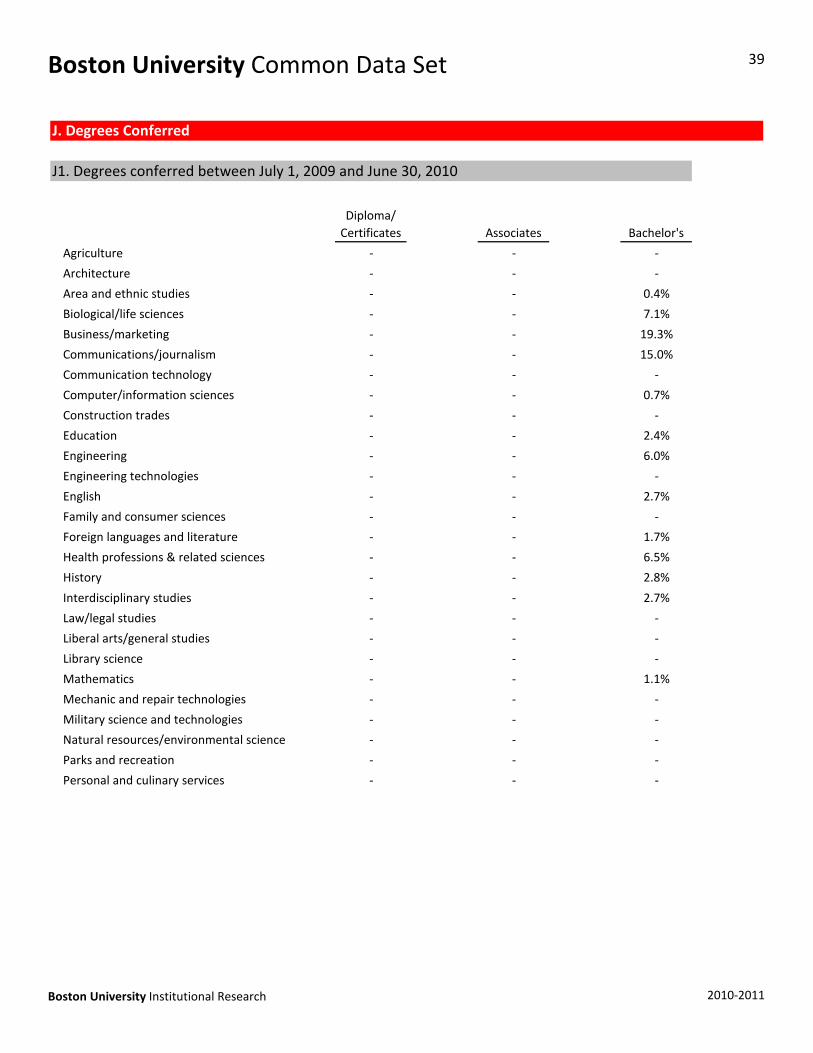
Agriculture ‐ ‐ ‐
Architecture ‐ ‐ ‐
Area and ethnic studies ‐ ‐ 0.4%
Biological/life sciences ‐ ‐ 7.1%
Business/marketing ‐ ‐ 19.3%
Communications/journalism ‐ ‐ 15.0%
Communication technology ‐ ‐ ‐
Computer/information sciences ‐ ‐ 0.7%
Construction trades ‐ ‐ ‐
Education ‐ ‐ 2.4%
Engineering ‐ ‐ 6.0%
Engineering technologies ‐ ‐ ‐
English ‐ ‐ 2.7%
Family and consumer sciences ‐ ‐ ‐
Foreign languages and literature ‐ ‐ 1.7%
Health professions & related sciences ‐ ‐ 6.5%
History ‐ ‐ 2.8%
J. Degrees Conferred
J1. Degrees conferred between July 1, 2009 and June 30, 2010
Diploma/Certificates Associates Bachelor's
Interdisciplinary studies ‐ ‐ 2.7%
Law/legal studies ‐ ‐ ‐
Liberal arts/general studies ‐ ‐ ‐
Library science ‐ ‐ ‐
Mathematics ‐ ‐ 1.1%
Mechanic and repair technologies ‐ ‐ ‐
Military science and technologies ‐ ‐ ‐
Natural resources/environmental science ‐ ‐ ‐
Parks and recreation ‐ ‐ ‐
Personal and culinary services ‐ ‐ ‐
Boston University Institutional Research 2010‐2011
Boston University Common Data Set 40
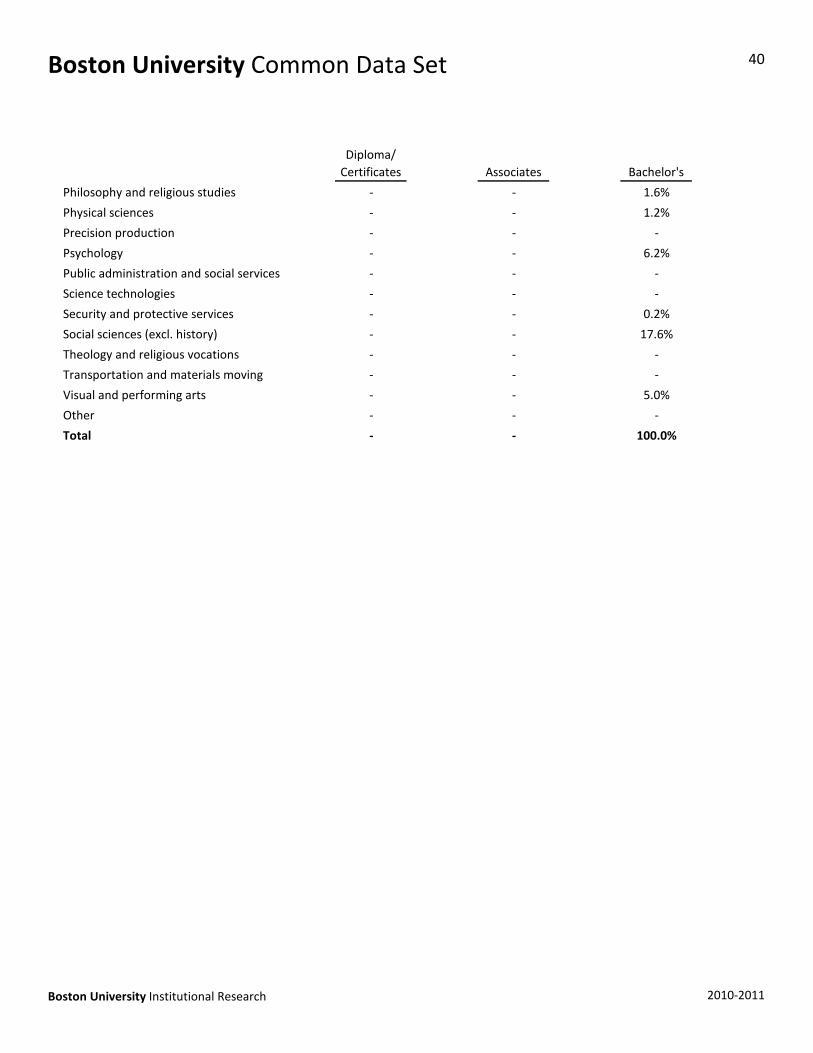
Philosophy and religious studies ‐ ‐ 1.6%
Physical sciences ‐ ‐ 1.2%
Precision production ‐ ‐ ‐
Psychology ‐ ‐ 6.2%
Public administration and social services ‐ ‐ ‐
Science technologies ‐ ‐ ‐
Security and protective services ‐ ‐ 0.2%
Social sciences (excl. history) ‐ ‐ 17.6%
Theology and religious vocations ‐ ‐ ‐
Transportation and materials moving ‐ ‐ ‐
Visual and performing arts ‐ ‐ 5.0%
Other ‐ ‐ ‐
Total ‐ ‐ 100.0%
Diploma/Certificates Associates Bachelor's
Boston University Institutional Research 2010‐2011