Embed Size (px)
Citation preview

Borehole imaging in oil-base mud
OBMI

Applications� Structural analysis
� Structural dip determination� Fracture and fault detection
� Stratigraphic analysis� Characterization of
sedimentary deposits� Stratigraphic dip
determination� Thin-bed detection
� Core analysis� Depth matching� Orientation� Missed interval coverage
� Compartmentalization andpermeability analyses
� High-resolution net pay count
� Sample and formation testpositioning
� Detection of drilling-inducedfeatures
Benefits� Detection and measurement
of features too small for conventional logs
� Detection of anisotropic features
� Differentiation of structuraland stratigraphic features
� Flexibility retained in choosing mud systems
Features� Operates in any oil-, diesel-
or synthetic-base mud
� High-resolution, oriented formation image
� 0.4-in. button size, 1.2-in. resolution
� Five measurements per pad
� Quantitative Rxo
measurement
� Compact, integrated design
� Combinable top and bottom
� 3600 ft/hr maximum loggingspeed
� Two-axis caliper
A tradition of electrical coringBefore it was called logging, the down-hole measurement of formation prop-erties was called “electrical coring.”Inspired by this ideal, Schlumbergerdeveloped formation imaging toadvance log structural and stratigraphicanalysis to new levels of insight. TheOBMI* Oil-Base MicroImager tool isthe latest Schlumberger imaging solu-tion and another industry first, extend-ing microresistivity imaging into theenvironment of nonconductive invert-emulsion mud systems.
The measurement challengeThe increasing use of oil- and synthetic-base mud systems to limit drilling risksand improve efficiency poses manychallenges for formation imaging.Even a thin film of nonconductive mudis essentially an opaque curtain, pre-venting conventional microresistivityimagers from measuring the formation.The presence of nonconductive mud-cake or mud filtrate further compli-cates the situation. Oil-base mud canbe displaced with water-base mud atconsiderable expense, but there is no
guarantee that measurement will be possible. Addressing the need forimages in this difficult environmentclearly demanded a novel approach.
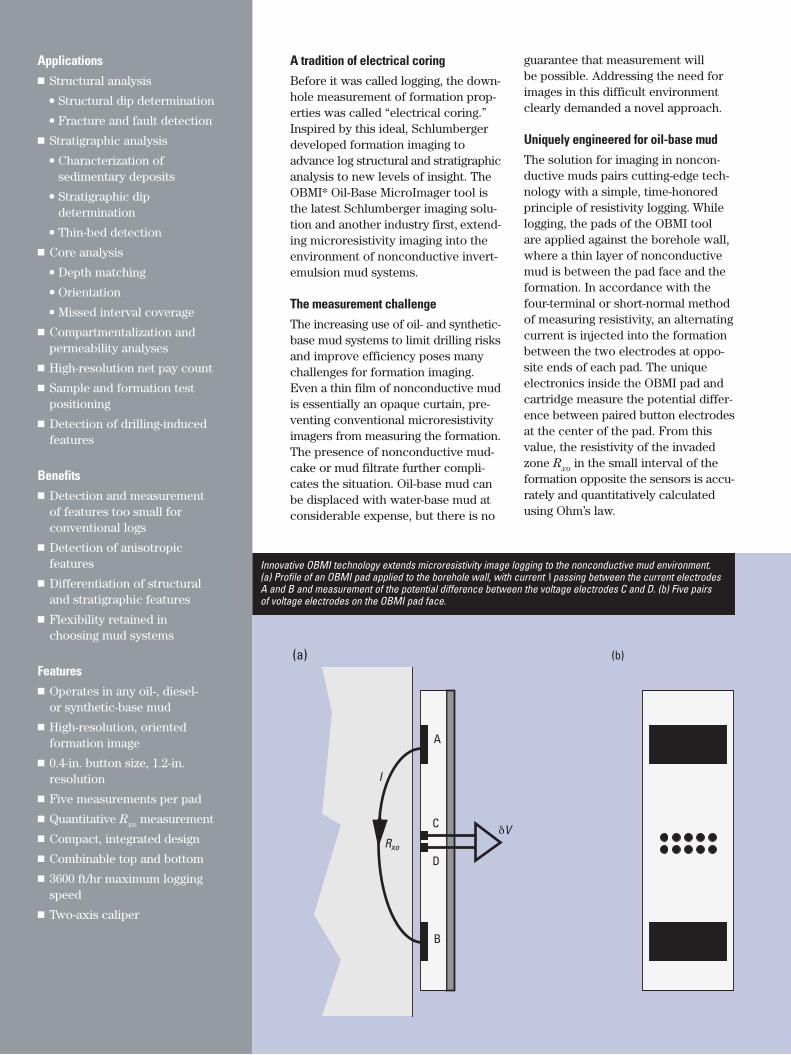
Uniquely engineered for oil-base mudThe solution for imaging in noncon-ductive muds pairs cutting-edge tech-nology with a simple, time-honoredprinciple of resistivity logging. Whilelogging, the pads of the OBMI tool are applied against the borehole wall,where a thin layer of nonconductivemud is between the pad face and theformation. In accordance with thefour-terminal or short-normal methodof measuring resistivity, an alternatingcurrent is injected into the formationbetween the two electrodes at oppo-site ends of each pad. The uniqueelectronics inside the OBMI pad andcartridge measure the potential differ-ence between paired button electrodesat the center of the pad. From thisvalue, the resistivity of the invadedzone R
xoin the small interval of the
formation opposite the sensors is accu-rately and quantitatively calculatedusing Ohm’s law.
δV
I
Rxo
(a) (b)
A
B
C
D
Innovative OBMI technology extends microresistivity image logging to the nonconductive mud environment. (a) Profile of an OBMI pad applied to the borehole wall, with current I passing between the current electrodes A and B and measurement of the potential difference between the voltage electrodes C and D. (b) Five pairs of voltage electrodes on the OBMI pad face.
Each of the four pads acquires five measurements, and the data aredisplayed as a color image, orientedwith respect to the geometry of thetool and borehole. Structural andstratigraphic features as small as 0.4 in.[1 cm] can be seen, yielding a wealth ofhigh-resolution, azimuthal informationunobtainable through conventionallogging techniques. The resemblanceof the OBMI image to whole-roundcore enables virtual visualization of thereservoir—a first for the nonconduc-tive mud environment.
The OBMI tool has been validatedin the field with more than 20 brandsof diesel-, oil- and synthetic-base muds.
Engineered for efficiencyMaking breakthrough measurementsis but one benefit of the OBMI tool.The compact, integrated design andmaximum logging speed of 3600 ft/hrensure efficient wellsite rig-up andoperation. The through-wired sondeenables running other services such asthe UBI* Ultrasonic Borehole Imagerbelow the OBMI tool on the samedescent. To ensure high reliability, theOBMI tool is built to the same mechan-ical shock standards as the provenPlatform Express* tools.
Clear dip and structure resolutionComparison of OBMI images with anOBDT* Oil-Base Dipmeter Tool logacquired in the same well demonstratesthe quantum leap in information forformation evaluation. In the exampleto the right, the value of the high-resolution OBMI image is readilyapparent in resolving otherwise ambig-uous dip and structural features.
In an interbedded, contrastingsequence of sand and shale, an auto-matic algorithm can accurately identifyand compute the formation dip fromboth data sets. However, the OBDTtool measures one curve per pad at aresolution of about 2 in. The array ofhigh-resolution sensors on each OBMIpad provides an image, and beddingand structure that are unresolved bythe OBDT data are clearly visible.
In a shale formation that has littleresistivity contrast, automatically com-puted dips are often in error, and it isnecessary to resort to manual methods.Using dipmeter data, it is a challengeto determine the dip in this manner.
The sensitive response of the OBMImeasurement and the image it providesenable manually picking dips withconfidence. The OBMI data yield accu-rate dip in this formation even whenprocessed by the automatic algorithm.
The OBMI image (far right track) is developed from five resistivity measurements per pad. OBDT data(center track) are displayed as a pseudoimage consisting of one data point per pad. OBDT-computeddips are plotted in red and OBMI dips in black for a sand/shale sequence (top) and low-contrast shalesequence (bottom).
XXX70
0
Conductive OBMI
OBMI
(Sinusoid)
Orientation North
AO90
0.2
AO10
0.2
OBMI Resistivity
0.2
True DipOBDT
0
True DipOBMI
Deg0
Resistive OBDT
OBDT
(Sinusoid)
Orientation North
MD1 : 20( ft )
Borehole Drift
0
20
6
6
XXX75
( in.)
( gAPI )
( in.)
( Deg )
( ohm-m )
( ohm-m )
( ohm-m )( Deg )
Resistive
360
90
90
Conductive
20
20
20
10
120
6
6
Caliper 1
Caliper 2
Gamma Ray
0 360
XXX50
XXX55

Deepwater answers in focusA Gulf of Mexico deepwater operatorran the OBMI tool in a partially coredappraisal well to more fully charac-terize the thinly bedded reservoir sed-iments and refine the net pay count.The OBMI image accurately repro-duced the cored interval. An abruptchange in the core dip, previouslythought to be coring induced, wasdemonstrated to be natural in originby the image.
Stratigraphic analysis was success-fully extended beyond the cored inter-val using the OBMI image. The OBMIR
xodata correlated well with grain-size
information from sidewall cores. Theresulting net pay count was increasedby more than 50 ft from that deter-mined by conventional log analysis.
OBMI images and quantitative Rxo measurement from a deepwater well in the Gulf of Mexico show an excellent match to the ultraviolet-light core photograph and conventional logs. Thresholds areapplied to the OBMI Rxo data to calculate the net pay thickness in the far-right track.
The OBMI image proved that the reversal in dip direction at XXX36.5 ft is a natural feature, not induced by twisting during the coring process.
XXX82 264.30
265.04
49.47
49.58
Silt
Shale / Wet Sand
OBMI Resistivity
0 3( ohm-m )
Sand
0 360
Conductive ResistiveOBMI ImageCore Image
60 0
60 0
OBMI Resistivity
0.2 20( ohm-m )
AO90
0.2 20( ohm-m )
AO10
0.2 20( ohm-m )
MD1 : 7( ft )
Borehole Drift
( Deg )0 10
20 120( gAPI )
6 16( in.)
6 16( in.)
XXX85
XXX84
XXX83
263.24
263.70
264.10
48.87
49.18
49.34
Density Porosity
Neutron Porosity
( p.u.)
( p.u.)
Cumulative Sand
Cumulative Silt
Caliper 1
Caliper 2
Gamma Ray
( ft )
( ft )
XXX35
Conductive ResistiveOBMI
OBMI
(Sinusoid)
Orientation North
0.2 20( ohm-m )
AO90
0.2 20( ohm-m )
AO10
0.2 20( ohm-m )
MD1 : 10( ft )
Borehole Drift
0 10
20 120( gAPI )
6 16( in.)
6 16( in.)
True DipOBMI
0 90
XXX40
( Deg )OBMI Resistivity
( Deg ) Core Image
Caliper 1
Caliper 2
Gamma Ray
0 360

Insight to structurally complex settingsAn operator in the Alberta Foothills,Canada, drilled a pilot hole for a hori-zontal well in a poorly bedded reefbuildup. The lateral borehole wasplanned to follow the long axis of thereservoir to maximize the productiveinterval. The structural dip—too subtlefor a dipmeter to determine—wasclearly revealed in the OBMI image,confirming that the reservoir had beenpenetrated in the planned location.The image also confirmed the exis-tence of fractures perpendicular to theplanned lateral, a critical factor formaximizing productivity.
The OBMI image provides a structural overview of the bottom of a pilot hole for a horizontal well in theAlberta Foothills, confirming the target between XX52 and XX60 m. The accuracy of the OBMI Rxo measure-ment is verified by excellent correlation with the shallow AIT* Array Induction Imager Tool log.
Determining structural dip is challenging in reservoirs such as this massive reef because of the lack of clearbedding. The OBMI image enables handpicking the dip. A set of fractures (purple) could also be identified.
XX70
XX65
XX60
XX55
True DipResistive Fracture
(Deg)0
True DipBed Boundary
(Deg)0
Bed Boundary
(Sinusoid)
Orientation Top of Hole
0
Conductive OBMI Image
OBMI Resistivity
2
AHO10
2
MD1 : 200
0
5
5
Borehole drift
0 90
150
15
15
( Deg )
( in.)
( in.)
( m )
( gAPI ) ( ohm-m )
( ohm-m )
Caliper 1
Caliper 2
Gamma Ray
360
Resistive
20000
20000
0
Conductive OBMI Image
True DipResistive Fracture
0
True DipBed Boundary
( Deg )0
Resistive Fracture
(Sinusoid)
Orientation Top of Hole
Bed Boundary
(Sinusoid)
Orientation Top of Hole
0
Conductive OBMI Image
MD1 : 20( m )
0 ( gAPI )
5 ( in.)
5 ( in.)
Borehole drift
( Deg )0
XX56
15
15
150
90
90
( Deg )
Resistive
90
XX54
XX55
Caliper 1
Caliper 2
Gamma Ray360
Resistive
360

Customized image visualizationOMBI image logs are not static paperprints but an interactive, versatile dataset for analysis with OBMI-Viewersoftware. The OBMI images are placedon a PC-compatible CD-ROM with theOBMI-Viewer set of stand-alone toolsfor image display and interpretation.The application is intuitively easy touse, with a Web-browser-styled inter-face and on-line help system. Changingthe depth or color scale, manuallypicking dip and compiling a sand countare just some of the analyses quicklyexecuted with a few clicks of themouse. The interpreted images canalso be printed.
You choose the mud—Schlumbergerdelivers the imagesWhatever your choice of mud system,Schlumberger has a formation-imagingsolution for your well.
In challenging environments, drillwith the oil- or synthetic-base mud thatprovides the best drilling performance.Logging with the OBMI tool in non-conductive mud systems provides youwith the insight that only a micro-resistivity imaging tool can deliver.High-resolution OBMI images help youlimit risks without limiting your oper-ational flexibility or the informationneeded for optimized decision making.
OBMI Oil-Base MicroImager tool
Tool Specifications
Length 17 ftWeight 310 lbmMax OD 5.75 in.Max caliper 17.5 in.Recommended hole size 7–16 in.Max temperature 320°F [160°C]Max pressure 20,000 psiConveyance Wireline or TLC* Tough Logging Conditions systemEffective button size 0.4 in.Effective resolution 1.2 in.Depth of investigation 3.5 in.Coverage in 8-in. hole 32%Max logging speed 3600 ft/hrCombinability Top and bottom

06-FE-146 ©2006 Schlumberger. All rights reserved
July 2006 *Mark of Schlumberger
www.slb.com/oilfield